MACHINE
LEARNING
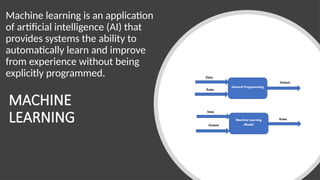
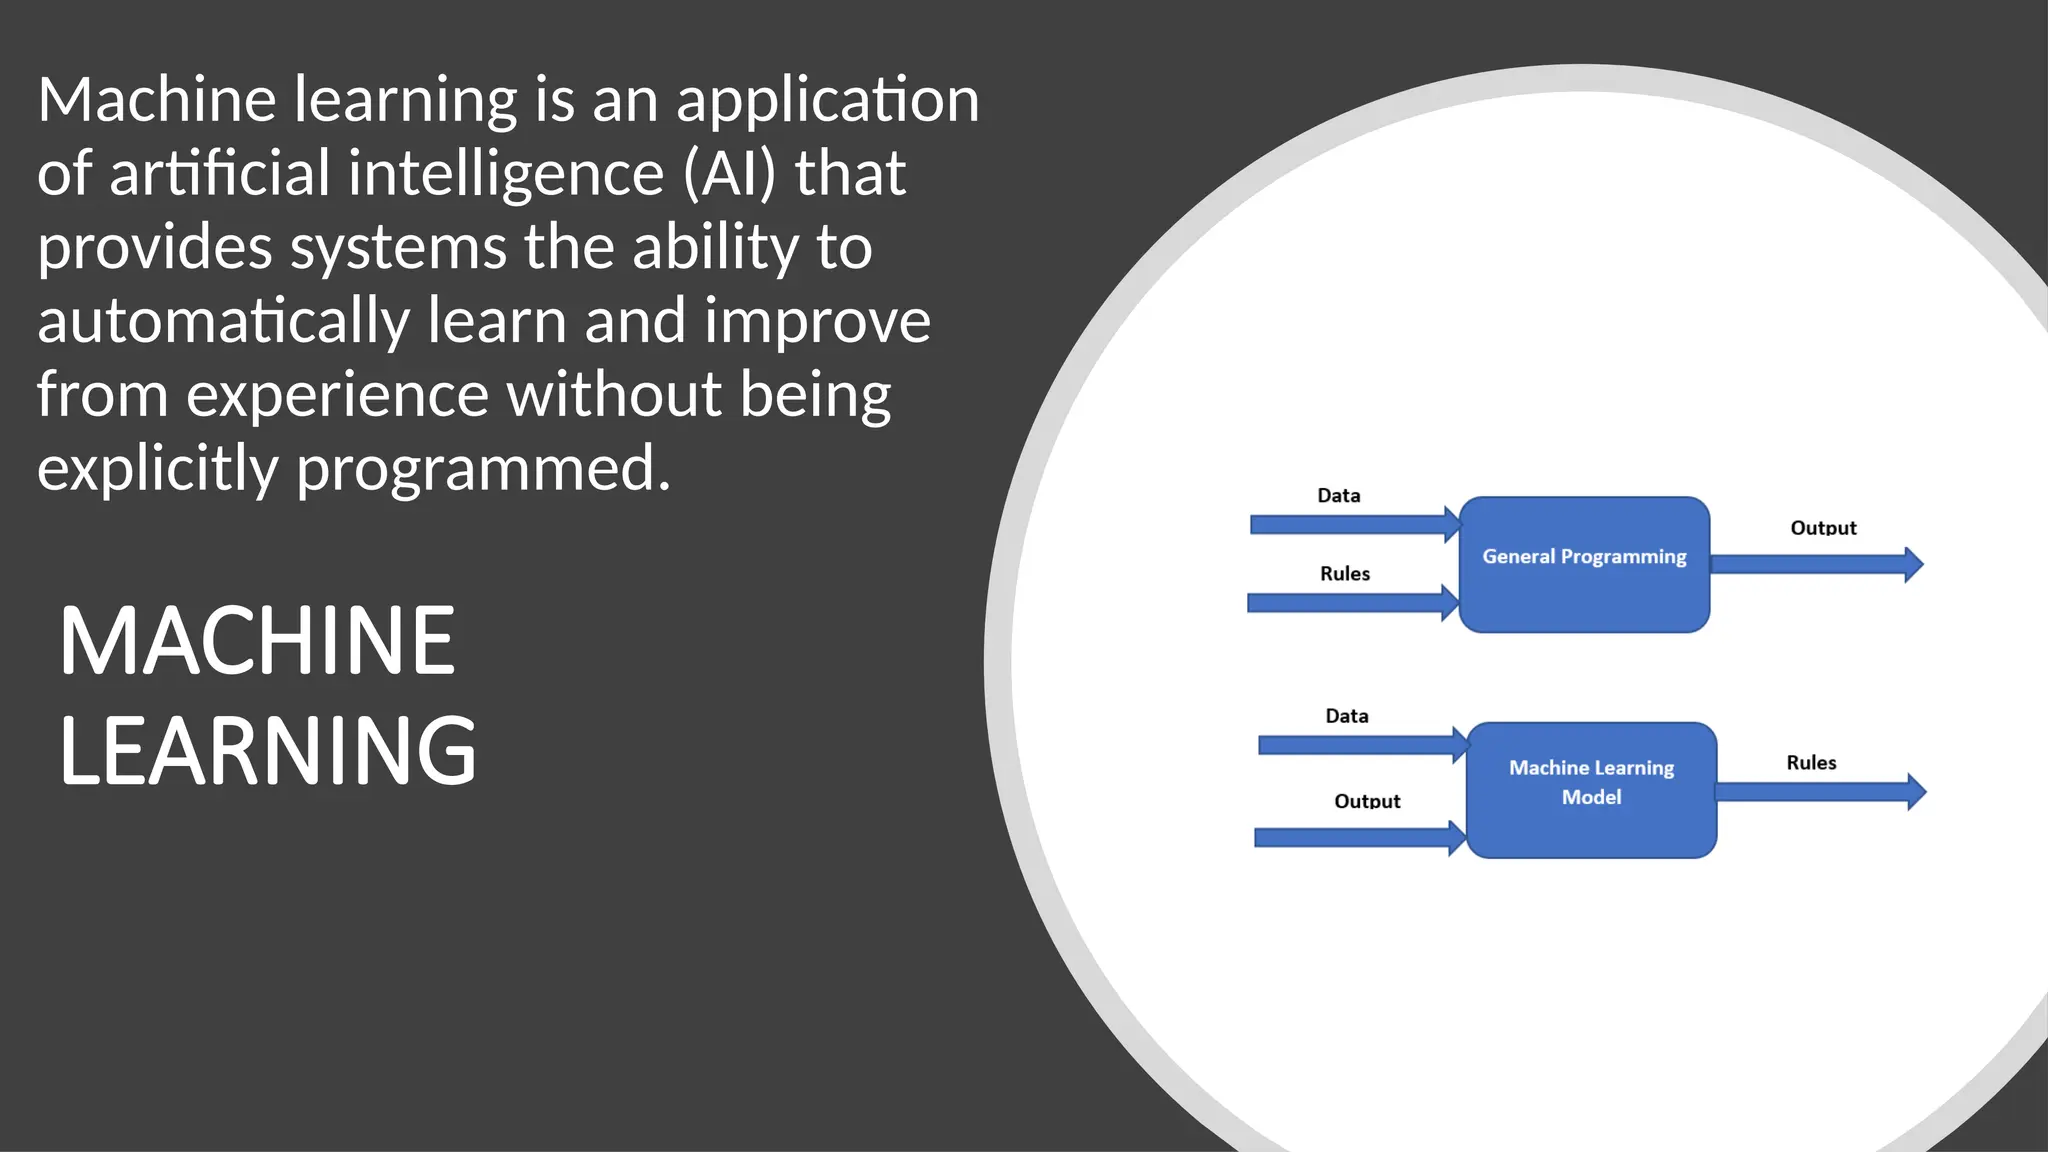
Machine learning isan application
of artificial intelligence (AI) that
provides systems the ability to
automatically learn and improve
from experience without being
explicitly programmed.
2.
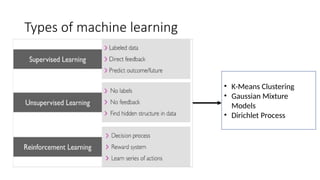
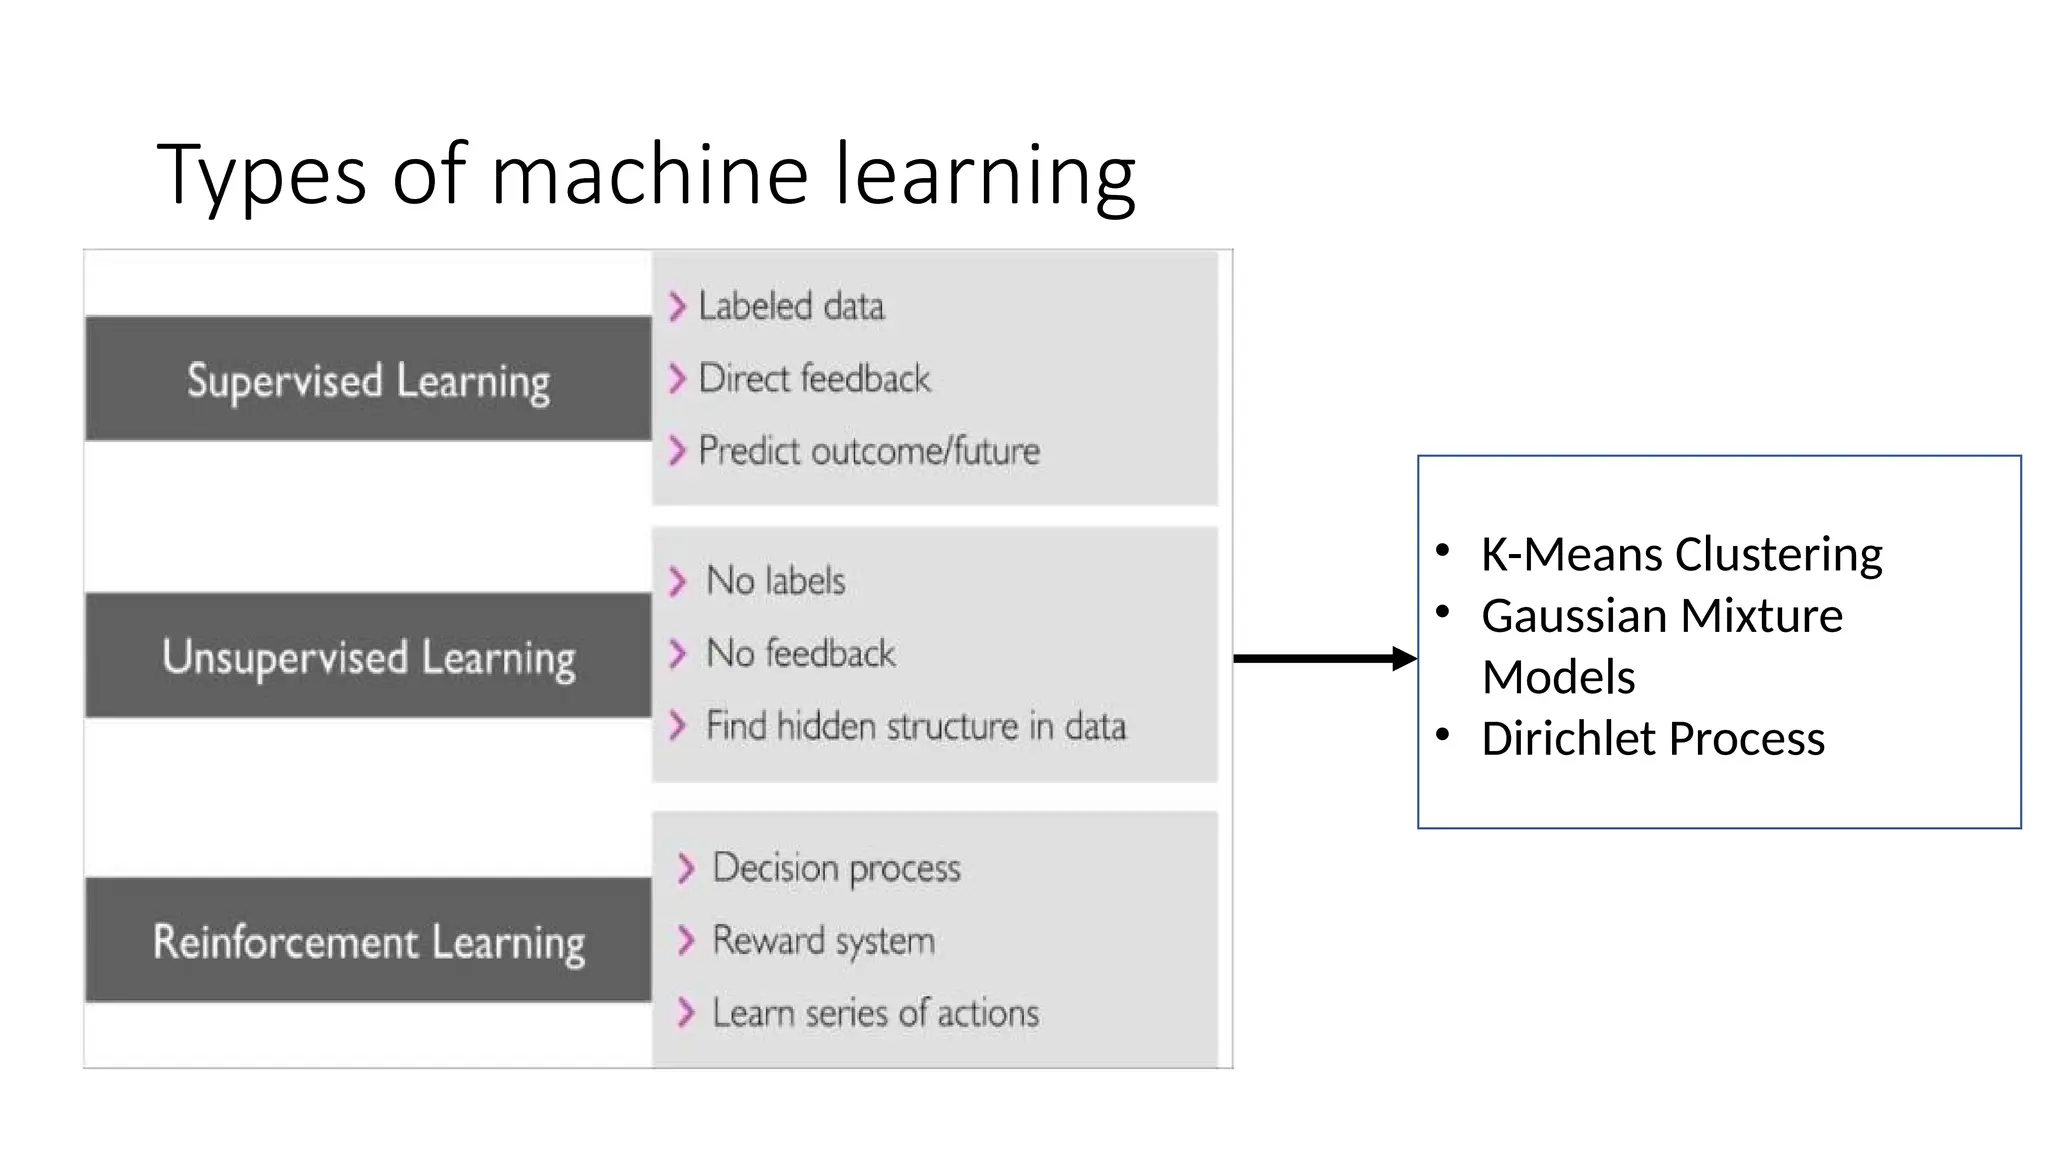
Types of machinelearning
• K-Means Clustering
• Gaussian Mixture
Models
• Dirichlet Process
3.
K-Means Clustering
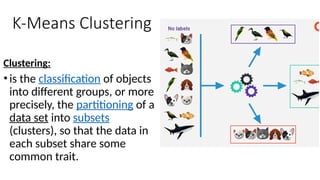
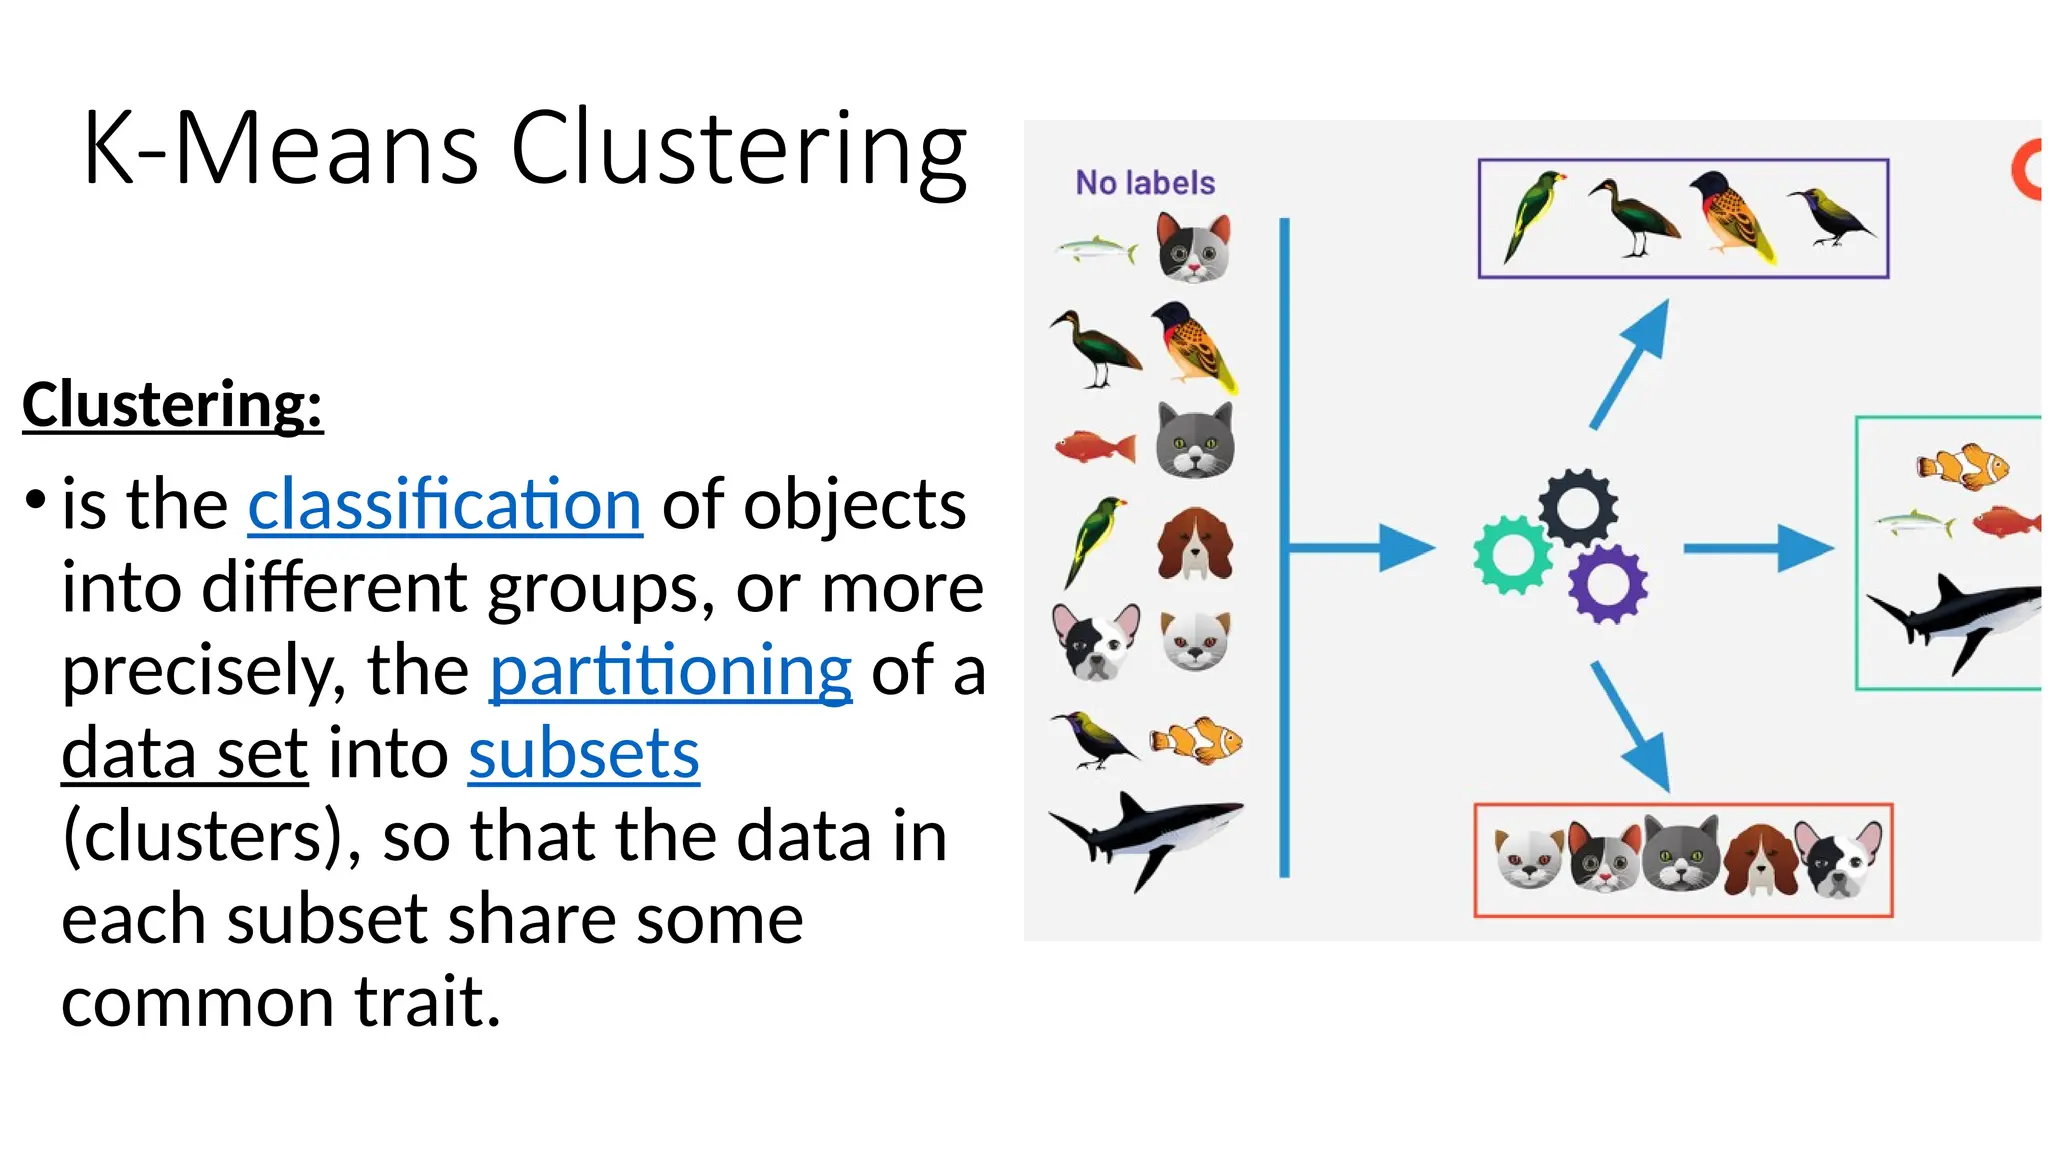
Clustering:
•is theclassification of objects
into different groups, or more
precisely, the partitioning of a
data set into subsets
(clusters), so that the data in
each subset share some
common trait.
4.
K-means Clustering
Types ofClustering
1. Hierarchical
2. Partitional
3. Density Based Clustering
4. Fuzzy logic Clustering
5.
K-means Clustering
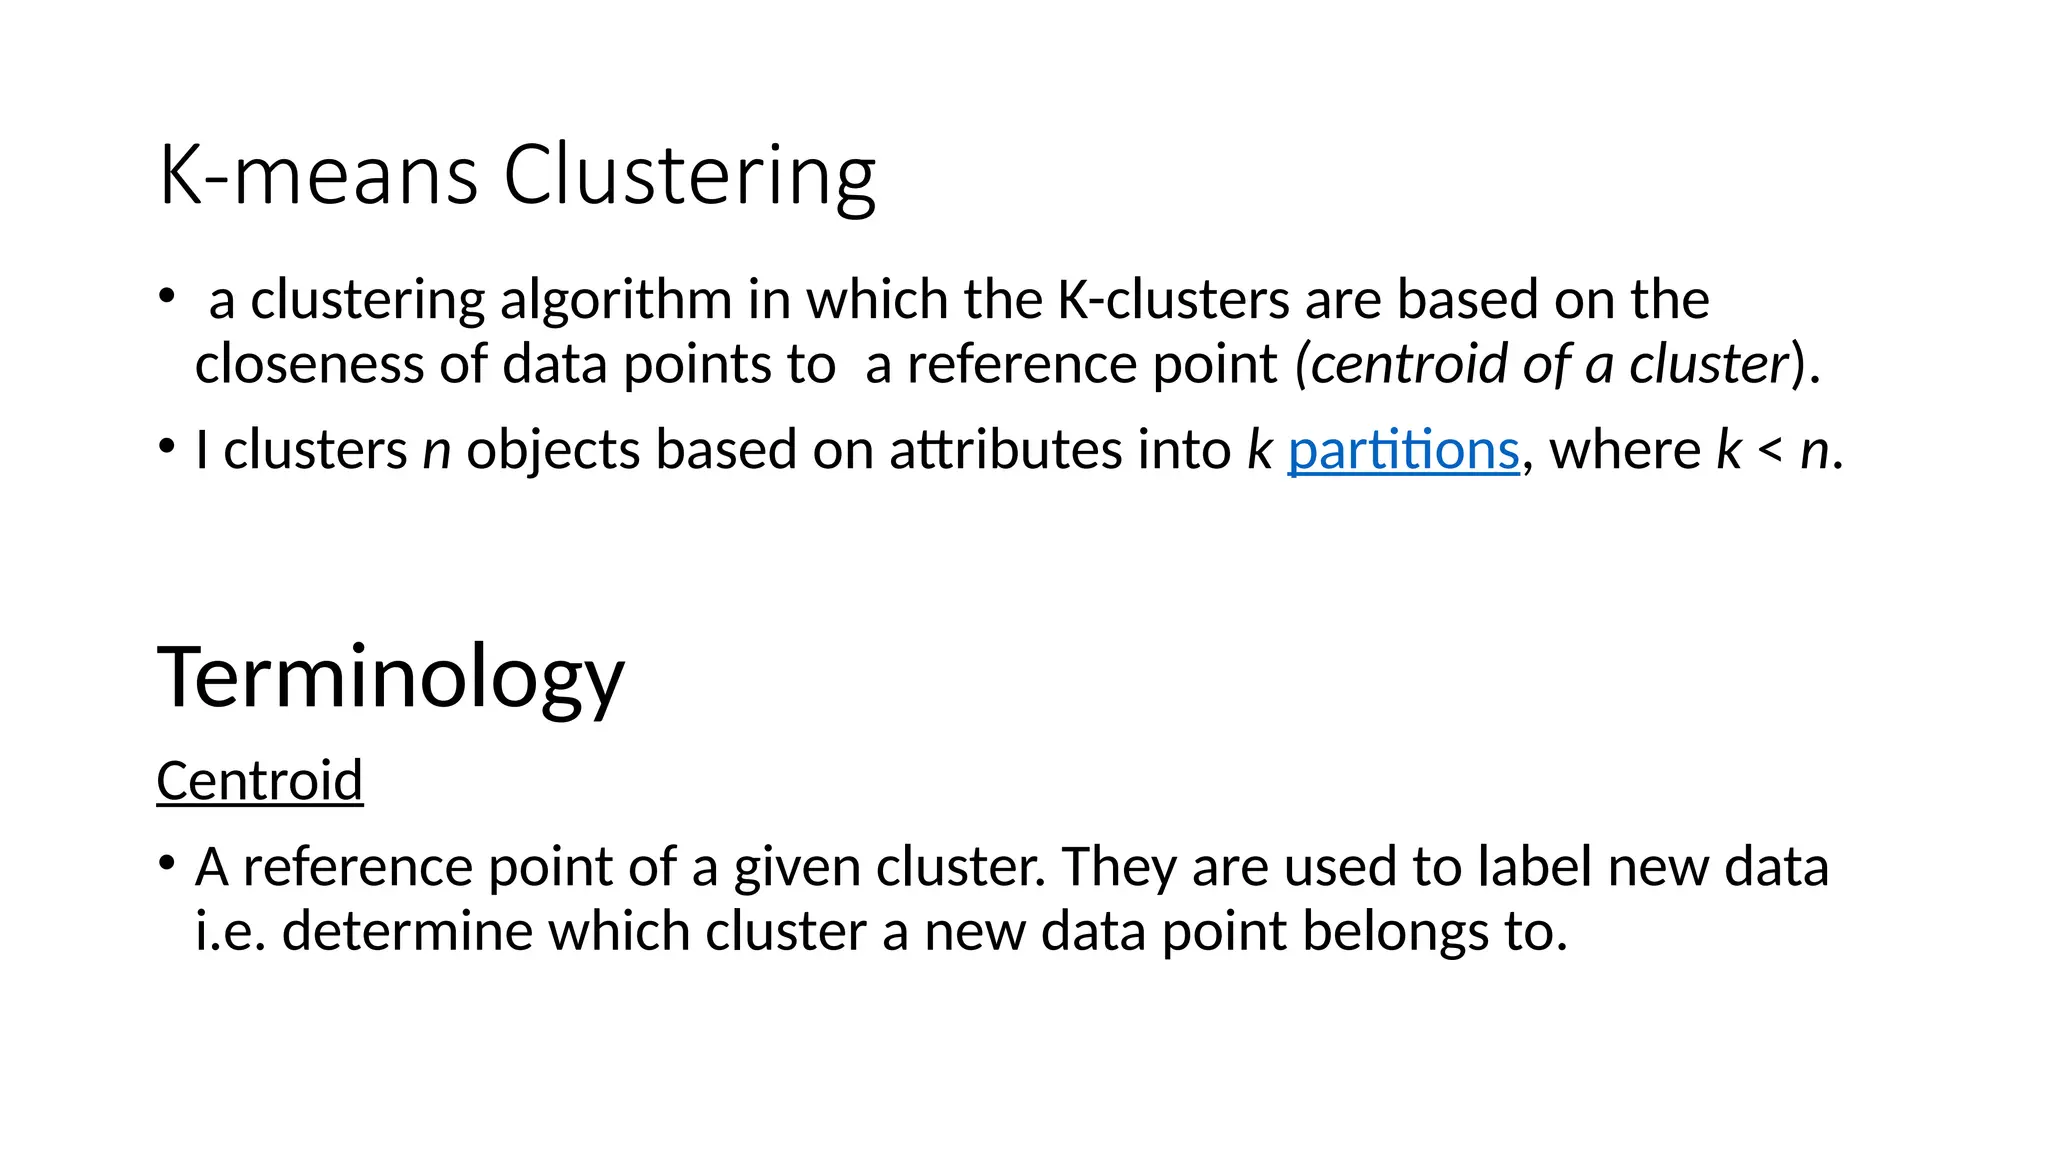
• aclustering algorithm in which the K-clusters are based on the
closeness of data points to a reference point (centroid of a cluster).
• I clusters n objects based on attributes into k partitions, where k < n.
Terminology
Centroid
• A reference point of a given cluster. They are used to label new data
i.e. determine which cluster a new data point belongs to.
6.
K-means Clustering
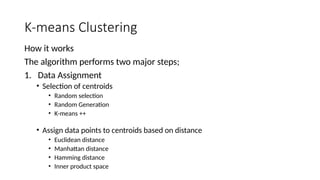
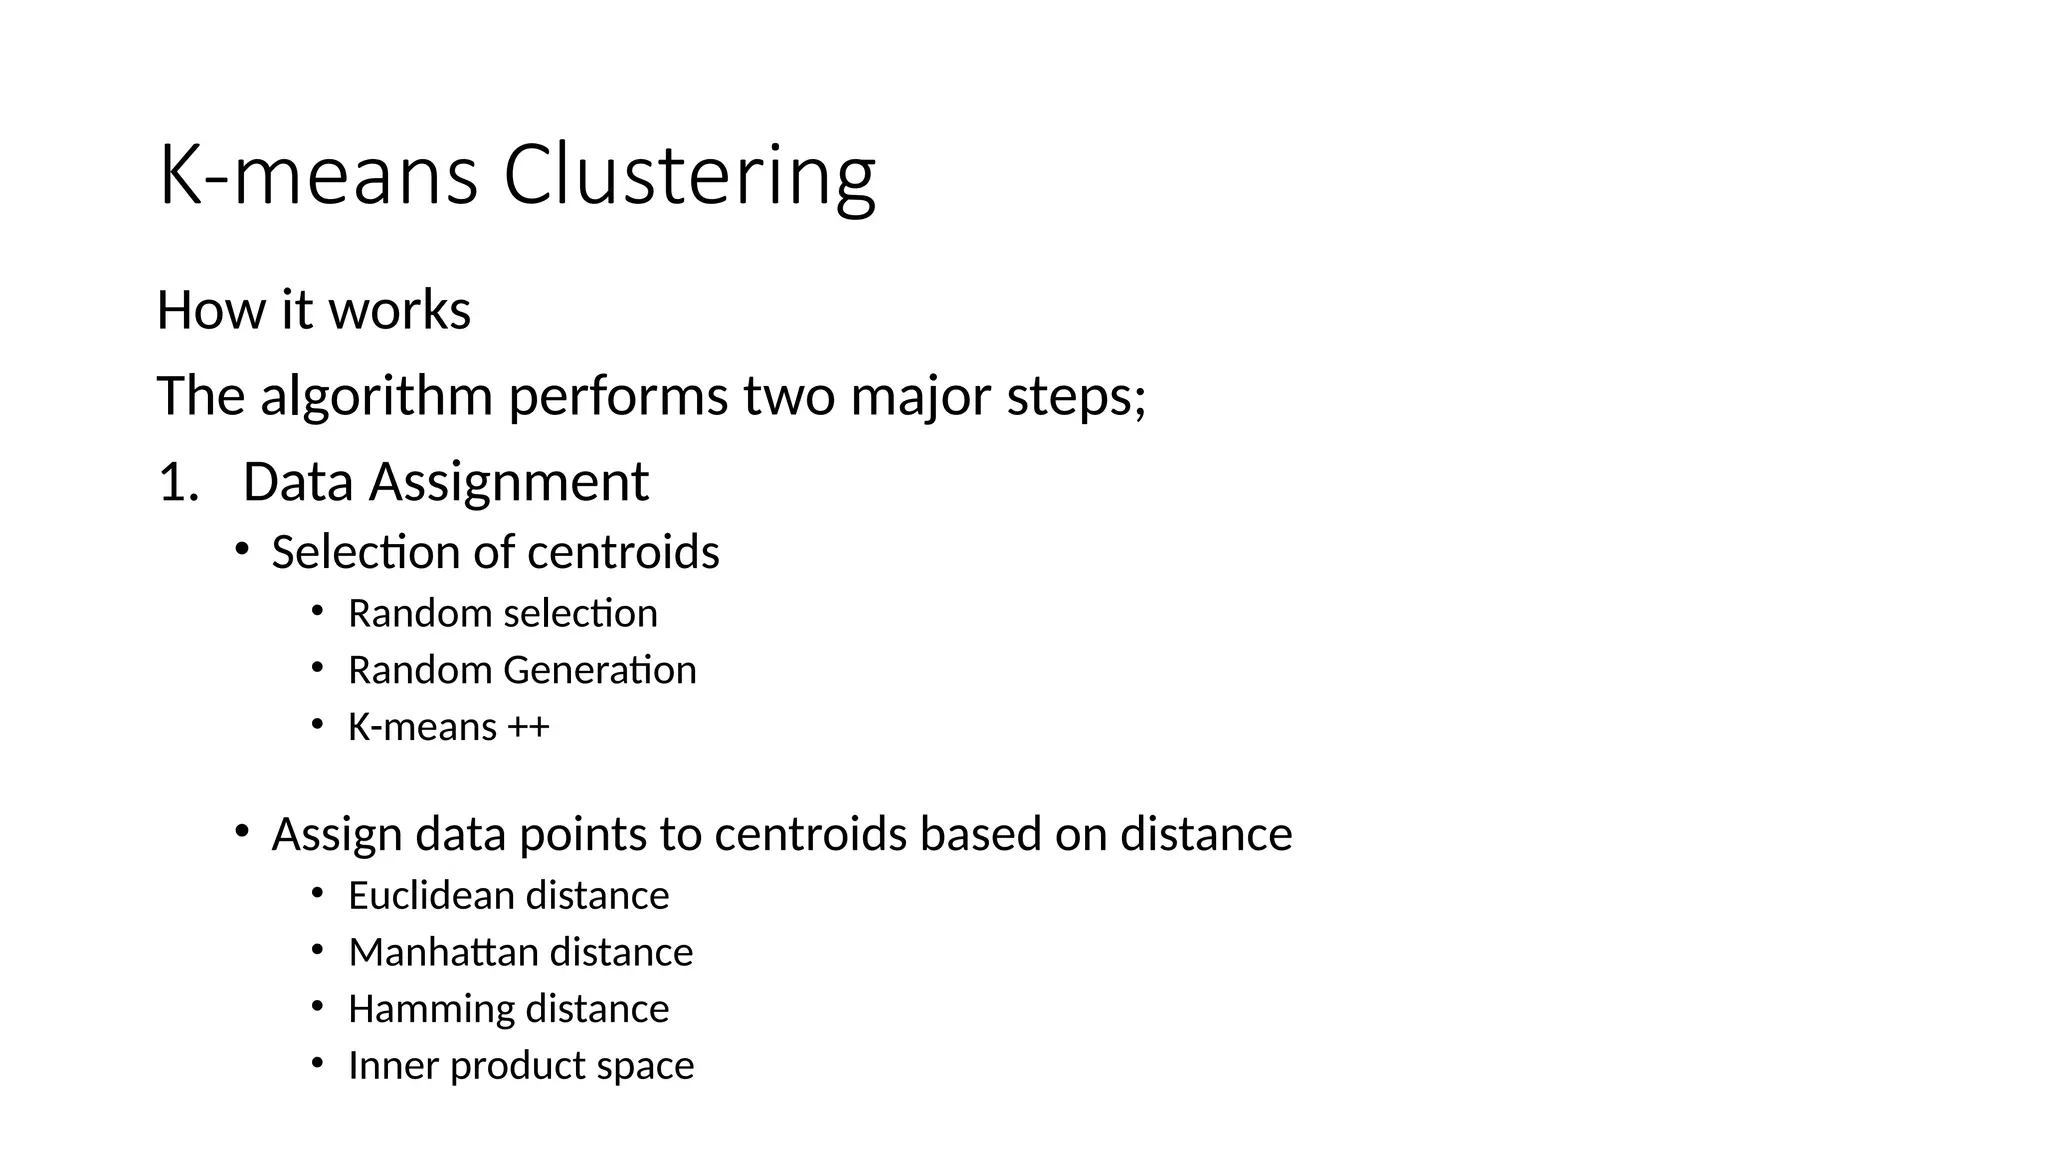
How itworks
The algorithm performs two major steps;
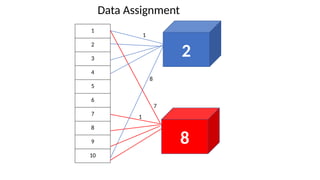
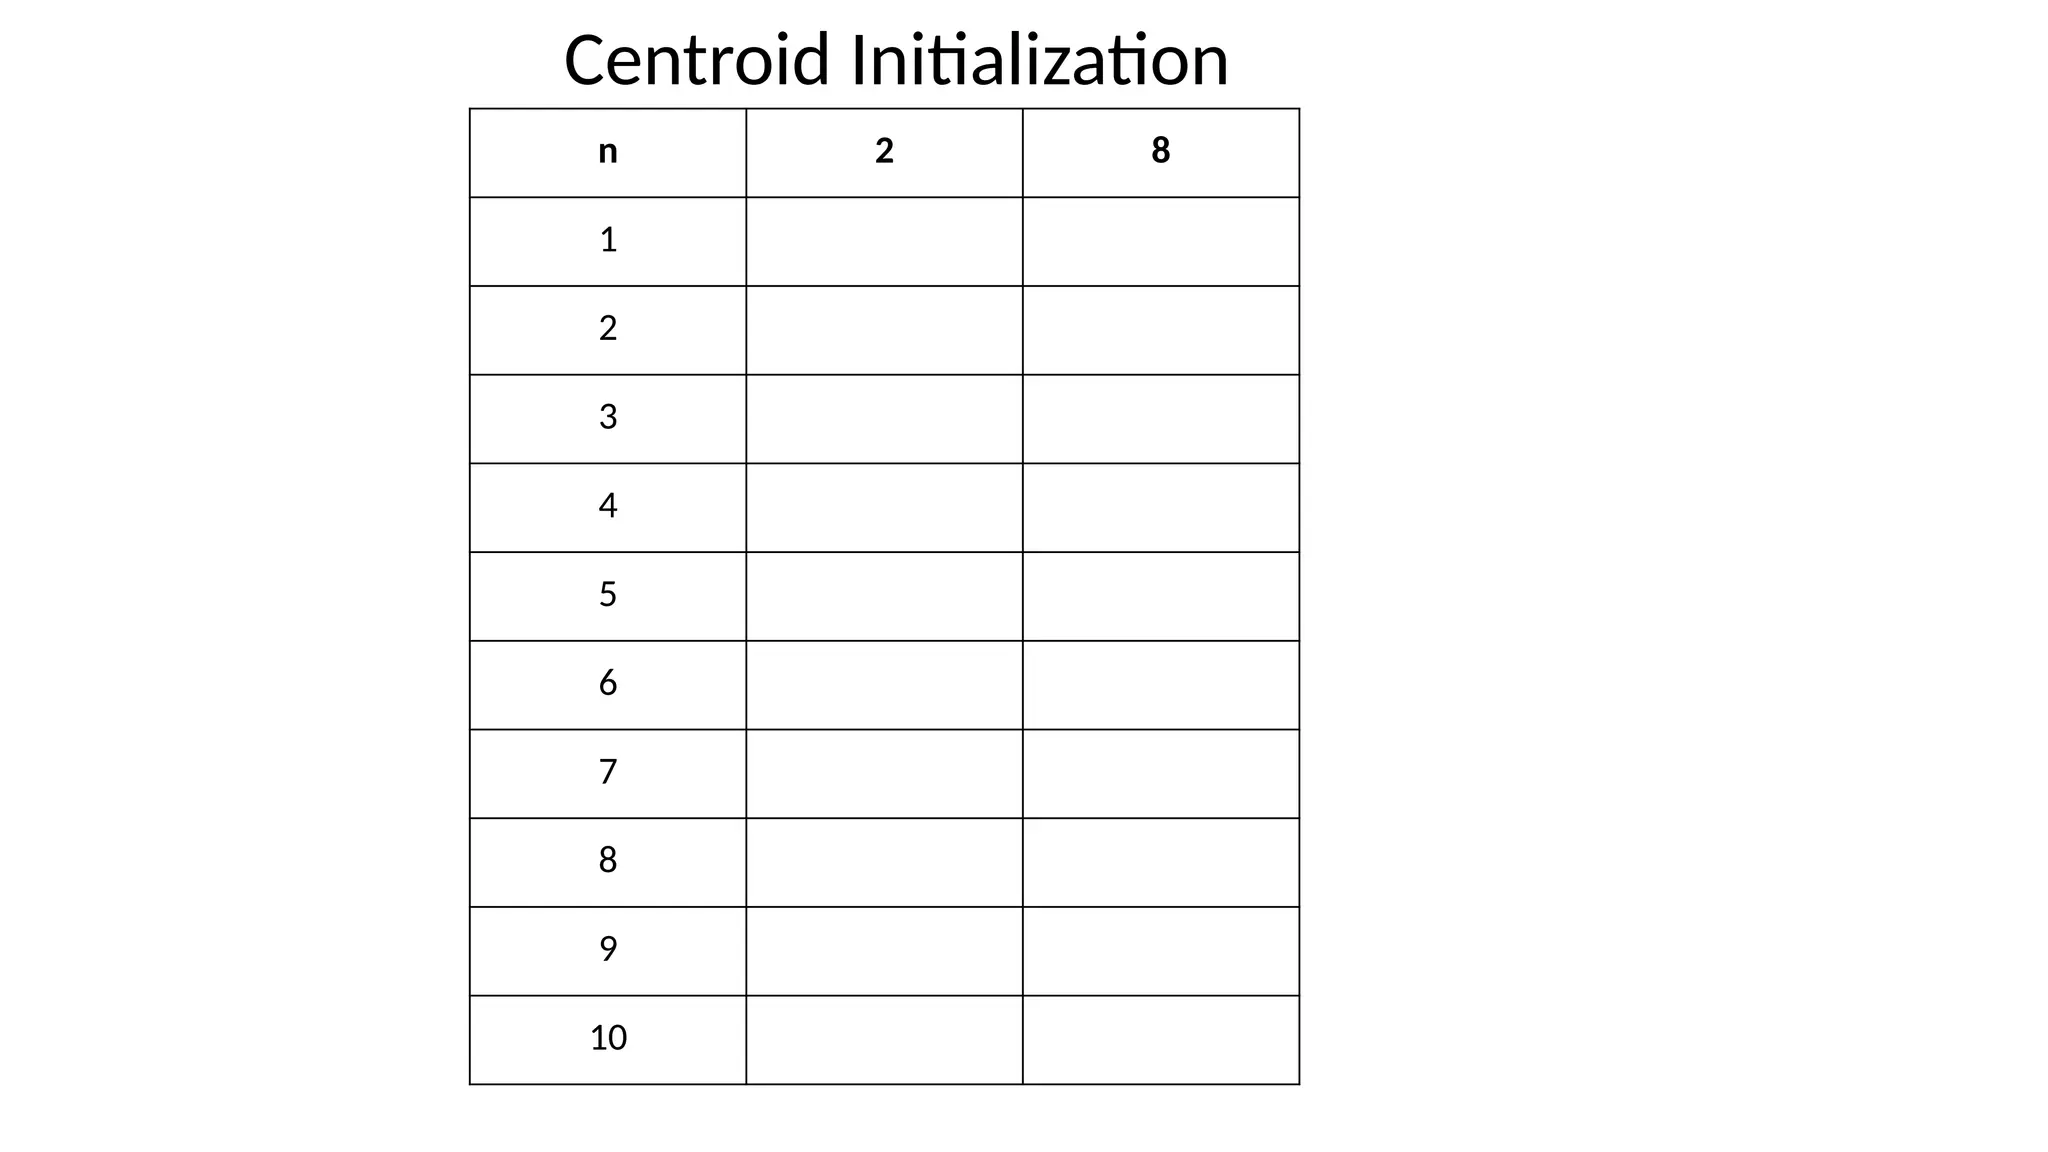
1. Data Assignment
• Selection of centroids
• Random selection
• Random Generation
• K-means ++
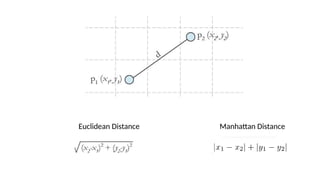
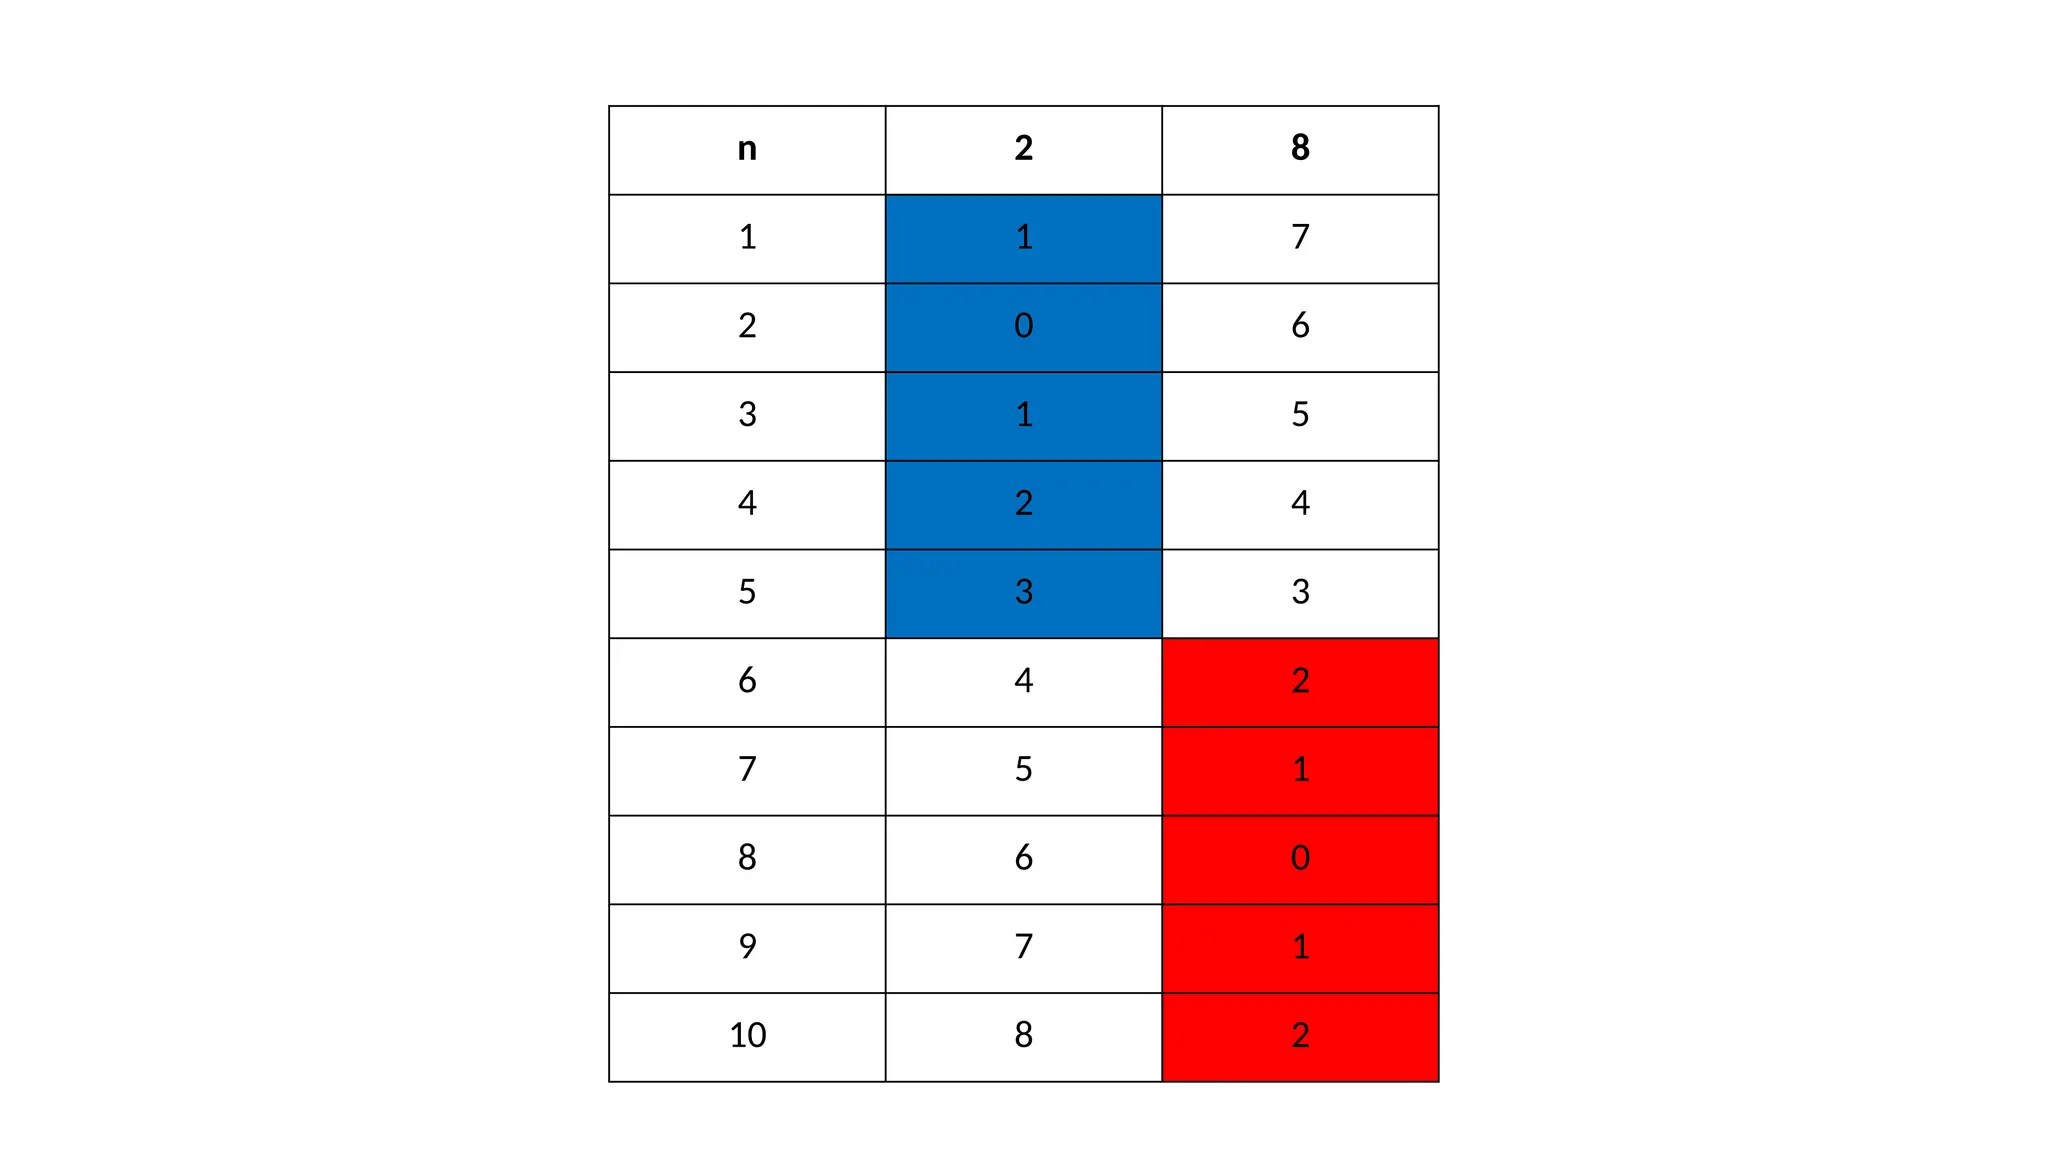
• Assign data points to centroids based on distance
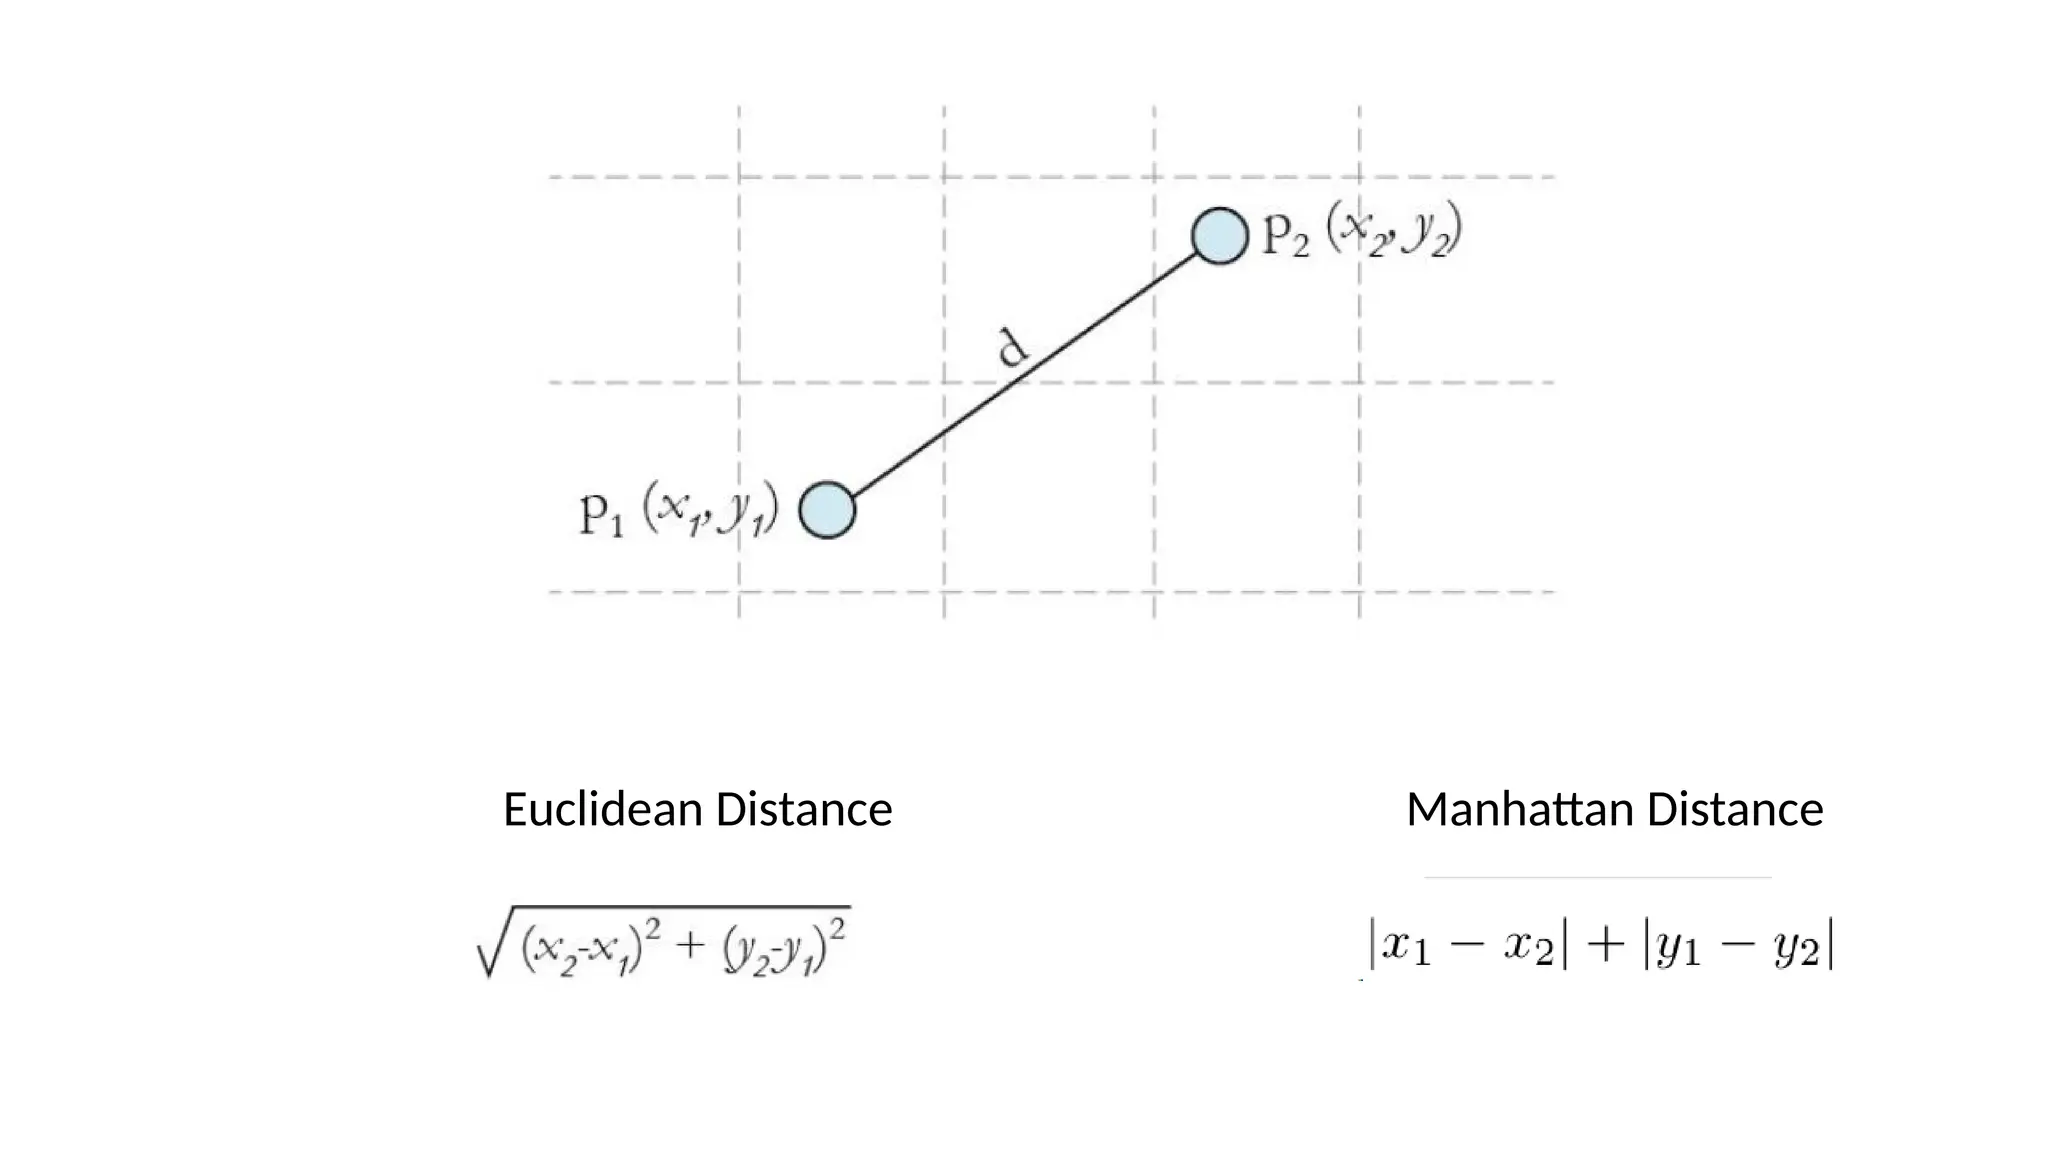
• Euclidean distance
• Manhattan distance
• Hamming distance
• Inner product space
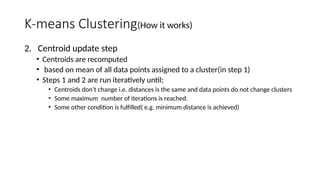
K-means Clustering(How itworks)
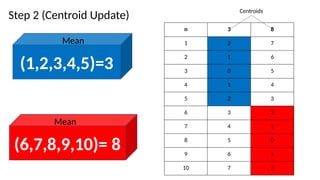
2. Centroid update step
• Centroids are recomputed
• based on mean of all data points assigned to a cluster(in step 1)
• Steps 1 and 2 are run iteratively until;
• Centroids don’t change i.e. distances is the same and data points do not change clusters
• Some maximum number of iterations is reached.
• Some other condition is fulfilled( e.g. minimum distance is achieved)
NOTE
The centroids donot change after the 2nd
iteration. Therefore we stop
updating the centroids.
Remember !
Our goal is to identify the optimum value of K.
17.
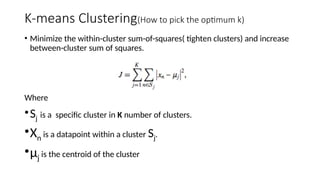
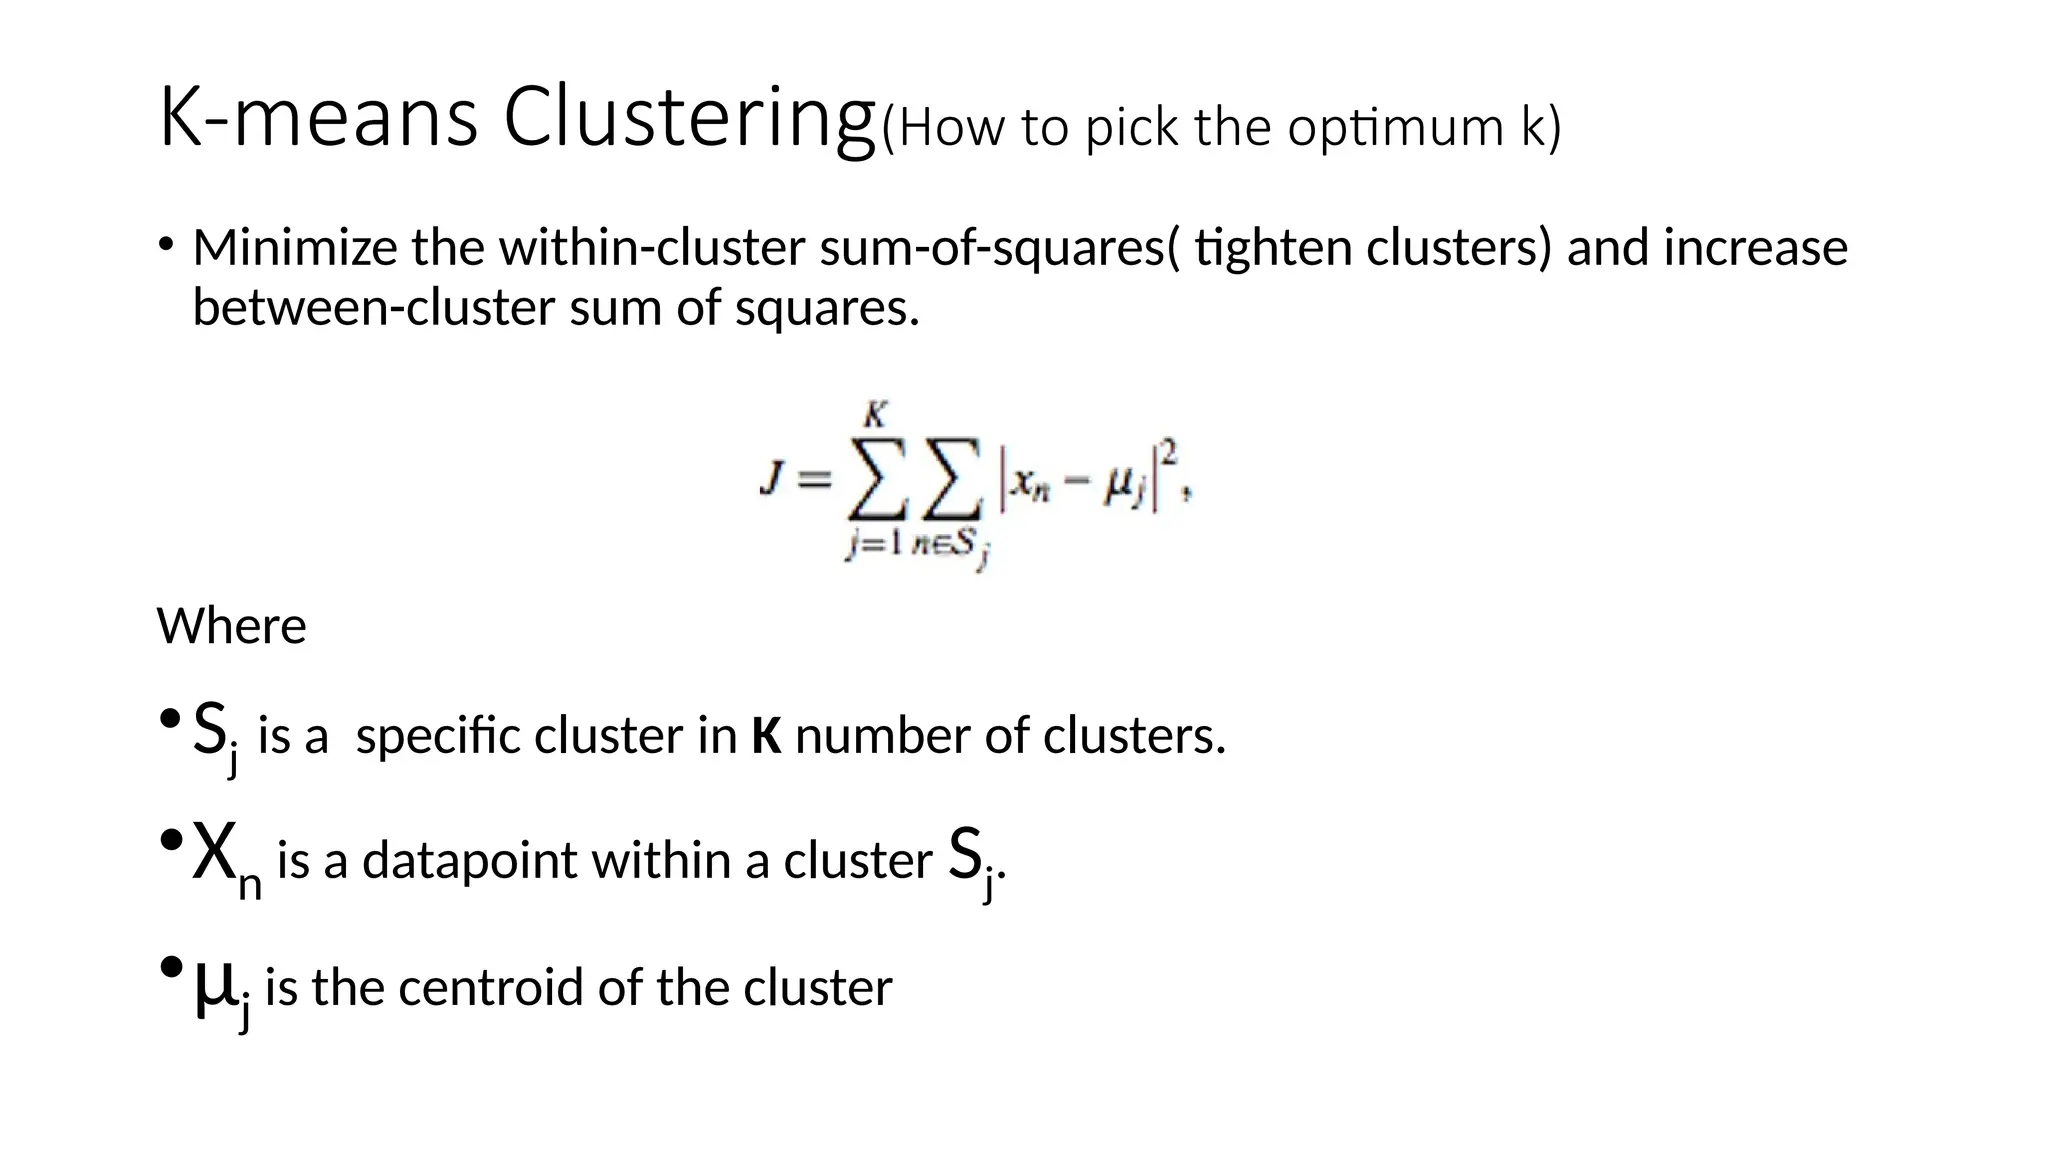
K-means Clustering(How topick the optimum k)
• Minimize the within-cluster sum-of-squares( tighten clusters) and increase
between-cluster sum of squares.
Where
•Sj is a specific cluster in K number of clusters.
•Xn is a datapoint within a cluster Sj.
•µj is the centroid of the cluster
18.
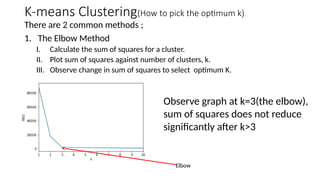
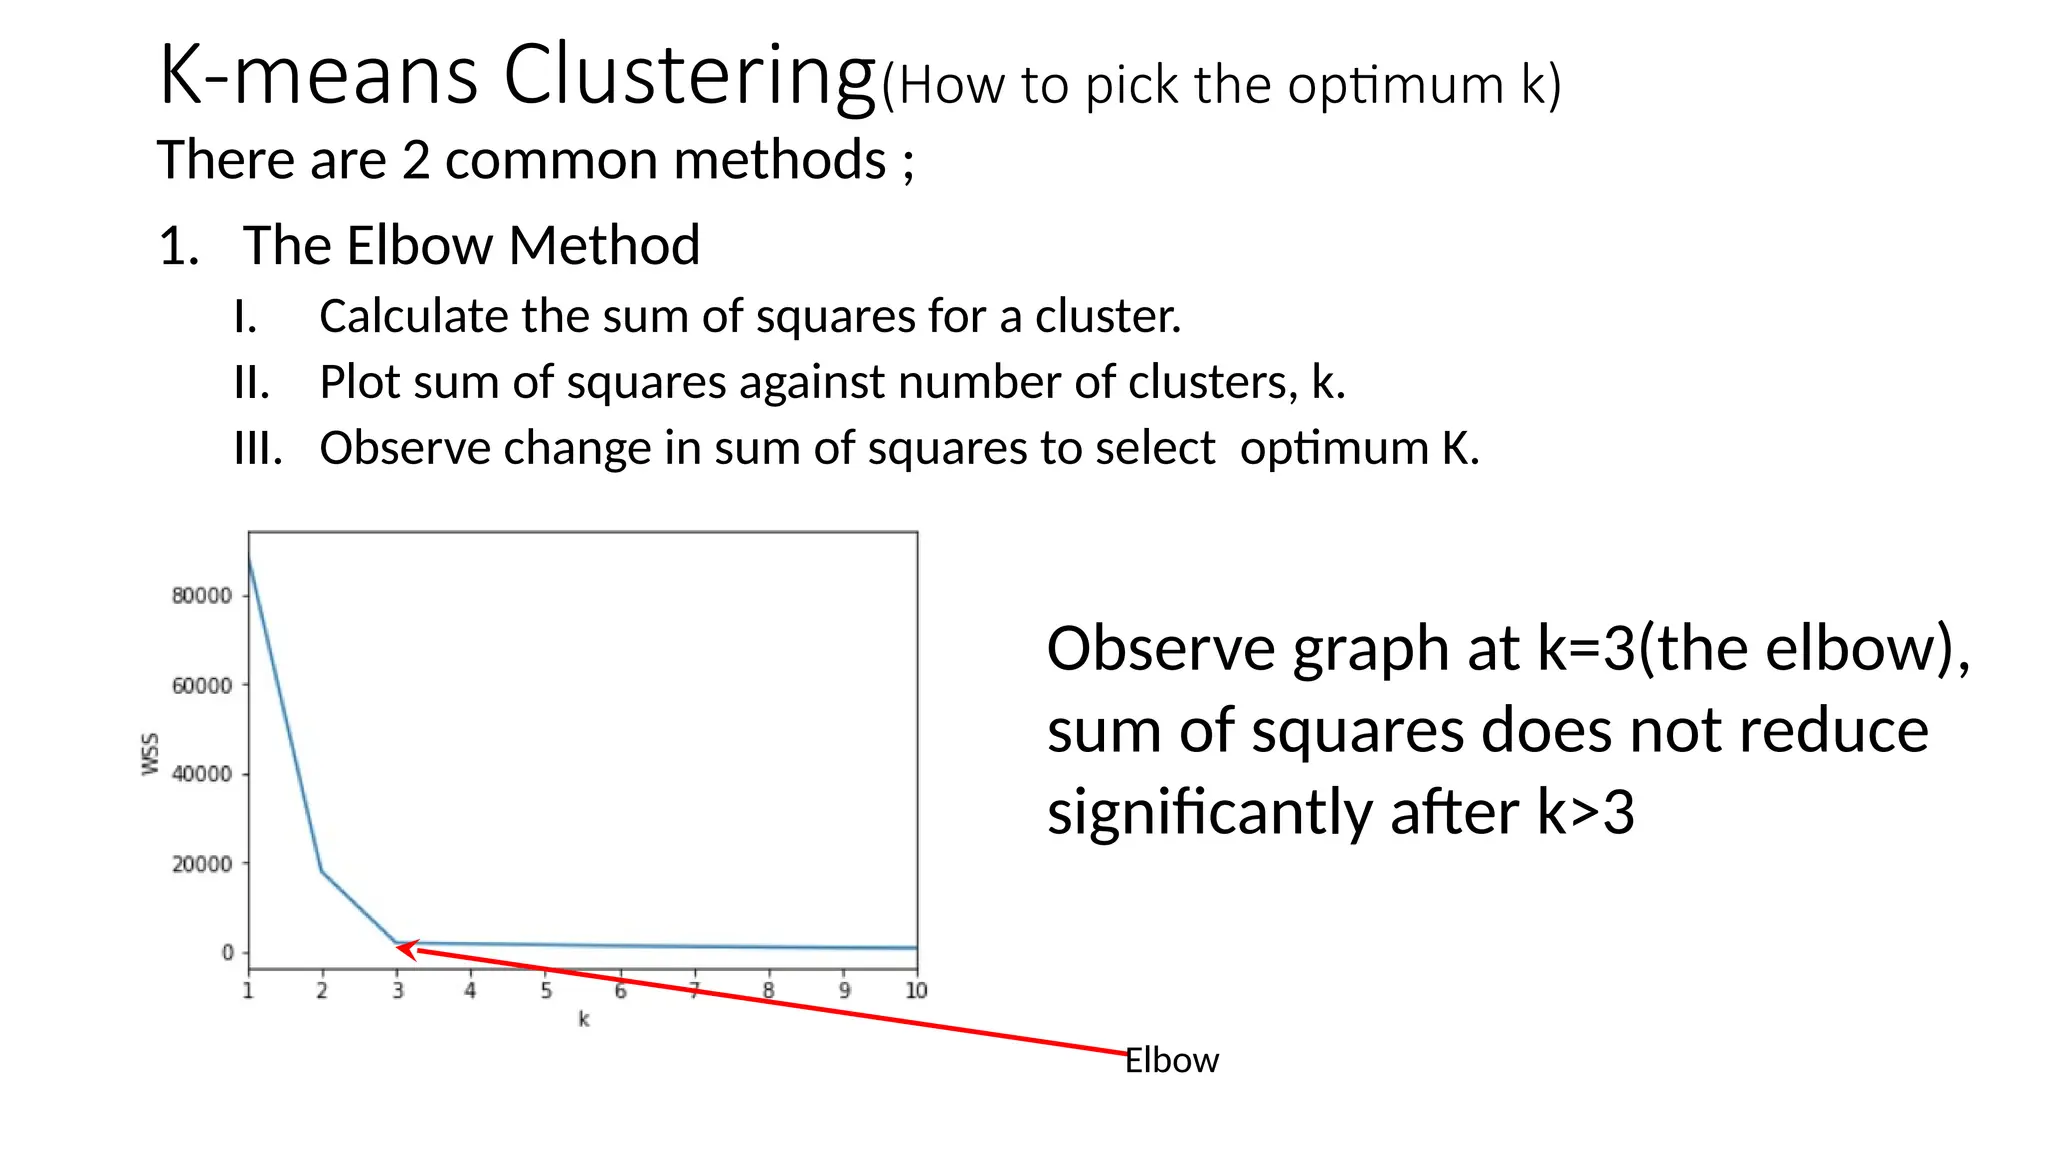
There are 2common methods ;
1. The Elbow Method
I. Calculate the sum of squares for a cluster.
II. Plot sum of squares against number of clusters, k.
III. Observe change in sum of squares to select optimum K.
K-means Clustering(How to pick the optimum k)
Observe graph at k=3(the elbow),
sum of squares does not reduce
significantly after k>3
Elbow
19.
Limitations with theelbow method is that the elbow might not be well
defined.
This can be overcome using the Silhouette method
2. Silhouette method
• The silhouette value is a measure of how similar an object is to its
own cluster (cohesion) compared to other clusters (separation).
• It ranges from [+1,-1] with +1 showing that the point is very close to
its own cluster, -1 shows that the point is very similar to the
neighboring cluster.
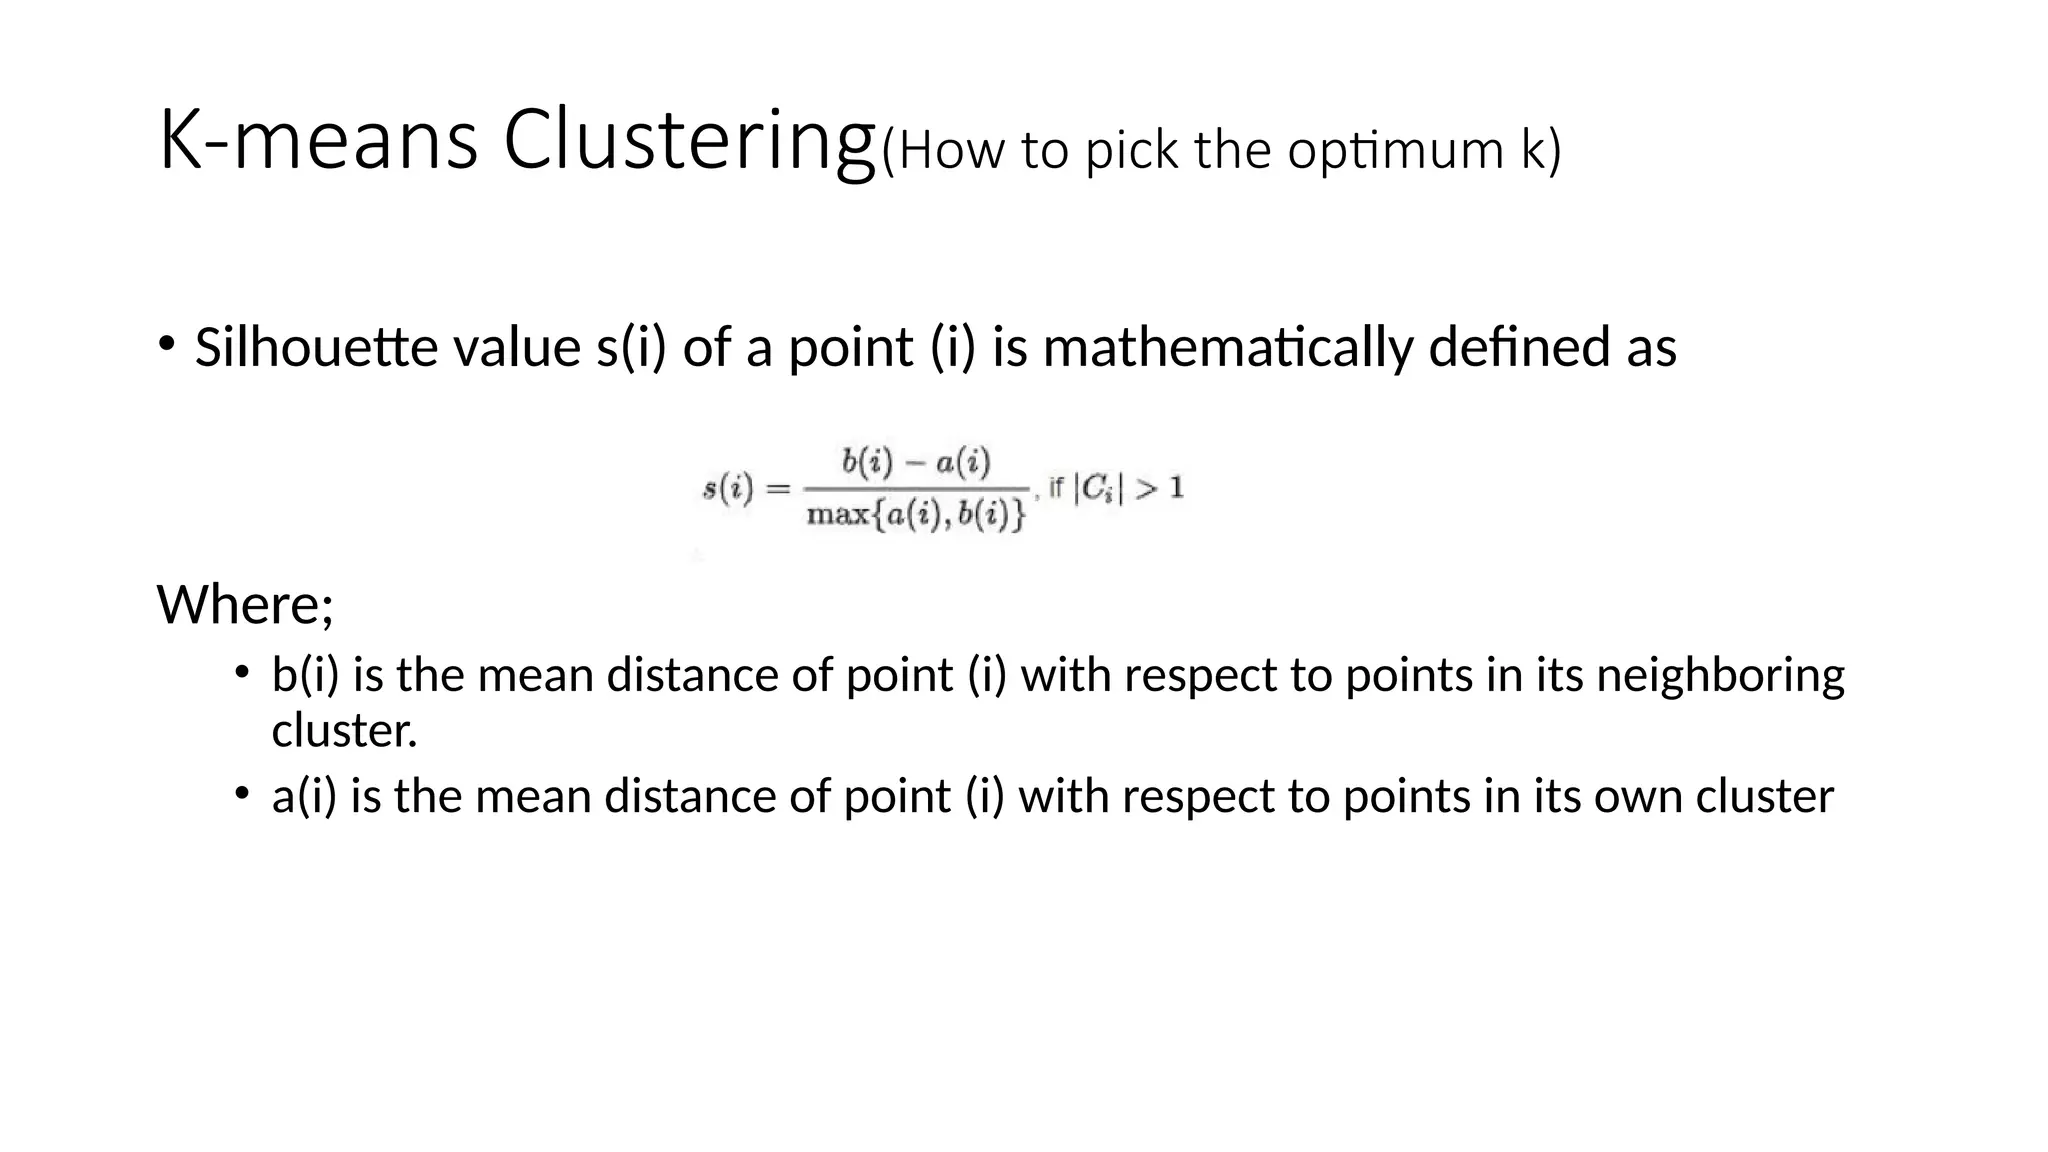
K-means Clustering(How to pick the optimum k)
20.
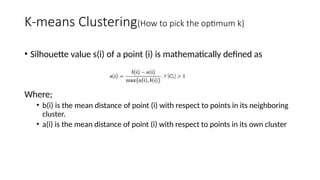
• Silhouette values(i) of a point (i) is mathematically defined as
Where;
• b(i) is the mean distance of point (i) with respect to points in its neighboring
cluster.
• a(i) is the mean distance of point (i) with respect to points in its own cluster
K-means Clustering(How to pick the optimum k)
21.
K-means Clustering(advantages)
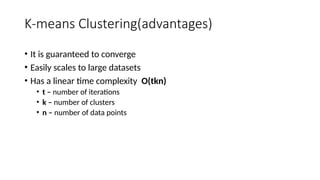
• Itis guaranteed to converge
• Easily scales to large datasets
• Has a linear time complexity O(tkn)
• t – number of iterations
• k – number of clusters
• n – number of data points
22.
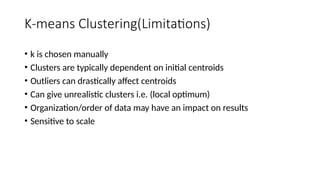
K-means Clustering(Limitations)
• kis chosen manually
• Clusters are typically dependent on initial centroids
• Outliers can drastically affect centroids
• Can give unrealistic clusters i.e. (local optimum)
• Organization/order of data may have an impact on results
• Sensitive to scale


![Limitations with the elbow method is that the elbow might not be well
defined.
This can be overcome using the Silhouette method
2. Silhouette method
• The silhouette value is a measure of how similar an object is to its
own cluster (cohesion) compared to other clusters (separation).
• It ranges from [+1,-1] with +1 showing that the point is very close to
its own cluster, -1 shows that the point is very similar to the
neighboring cluster.
K-means Clustering(How to pick the optimum k)](https://image.slidesharecdn.com/kmeans-clustering-251013081950-60dd321e/85/Kmeans-clustering-using-machine-learning-19-320.jpg)


![Limitations with the elbow method is that the elbow might not be well
defined.
This can be overcome using the Silhouette method
2. Silhouette method
• The silhouette value is a measure of how similar an object is to its
own cluster (cohesion) compared to other clusters (separation).
• It ranges from [+1,-1] with +1 showing that the point is very close to
its own cluster, -1 shows that the point is very similar to the
neighboring cluster.
K-means Clustering(How to pick the optimum k)](https://image.slidesharecdn.com/kmeans-clustering-251013081950-60dd321e/75/Kmeans-clustering-using-machine-learning-19-2048.jpg)


![RTP_AR_Basic_Learners' Workbook_KS2 [FOR REPRODUCTION] (1).pdf](https://cdn.slidesharecdn.com/ss_thumbnails/rtparbasiclearnersworkbookks2forreproduction1-251016024943-e51a16ac-thumbnail.jpg?width=600ounds&width=560&fit=bounds)


