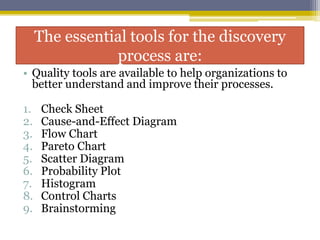
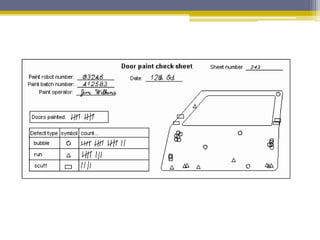
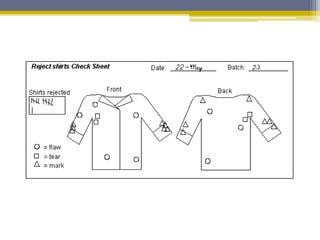
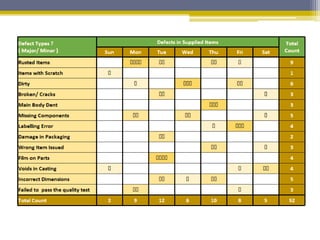
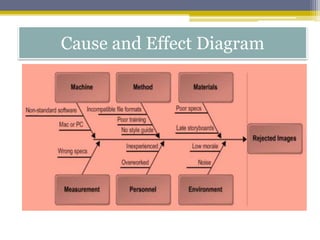
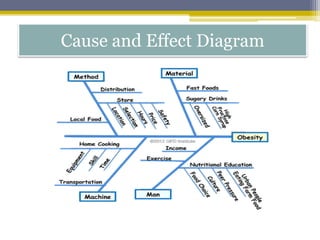
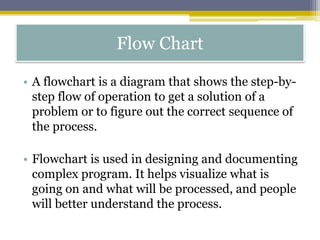
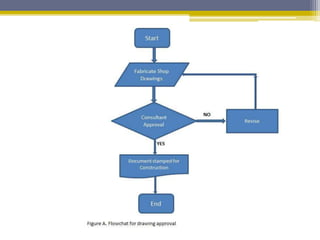
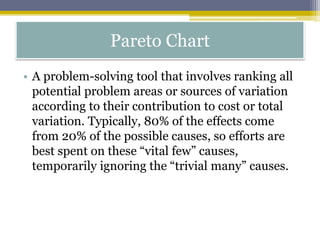
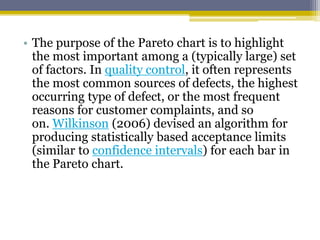
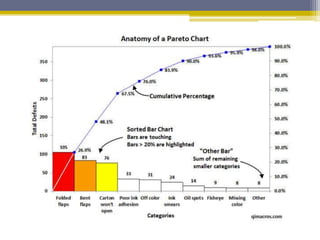
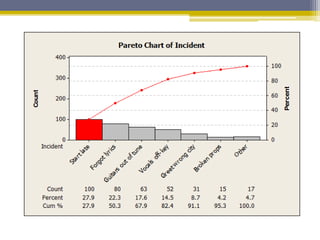
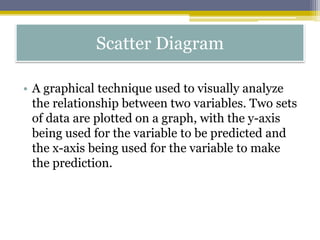
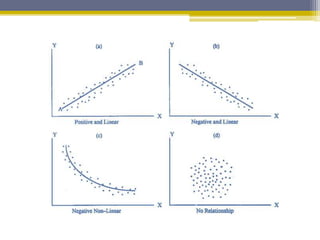
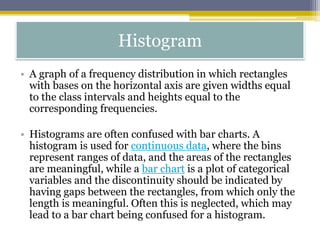
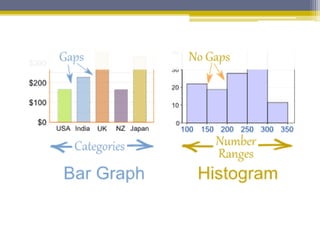
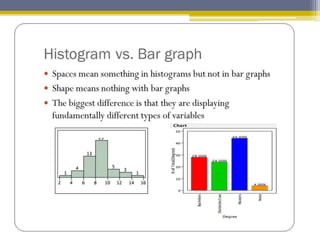
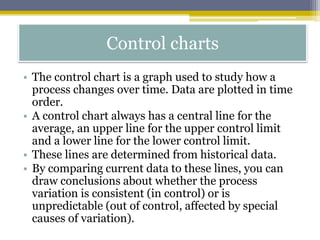
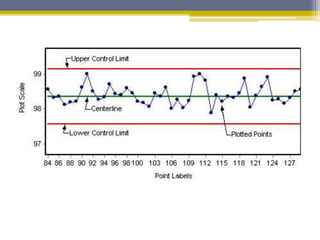
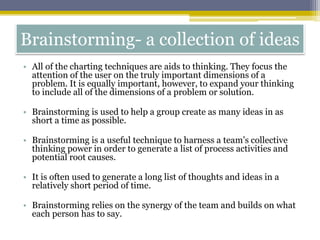
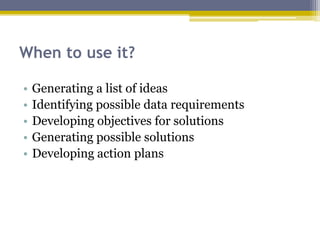
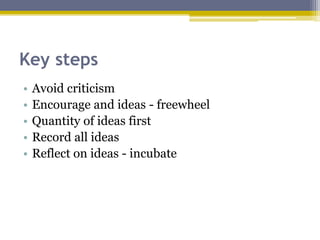
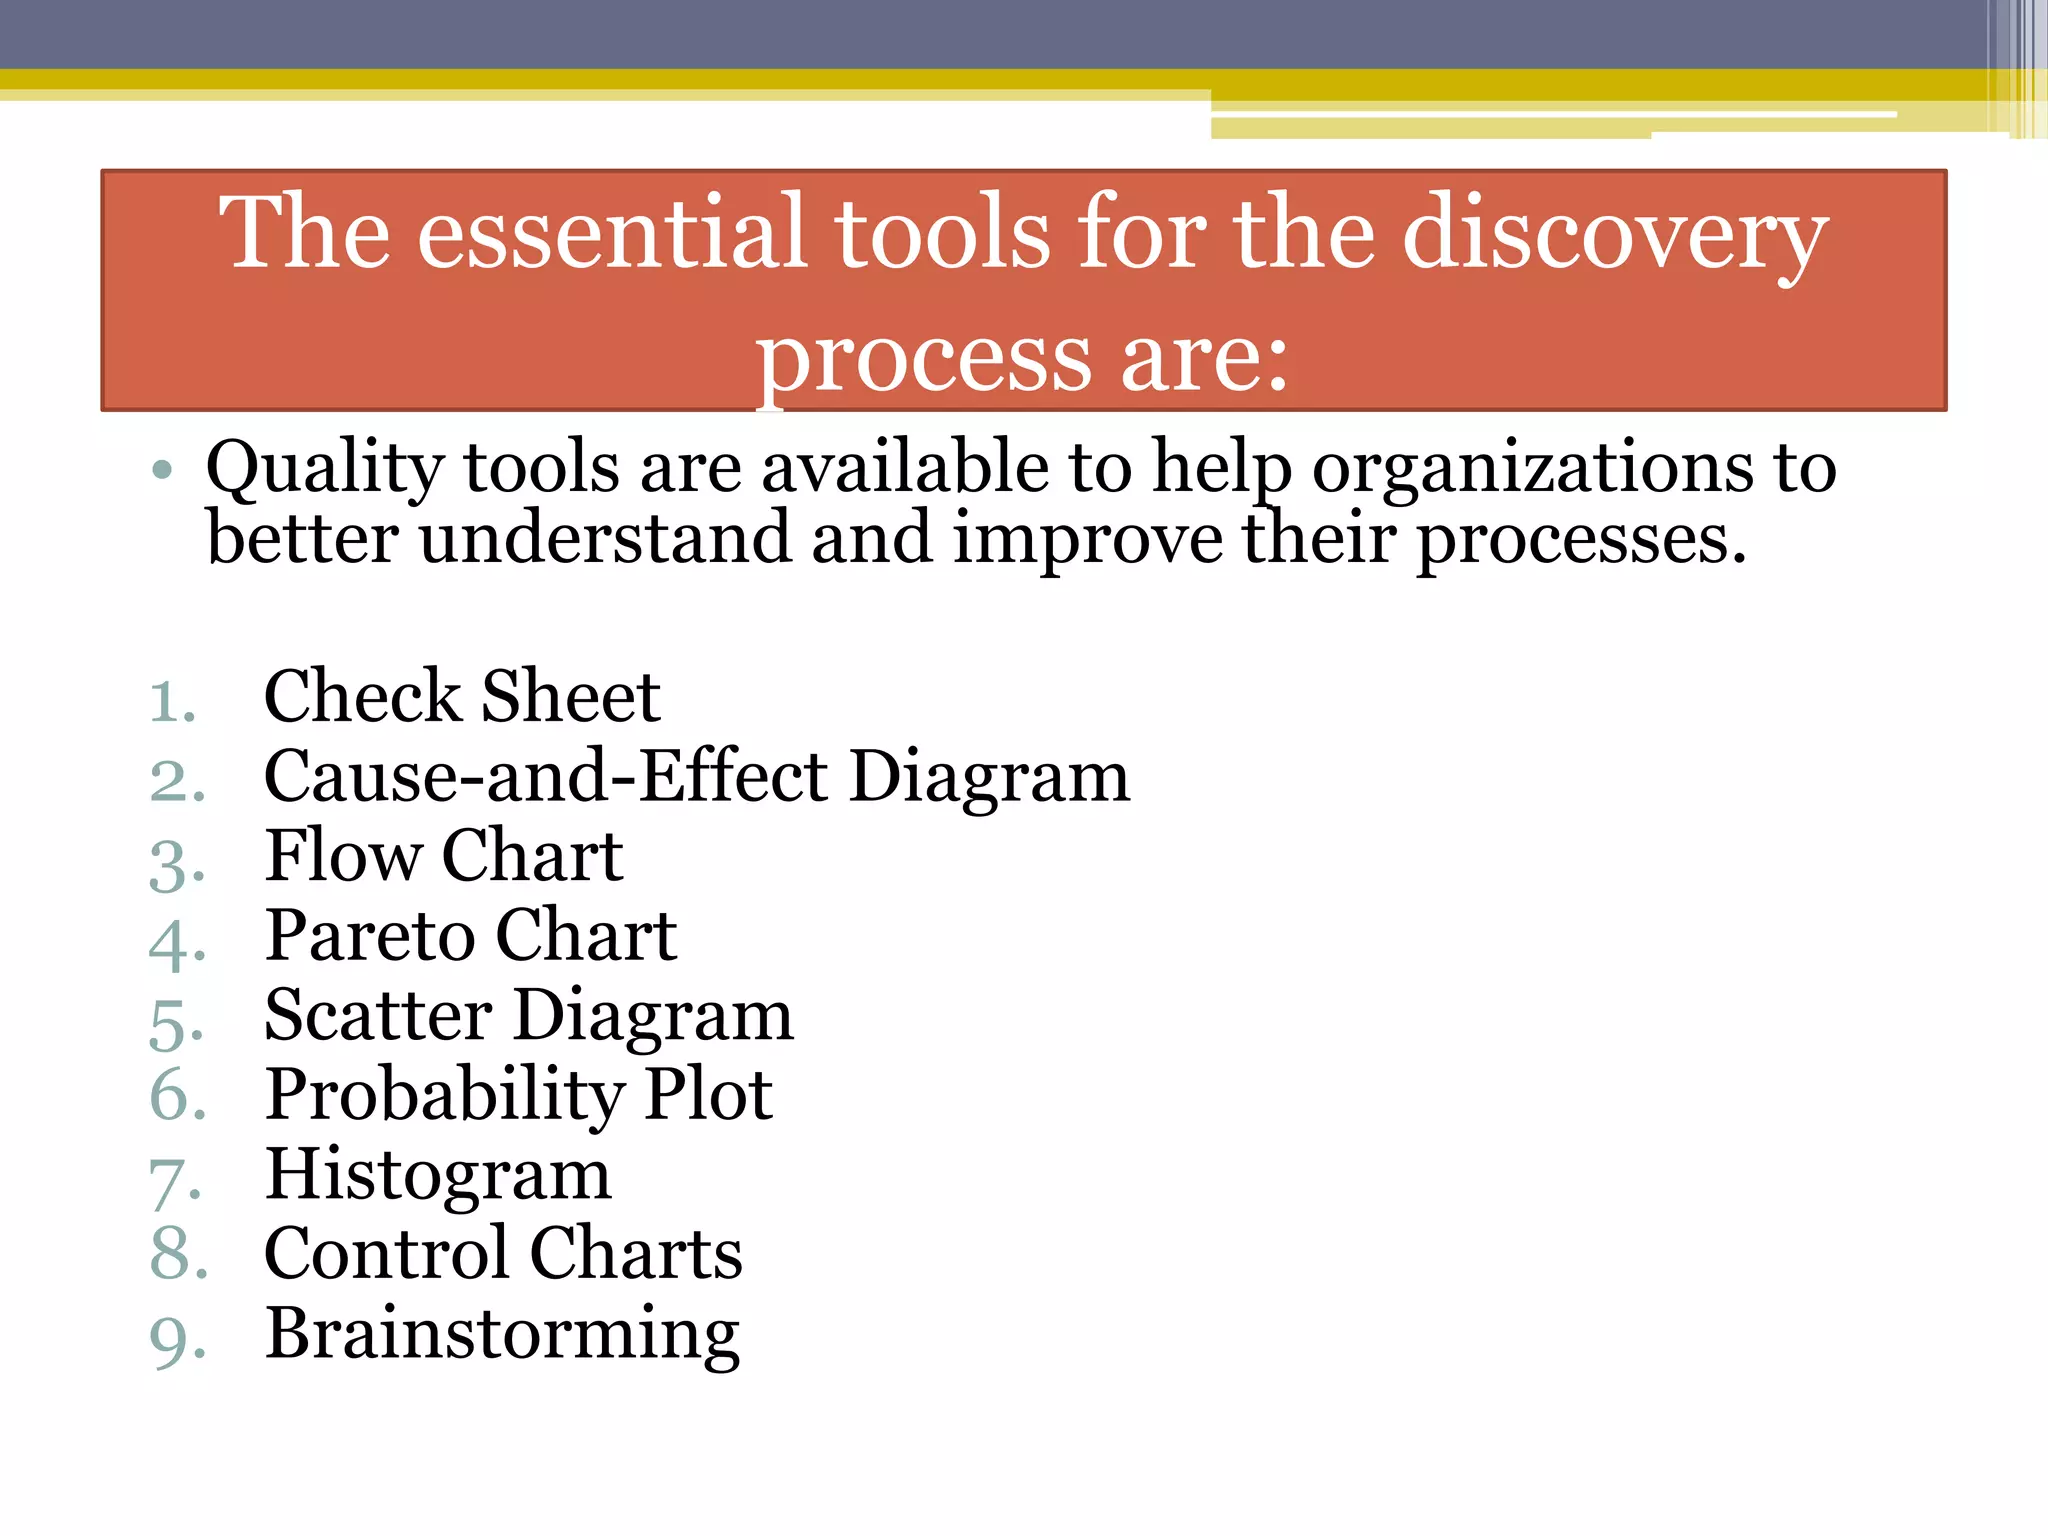
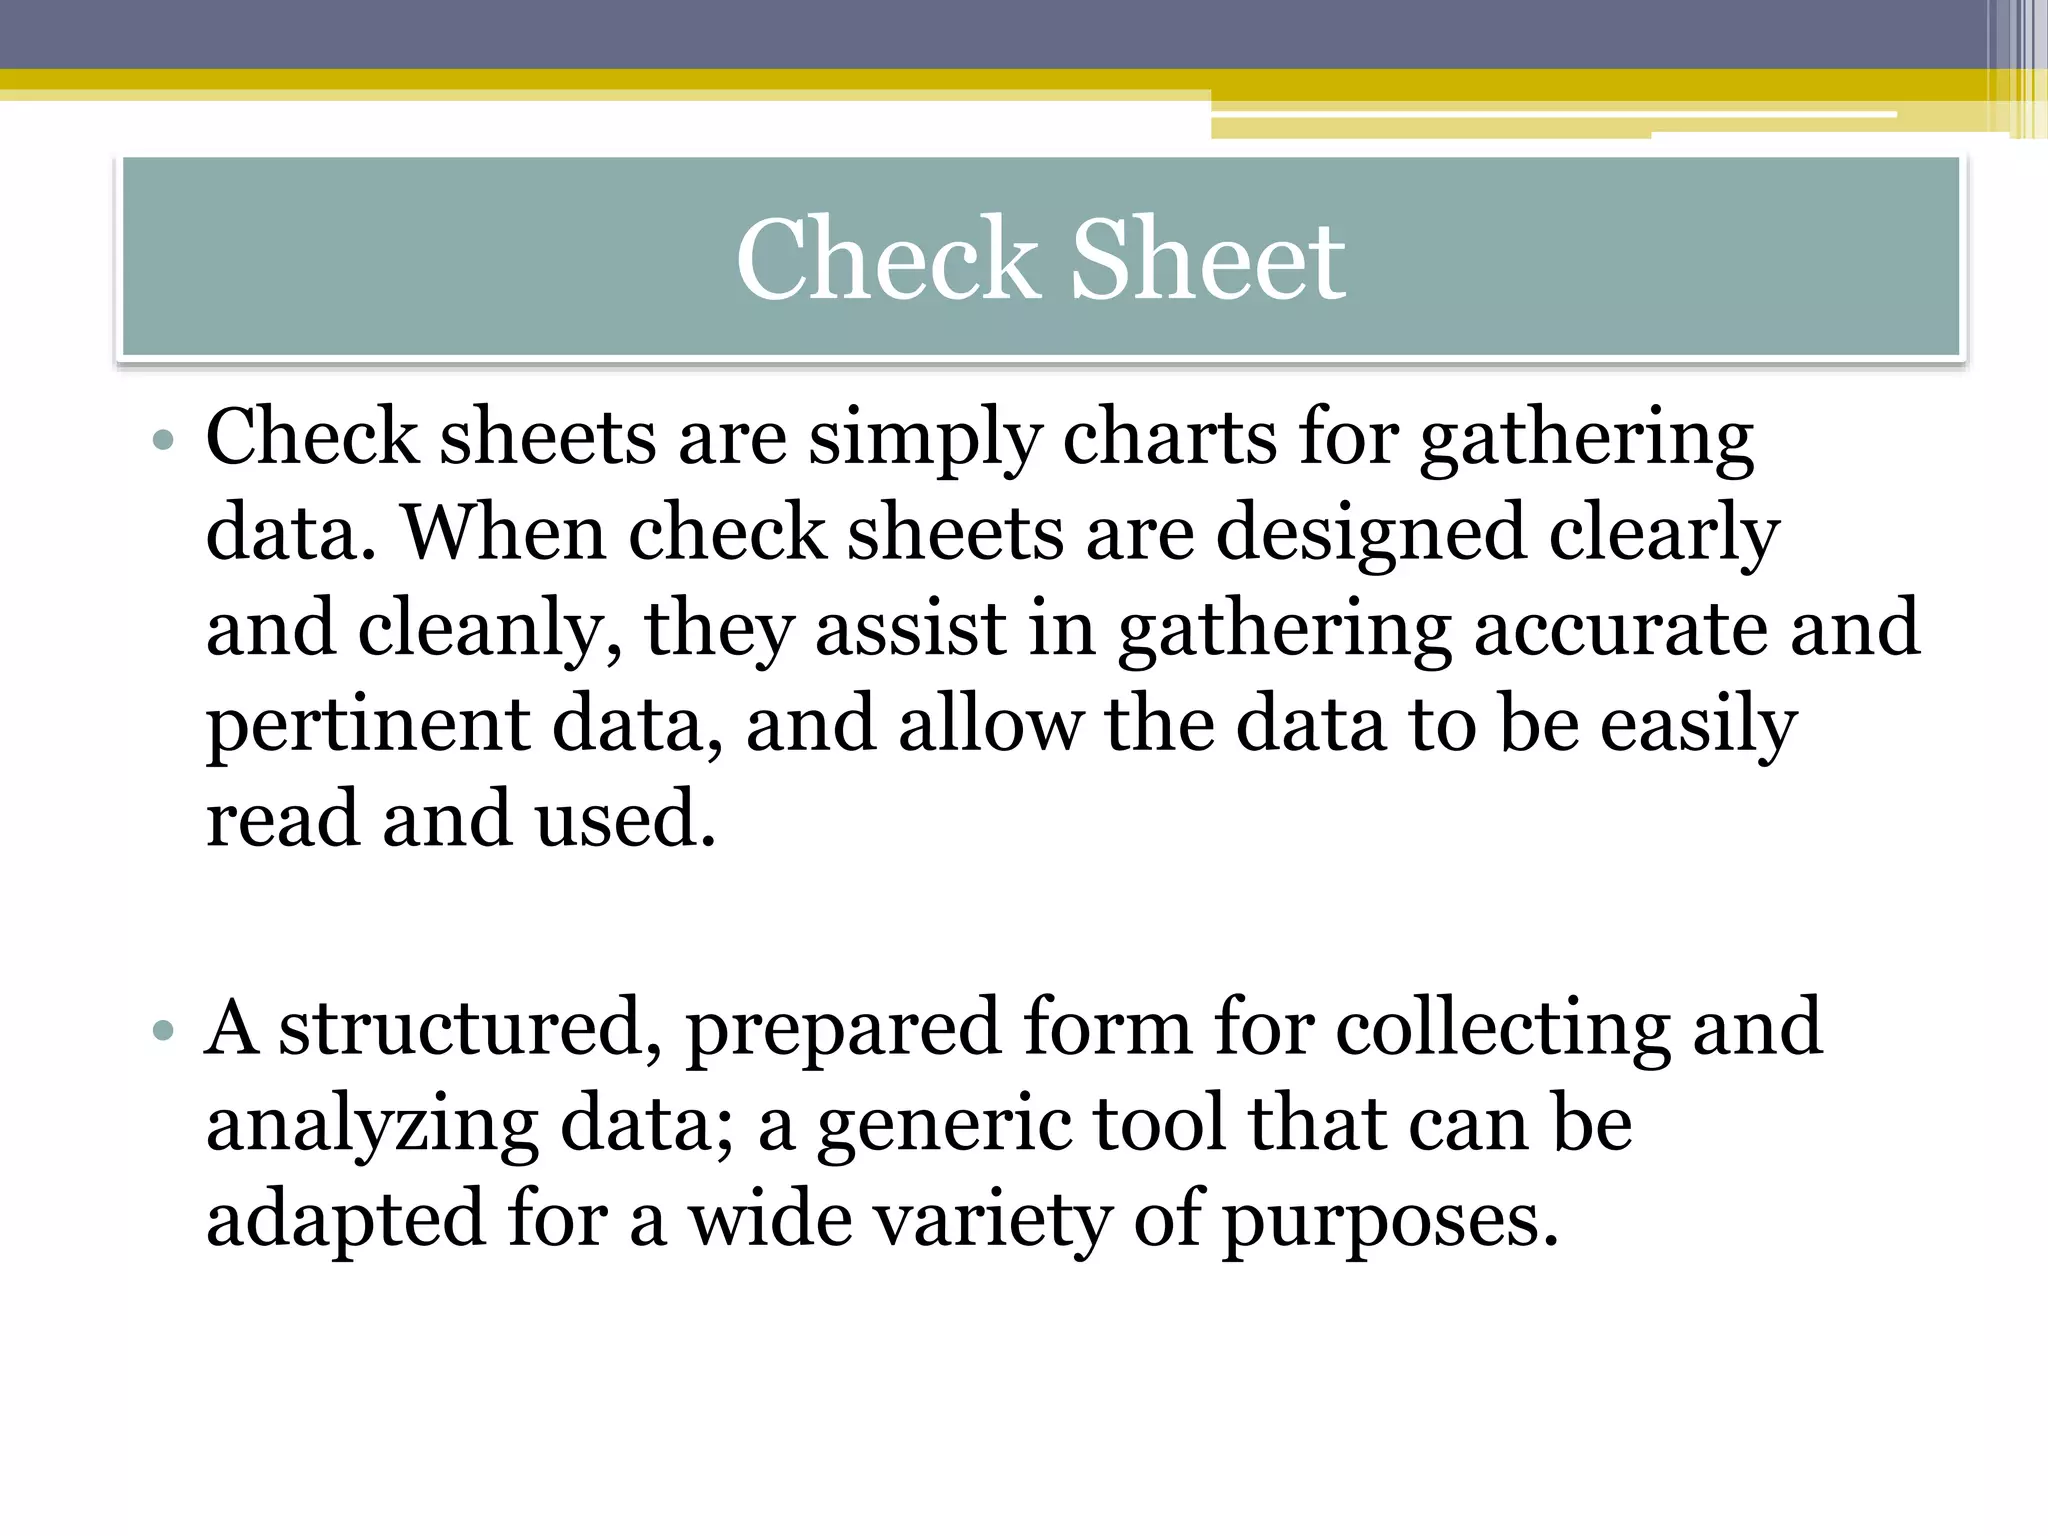
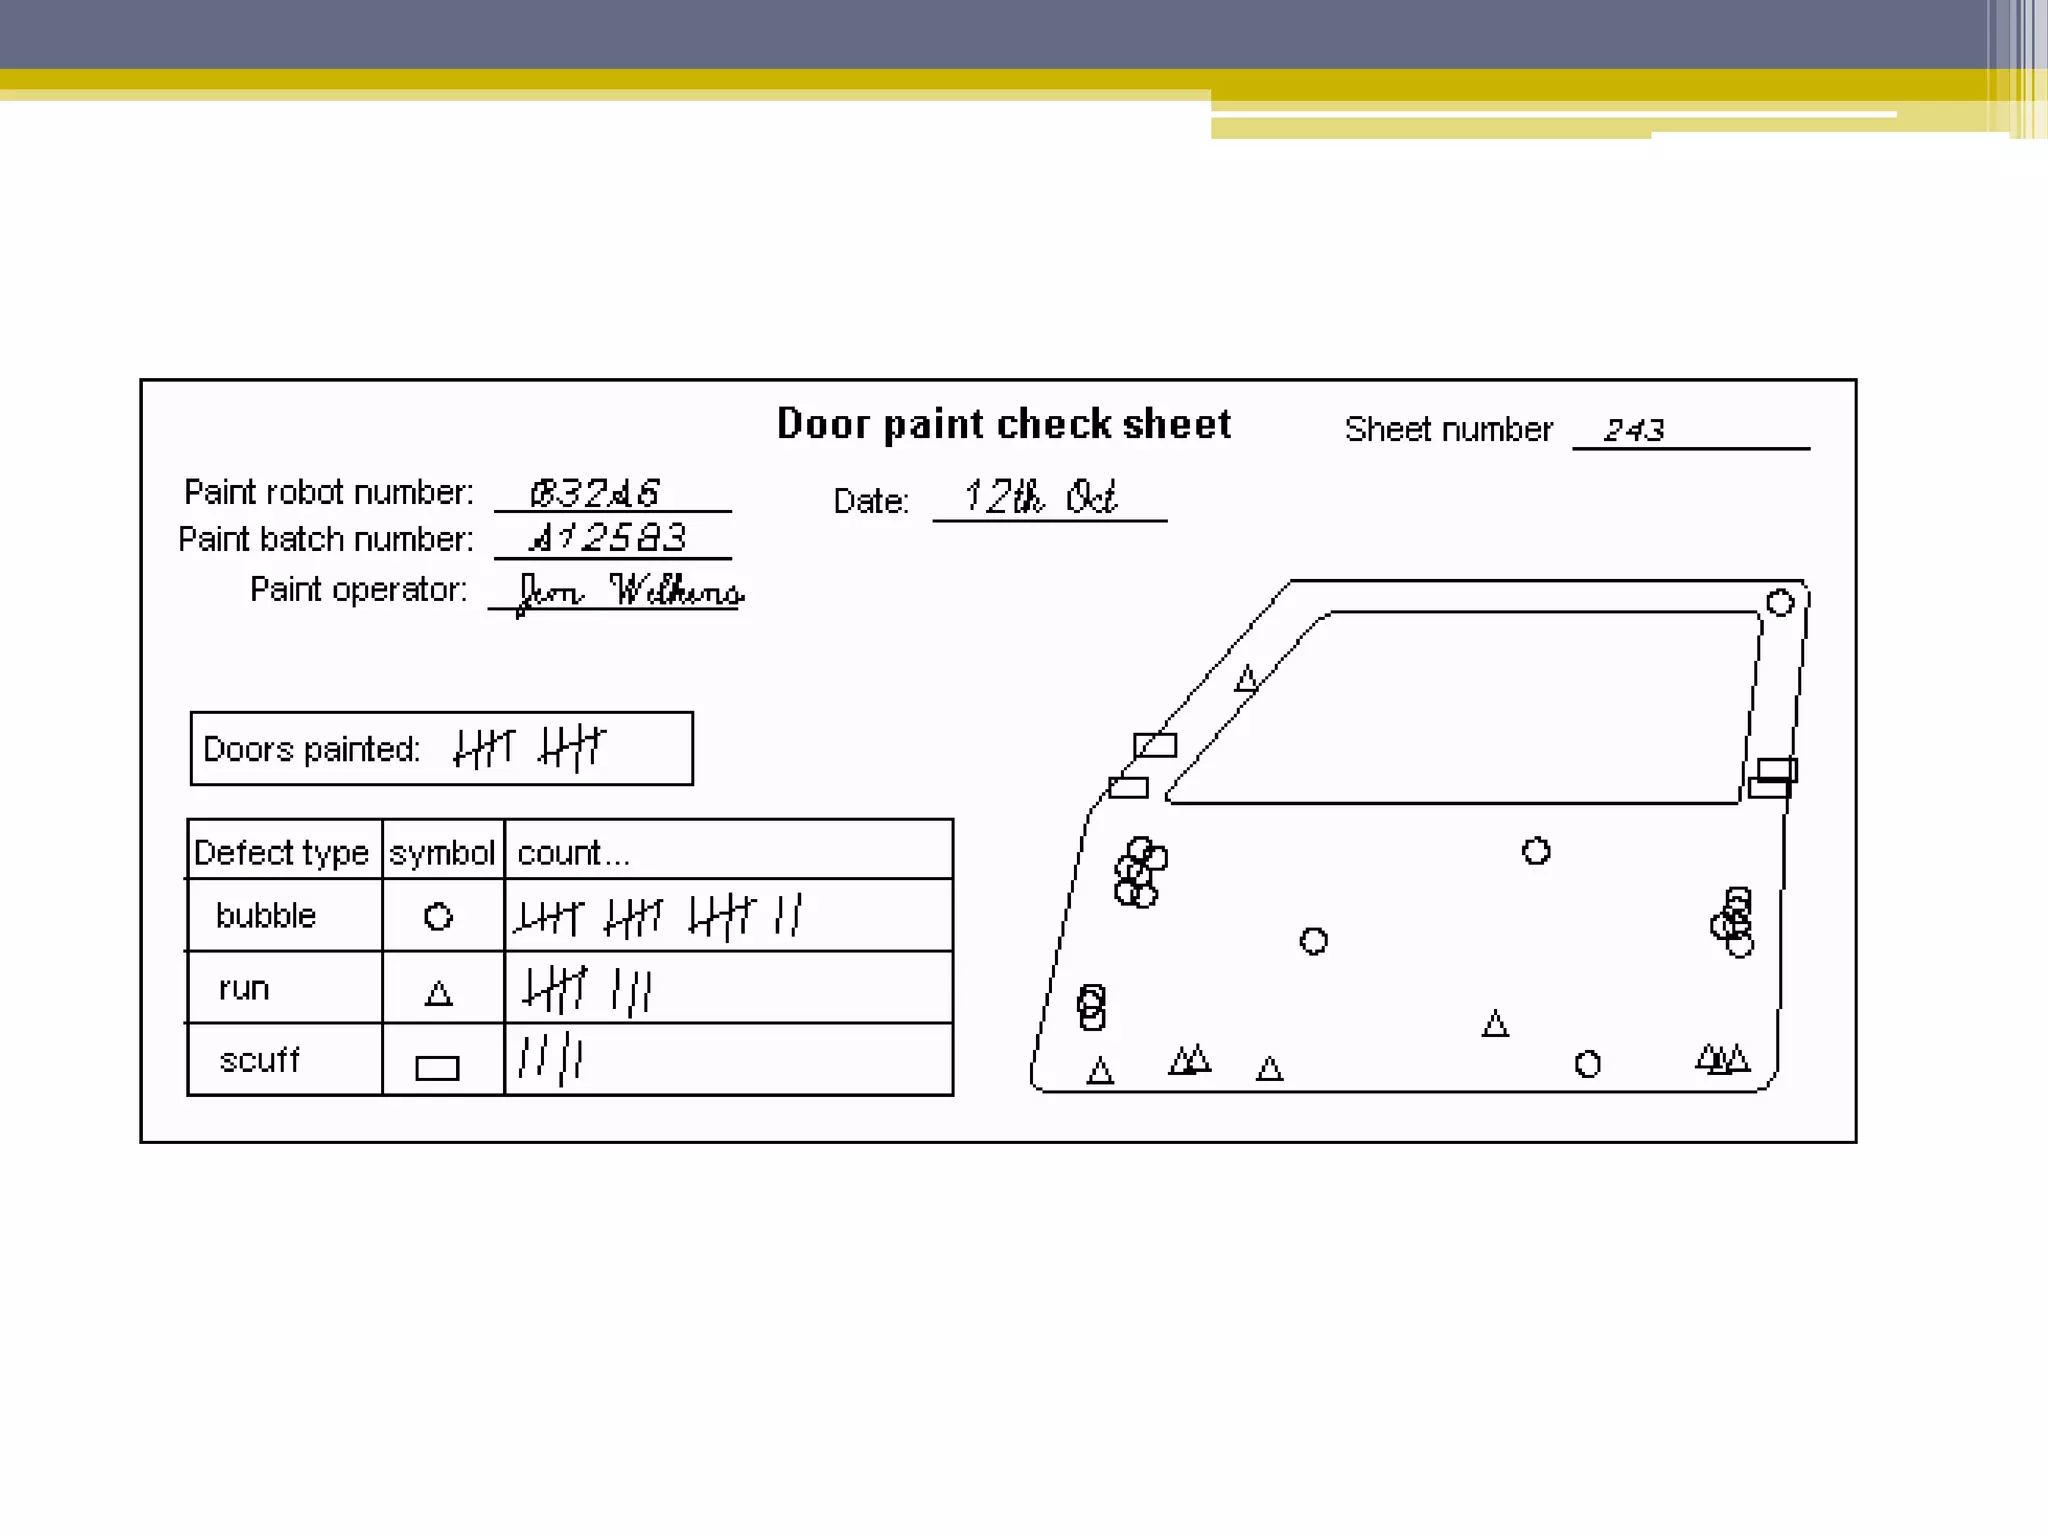
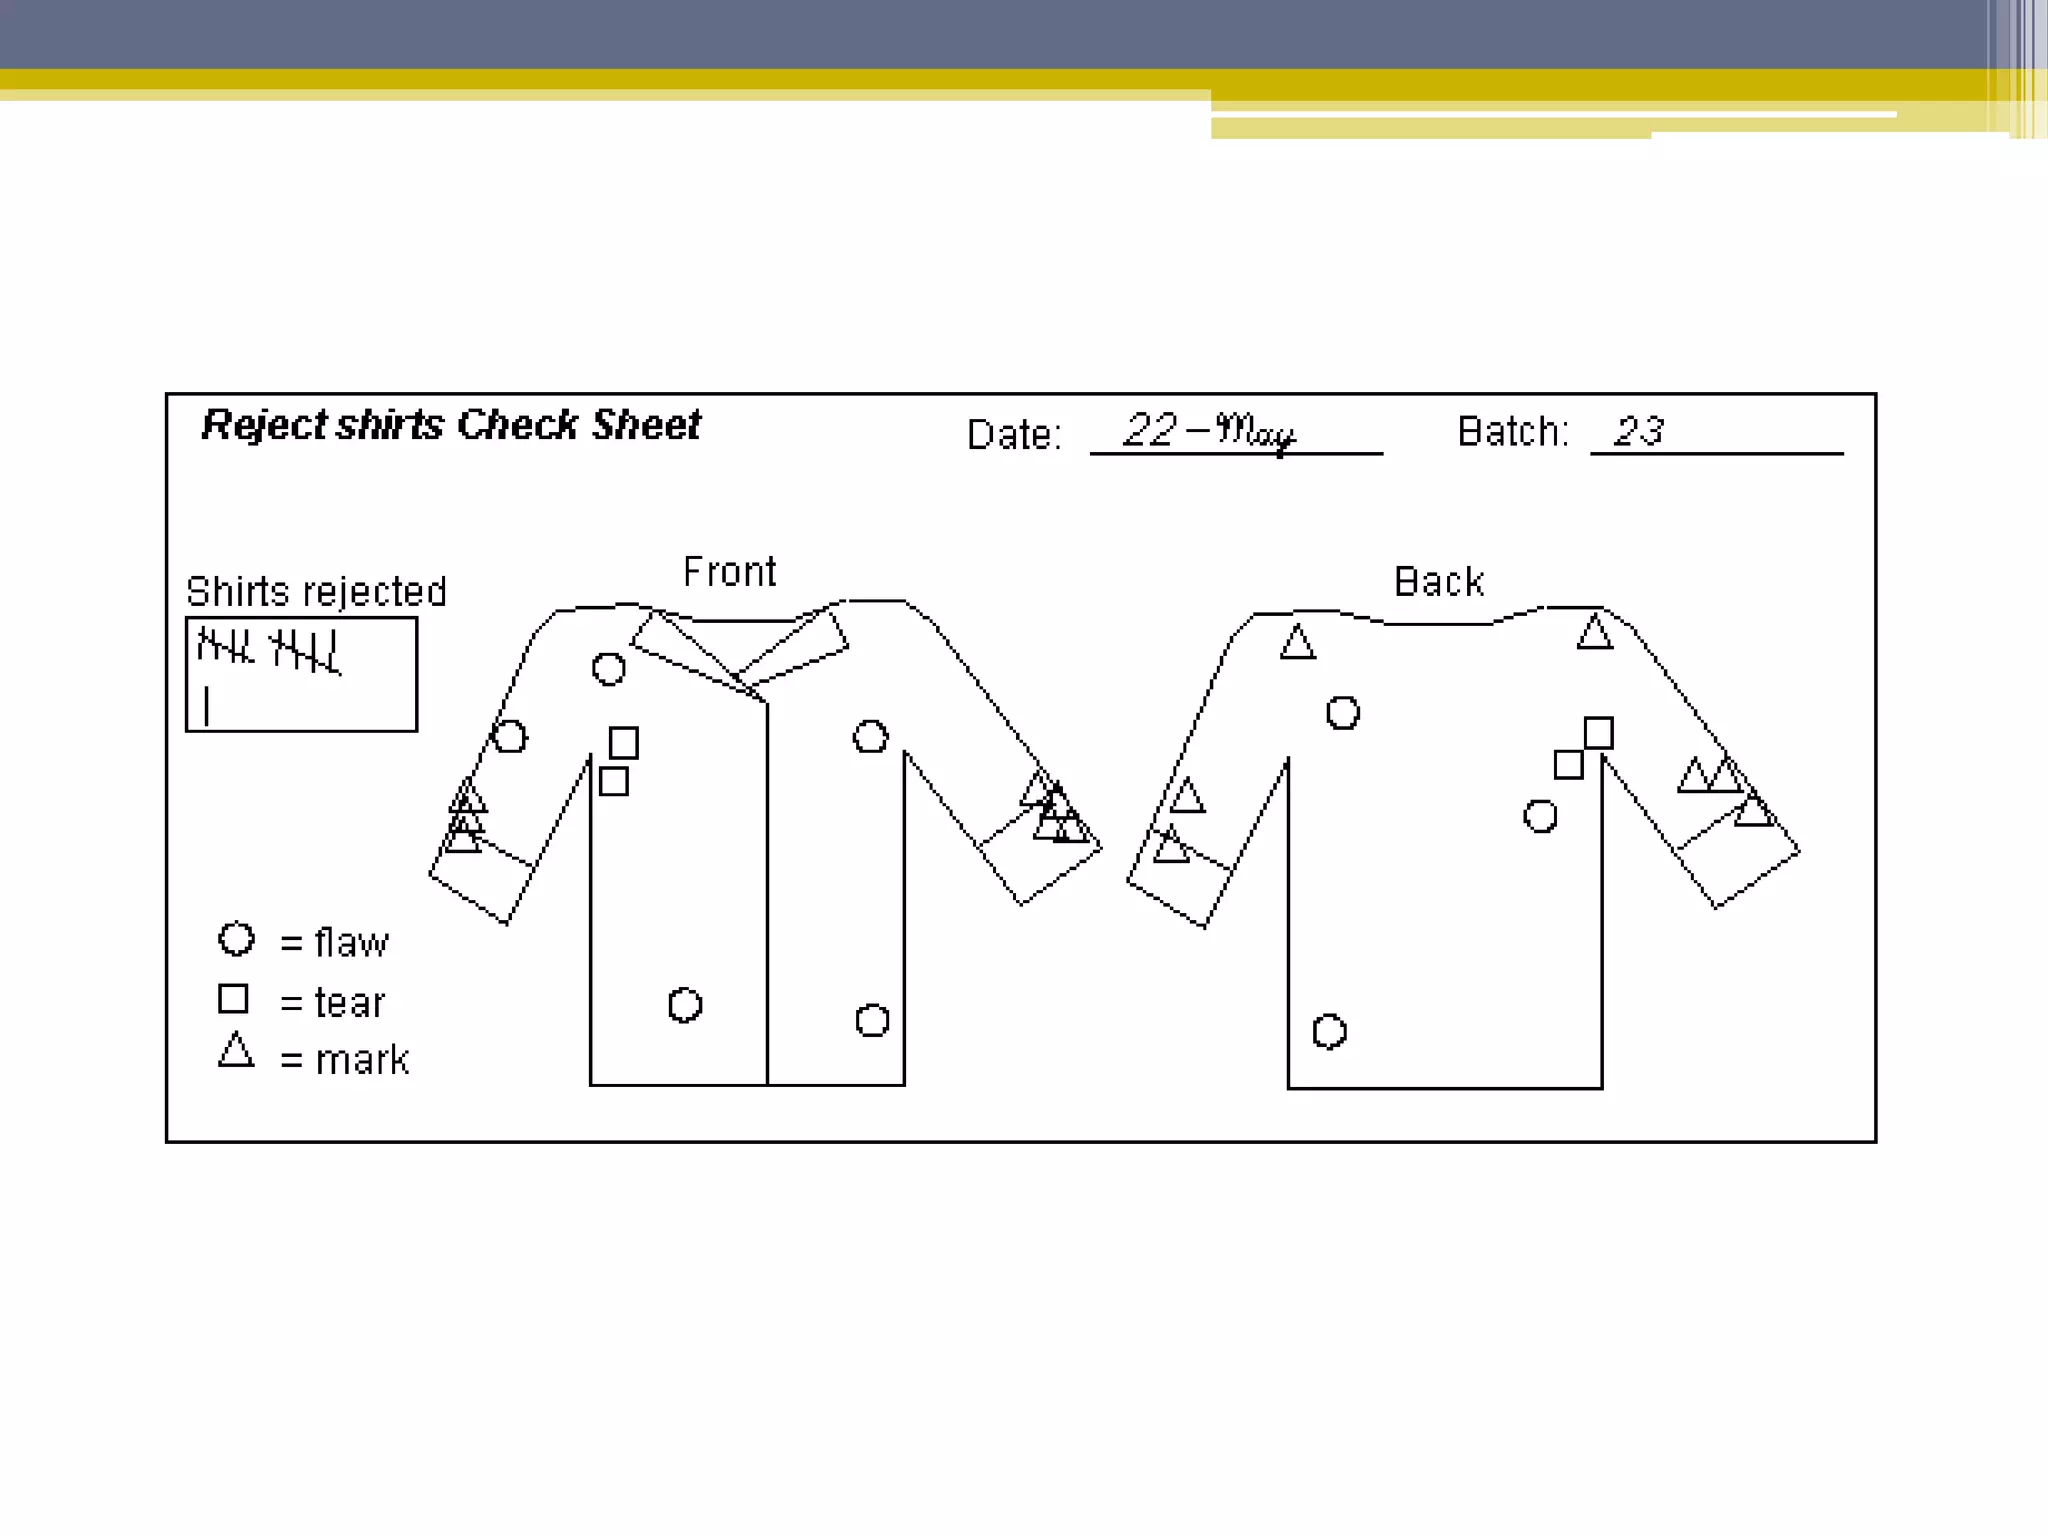
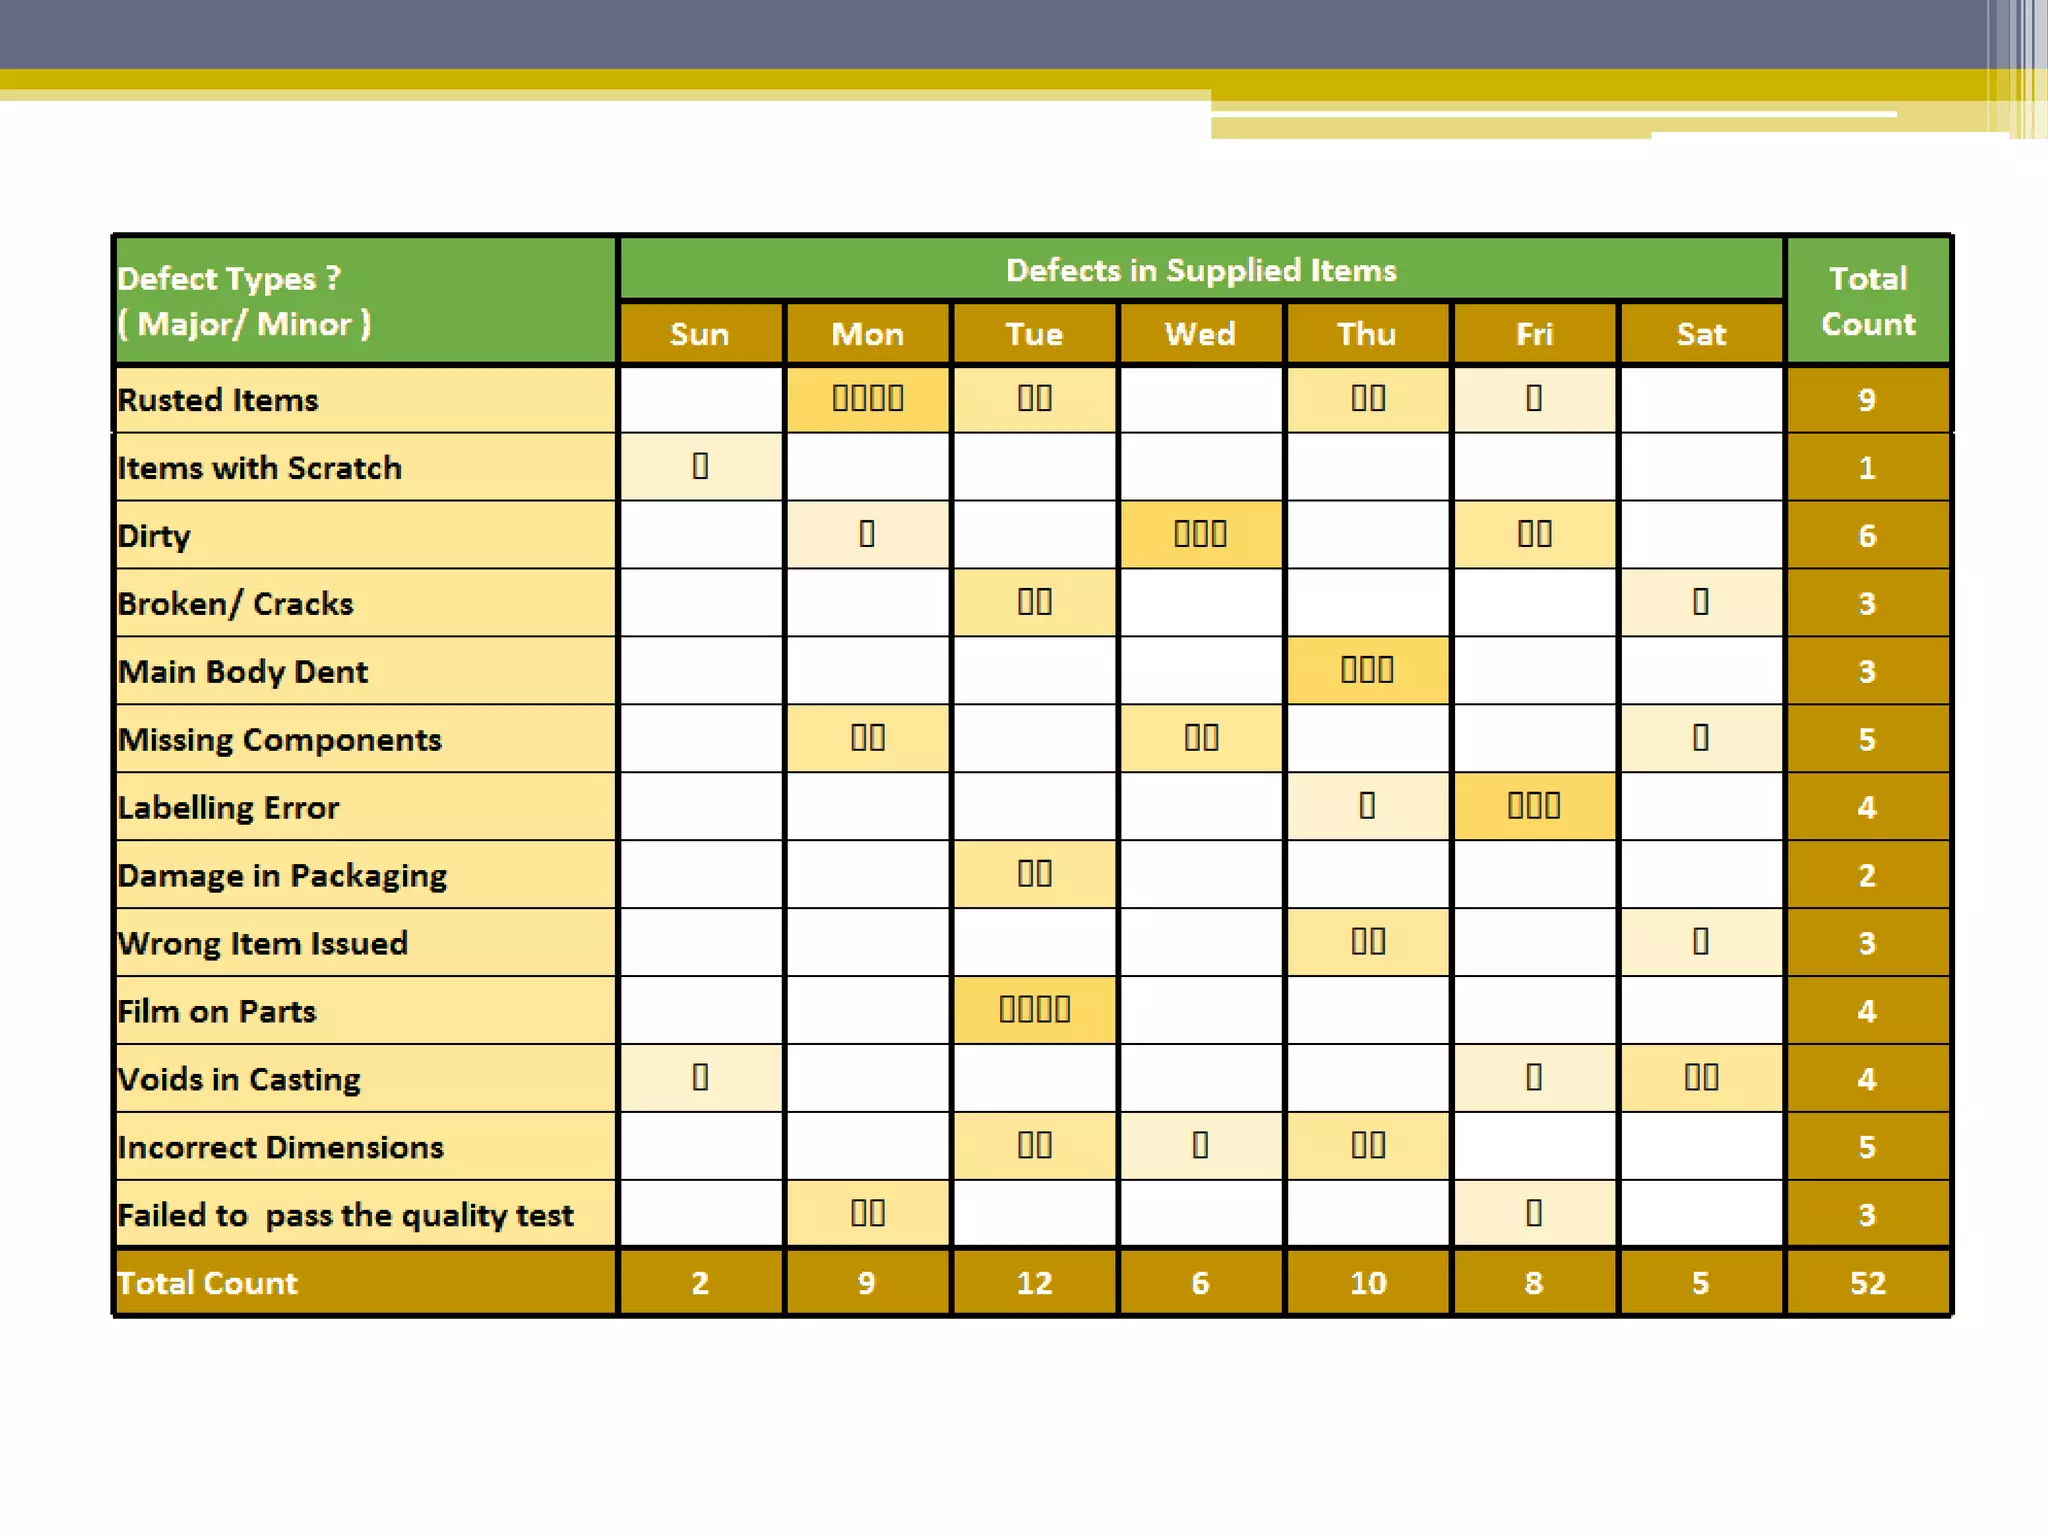
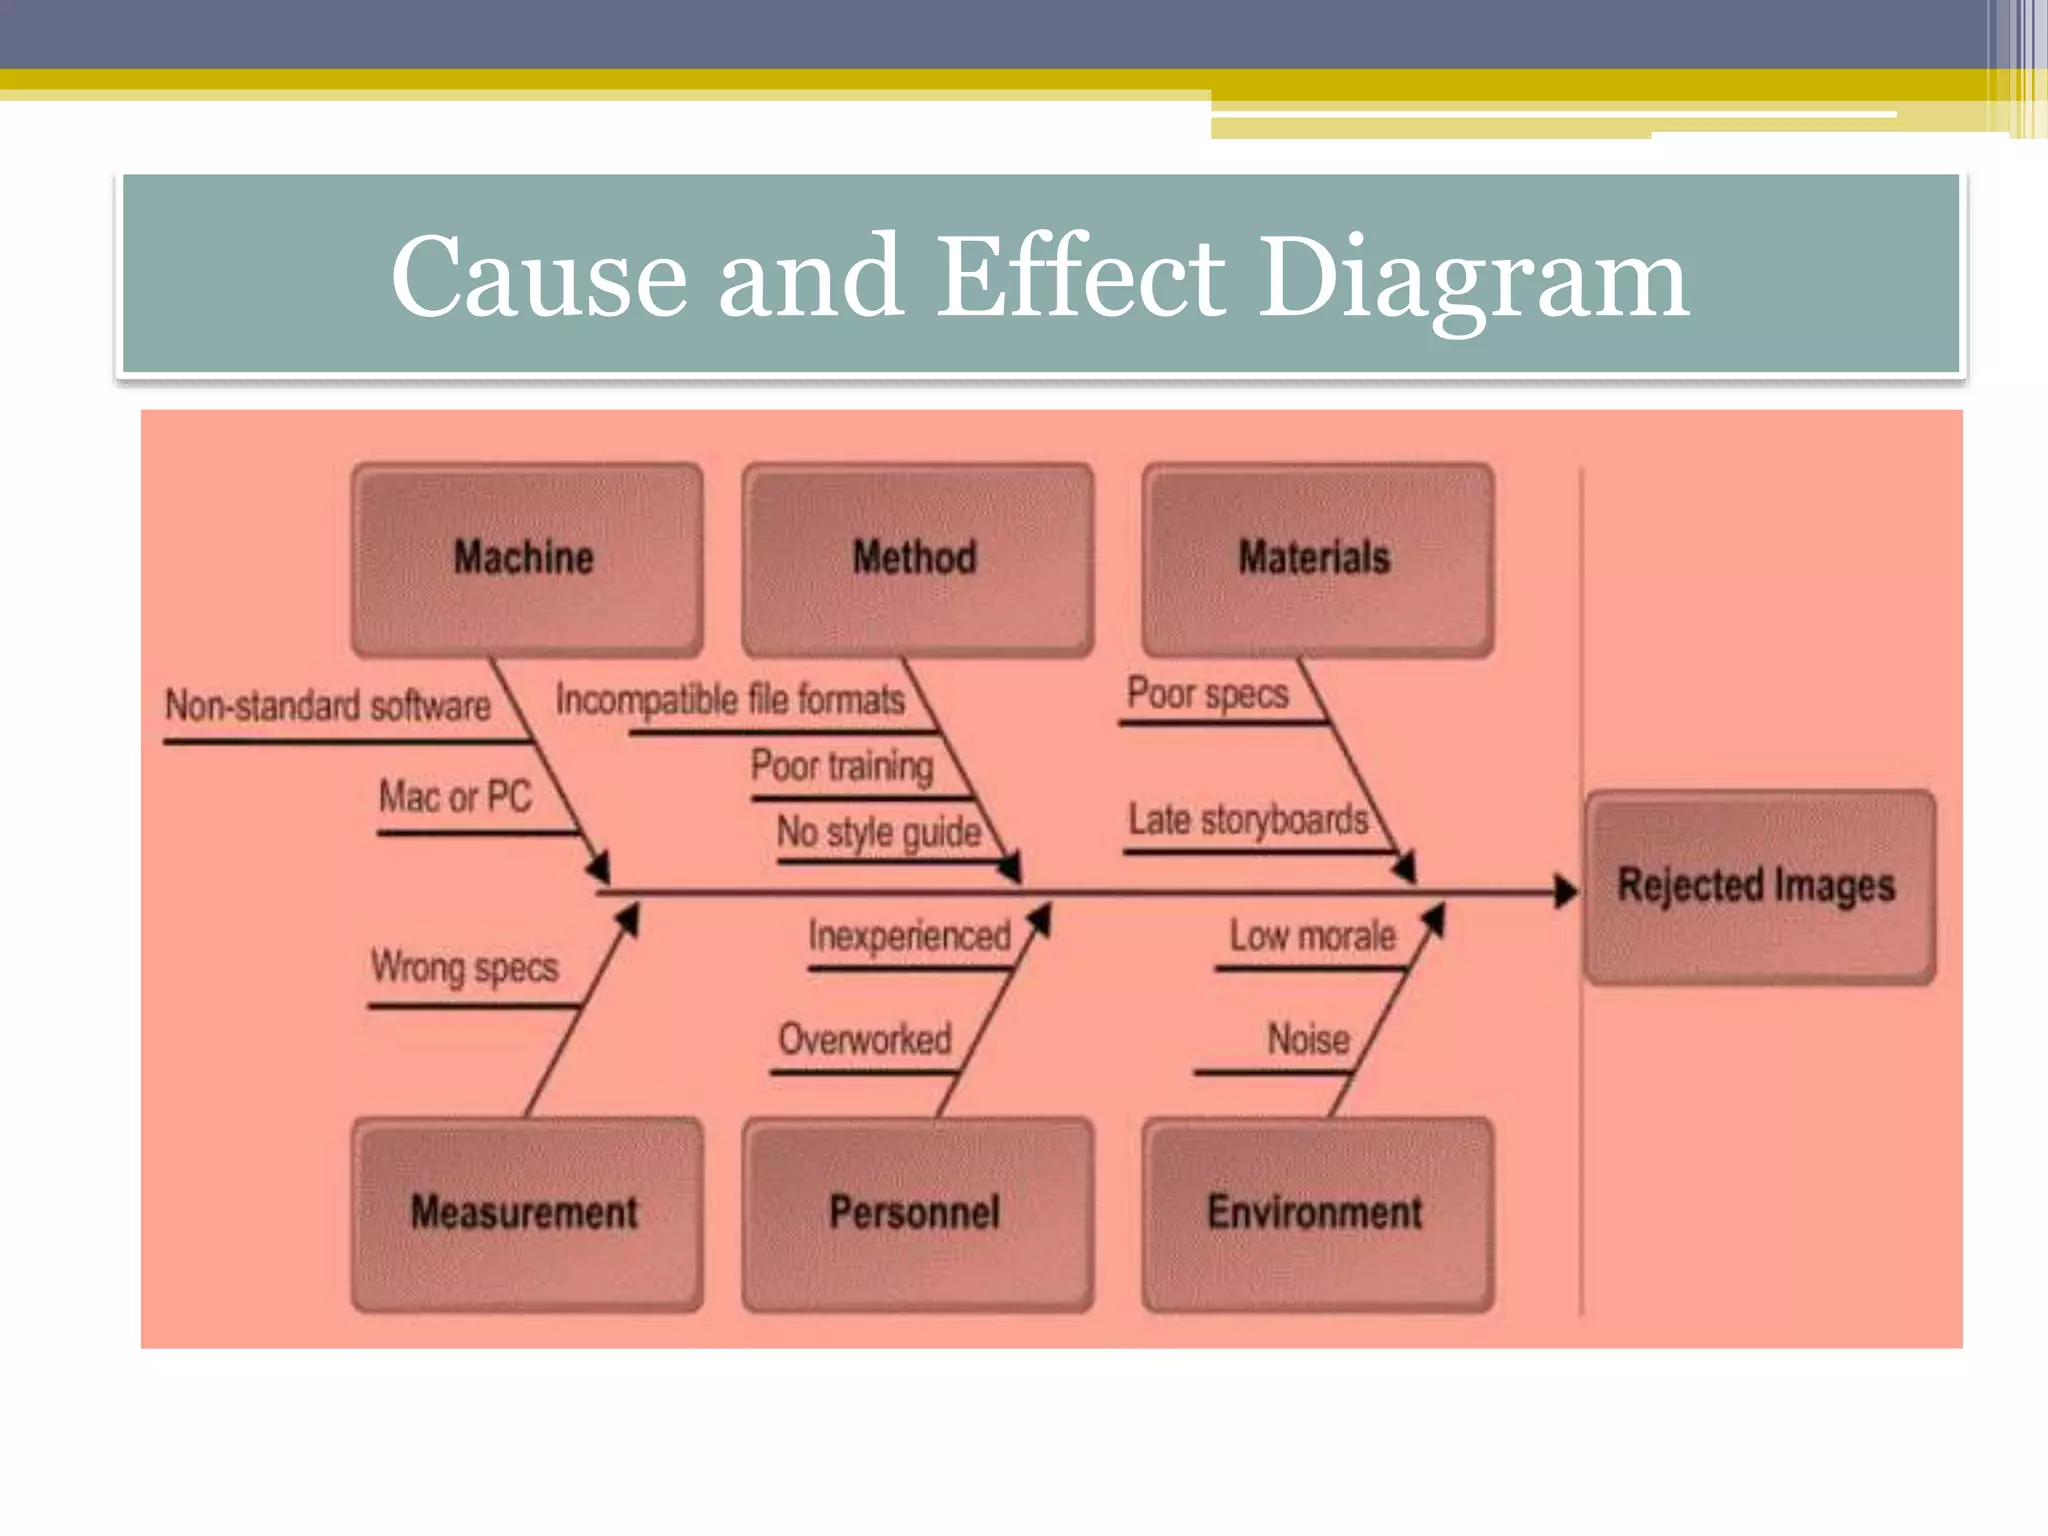
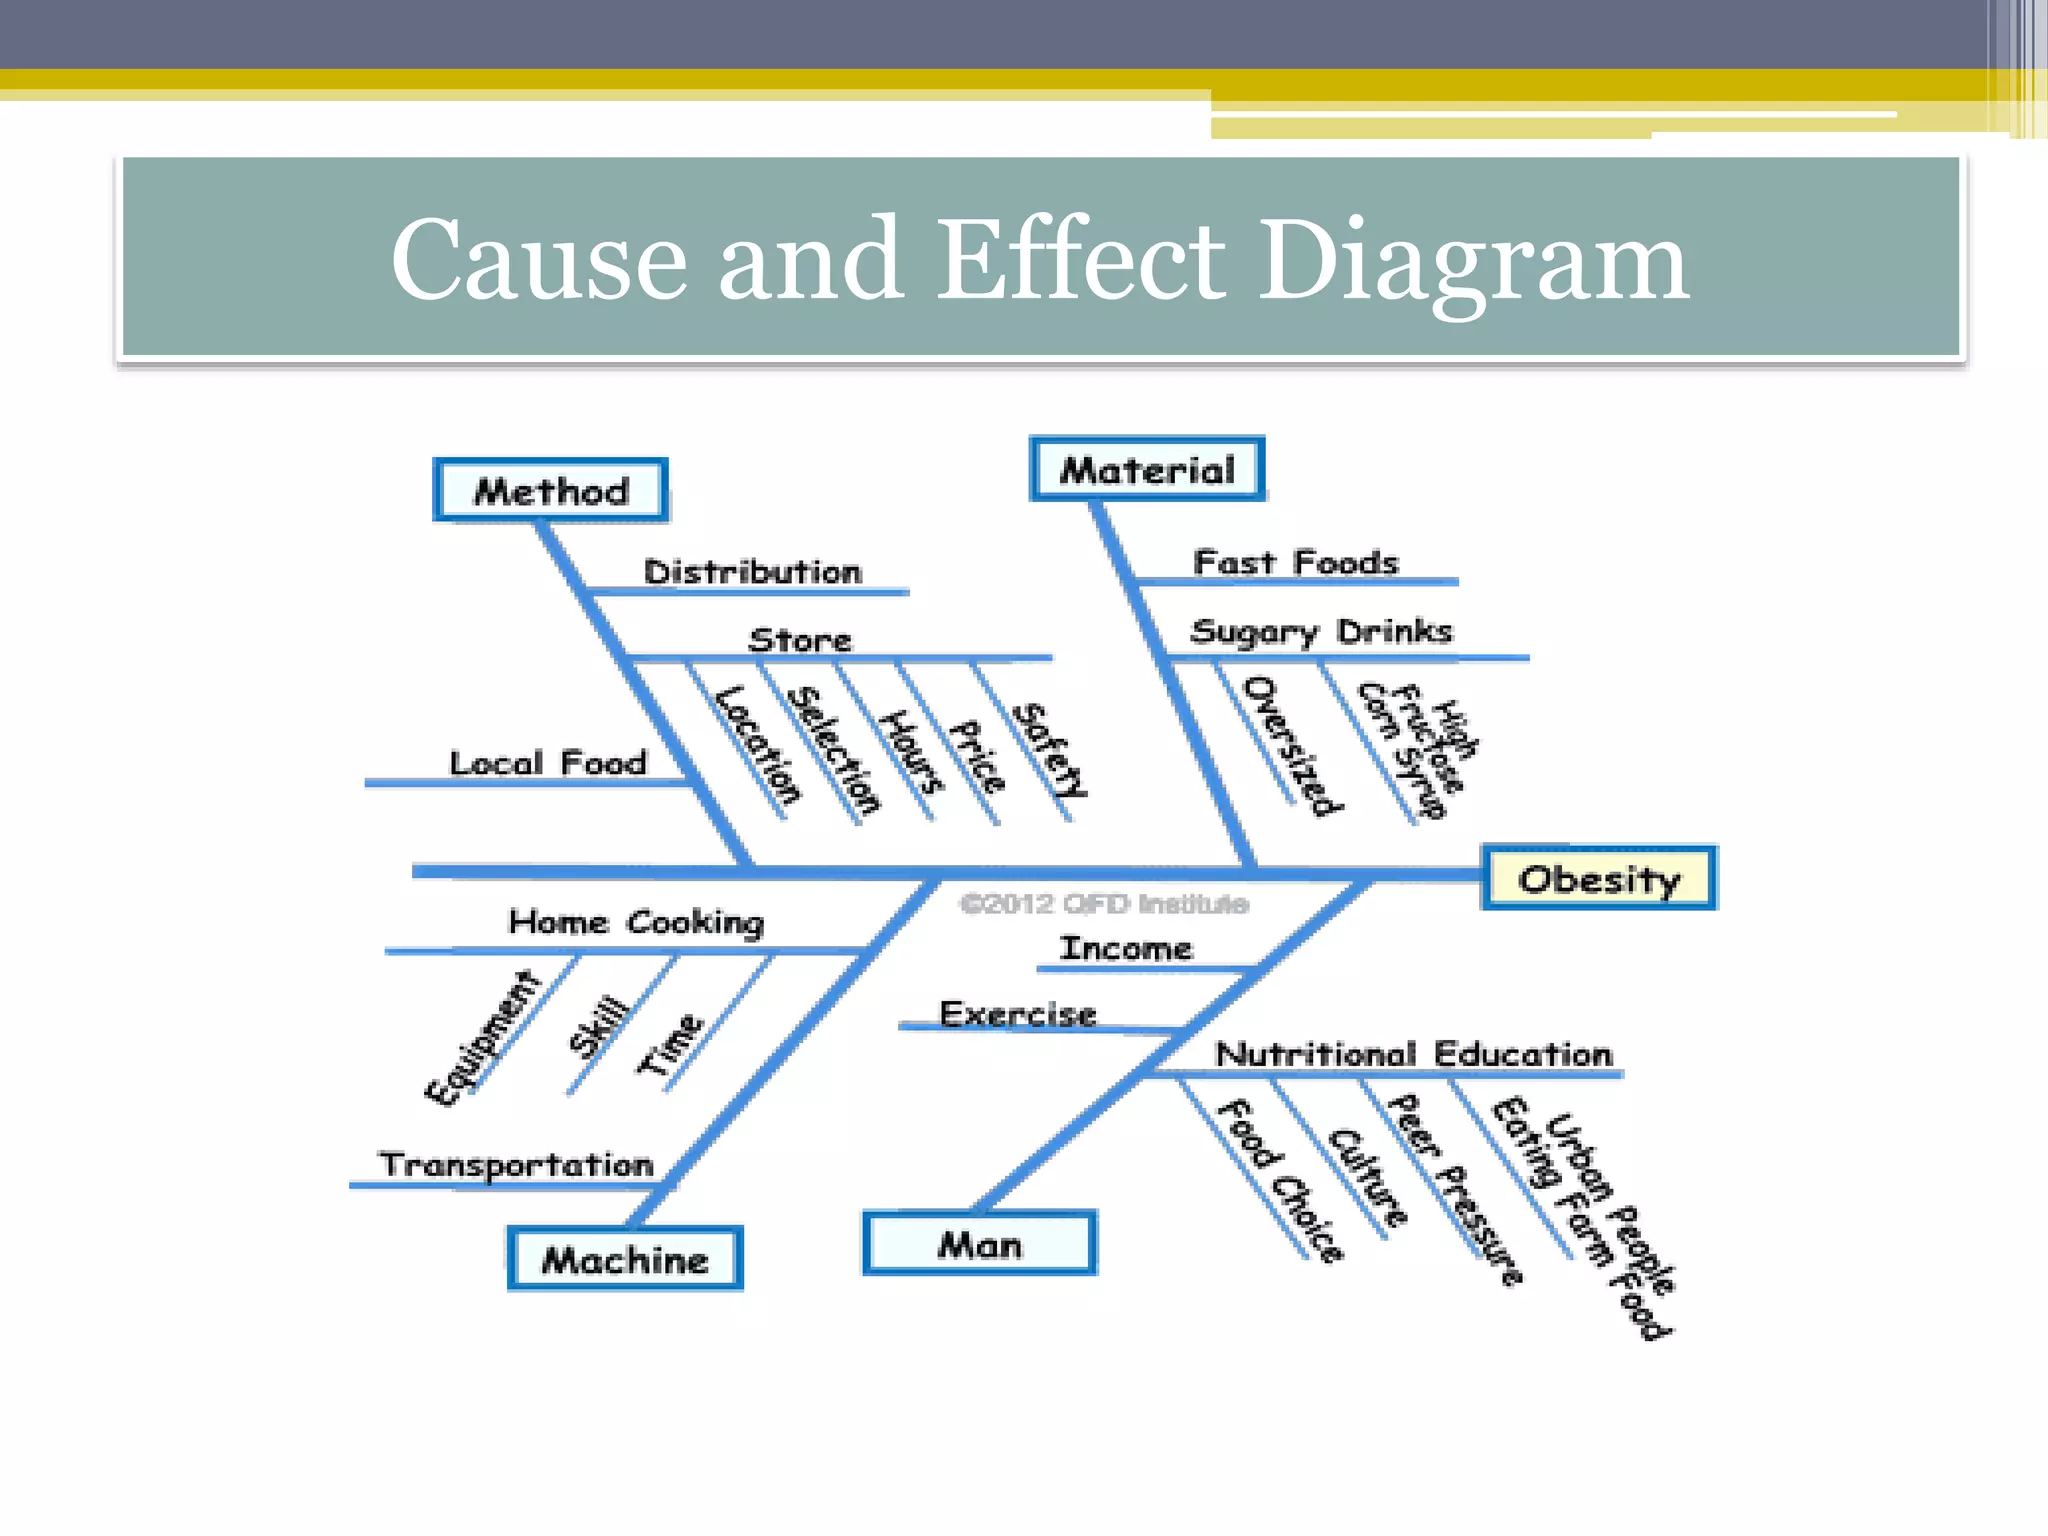
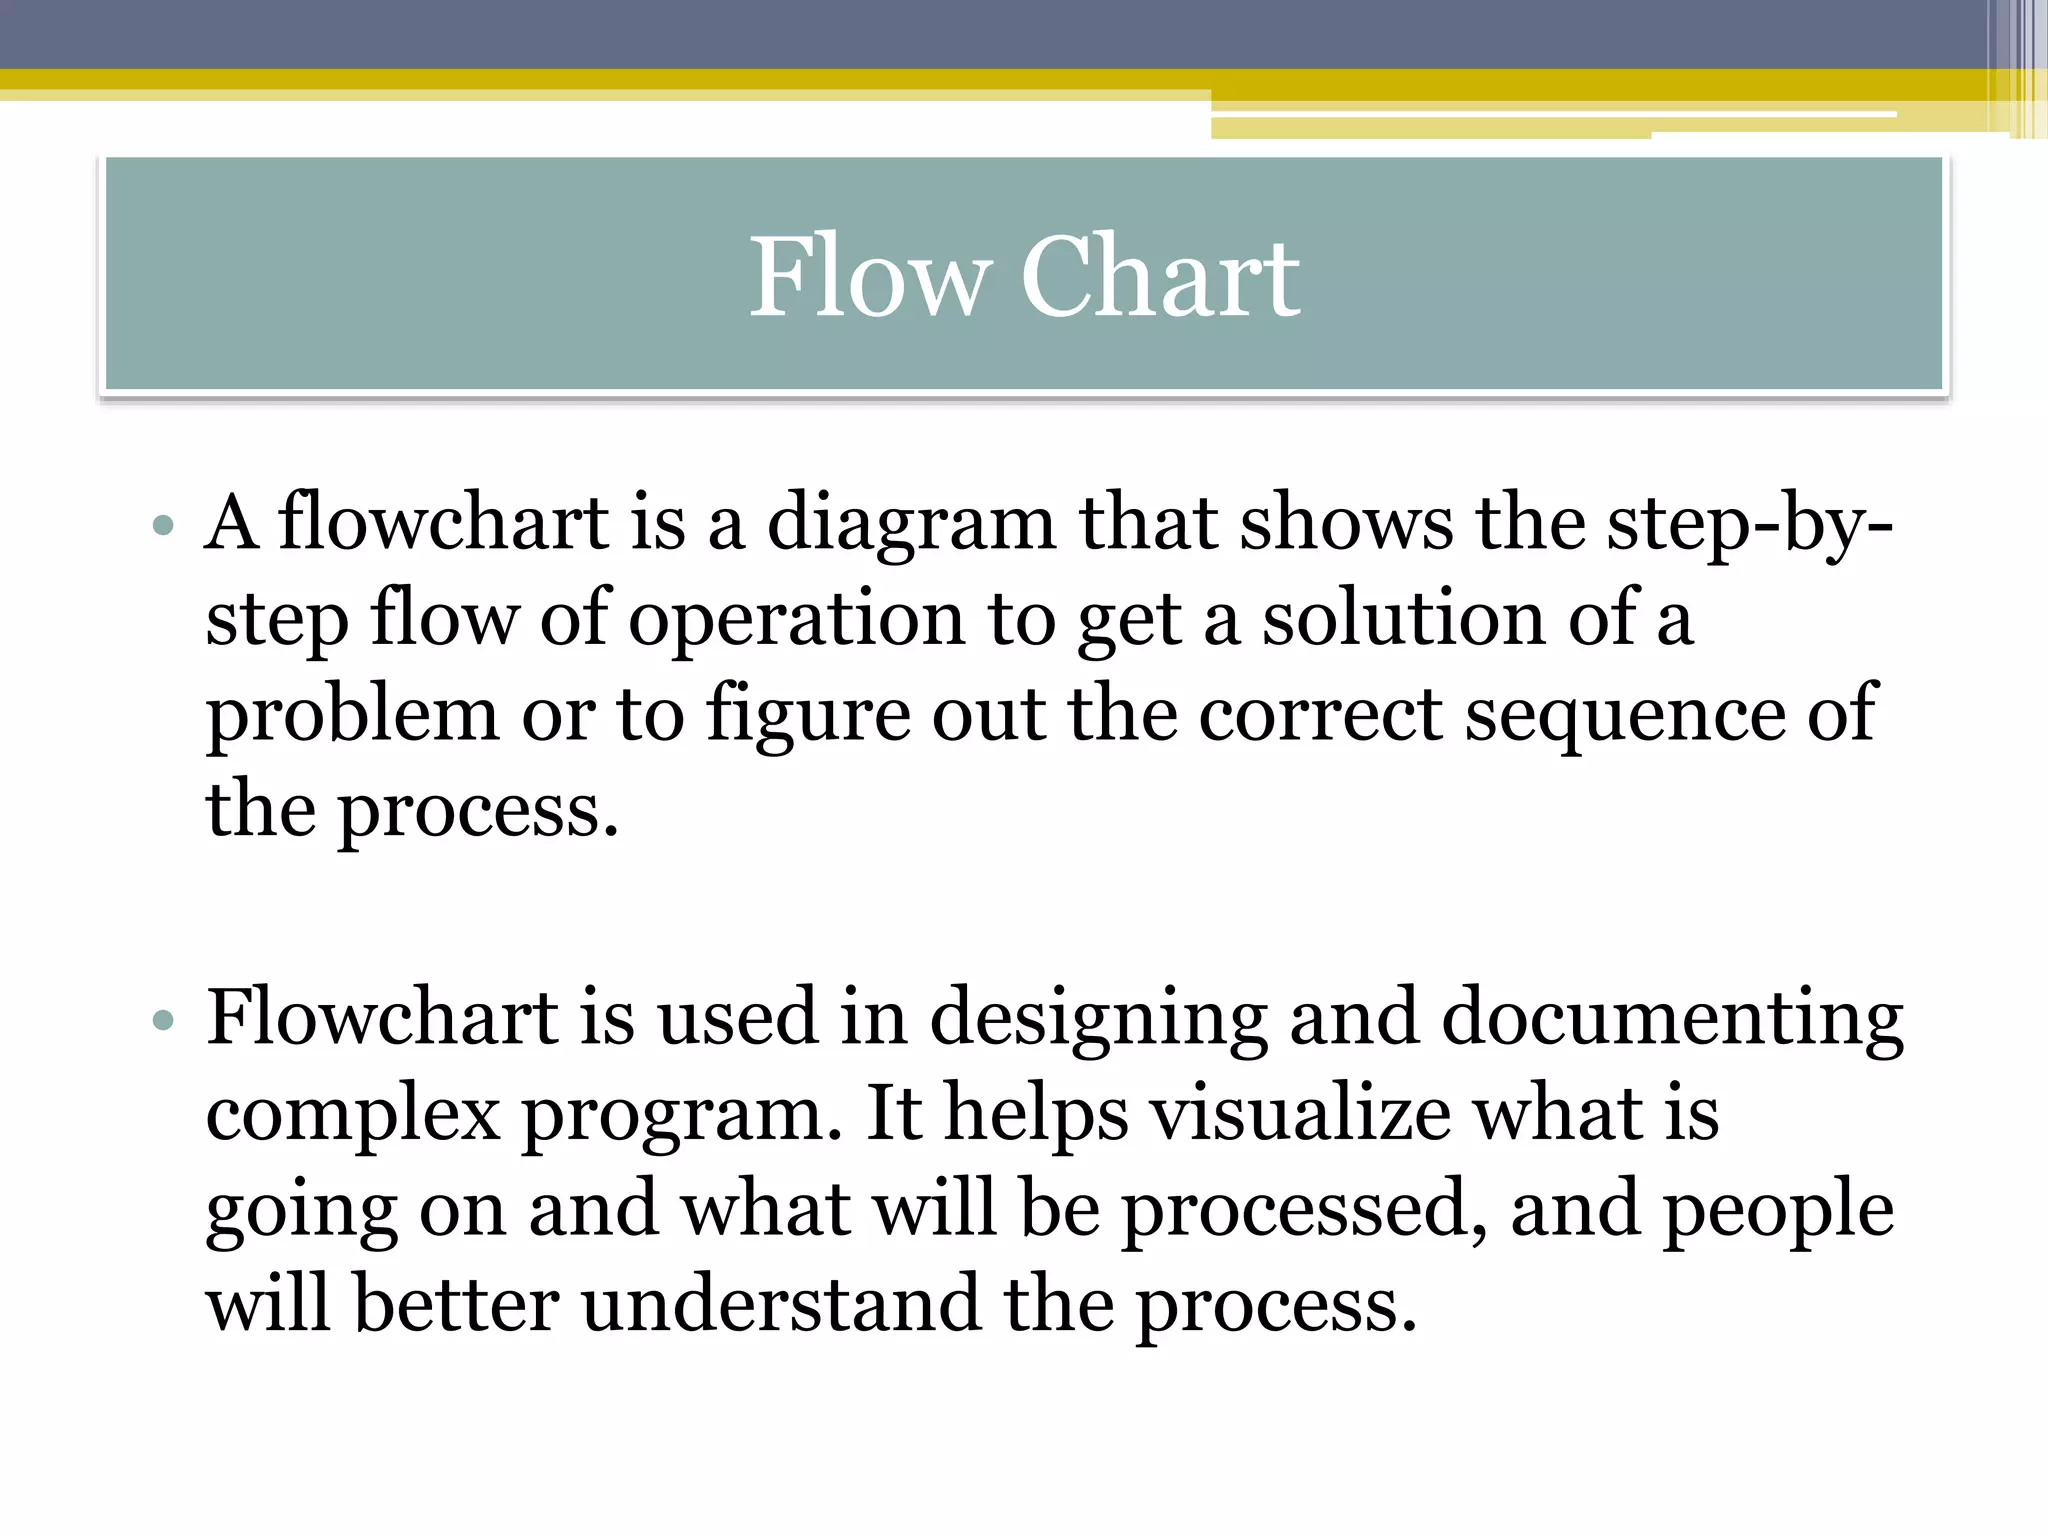
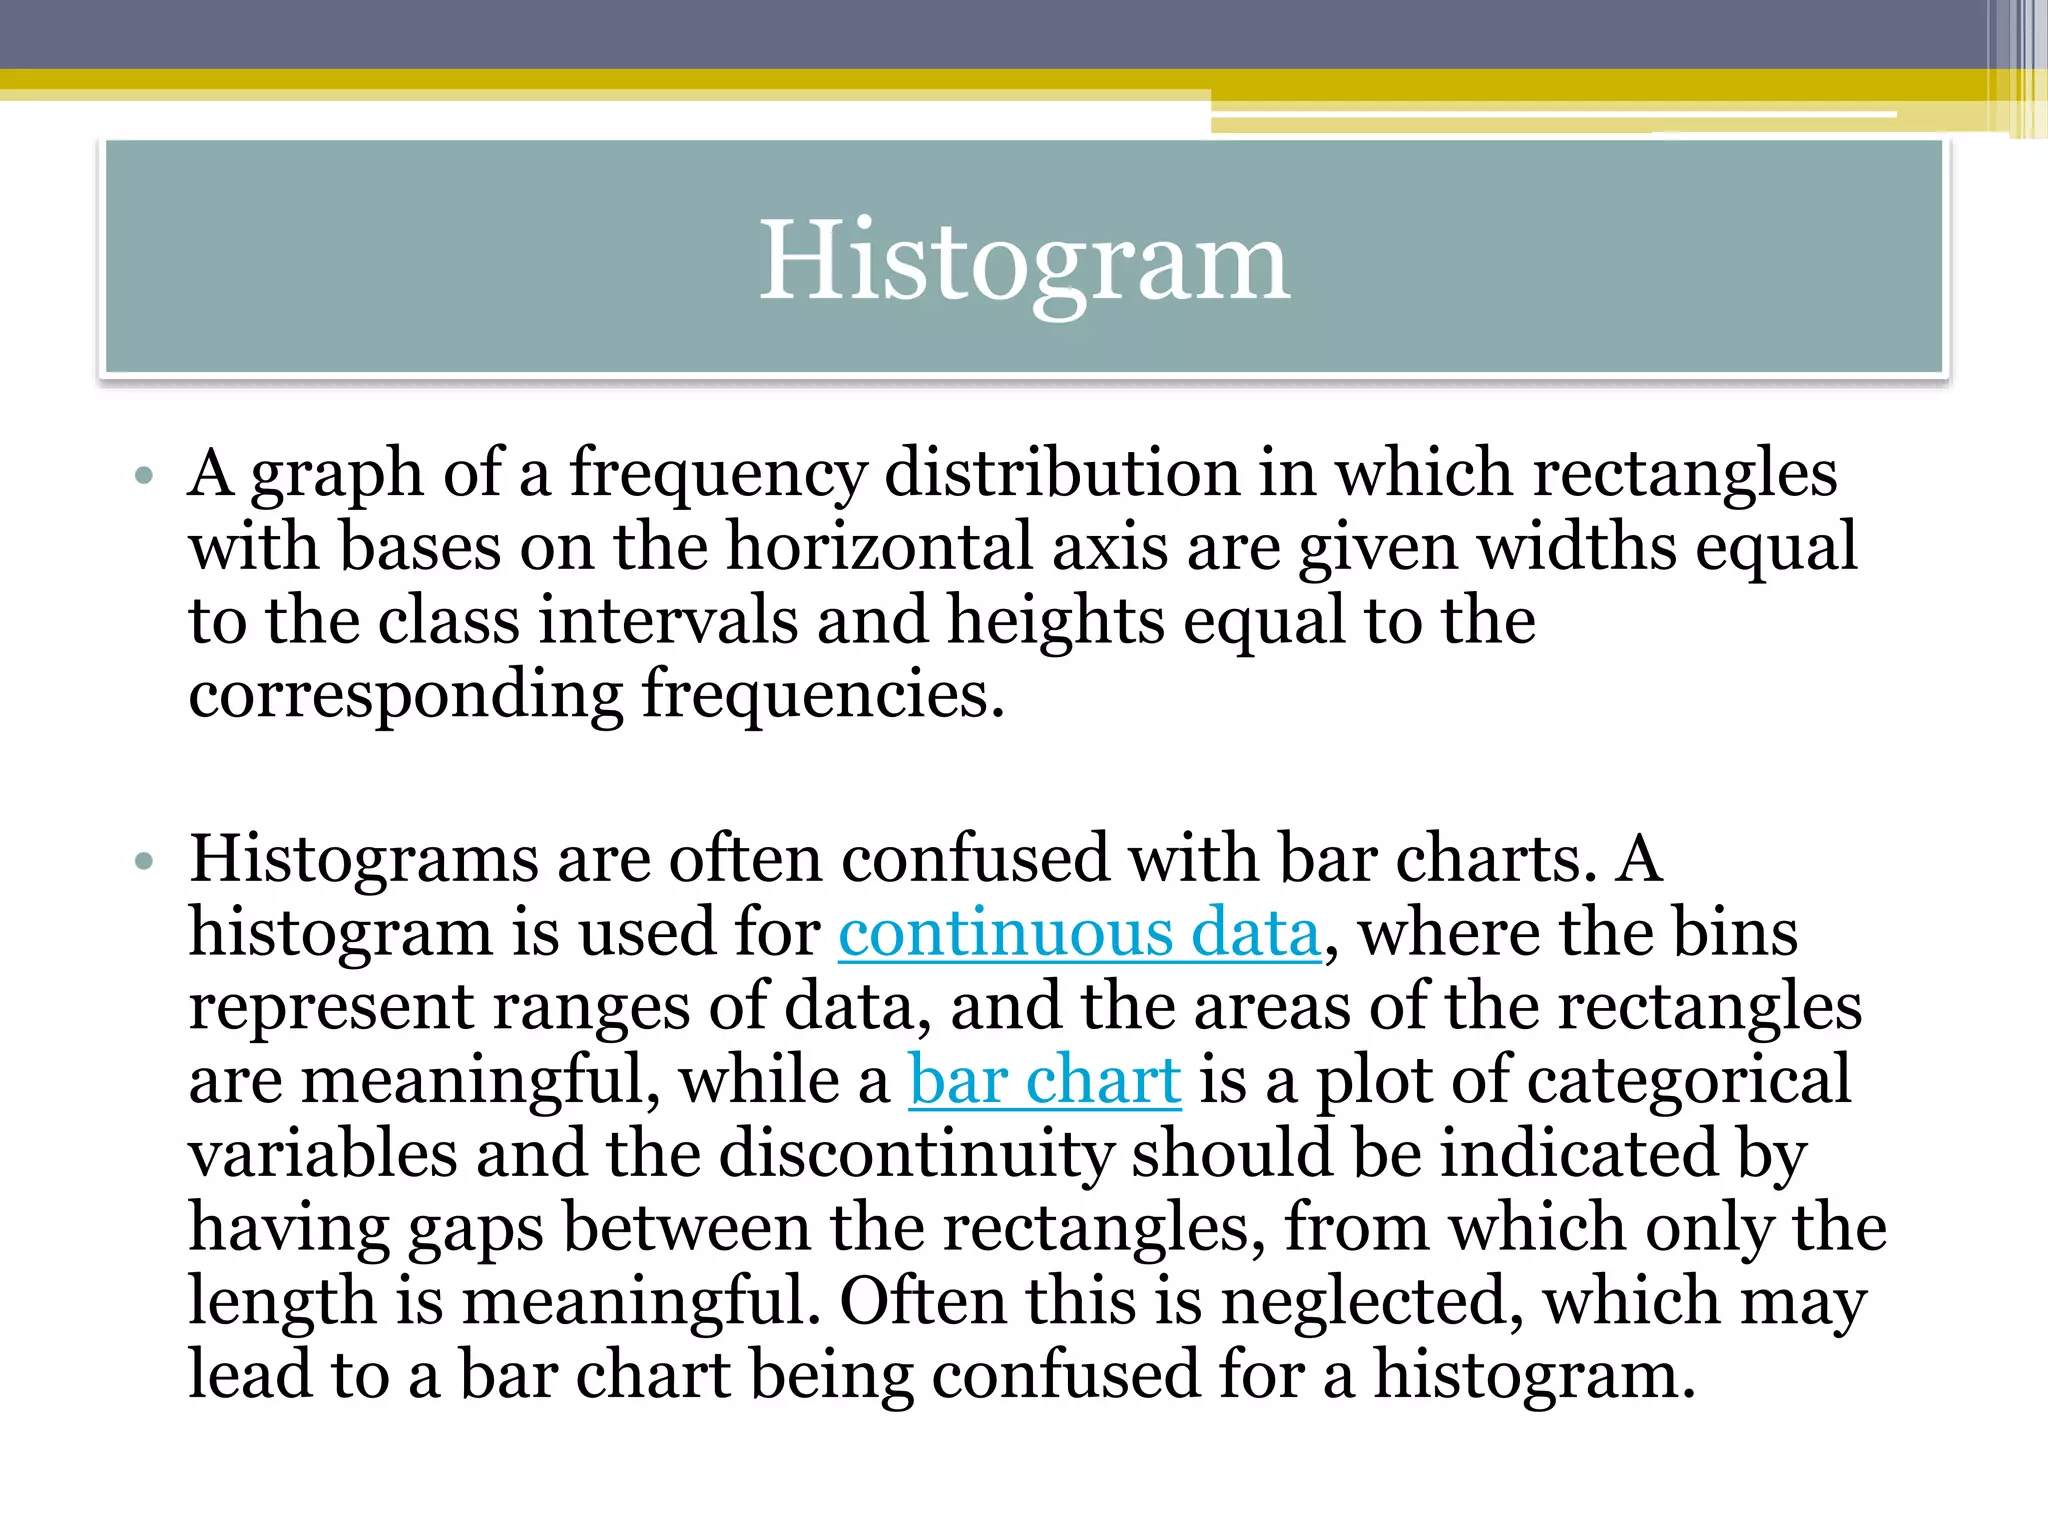
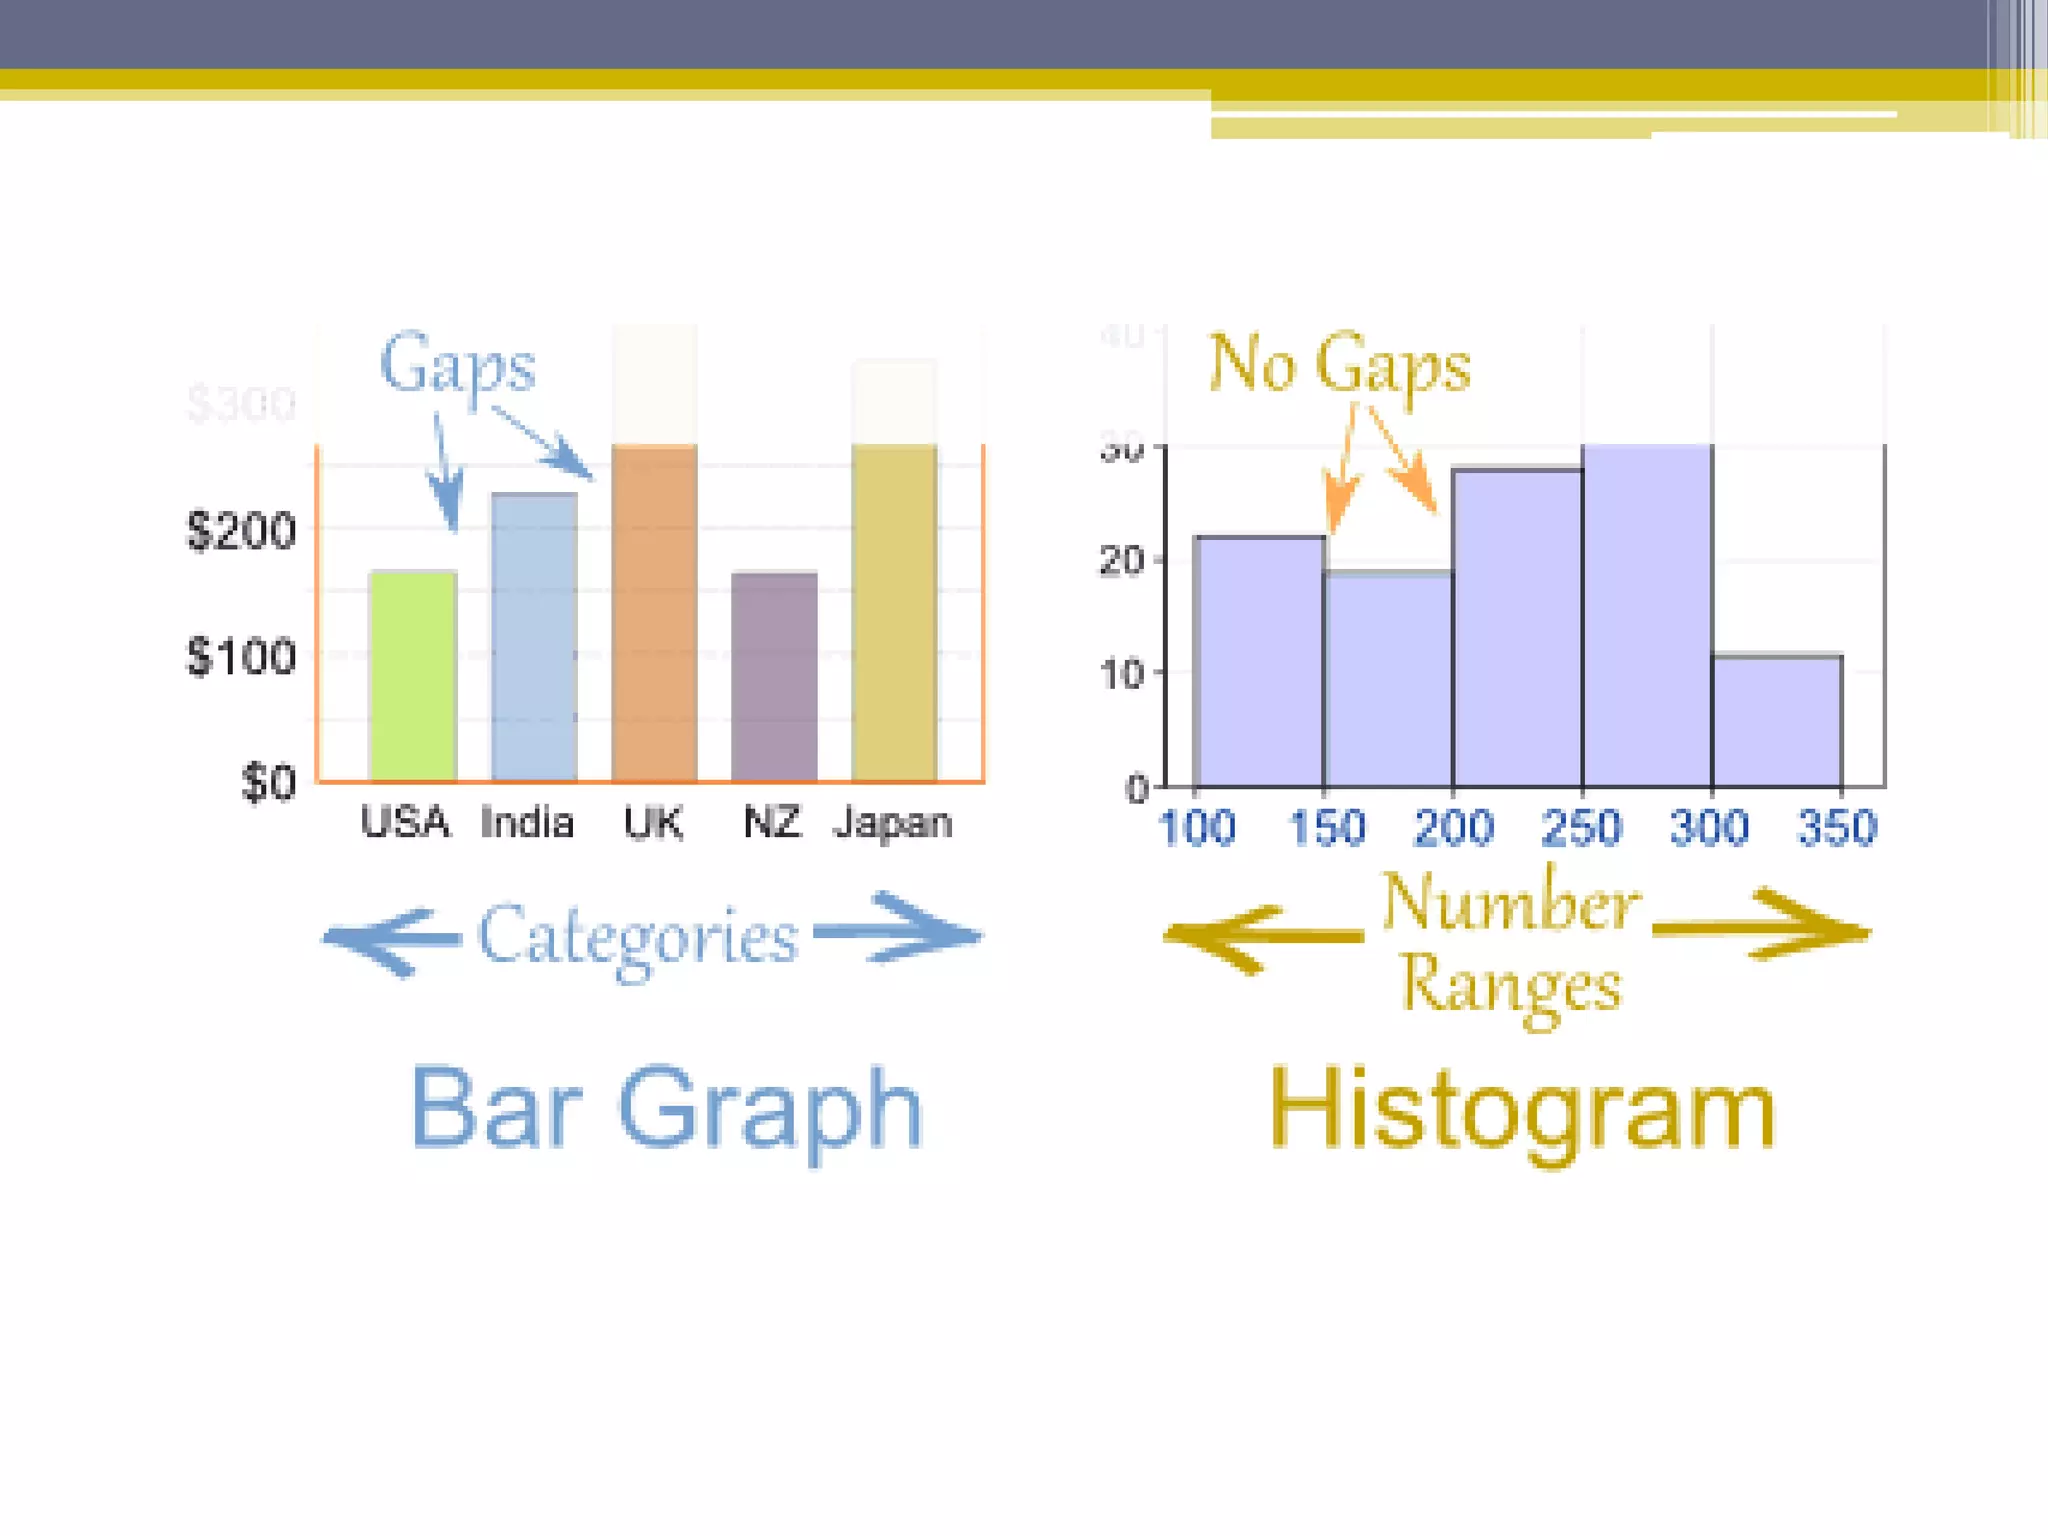
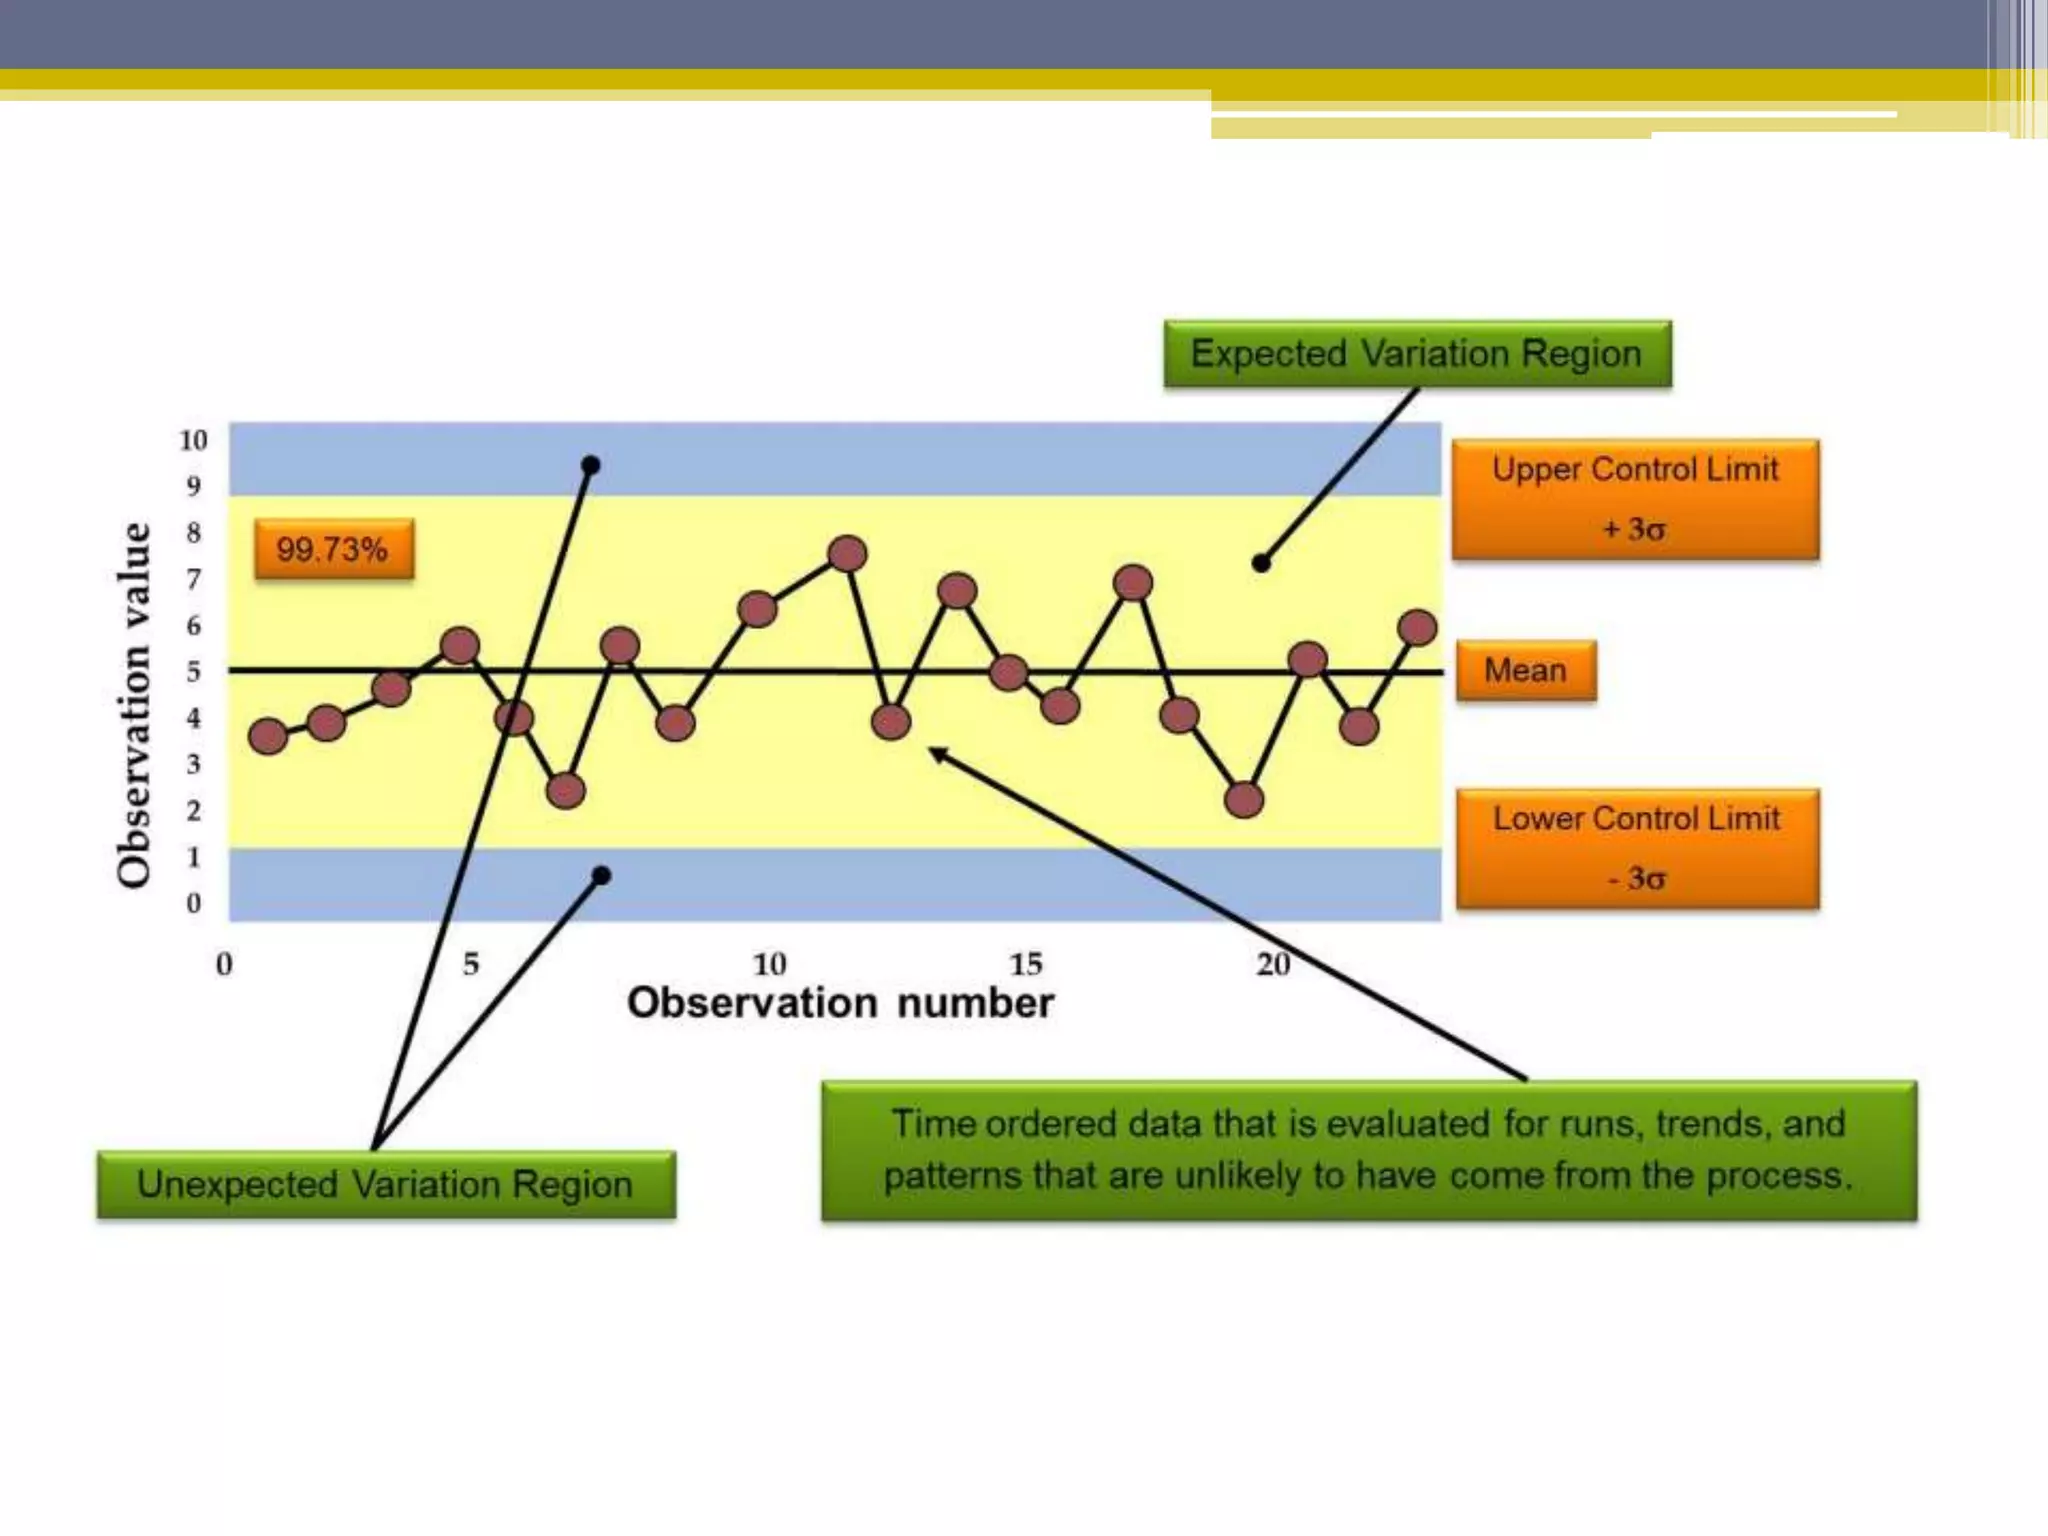
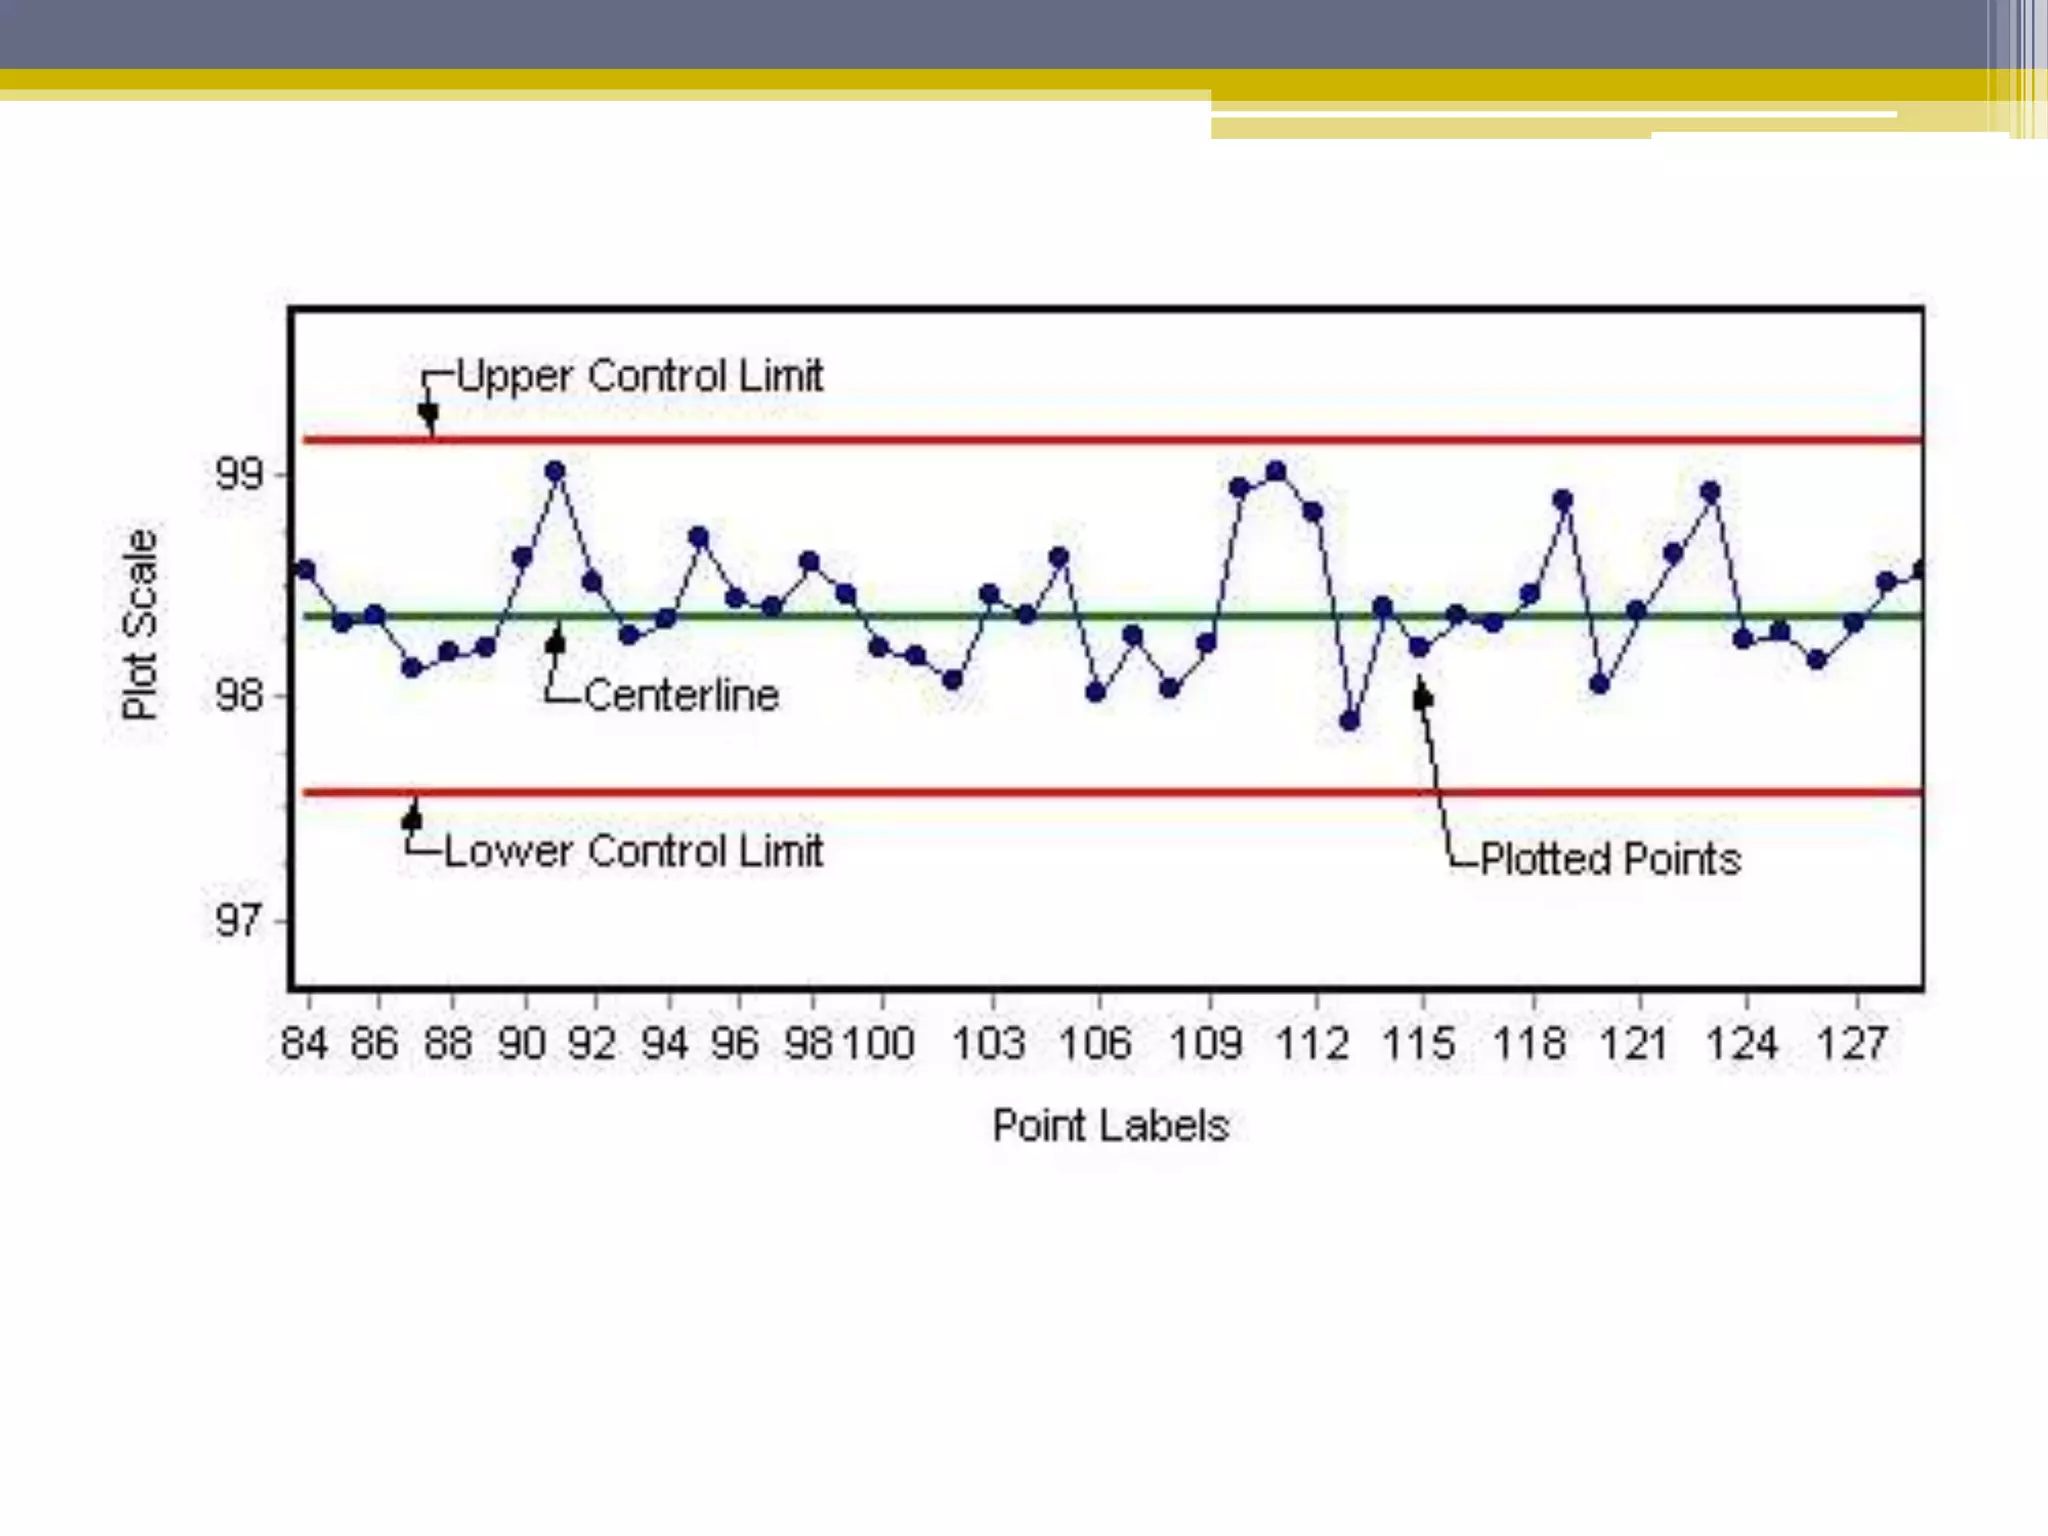
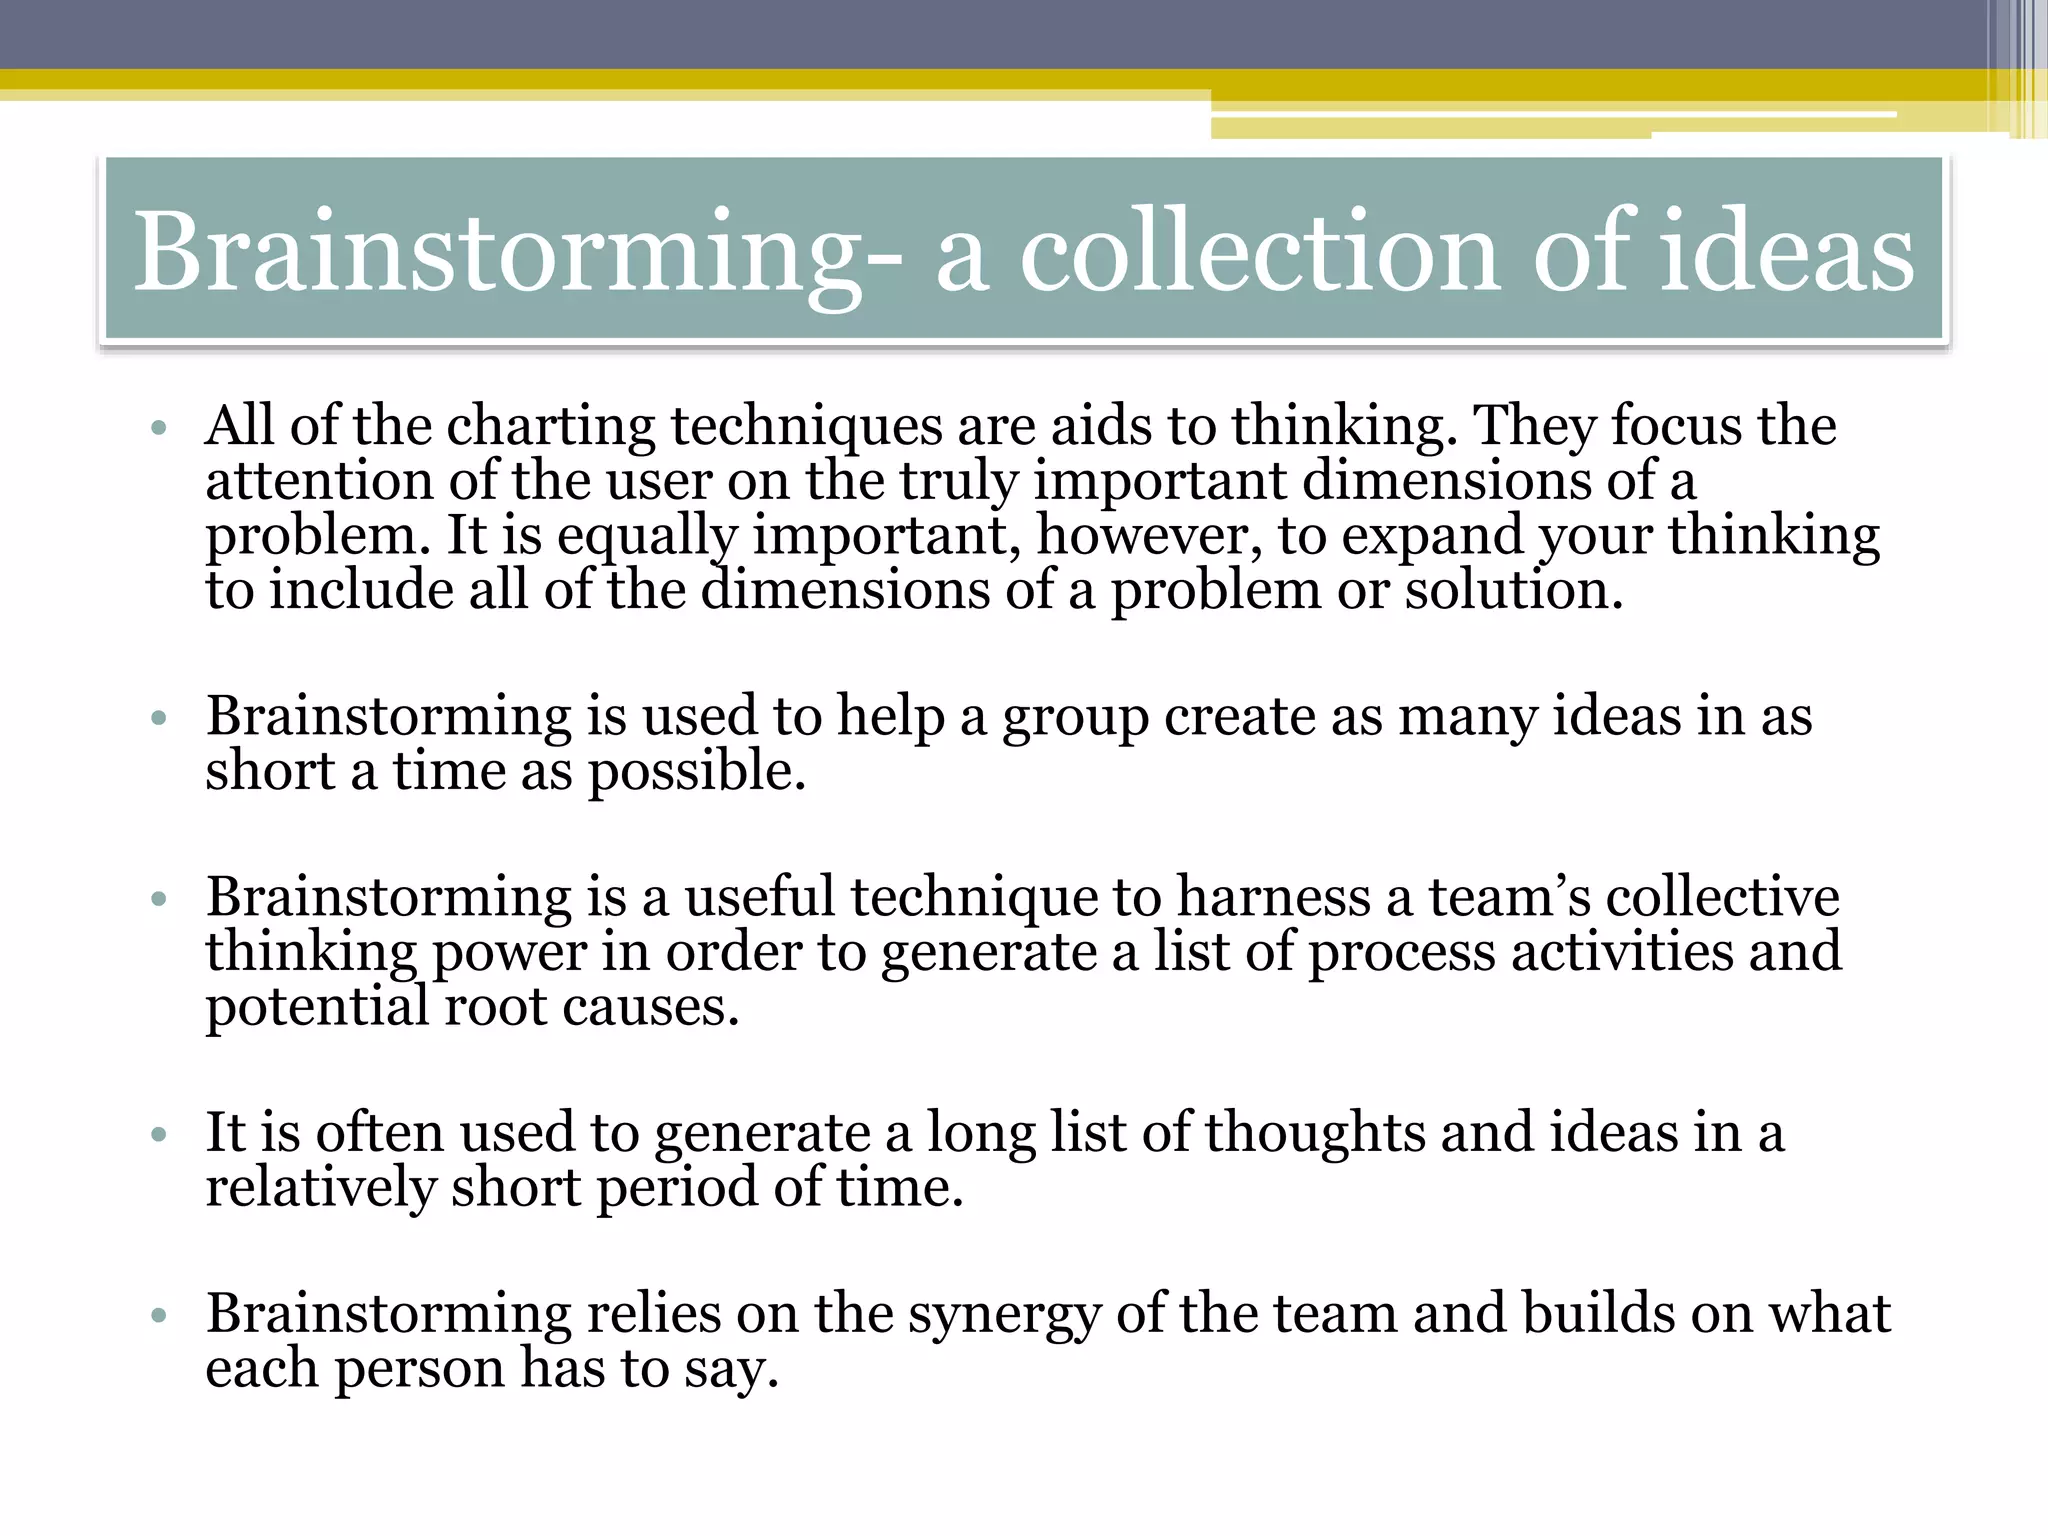
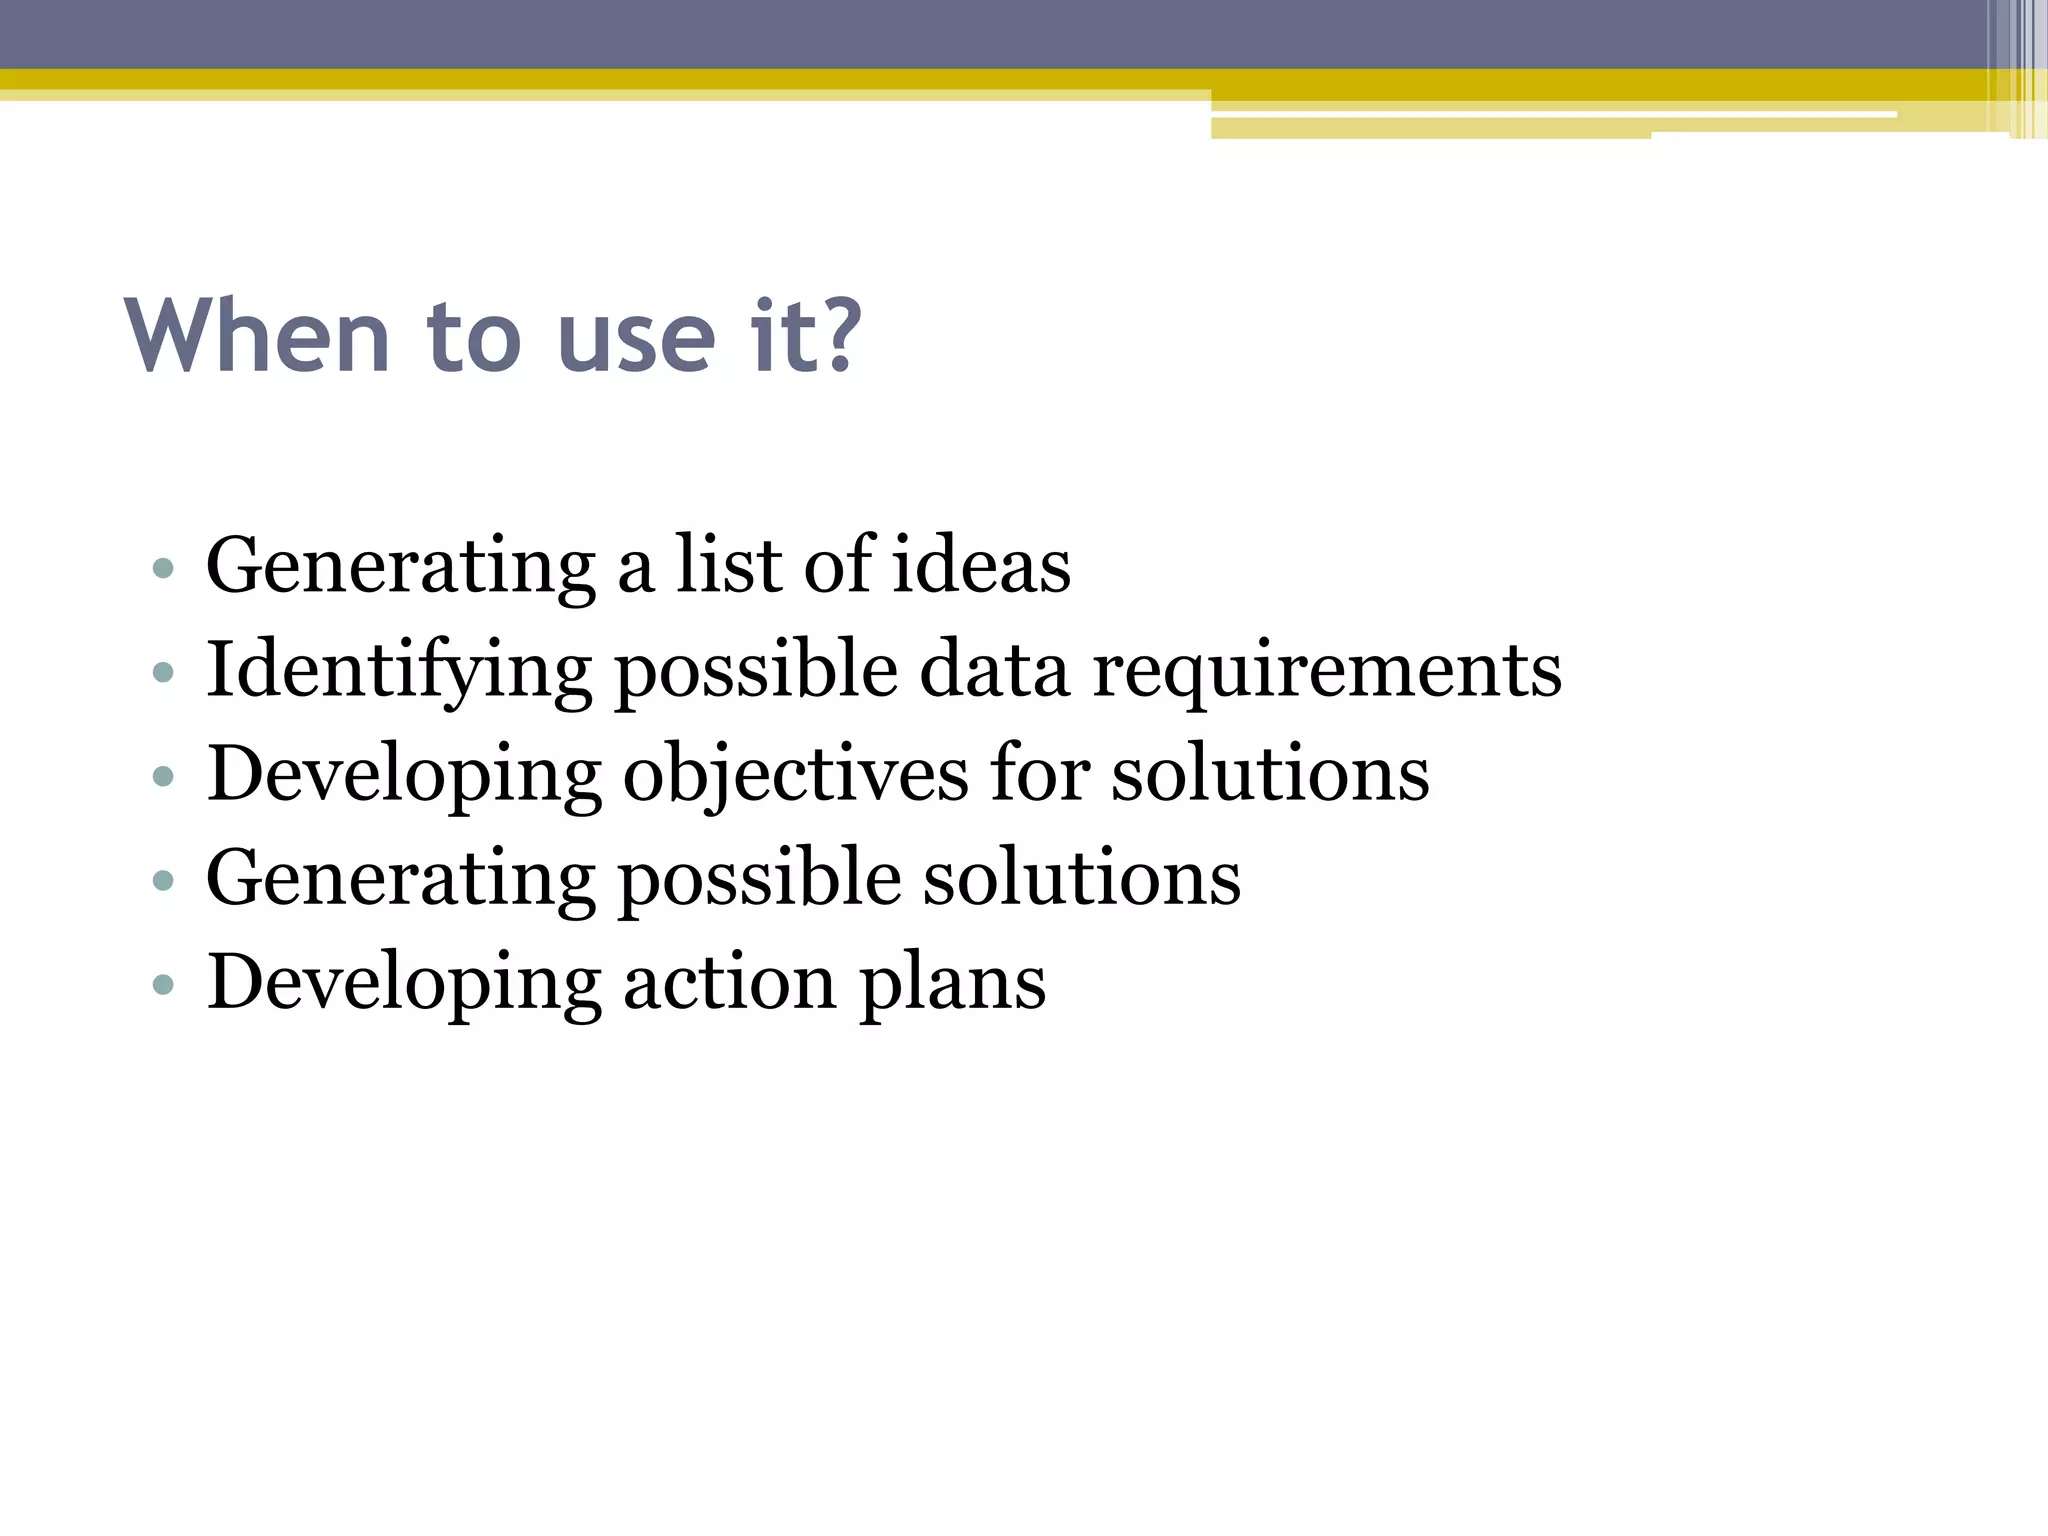
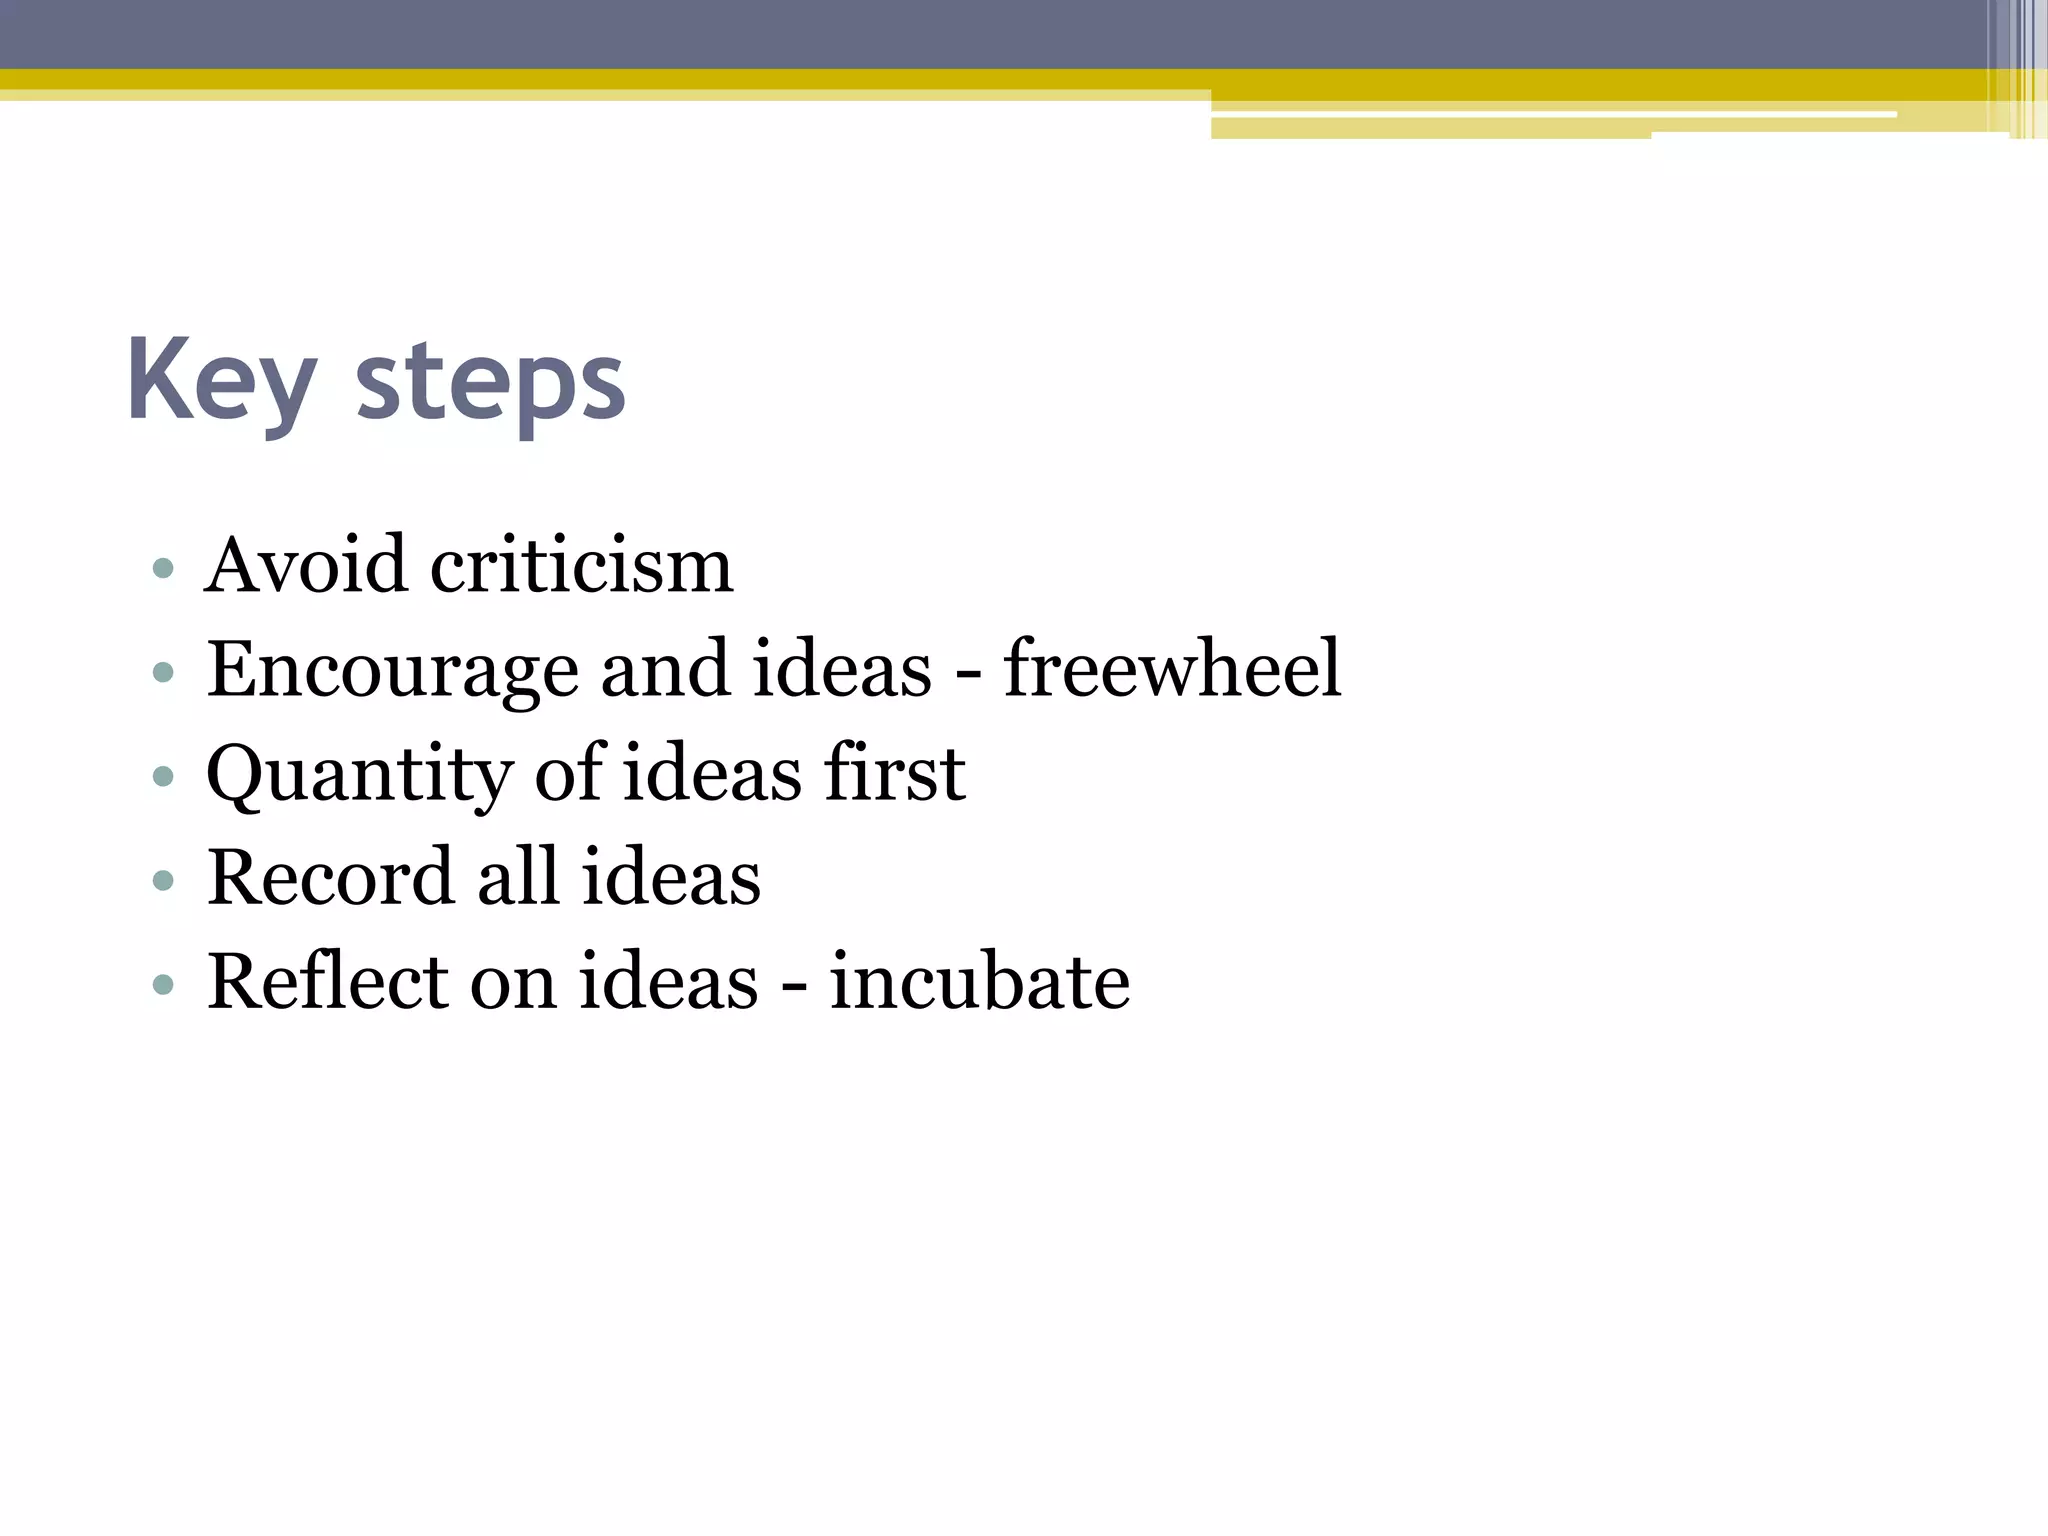
KEMBAR78
Lecture 5 Quality Performance Tools & Techniques | PPTX
Quality improvement tools
Tantish Kamaruddin
UTM, Skudai
What is quality improvement
techniques?
• Quality improvement is a characteristic of
quality management and it is the continuous
improvement of the output of products and
services using management systems.
• There are various quality management systems
available.
• Many Quality improvement tools today are used due
to a high demand for large volumes of high value
products and services using cheaper materials in
production during the second world war.
• Present systems such as Kaizen, Total quality
management (TQM), Quality circles and Six Sigma
have shown the power and effects a team-base
improvement system can have on production.
Process capability design is at the forefront when
using Six Sigma.
• A sustainable and continuous improvement
program in a company has to be part of the
companies’ cooperate culture, and staff should be
trained on the system adopted for this type of
management and improvement.
• No matter the techniques being used to improve the
quality of the production process in a company, they
all have the same objective; to save on costs while
satisfying the customer. Many techniques don’t just
seek to improve a system to a certain standard, some
techniques like 6 Sigma strive to continuously
improve a system or systems within an entire
company.
Improvement Techniques
1. Six Sigma
• Six Sigma is a business management tool developed by the
Motorola Company in the mid 80’s. It seeks to improve the
quality output and efficiency of companies by identifying the
probable defects in a given process and minimizing the
variability in output. This process uses a set of methods
including statistical methods creating an infrastructure of
people within the organization. Each Six Sigma project
process in an organization follows a laid down sequence with
the aim of reducing cost and maximizing profit.
• A high-performance, data-driven approach to analyzing the
root causes of business problems and solving them. Sixsigma
techniques were championed by Motorola.
2. Total Quality Management (TQM)
• TQM uses teams made up of workers from all
sectors in the company to solve issues. The
teams undergo training in the use of basic
statistical tools that are used in the collection
and analysis of data.
Improvement Techniques
3. ISO 9000
• ISO 9000 is a standard of quality systems. The
ISO 9000 family of standards ensure that
organizations meet the needs of customers and
other stakeholders. This process deals with the
basics of quality management, emphasizing on
eight principles on which the family of standards
is based.
Improvement Techniques
4. Quality Control Circle (QCC)
• Quality control circle is a small group of workers
who come together to discuss ways of
identifying, analyzing, solving and selecting
work related issues.
Improvement Techniques
5. Kaizen
• Kaizen (Japanese for improvement) is a daily
process geared towards rapid improvement.
Kaizen focuses on total reduction of waste while
increasing the output of products, and services
and achieving sustained improvement in
processes and specific activities.
Improvement Techniques
The essential tools for the discovery
process are:
• Quality tools are available to help organizations to
better understand and improve their processes.
1. Check Sheet
2. Cause-and-Effect Diagram
3. Flow Chart
4. Pareto Chart
5. Scatter Diagram
6. Probability Plot
7. Histogram
8. Control Charts
9. Brainstorming
Check Sheet
• Check sheets are simply charts for gathering
data. When check sheets are designed clearly
and cleanly, they assist in gathering accurate and
pertinent data, and allow the data to be easily
read and used.
• A structured, prepared form for collecting and
analyzing data; a generic tool that can be
adapted for a wide variety of purposes.
Cause and Effect Diagram
• A quality control tool used to analyze potential
causes of problems in a product or process. It is
also called a fishbone diagram or an Ishikawa
diagram after its developer.
Cause and Effect Diagram
• A flowchart is a diagram that shows the step-by-
step flow of operation to get a solution of a
problem or to figure out the correct sequence of
the process.
• Flowchart is used in designing and documenting
complex program. It helps visualize what is
going on and what will be processed, and people
will better understand the process.
Flow Chart
More complicated flow chart!!!
Pareto Chart
• A problem-solving tool that involves ranking all
potential problem areas or sources of variation
according to their contribution to cost or total
variation. Typically, 80% of the effects come
from 20% of the possible causes, so efforts are
best spent on these “vital few” causes,
temporarily ignoring the “trivial many” causes.
• The purpose of the Pareto chart is to highlight
the most important among a (typically large) set
of factors. In quality control, it often represents
the most common sources of defects, the highest
occurring type of defect, or the most frequent
reasons for customer complaints, and so
on. Wilkinson (2006) devised an algorithm for
producing statistically based acceptance limits
(similar to confidence intervals) for each bar in
the Pareto chart.
Scatter Diagram
• A graphical technique used to visually analyze
the relationship between two variables. Two sets
of data are plotted on a graph, with the y-axis
being used for the variable to be predicted and
the x-axis being used for the variable to make
the prediction.
Probability Plot
• The probability plot (Chambers et al., 1983) is a
graphical technique for assessing whether or not
a data set follows a given distribution such as the
normal or Weibull.
• The data are plotted against a theoretical
distribution in such a way that the points should
form approximately a straight line. Departures
from this straight line indicate departures from
the specified distribution.
Histogram
• A graph of a frequency distribution in which rectangles
with bases on the horizontal axis are given widths equal
to the class intervals and heights equal to the
corresponding frequencies.
• Histograms are often confused with bar charts. A
histogram is used for continuous data, where the bins
represent ranges of data, and the areas of the rectangles
are meaningful, while a bar chart is a plot of categorical
variables and the discontinuity should be indicated by
having gaps between the rectangles, from which only the
length is meaningful. Often this is neglected, which may
lead to a bar chart being confused for a histogram.
Control charts
• The control chart is a graph used to study how a
process changes over time. Data are plotted in time
order.
• A control chart always has a central line for the
average, an upper line for the upper control limit
and a lower line for the lower control limit.
• These lines are determined from historical data.
• By comparing current data to these lines, you can
draw conclusions about whether the process
variation is consistent (in control) or is
unpredictable (out of control, affected by special
causes of variation).
Brainstorming- a collection of ideas
• All of the charting techniques are aids to thinking. They focus the
attention of the user on the truly important dimensions of a
problem. It is equally important, however, to expand your thinking
to include all of the dimensions of a problem or solution.
• Brainstorming is used to help a group create as many ideas in as
short a time as possible.
• Brainstorming is a useful technique to harness a team’s collective
thinking power in order to generate a list of process activities and
potential root causes.
• It is often used to generate a long list of thoughts and ideas in a
relatively short period of time.
• Brainstorming relies on the synergy of the team and builds on what
each person has to say.
When to use it?
• Generating a list of ideas
• Identifying possible data requirements
• Developing objectives for solutions
• Generating possible solutions
• Developing action plans
What does it achieve?
• Providing the rules and principles are carefully
followed, brainstorming can achieve the following:
• Many ideas are produced in a short timeframe
• Enable participants to both contribute individually
and to benefit from the ideas generated by others.
• Encourage the generation of ‘unusual’ ideas
• Encourage deeper thinking about particular
problems
• Create the environment that will enhance group
activity and teamwork
• Create a more positive environment in which to
approach problem solving
Key steps
• Avoid criticism
• Encourage and ideas - freewheel
• Quantity of ideas first
• Record all ideas
• Reflect on ideas - incubate
Lecture 5  Quality Performance Tools & Techniques

Lecture 5 Quality Performance Tools & Techniques

  • 1.
    Quality improvement tools TantishKamaruddin UTM, Skudai
  • 2.
    What is qualityimprovement techniques? • Quality improvement is a characteristic of quality management and it is the continuous improvement of the output of products and services using management systems. • There are various quality management systems available.
  • 3.
    • Many Qualityimprovement tools today are used due to a high demand for large volumes of high value products and services using cheaper materials in production during the second world war. • Present systems such as Kaizen, Total quality management (TQM), Quality circles and Six Sigma have shown the power and effects a team-base improvement system can have on production. Process capability design is at the forefront when using Six Sigma.
  • 4.
    • A sustainableand continuous improvement program in a company has to be part of the companies’ cooperate culture, and staff should be trained on the system adopted for this type of management and improvement. • No matter the techniques being used to improve the quality of the production process in a company, they all have the same objective; to save on costs while satisfying the customer. Many techniques don’t just seek to improve a system to a certain standard, some techniques like 6 Sigma strive to continuously improve a system or systems within an entire company.
  • 5.
    Improvement Techniques 1. SixSigma • Six Sigma is a business management tool developed by the Motorola Company in the mid 80’s. It seeks to improve the quality output and efficiency of companies by identifying the probable defects in a given process and minimizing the variability in output. This process uses a set of methods including statistical methods creating an infrastructure of people within the organization. Each Six Sigma project process in an organization follows a laid down sequence with the aim of reducing cost and maximizing profit. • A high-performance, data-driven approach to analyzing the root causes of business problems and solving them. Sixsigma techniques were championed by Motorola.
  • 6.
    2. Total QualityManagement (TQM) • TQM uses teams made up of workers from all sectors in the company to solve issues. The teams undergo training in the use of basic statistical tools that are used in the collection and analysis of data. Improvement Techniques
  • 7.
    3. ISO 9000 •ISO 9000 is a standard of quality systems. The ISO 9000 family of standards ensure that organizations meet the needs of customers and other stakeholders. This process deals with the basics of quality management, emphasizing on eight principles on which the family of standards is based. Improvement Techniques
  • 8.
    4. Quality ControlCircle (QCC) • Quality control circle is a small group of workers who come together to discuss ways of identifying, analyzing, solving and selecting work related issues. Improvement Techniques
  • 9.
    5. Kaizen • Kaizen(Japanese for improvement) is a daily process geared towards rapid improvement. Kaizen focuses on total reduction of waste while increasing the output of products, and services and achieving sustained improvement in processes and specific activities. Improvement Techniques
  • 10.
    The essential toolsfor the discovery process are: • Quality tools are available to help organizations to better understand and improve their processes. 1. Check Sheet 2. Cause-and-Effect Diagram 3. Flow Chart 4. Pareto Chart 5. Scatter Diagram 6. Probability Plot 7. Histogram 8. Control Charts 9. Brainstorming
  • 11.
    Check Sheet • Checksheets are simply charts for gathering data. When check sheets are designed clearly and cleanly, they assist in gathering accurate and pertinent data, and allow the data to be easily read and used. • A structured, prepared form for collecting and analyzing data; a generic tool that can be adapted for a wide variety of purposes.
  • 15.
    Cause and EffectDiagram • A quality control tool used to analyze potential causes of problems in a product or process. It is also called a fishbone diagram or an Ishikawa diagram after its developer.
  • 16.
  • 17.
  • 18.
    • A flowchartis a diagram that shows the step-by- step flow of operation to get a solution of a problem or to figure out the correct sequence of the process. • Flowchart is used in designing and documenting complex program. It helps visualize what is going on and what will be processed, and people will better understand the process. Flow Chart
  • 21.
  • 22.
    Pareto Chart • Aproblem-solving tool that involves ranking all potential problem areas or sources of variation according to their contribution to cost or total variation. Typically, 80% of the effects come from 20% of the possible causes, so efforts are best spent on these “vital few” causes, temporarily ignoring the “trivial many” causes.
  • 23.
    • The purposeof the Pareto chart is to highlight the most important among a (typically large) set of factors. In quality control, it often represents the most common sources of defects, the highest occurring type of defect, or the most frequent reasons for customer complaints, and so on. Wilkinson (2006) devised an algorithm for producing statistically based acceptance limits (similar to confidence intervals) for each bar in the Pareto chart.
  • 26.
    Scatter Diagram • Agraphical technique used to visually analyze the relationship between two variables. Two sets of data are plotted on a graph, with the y-axis being used for the variable to be predicted and the x-axis being used for the variable to make the prediction.
  • 28.
    Probability Plot • Theprobability plot (Chambers et al., 1983) is a graphical technique for assessing whether or not a data set follows a given distribution such as the normal or Weibull. • The data are plotted against a theoretical distribution in such a way that the points should form approximately a straight line. Departures from this straight line indicate departures from the specified distribution.
  • 30.
    Histogram • A graphof a frequency distribution in which rectangles with bases on the horizontal axis are given widths equal to the class intervals and heights equal to the corresponding frequencies. • Histograms are often confused with bar charts. A histogram is used for continuous data, where the bins represent ranges of data, and the areas of the rectangles are meaningful, while a bar chart is a plot of categorical variables and the discontinuity should be indicated by having gaps between the rectangles, from which only the length is meaningful. Often this is neglected, which may lead to a bar chart being confused for a histogram.
  • 33.
    Control charts • Thecontrol chart is a graph used to study how a process changes over time. Data are plotted in time order. • A control chart always has a central line for the average, an upper line for the upper control limit and a lower line for the lower control limit. • These lines are determined from historical data. • By comparing current data to these lines, you can draw conclusions about whether the process variation is consistent (in control) or is unpredictable (out of control, affected by special causes of variation).
  • 36.
    Brainstorming- a collectionof ideas • All of the charting techniques are aids to thinking. They focus the attention of the user on the truly important dimensions of a problem. It is equally important, however, to expand your thinking to include all of the dimensions of a problem or solution. • Brainstorming is used to help a group create as many ideas in as short a time as possible. • Brainstorming is a useful technique to harness a team’s collective thinking power in order to generate a list of process activities and potential root causes. • It is often used to generate a long list of thoughts and ideas in a relatively short period of time. • Brainstorming relies on the synergy of the team and builds on what each person has to say.
  • 37.
    When to useit? • Generating a list of ideas • Identifying possible data requirements • Developing objectives for solutions • Generating possible solutions • Developing action plans
  • 38.
    What does itachieve? • Providing the rules and principles are carefully followed, brainstorming can achieve the following: • Many ideas are produced in a short timeframe • Enable participants to both contribute individually and to benefit from the ideas generated by others. • Encourage the generation of ‘unusual’ ideas • Encourage deeper thinking about particular problems • Create the environment that will enhance group activity and teamwork • Create a more positive environment in which to approach problem solving
  • 39.
    Key steps • Avoidcriticism • Encourage and ideas - freewheel • Quantity of ideas first • Record all ideas • Reflect on ideas - incubate