ALGORITHMS AND FLOWCHARTS
■Atypical programming task can be divided into
two phases:
■Problem solving phase
◻produce an ordered sequence of steps that describe
solution of problem
◻this sequence of steps is called an algorithm
■Implementation phase
◻implement the program in some programming
language
3.
Steps in ProblemSolving
■First produce a general algorithm (one can use
pseudocode)
■Refine the algorithm successively to get step by
step detailed algorithm that is very close to a
computer language.
■Pseudocode is an artificial and informal
language that helps programmers develop
algorithms. Pseudocode is very similar to
everyday English.
4.
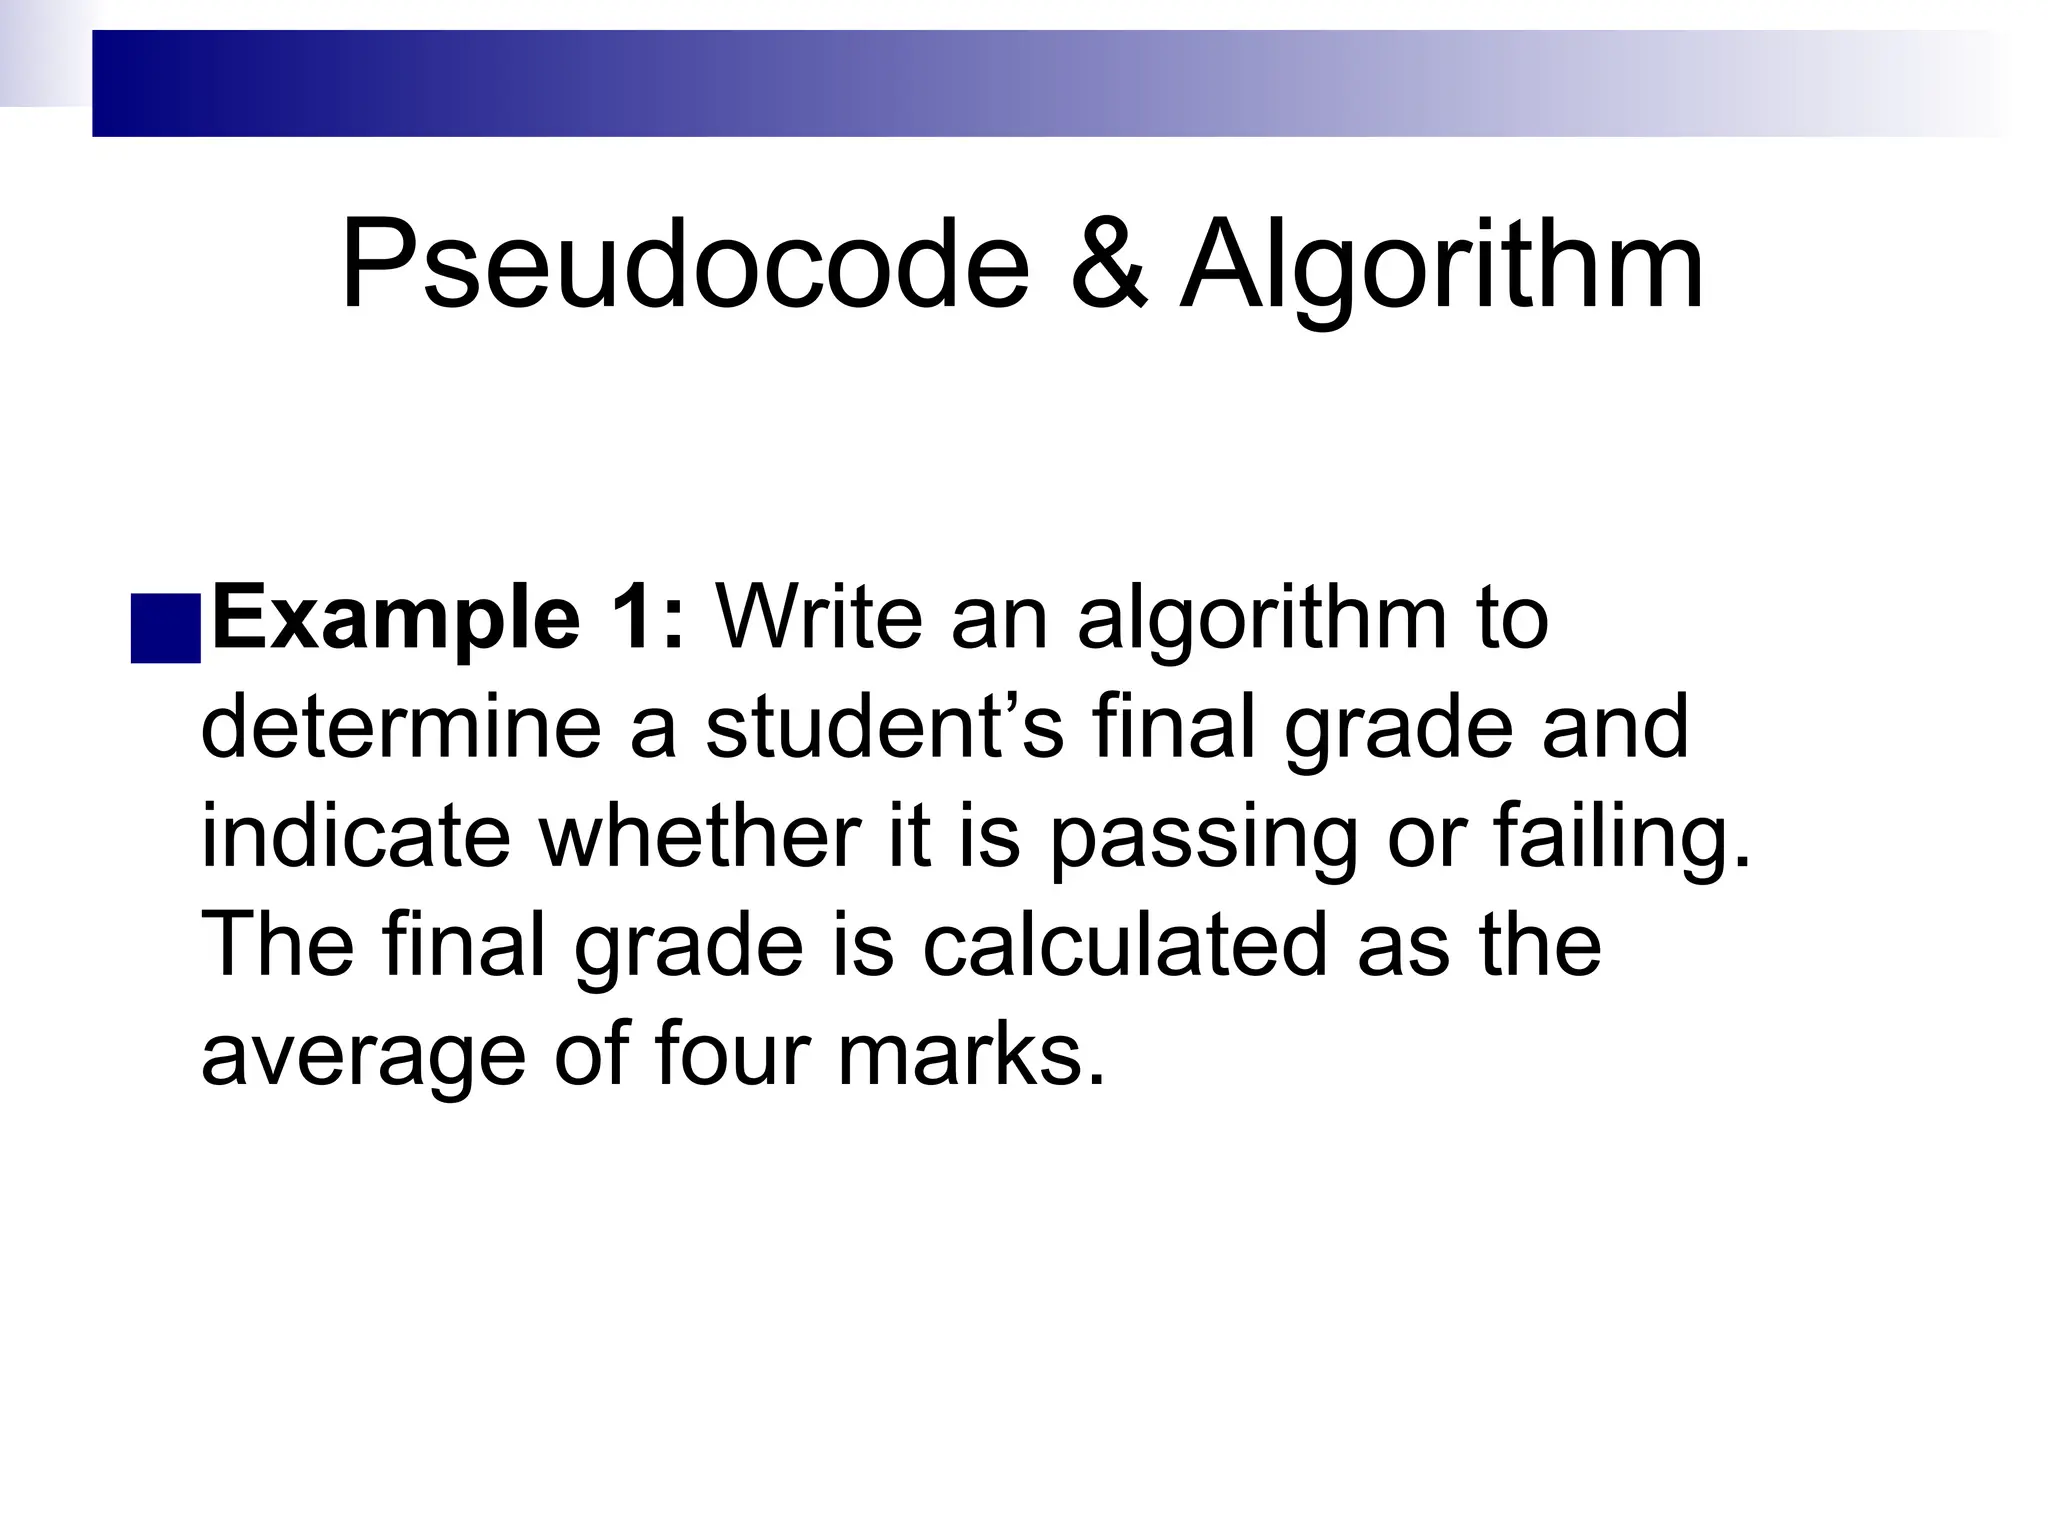
Pseudocode & Algorithm
■Example1: Write an algorithm to
determine a student’s final grade and
indicate whether it is passing or failing.
The final grade is calculated as the
average of four marks.
5.
Pseudocode & Algorithm
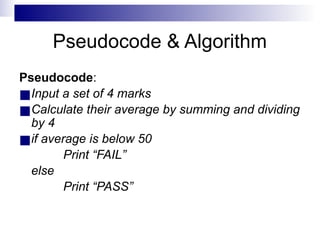
Pseudocode:
■Inputa set of 4 marks
■Calculate their average by summing and dividing
by 4
■if average is below 50
Print “FAIL”
else
Print “PASS”
The Flowchart
■ (Dictionary)A schematic representation of a sequence of
operations, as in a manufacturing process or computer
program.
■ (Technical) A graphical representation of the sequence of
operations in an information system or program.
Information system flowcharts show how data flows from
source documents through the computer to final
distribution to users. Program flowcharts show the
sequence of instructions in a single program or
subroutine. Different symbols are used to draw each
type of flowchart.
8.
The Flowchart
■ Anorganized combination of shapes, lines and text which
graphically illustrate a process/program.
■ A type of diagram that represents an algorithm, workflow or process,
showing the steps as boxes of various kinds, and their order by
connecting them with arrows. This diagrammatic representation
illustrates a solution to a given problem.
■ Emphasizes individual steps and their interconnections
■ Flowcharts are used in analyzing, designing, documenting or
managing a process or program. Like other types of diagrams, they
help visualize what is going on and thereby help the people to
understand a process, and perhaps also find flaws, bottlenecks, and
other less-obvious features within it.
■ Very helpful in explaining program to others.
9.
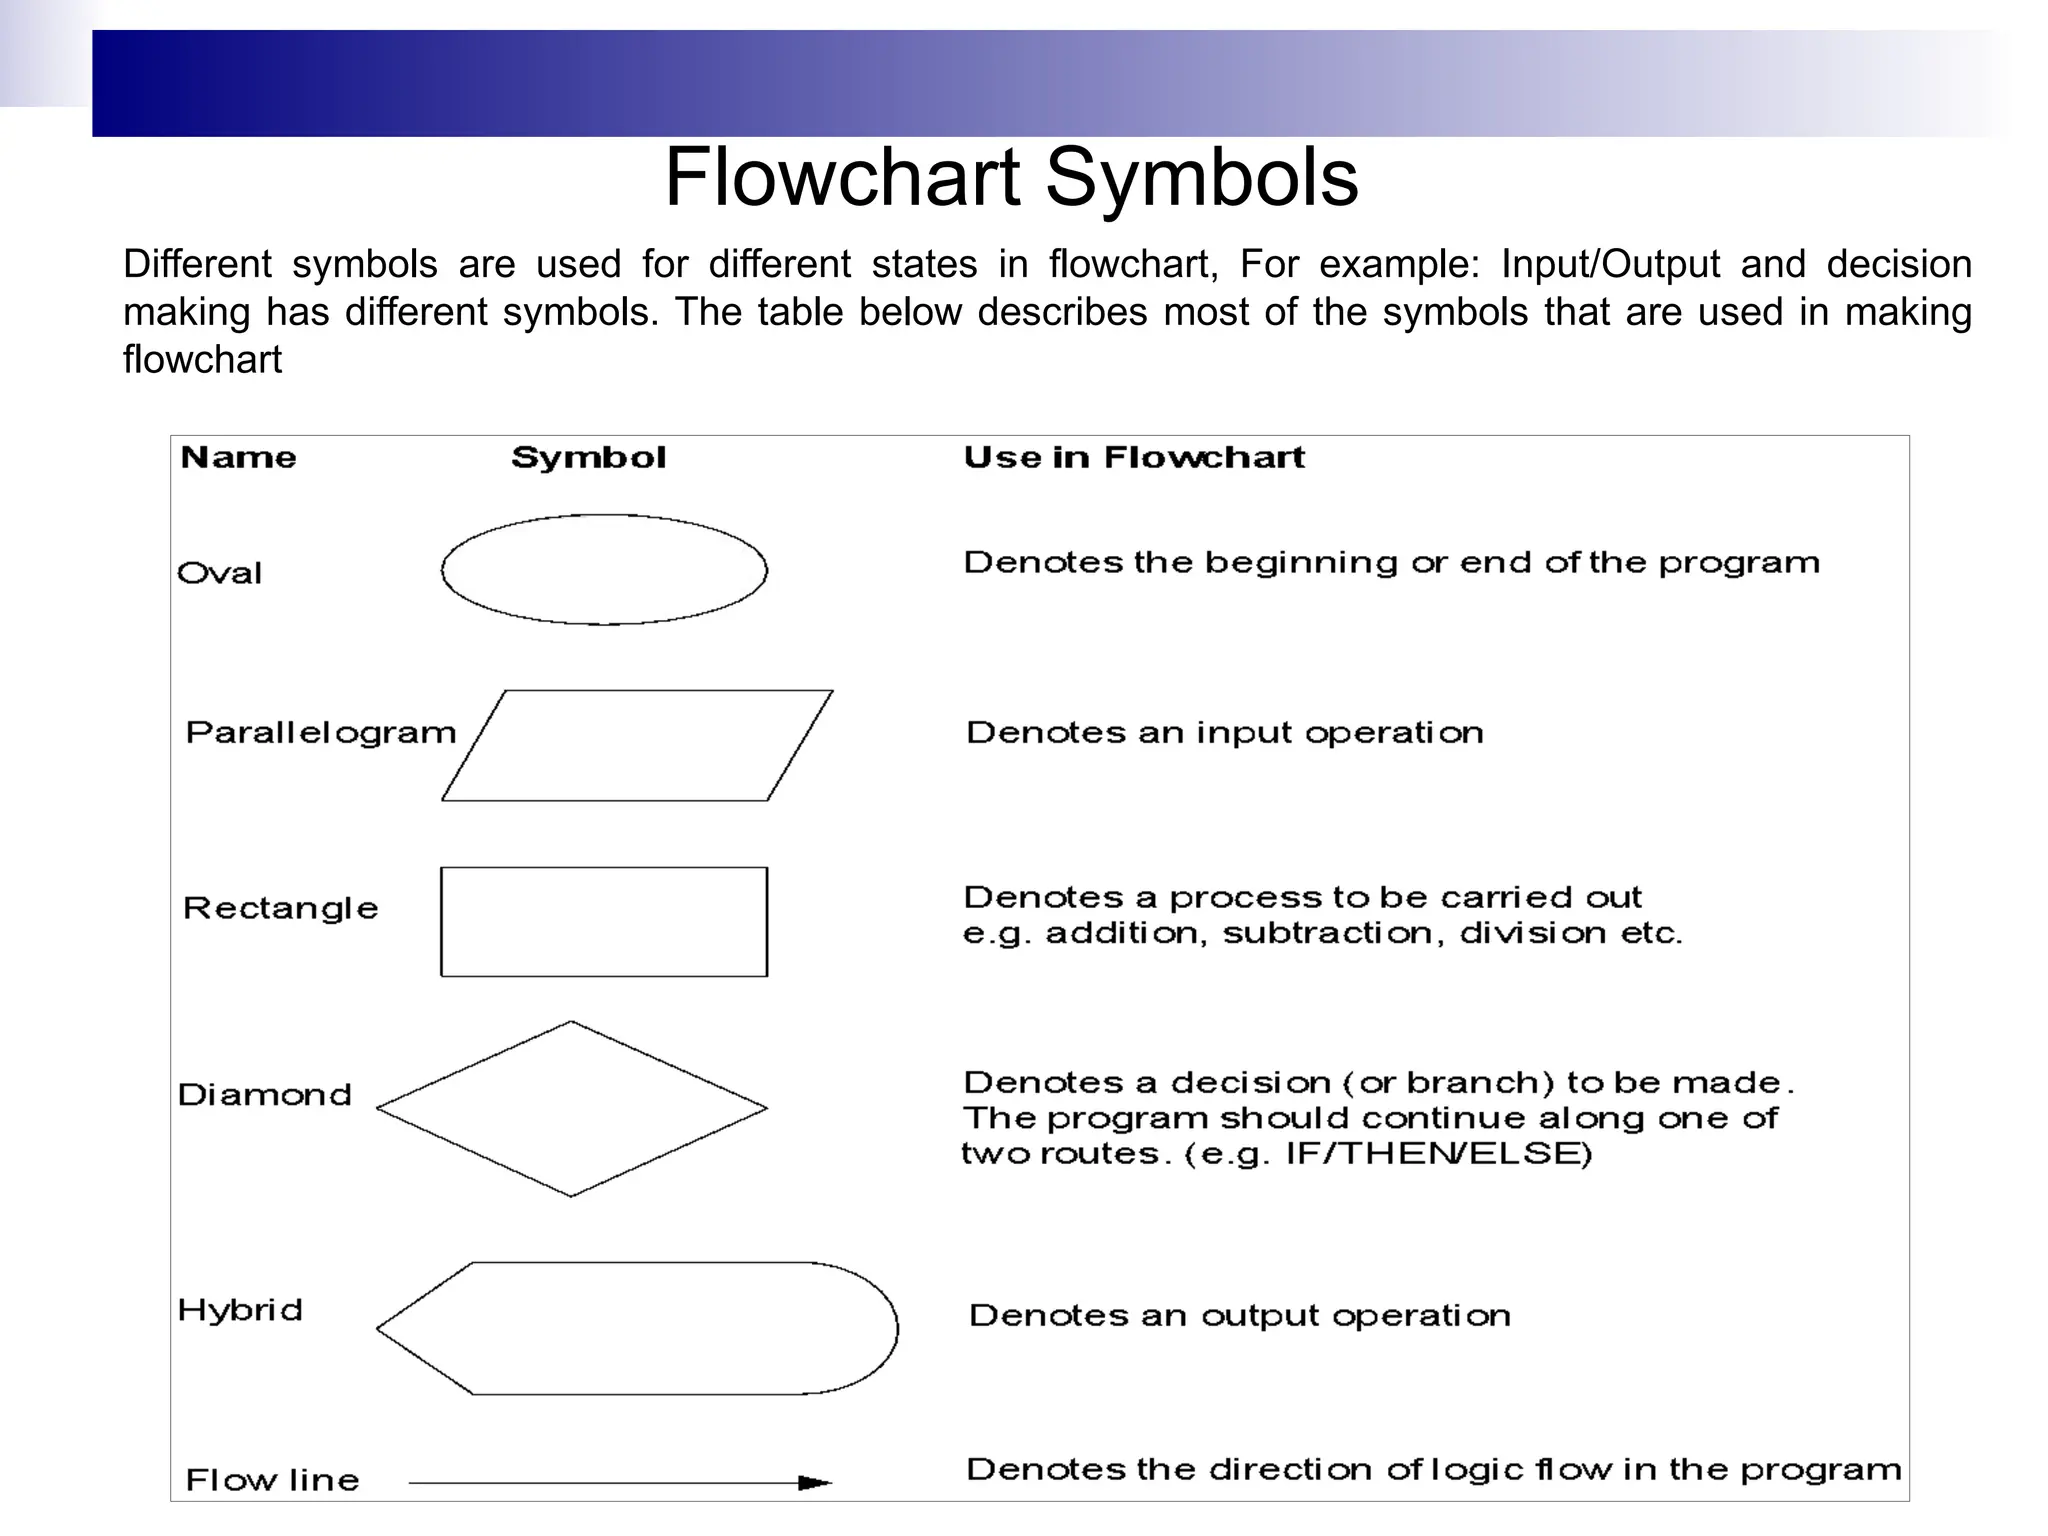
Flowchart Symbols
Different symbolsare used for different states in flowchart, For example: Input/Output and decision
making has different symbols. The table below describes most of the symbols that are used in making
flowchart
10.
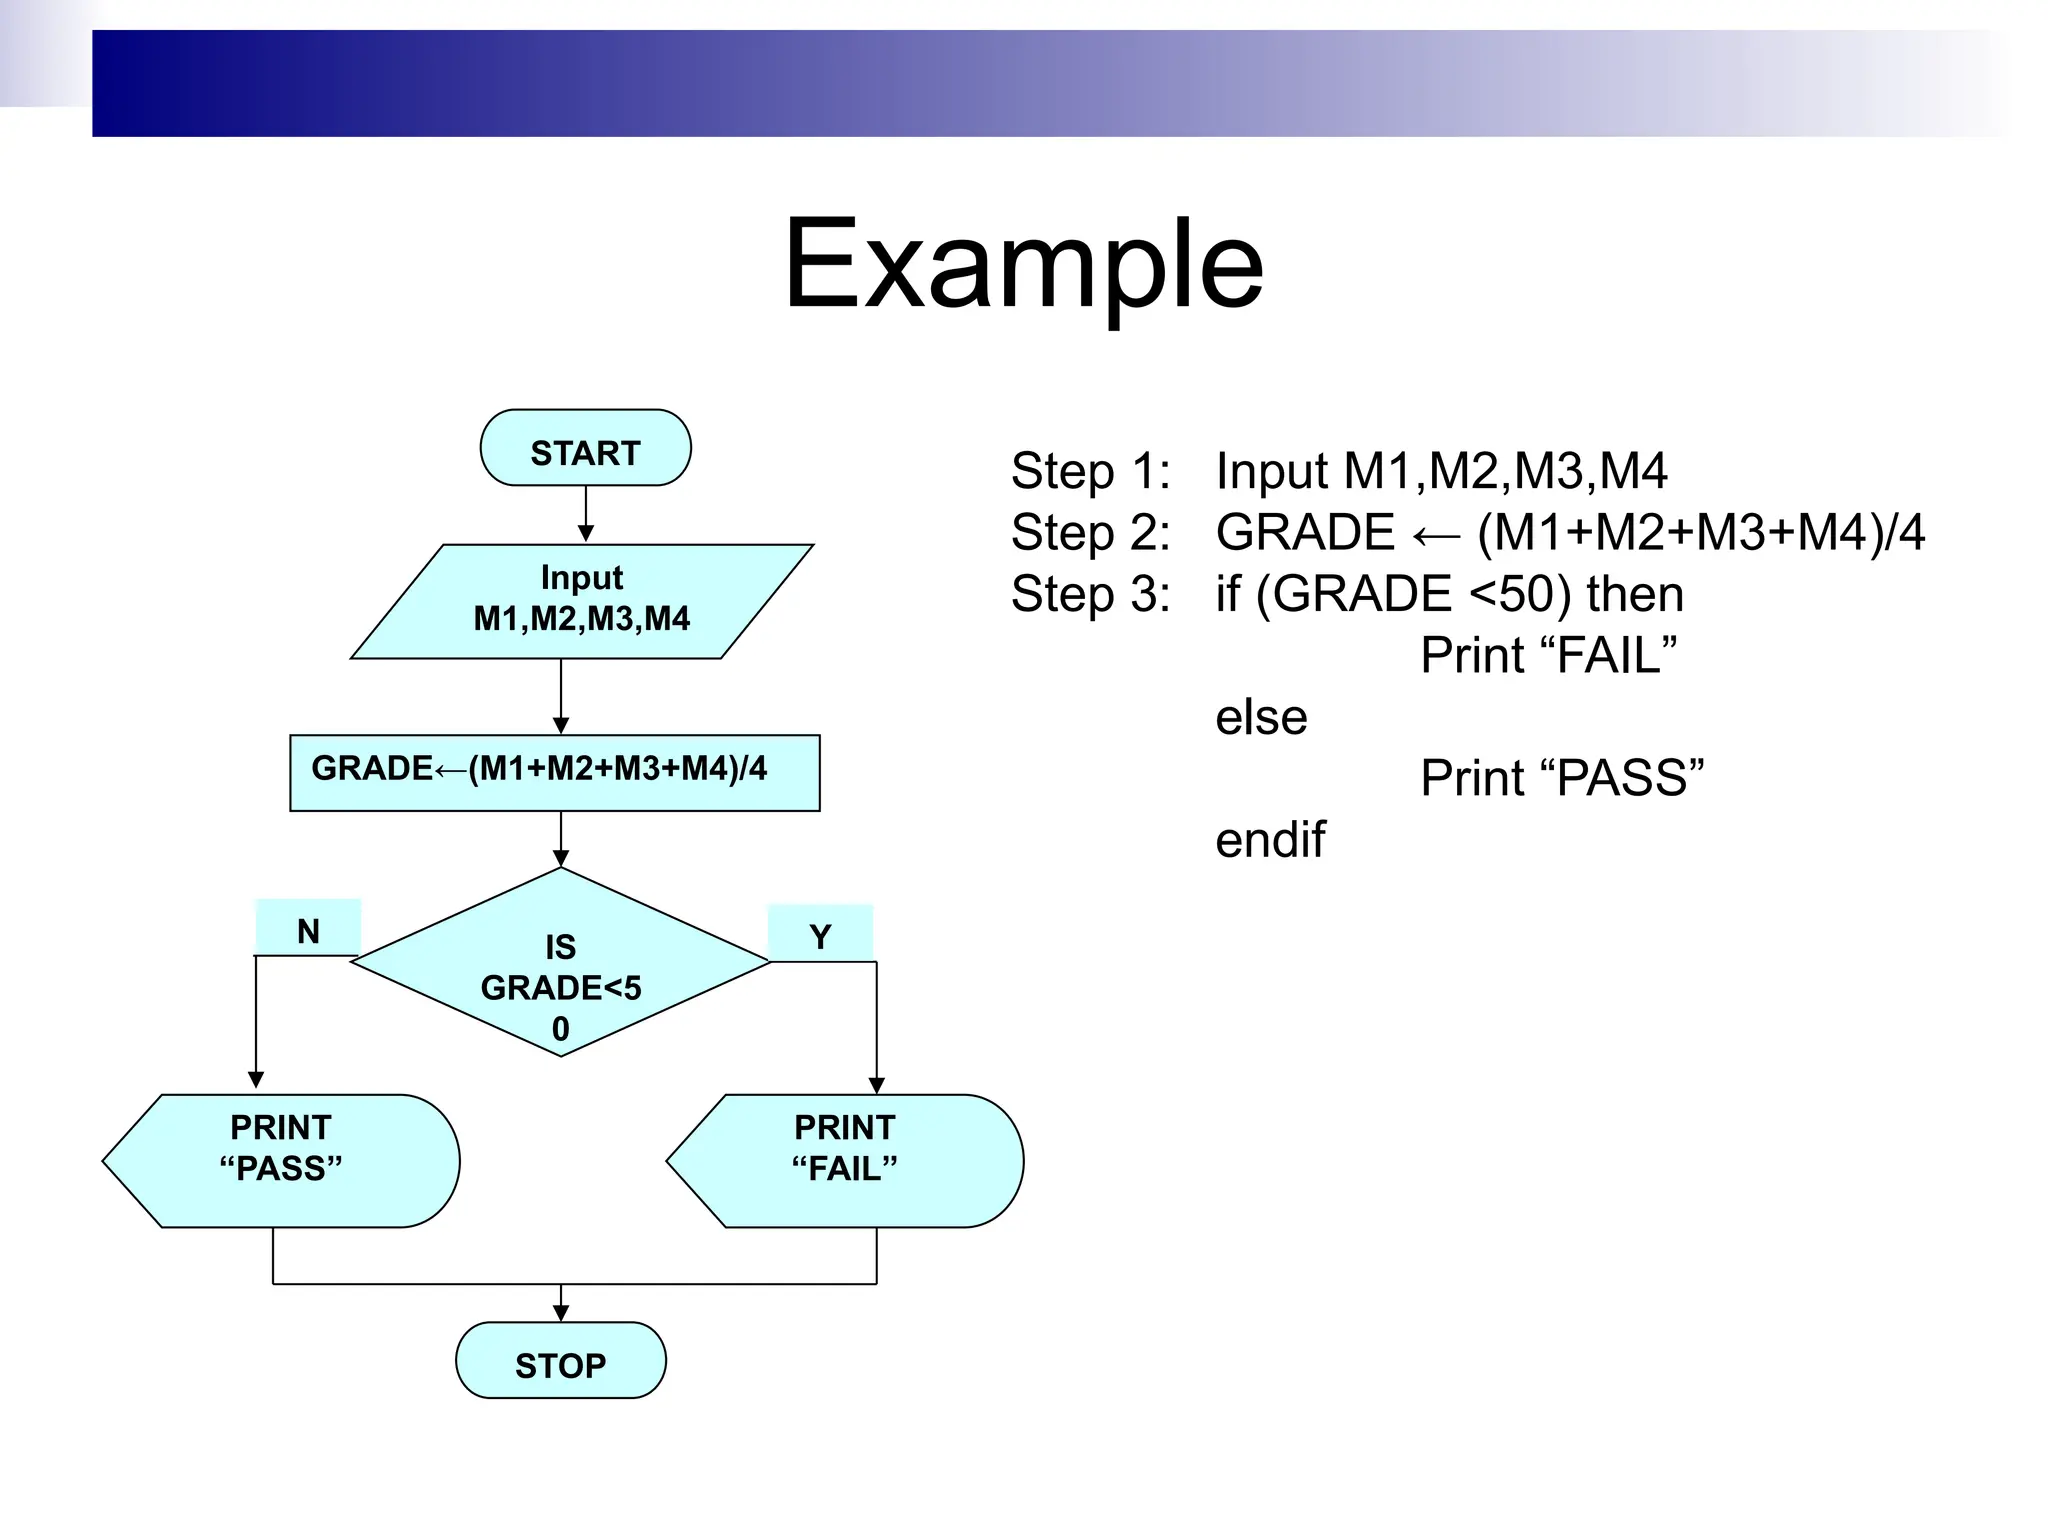
Example
PRINT
“PASS”
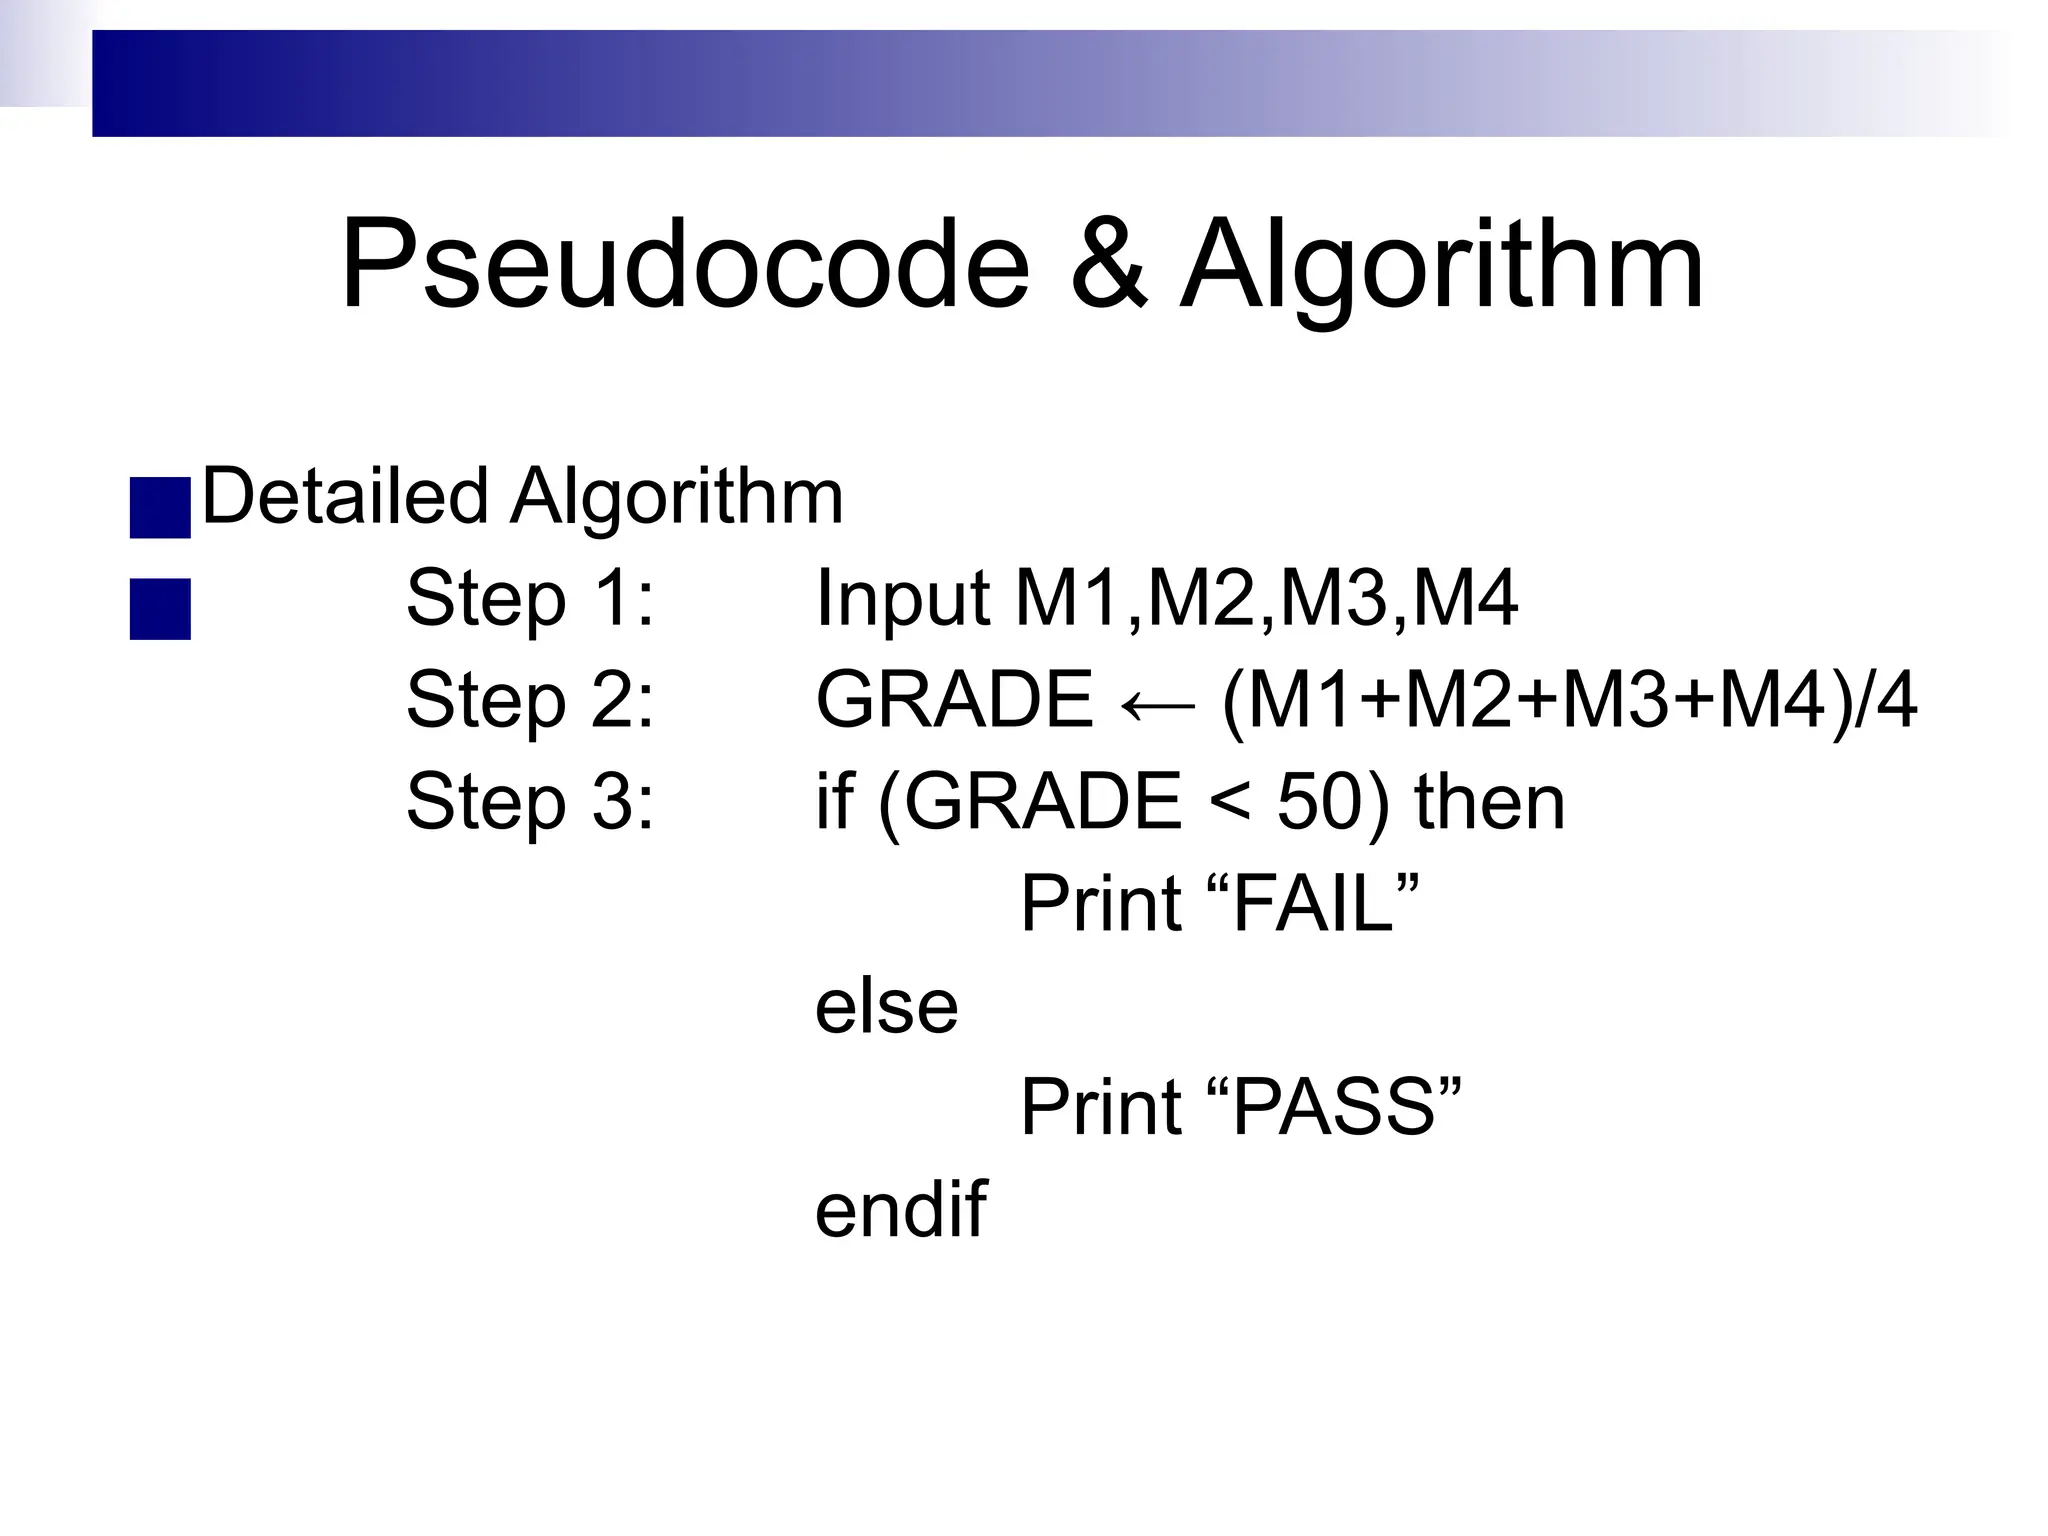
Step 1: InputM1,M2,M3,M4
Step 2: GRADE ← (M1+M2+M3+M4)/4
Step 3: if (GRADE <50) then
Print “FAIL”
else
Print “PASS”
endif
START
Input
M1,M2,M3,M4
GRADE←(M1+M2+M3+M4)/4
IS
GRADE<5
0
PRINT
“FAIL”
STOP
Y
N
11.
Example 2
■Write analgorithm and draw a flowchart to
convert the length in feet to centimeter.
■Pseudocode:
◻ Input the length in feet (Lft)
◻Calculate the length in cm (Lcm) by
multiplying LFT with 30
◻Print length in cm (LCM)
12.
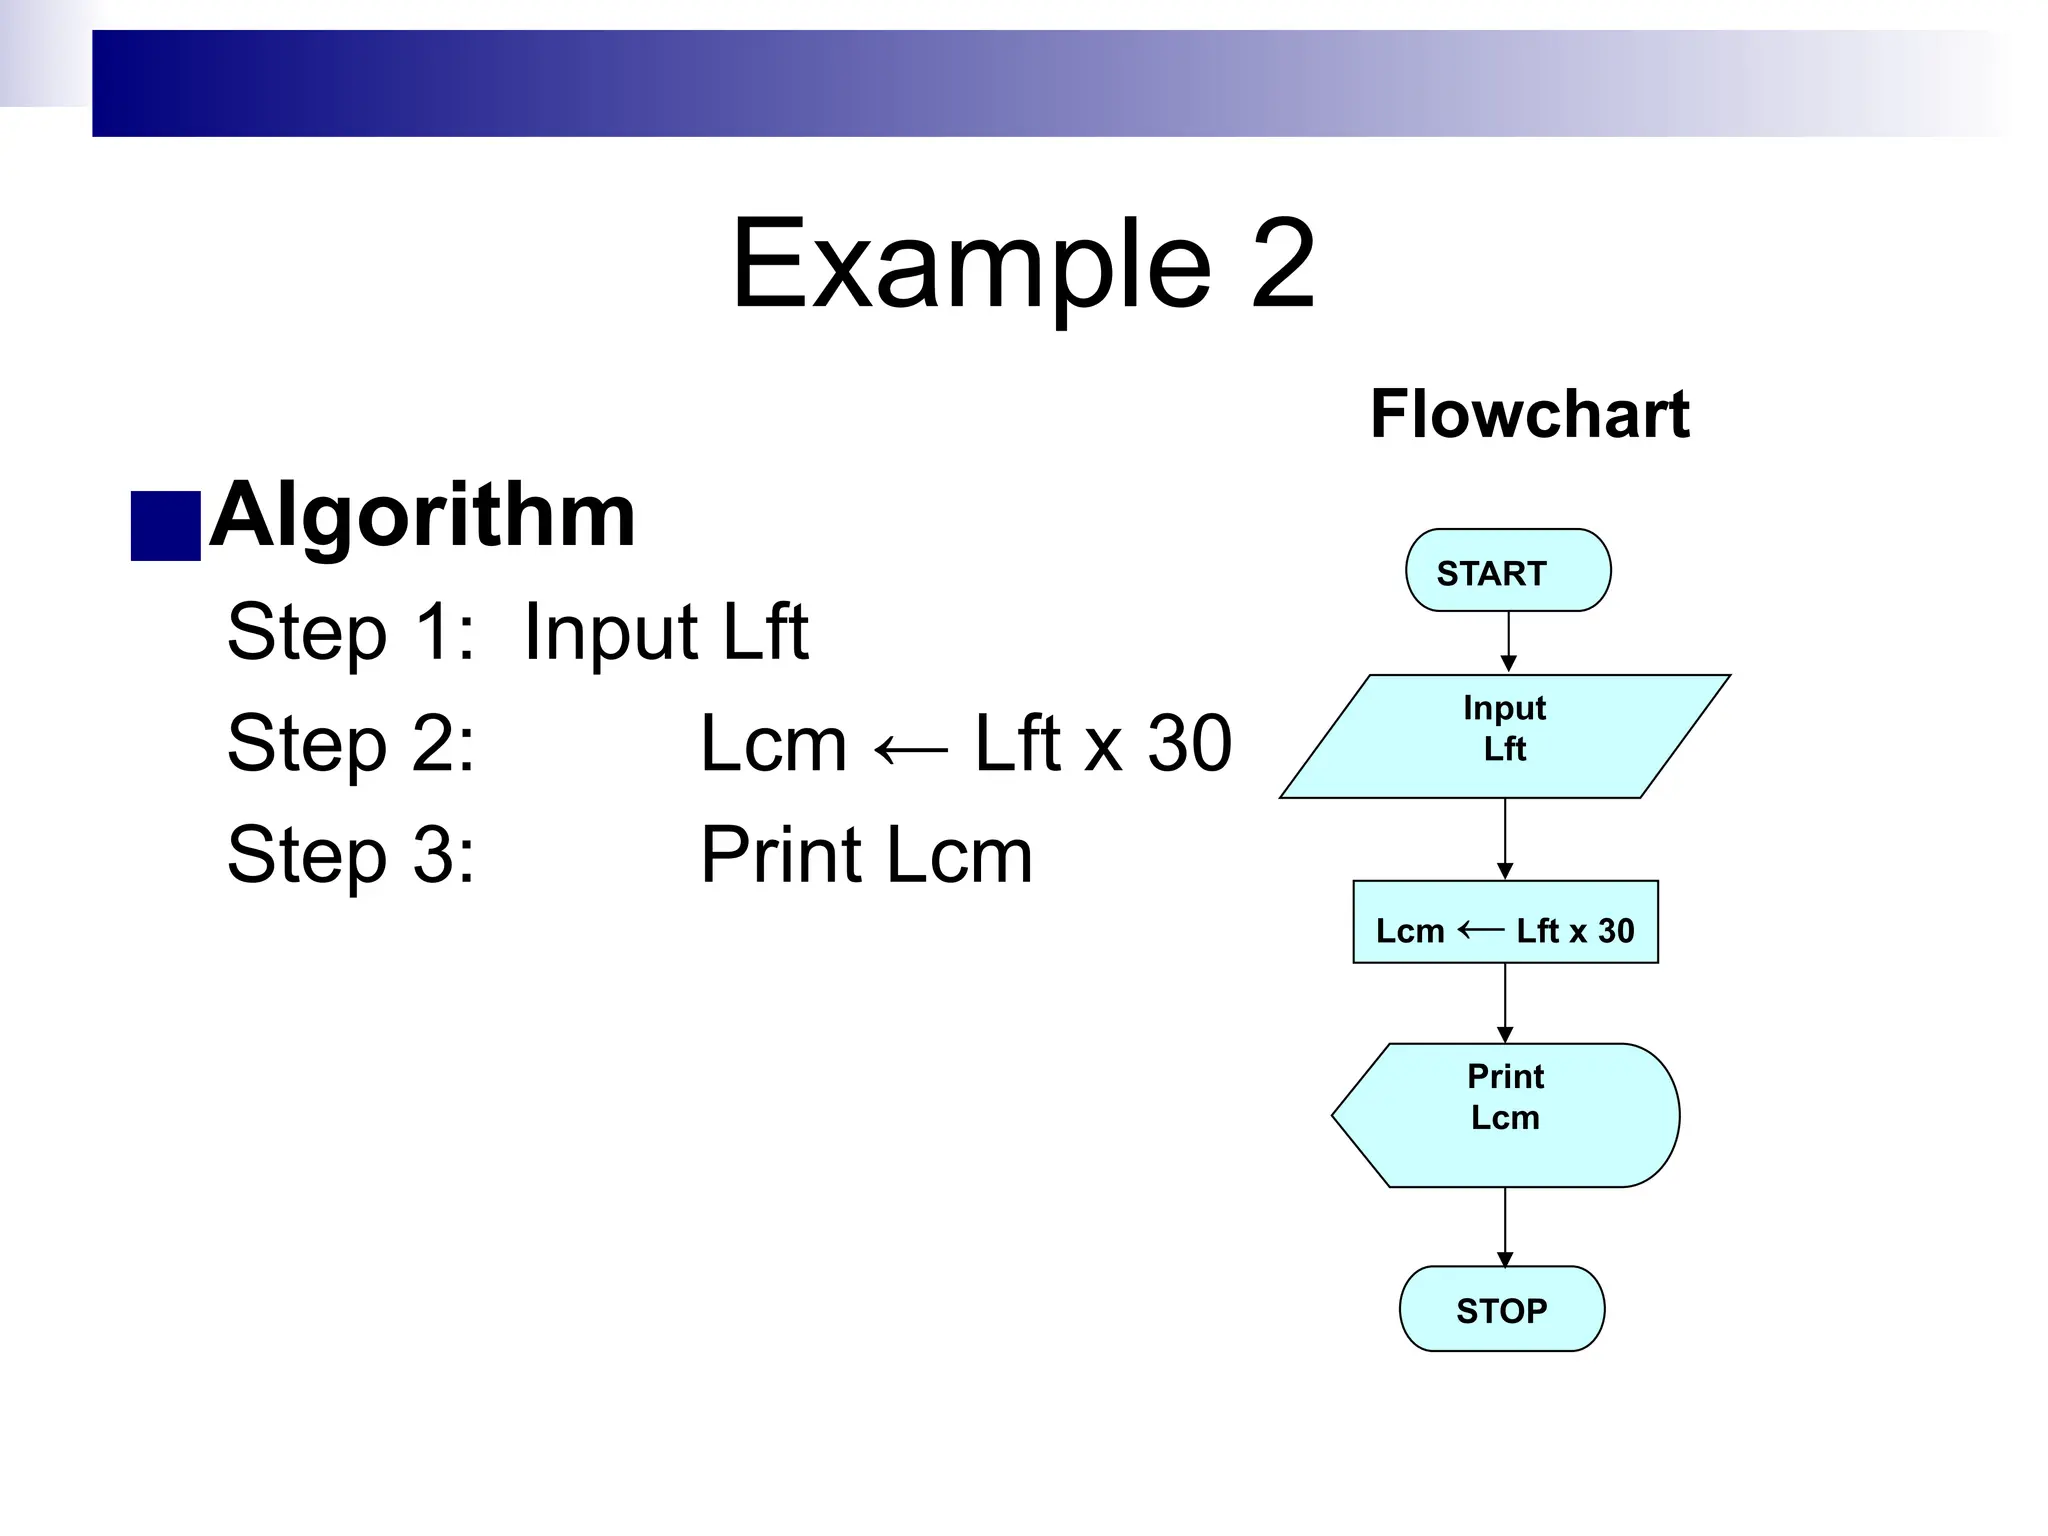
Example 2
■Algorithm
Step 1:Input Lft
Step 2: Lcm ← Lft x 30
Step 3: Print Lcm
START
Input
Lft
Lcm ← Lft x 30
Print
Lcm
STOP
Flowchart
13.
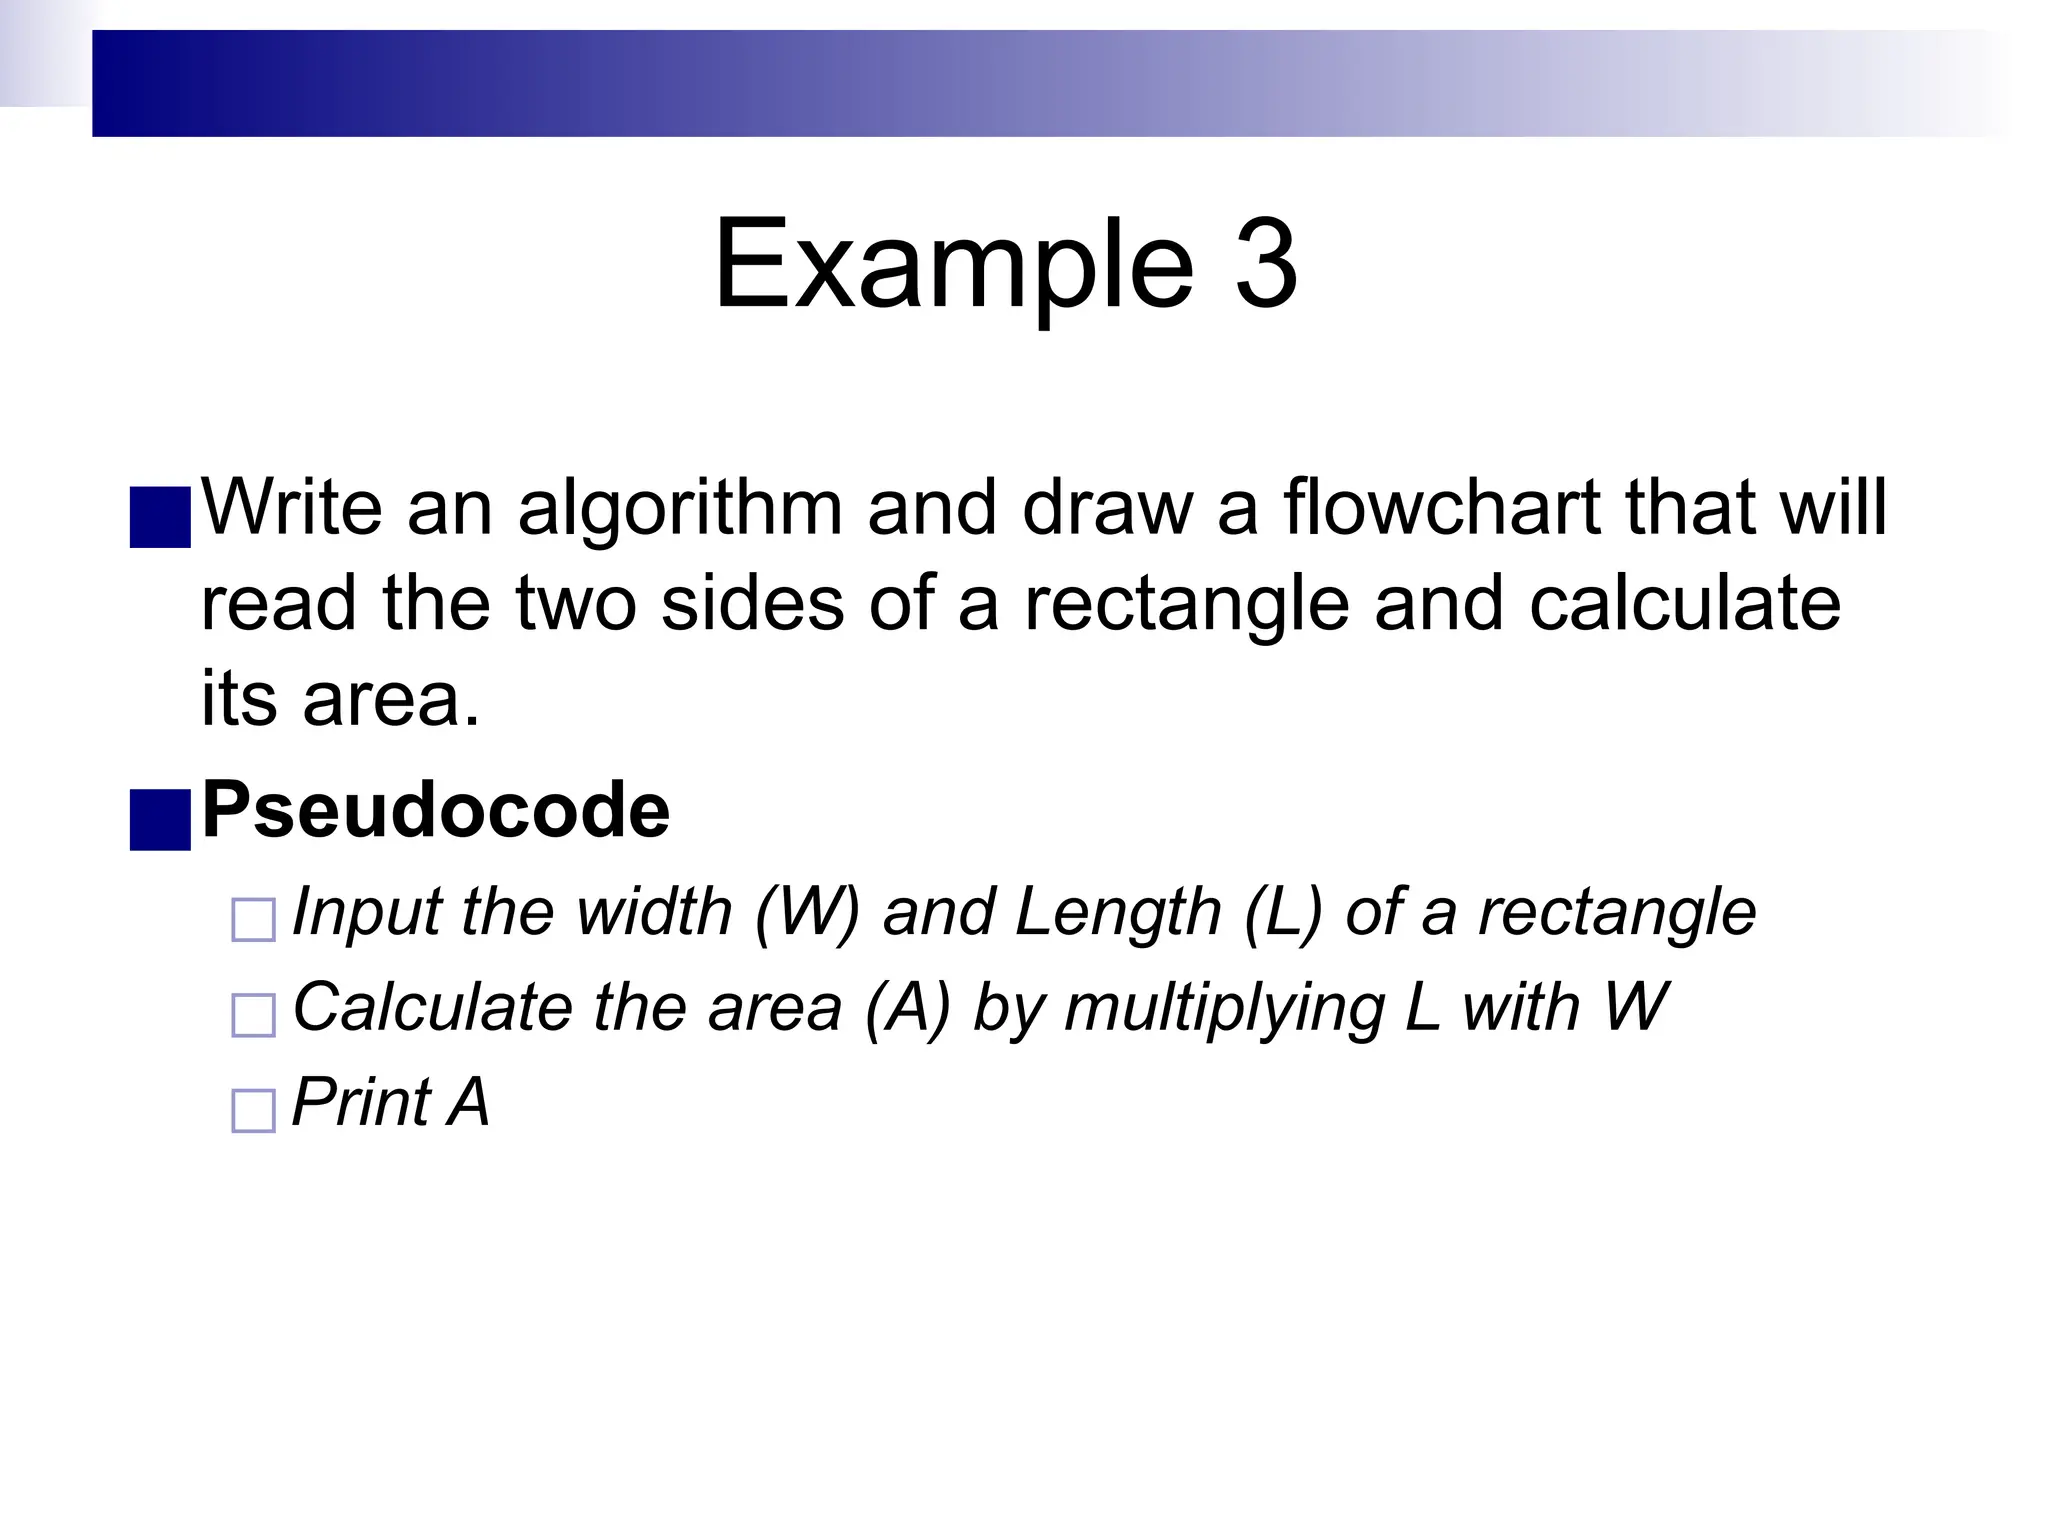
Example 3
■Write analgorithm and draw a flowchart that will
read the two sides of a rectangle and calculate
its area.
■Pseudocode
◻Input the width (W) and Length (L) of a rectangle
◻Calculate the area (A) by multiplying L with W
◻Print A
14.
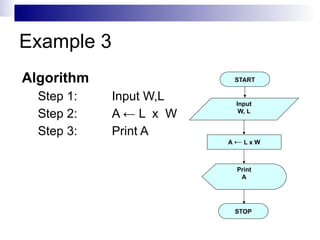
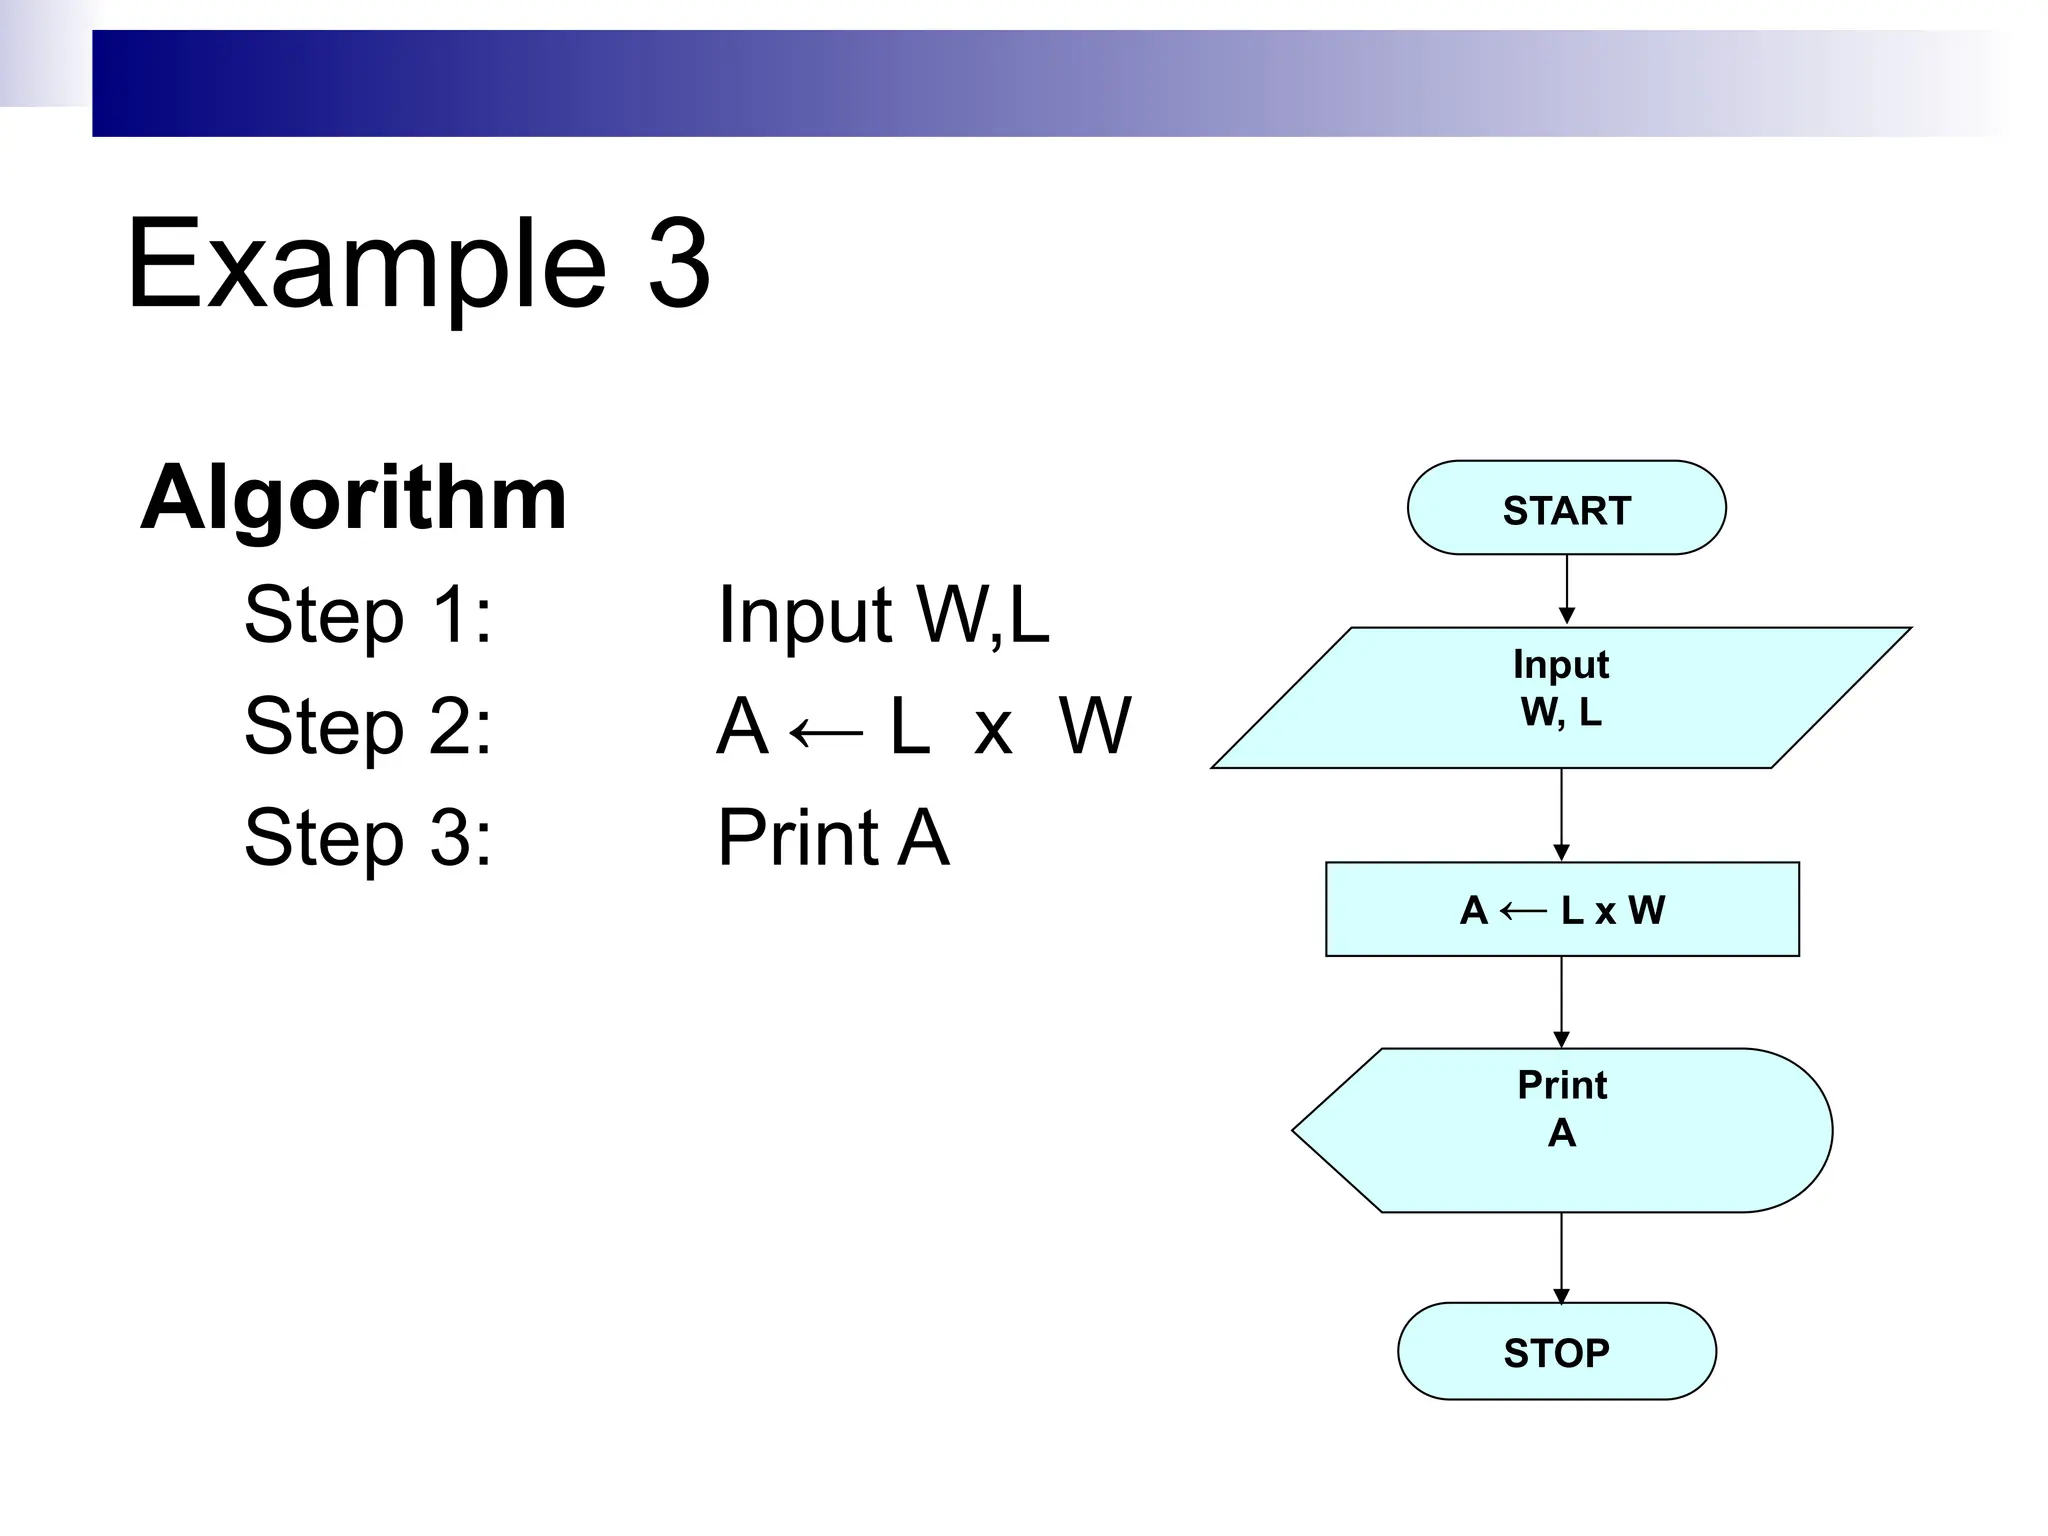
Example 3
Algorithm
Step 1:Input W,L
Step 2: A ← L x W
Step 3: Print A
START
Input
W, L
A ← L x W
Print
A
STOP
15.
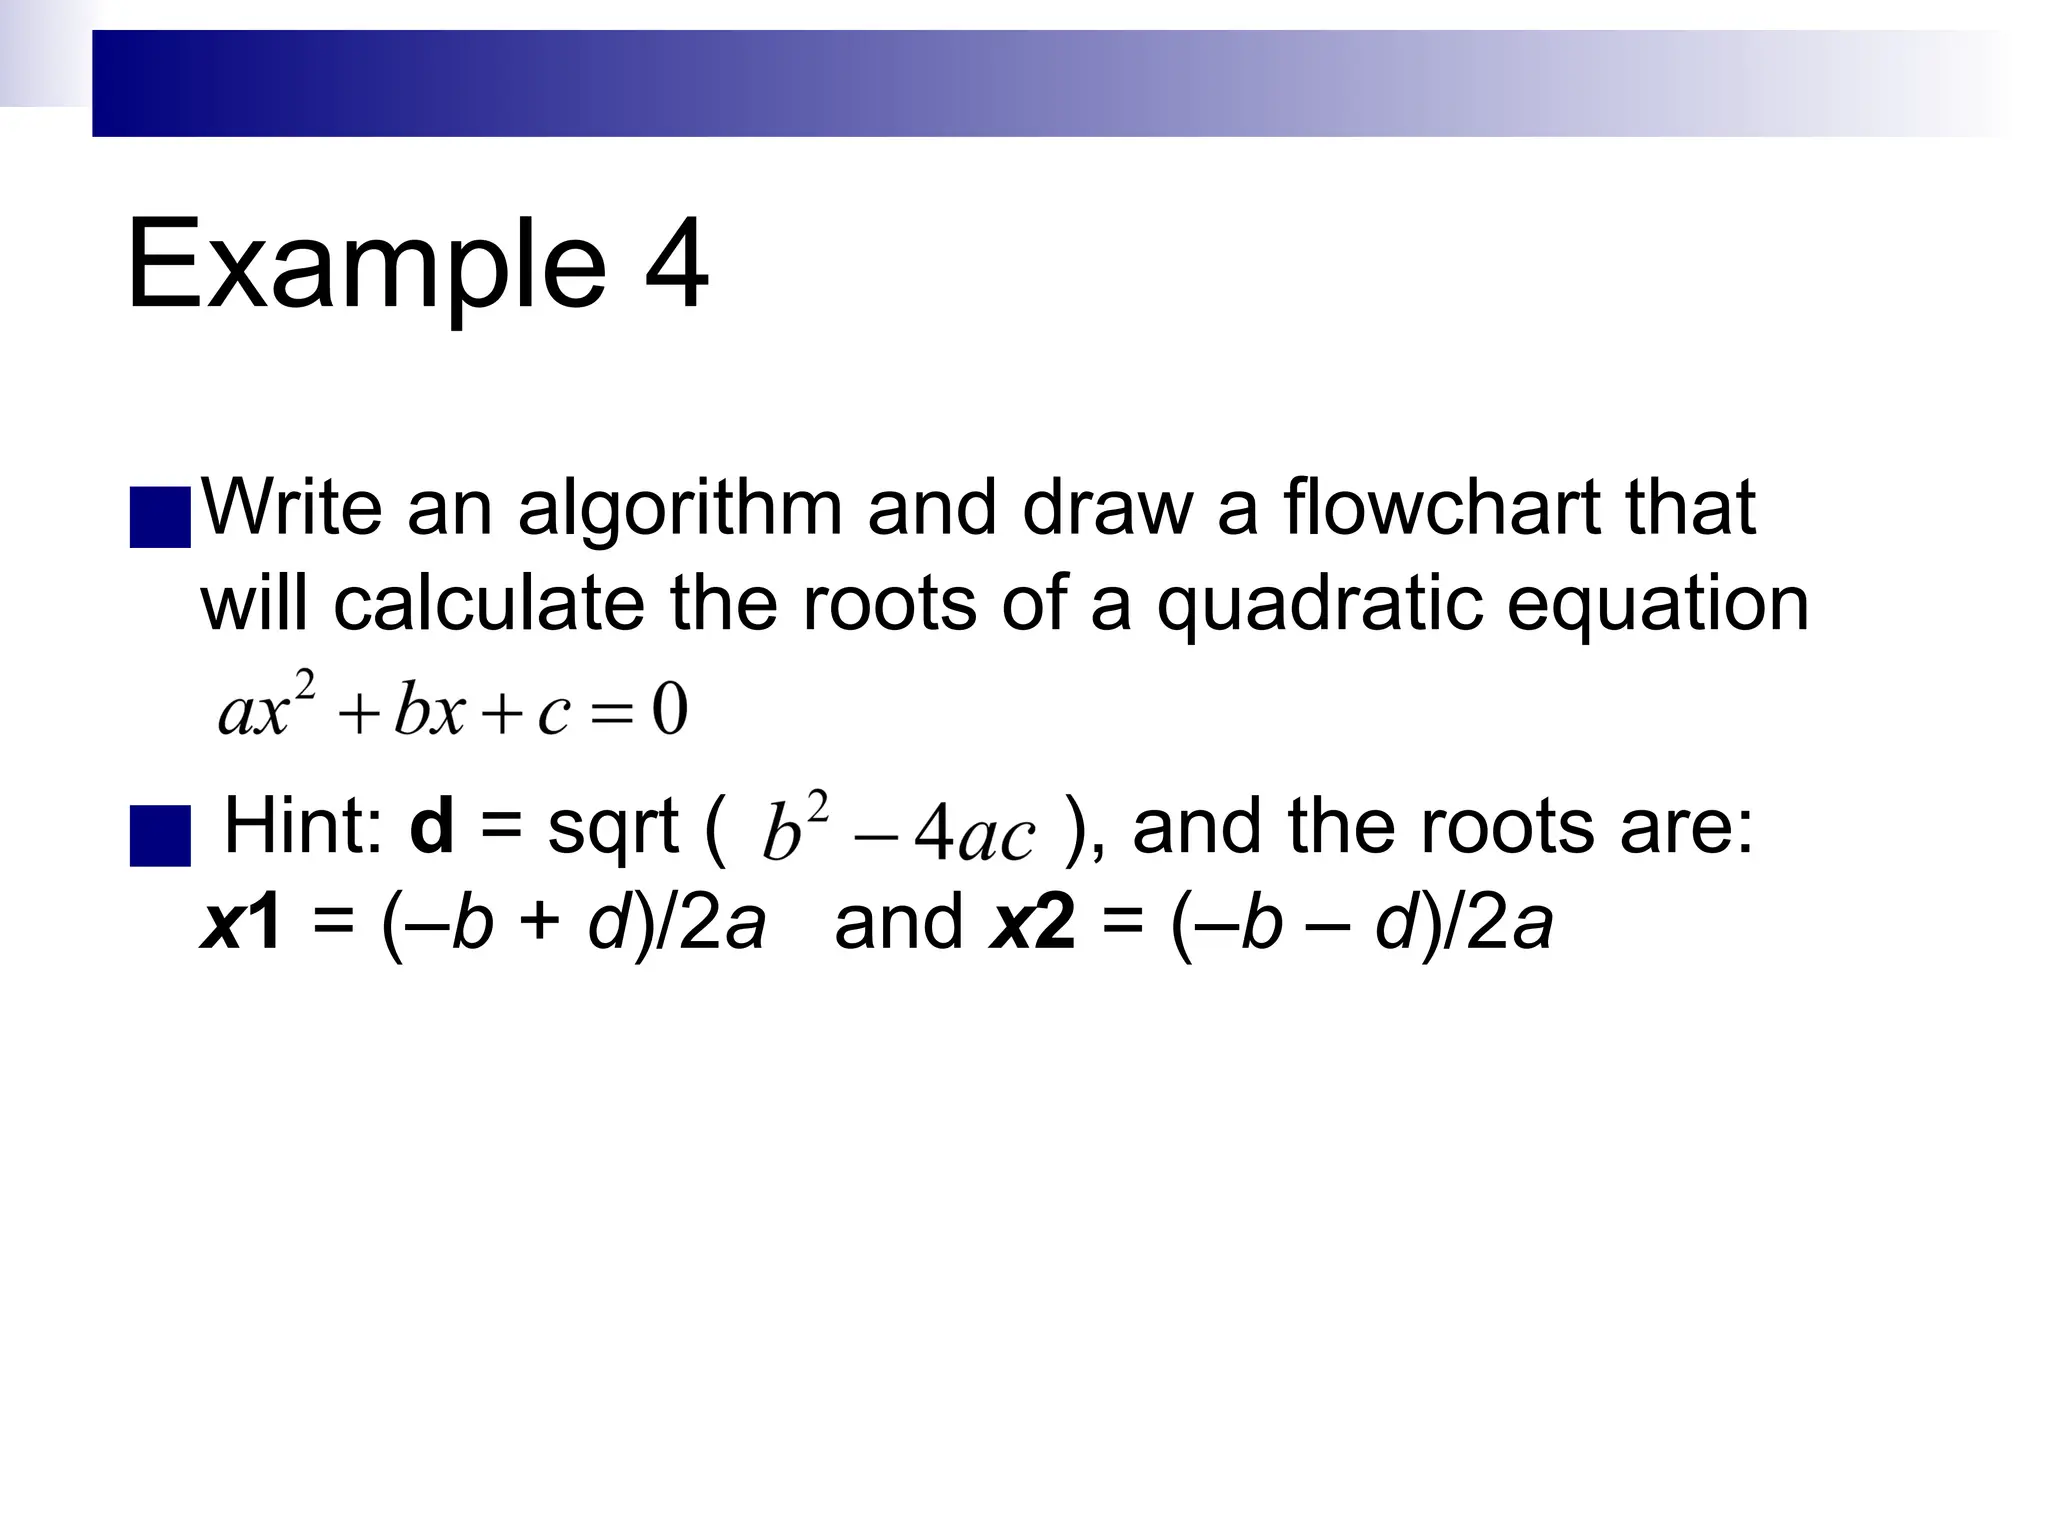
Example 4
■Write analgorithm and draw a flowchart that
will calculate the roots of a quadratic equation
■ Hint: d = sqrt ( ), and the roots are:
x1 = (–b + d)/2a and x2 = (–b – d)/2a
16.
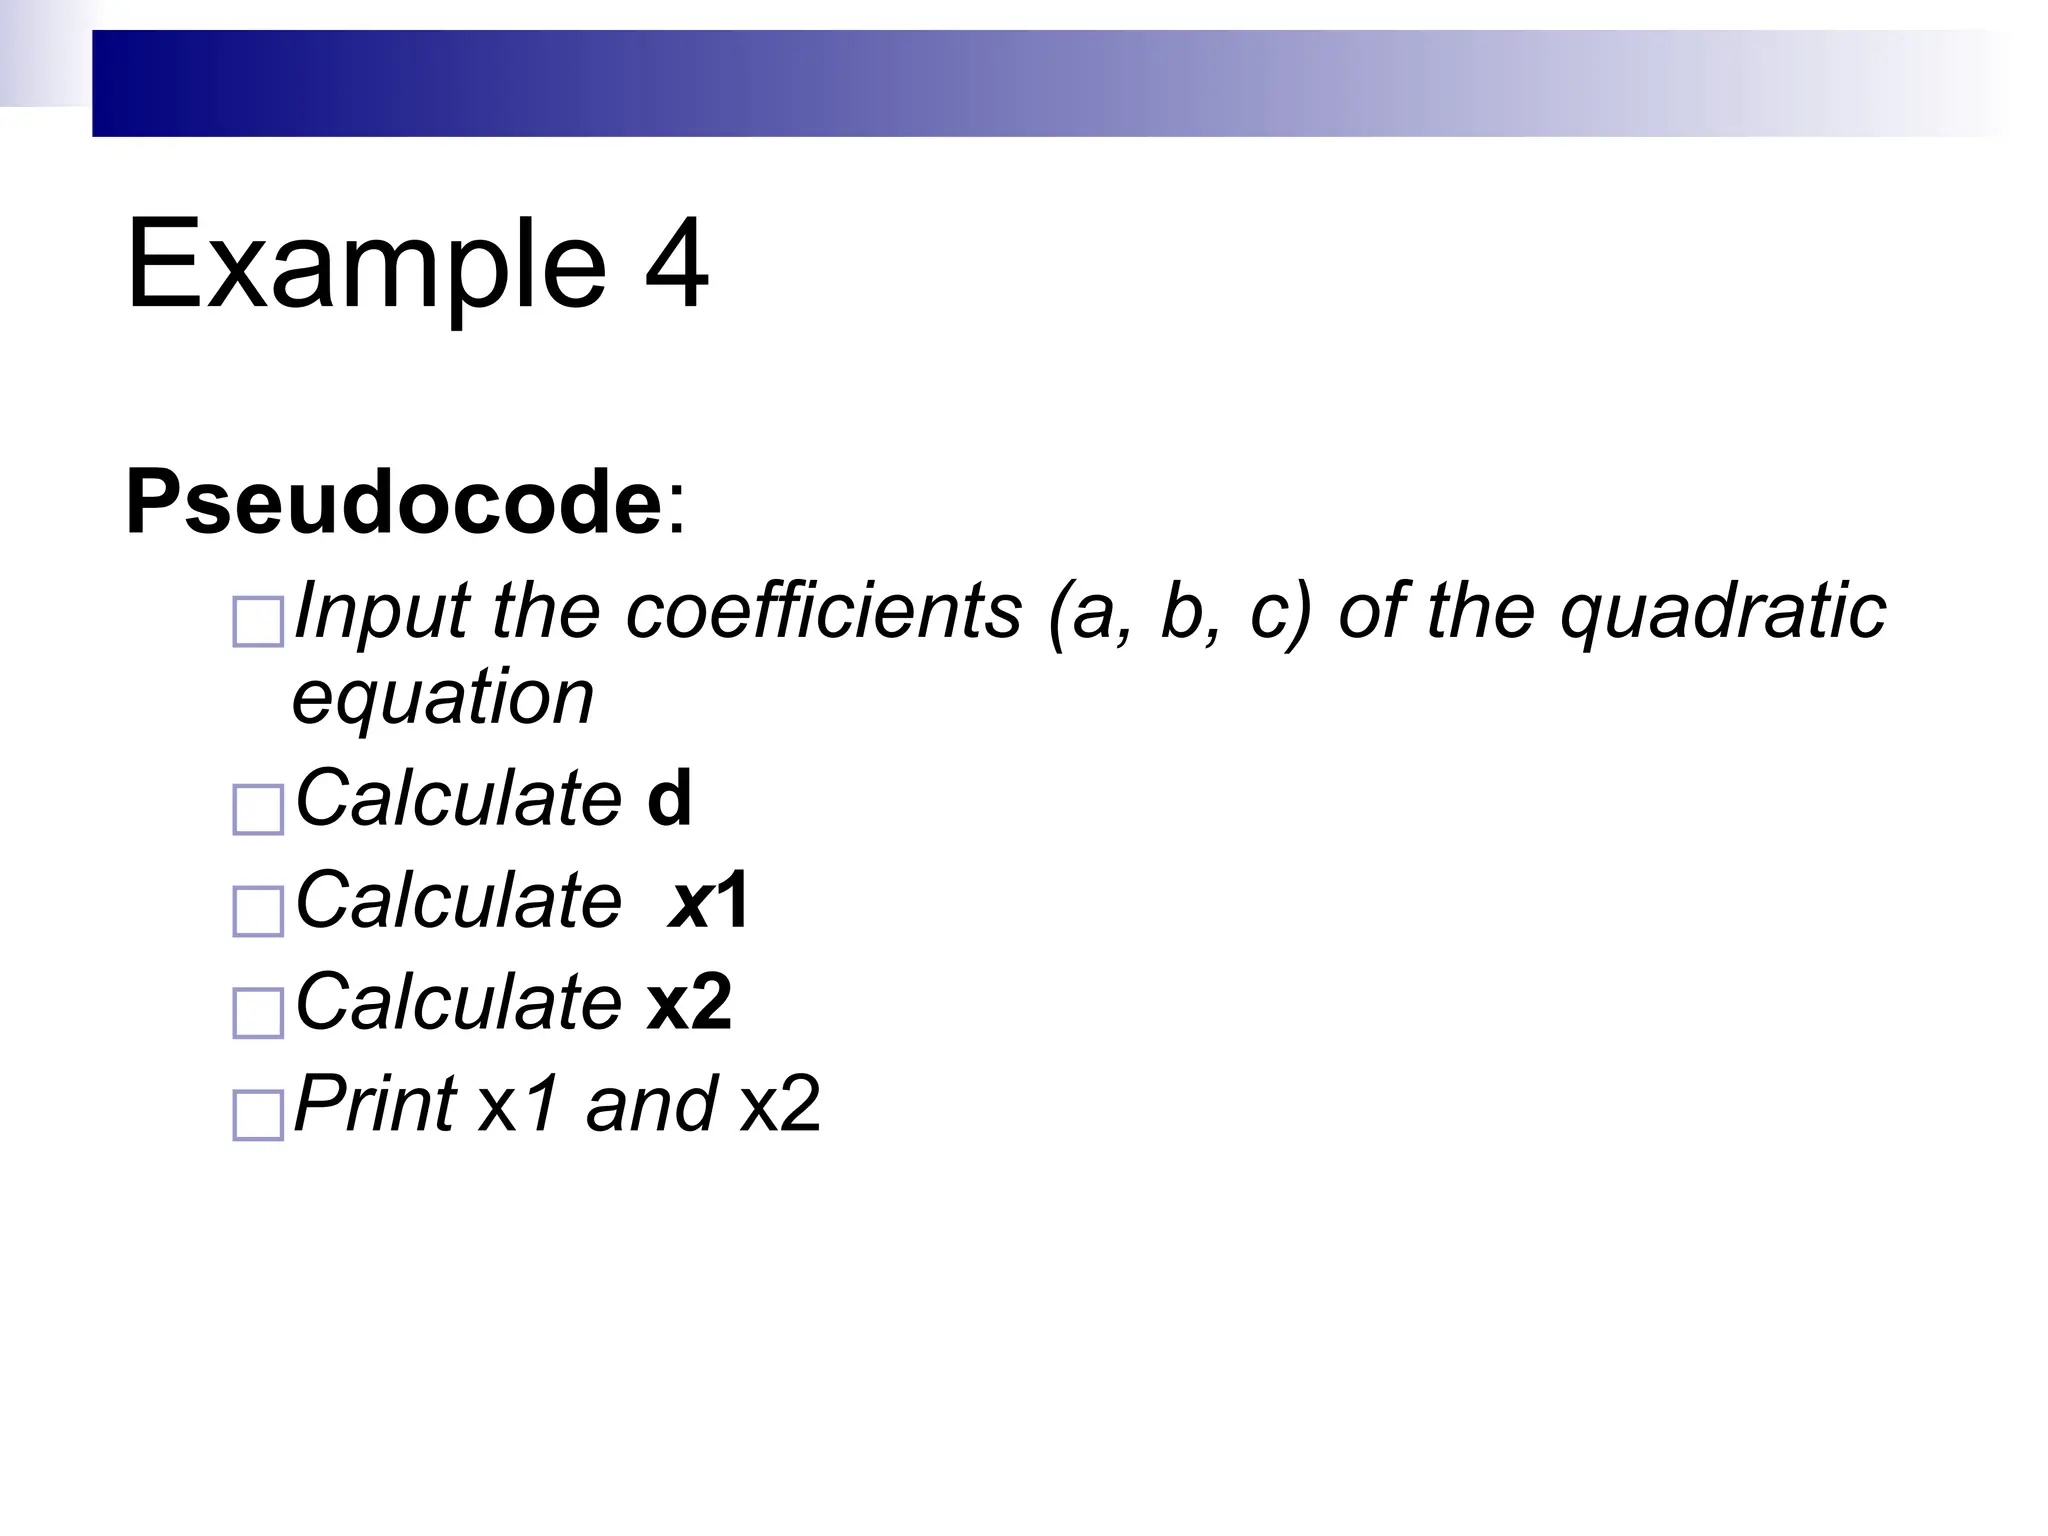
Example 4
Pseudocode:
◻Input thecoefficients (a, b, c) of the quadratic
equation
◻Calculate d
◻Calculate x1
◻Calculate x2
◻Print x1 and x2
17.
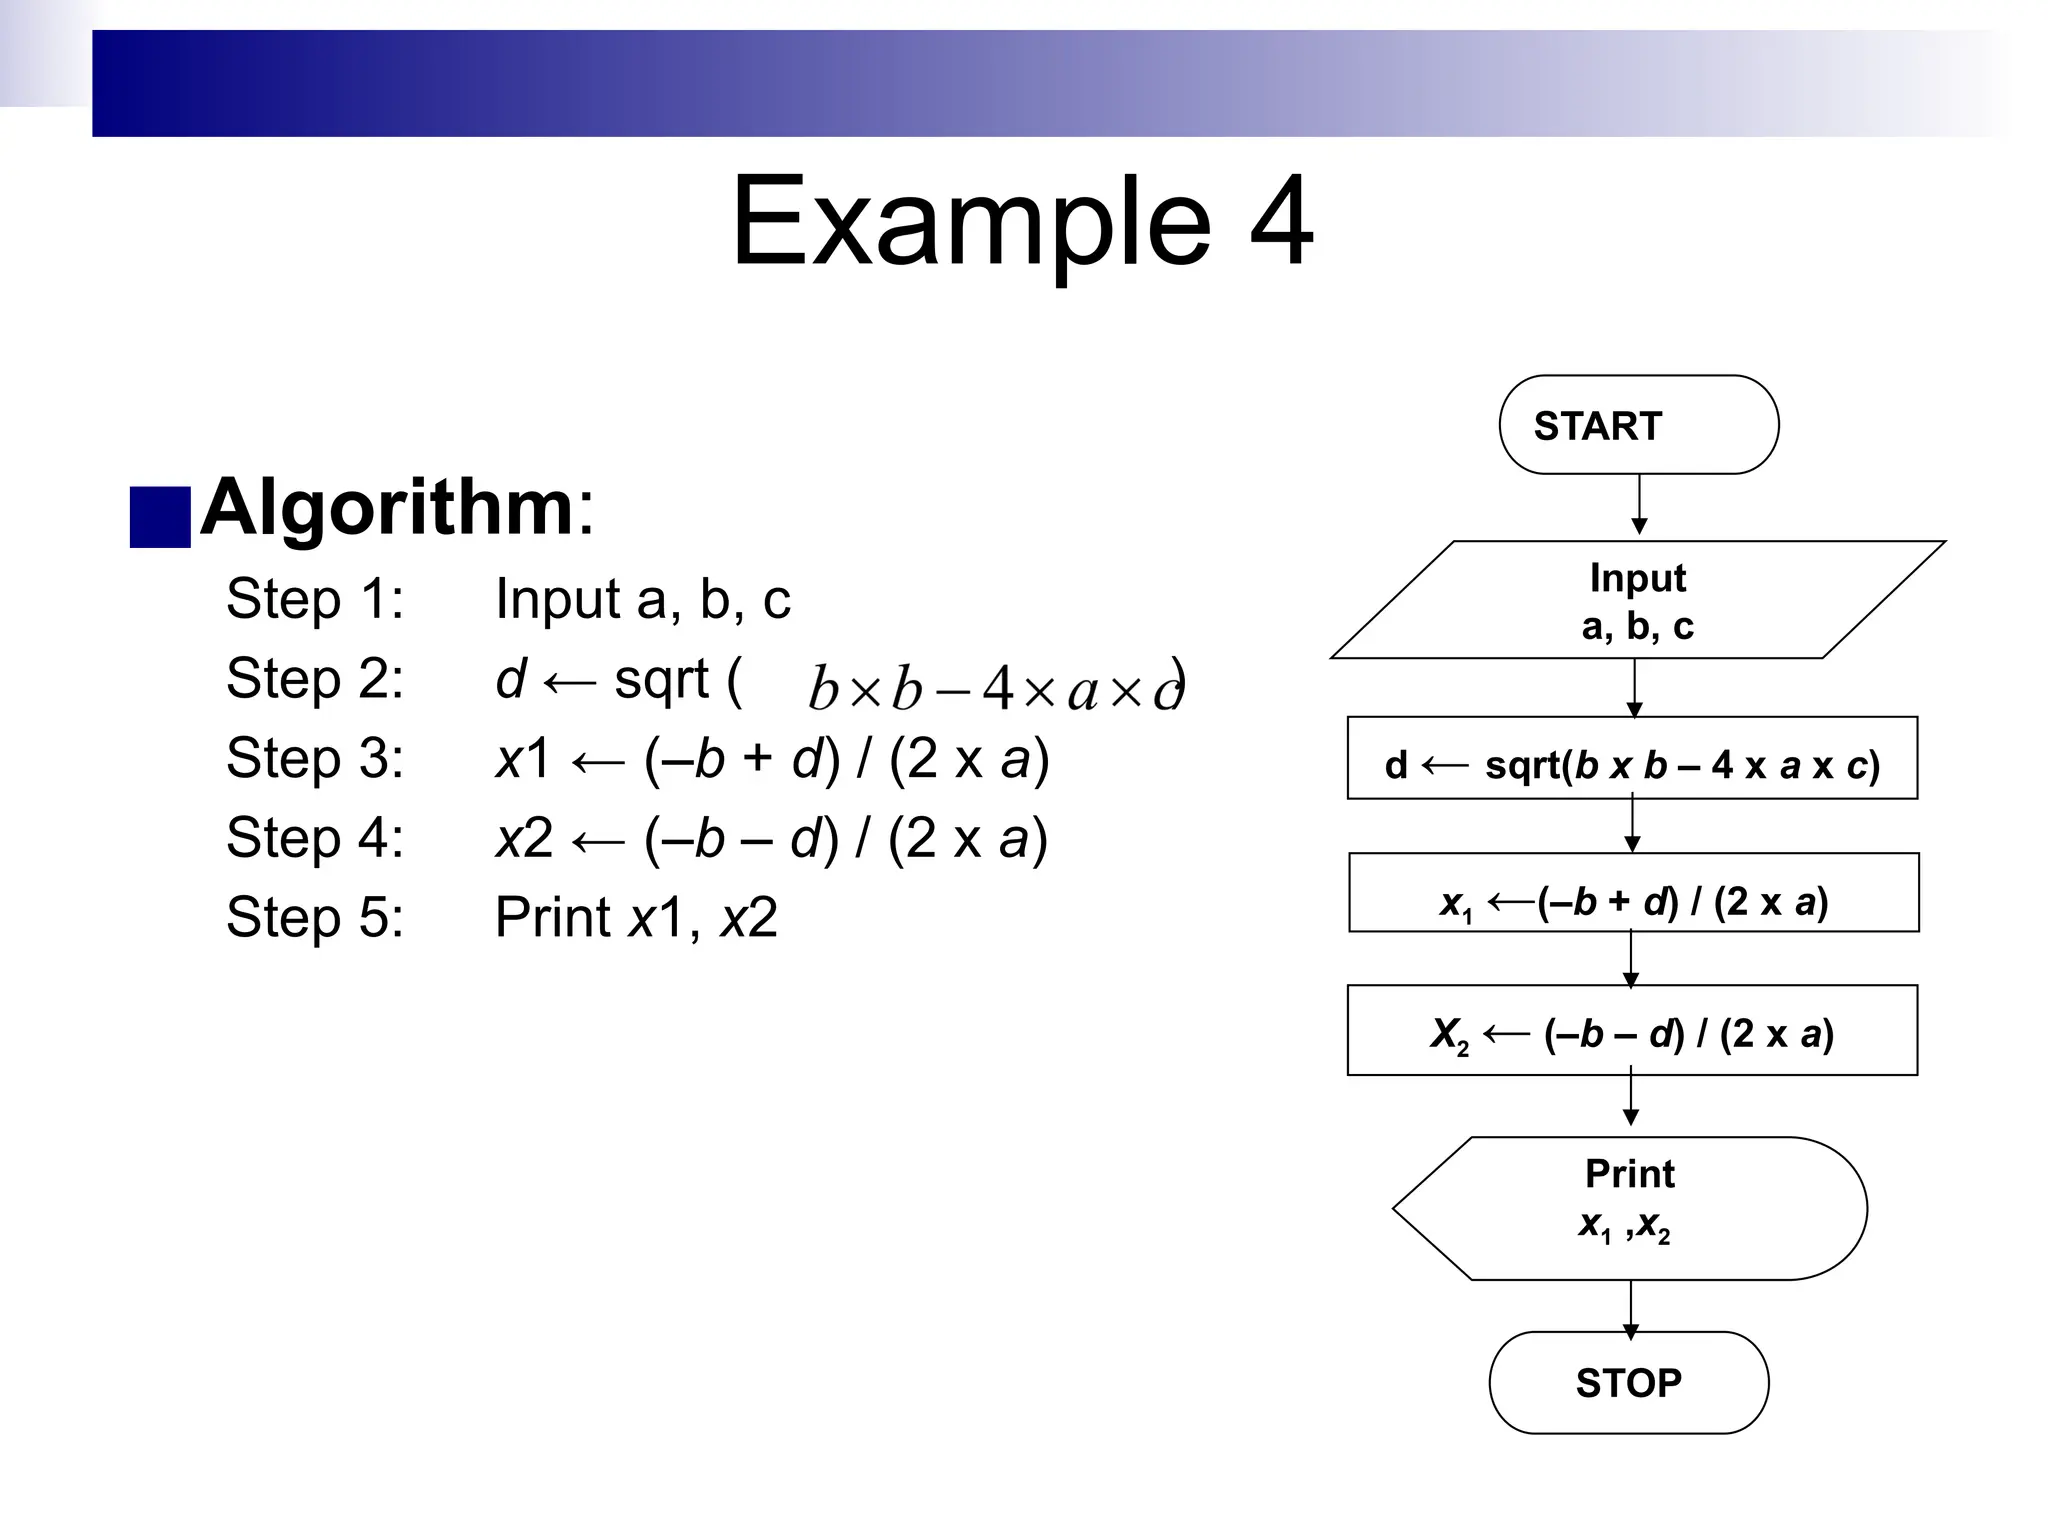
Example 4
■Algorithm:
Step 1:Input a, b, c
Step 2: d ← sqrt ( )
Step 3: x1 ← (–b + d) / (2 x a)
Step 4: x2 ← (–b – d) / (2 x a)
Step 5: Print x1, x2
START
Input
a, b, c
d ← sqrt(b x b – 4 x a x c)
Print
x1 ,x2
STOP
x1 ←(–b + d) / (2 x a)
X2 ← (–b – d) / (2 x a)
18.
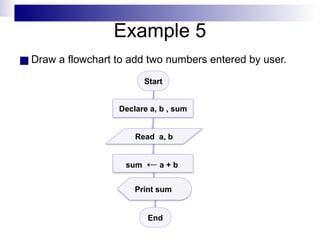
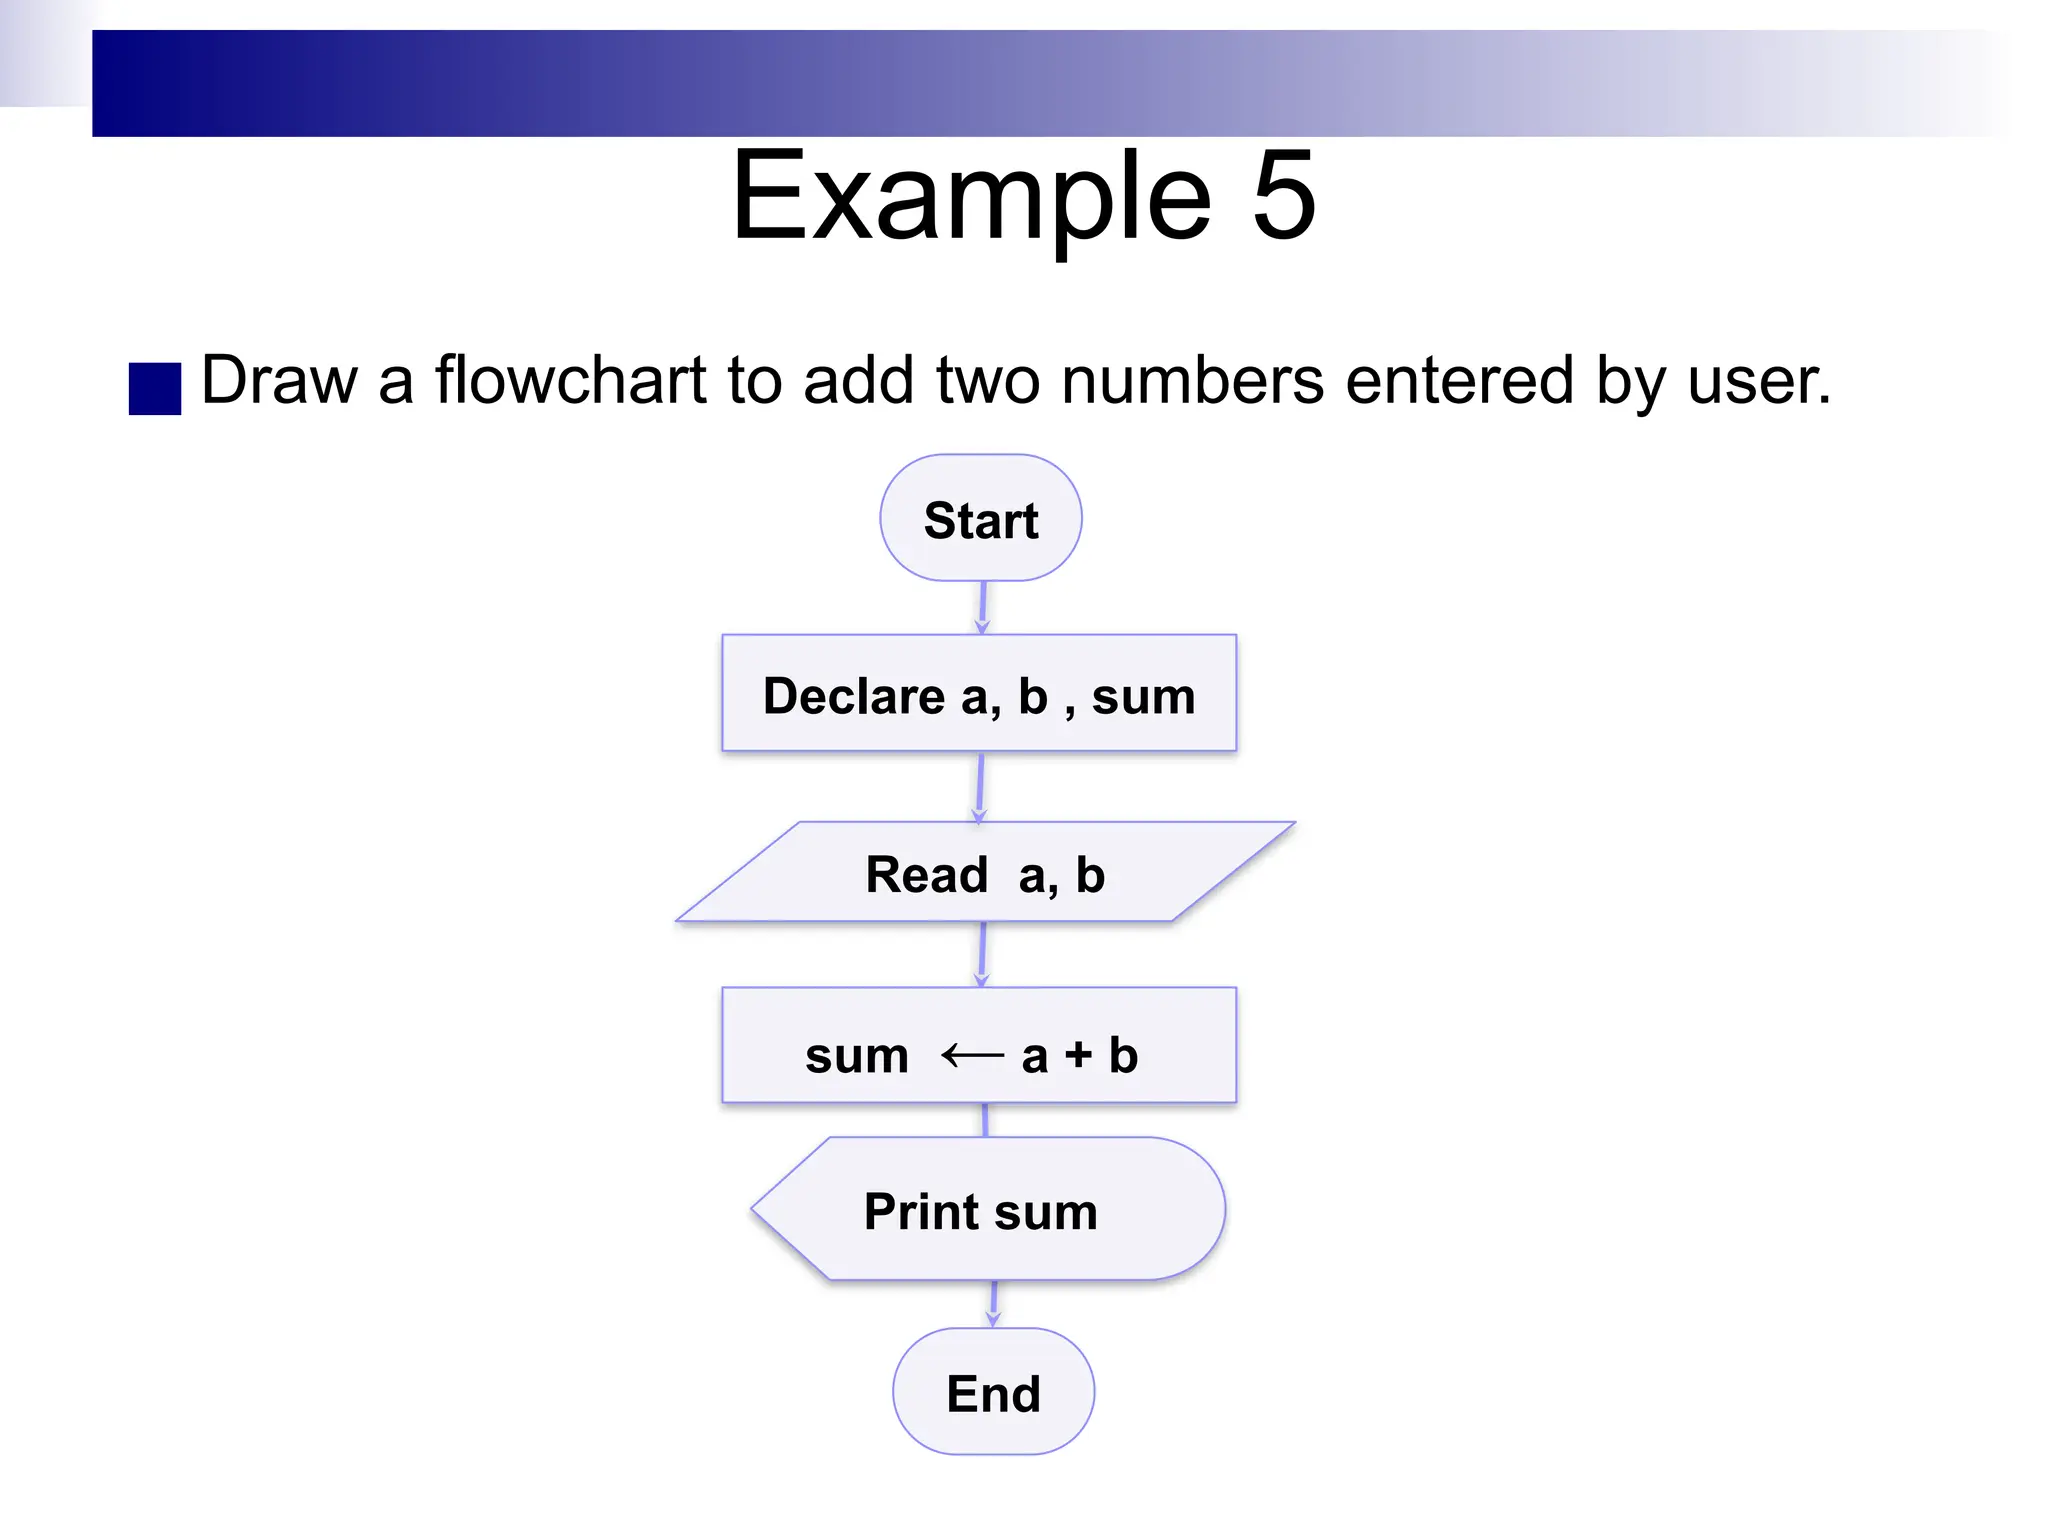
Example 5
■ Drawa flowchart to add two numbers entered by user.
Start
Read a, b
End
sum ← a + b
Declare a, b , sum
Print sum
19.
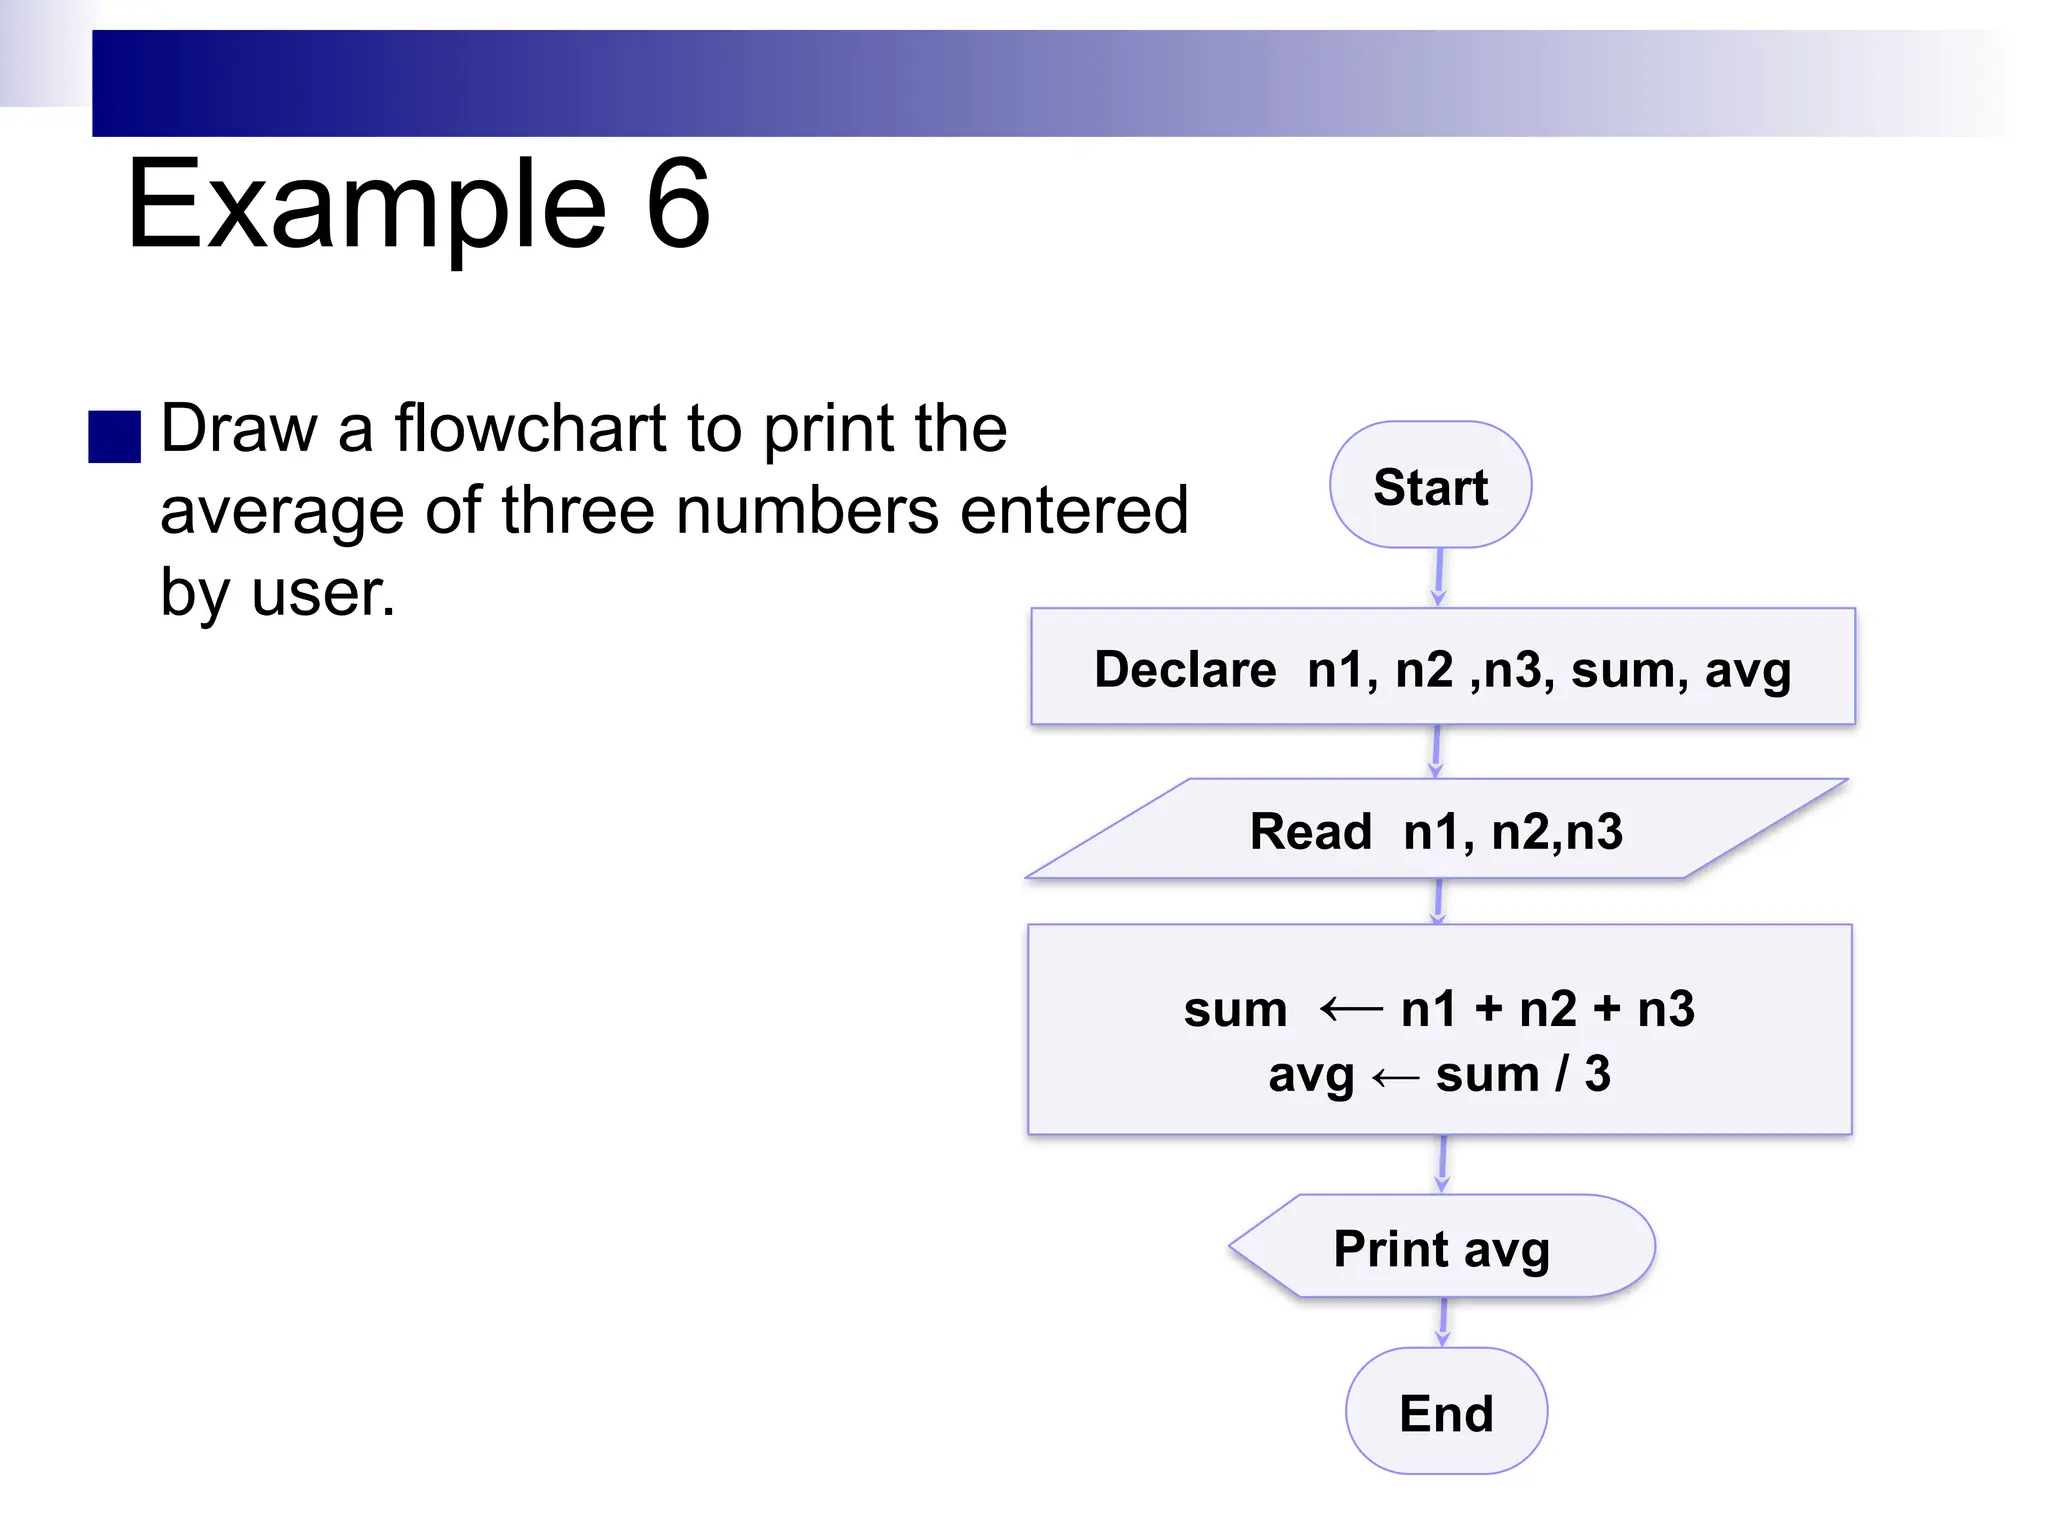
■ Draw aflowchart to print the
average of three numbers entered
by user.
Start
Read n1, n2,n3
End
sum ← n1 + n2 + n3
avg ← sum / 3
Declare n1, n2 ,n3, sum, avg
Example 6
Print avg
20.
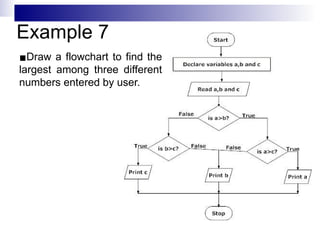
Example 7
▪Draw aflowchart to find the
largest among three different
numbers entered by user.
21.
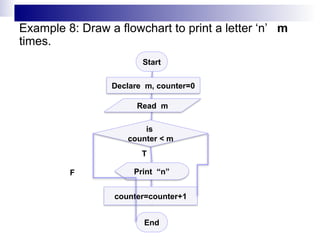
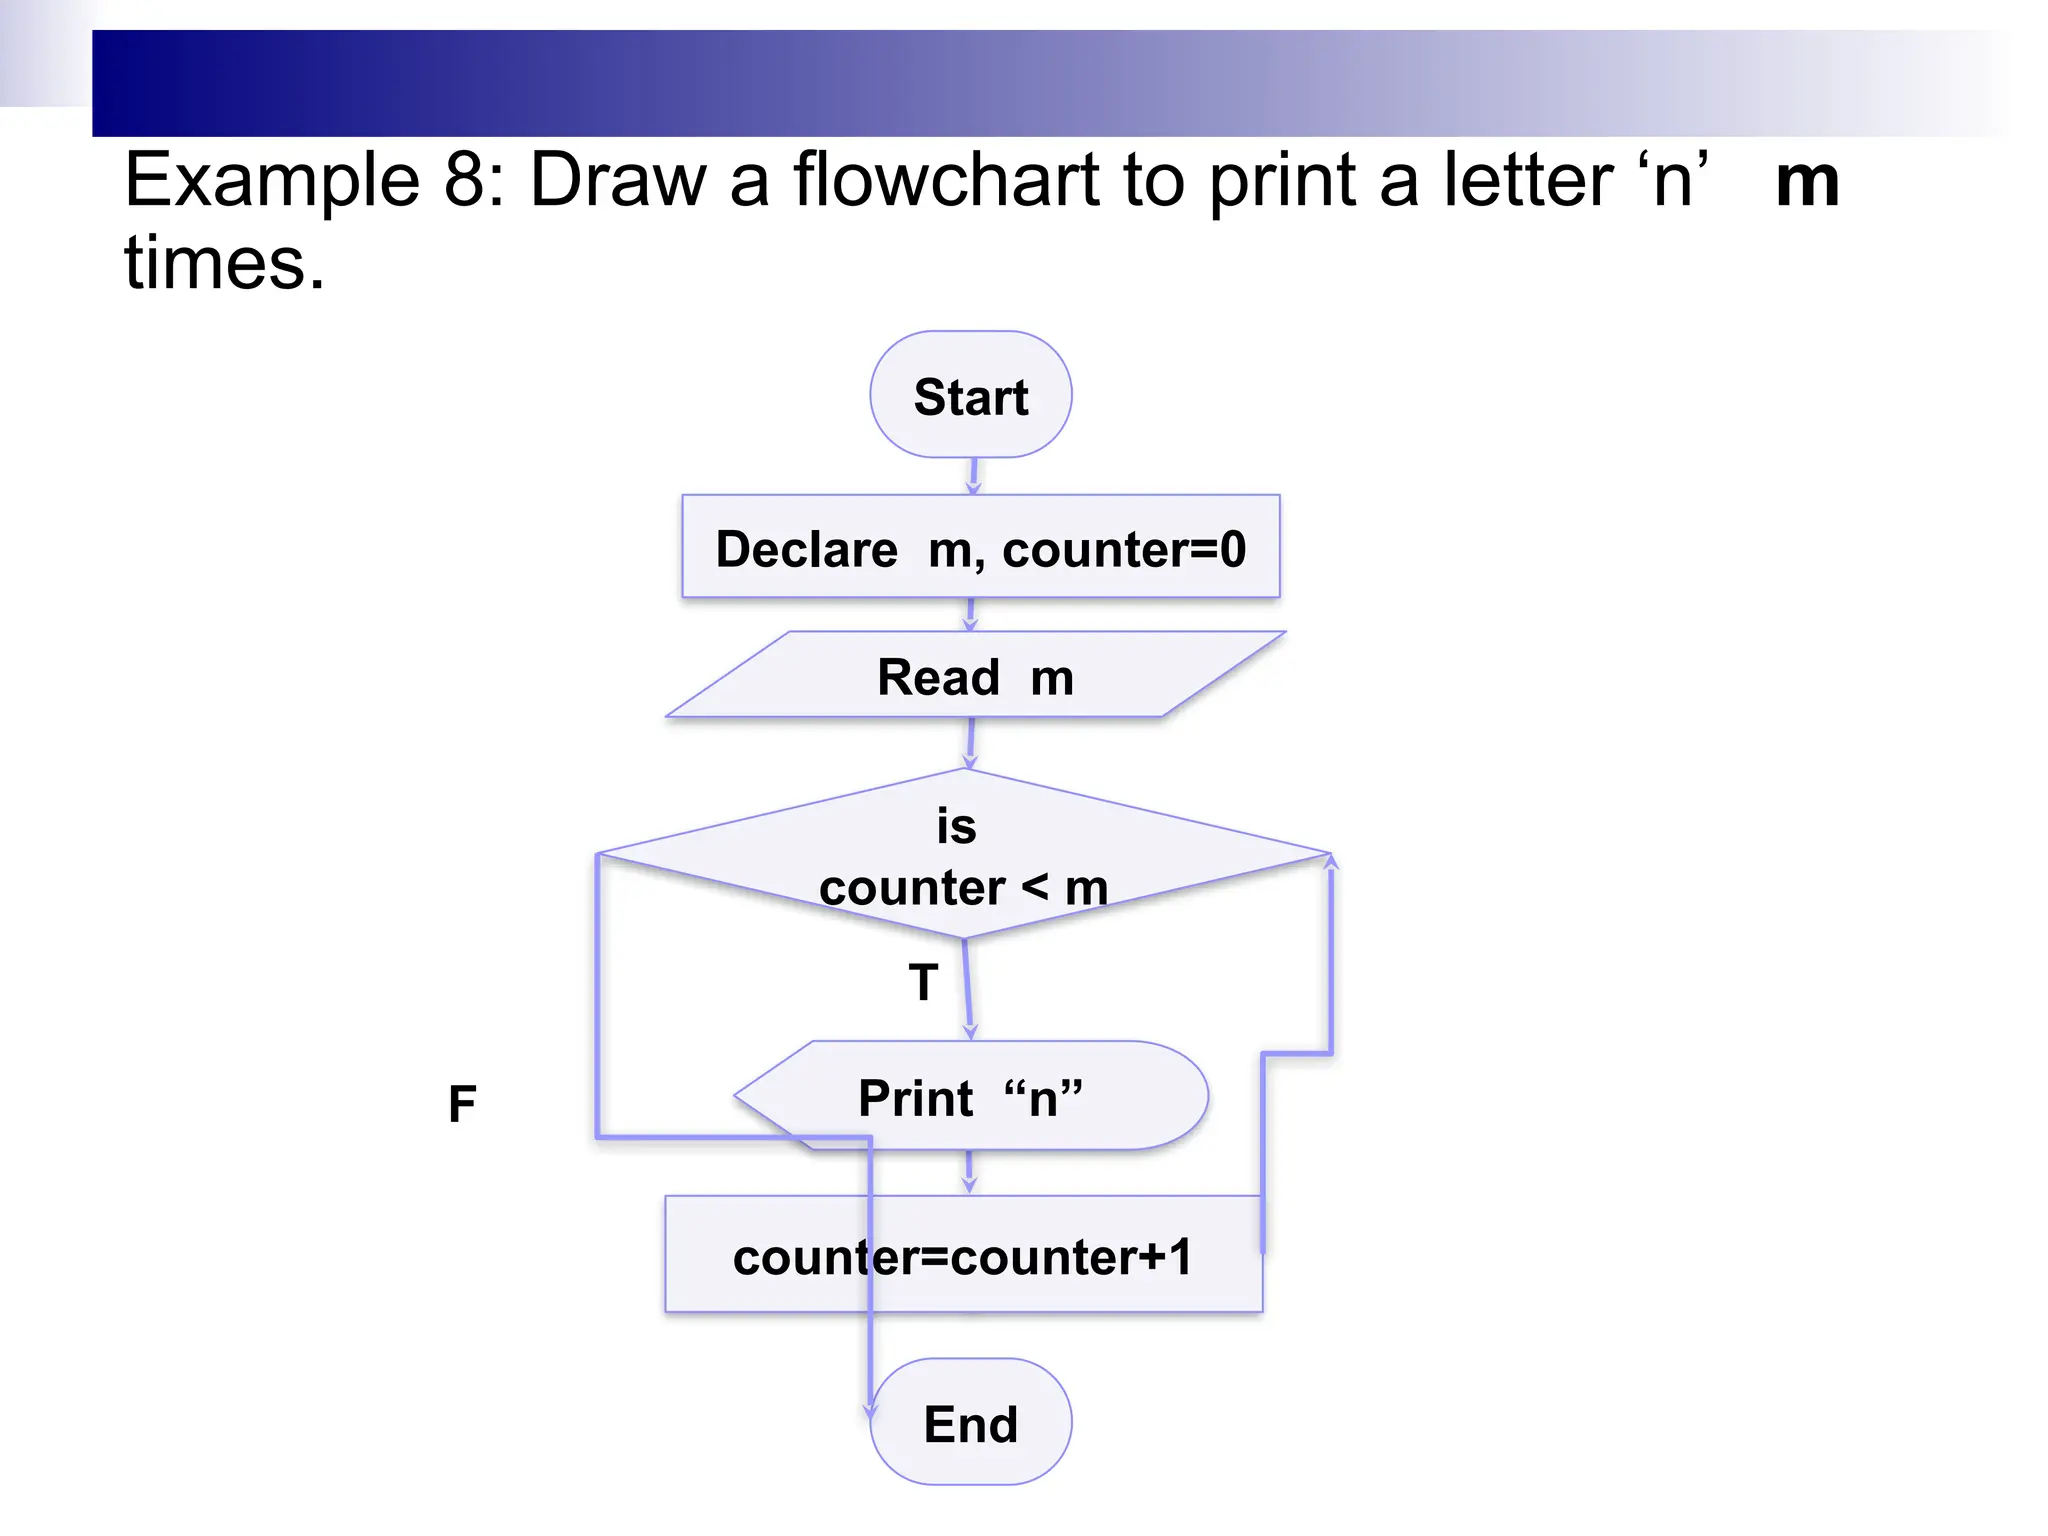
Start
Read m
End
Declare m,counter=0
Print “n”
is
counter < m
Example 8: Draw a flowchart to print a letter ‘n’ m
times.
counter=counter+1
F
T
22.
Algorithm and PseudoCode
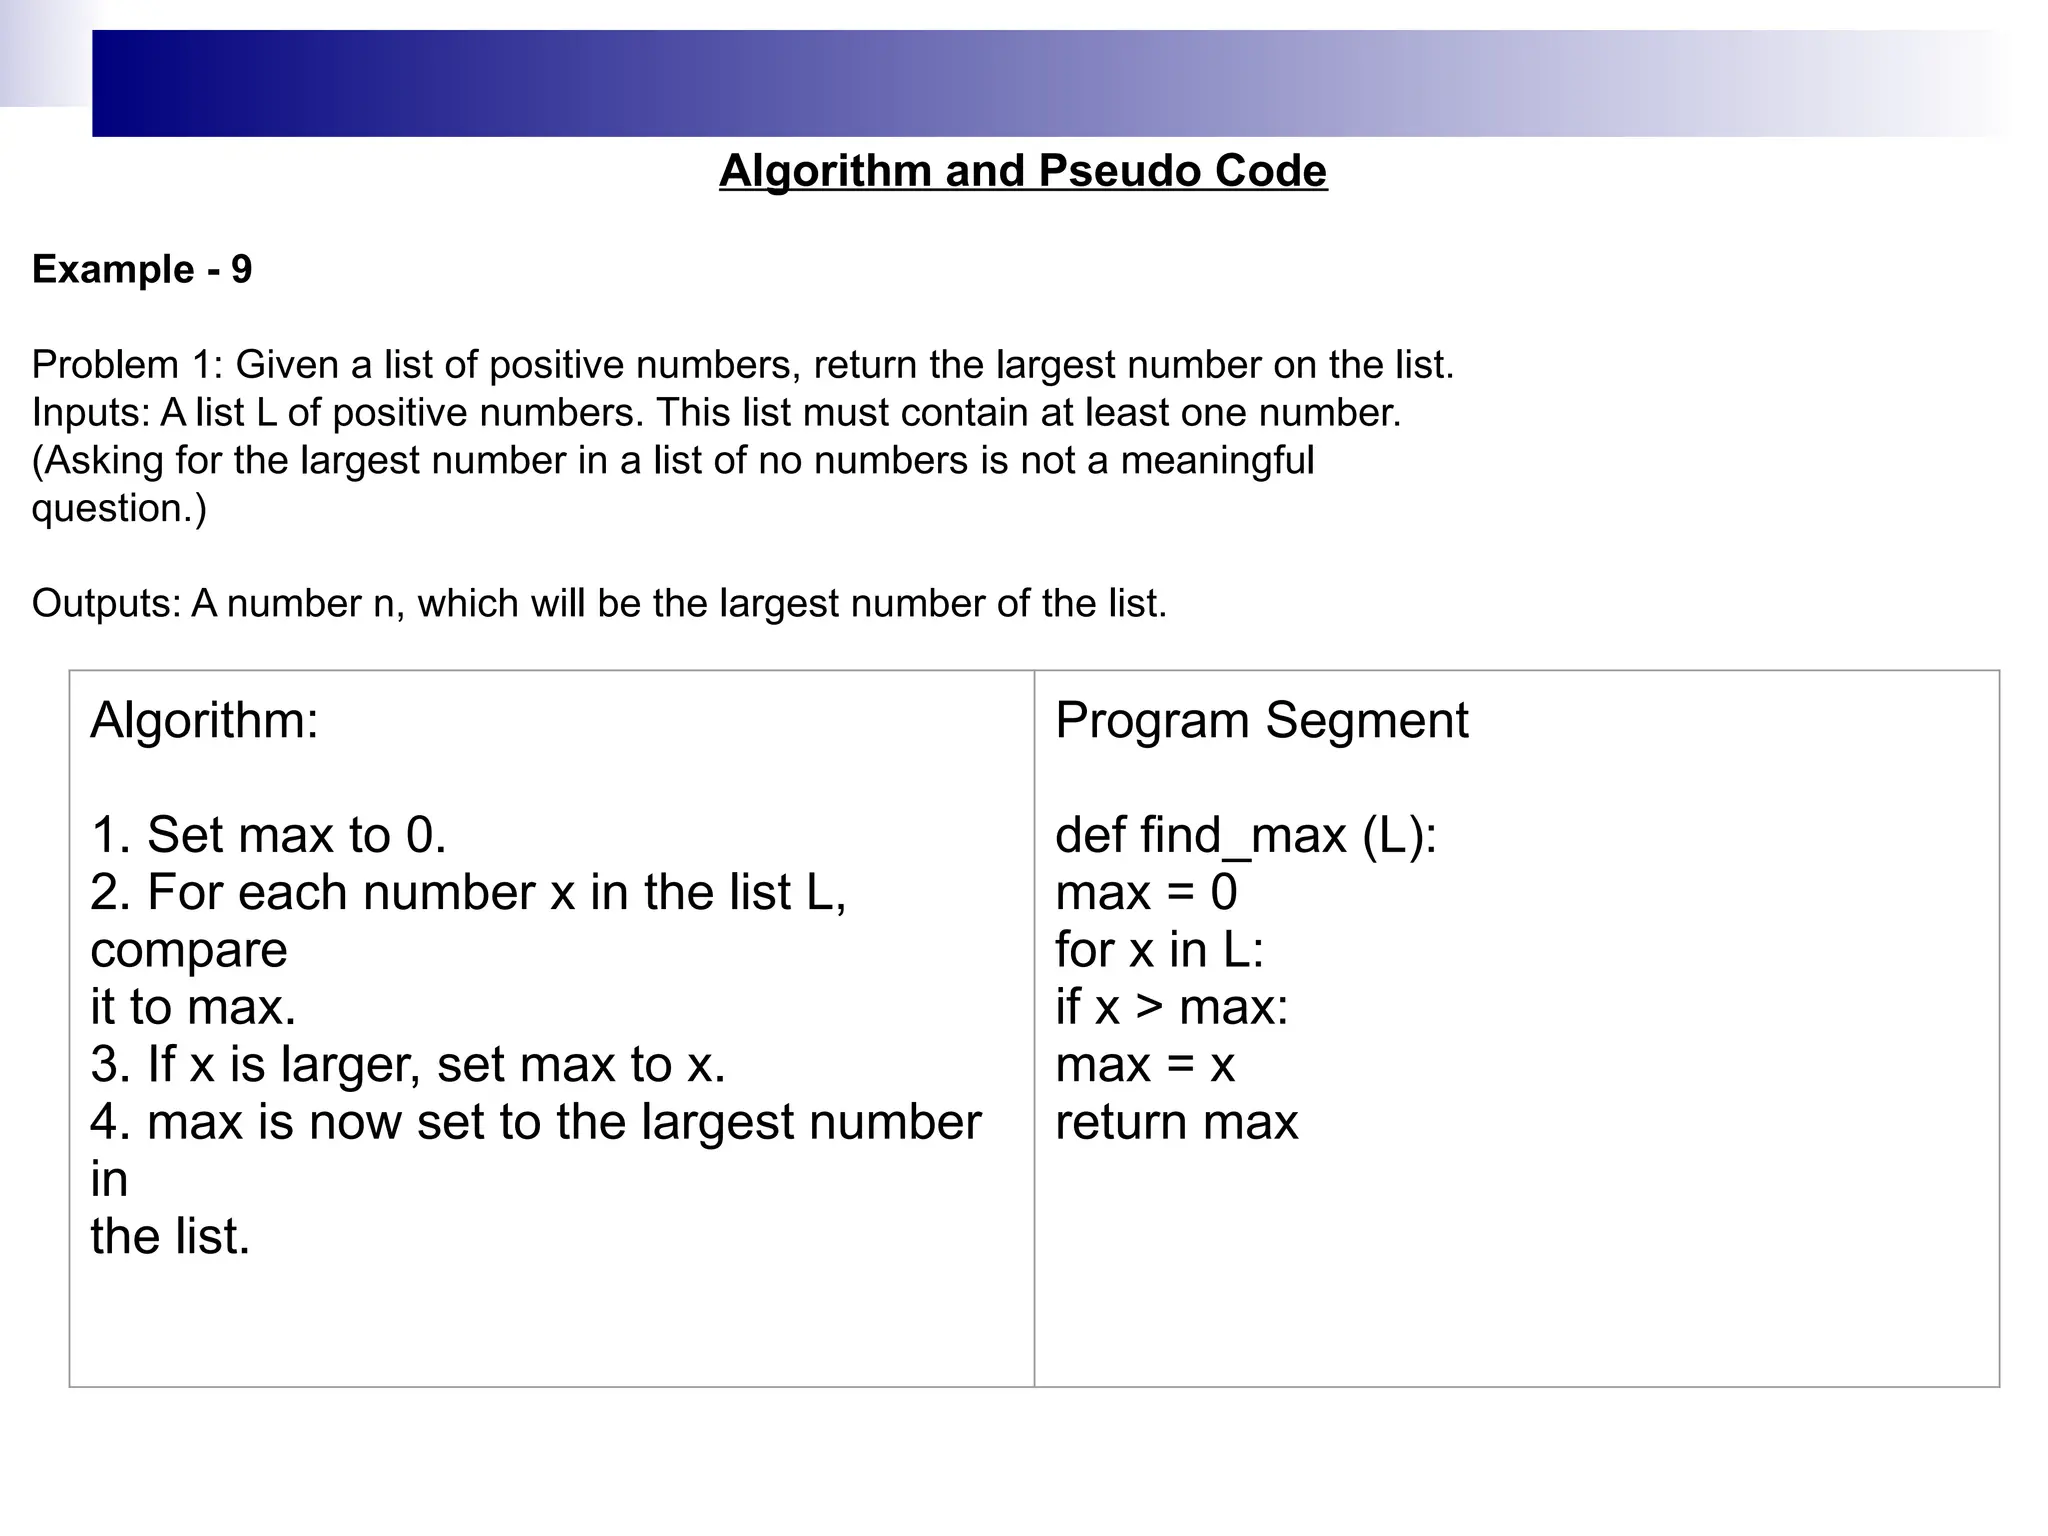
Example - 9
Problem 1: Given a list of positive numbers, return the largest number on the list.
Inputs: A list L of positive numbers. This list must contain at least one number.
(Asking for the largest number in a list of no numbers is not a meaningful
question.)
Outputs: A number n, which will be the largest number of the list.
Algorithm:
1. Set max to 0.
2. For each number x in the list L,
compare
it to max.
3. If x is larger, set max to x.
4. max is now set to the largest number
in
the list.
Program Segment
def find_max (L):
max = 0
for x in L:
if x > max:
max = x
return max
23.
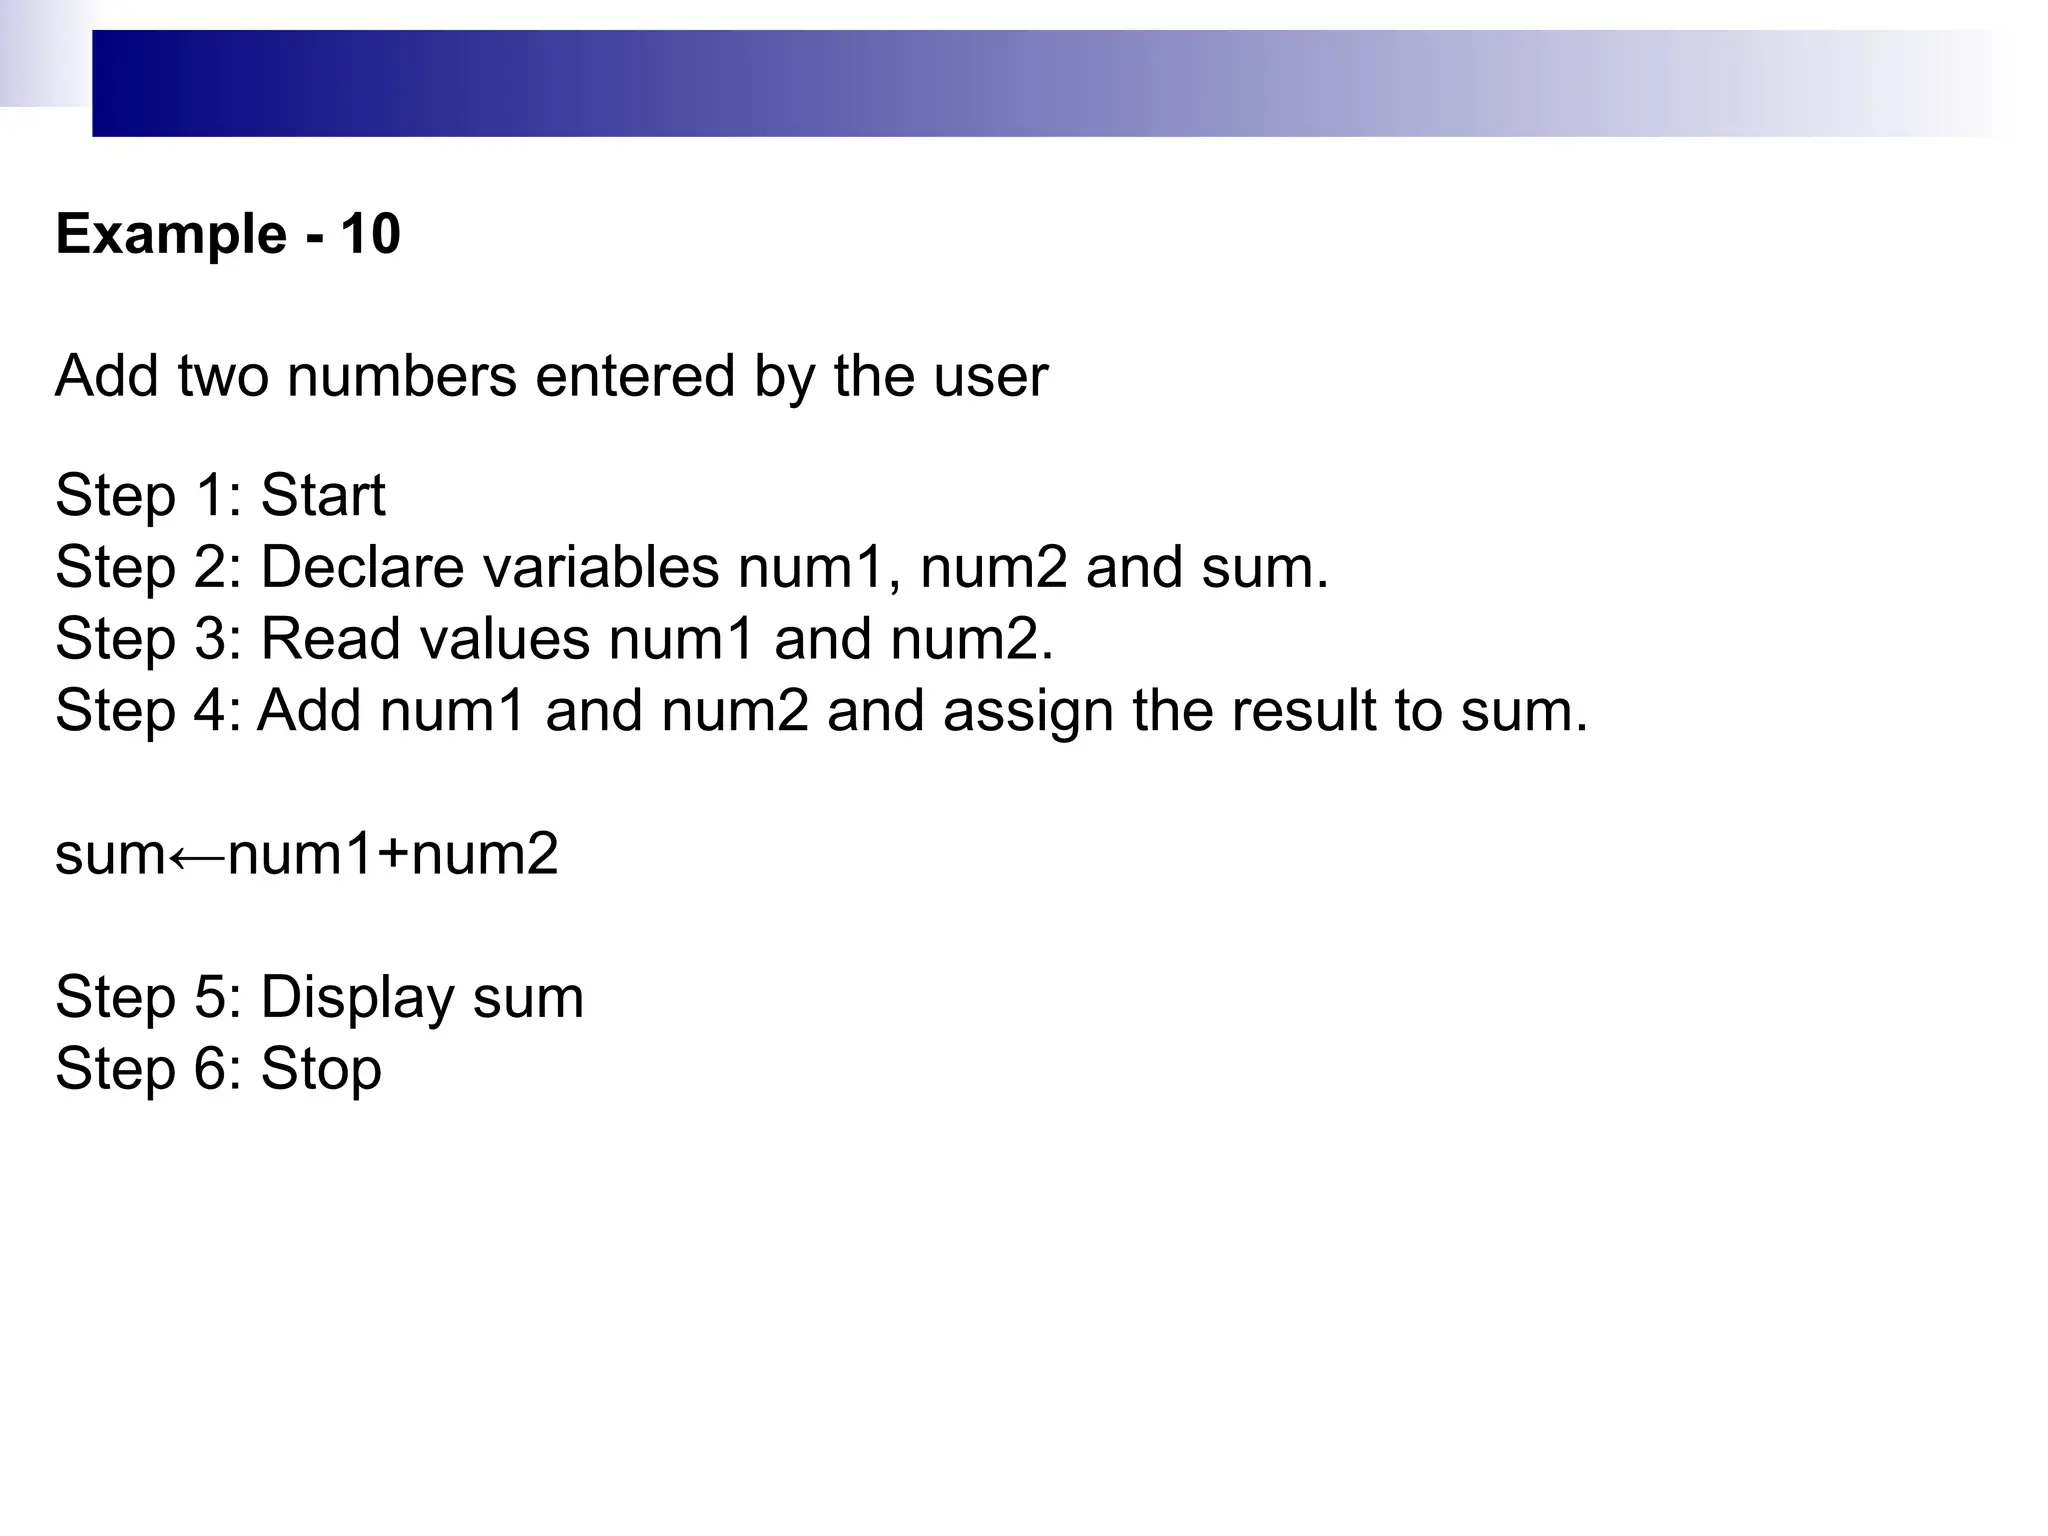
Example - 10
Addtwo numbers entered by the user
Step 1: Start
Step 2: Declare variables num1, num2 and sum.
Step 3: Read values num1 and num2.
Step 4: Add num1 and num2 and assign the result to sum.
sum←num1+num2
Step 5: Display sum
Step 6: Stop
24.
Example - 11
Findthe largest number among three numbers
Step 1: Start
Step 2: Declare variables a, b and c.
Step 3: Read variables a, b and c.
Step 4: If a > b If a > c
Display a is the largest number.
Else
Display c is the largest number.
Else
If b > c
Display b is the largest number.
Else
Display c is the greatest number.
Step 5: Stop
25.
Example - 12
Findthe largest number among three numbers
Step 1: Start
Step 2: Declare variables a, b and c.
Step 3: Read variables a, b and c.
Step 4: If a > b If a > c
Display a is the largest number.
Else
Display c is the largest number.
Else
If b > c
Display b is the largest number.
Else
Display c is the greatest number.
Step 5: Stop
26.
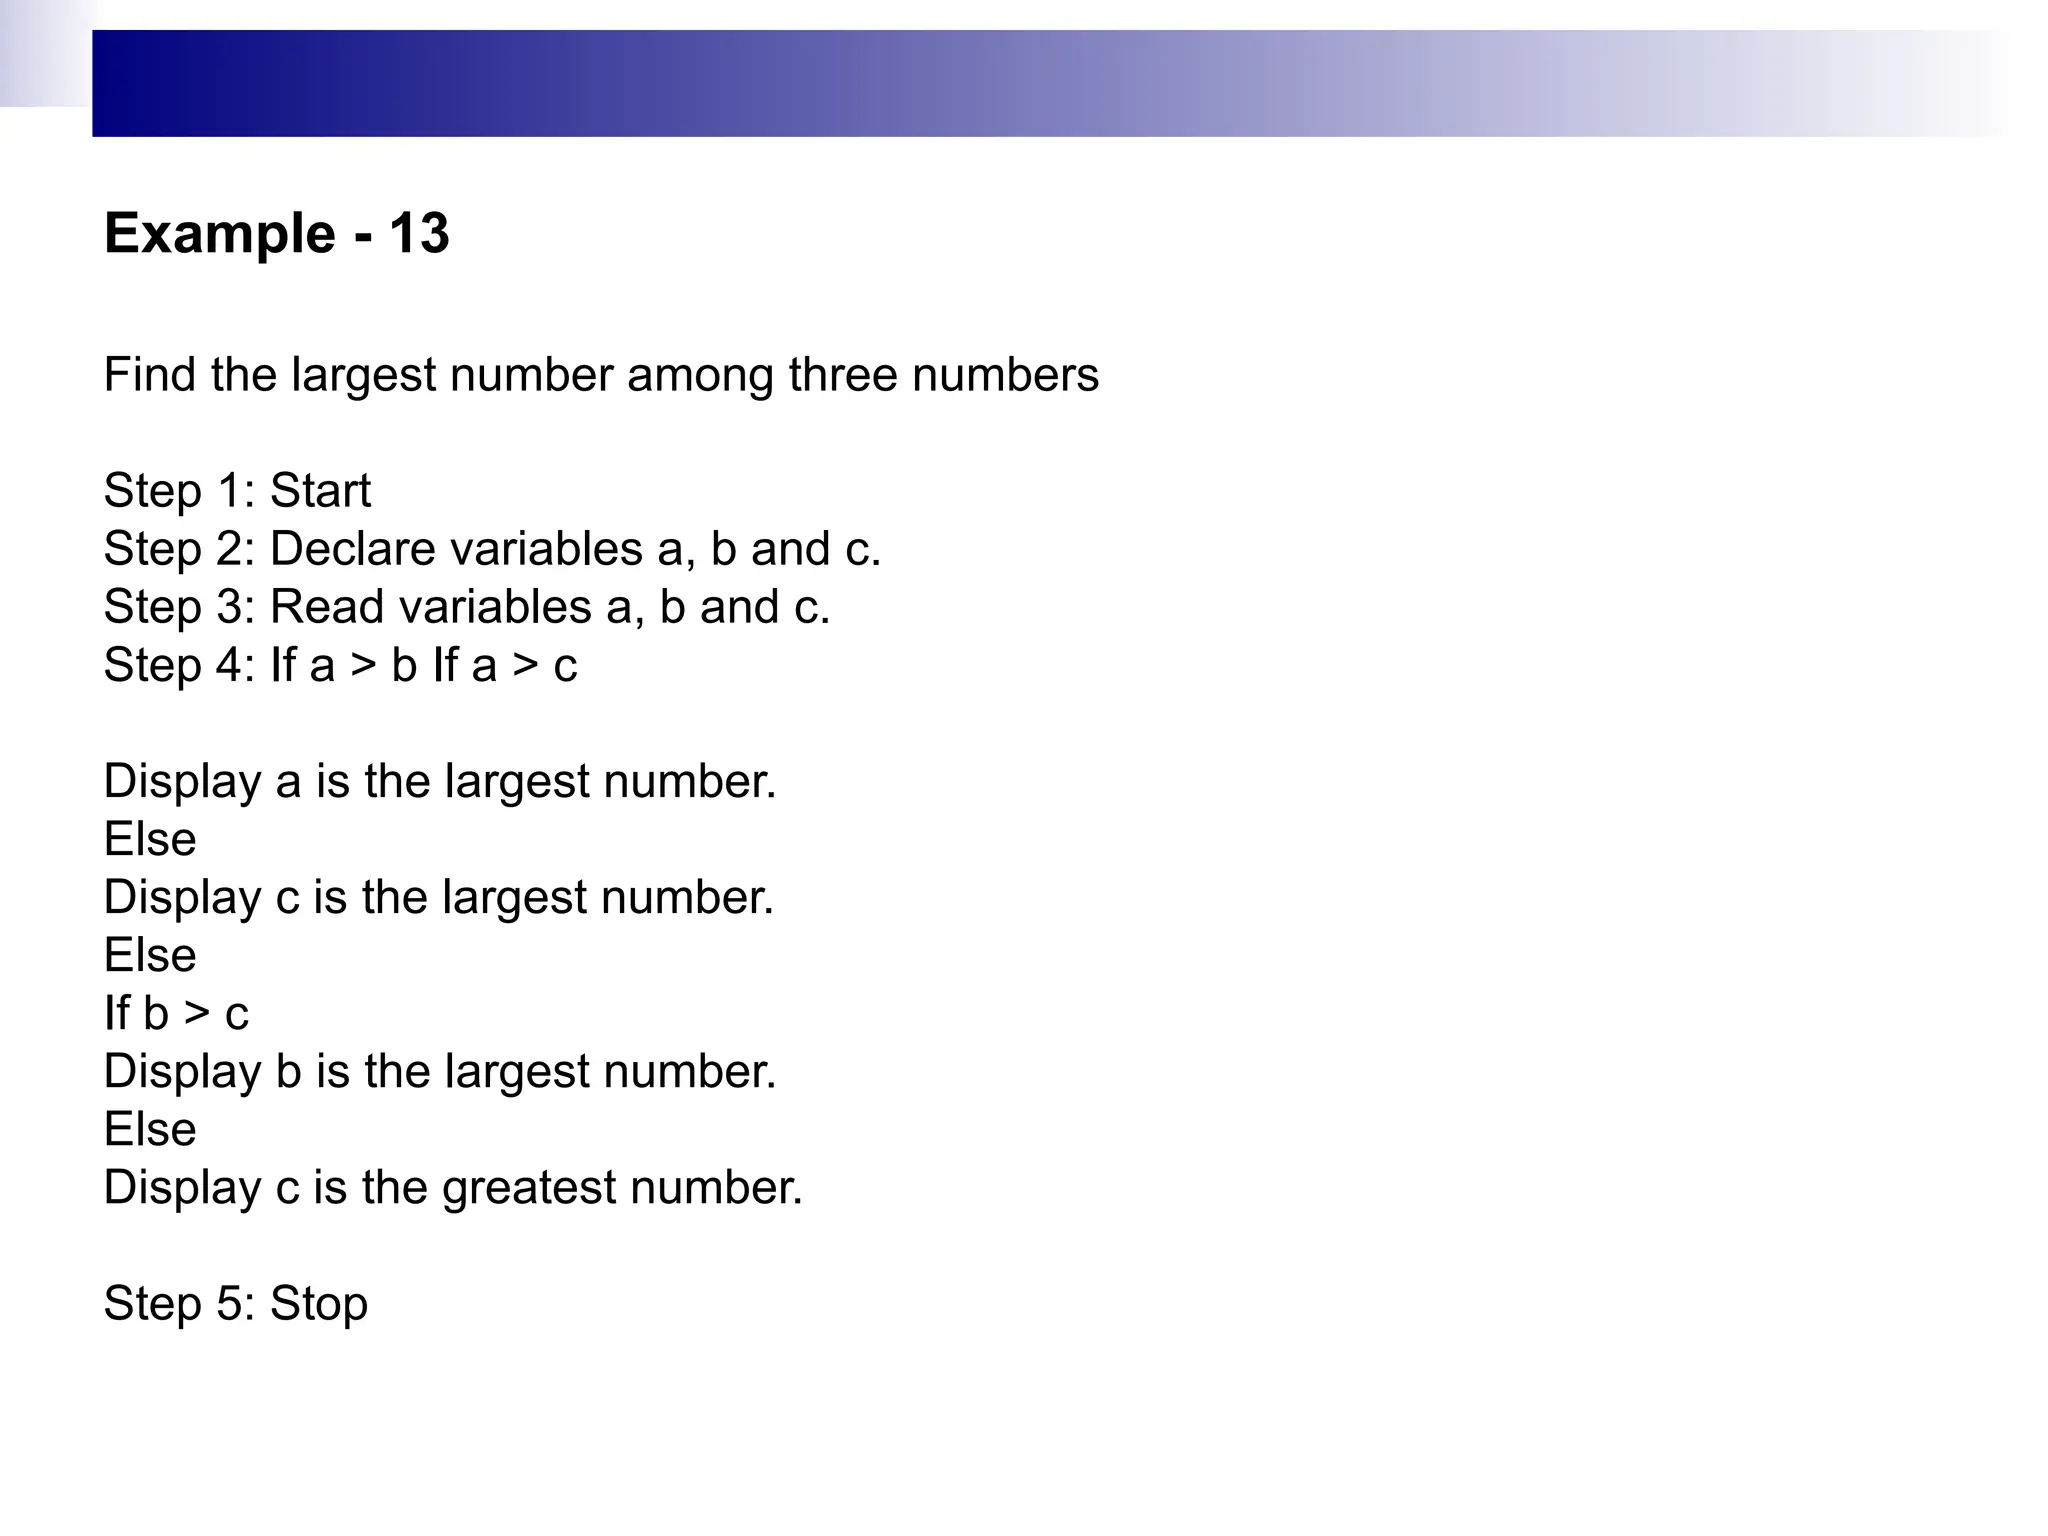
Example - 13
Findthe largest number among three numbers
Step 1: Start
Step 2: Declare variables a, b and c.
Step 3: Read variables a, b and c.
Step 4: If a > b If a > c
Display a is the largest number.
Else
Display c is the largest number.
Else
If b > c
Display b is the largest number.
Else
Display c is the greatest number.
Step 5: Stop
27.
Example - 14
Findthe largest number among three numbers
Step 1: Start
Step 2: Declare variables a, b and c.
Step 3: Read variables a, b and c.
Step 4: If a > b If a > c
Display a is the largest number.
Else
Display c is the largest number.
Else
If b > c
Display b is the largest number.
Else
Display c is the greatest number.
Step 5: Stop
28.
Example - 15
Findthe largest number among three numbers
Step 1: Start
Step 2: Declare variables a, b and c.
Step 3: Read variables a, b and c.
Step 4: If a > b If a > c
Display a is the largest number.
Else
Display c is the largest number.
Else
If b > c
Display b is the largest number.
Else
Display c is the greatest number.
Step 5: Stop