This document discusses Linux kernel debugging. It provides an overview of debugging techniques including collecting system information, handling failures, and using printk(), KGDB, and debuggers. Key points covered are the components of a debugger, how KGDB can be used with gdb to debug interactively, analyzing crash data, and some debugging tricks and print functions.


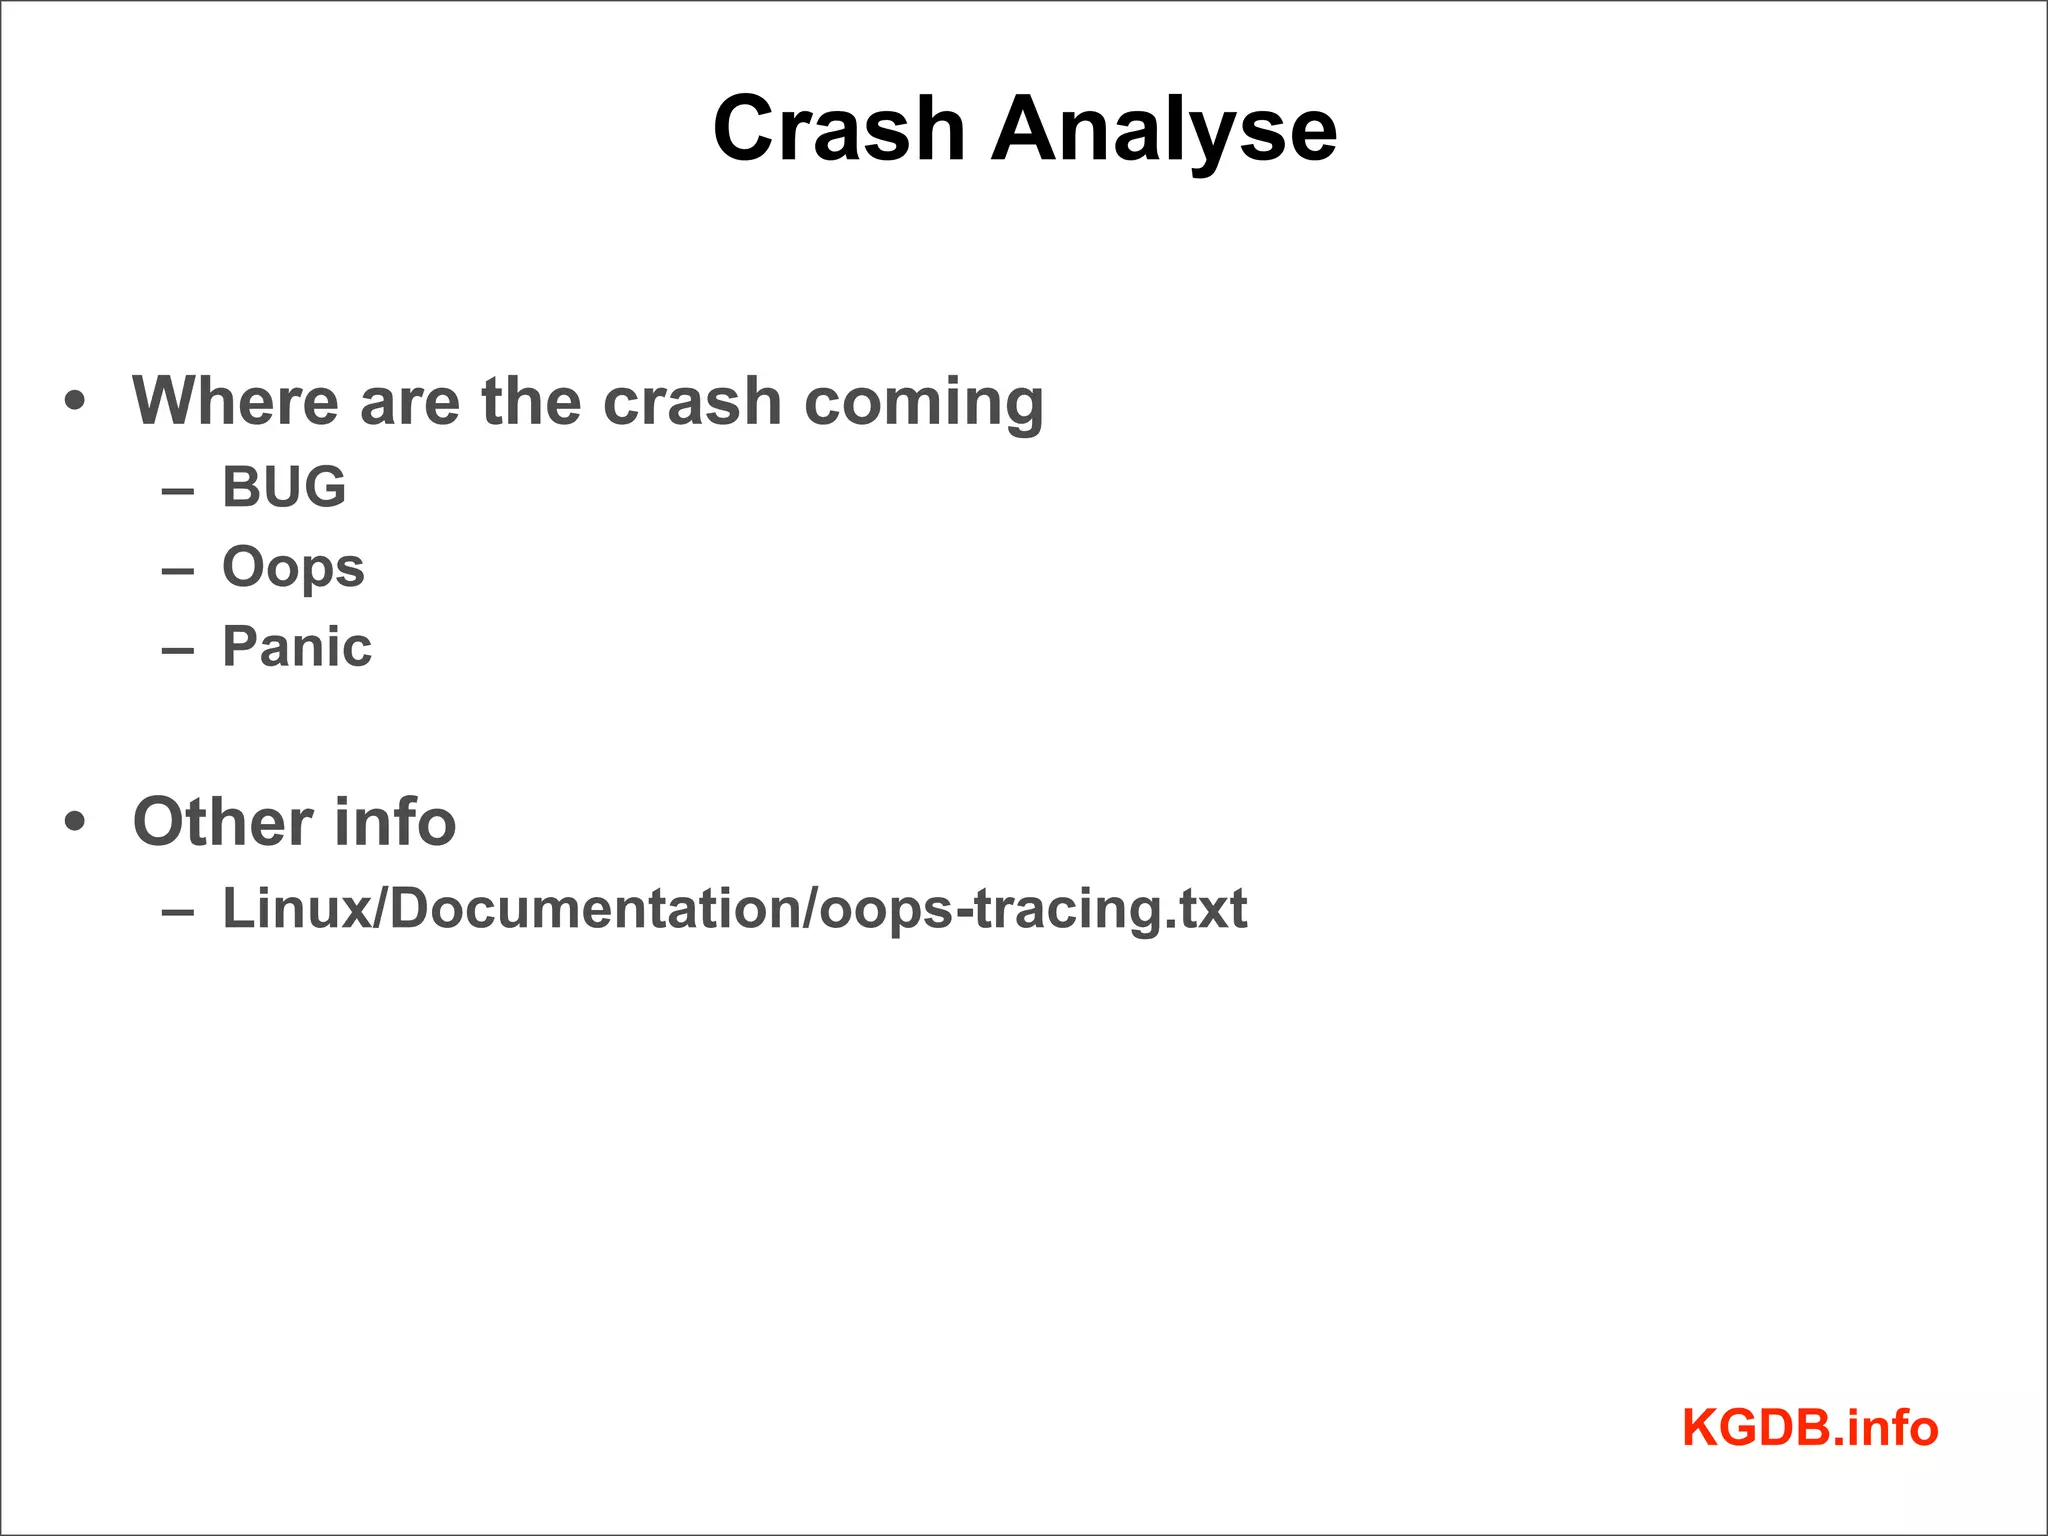
![Crash Analyse
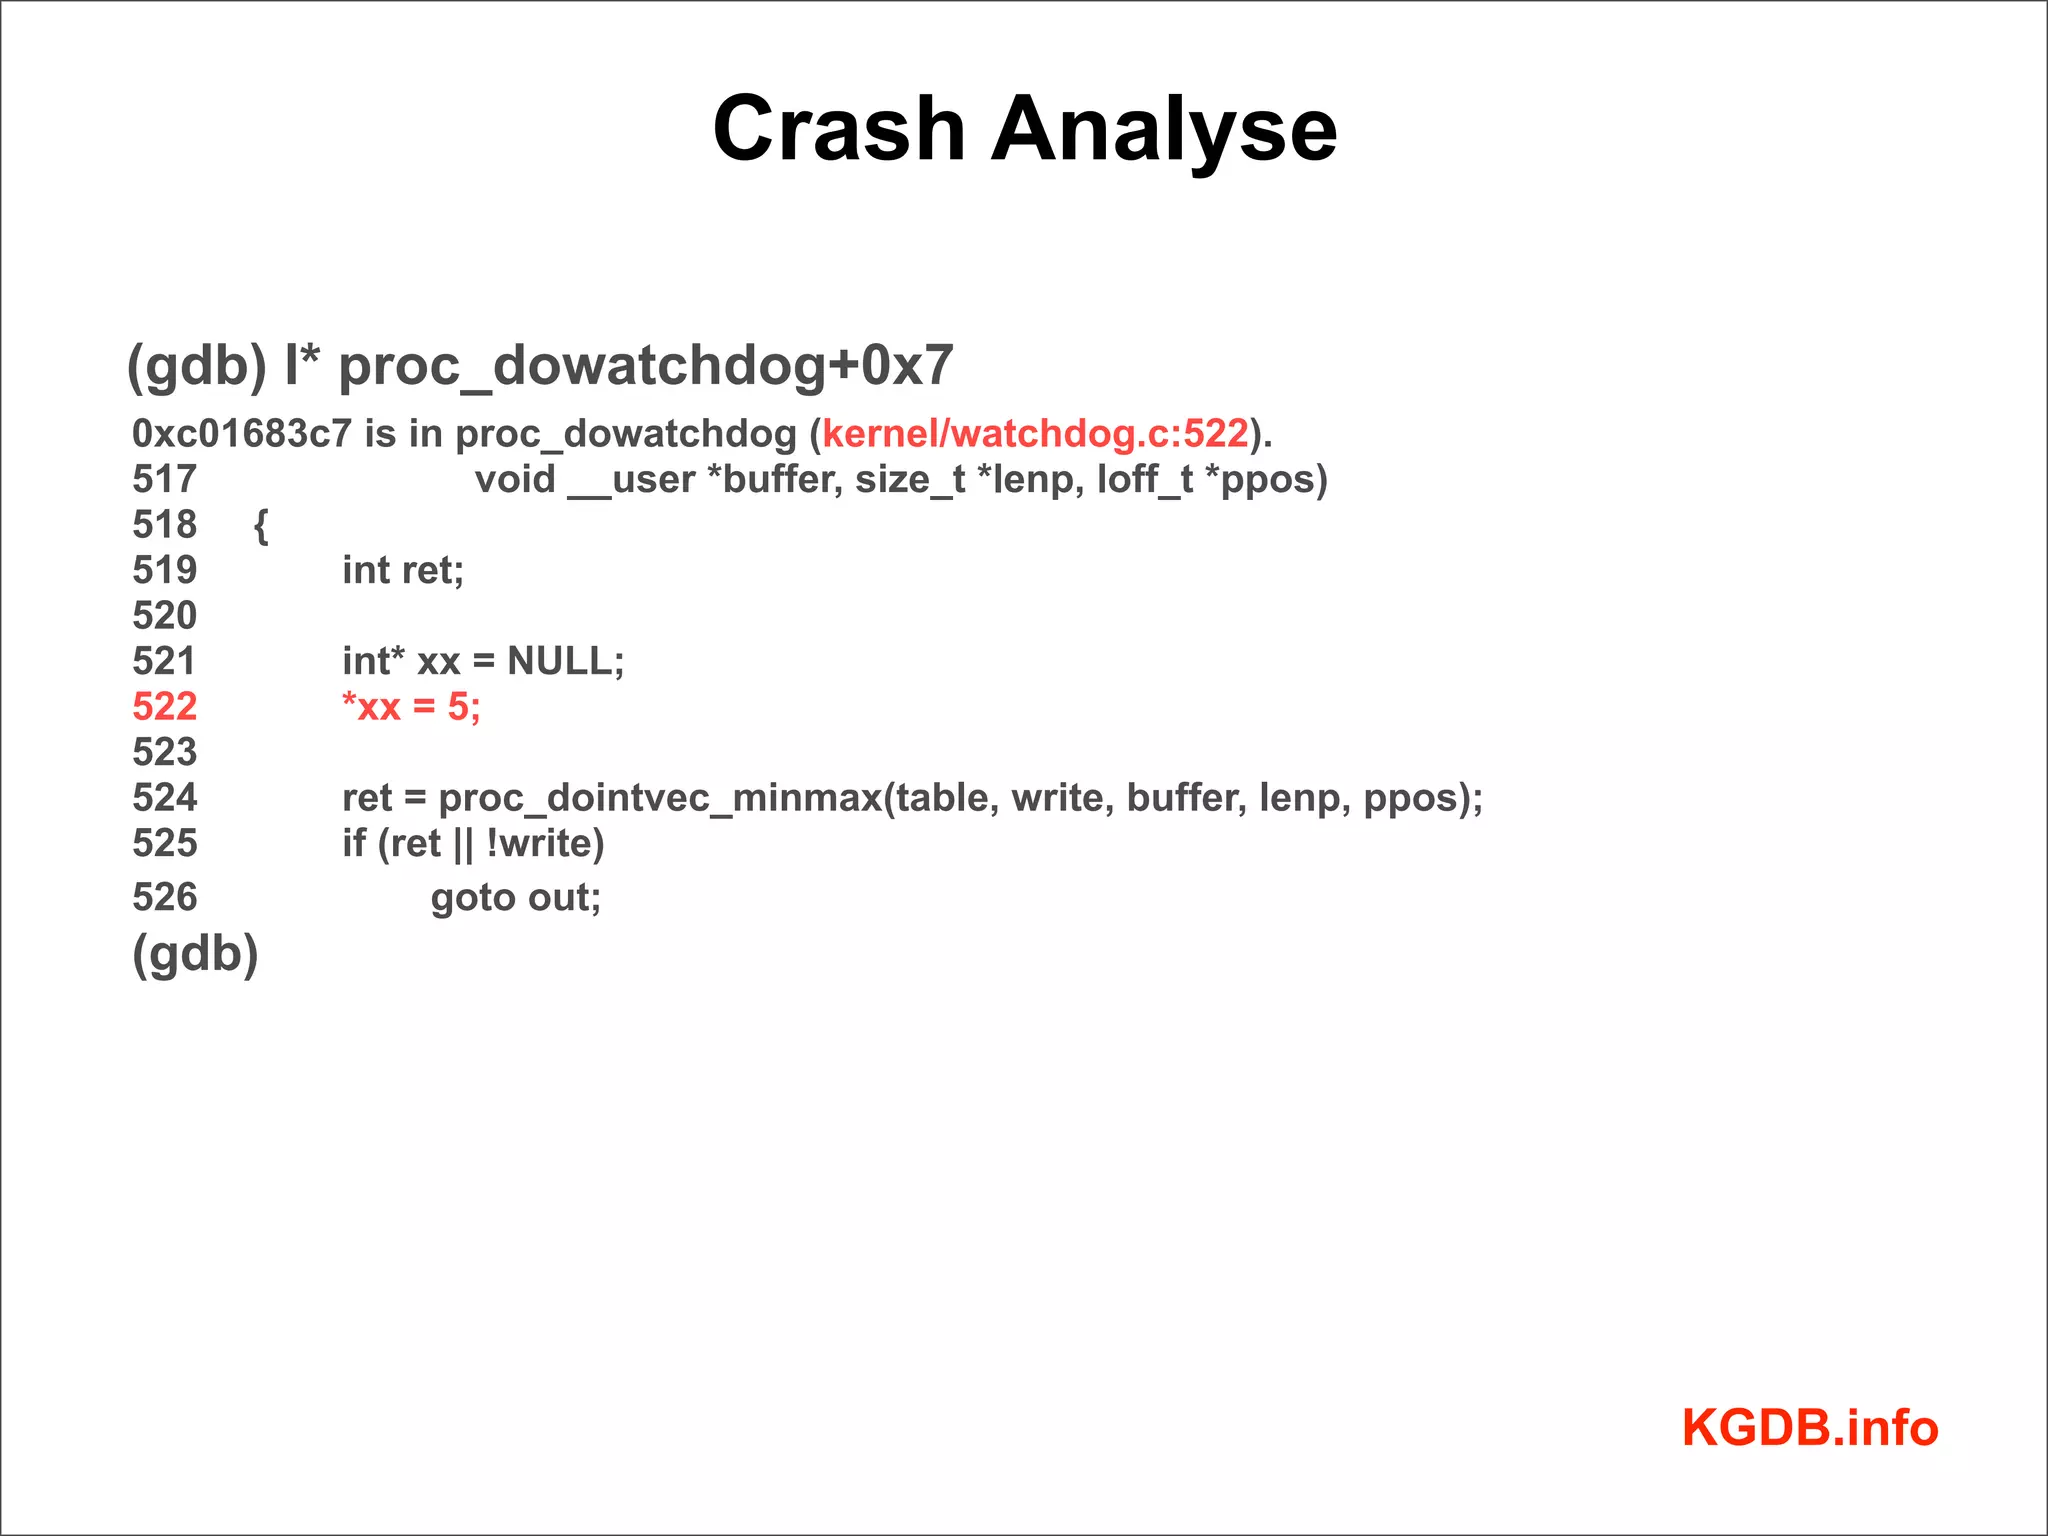
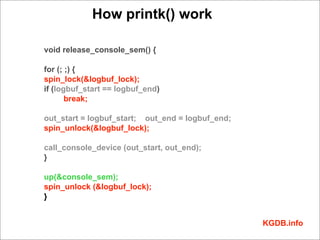
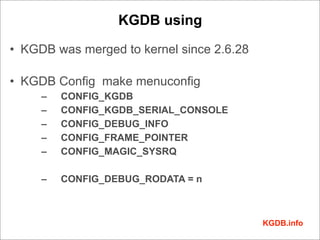
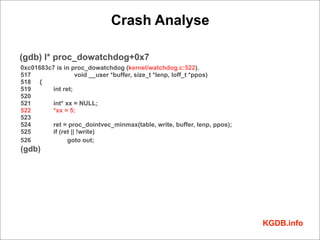
BUG: unable to handle kernel NULL pointer dereference at (null)
IP: [<c01683c7>] proc_dowatchdog+0x7/0xd0
*pde = 00000000
Oops: 0002 [#2] PREEMPT
Modules linked in:
Pid: 1126, comm: sh Tainted: G D 3.0.0-rc2-dirty #4 Bochs Bochs
EIP: 0060:[<c01683c7>] EFLAGS: 00000286 CPU: 0 à Register Info
EIP is at proc_dowatchdog+0x7/0xd0
EAX: c069fcc4 EBX: 00000001 ECX: b7838000 EDX: 00000001
ESI: c069fcc4 EDI: 00000004 EBP: b7838000 ESP: d7623f30
DS: 007b ES: 007b FS: 0000 GS: 0033 SS: 0068
Process sh (pid: 1126, ti=d7622000 task=d749f4a0 task.ti=d7622000)
Stack:
d749f4a0 c069f6c0 c069f6c0 c069fcc4 c0202c77 d7623f50 d7623f9c 00000000
00000004 d7623f9c 00000004 b7838000 c0202cb0 c0202cc8 d7623f9c 00000001
d7428e00 c01b4d50 d7623f9c 00000002 00000001 d7428e00 fffffff7 081d1300
Call Trace:
[<c0202c77>] ? proc_sys_call_handler+0x77/0xb0
[<c0202cb0>] ? proc_sys_call_handler+0xb0/0xb0
[<c0202cc8>] ? proc_sys_write+0x18/0x20
[<c01b4d50>] ? vfs_write+0xa0/0x140
[<c01b4ec1>] ? sys_write+0x41/0x80
[<c0539d10>] ? sysenter_do_call+0x12/0x26
Code: 75 0f c7 03 01 00 00 00 e8 57 69 fd ff 85 c0 74 db a1 48 c0 69
c0 c7 00 00 00 00 00 31 c0 83 c4 04 5b c3 90 56 53 89 d3 83 ec 08 <c7>
05 00 00 00 00 05 00 00 00 8b 54 24 18 89 54 24 04 8b 54 24
EIP: [<c01683c7>] proc_dowatchdog+0x7/0xd0 SS:ESP 0068:d7623f30
CR2: 0000000000000000
---[ end trace 8b37721a29dead5b ]--
KGDB.info](https://image.slidesharecdn.com/linuxkerneldebugging-110624110400-phpapp01/85/Linux-kernel-debugging-22-320.jpg)


![Crash Analyse
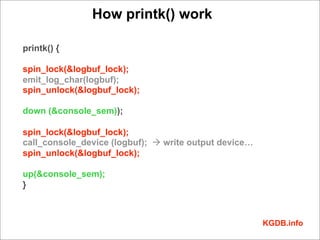
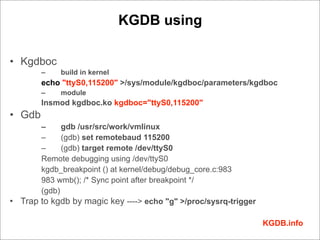
BUG: unable to handle kernel NULL pointer dereference at (null)
IP: [<c01683c7>] proc_dowatchdog+0x7/0xd0
*pde = 00000000
Oops: 0002 [#2] PREEMPT
Modules linked in:
Pid: 1126, comm: sh Tainted: G D 3.0.0-rc2-dirty #4 Bochs Bochs
EIP: 0060:[<c01683c7>] EFLAGS: 00000286 CPU: 0 à Register Info
EIP is at proc_dowatchdog+0x7/0xd0
EAX: c069fcc4 EBX: 00000001 ECX: b7838000 EDX: 00000001
ESI: c069fcc4 EDI: 00000004 EBP: b7838000 ESP: d7623f30
DS: 007b ES: 007b FS: 0000 GS: 0033 SS: 0068
Process sh (pid: 1126, ti=d7622000 task=d749f4a0 task.ti=d7622000)
Stack:
d749f4a0 c069f6c0 c069f6c0 c069fcc4 c0202c77 d7623f50 d7623f9c 00000000
00000004 d7623f9c 00000004 b7838000 c0202cb0 c0202cc8 d7623f9c 00000001
d7428e00 c01b4d50 d7623f9c 00000002 00000001 d7428e00 fffffff7 081d1300
Call Trace:
[<c0202c77>] ? proc_sys_call_handler+0x77/0xb0
[<c0202cb0>] ? proc_sys_call_handler+0xb0/0xb0
[<c0202cc8>] ? proc_sys_write+0x18/0x20
[<c01b4d50>] ? vfs_write+0xa0/0x140
[<c01b4ec1>] ? sys_write+0x41/0x80
[<c0539d10>] ? sysenter_do_call+0x12/0x26
Code: 75 0f c7 03 01 00 00 00 e8 57 69 fd ff 85 c0 74 db a1 48 c0 69
c0 c7 00 00 00 00 00 31 c0 83 c4 04 5b c3 90 56 53 89 d3 83 ec 08 <c7>
05 00 00 00 00 05 00 00 00 8b 54 24 18 89 54 24 04 8b 54 24
EIP: [<c01683c7>] proc_dowatchdog+0x7/0xd0 SS:ESP 0068:d7623f30
CR2: 0000000000000000
---[ end trace 8b37721a29dead5b ]--
KGDB.info](https://image.slidesharecdn.com/linuxkerneldebugging-110624110400-phpapp01/75/Linux-kernel-debugging-22-2048.jpg)