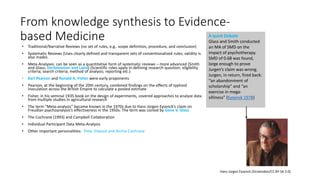
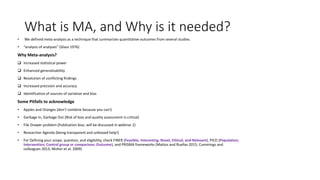
KEMBAR78
Meta-Analysis -- Introduction.pptx
For more info on ACSRM,
Please visit https://acsrm.info/
Meta-Analysis - Introduction
Moses Asori
Ph.D. Student – University of North Carolina, Charlotte
Research interests: Environmental Epidemiology, Spatial Epidemiology,
Geographies of Health, Public Health, GIS, and Remote Sensing.
Expected Outcomes
• Background of Meta-analysis
• Essence of Meta-analysis
• Know the difference between meta-analysis and
Systematic review
• Key features of Meta-analysis
• Difference between Fixed and Random Effect Meta-
analysis
• Software for meta-analysis
From knowledge synthesis to Evidence-
based Medicine
• Traditional/Narrative Reviews (no set of rules, e.g., scope definition, procedure, and conclusion)
• Systematic Reviews (Uses clearly defined and transparent sets of conventionalized rules; validity is
also made).
• Meta-Analyses: can be seen as a quantitative form of systematic reviews – more advanced (Smith
and Glass; DerSimonian and Laird) (Scientific rules apply in defining research question; eligibility
criteria; search criteria; method of analysis; reporting etc.)
• Karl Pearson and Ronald A. Fisher were early proponents
• Pearson, at the beginning of the 20th century, combined findings on the effects of typhoid
inoculation across the British Empire to calculate a pooled estimate
• Fisher, in his seminal 1935 book on the design of experiments, covered approaches to analyze data
from multiple studies in agricultural research
• The term “Meta-analysis” became known in the 1970s due to Hans Jürgen Eysenck’s claim on
Freudian psychoanalysis’s effectiveness in the 1950s. The term was coined by Gene V. Glass
• The Cochrane (1993) and Campbell Collaboration
• Individual Participant Data Meta-Analysis
• Other important personalities: Peter Elwood and Archie Cochrane
A quick Debate
Glass and Smith conducted
an MA of SMD on the
impact of psychotherapy.
SMD of 0.68 was found,
large enough to prove
Jurgen’s claim was wrong.
Jurgen, in return, fired back:
“an abandonment of
scholarship” and “an
exercise in mega-
silliness” (Eysenck 1978)
Hans Jürgen Eysenck (Sirswindon/CC BY-SA 3.0).
What is MA, and Why is it needed?
• We defined meta-analysis as a technique that summarizes quantitative outcomes from several studies.
• “analysis of analyses” (Glass 1976)
Why Meta-analysis?
 Increased statistical power
 Enhanced generalizability
 Resolution of conflicting findings
 Increased precision and accuracy
 Identification of sources of variation and bias
Some Pitfalls to acknowledge
• Apples and Oranges (don’t combine because you can!)
• Garbage In, Garbage Out (Risk of bias and quality assessment is critical)
• File Drawer problem (Publication bias: will be discussed in webinar 2)
• Researcher Agenda (being transparent and unbiased help!)
• For Defining your scope, question, and eligibility, check FINER (Feasible, Interesting, Novel, Ethical, and Relevant), PICO (Population;
Intervention; Control group or comparison; Outcome), and PRISMA frameworks (Mattos and Ruellas 2015; Cummings and
colleagues 2013; Moher et al. 2009)
Effect size cont’d
Effect Size
• Different studies with different outcome measures: we need effect sizes
(ES)
• ES is a standardized outcome measure that permits the pooling of results
from different studies (may include magnitude, association, and direction)
• ES should be (1) Comparable, (2) Computationally feasible, (3) Reliable, (4)
Interpretable
• The term is Heavily contested (effect suggests causation: that’s a problem),
but it’s still the standard
• Normally represented as theta (θ) as the true effect size for the overall
study effect, whereas θk represents the true effect for study K
• Imagine θ = θk + EK
• Also θk (hat) = θk+ϵk
• Where EK is the error associated with the theta
• In reality, we never know the true measures and sampling error in our
studies, but we estimate this by repeated re-estimation of our mean and
calculating the standard error (deviations around our expectation)
Pooling the ES
• We are aggregating our study outcomes
• We can pool in two ways (models)
• Fixed effect (no real differences between studies except for sampling error)
• Random Effect (Real differences between studies)
We can pool mean, proportions, Pearson
correlation, Point-Biserial correlation,
mean difference, Risk and odds Ratios,
etc.
Before you pool…,
• Effect Size Correction
• Small Sample (Hedges’ g)
• Unreliability (test-retest-reliability or attenuation)
• We can correct for unreliability using the Hunter and
Schmidt method in R or any standard software
environment that supports this.
• Know the model to use: But what exactly is a model?
Fixed Effect Model
1. Since all factors are assumed fixed, the only
reason results will vary is random sampling error
2. Although the error is random, the sampling
distribution of the errors can be estimated
Weighted
Mean
Study
weight
Study
variance
Study ES (r2, %
etc.)
Cont’d
Random-Effects Models
• Does not assume that the true effect is identical
across studies
• Because study characteristics vary (e.g., participant
characteristics, treatment intensity, outcome
measurement), there may be different effect sizes
underlying different studies
• Error, therefore, comes from many sources (internal
and external factors)
Estimating the true variance (tau-squared)
The tau (expected
variance) is quite
complicated to calculate
manually. DerSimonian-
Laird; Restricted Maximum
Likelihood; Paule-
Mandel; Empirical Bayes;
Sidik-Jonkman. Which one
to use? Depends on many
factors (e.g., sample size,
number of studies,
variation in sample, etc.)
Heterogeneity
• Baseline or design-related
heterogeneity
• Statistical heterogeneity
• Cochran’s Q
Outliers & Influential Cases
1. Basic Outlier Removal (how do we define it?)
2. Influence Analysis (InfluenceAnalysis in dmetar)
Which Heterogeneity measure
should I use? Maybe use all? Or
I2
increases
as the
number of
studies
increases
because
the SE
reduces
Notable Software for Meta-Analysis
• Comprehensive Meta-Analysis (Not for free)
• R with Meta-Analysis Packages (For free)
• RevMan (Review Manager) (Free)
• STATA (Not for free)
• JASP (Free)
• MetaXL (Not sure)
• WinBUGS/OpenBUGS (Not sure)
• MixMeta (Not sure)
References
• Cummings, Steven R, Warren S Browner, and Stephen B Hulley. 2013. “Conceiving
the Research Question and Developing the Study Plan.” Designing Clinical
Research 4: 14–22.
• DerSimonian, Rebecca, and Nan Laird. 1986. “Meta-Analysis in Clinical
Trials.” Controlled Clinical Trials 7 (3): 177–88.
• lwood, Peter. 2006. “The First Randomized Trial of Aspirin for Heart Attack and
the Advent of Systematic Overviews of Trials.” Journal of the Royal Society of
Medicine 99 (11): 586–88.
• Eysenck, Hans J. 1978. “An Exercise in Mega-Silliness.” American Psychologist 33
(5).
• Fisher, Ronald A. 1935. The Design of Experiments. Oliver & Boyd, Edinburgh, UK.
• Glass, Gene V. 1976. “Primary, Secondary, and Meta-Analysis of
Research.” Educational Researcher 5 (10): 3–8.

Meta-Analysis -- Introduction.pptx

  • 1.
    For more infoon ACSRM, Please visit https://acsrm.info/
  • 2.
    Meta-Analysis - Introduction MosesAsori Ph.D. Student – University of North Carolina, Charlotte Research interests: Environmental Epidemiology, Spatial Epidemiology, Geographies of Health, Public Health, GIS, and Remote Sensing.
  • 3.
    Expected Outcomes • Backgroundof Meta-analysis • Essence of Meta-analysis • Know the difference between meta-analysis and Systematic review • Key features of Meta-analysis • Difference between Fixed and Random Effect Meta- analysis • Software for meta-analysis
  • 4.
    From knowledge synthesisto Evidence- based Medicine • Traditional/Narrative Reviews (no set of rules, e.g., scope definition, procedure, and conclusion) • Systematic Reviews (Uses clearly defined and transparent sets of conventionalized rules; validity is also made). • Meta-Analyses: can be seen as a quantitative form of systematic reviews – more advanced (Smith and Glass; DerSimonian and Laird) (Scientific rules apply in defining research question; eligibility criteria; search criteria; method of analysis; reporting etc.) • Karl Pearson and Ronald A. Fisher were early proponents • Pearson, at the beginning of the 20th century, combined findings on the effects of typhoid inoculation across the British Empire to calculate a pooled estimate • Fisher, in his seminal 1935 book on the design of experiments, covered approaches to analyze data from multiple studies in agricultural research • The term “Meta-analysis” became known in the 1970s due to Hans Jürgen Eysenck’s claim on Freudian psychoanalysis’s effectiveness in the 1950s. The term was coined by Gene V. Glass • The Cochrane (1993) and Campbell Collaboration • Individual Participant Data Meta-Analysis • Other important personalities: Peter Elwood and Archie Cochrane A quick Debate Glass and Smith conducted an MA of SMD on the impact of psychotherapy. SMD of 0.68 was found, large enough to prove Jurgen’s claim was wrong. Jurgen, in return, fired back: “an abandonment of scholarship” and “an exercise in mega- silliness” (Eysenck 1978) Hans Jürgen Eysenck (Sirswindon/CC BY-SA 3.0).
  • 5.
    What is MA,and Why is it needed? • We defined meta-analysis as a technique that summarizes quantitative outcomes from several studies. • “analysis of analyses” (Glass 1976) Why Meta-analysis?  Increased statistical power  Enhanced generalizability  Resolution of conflicting findings  Increased precision and accuracy  Identification of sources of variation and bias Some Pitfalls to acknowledge • Apples and Oranges (don’t combine because you can!) • Garbage In, Garbage Out (Risk of bias and quality assessment is critical) • File Drawer problem (Publication bias: will be discussed in webinar 2) • Researcher Agenda (being transparent and unbiased help!) • For Defining your scope, question, and eligibility, check FINER (Feasible, Interesting, Novel, Ethical, and Relevant), PICO (Population; Intervention; Control group or comparison; Outcome), and PRISMA frameworks (Mattos and Ruellas 2015; Cummings and colleagues 2013; Moher et al. 2009)
  • 6.
    Effect size cont’d EffectSize • Different studies with different outcome measures: we need effect sizes (ES) • ES is a standardized outcome measure that permits the pooling of results from different studies (may include magnitude, association, and direction) • ES should be (1) Comparable, (2) Computationally feasible, (3) Reliable, (4) Interpretable • The term is Heavily contested (effect suggests causation: that’s a problem), but it’s still the standard • Normally represented as theta (θ) as the true effect size for the overall study effect, whereas θk represents the true effect for study K • Imagine θ = θk + EK • Also θk (hat) = θk+ϵk • Where EK is the error associated with the theta • In reality, we never know the true measures and sampling error in our studies, but we estimate this by repeated re-estimation of our mean and calculating the standard error (deviations around our expectation) Pooling the ES • We are aggregating our study outcomes • We can pool in two ways (models) • Fixed effect (no real differences between studies except for sampling error) • Random Effect (Real differences between studies) We can pool mean, proportions, Pearson correlation, Point-Biserial correlation, mean difference, Risk and odds Ratios, etc.
  • 7.
    Before you pool…, •Effect Size Correction • Small Sample (Hedges’ g) • Unreliability (test-retest-reliability or attenuation) • We can correct for unreliability using the Hunter and Schmidt method in R or any standard software environment that supports this. • Know the model to use: But what exactly is a model?
  • 8.
    Fixed Effect Model 1.Since all factors are assumed fixed, the only reason results will vary is random sampling error 2. Although the error is random, the sampling distribution of the errors can be estimated Weighted Mean Study weight Study variance Study ES (r2, % etc.)
  • 9.
  • 10.
    Random-Effects Models • Doesnot assume that the true effect is identical across studies • Because study characteristics vary (e.g., participant characteristics, treatment intensity, outcome measurement), there may be different effect sizes underlying different studies • Error, therefore, comes from many sources (internal and external factors)
  • 11.
    Estimating the truevariance (tau-squared) The tau (expected variance) is quite complicated to calculate manually. DerSimonian- Laird; Restricted Maximum Likelihood; Paule- Mandel; Empirical Bayes; Sidik-Jonkman. Which one to use? Depends on many factors (e.g., sample size, number of studies, variation in sample, etc.)
  • 12.
    Heterogeneity • Baseline ordesign-related heterogeneity • Statistical heterogeneity • Cochran’s Q Outliers & Influential Cases 1. Basic Outlier Removal (how do we define it?) 2. Influence Analysis (InfluenceAnalysis in dmetar) Which Heterogeneity measure should I use? Maybe use all? Or I2 increases as the number of studies increases because the SE reduces
  • 13.
    Notable Software forMeta-Analysis • Comprehensive Meta-Analysis (Not for free) • R with Meta-Analysis Packages (For free) • RevMan (Review Manager) (Free) • STATA (Not for free) • JASP (Free) • MetaXL (Not sure) • WinBUGS/OpenBUGS (Not sure) • MixMeta (Not sure)
  • 14.
    References • Cummings, StevenR, Warren S Browner, and Stephen B Hulley. 2013. “Conceiving the Research Question and Developing the Study Plan.” Designing Clinical Research 4: 14–22. • DerSimonian, Rebecca, and Nan Laird. 1986. “Meta-Analysis in Clinical Trials.” Controlled Clinical Trials 7 (3): 177–88. • lwood, Peter. 2006. “The First Randomized Trial of Aspirin for Heart Attack and the Advent of Systematic Overviews of Trials.” Journal of the Royal Society of Medicine 99 (11): 586–88. • Eysenck, Hans J. 1978. “An Exercise in Mega-Silliness.” American Psychologist 33 (5). • Fisher, Ronald A. 1935. The Design of Experiments. Oliver & Boyd, Edinburgh, UK. • Glass, Gene V. 1976. “Primary, Secondary, and Meta-Analysis of Research.” Educational Researcher 5 (10): 3–8.