Downloaded 15 times
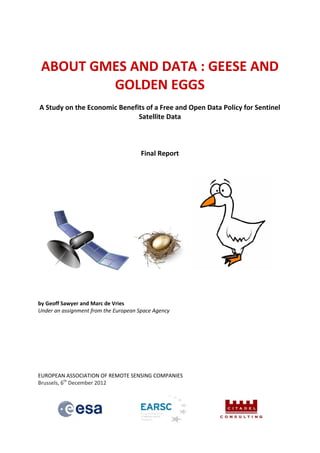

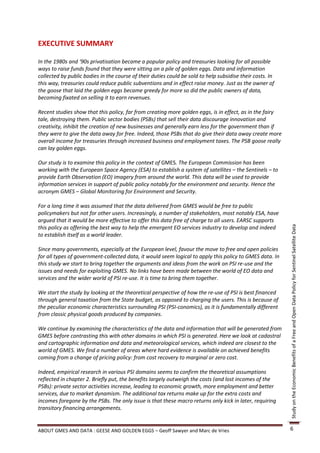

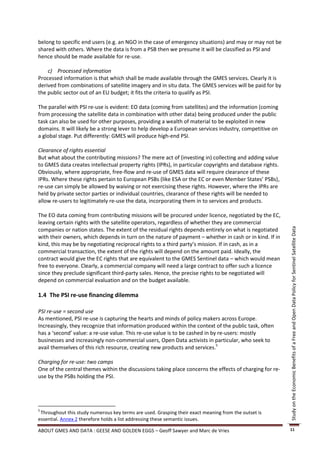


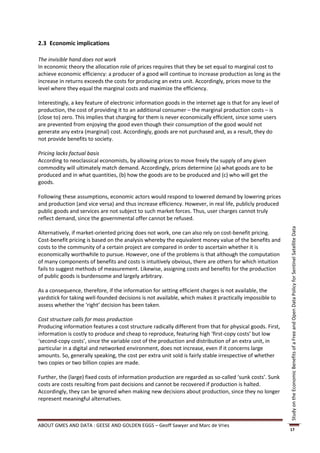


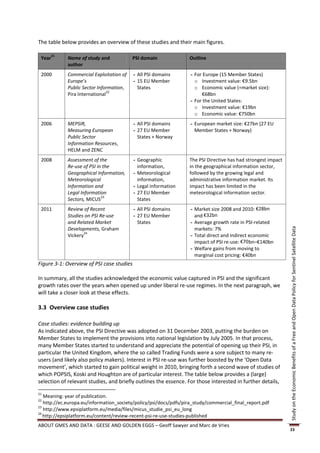
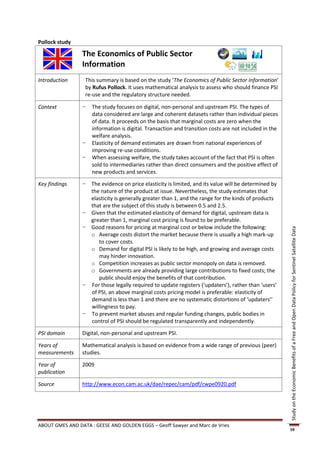
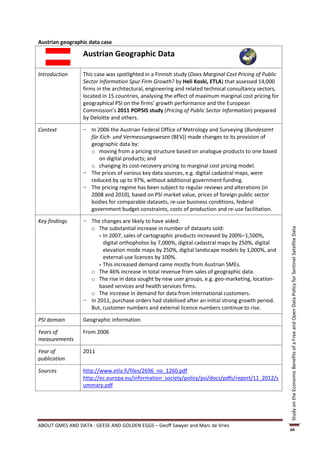
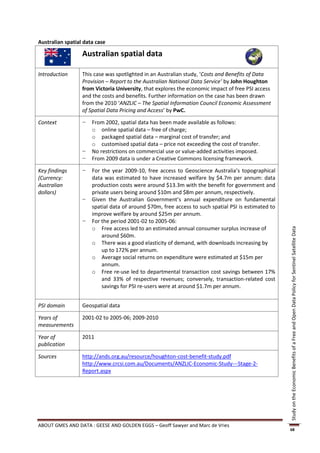
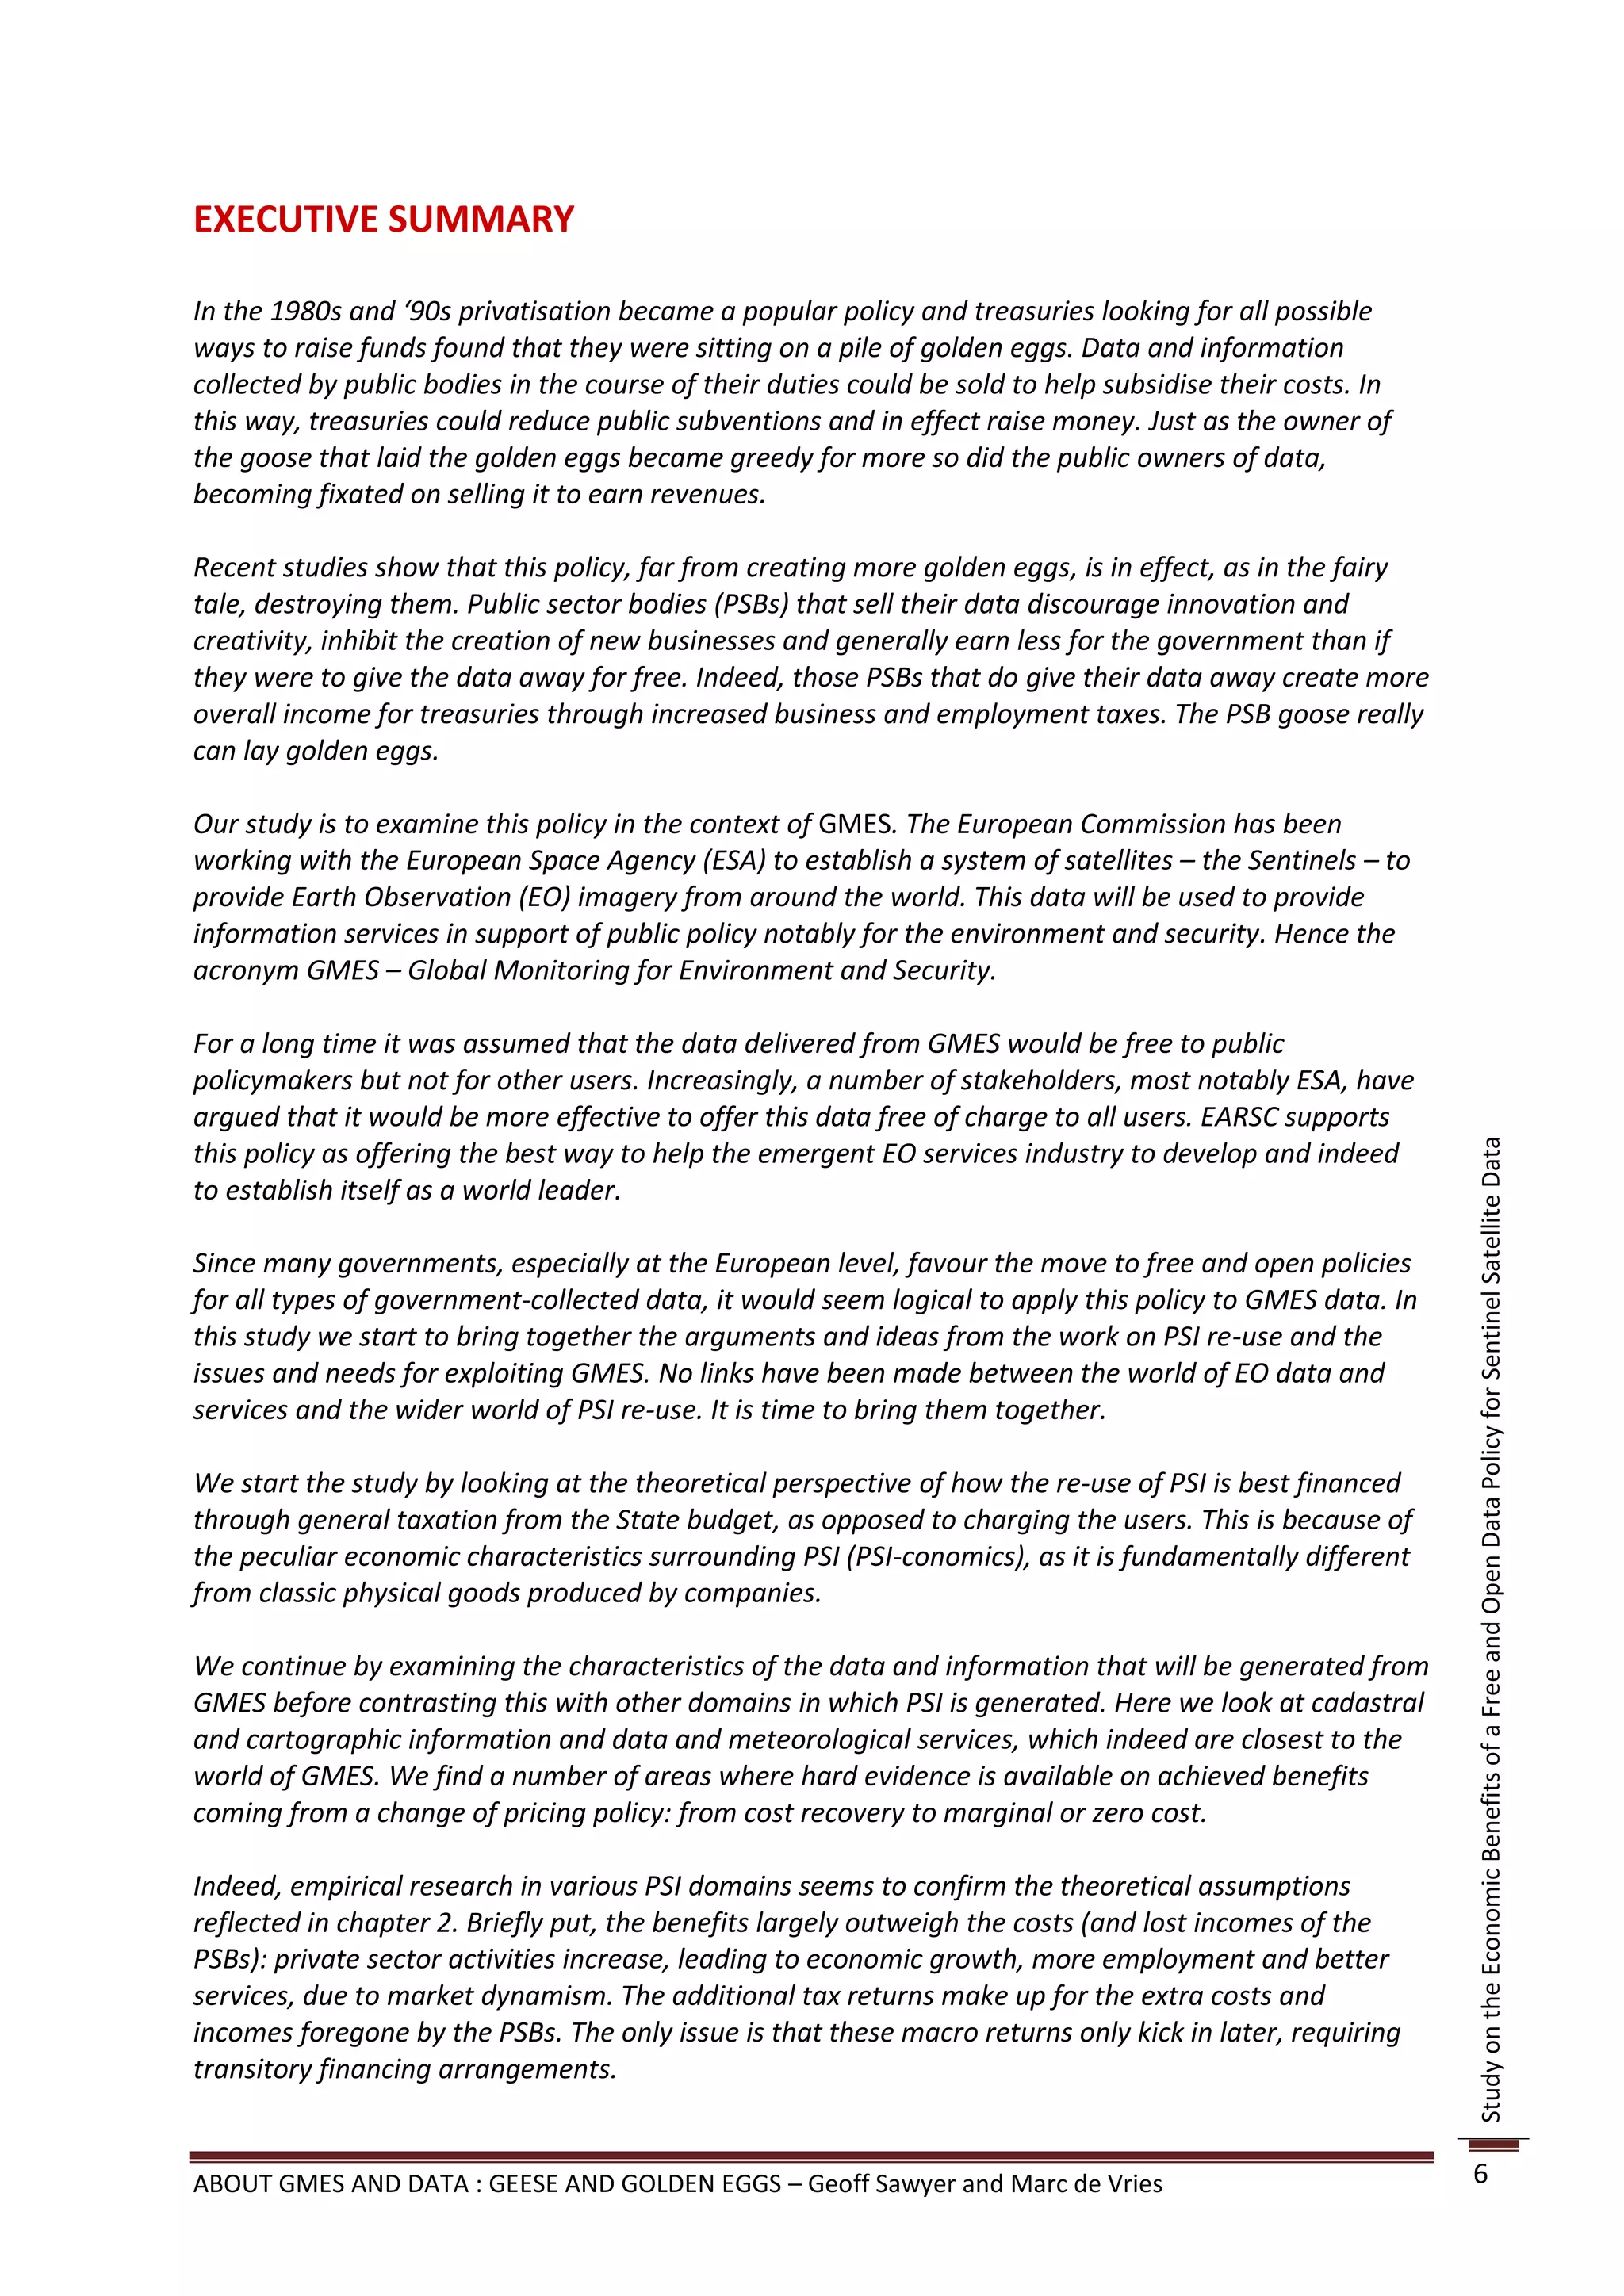
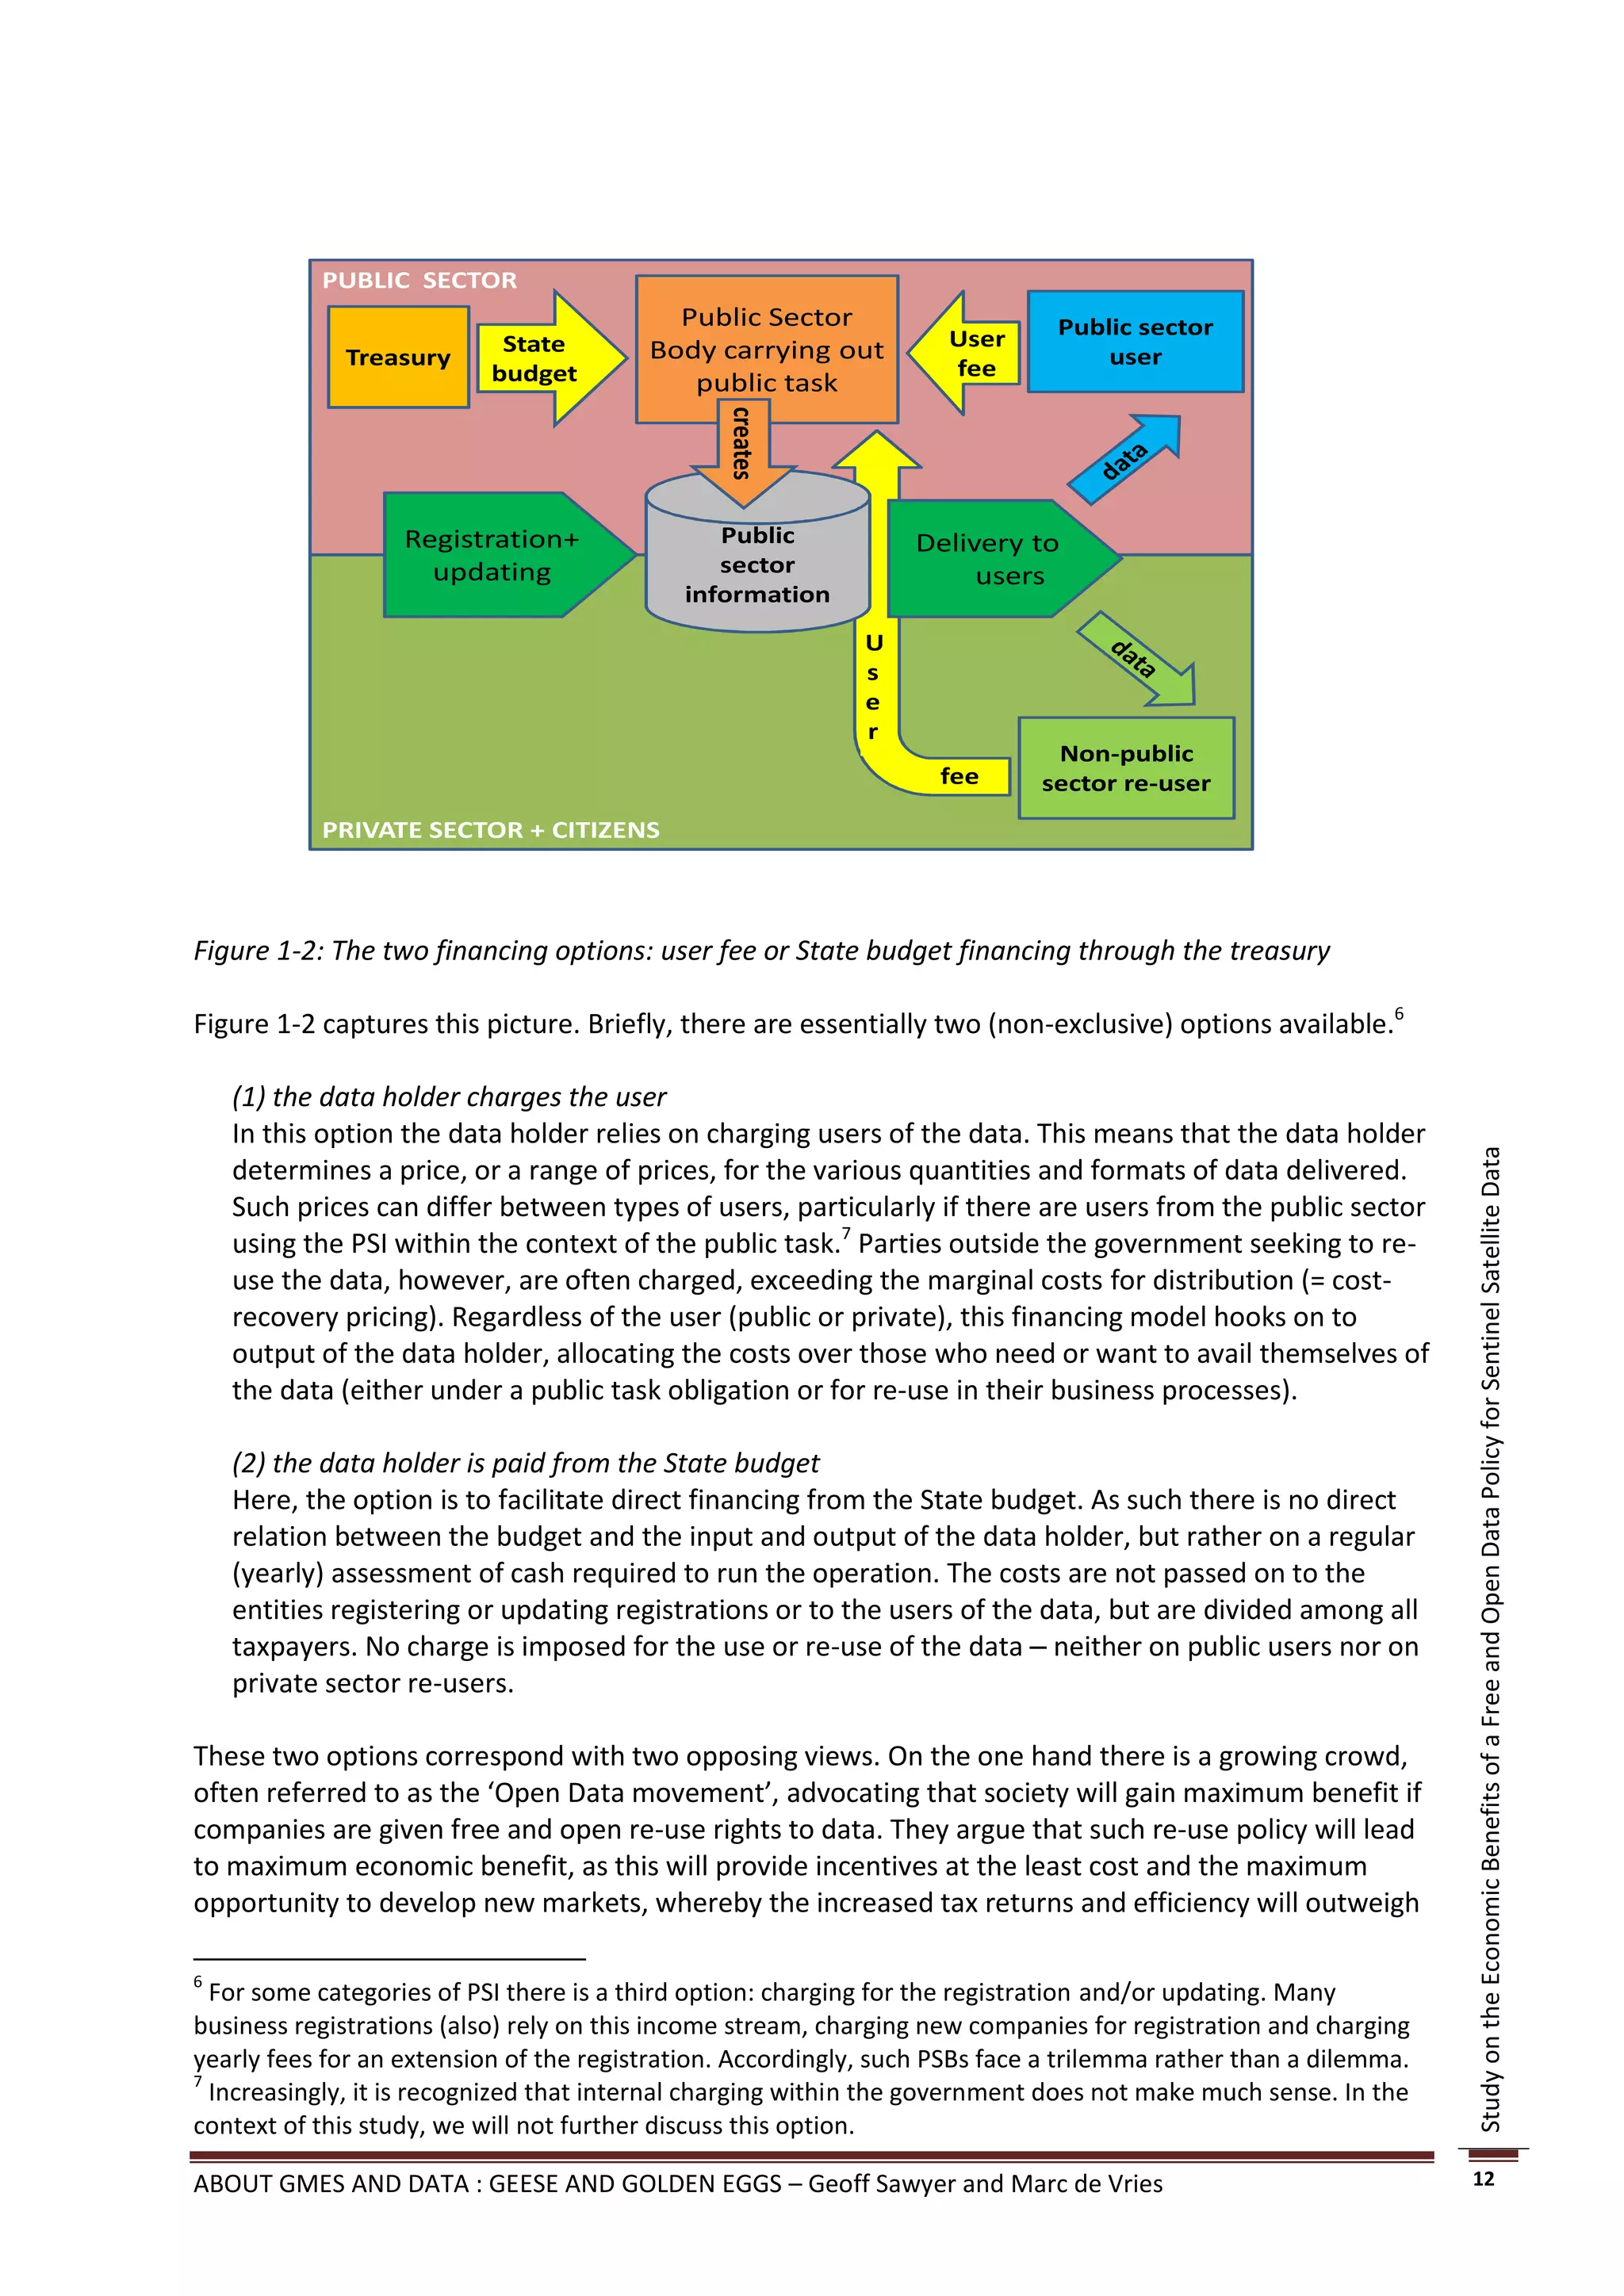
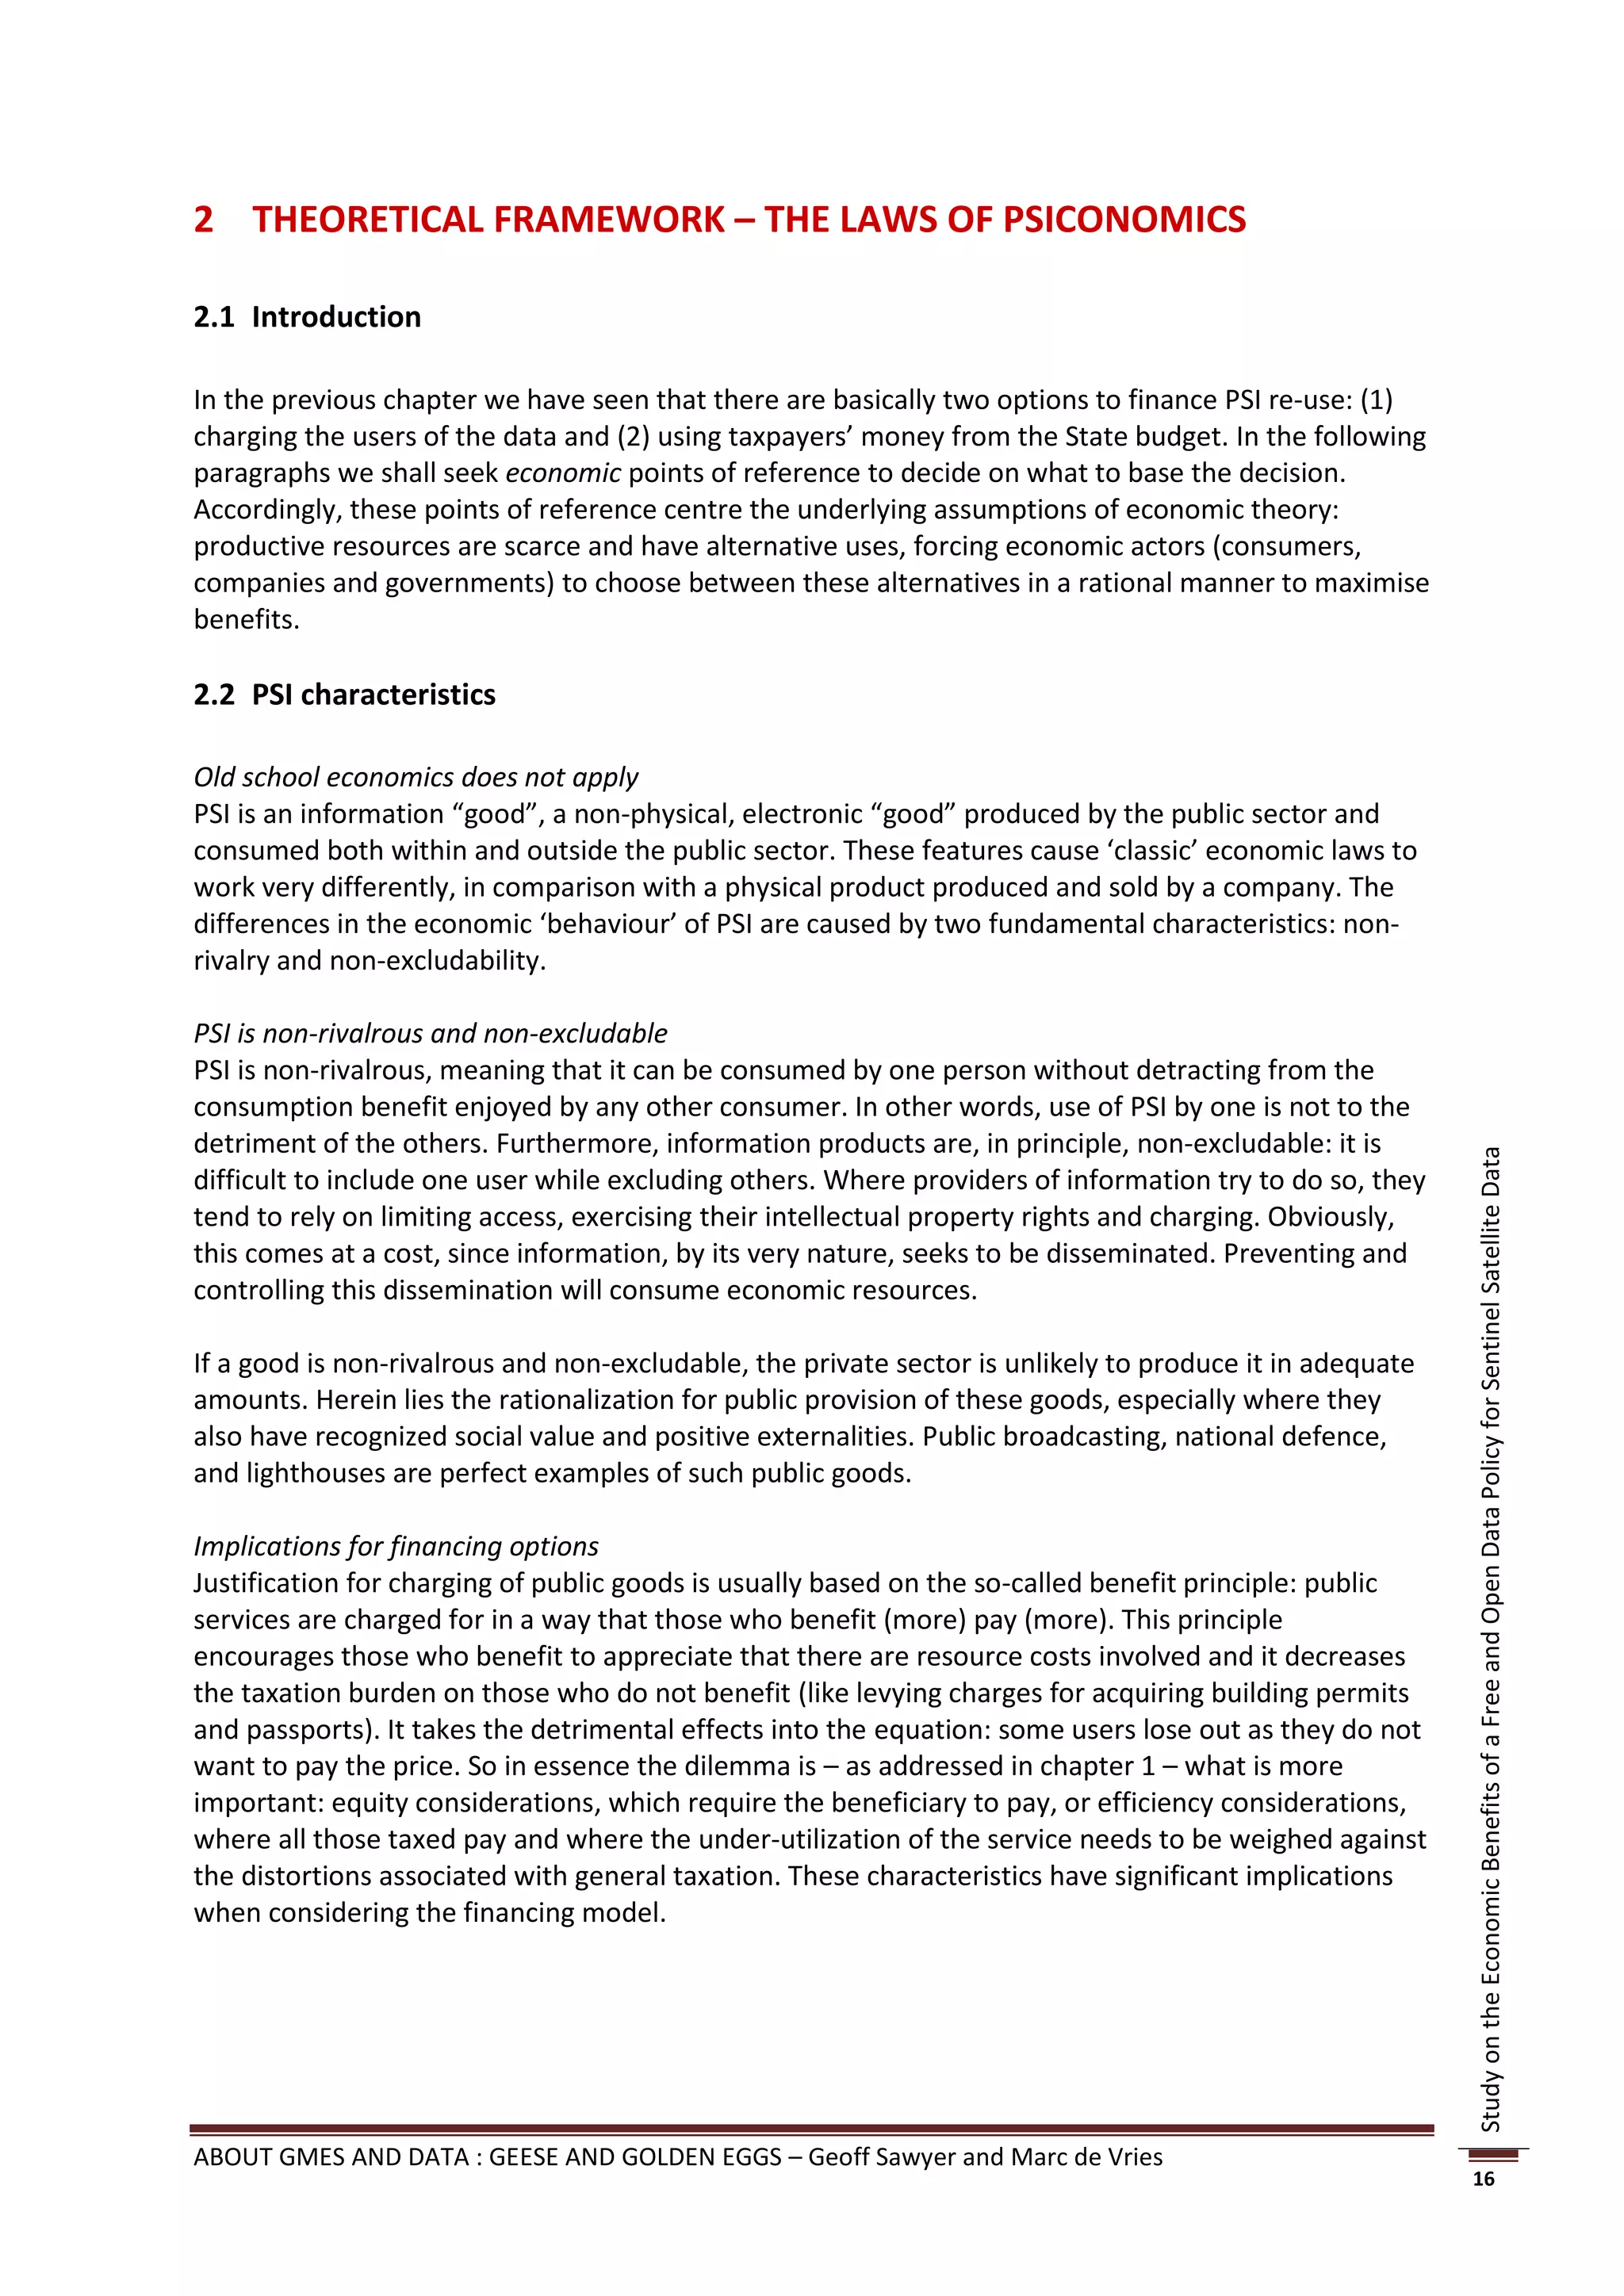
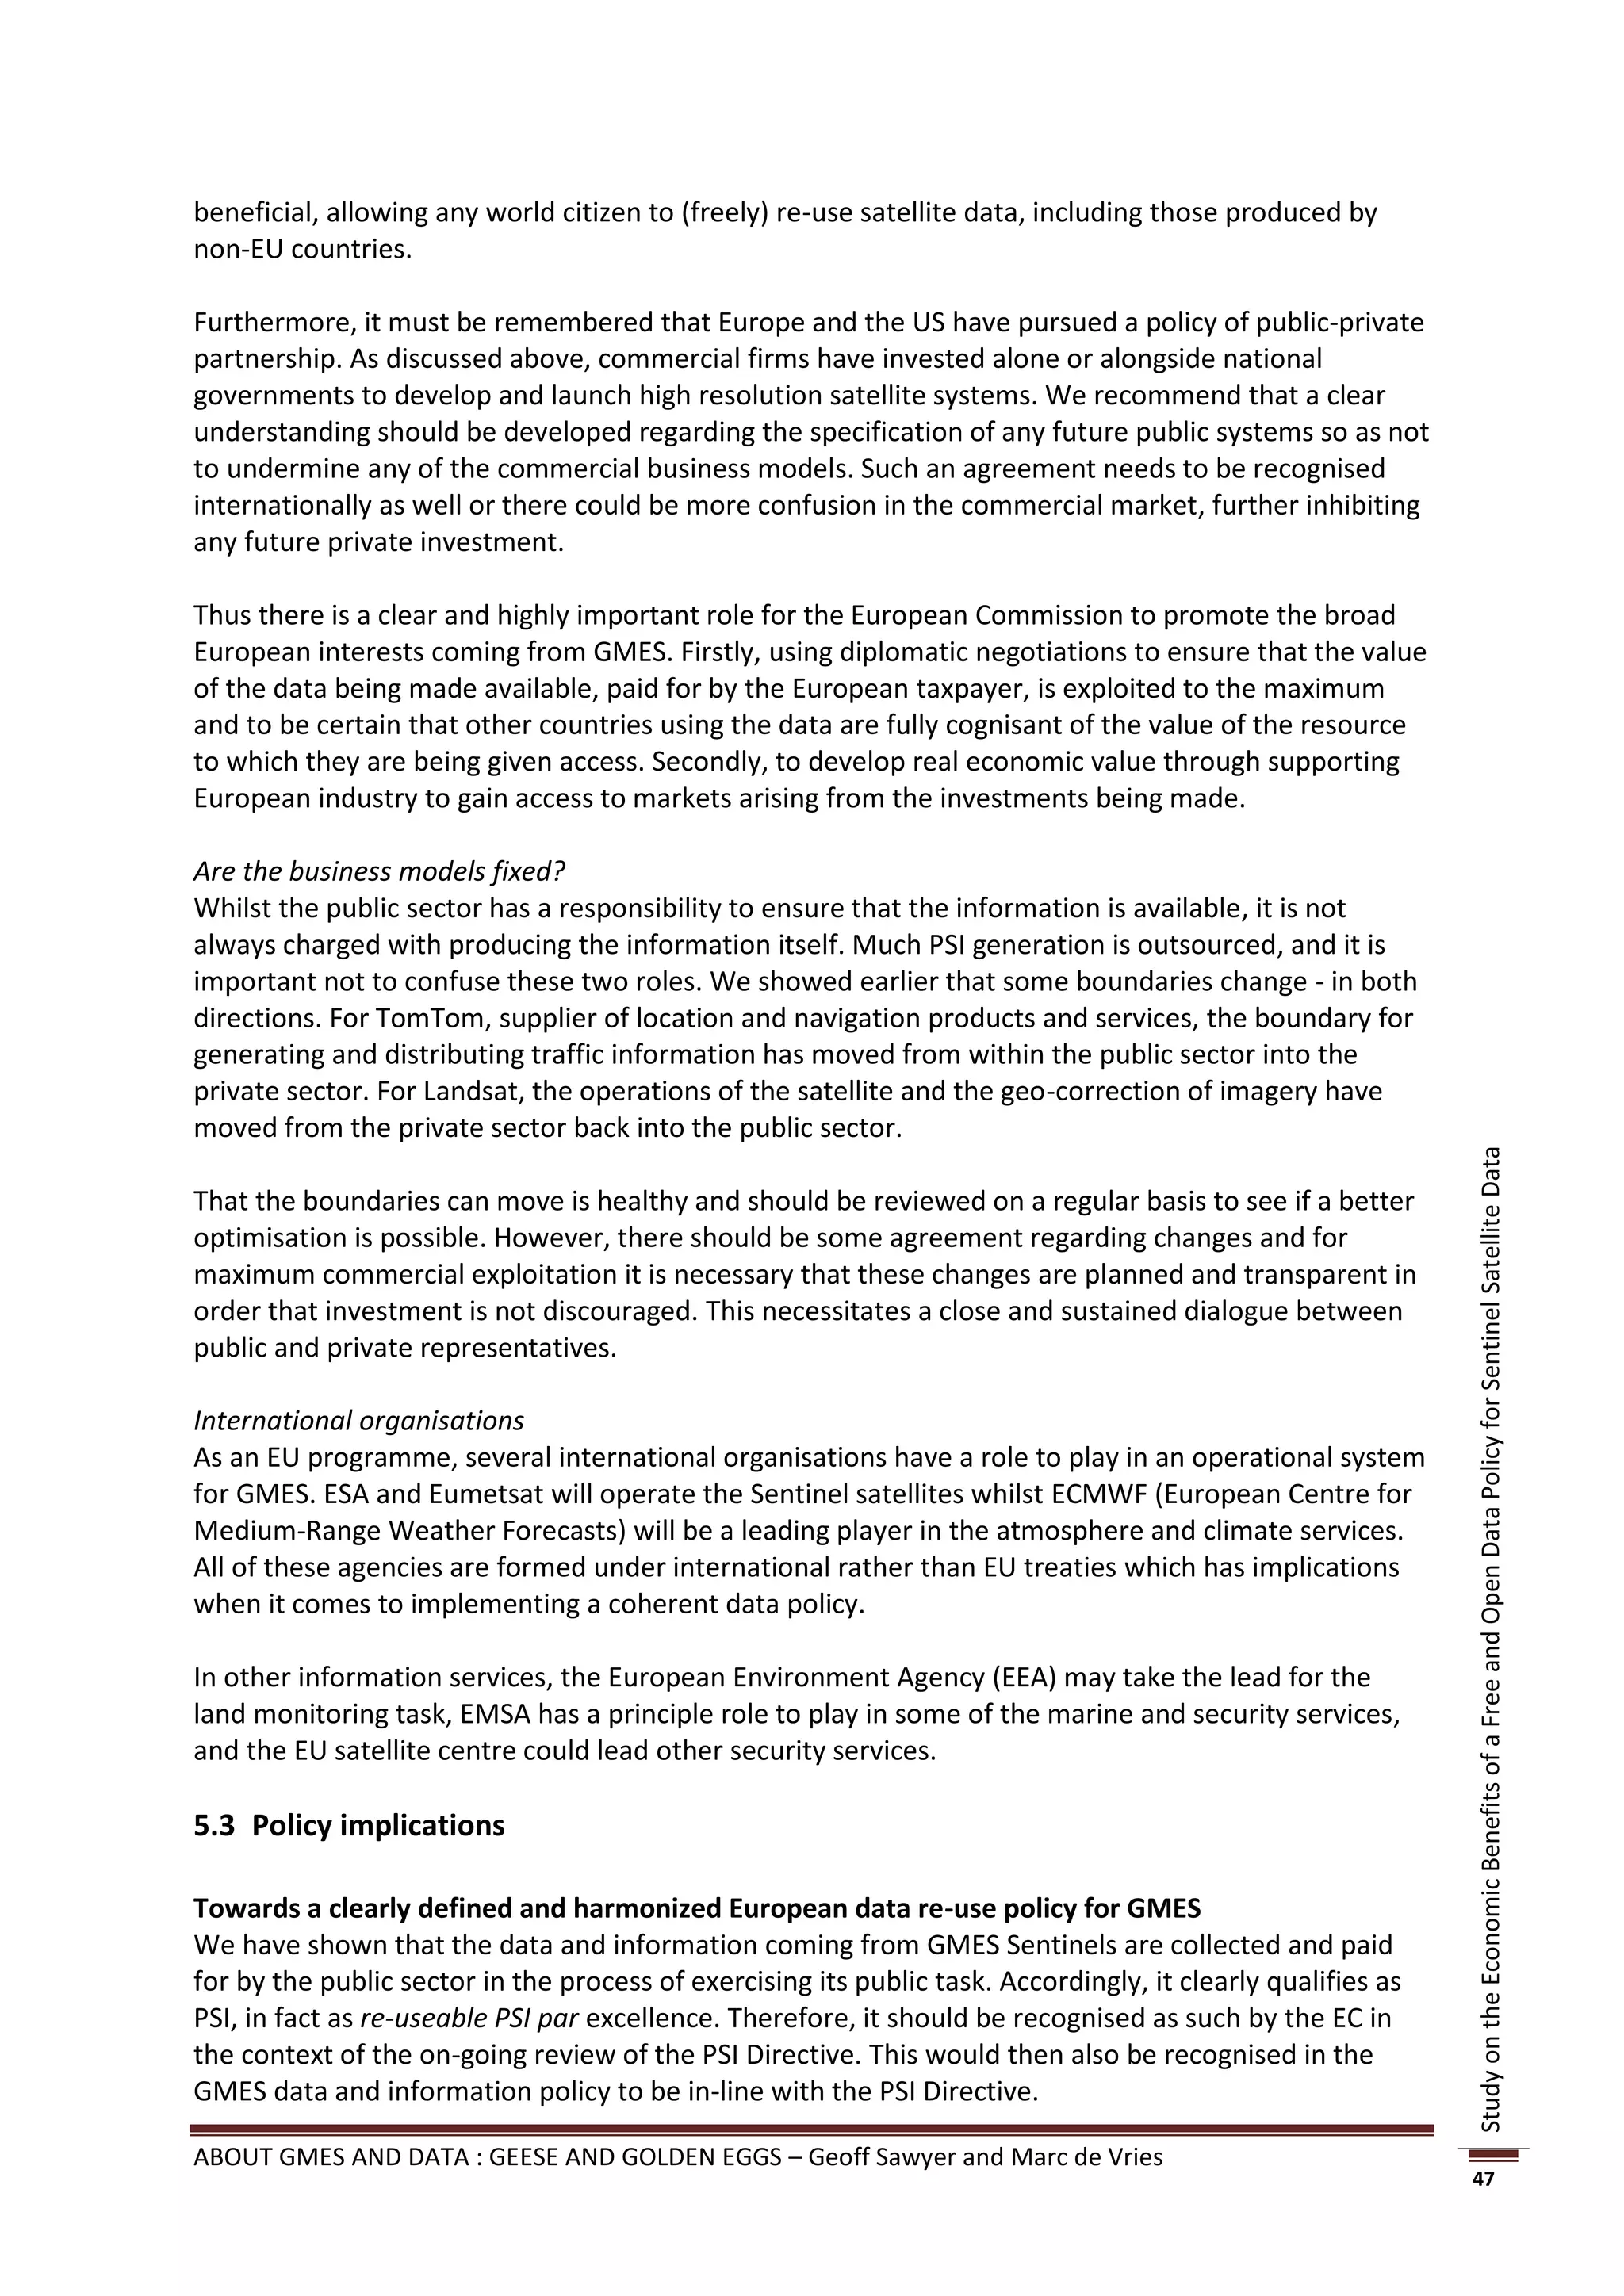
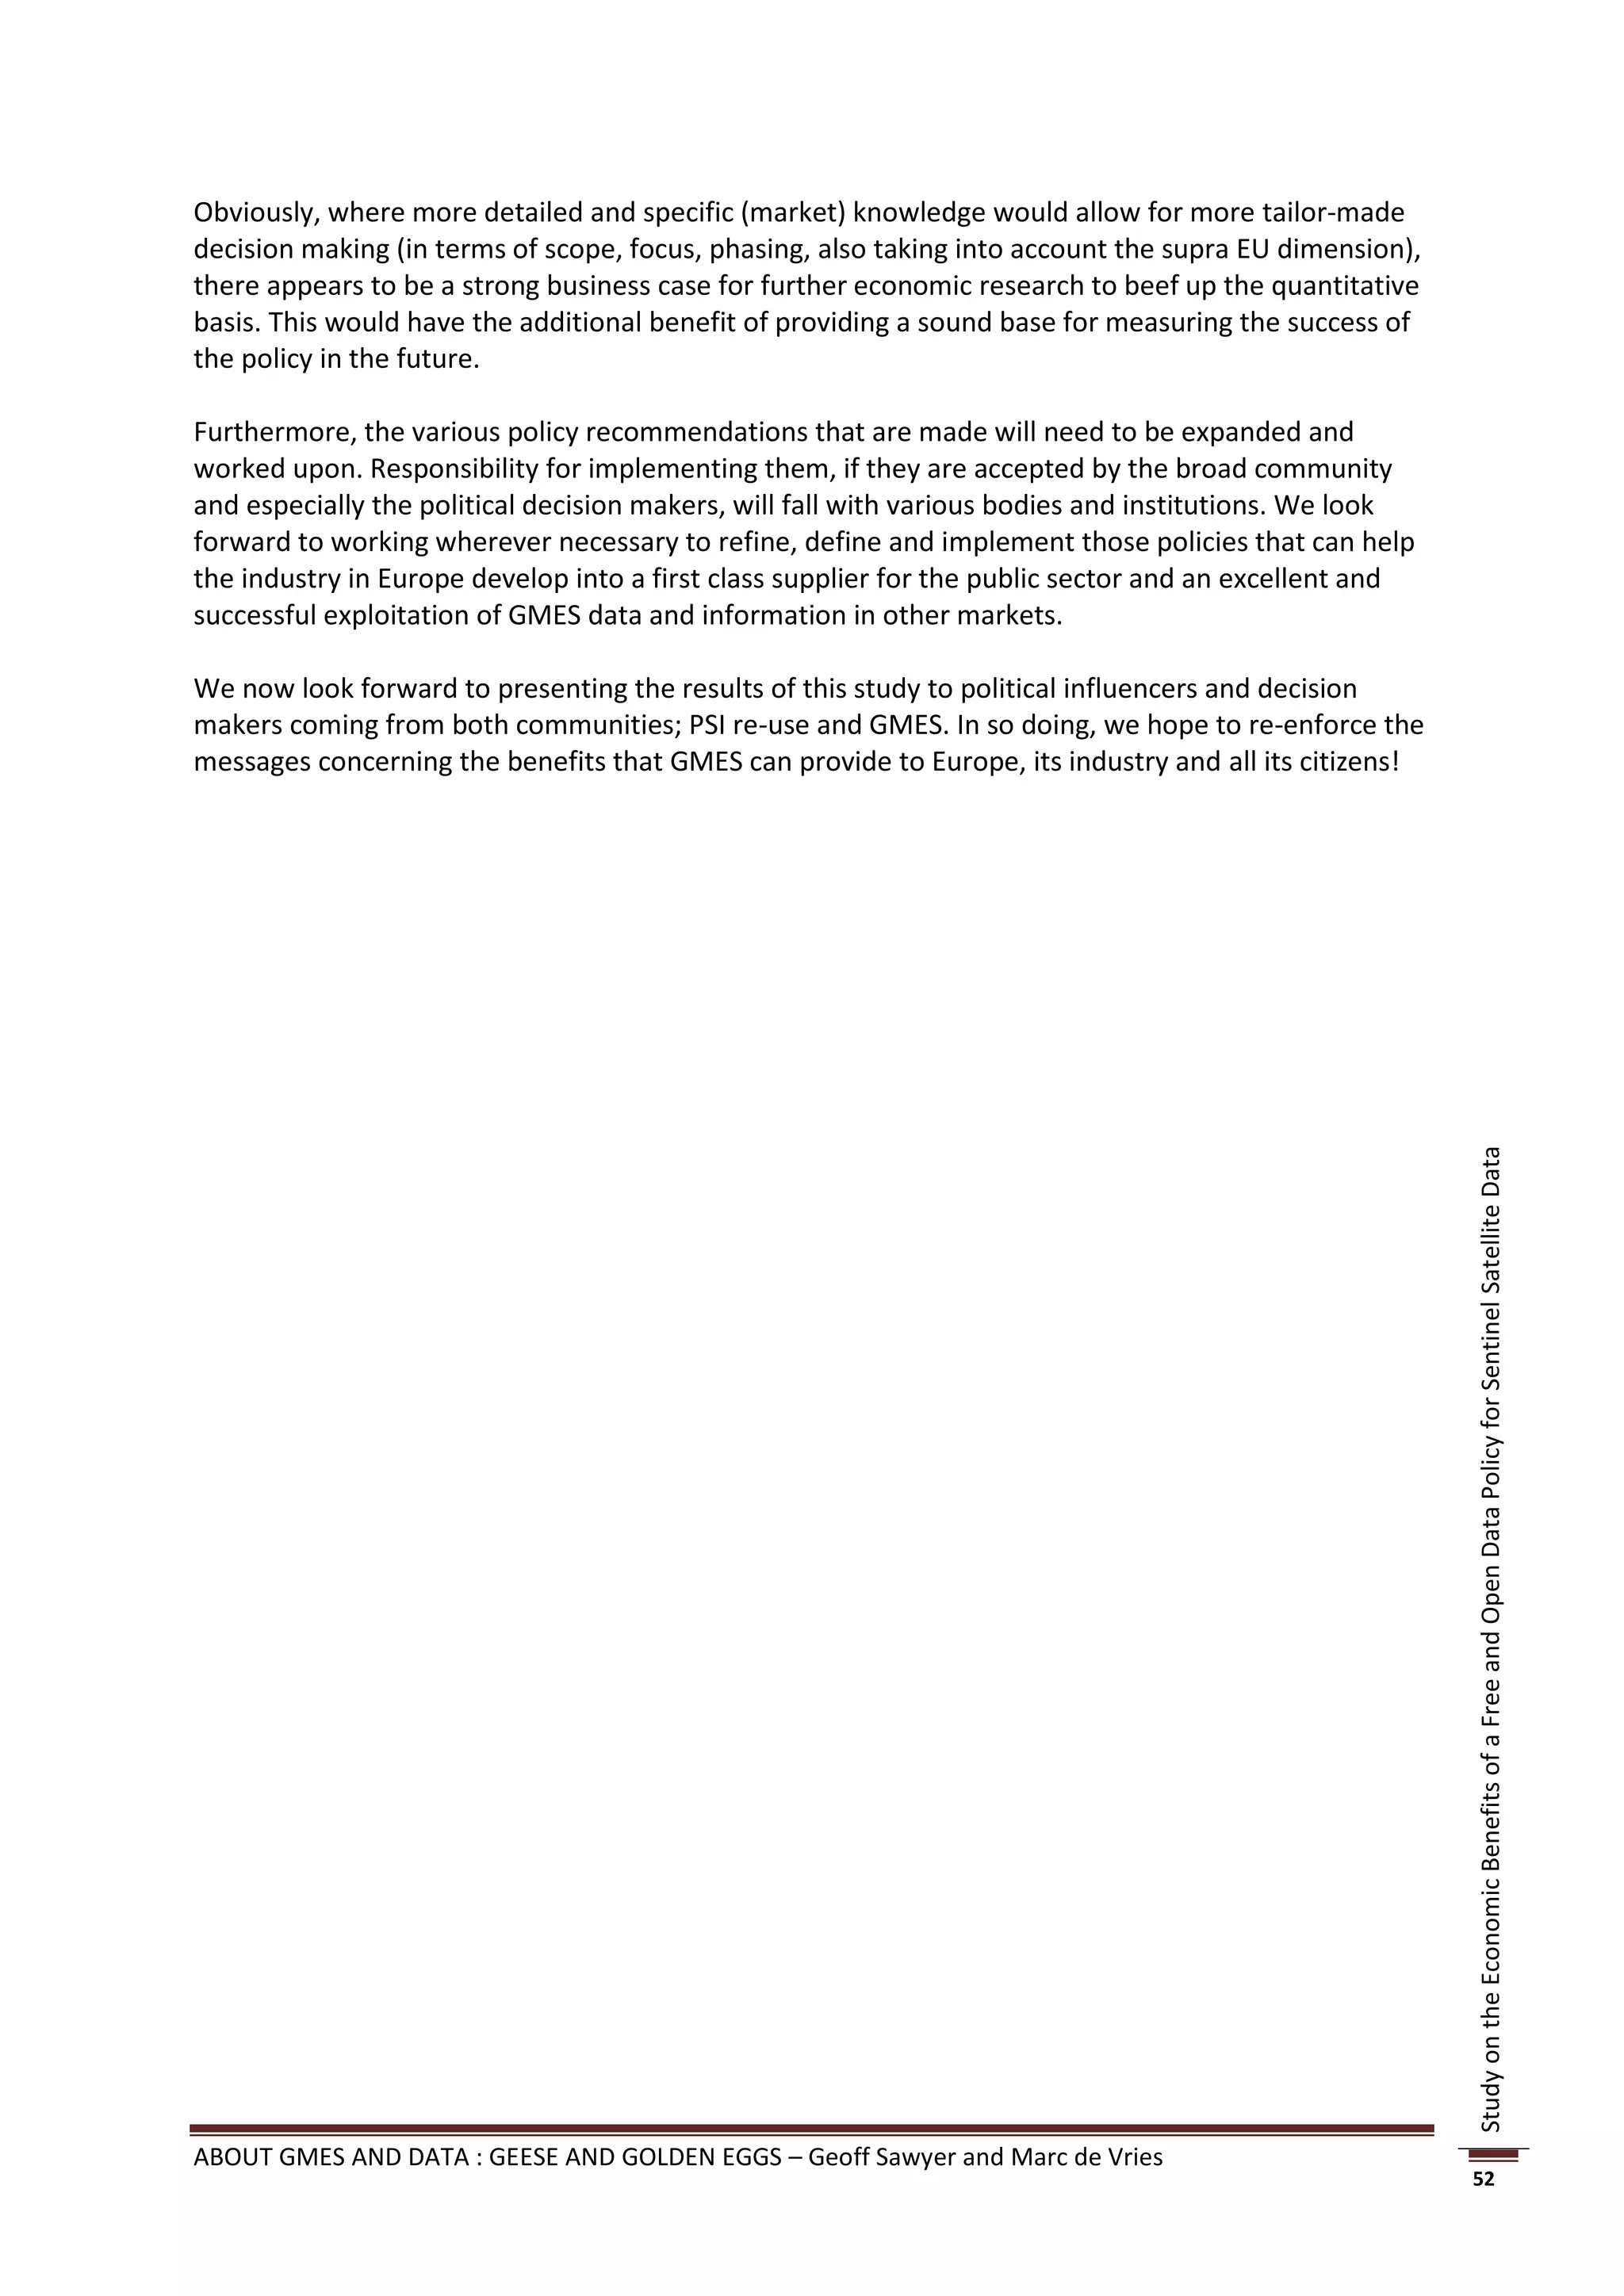
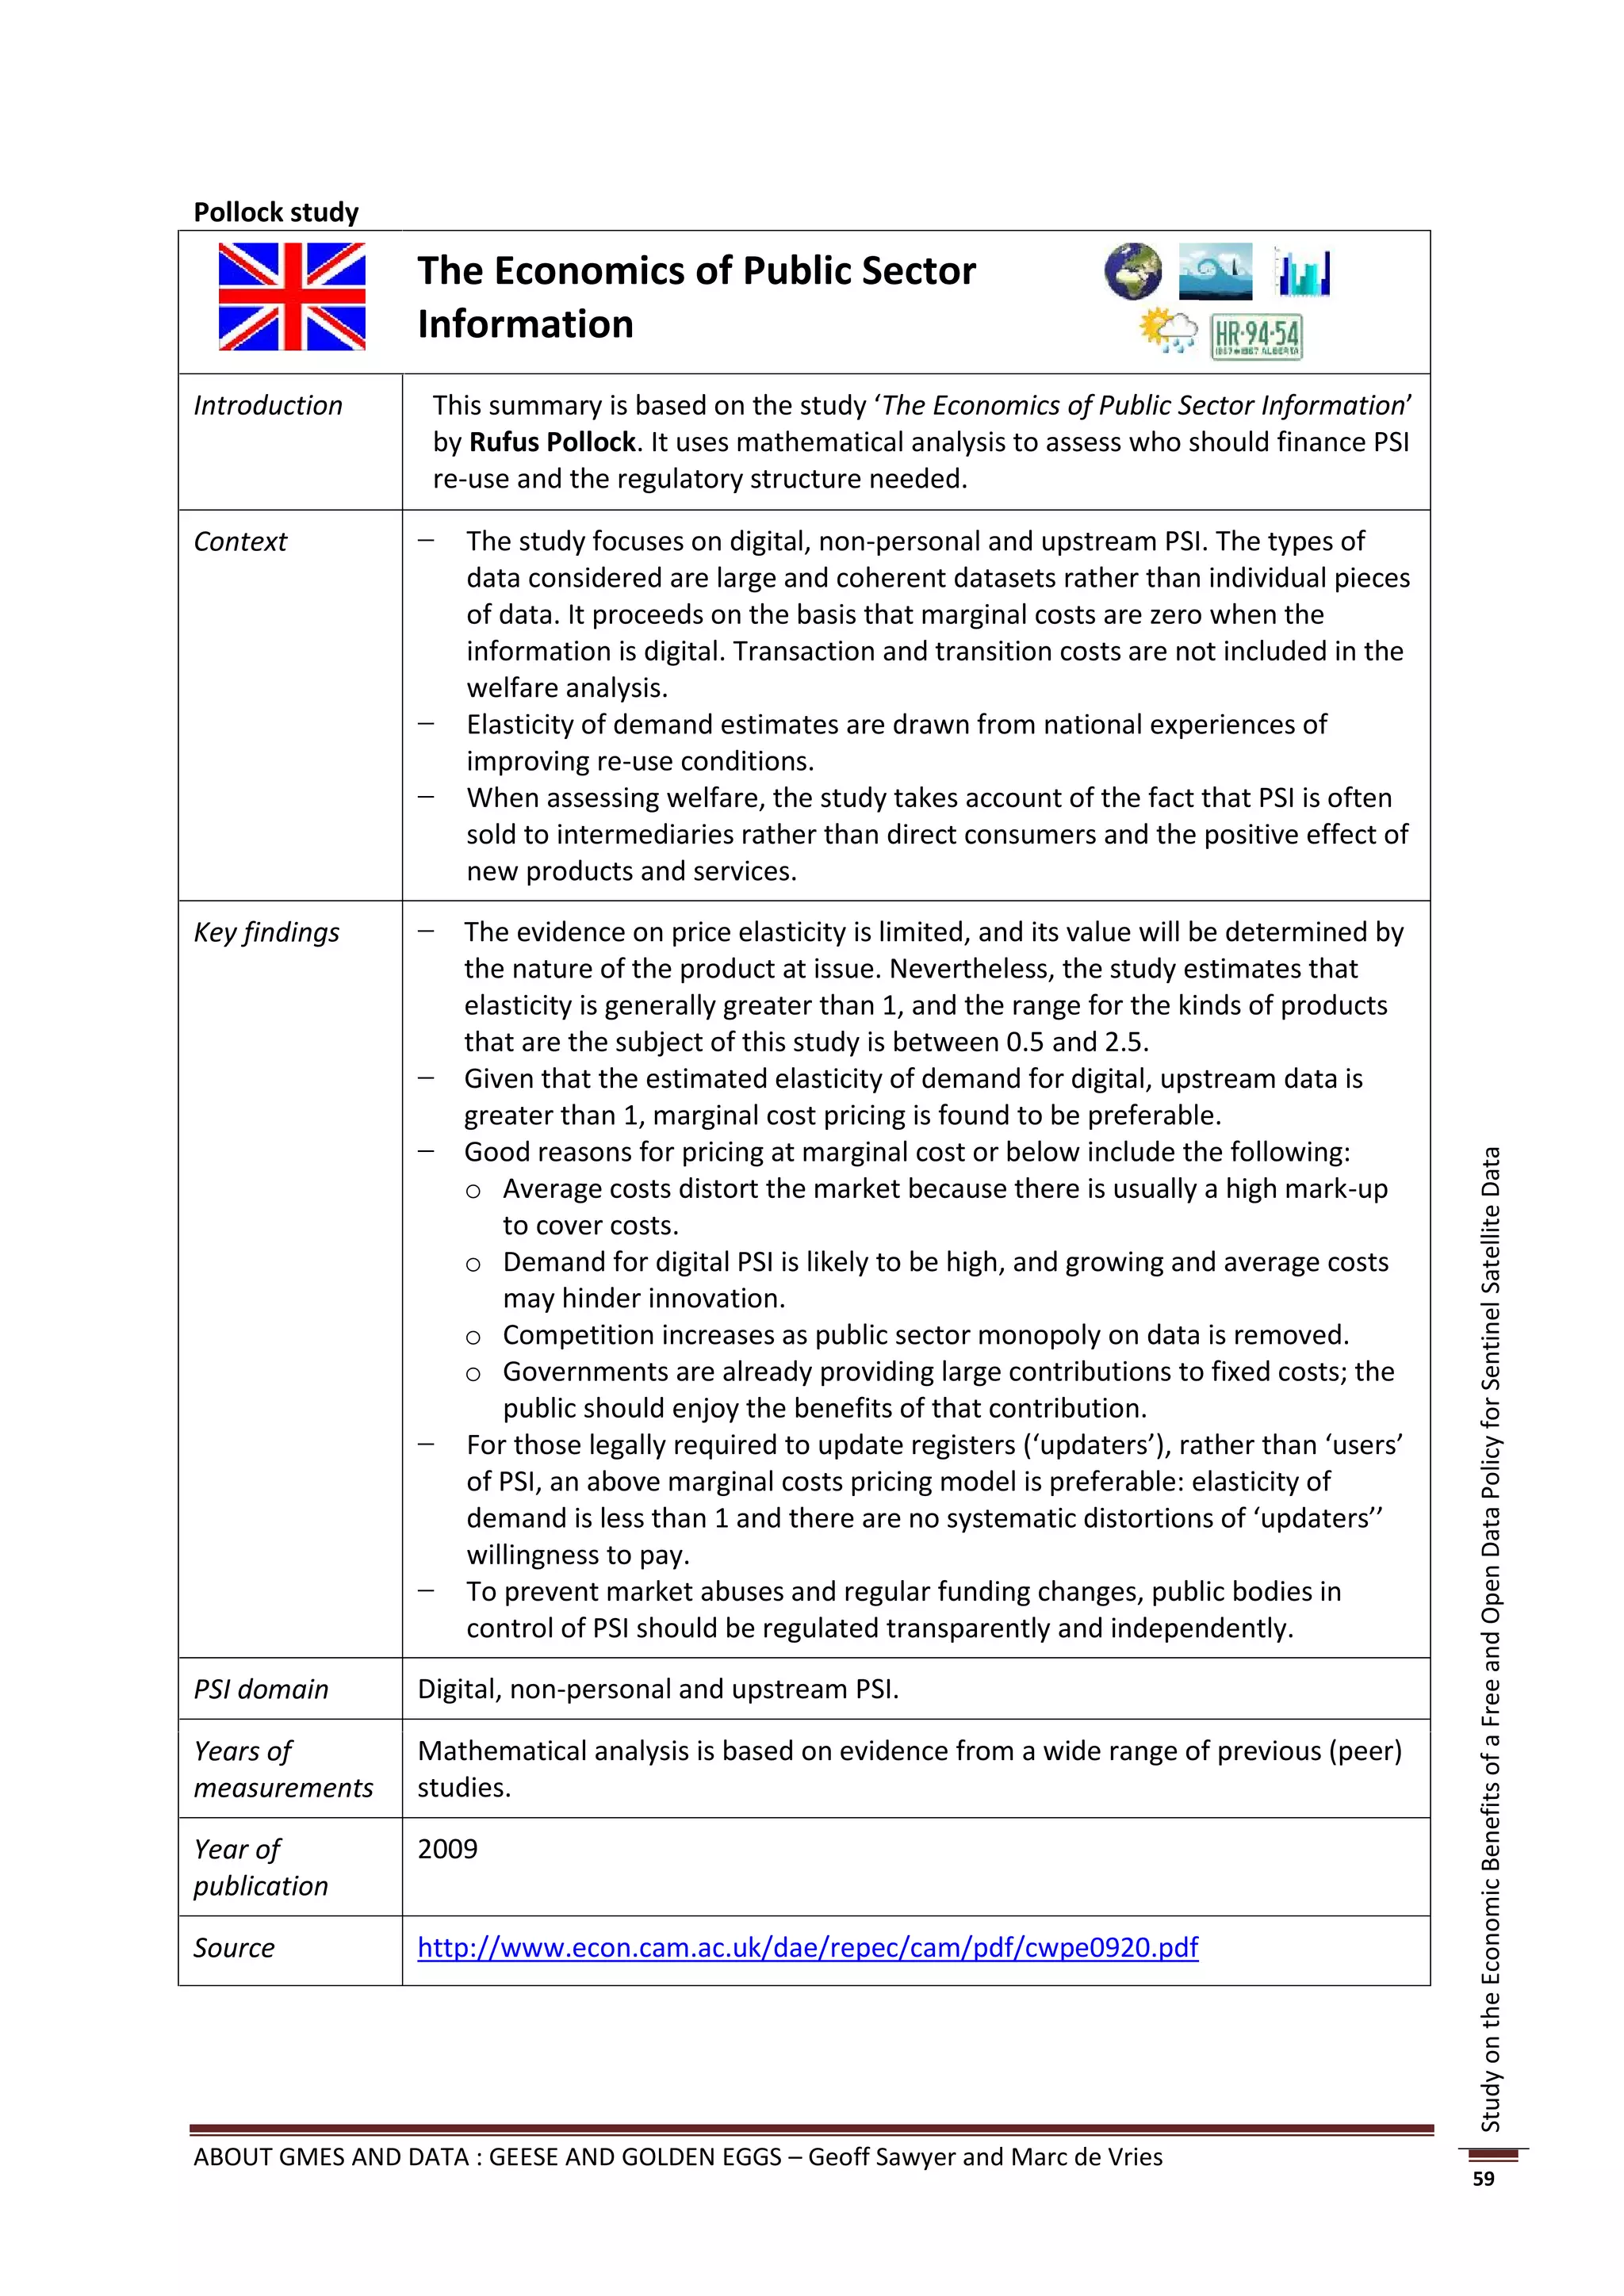
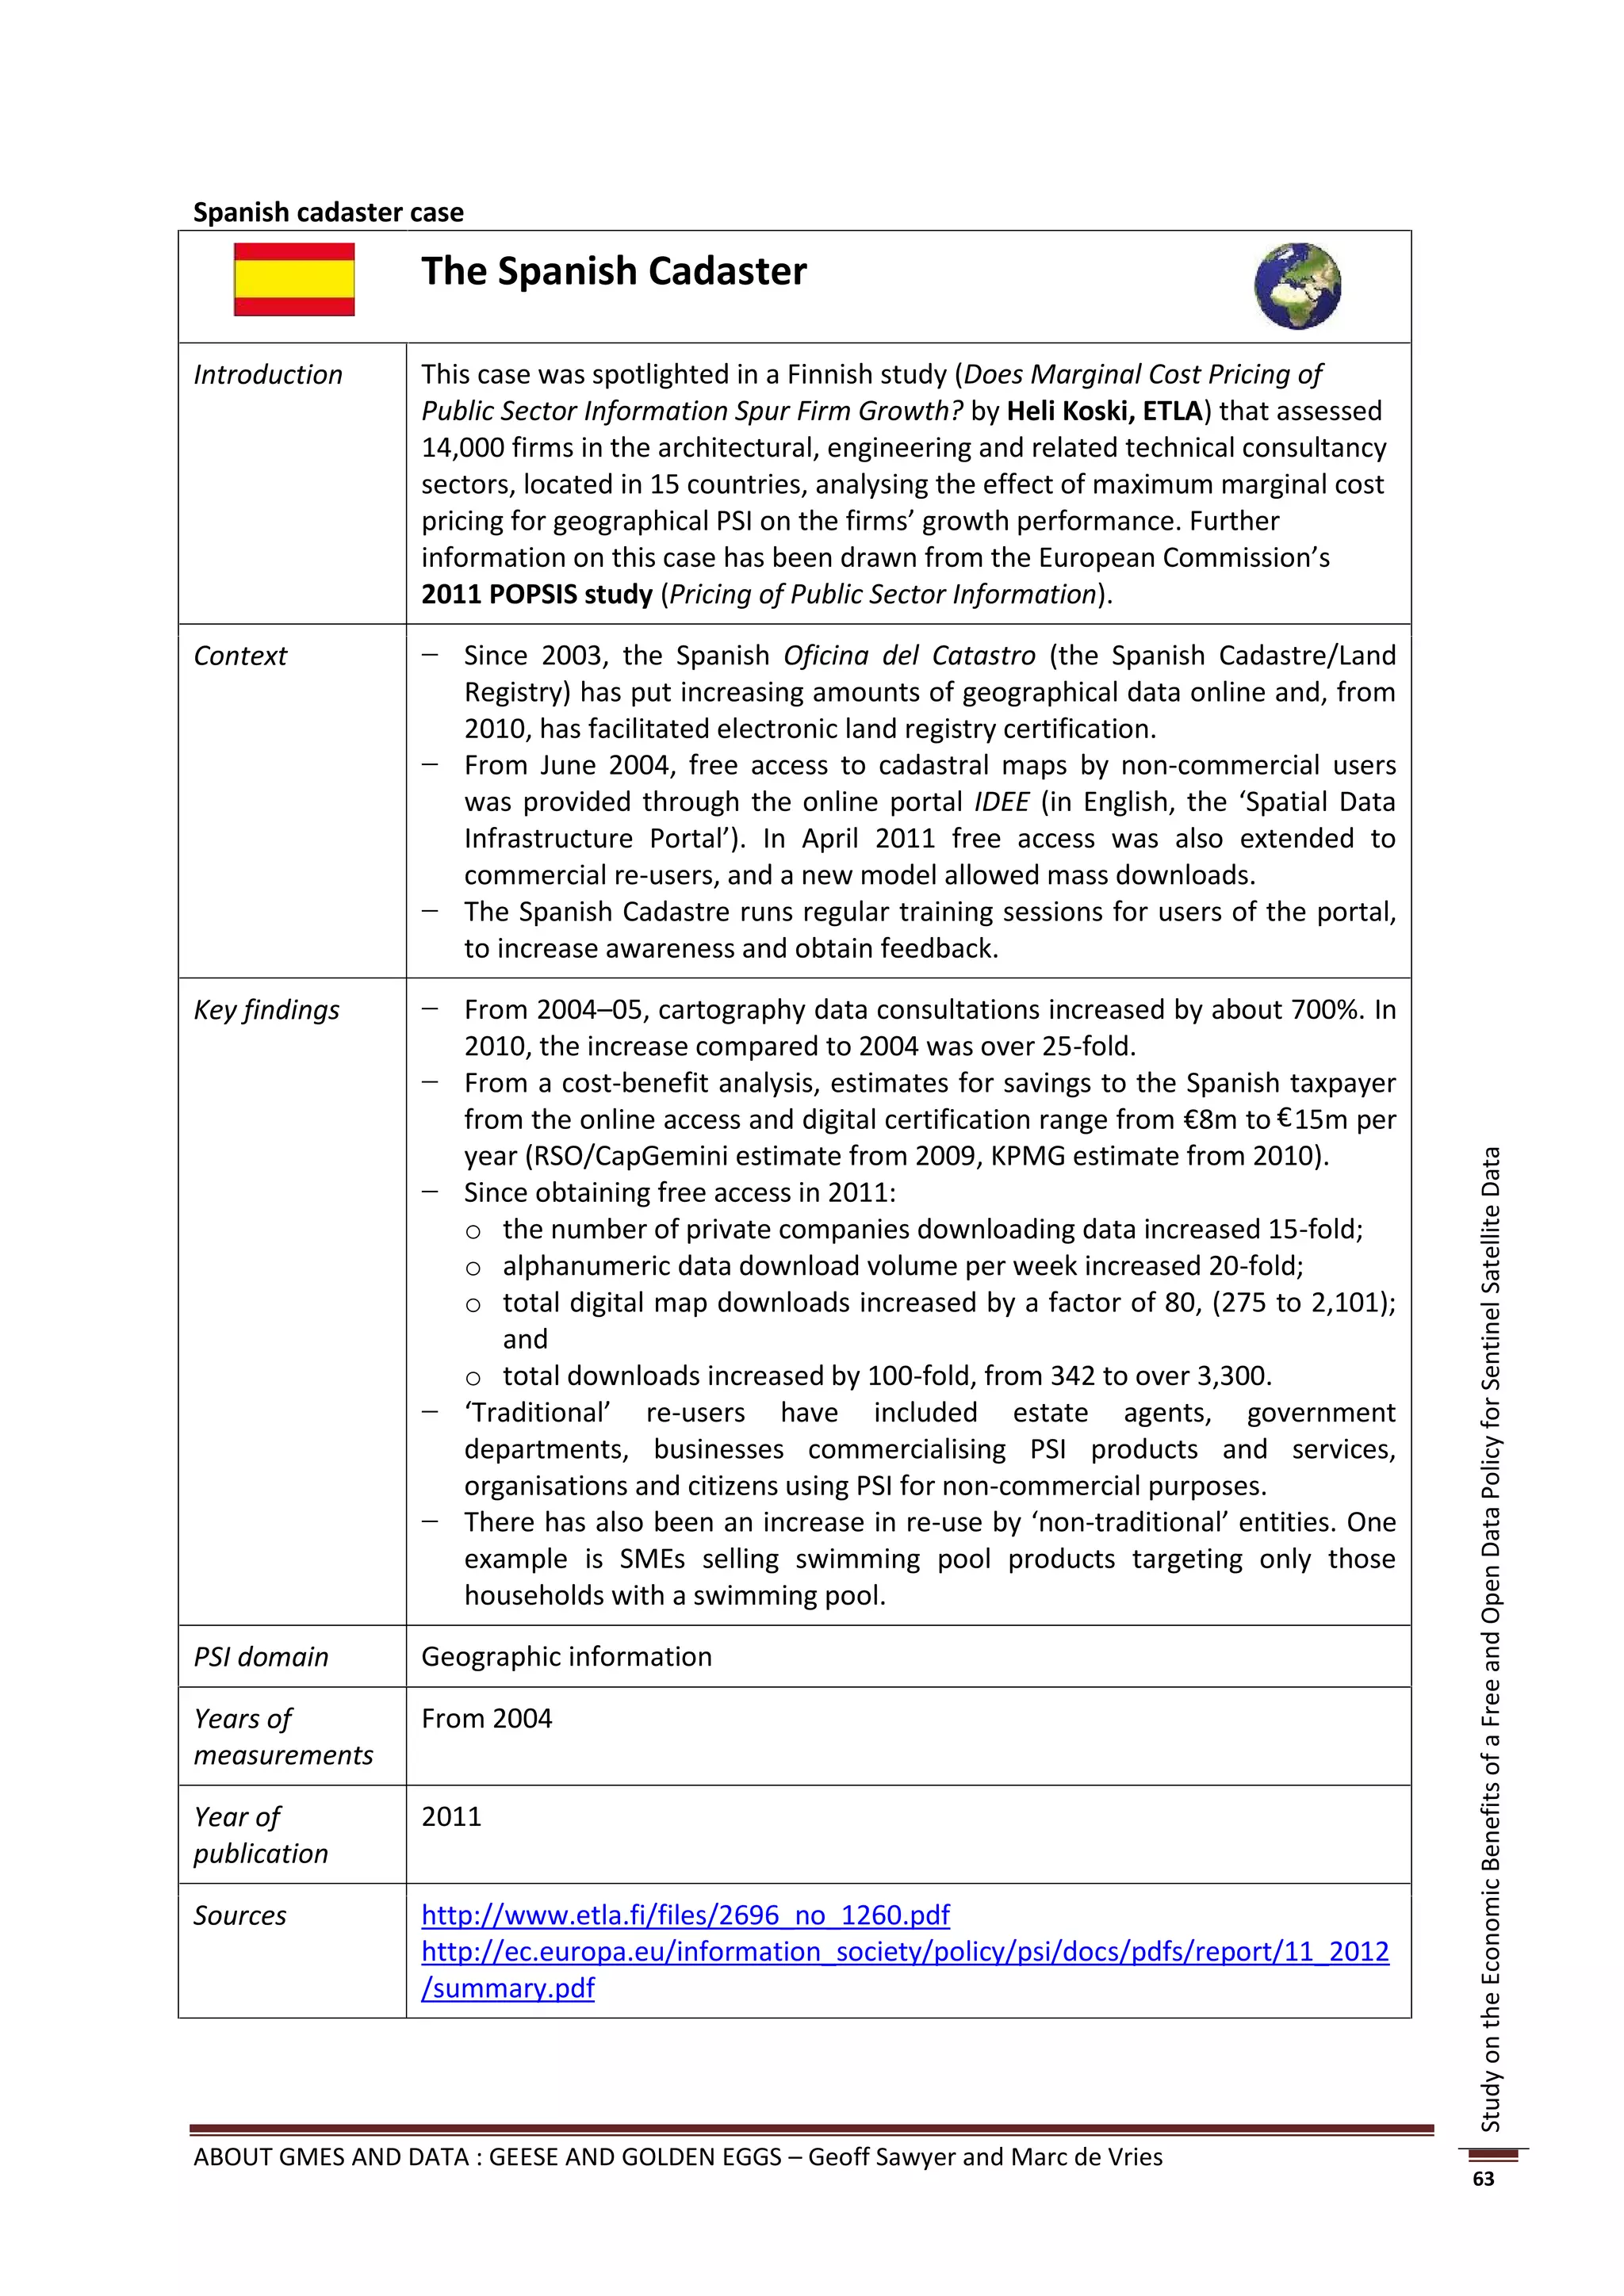
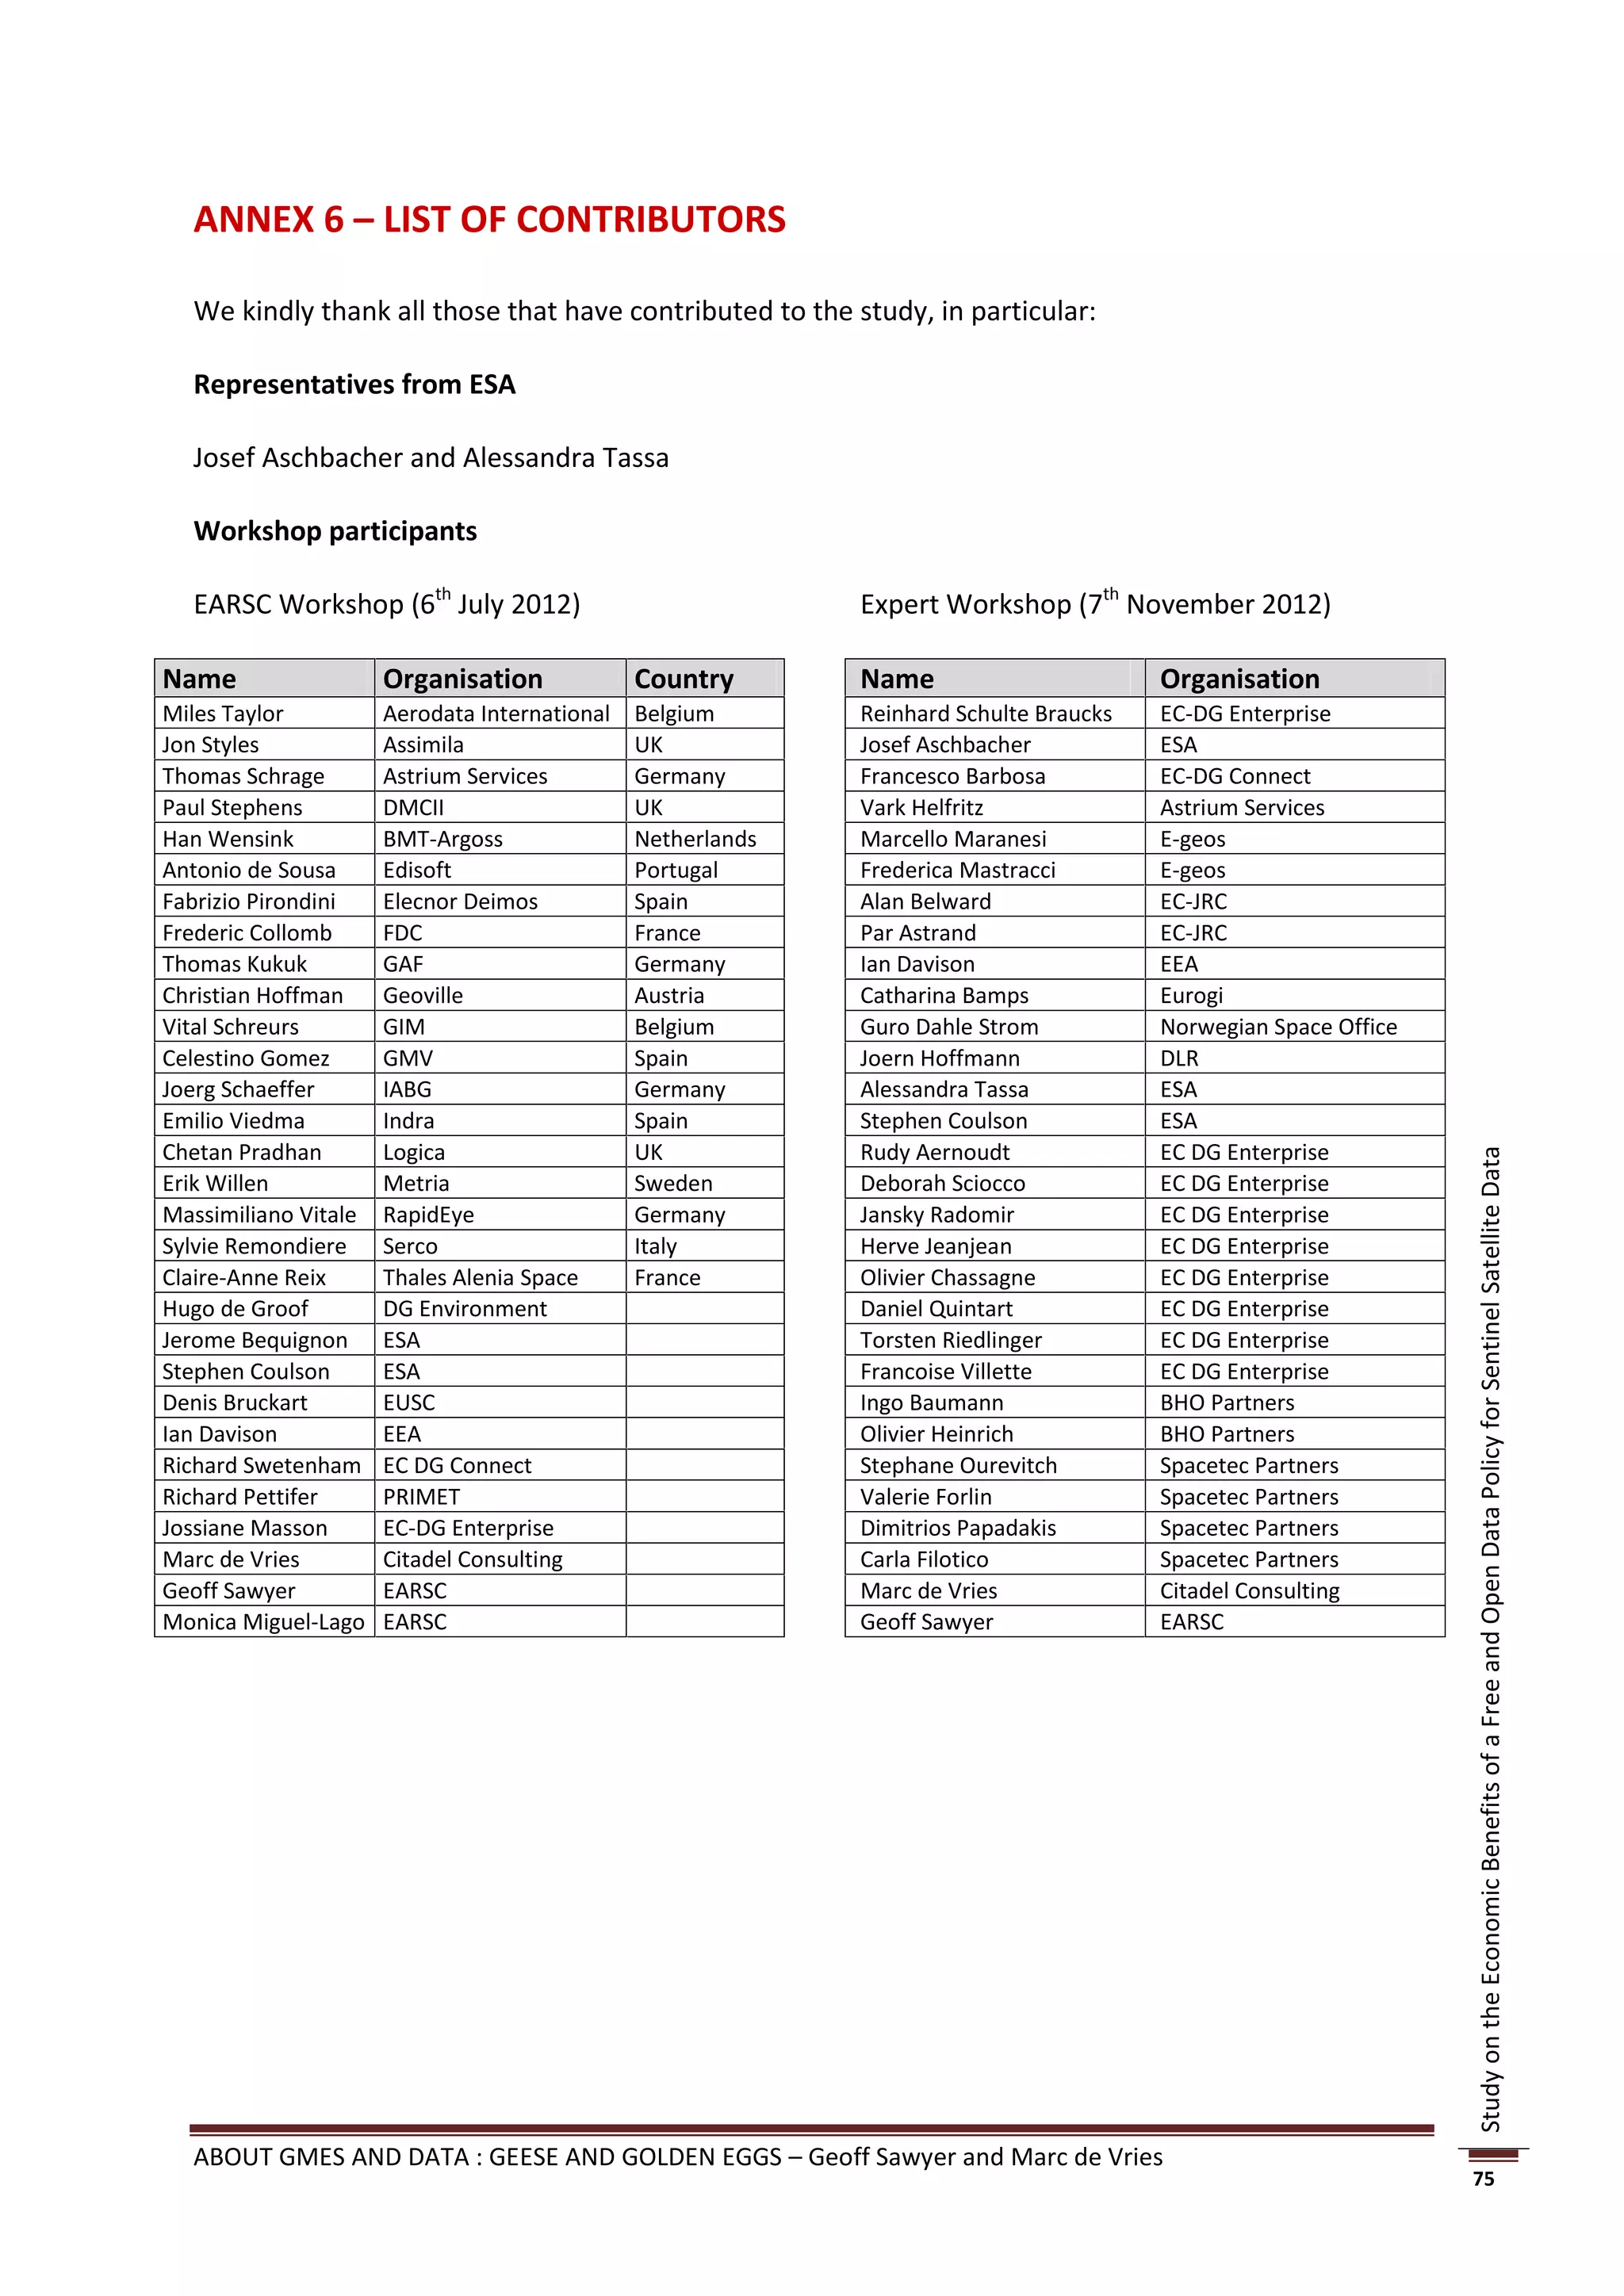
![Case study PSI domain Price cut re- Increase in demand
use charges
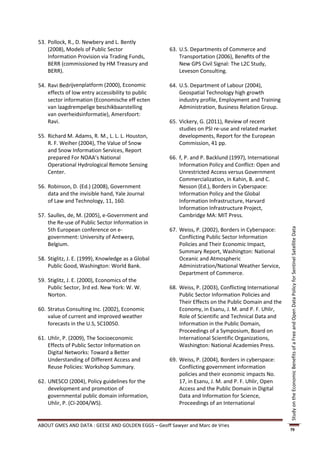
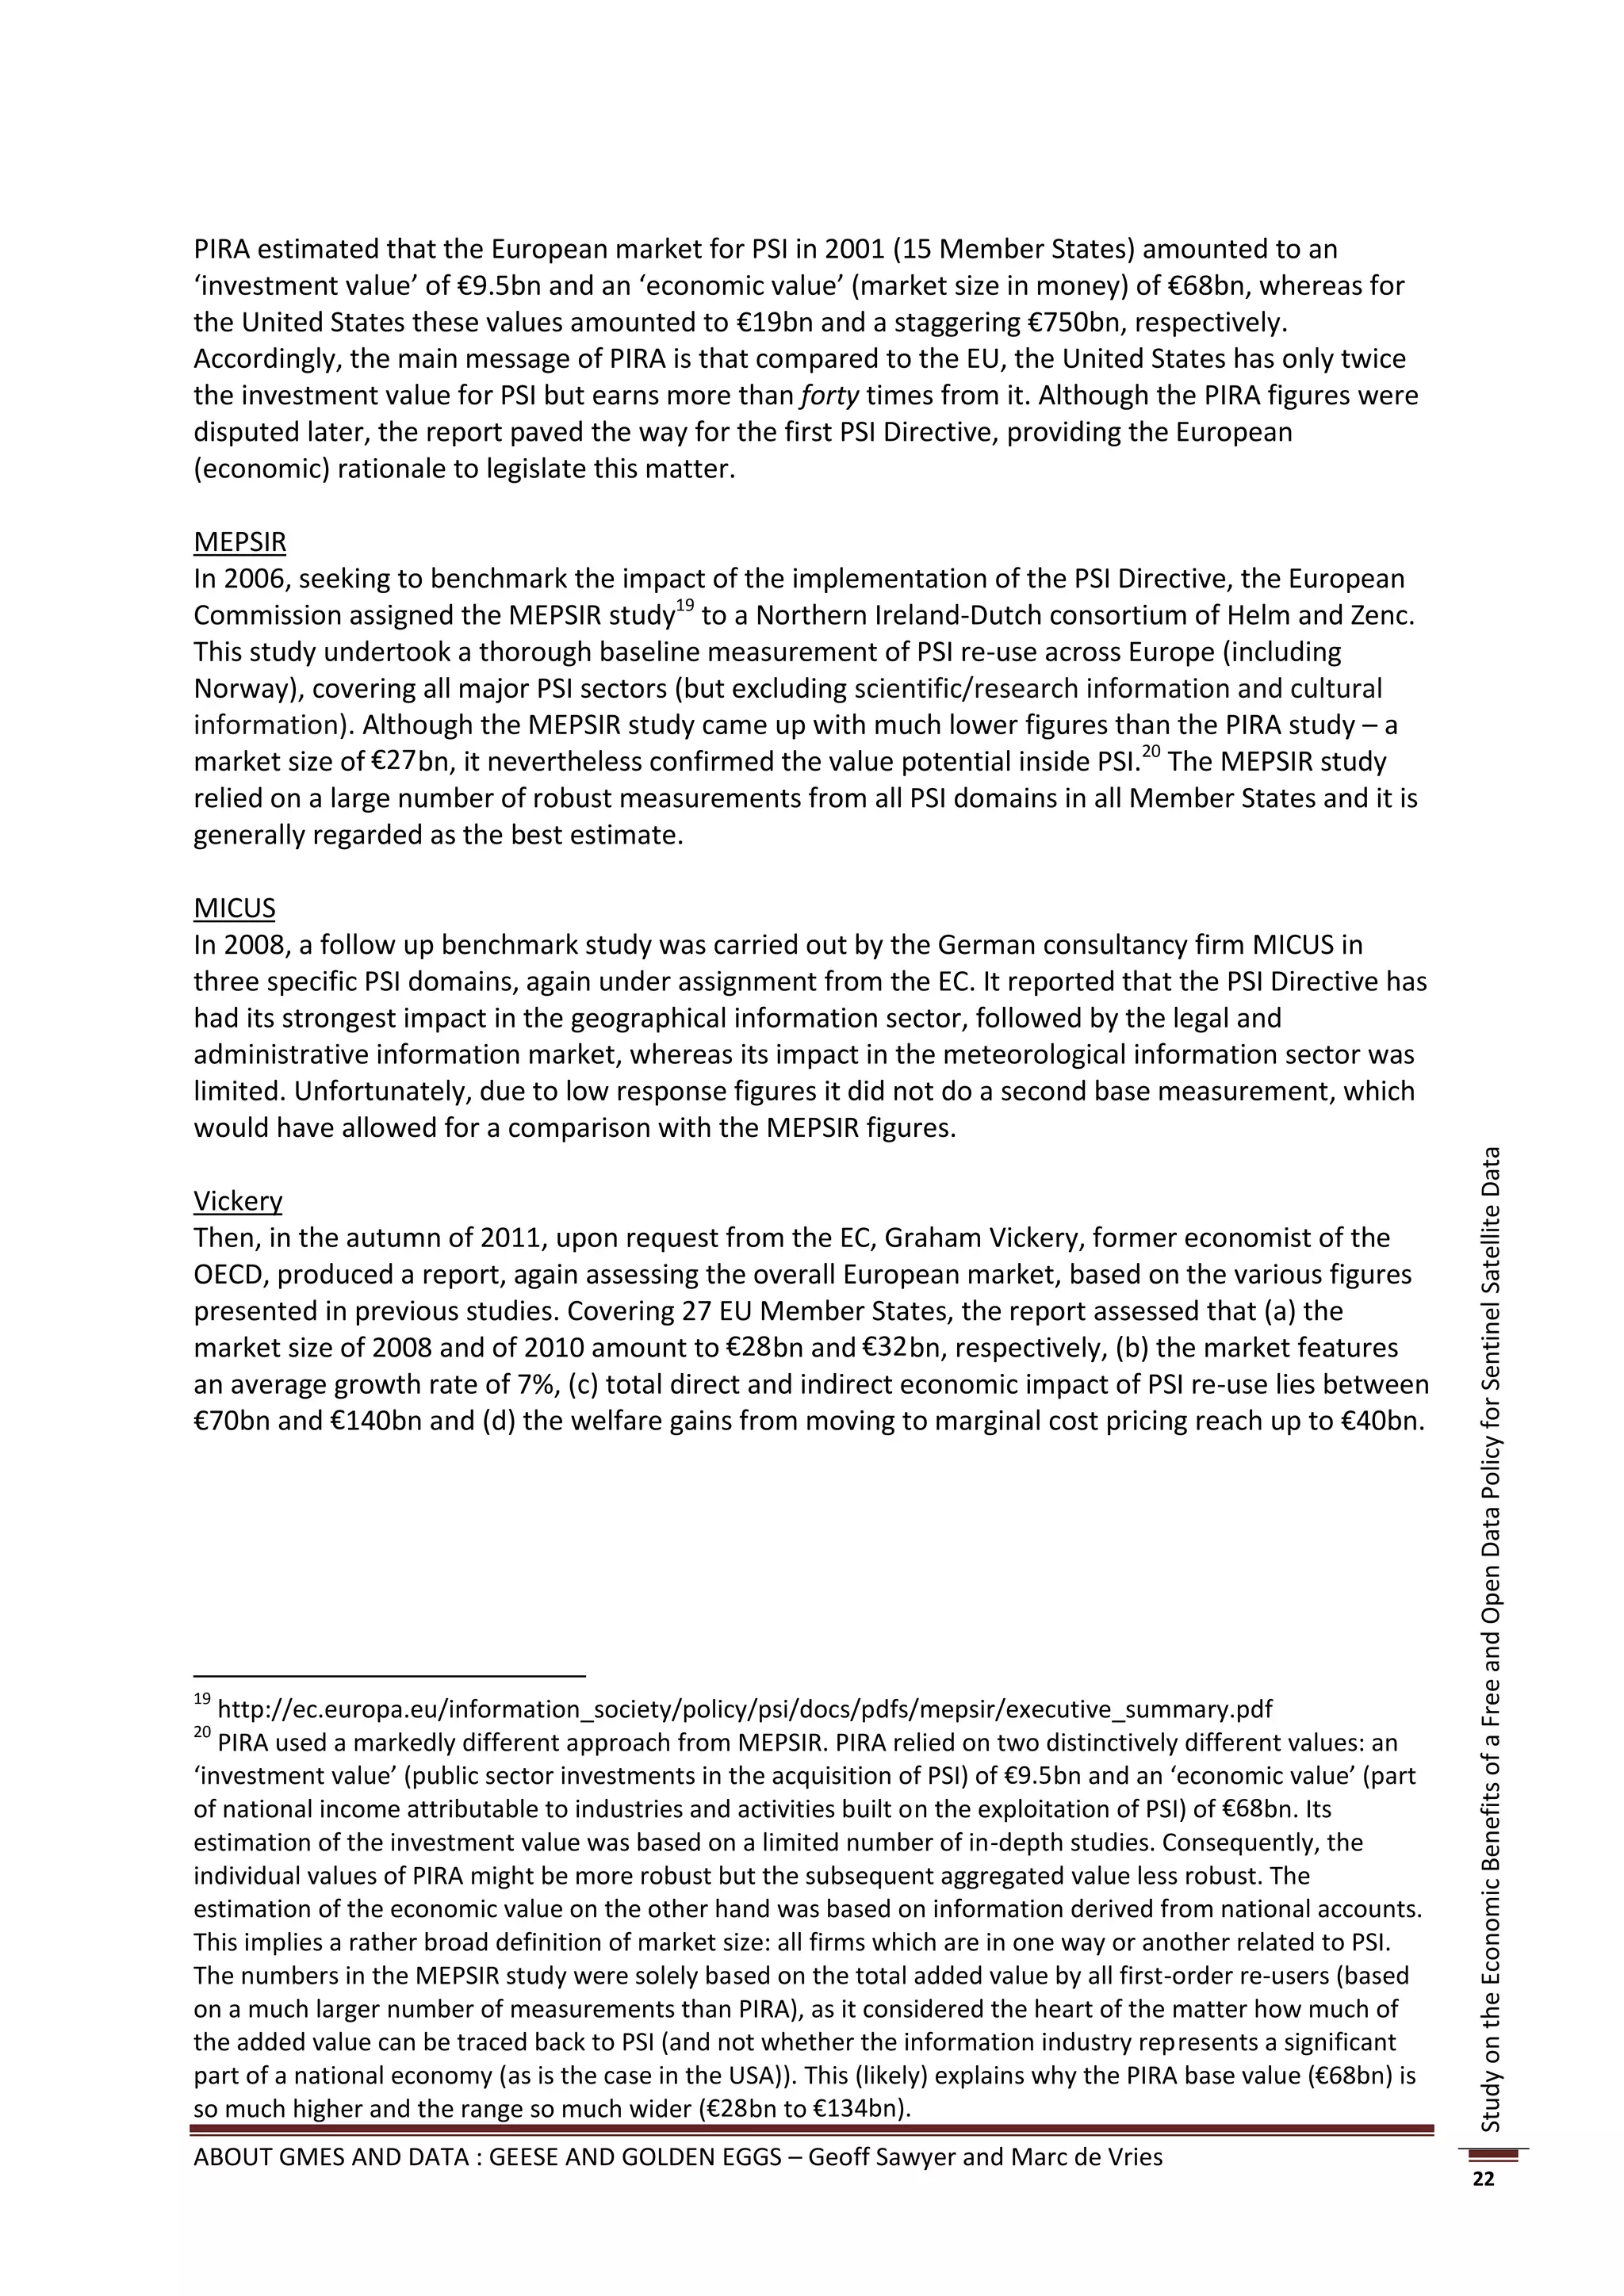
Austrian Cadastre Topographical data Up to 97% Factor 2 – 7 in number of downloads34
(POPSIS + Koski)
DECA (POPSIS) Danish address data almost 100% Factor 100 in number of re-users
KNMI (POPSIS) Dutch meteo data 80% Factor 10 in number of re-users, 90%
of them being SMEs
MET.NO (POPSIS) Norwegian meteo 100% Factor 30 in numbers of unique
data weekly re-users, majority being SMEs
Spanish Cadastre Spanish 100% - Factor 80 – 100 in numbers of
(POPSIS + Koski) topographical data downloads
- Factor 25 in numbers of re-users
Houghton study Australian:
- Topographical - almost 100% - 172%
data - 100%
- Statistical data - Factor 3 in product downloads
- Hydrological data - 100%
- Factor 100 in data requests
- Factor 2 for extractions of re-use
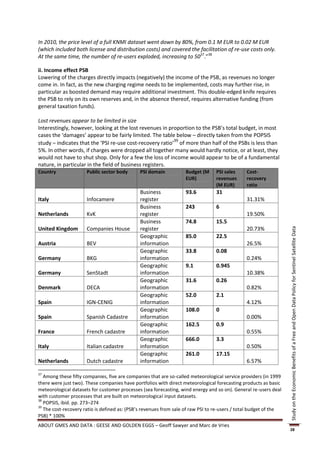
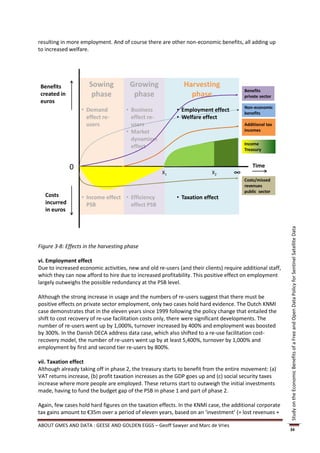
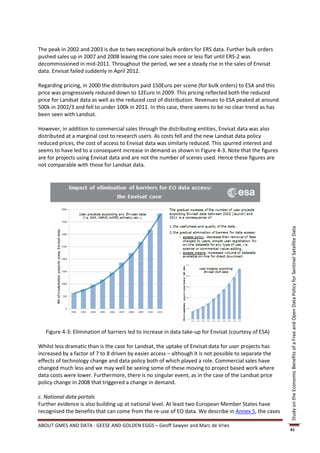
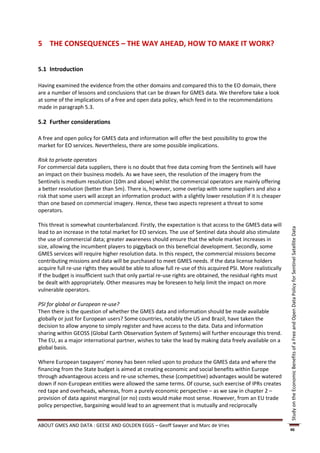
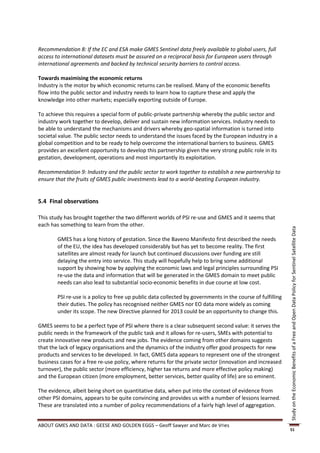
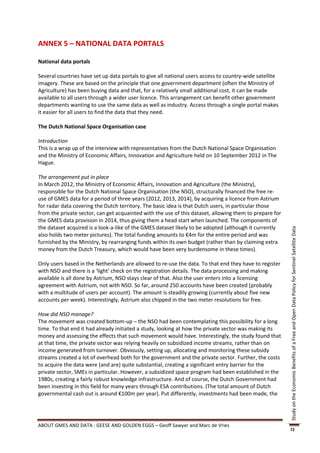
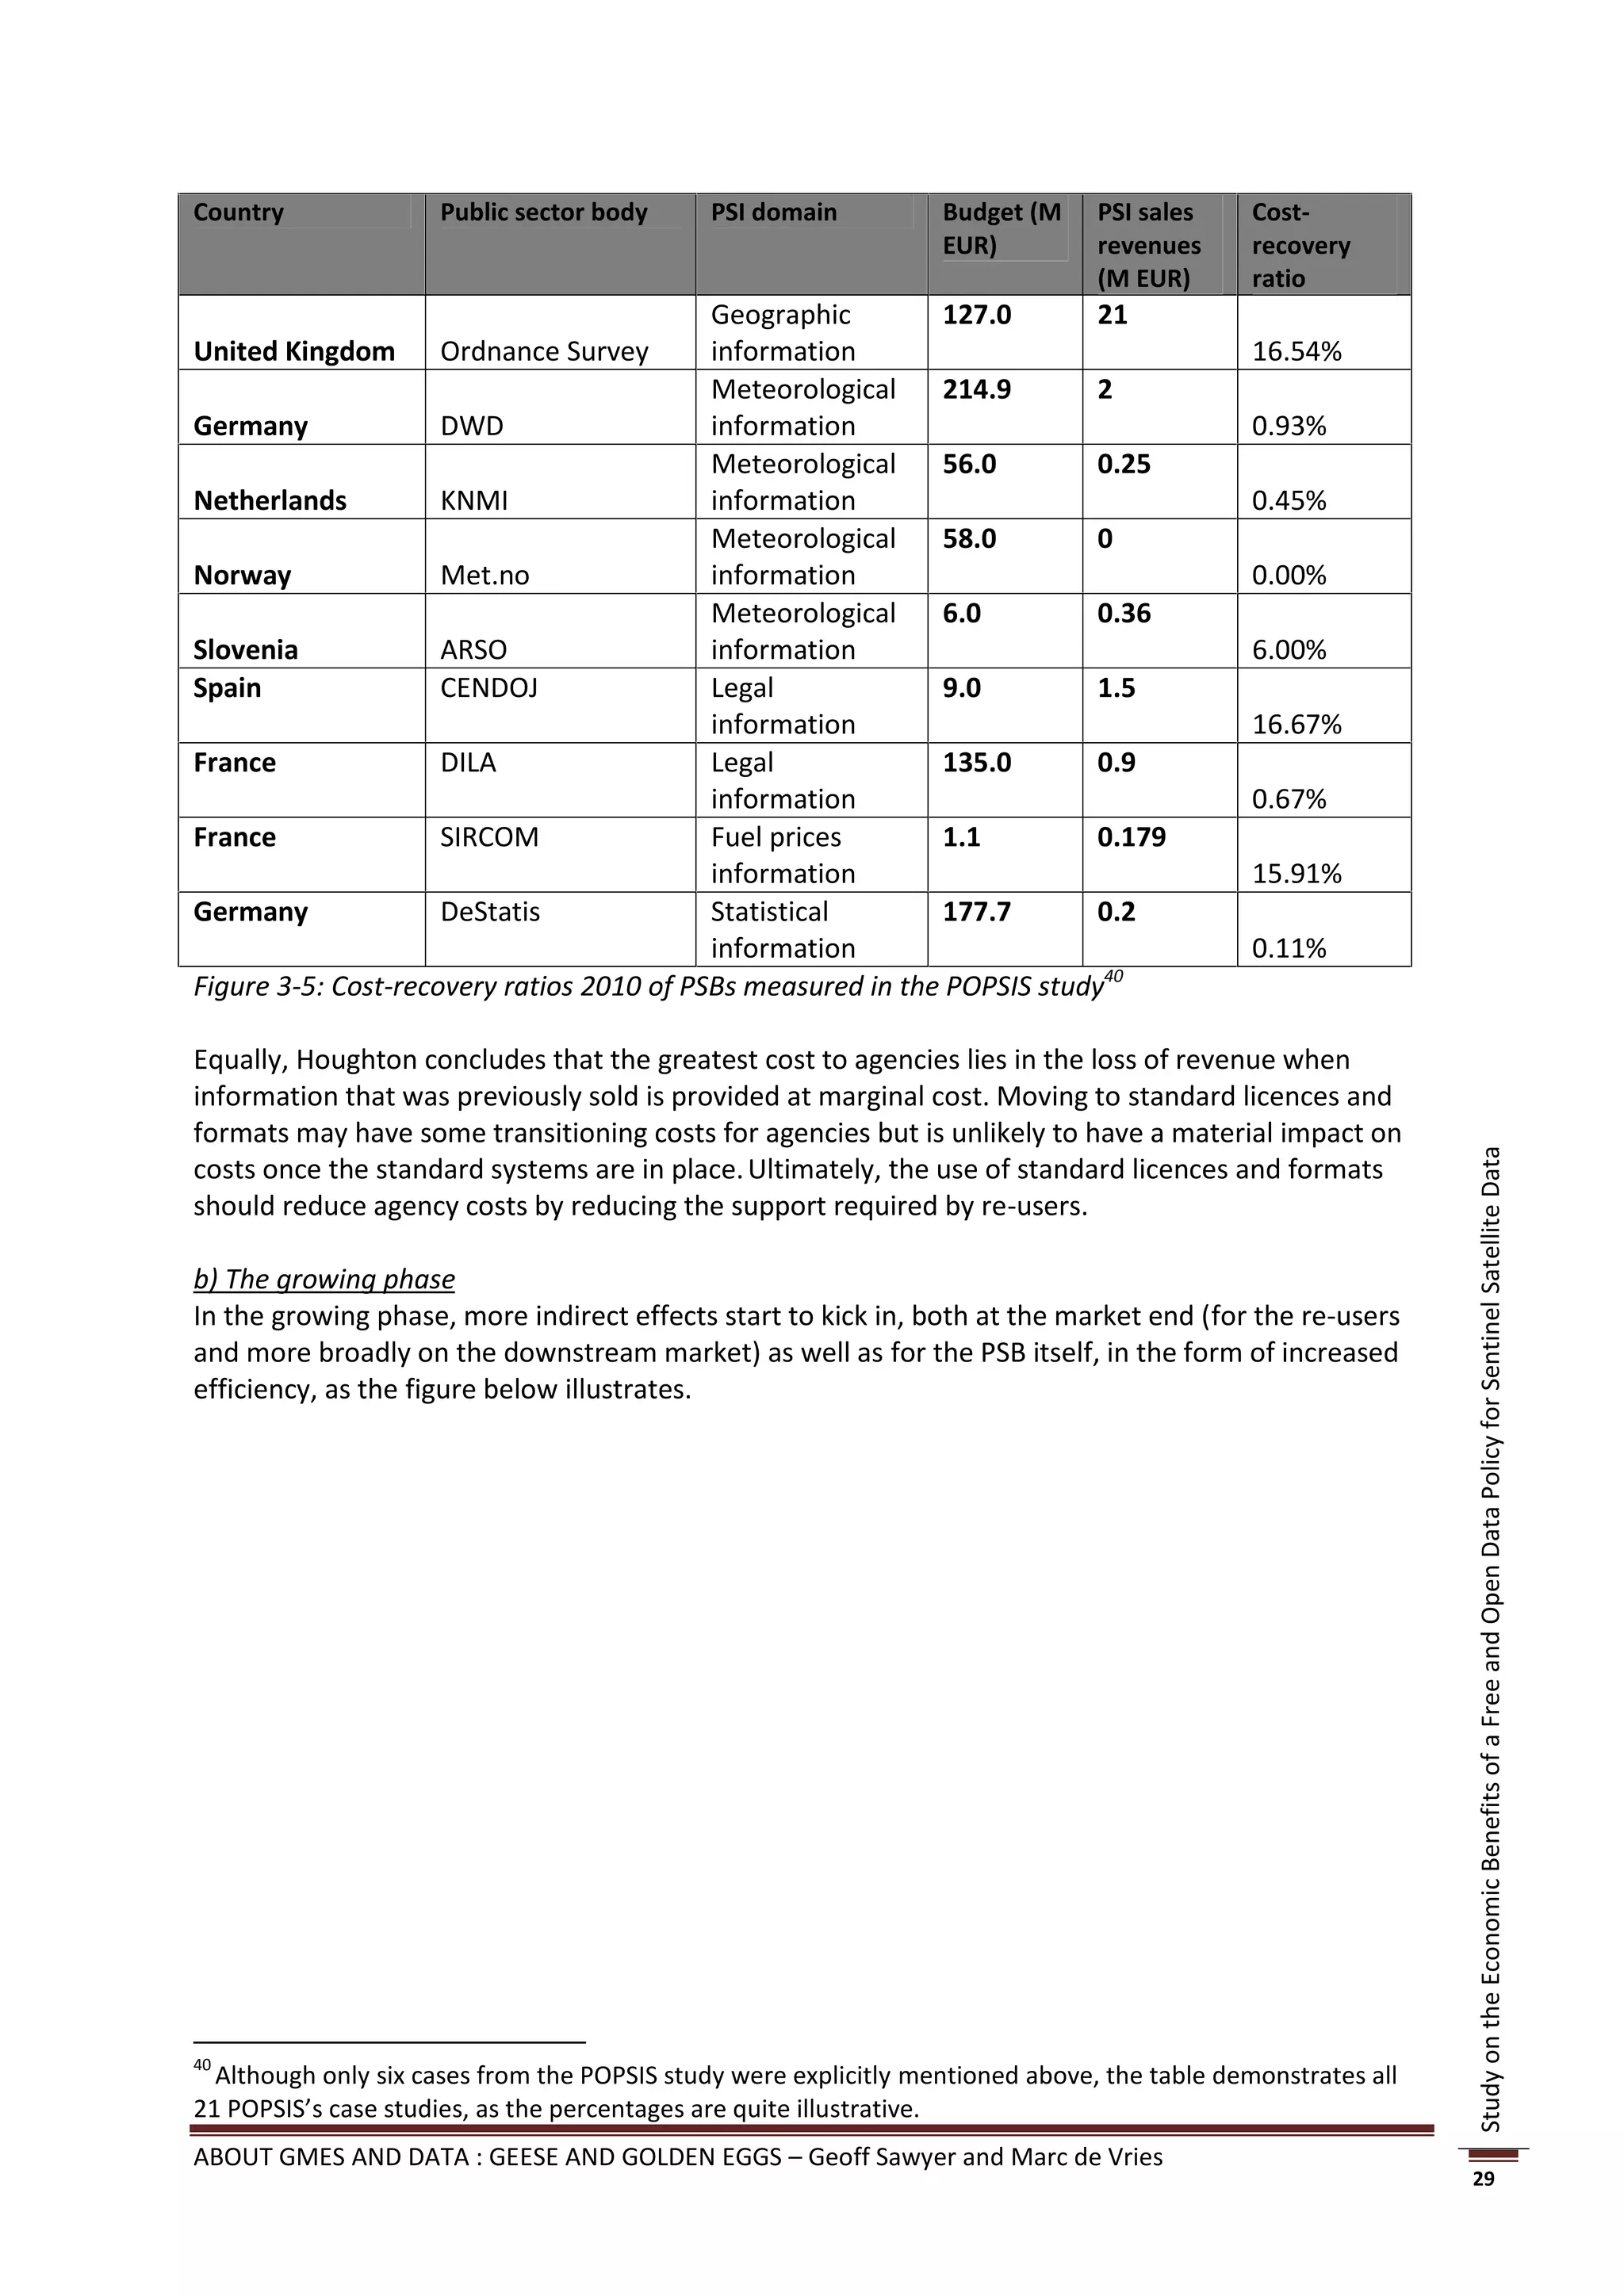
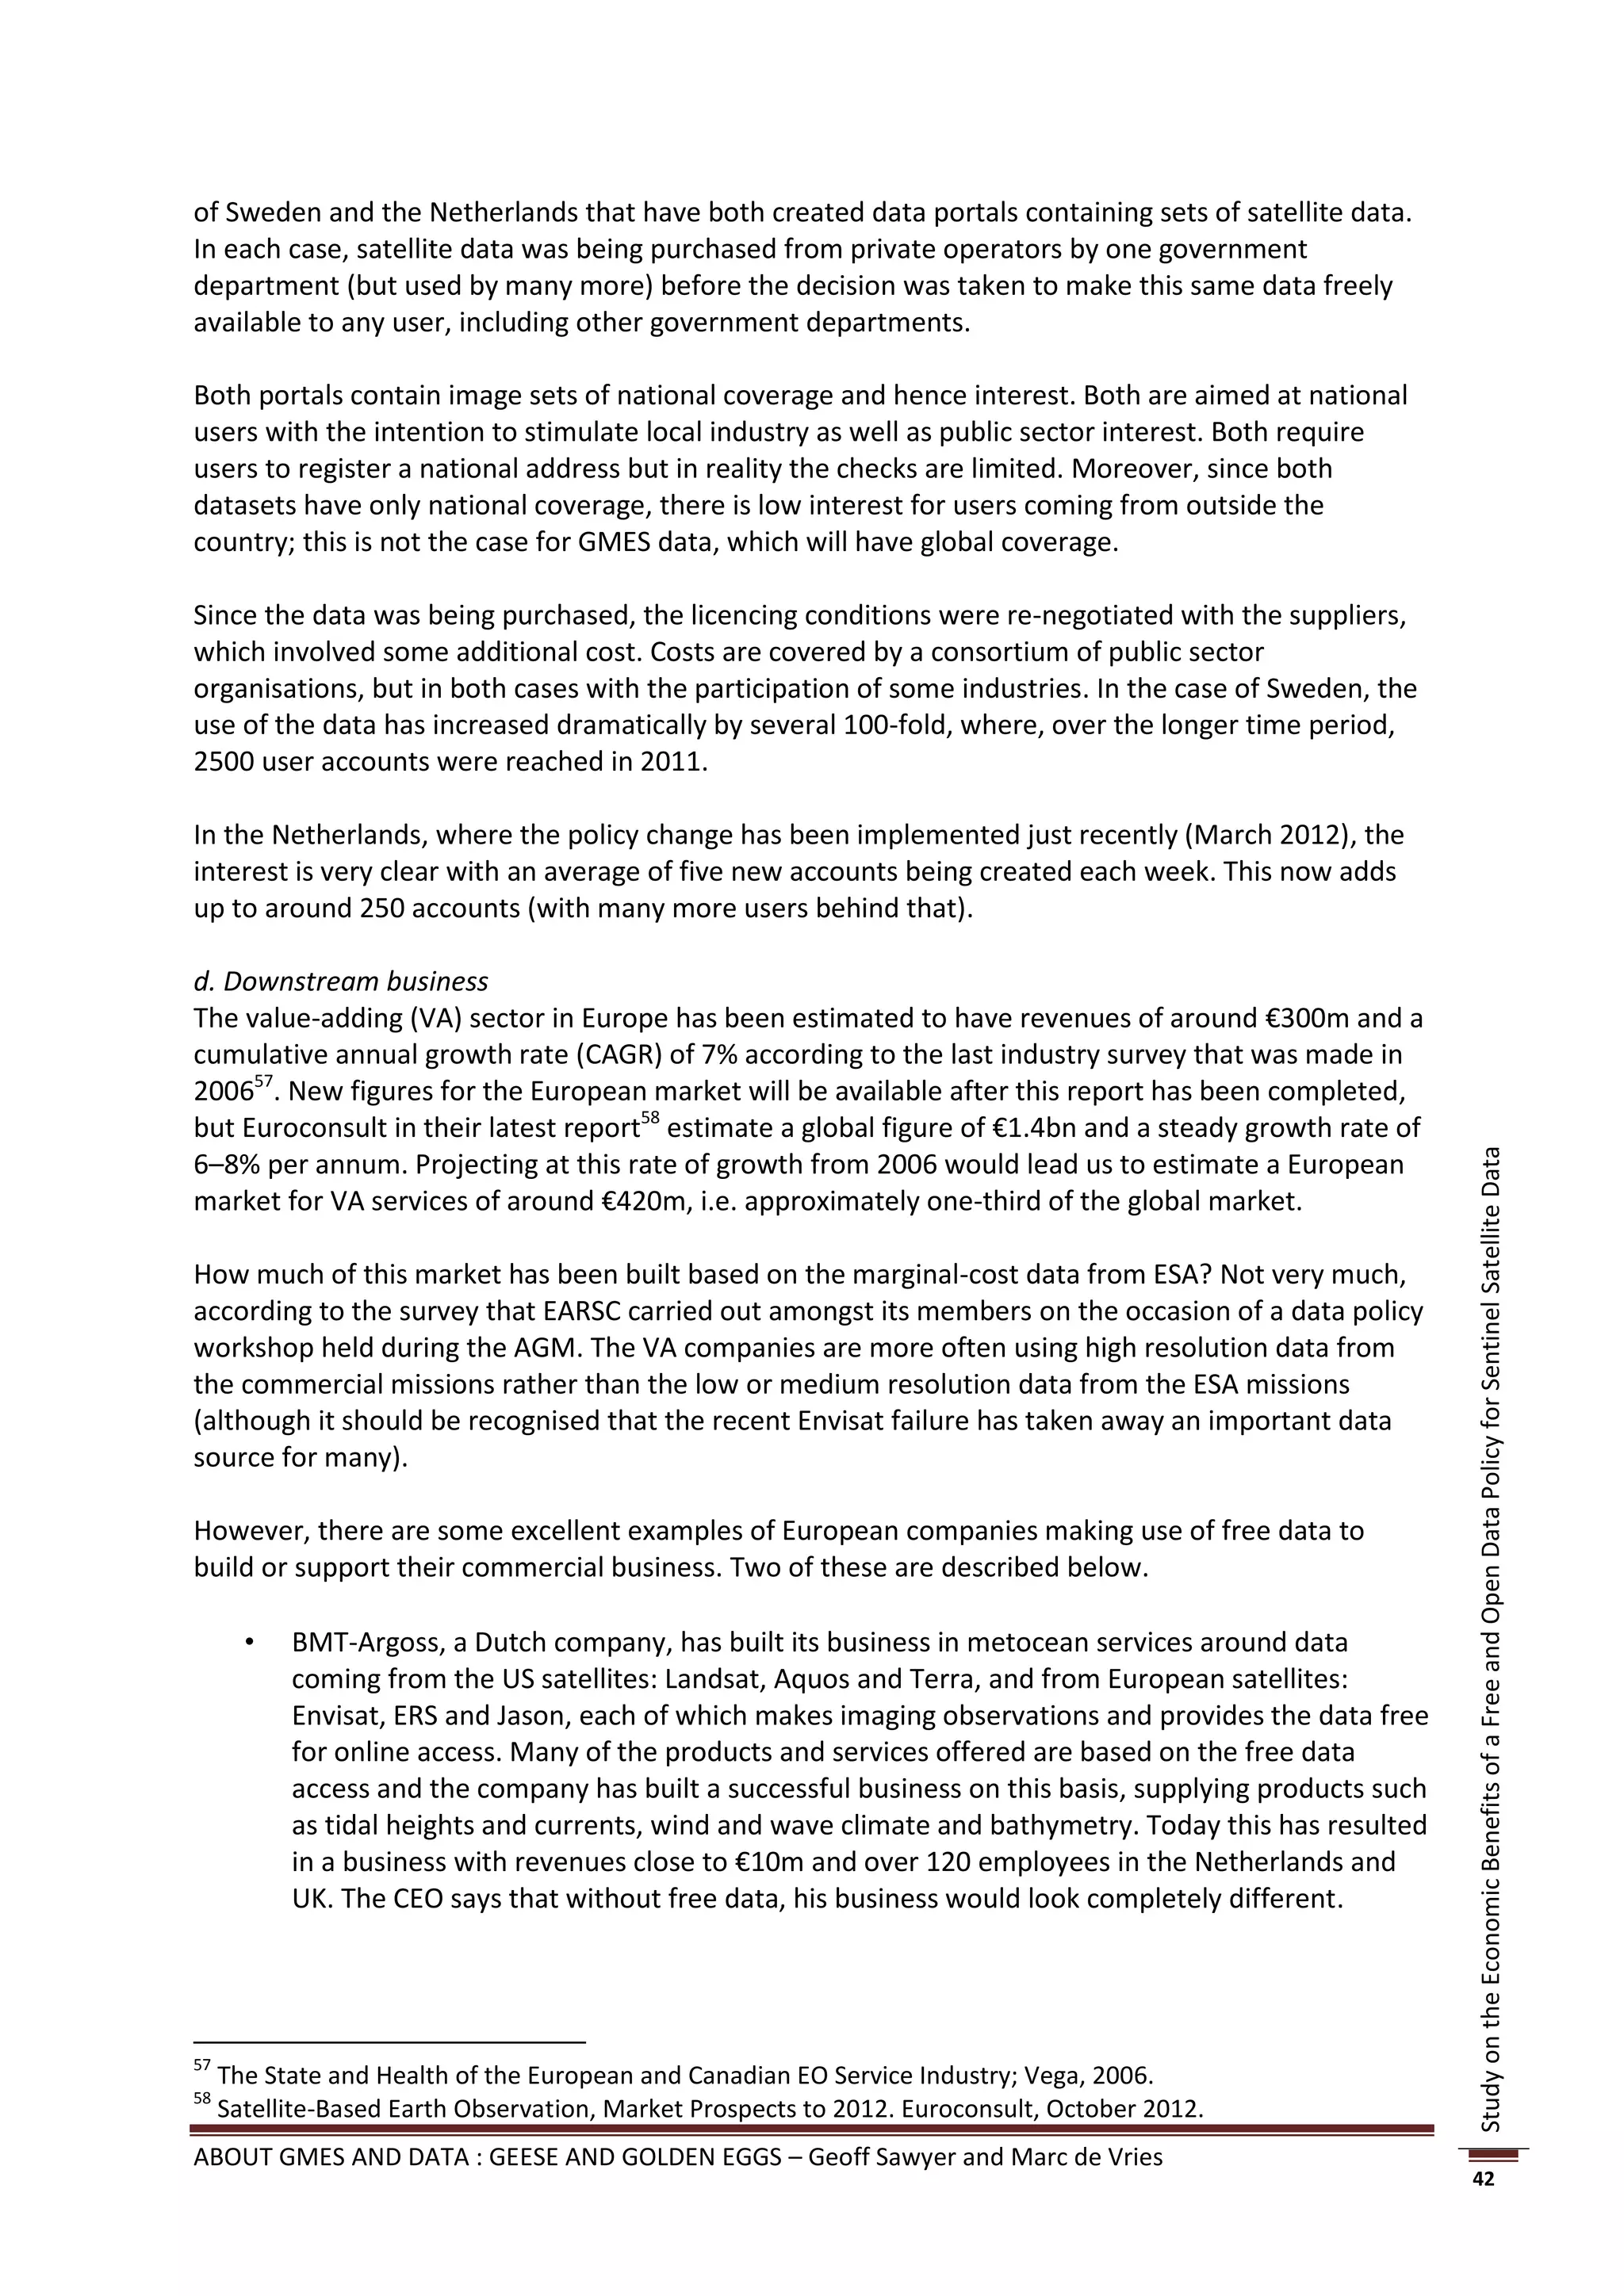
Figure 3-4: Overview of increases in demand following lowered PSI re-use charges
PSI features relatively elastic demand
These figures confirm previous research (Trading Funds Study and Pollock Study) that suggested a
price elasticity of demand (PED) well above 1 (in absolute terms), meaning that in case a PSB lowers
its prices (so not dropping the charging all together) the relative increase in quantity outweighs the
relative discount, generating higher revenues than before.35
Study on the Economic Benefits of a Free and Open Data Policy for Sentinel Satellite Data
Pollock notes that evidence on price elasticity is limited, and its value will be determined by the
nature of the product at issue. Nevertheless, he estimates that elasticity is generally greater than 1,
and the range for the kinds of products that are the subject of this study is between 0.5 and 2.5.
According to the Trading Funds Study, elasticity of demand varies depending on the PSI, but for the
products associated with the PSI, average elasticity is estimated at between 1 and 2.
The POPSIS findings confirm this in the Austrian cadastre case and the Dutch KNMI case.
POPSIS: “[T]he Austrian Federal Office of Metrology and Surveying adopted a simplified and more
market-oriented PSI pricing approach with drastic price cuts of up to 97% within strict budget
constraints (there was no additional governmental funding). Due to the additional demand – notably
from SMEs – triggered by lower prices, PSI sales revenues and the associated cost-recovery ratio could
be kept stable or slightly increased. Without additional governmental funding, BEV could improve the
situation for re-use business and secure a wider use of its public data.”36
POPSIS: “In 1999, at the peak of competition between the commercial activities of the KNMI and the
private sector re-use activities, there were in essence two re-users of KNMI data. … About ten years
later, after full implementation of the new re-use policy, this picture had changed quite dramatically.
34
Cartographic products with a factor 2 – 15, digital ortho-images with a factor 70, digital cadastral map and
elevation model with factor 2.5, the digital landscape model with a factor 10.
35
The formula for the coefficient of price elasticity of demand (PED) is (dQ/Q)/(dP/P), whereby Q is the
quantity, P is the price and d is the changes therein. Generally, if PED for a good is relatively elastic (-∞ < Ed < -
1), the percentage change in quantity demanded is greater than that in price. Hence, when the price is
lowered, the total revenue increases.
36
POPSIS, ibid., p. 127.
ABOUT GMES AND DATA : GEESE AND GOLDEN EGGS – Geoff Sawyer and Marc de Vries
27](https://image.slidesharecdn.com/opendatastudyfinalreport-130306143849-phpapp02/85/EARSC-Open-data-study-Final-Report-27-320.jpg)

![to oil rigs, based on its own high-tech forecast models. The high-end market services are highly
targeted, the number of clients is relatively low and yet the value of each transaction is high.
Conversely, in the low-end market, business models are based on reaching out to large volumes of
(generally non-professional) consumers who use high traffic web services and maybe apps on mobile
devices. Typically, these re-users merely mash up the PSI with other free content and integrate it into
services, not adding much value, other than distributing it widely. The re-users’ revenues come from
third-party advertisements, not from its users.
Backing this up, in the Dutch KNMI case, the POPSIS study reports:
“The lowered price level increased competition and sparked innovation: second-tier users of
meteorological information were offered smart, new products. For instance, the greenhouse sector in
the Netherlands was able to save about 10% on its energy costs due to its access to real-time detailed
forecasting of rainfall services. This allowed the sector to maximize the length of time that the
greenhouses can remain open to the air. This not only very beneficial for the crops but also for the
environment, since it reduces carbon dioxide emission quite considerably.... New business models
emerged: a new re-user entered the market and launched an innovative service under the name
‘Rainfall Radar’ (Buienradar). Anyone can use the service to determine whether it is going to rain in
the current location in the next few hours. This service is provided completely free of charge. It
generated around 300 million hits per year throughout Europe in 2010. As a result of this high traffic,
it is paid for through advertising revenues. Finally, since all KNMI data products are license free,
almost no restrictions in use or distribution are set. Some of the re-users have started activities as
distributors.”44
Stifling effects of strong PSB presence in the market
One may also ask what the consequences are when prices are not lowered. The two Pettifer studies
provide evidence of the consequent damage being incurred in the meteo domain: not lowering its re-
Study on the Economic Benefits of a Free and Open Data Policy for Sentinel Satellite Data
use charges and its own downstream market activities, the national Met Offices trifles with the
market, where high charges block SMEs from entering.
In his first paper ‘Pricing of PSI in the Meteorological Sector blocks market development’, Pettifer
considers three hypothetical SMEs, in Luxembourg, Poland and France that provide weather-related
services relating to forecasting, highways and energy, and uses 2010 prices on a cost-recovery basis.
The absolute minimum PSI meteorological data required to provide basic weather-related services,
with a market value of €6 ,000 to €20,000 per contract, would cost a typical SME between €84,000
and €400,000. Pettifer’s conclusion therefore is that SMEs cannot operate successfully or compete
with large firms when partial or full cost-recovery pricing principles are used: cost-recovery pricing
principles are likely to create barriers to market entry because SMEs are probably unable to find the
20 contracts required to operate profitably.
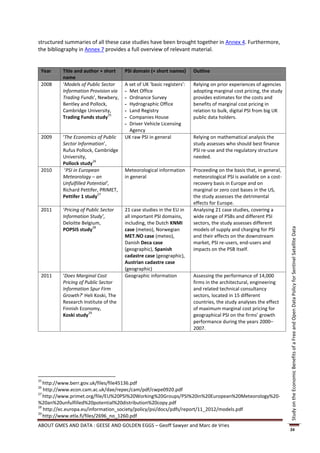
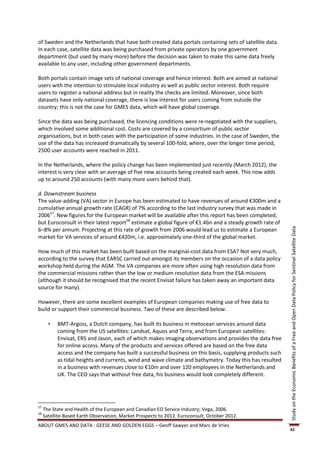
In Pettifer’s second paper, ‘PSI in European Meteorology – an Unfulfilled Potential’, he assesses the
damage from this current practice, by comparing the European market figures with those of the US.
“Recent estimates of the size of the 2006 market in value-added meteorological products of all
types in the USA and Europe are of the order of $1.4 billion per annum and $372 million (€530 million)
per annum respectively. ... It would appear therefore that [on the basis of GDP] only about 0.3% of
the potential European market in this sector is currently being supplied whereas in the US the
equivalent figure is around 0.7%. Moreover recent estimates suggest that in real terms, after allowing
for growth in GDP, the US market has grown at an average rate of around 17% per annum over the
past six or seven years while the European market has been growing at closer to 1.2% per annum in
the same period. This type of difference can be seen in specific market sectors as well as in the overall
44
POPSIS, ibid. p. 274.
ABOUT GMES AND DATA : GEESE AND GOLDEN EGGS – Geoff Sawyer and Marc de Vries
32](https://image.slidesharecdn.com/opendatastudyfinalreport-130306143849-phpapp02/85/EARSC-Open-data-study-Final-Report-32-320.jpg)

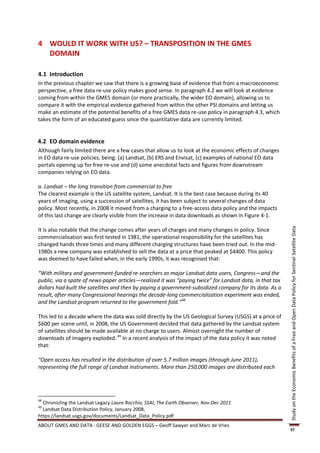
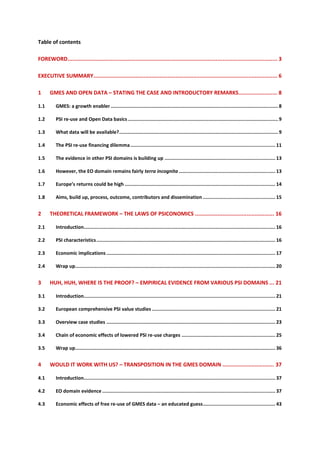
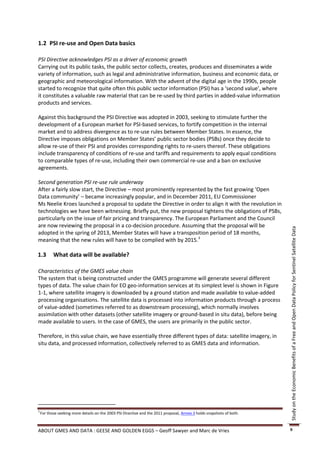
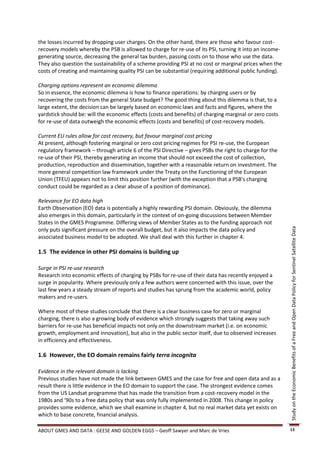
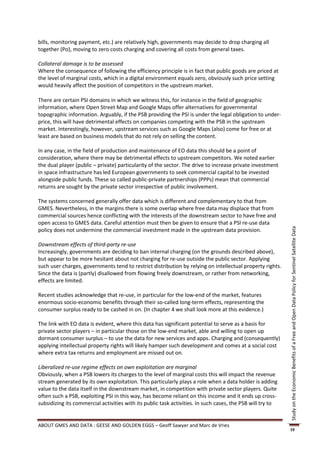
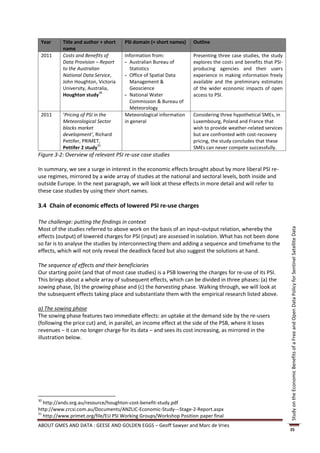
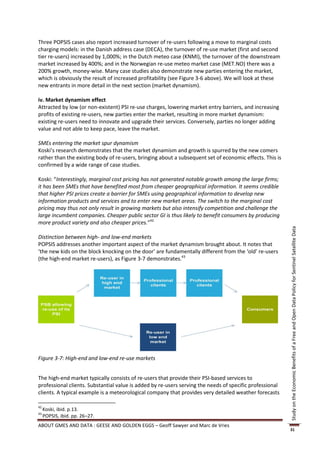
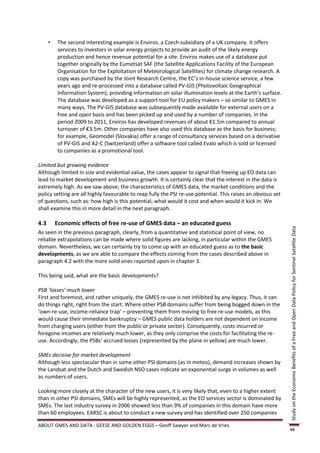
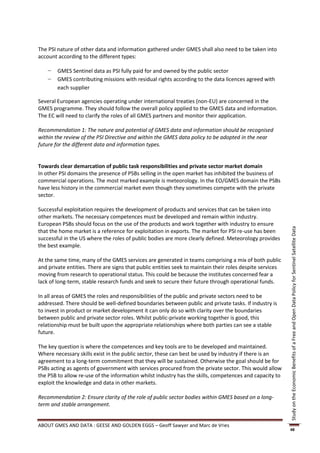
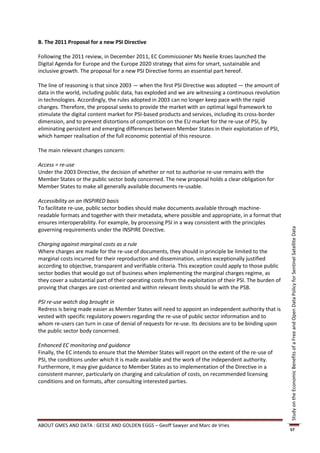
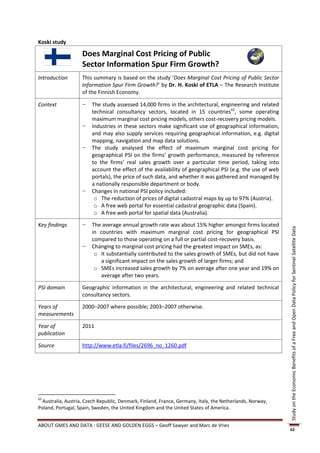
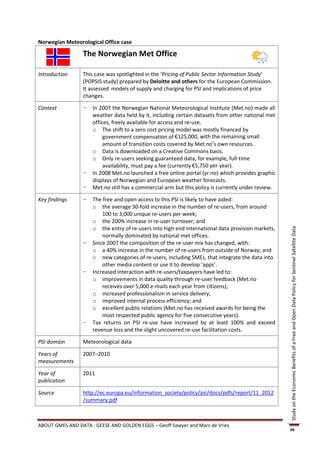
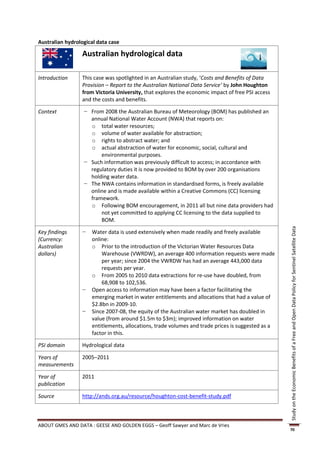
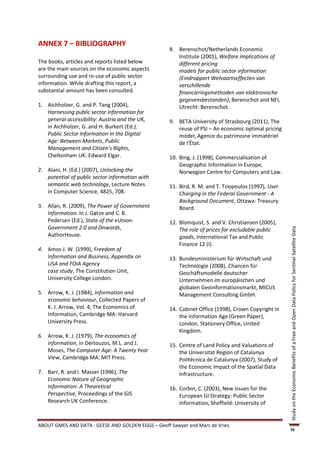
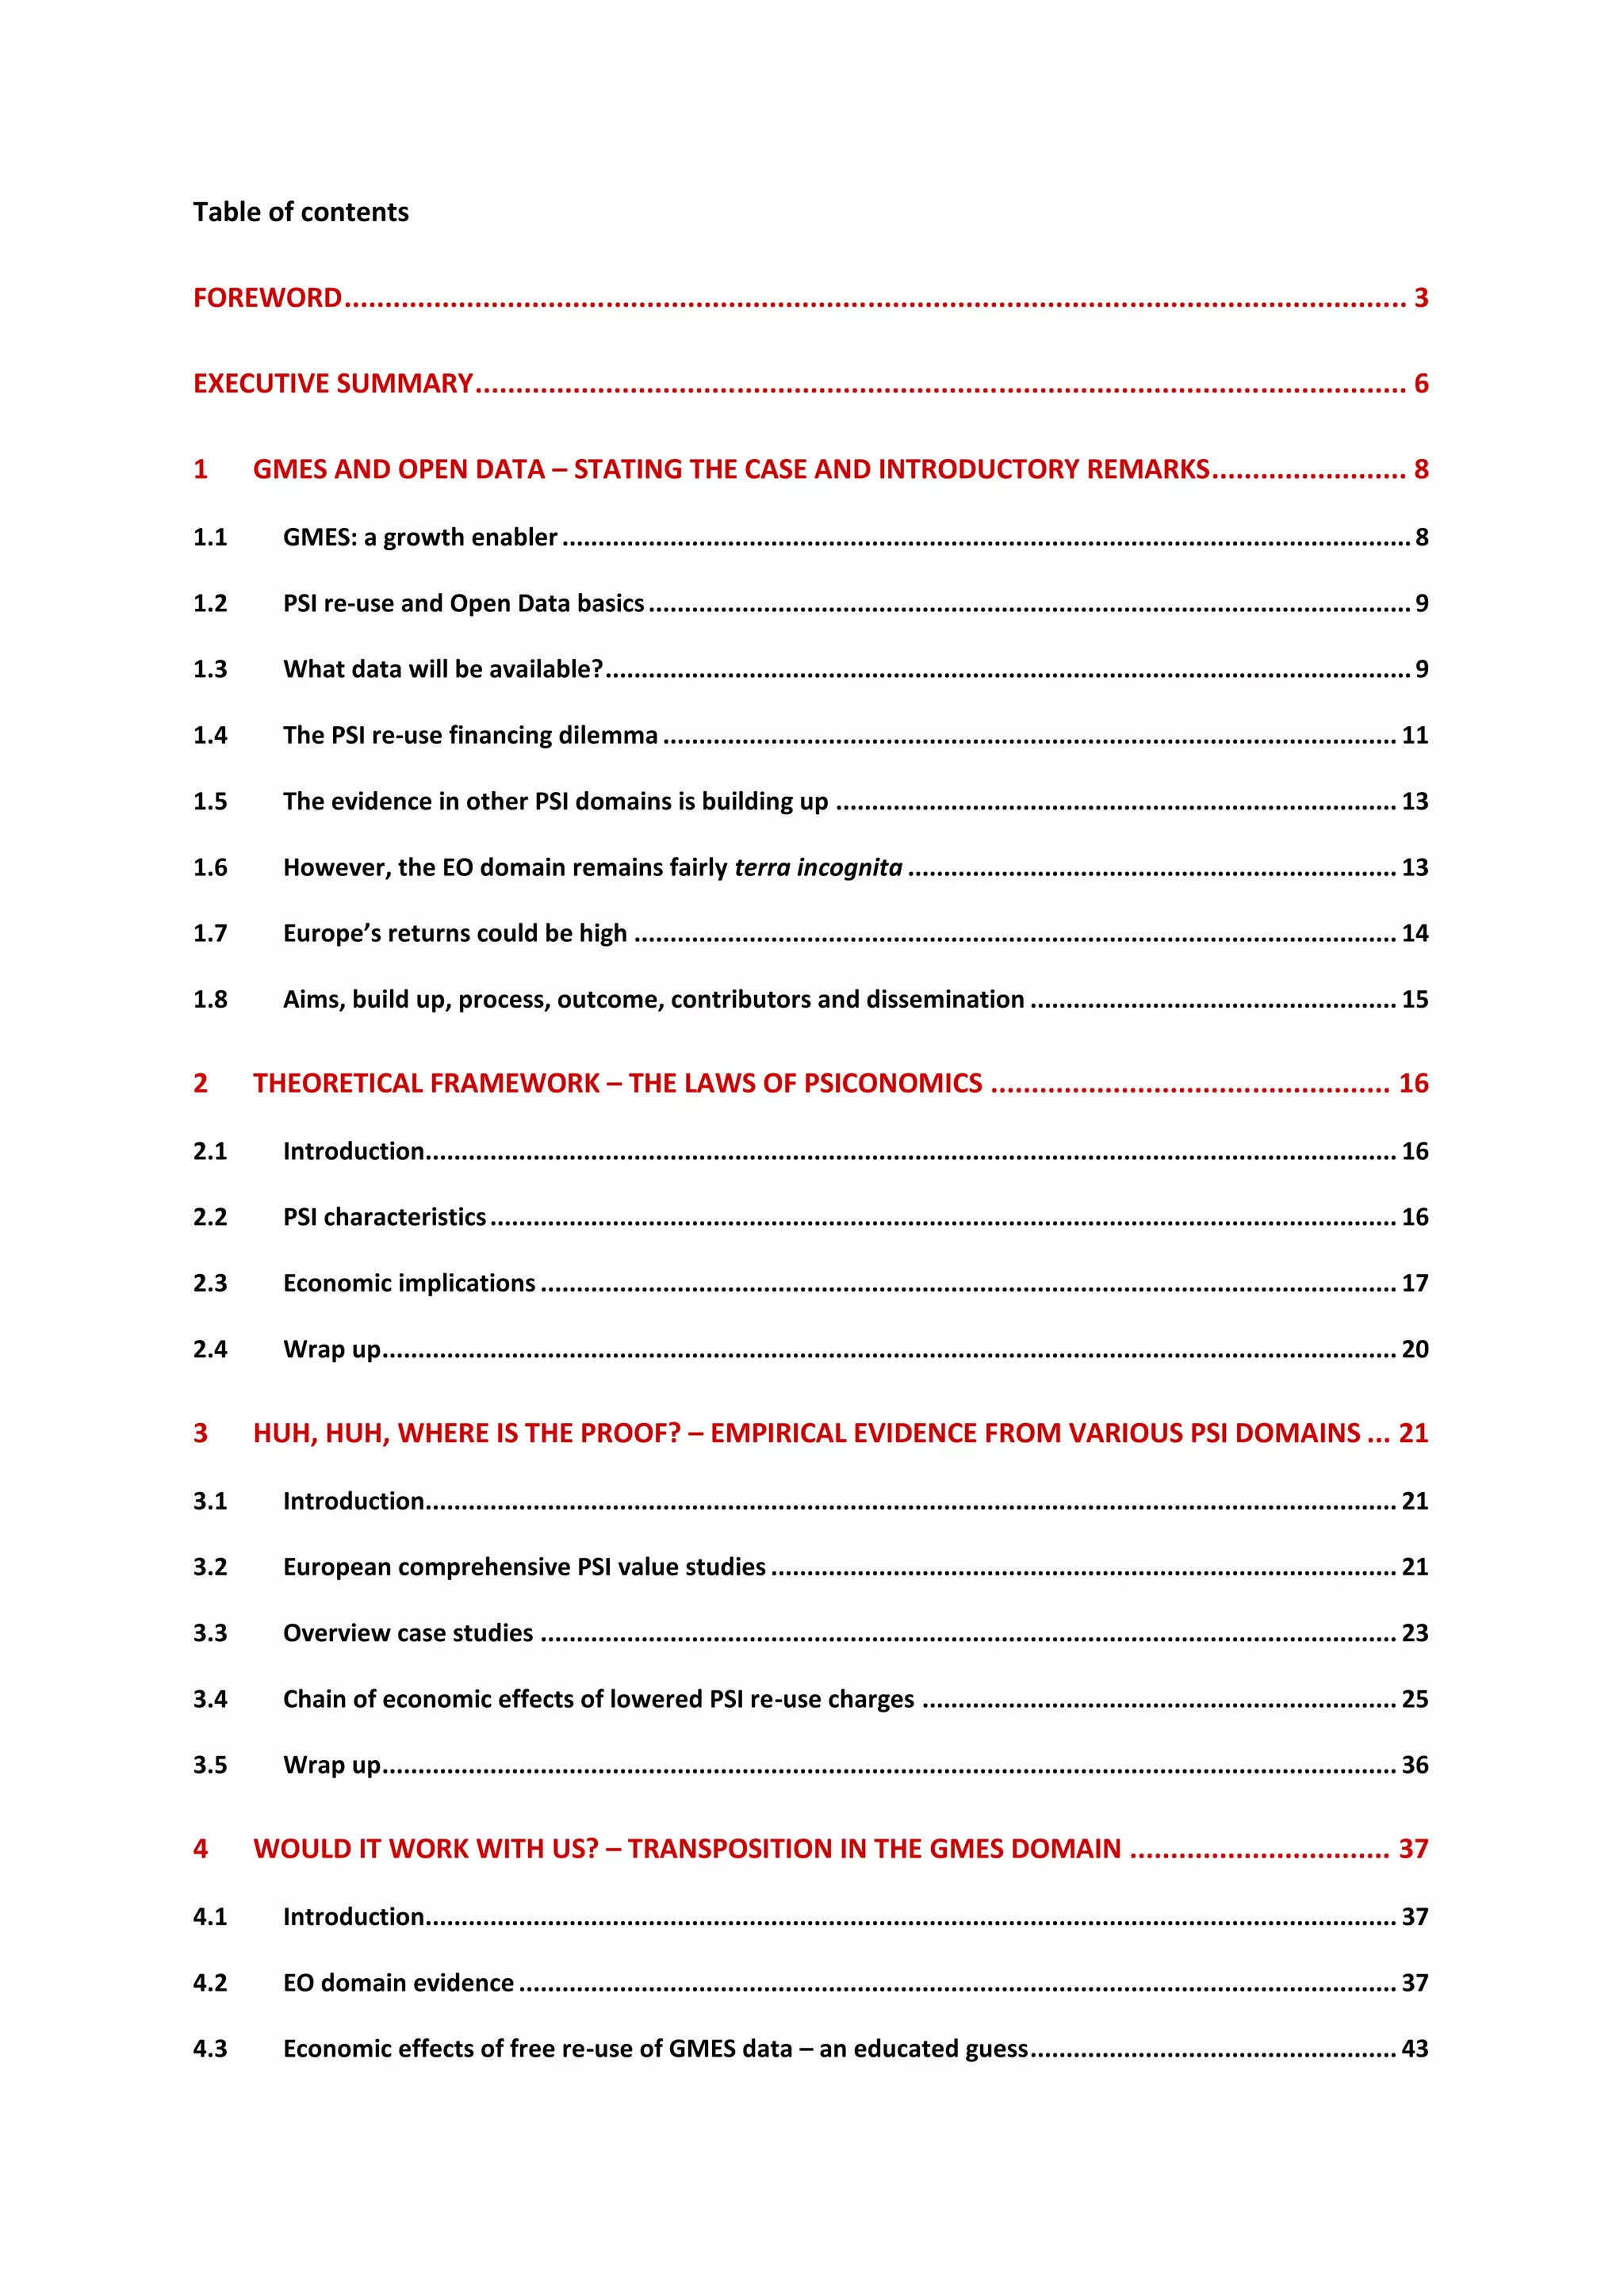
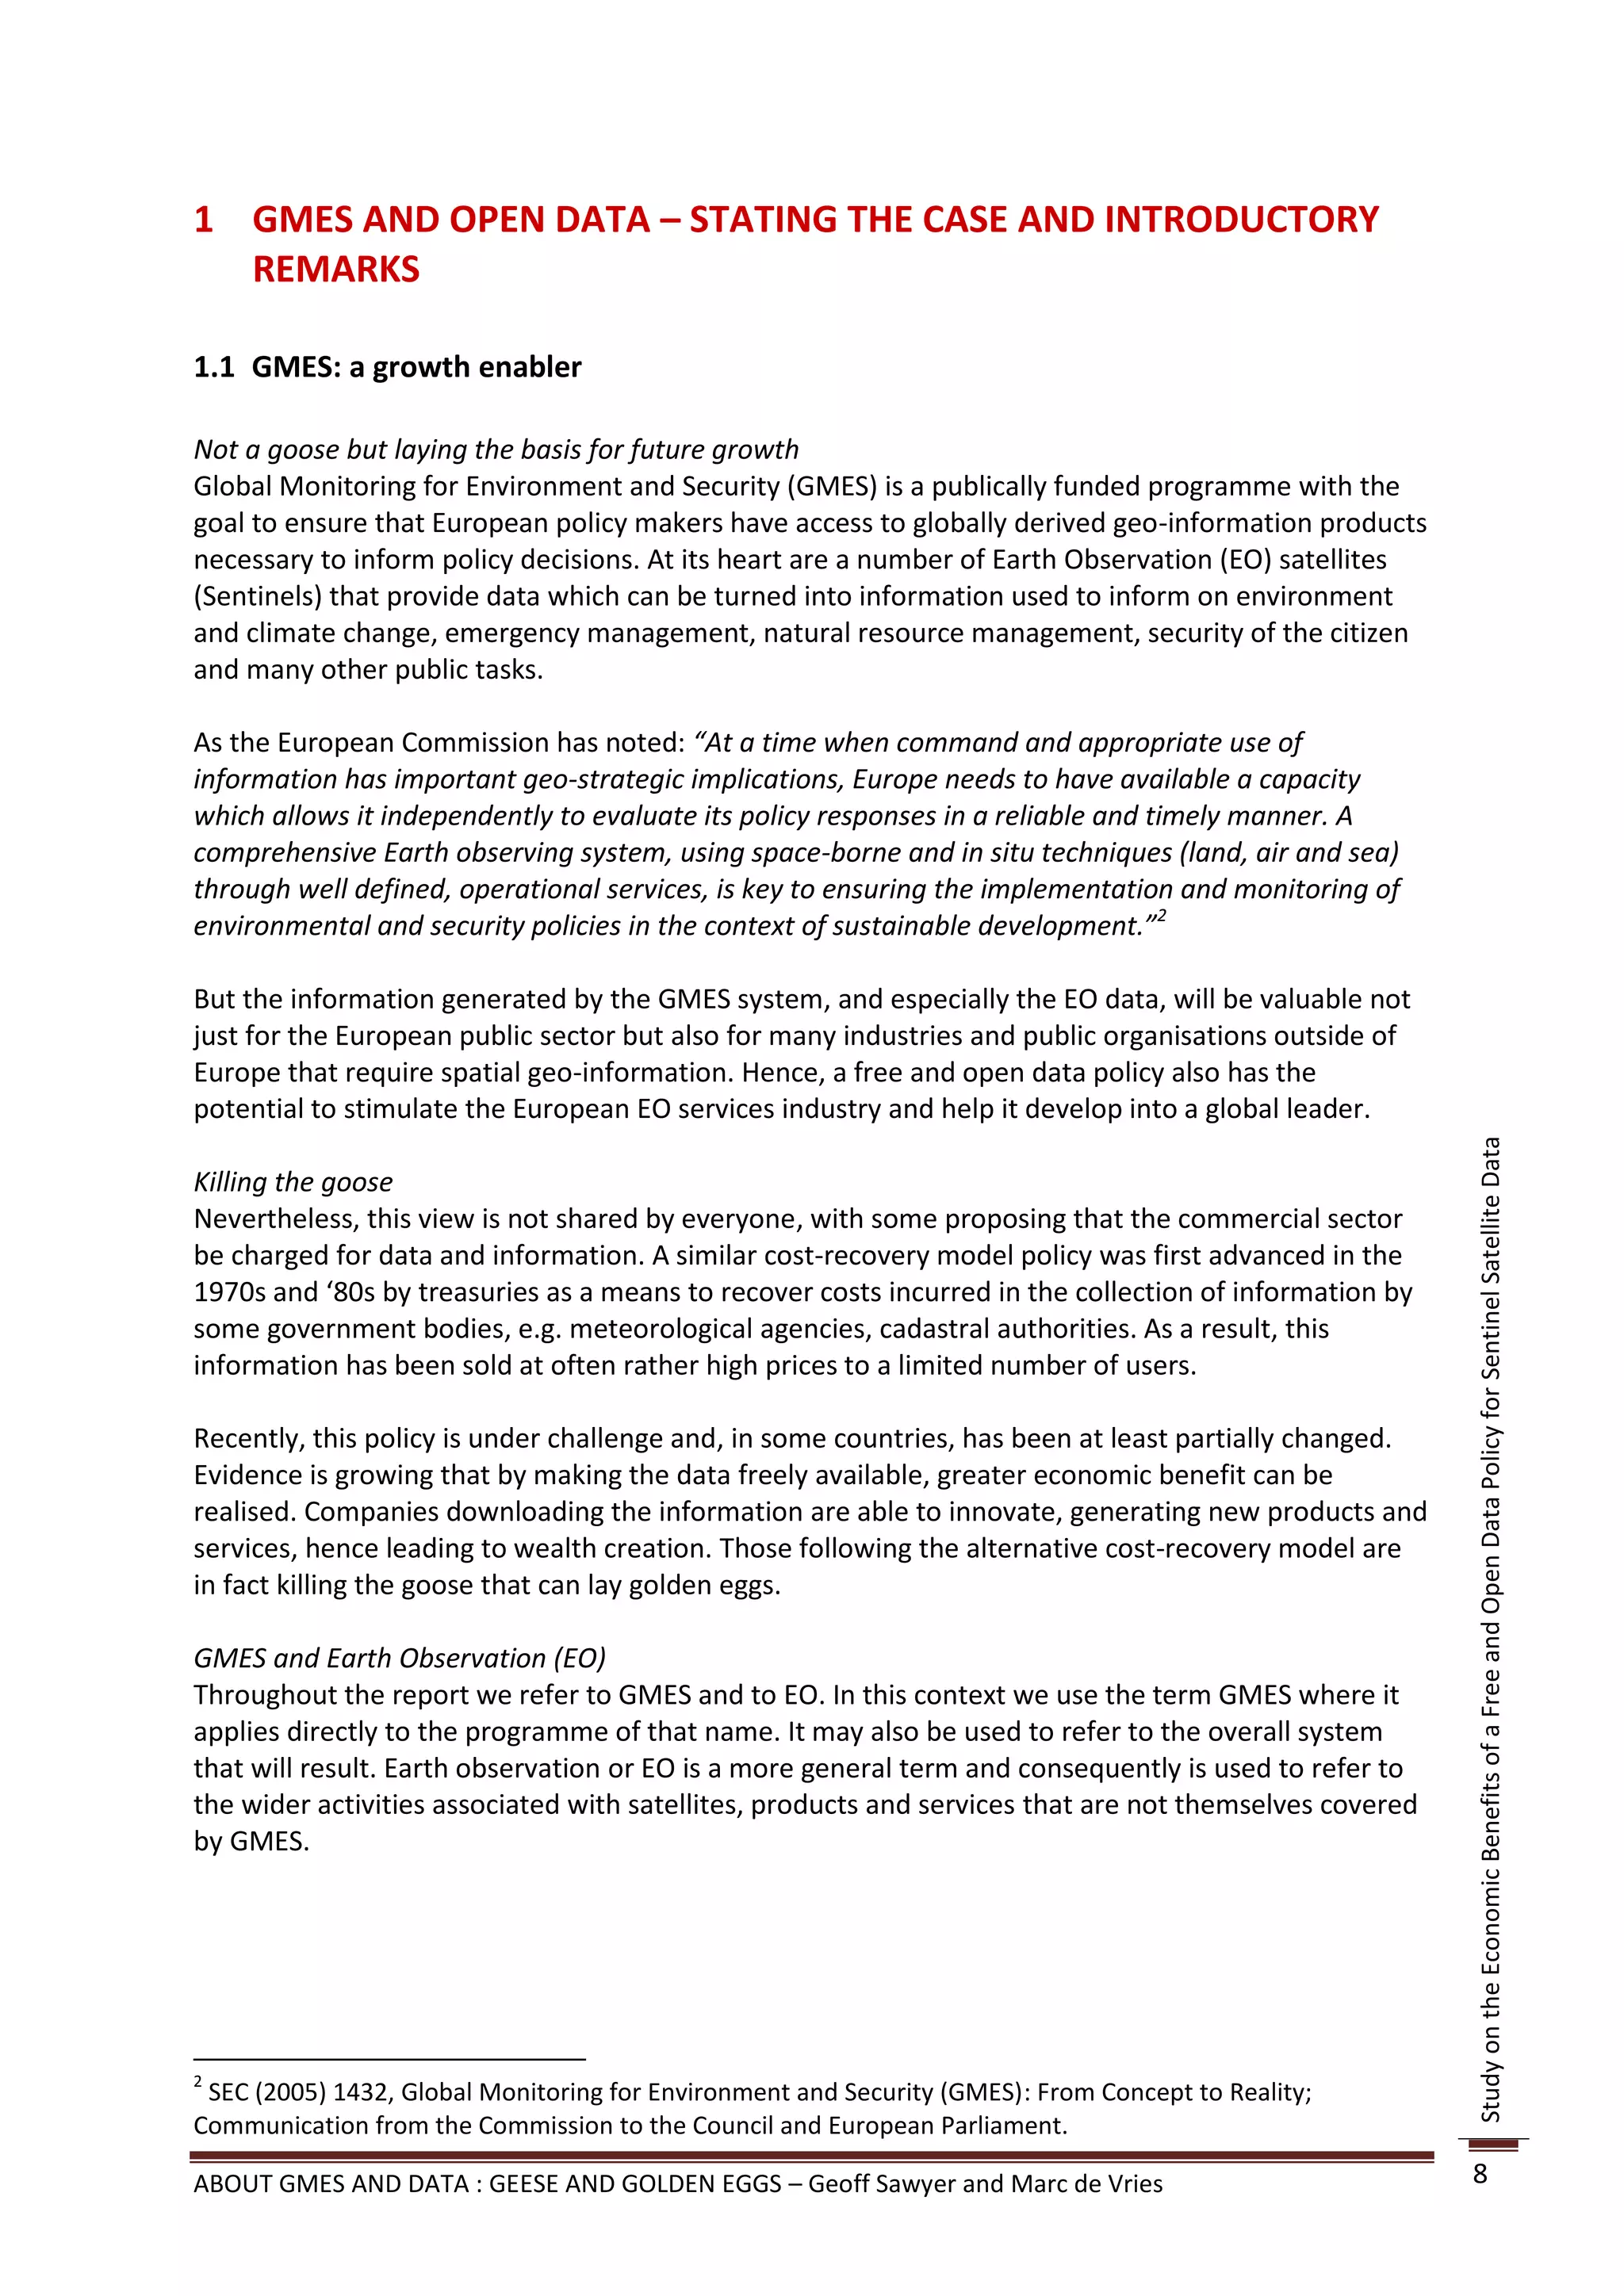
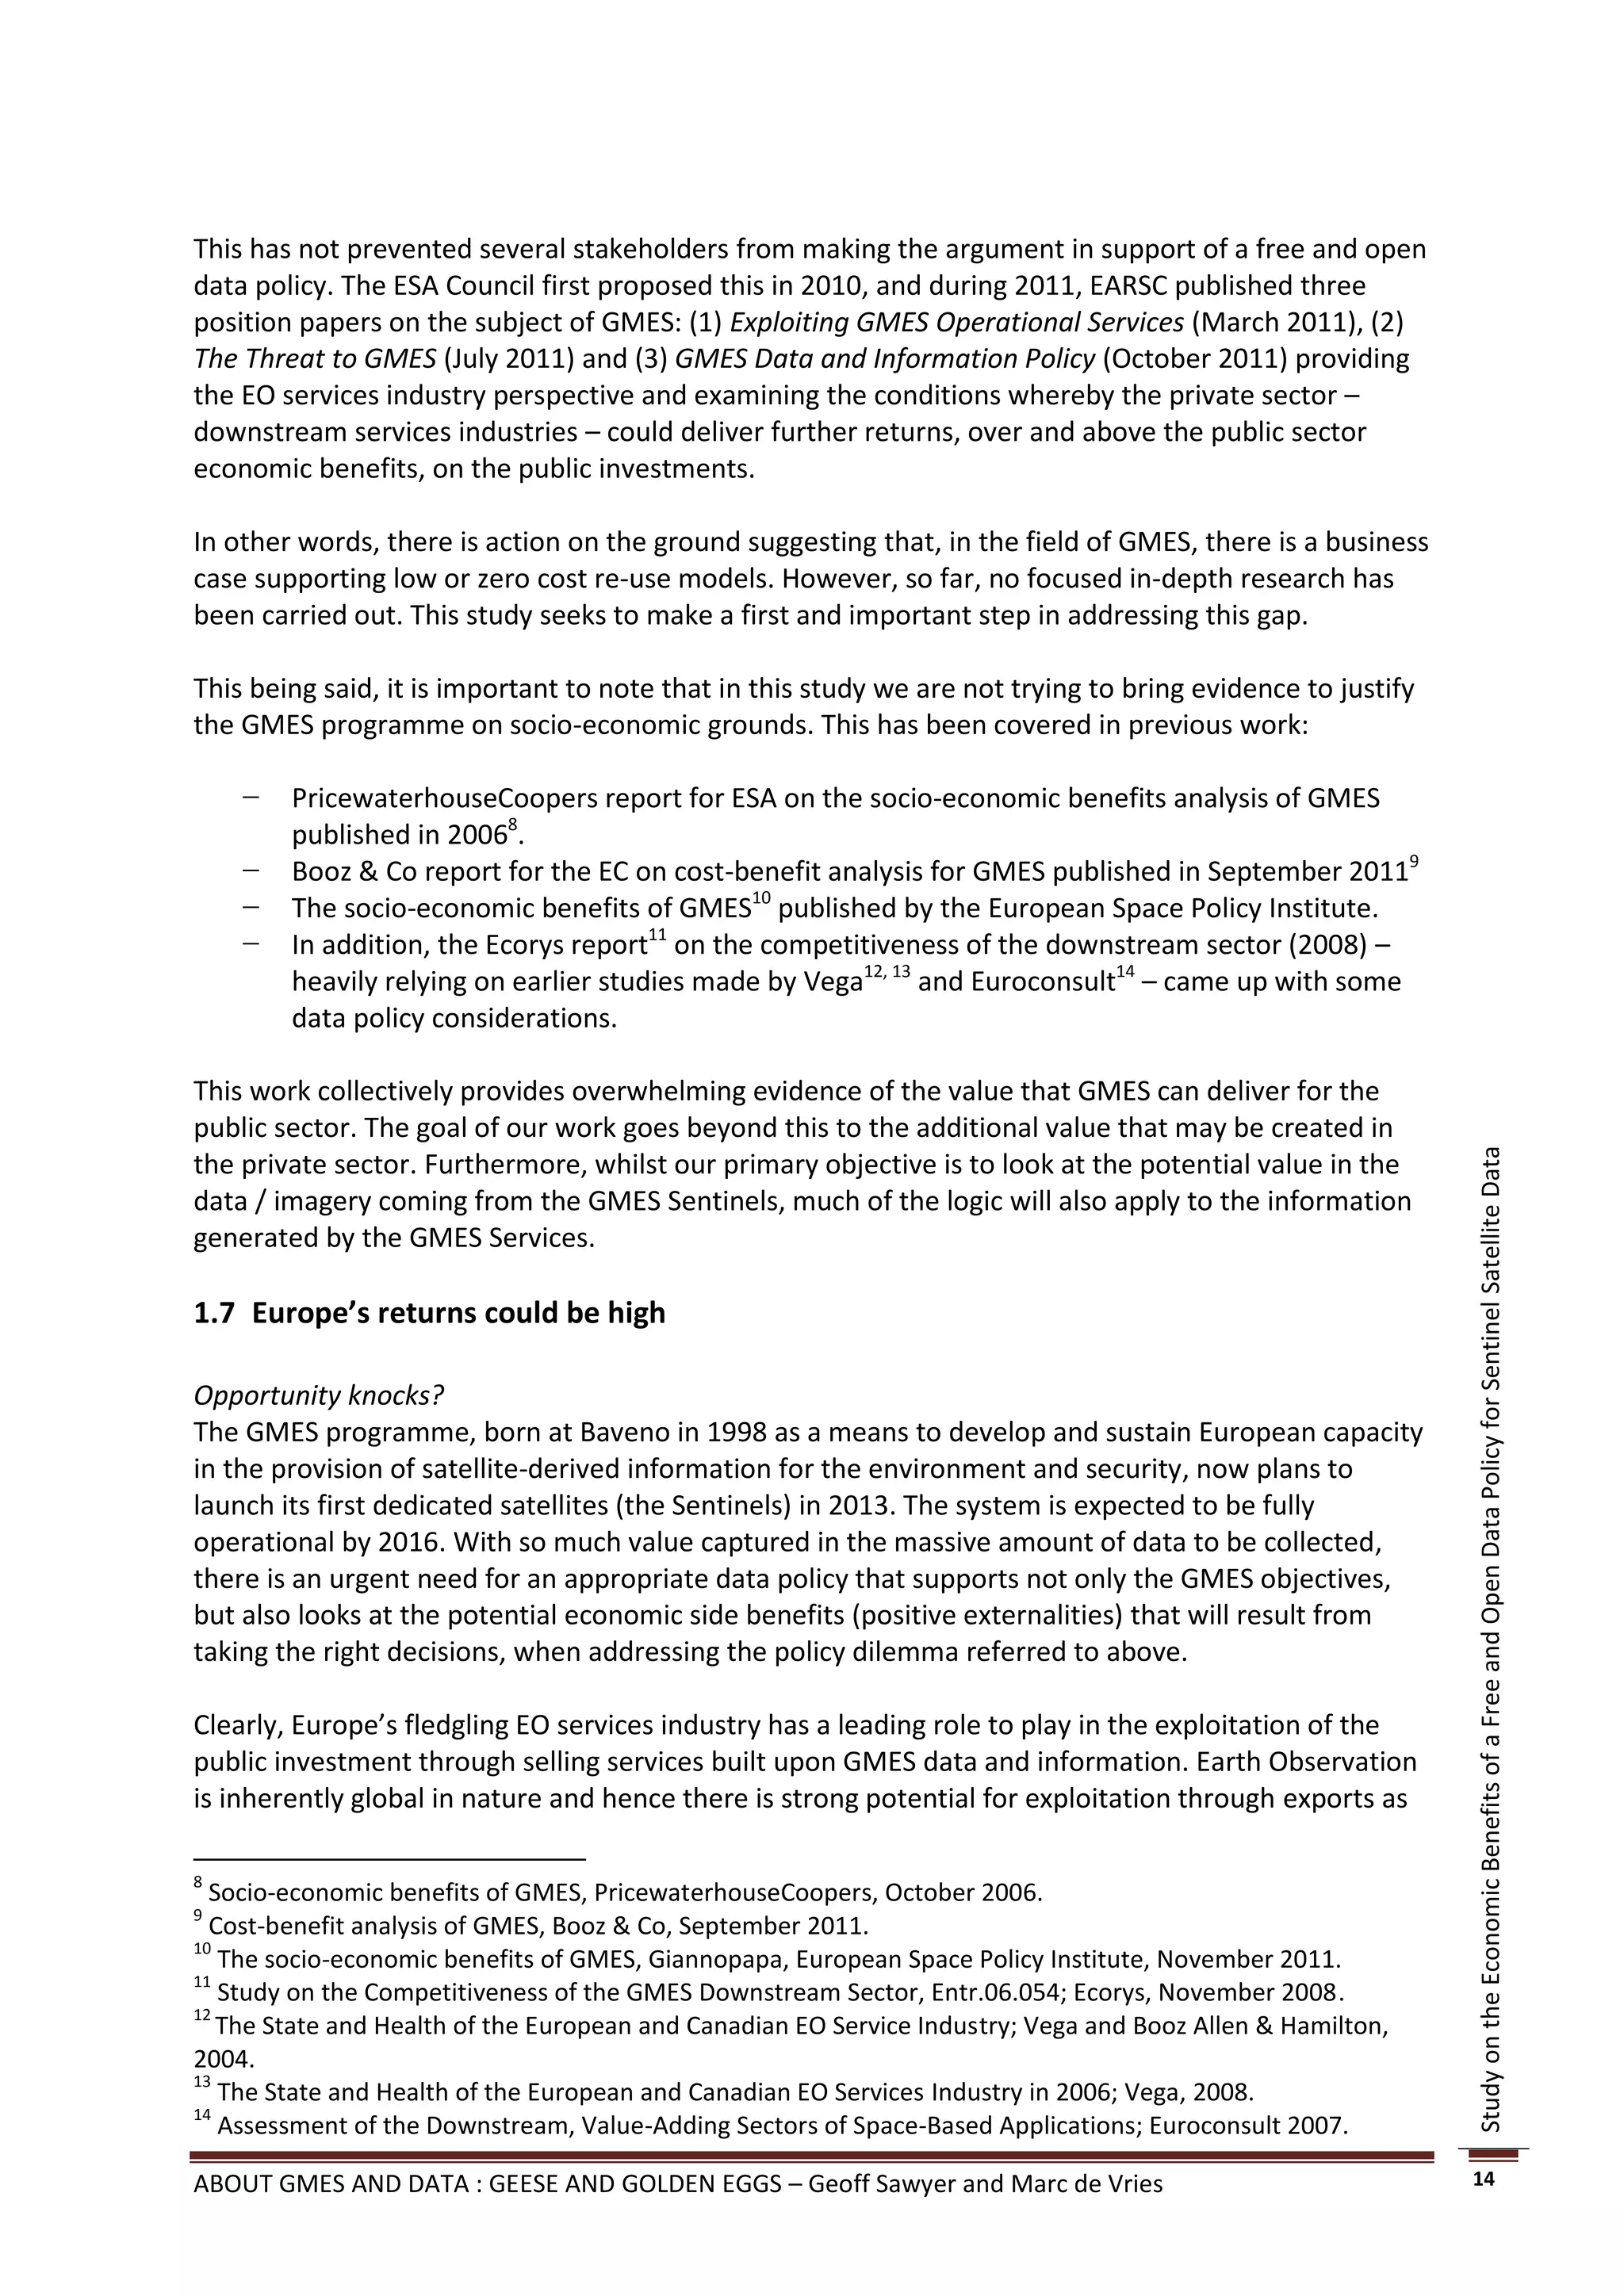
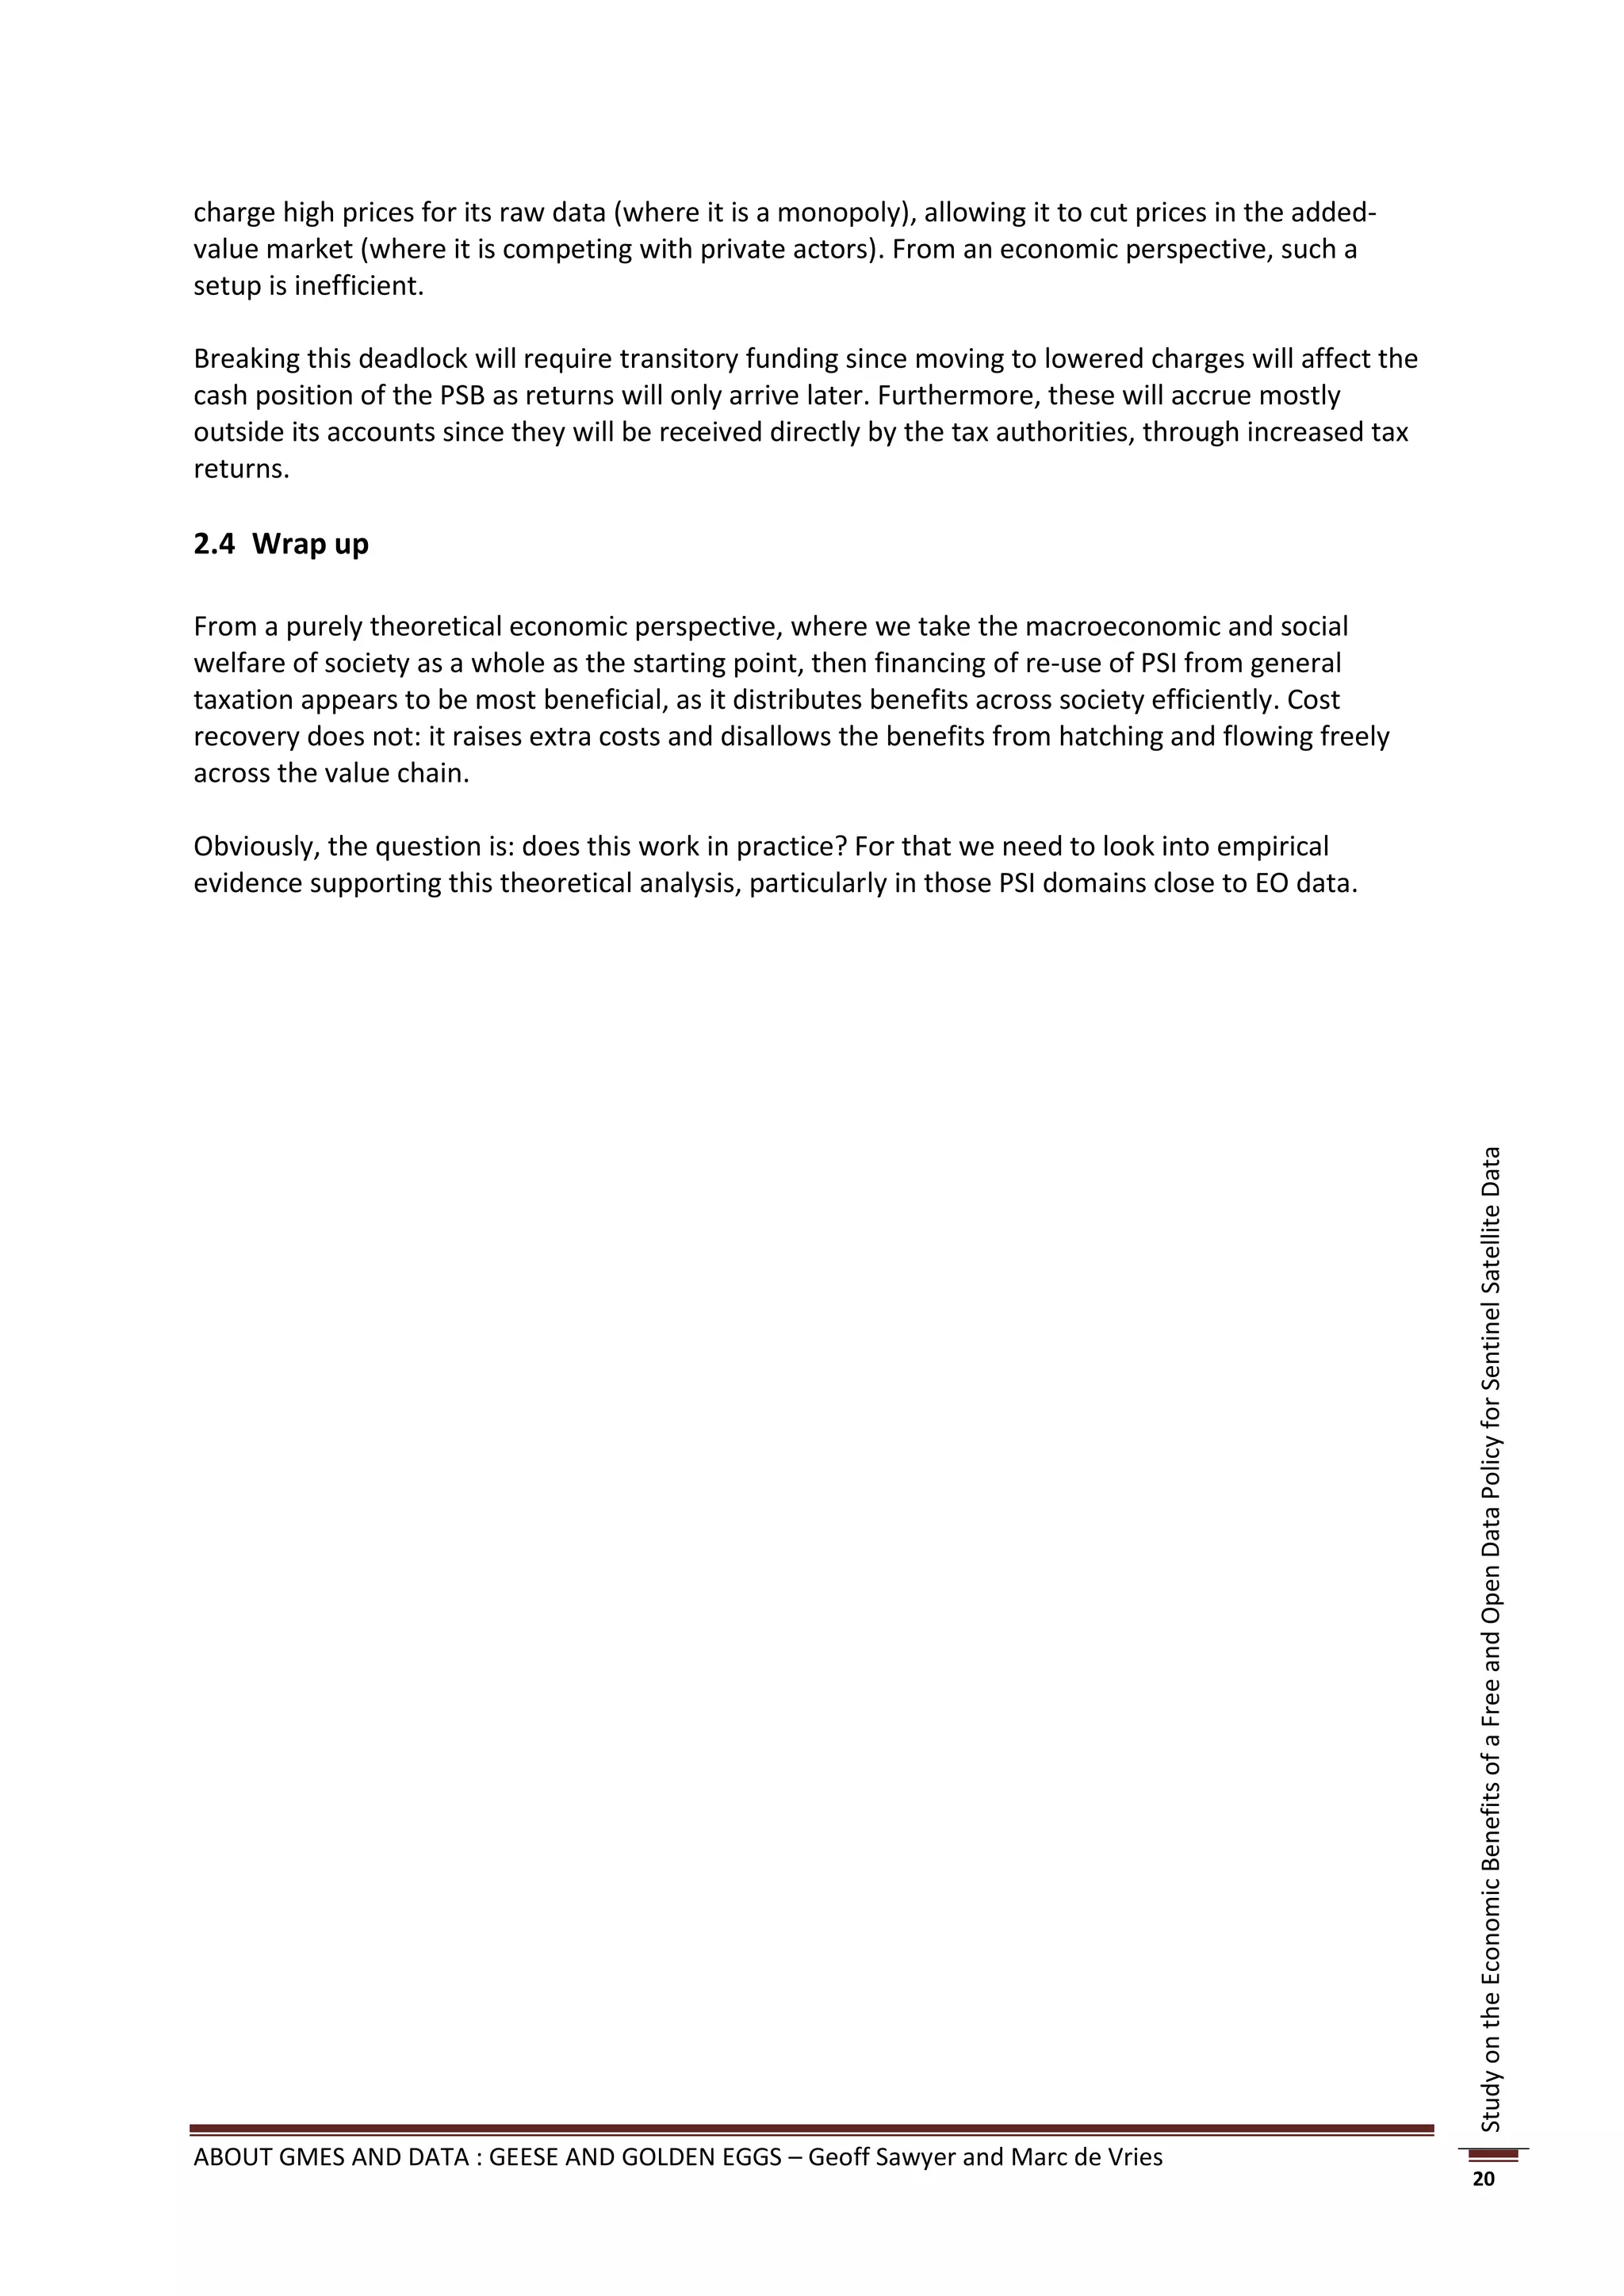
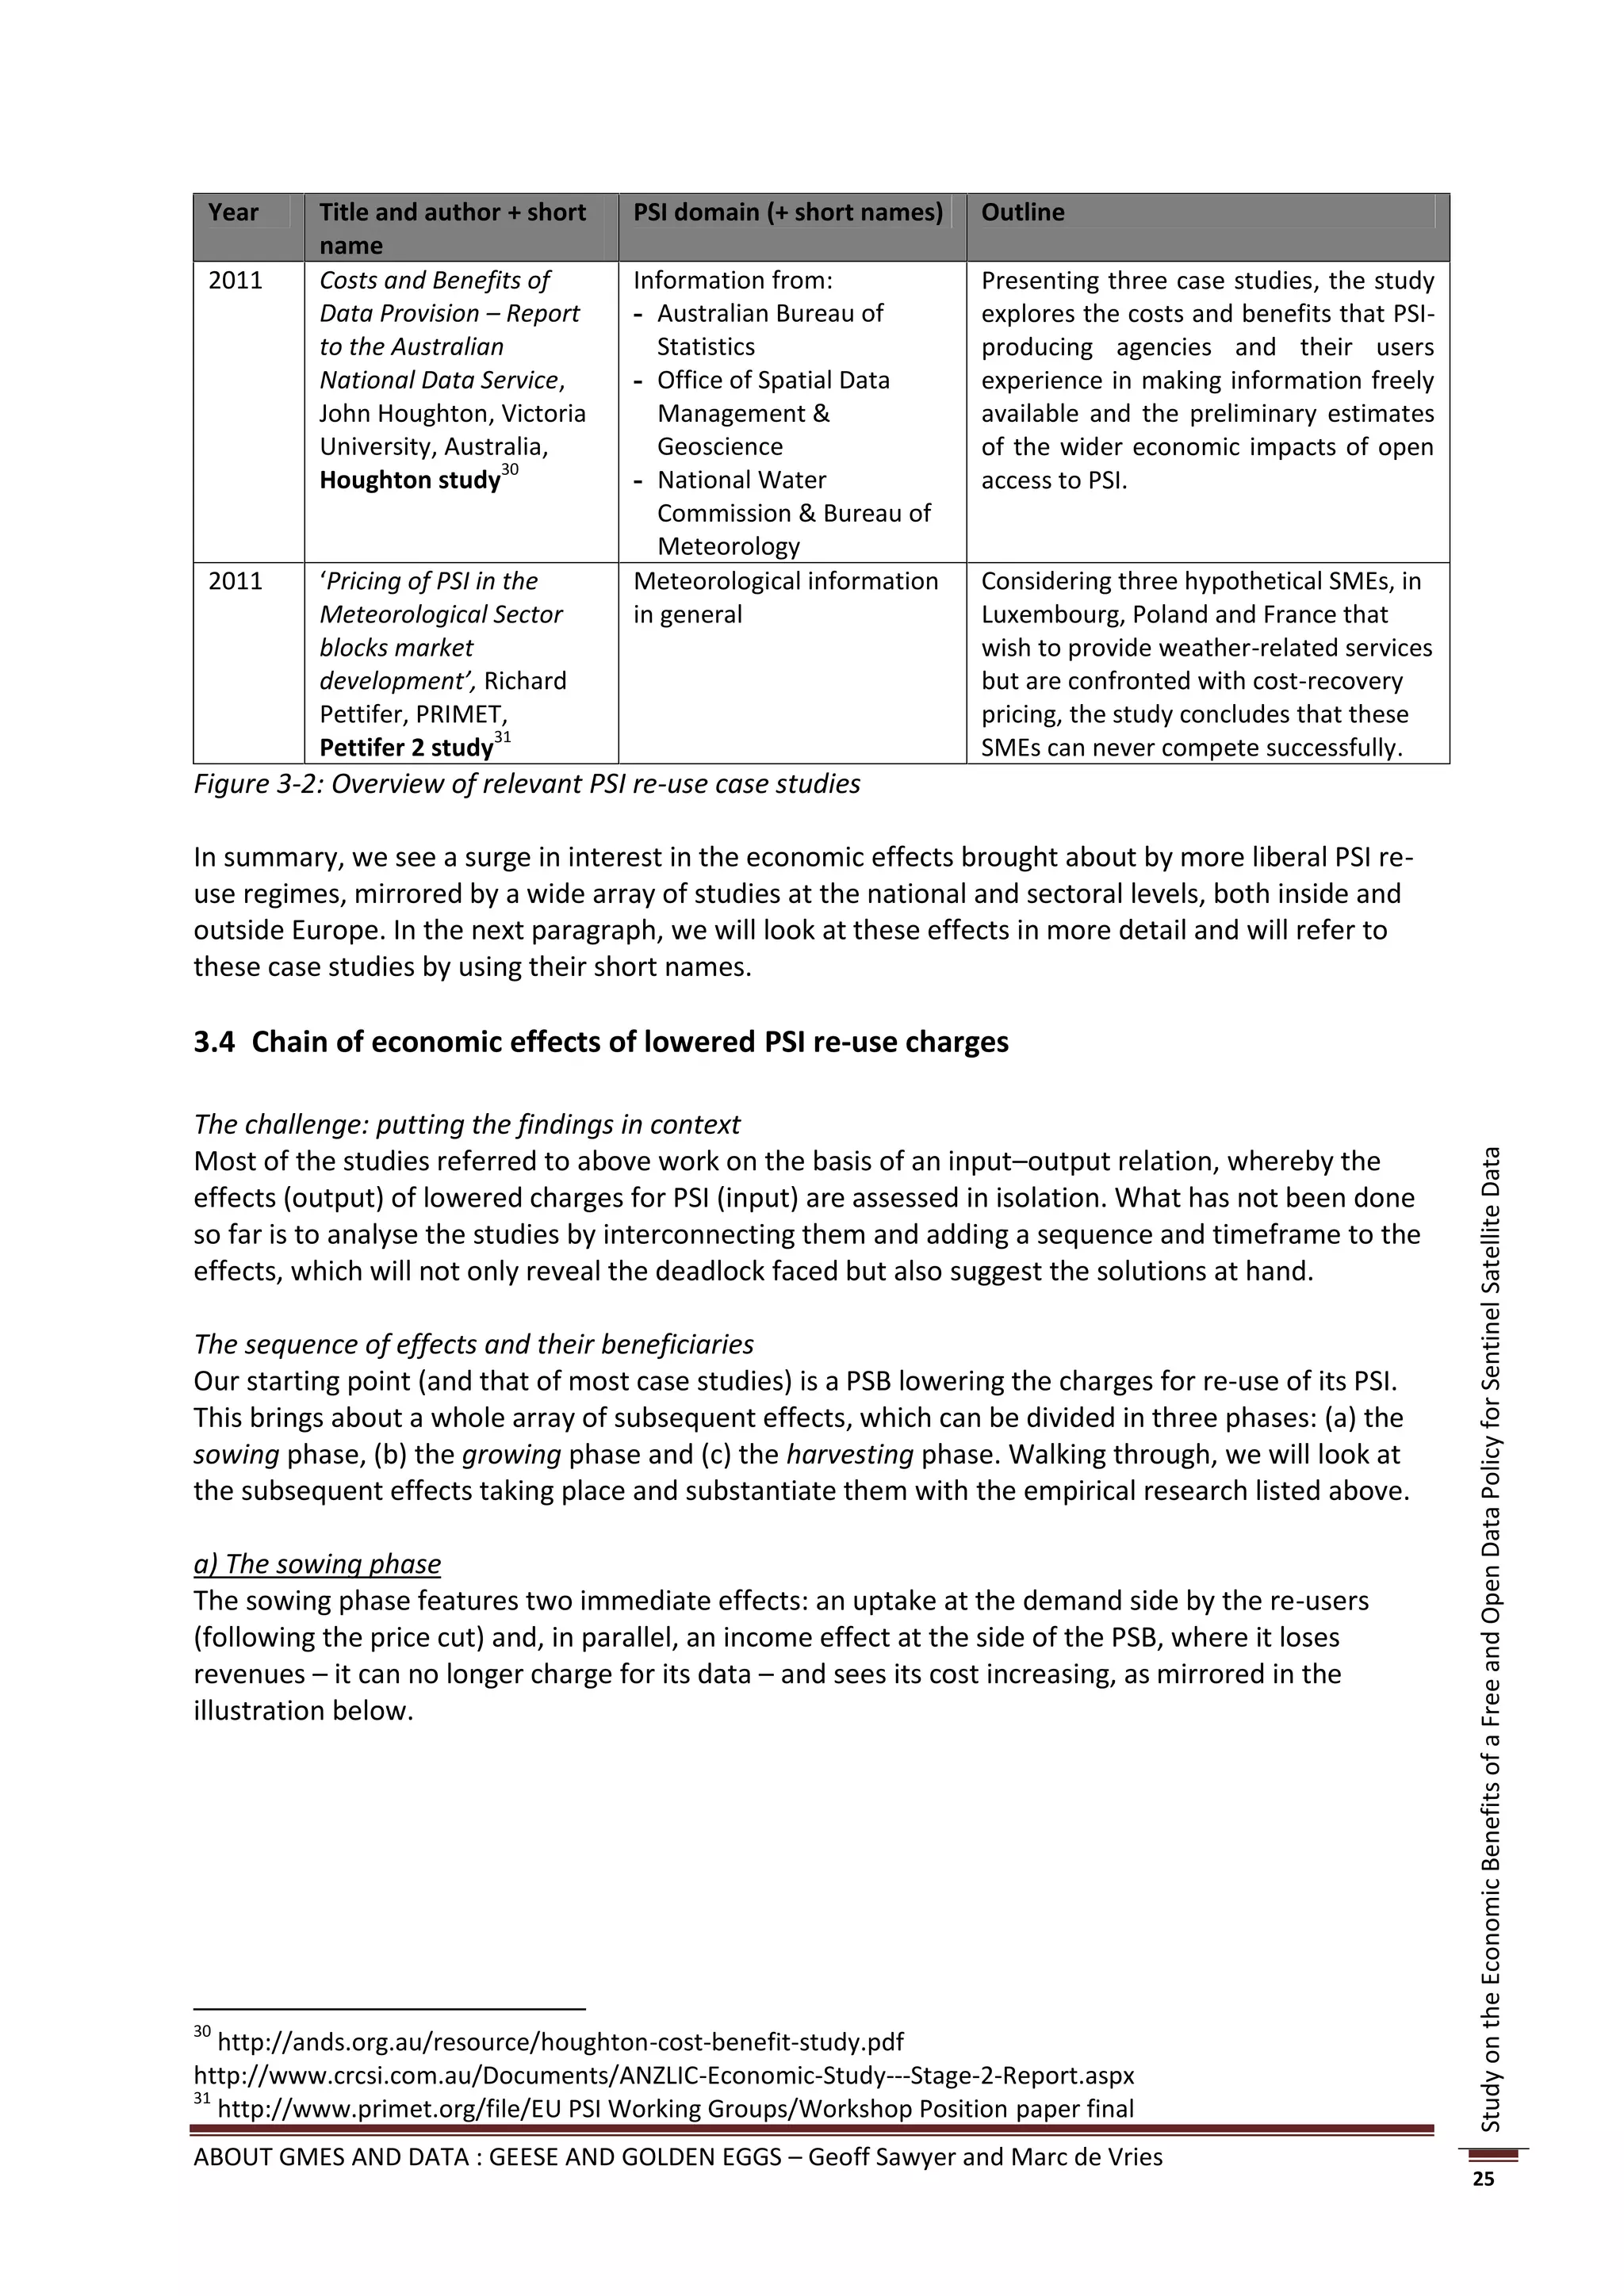
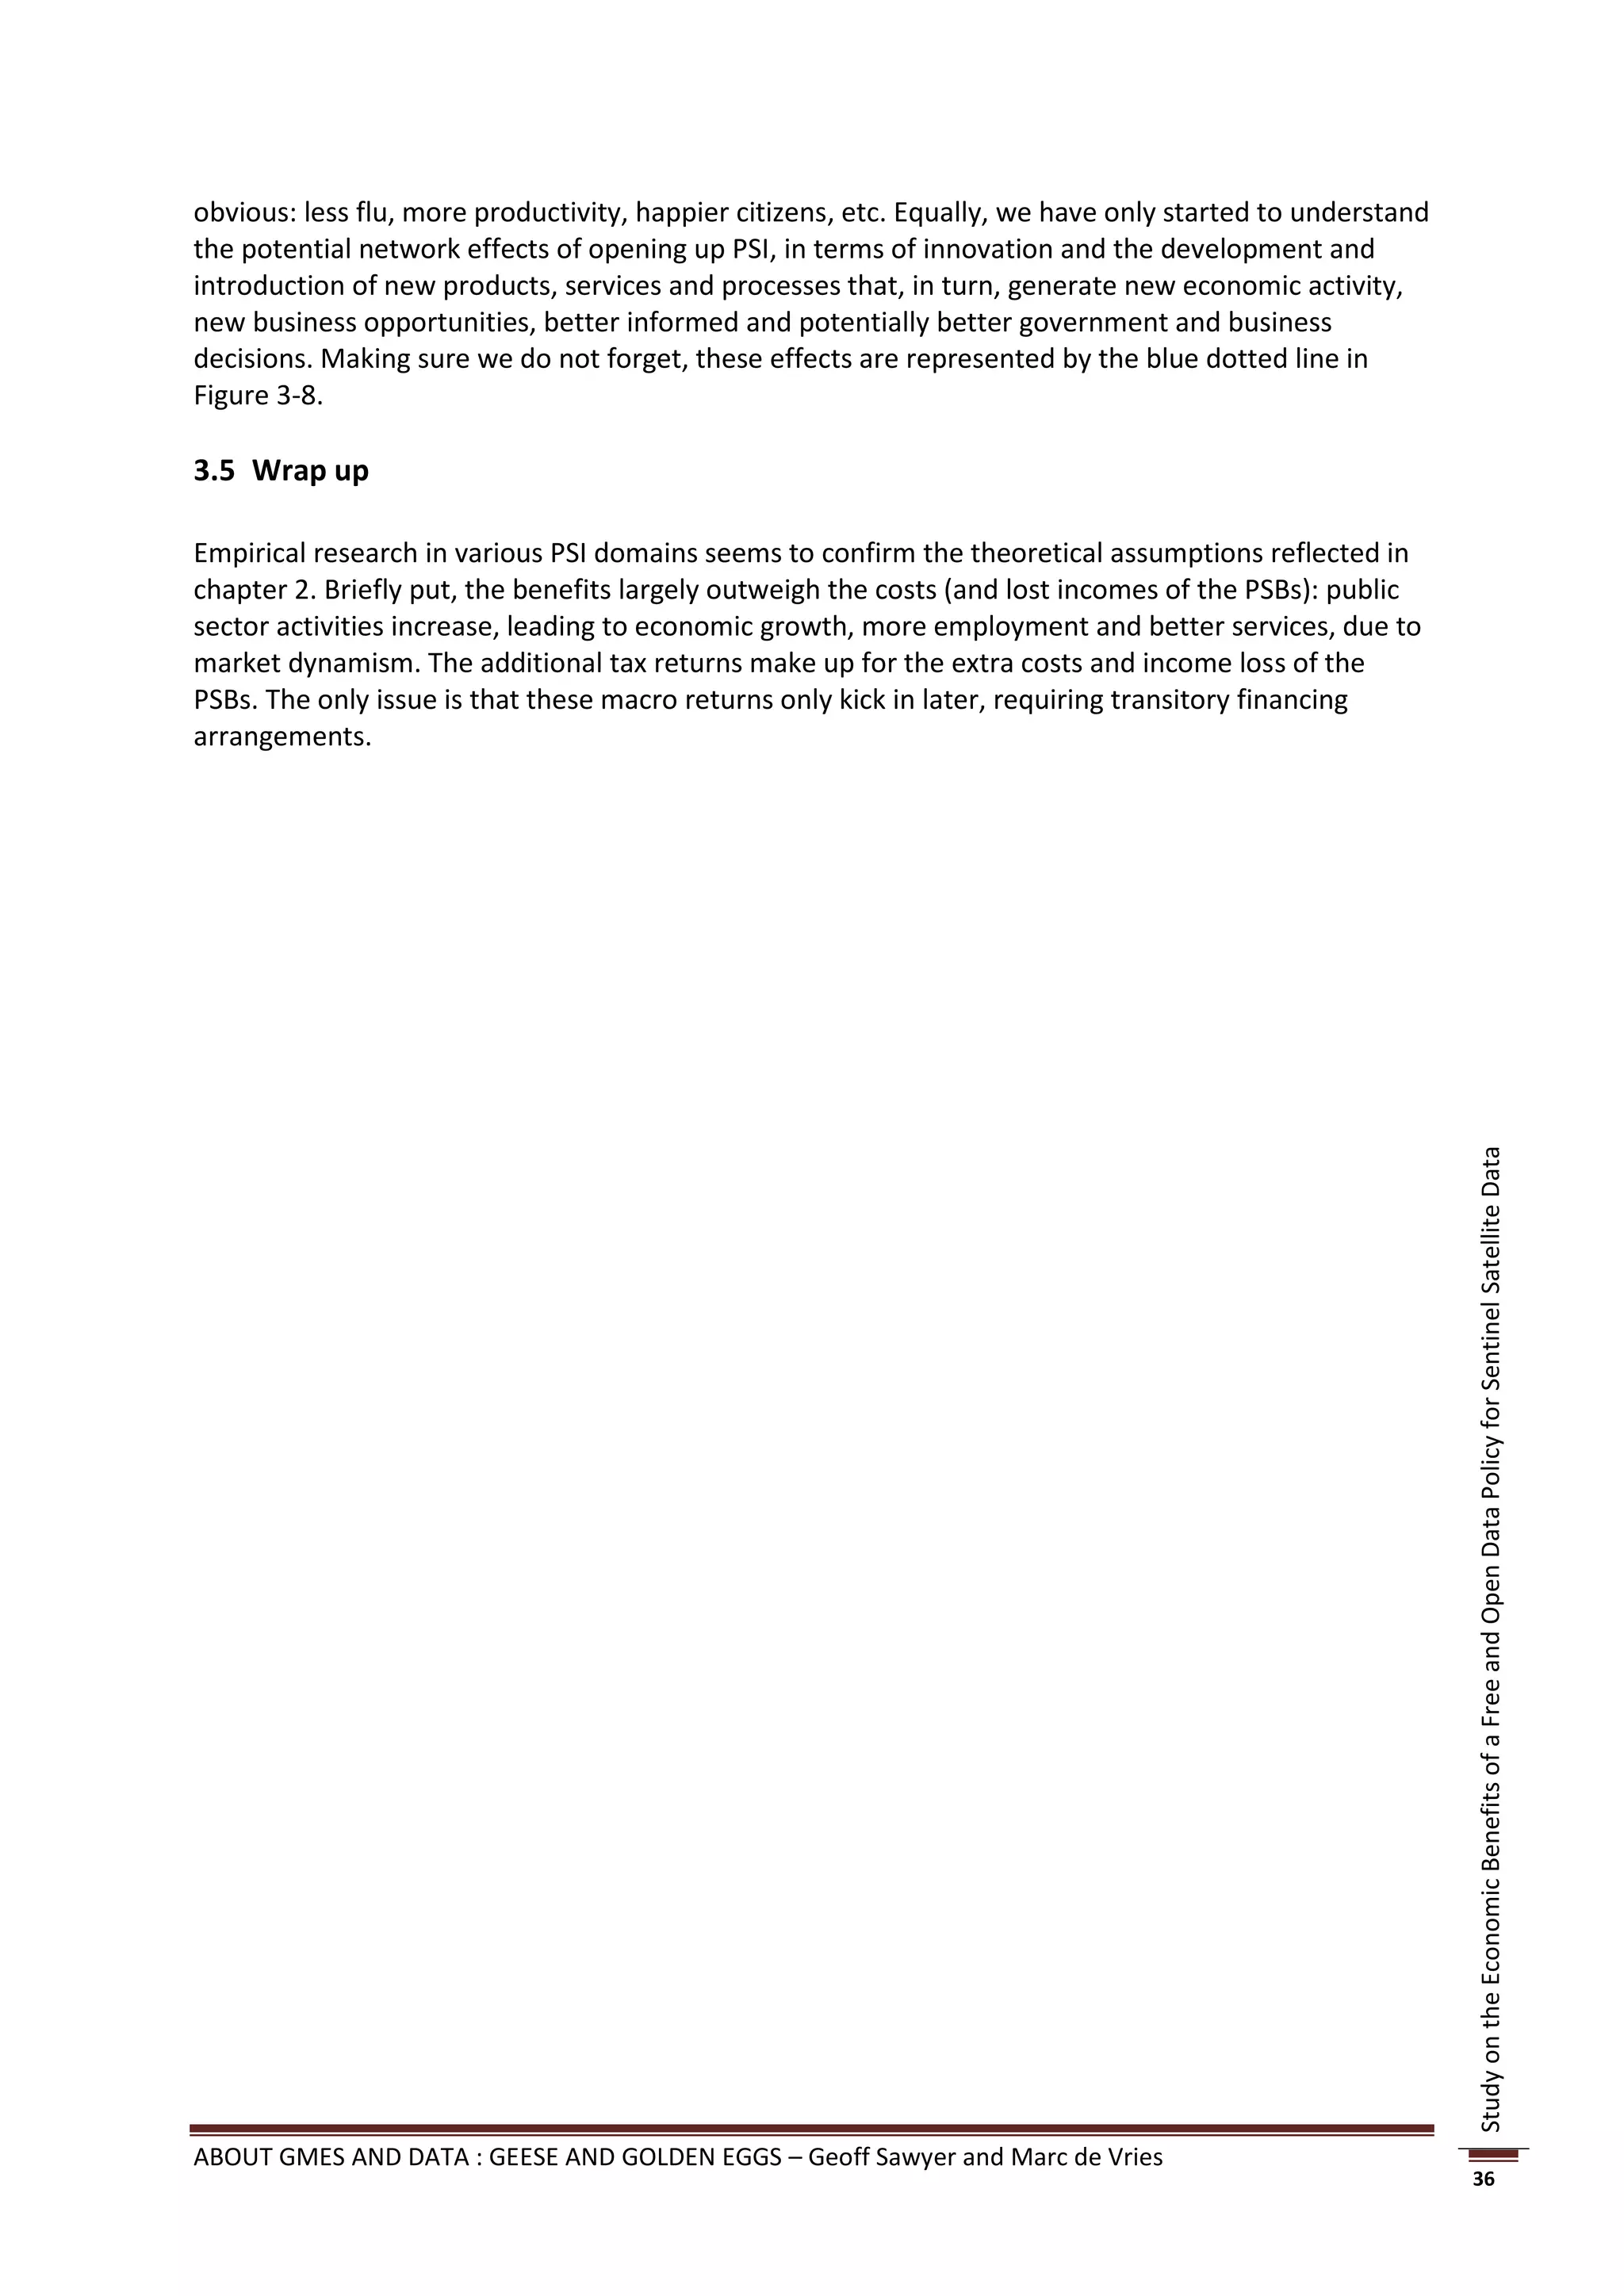
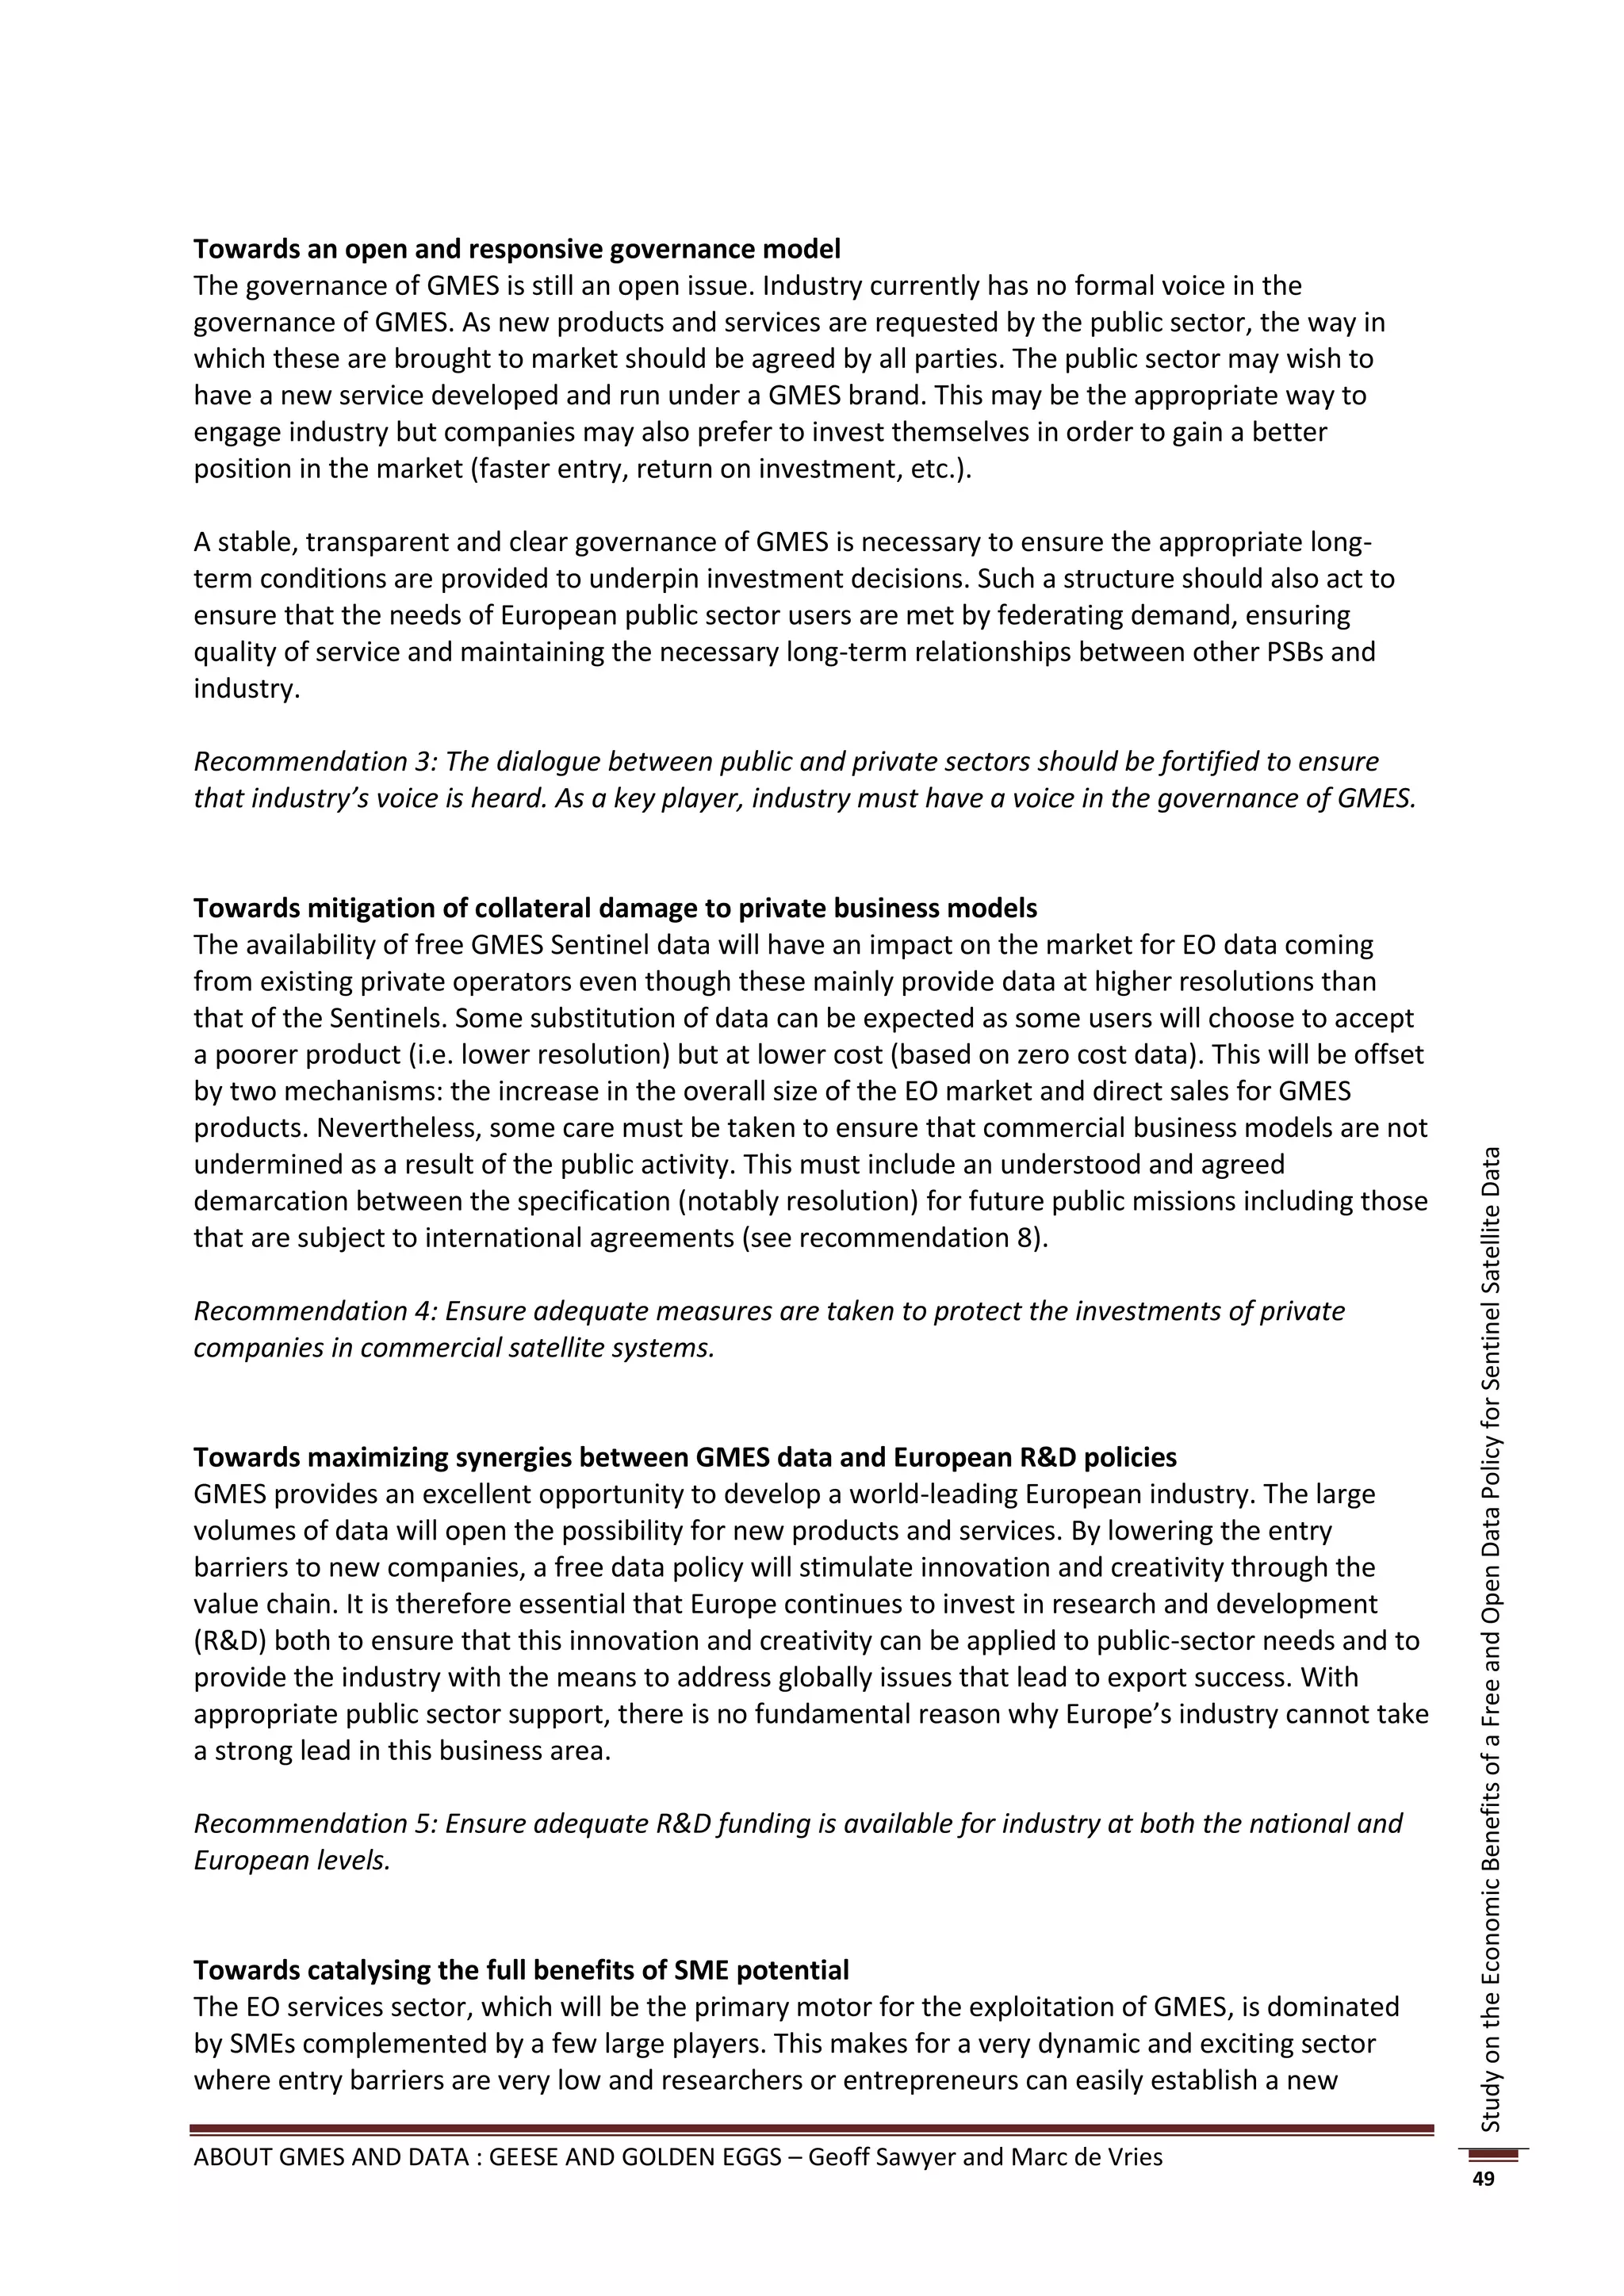
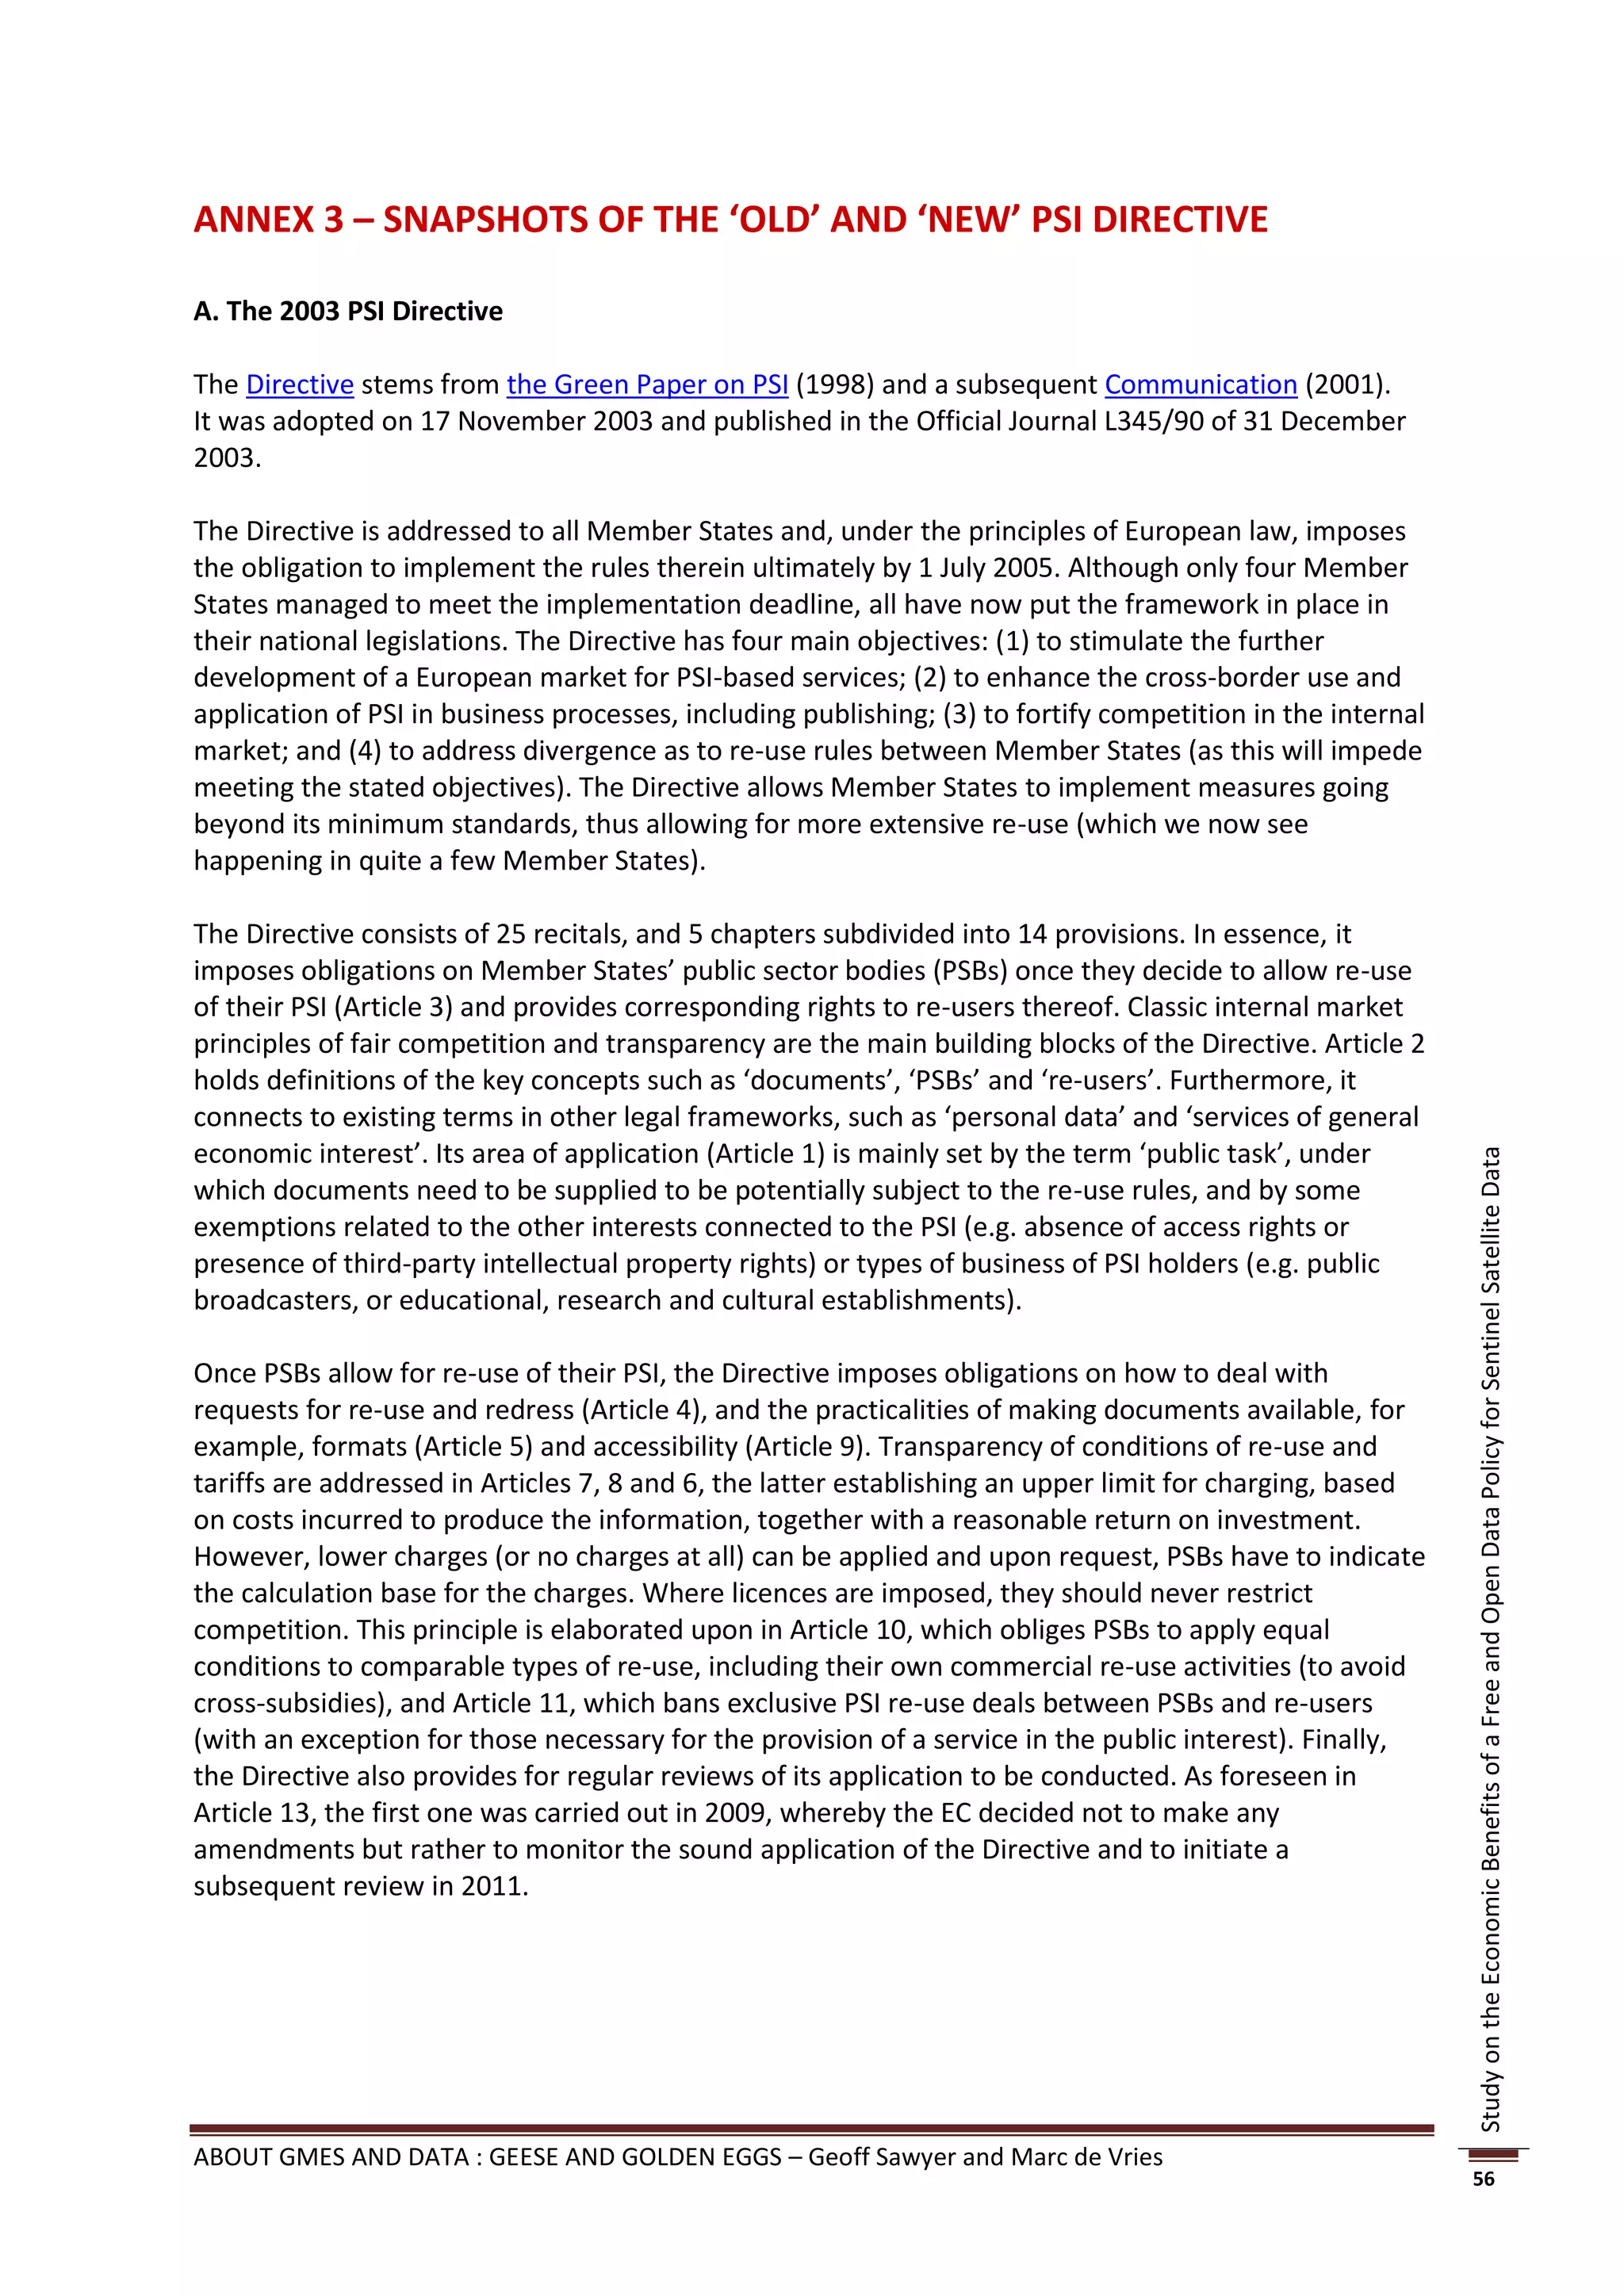
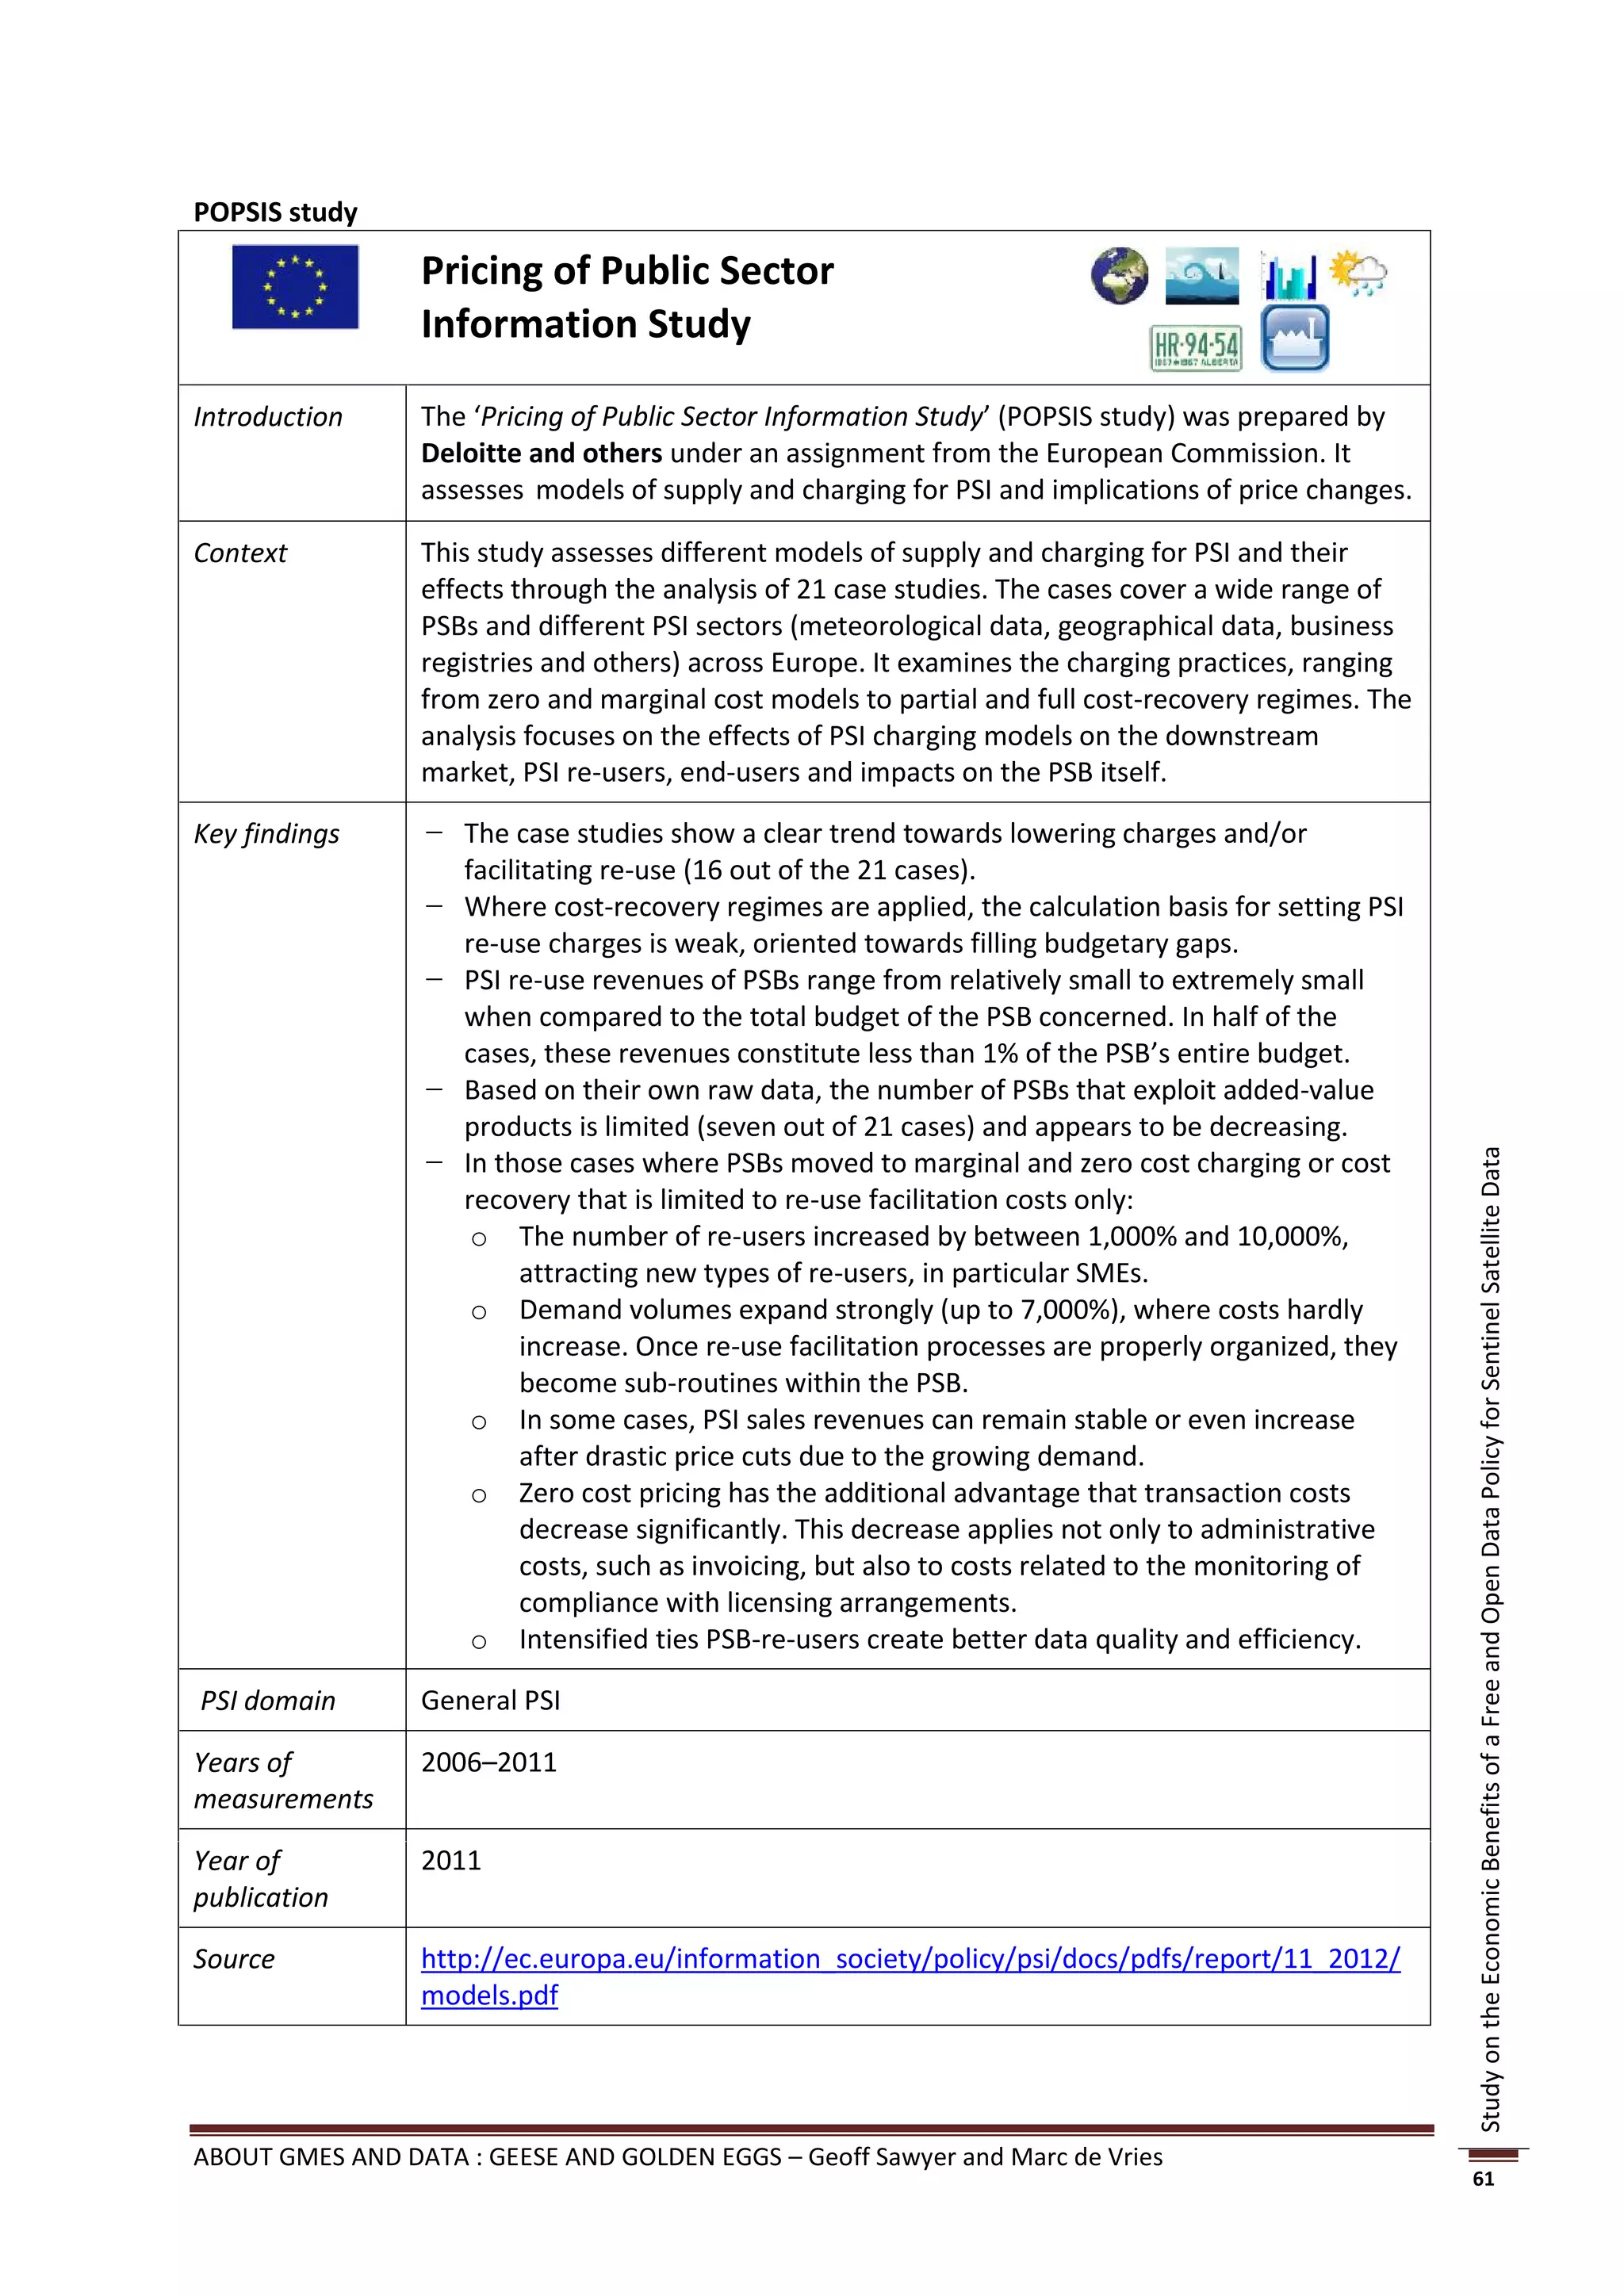
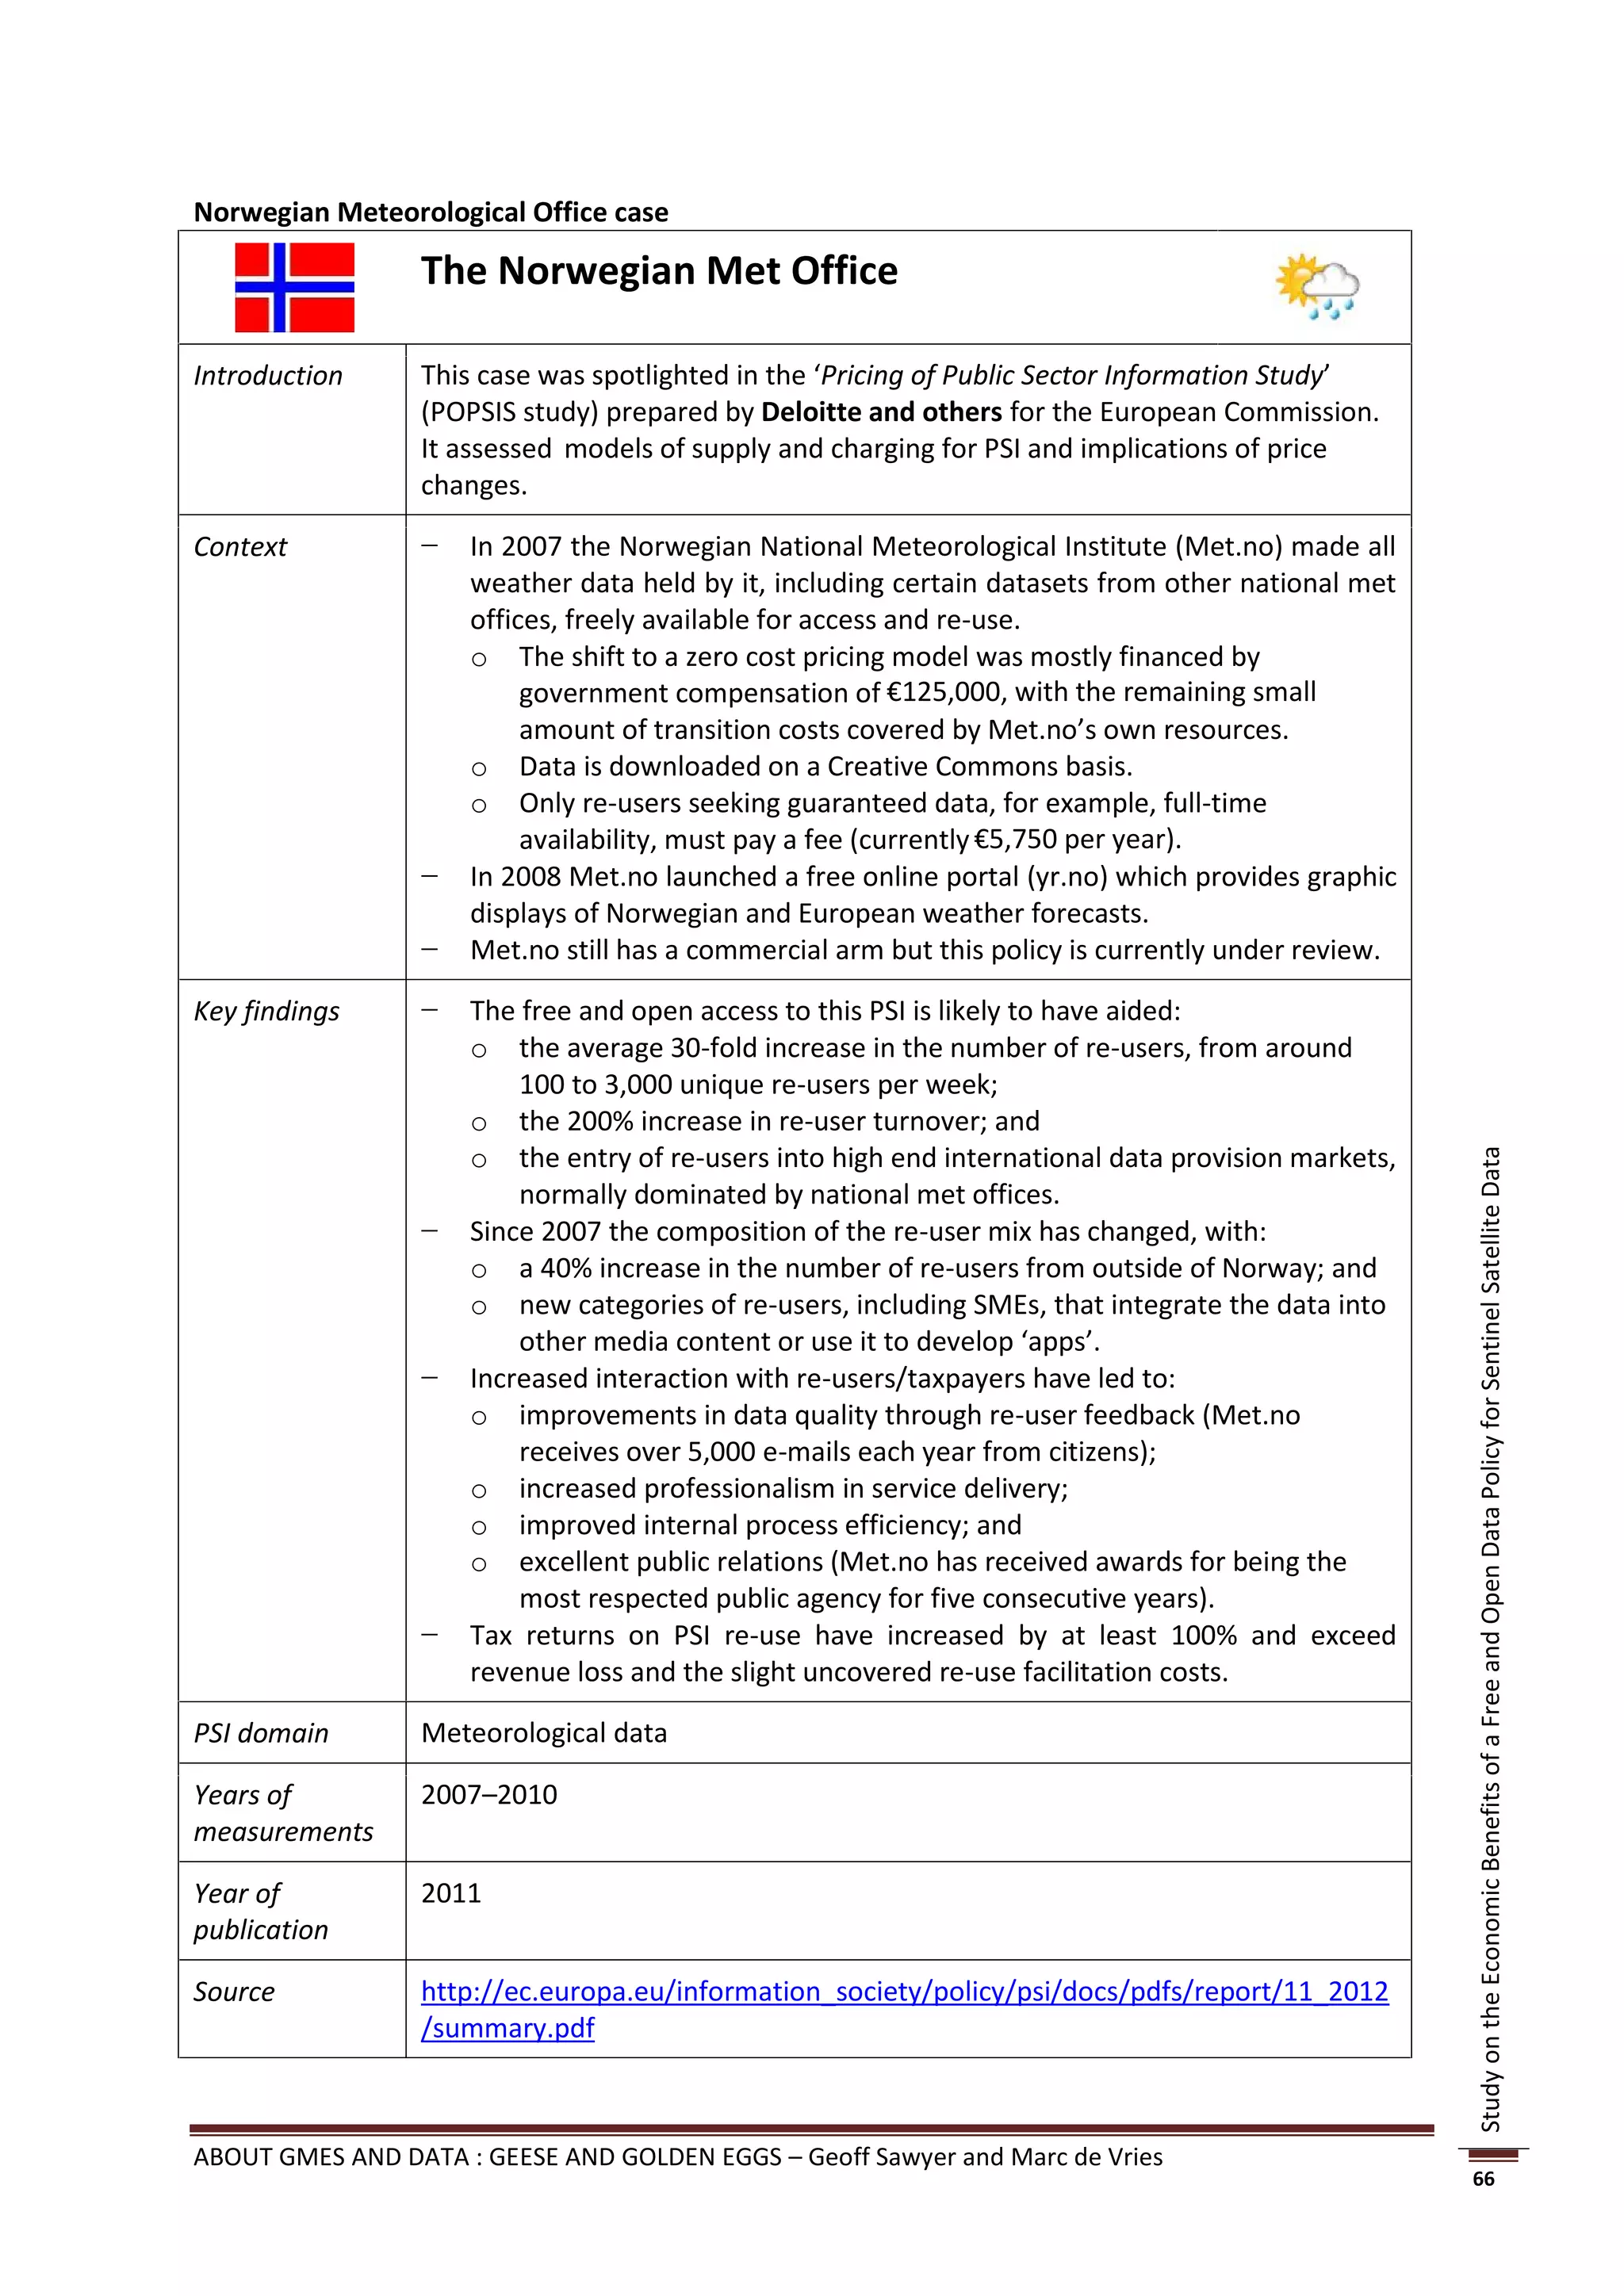
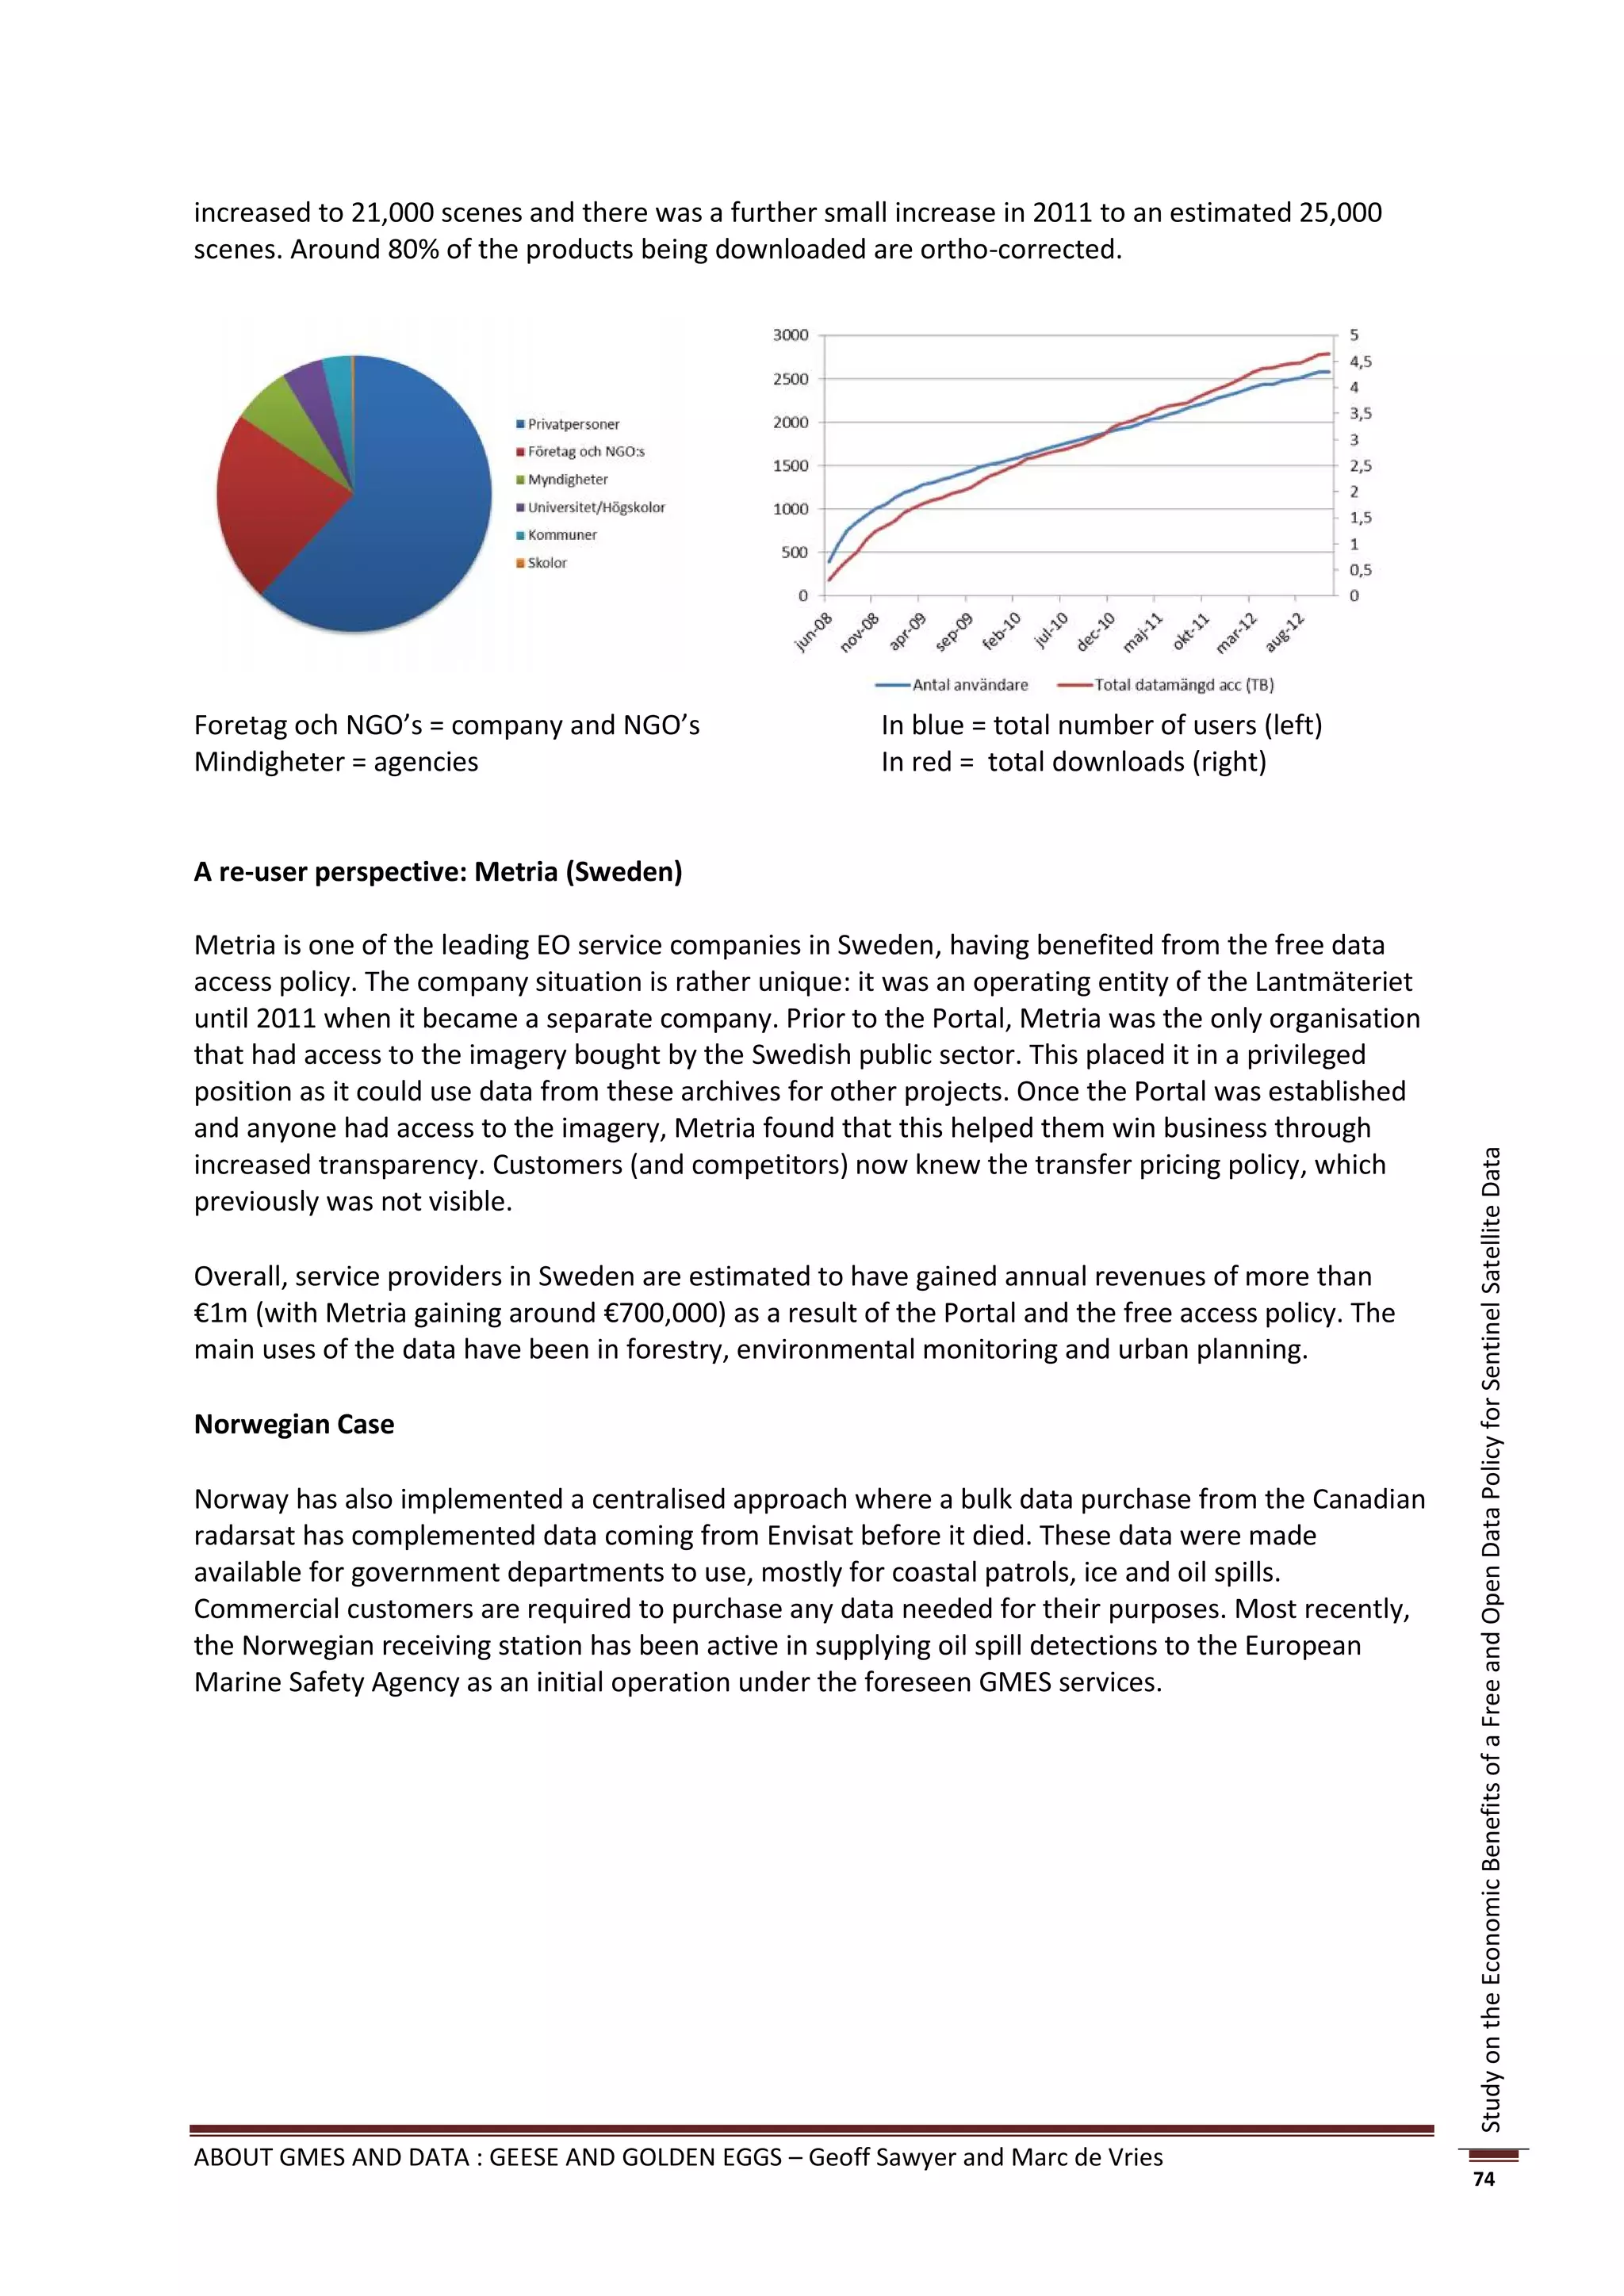
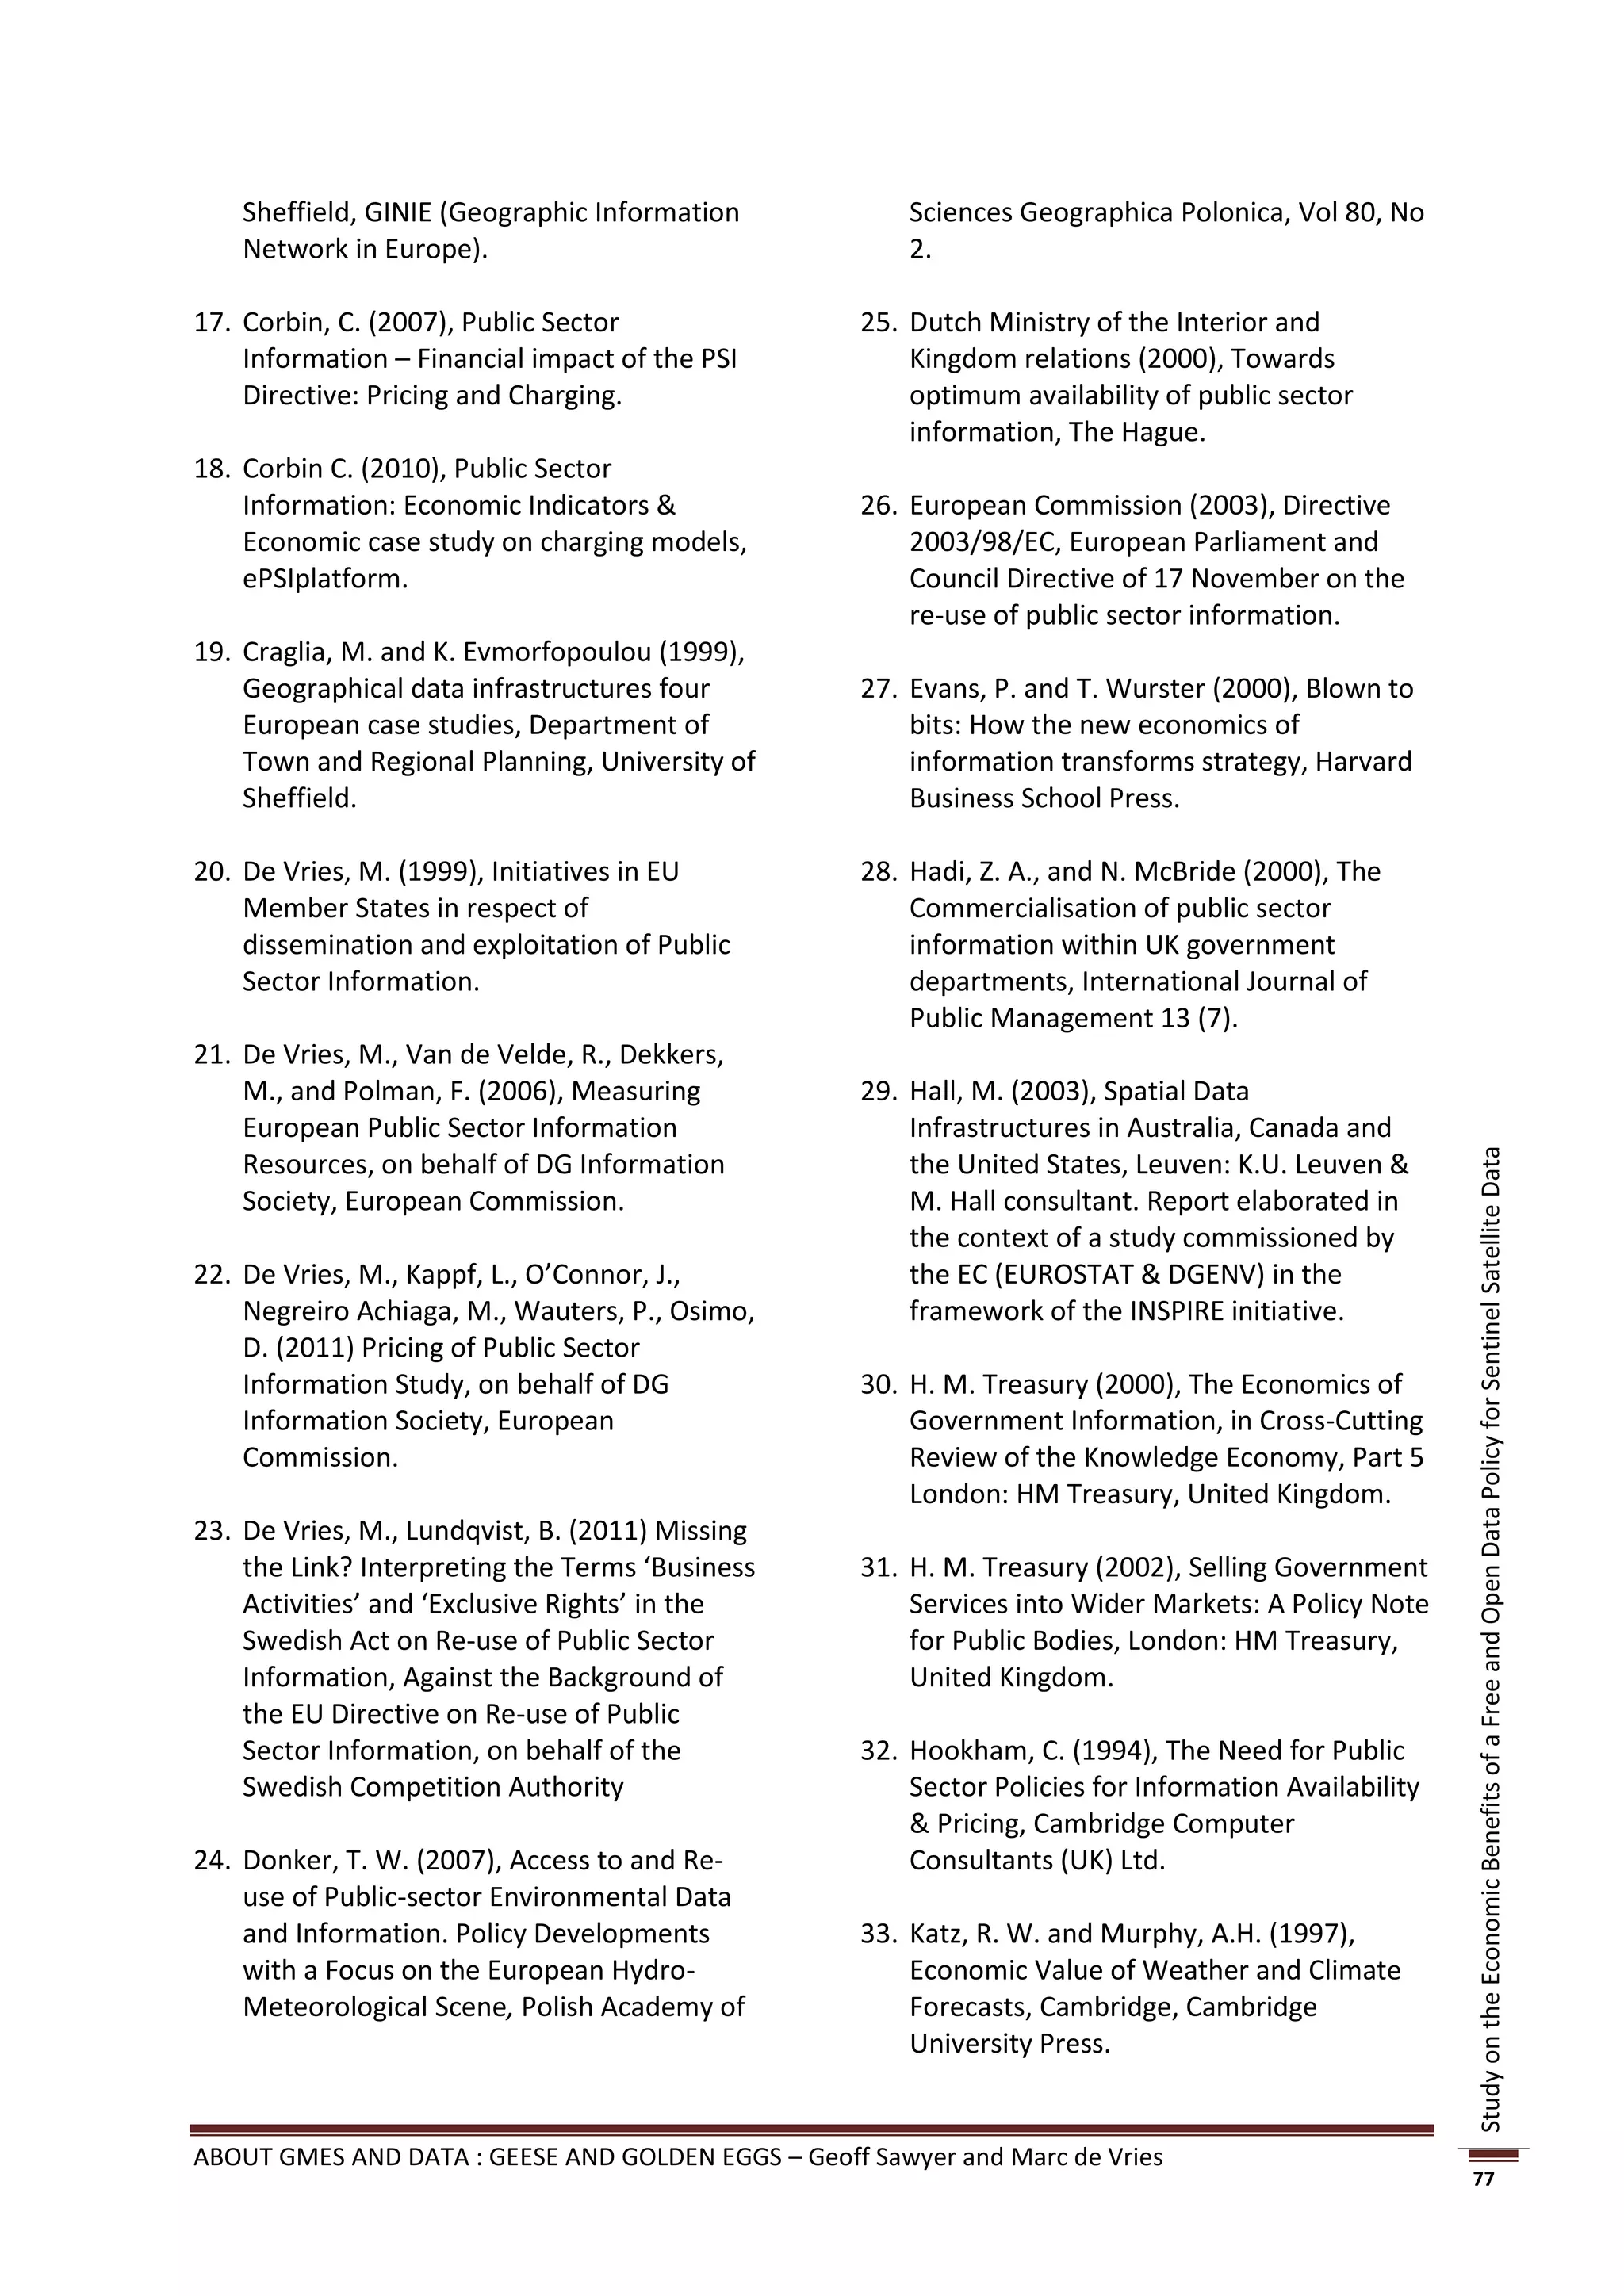
![month—an incredible statistic when considering that for the entire year of 2001 (when the previous
record was set for data distribution) approximately 25,000 images were purchased.”50
In 2001, the year of highest downloads before 2008, nearly 20,000 scenes were taken at an average
of 53 scenes per day. In 2011, over 2 million scenes were downloaded at an average of over 5,000
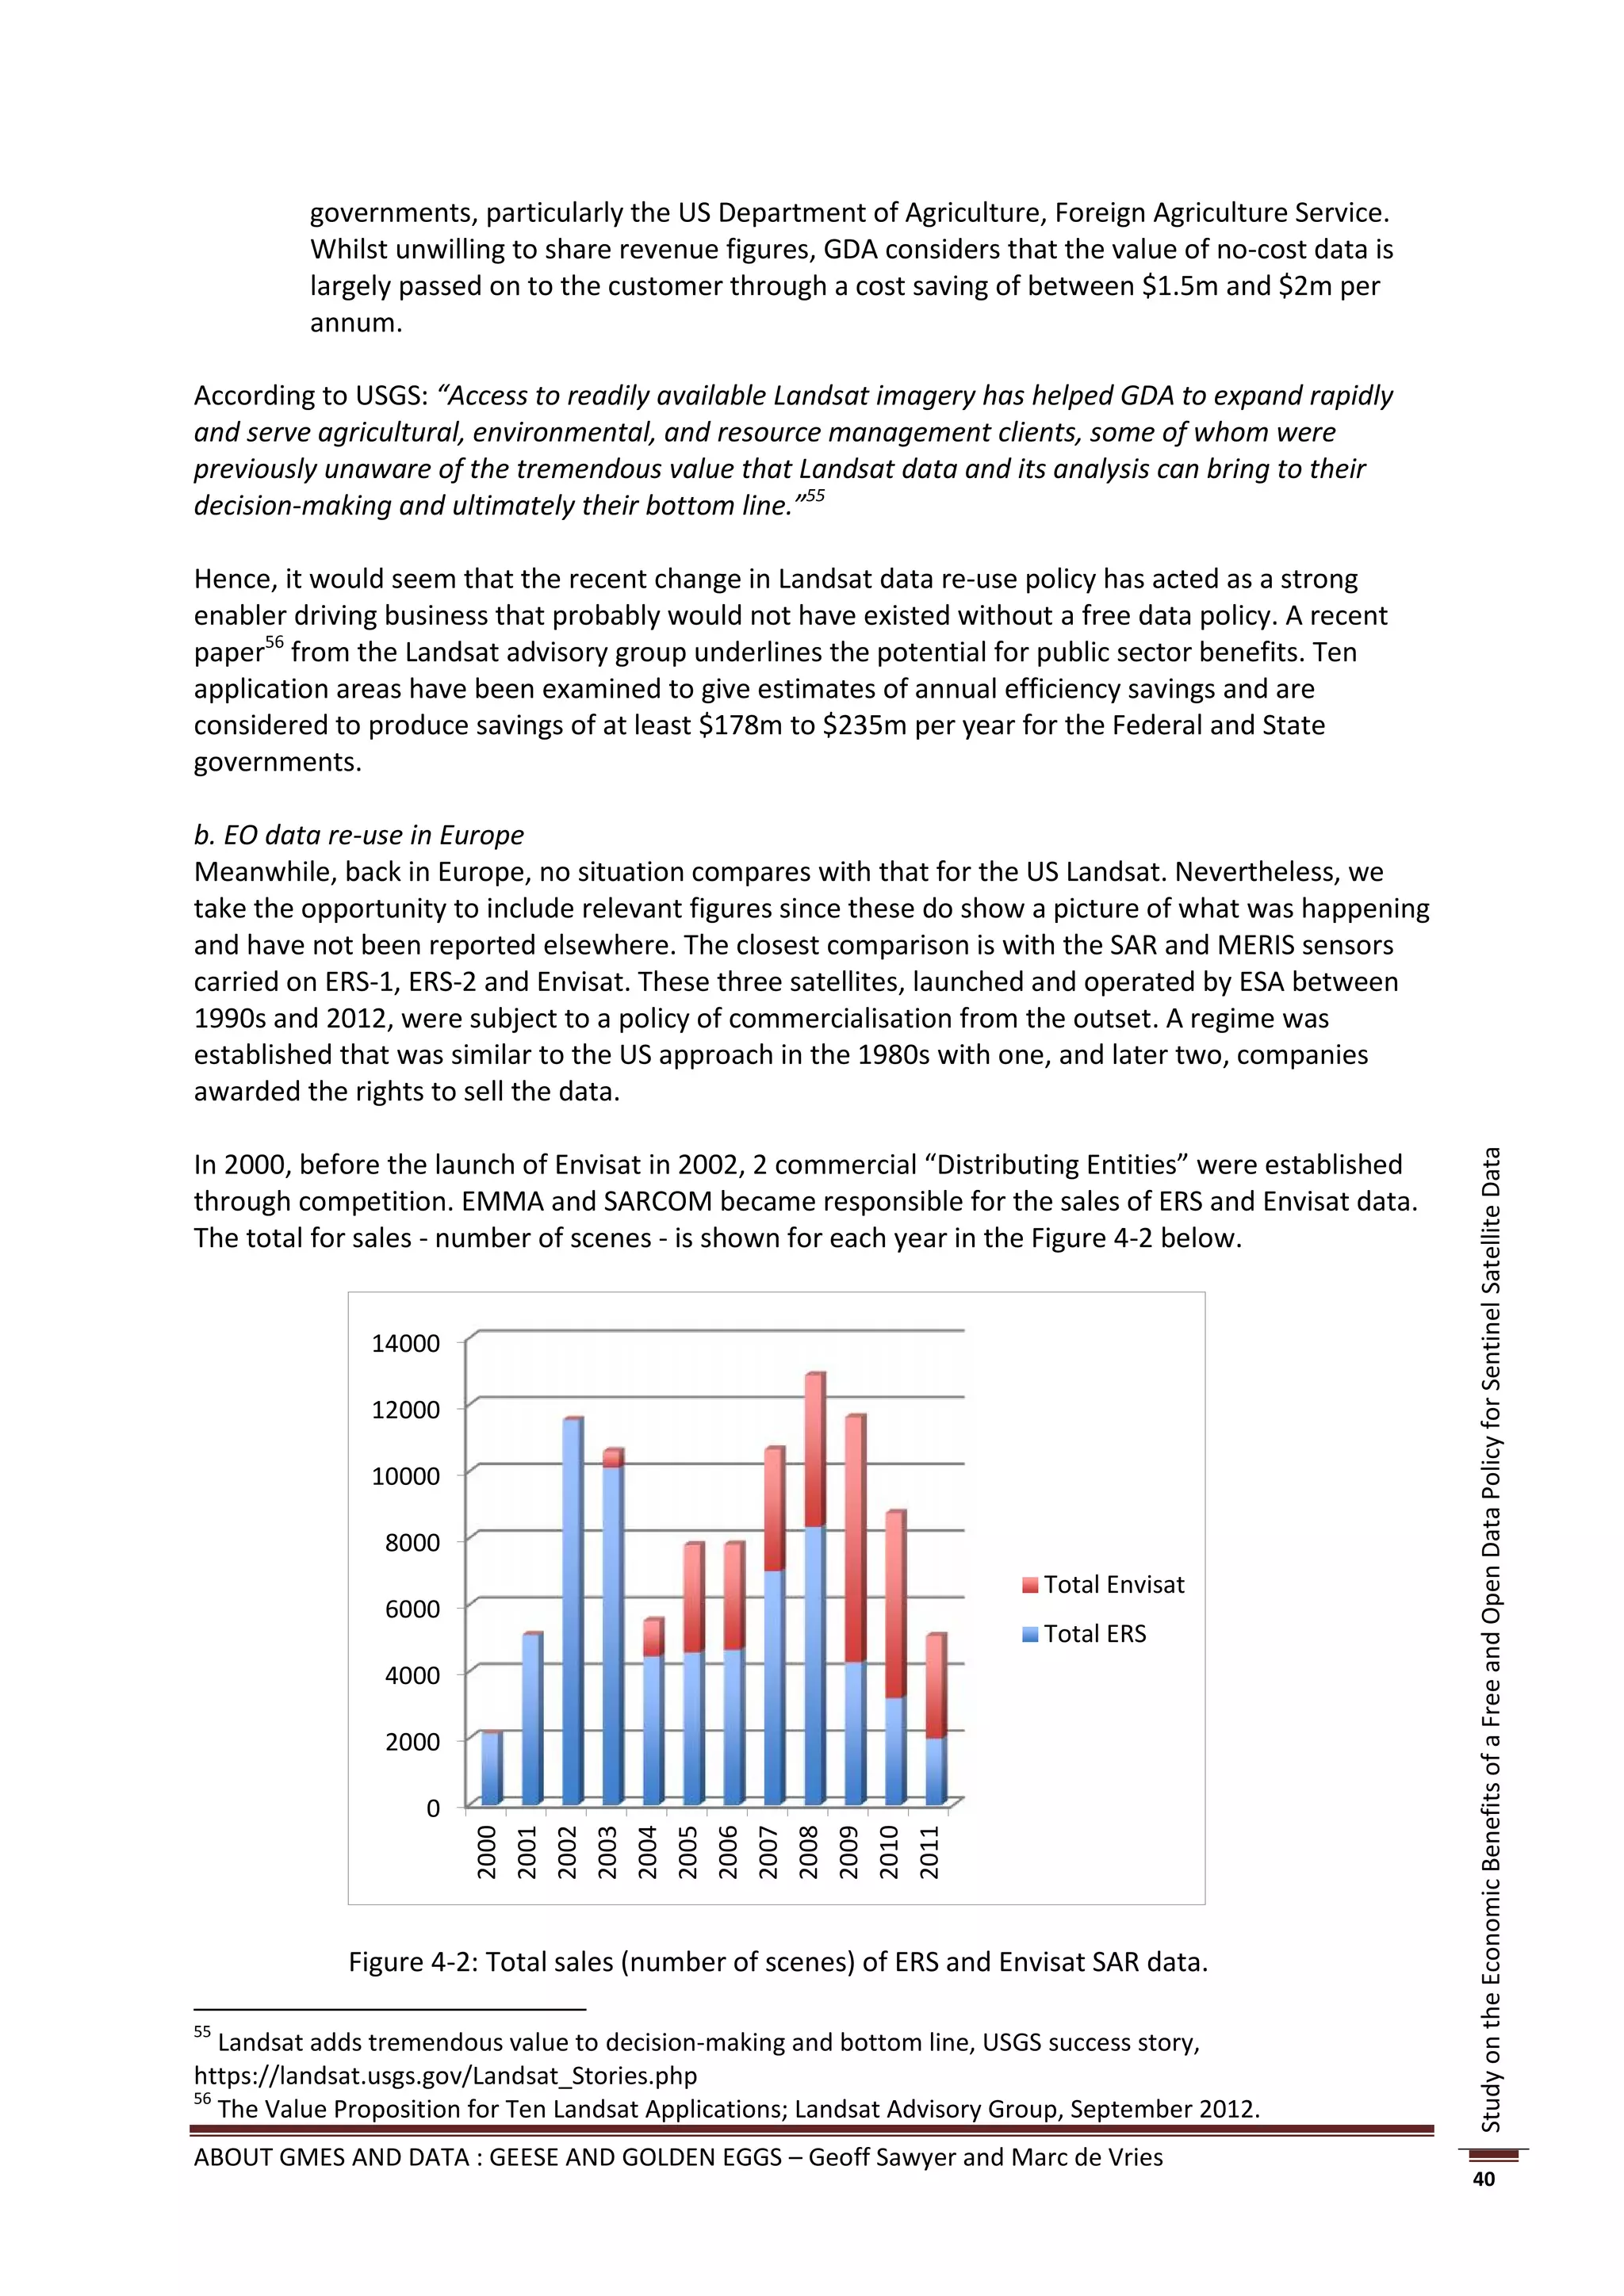
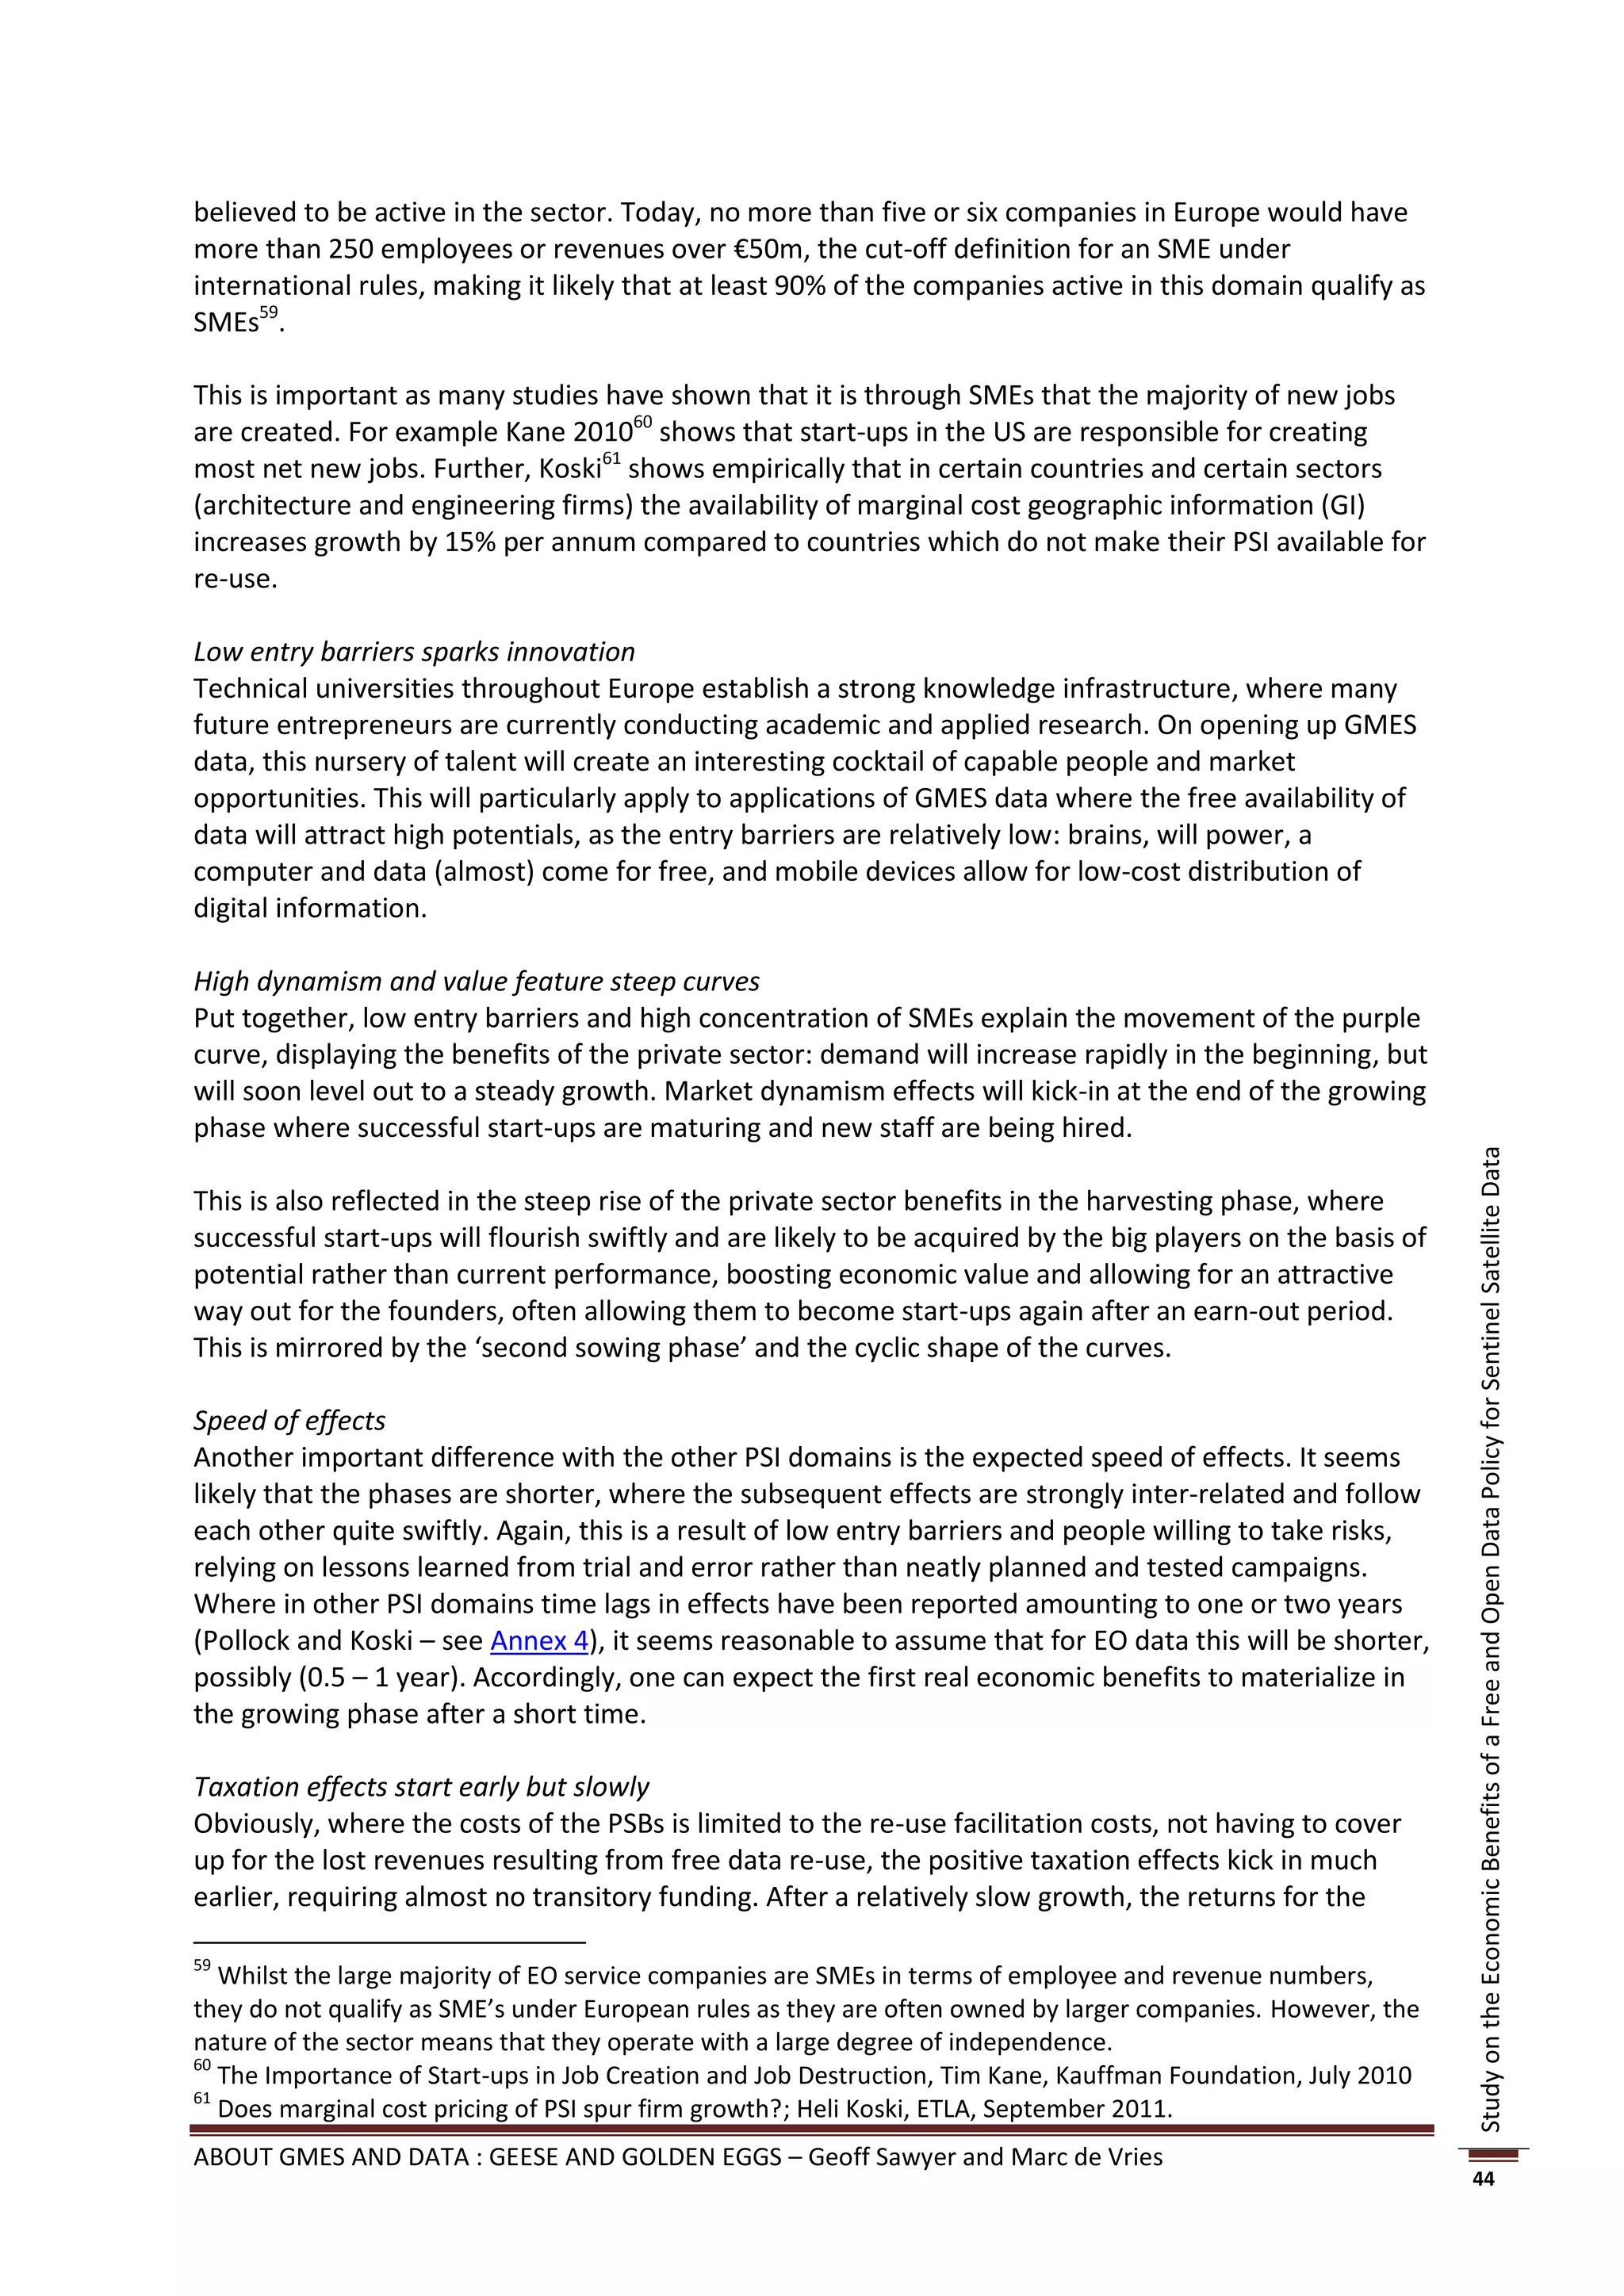
per day; a 100-fold increase. Clearly the interest in the data is very strong. See Figure 4-1 below.
Study on the Economic Benefits of a Free and Open Data Policy for Sentinel Satellite Data
Figure 4-1: Landsat image downloads since 2008 (courtesy of USGS)
For a full history of the Landsat programme see [Wulder et al50 and USGS54].
Economic effects
In paragraph 3.4 we saw a series of economic effects resulting from the opening up of PSI in the
other domains. How do these compare to the Landsat case?
i) Demand effect
This dramatic increase in the use of the data corresponds with the findings in other domains seen in
the sowing phase (see paragraph 3.4). As the charging policy is changed and data is made freely
available, the interest increases by one or two orders of magnitude. There appears to be a definite
read-across from other PSI domains to the EO domain.
ii) Efficiency effect
The efficiency effect is where the PSB no longer has the cost overhead of maintaining the resources
needed to run the sales operation. In this respect, the USGS 2011 report says that “because the
internet makes it possible for users to download images directly … the bureau has realised savings
including eliminating the billing and accounting system.”51
50
Wulder, M.A., et al., Opening the archive: How free data has enabled the science and monitoring promise of
Landsat, Remote Sensing of Environment (2012), doi:10.1016/j.rse.2012.01.010
51
Landsat Fees, from the USGS website http://remotesensing.usgs.gov/landsat_fees.php
ABOUT GMES AND DATA : GEESE AND GOLDEN EGGS – Geoff Sawyer and Marc de Vries
38](https://image.slidesharecdn.com/opendatastudyfinalreport-130306143849-phpapp02/85/EARSC-Open-data-study-Final-Report-38-320.jpg)
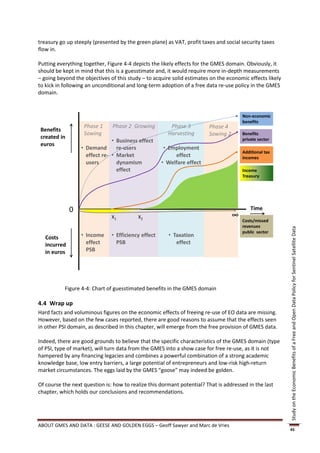
![As in the other domains, the income realised by the USGS was very low and barely covered the cost
of the sales system.
iii) Market dynamism effect
The users of Landsat imagery especially in the private sector have always been very sensitive to the
price demanded. Recall that in 1985, a single uncorrected Landsat scene cost $4,400, in 2001 it
would have been $600 and today it is free. The 1986 annual report on Landsat sales reported that:
“[T]he announcements in 1981, 1983 and 1985 that the prices would rise led to a roughly doubling of
demand in the months preceding the increase and to a drop in sales to very low sales immediately
following the increase52. [Furthermore,] in 1983 when prices tripled, government purchase revenues
increased 5 fold whilst the value of private purchases fell by one third”53.
Nevertheless, when the USGS made a survey of the users of the data in 2011, it found that “on
average, respondents were willing to pay $760 per scene which is greater than the previously
administratively set price.”54
This apparently rather confusing and somewhat surprising result provides evidence of the sensitivity
of entry barriers for commercial users. Since the majority of those downloading Landsat data are
“public good users”, it follows that the largest drop is from the commercial sector. Charging creates
too high an entry barrier and it is probably reasonable to conclude that the strongest impact falls on
SMEs. Certainly, intuitively, this would be the case.
Furthermore, the USGS study54 shows that it is the academic and federal government users that are
willing to pay the highest prices. As these are the largest users, in the set-up where Landsat charges
were made, most of the funds were simply circulating within government circles.
Study on the Economic Benefits of a Free and Open Data Policy for Sentinel Satellite Data
Cutting the charges spurs innovation and re-use and creates new markets for the information.
iv) Business effect.
The strong surges in data downloads provide evidence that the data has value. Are there cases where
users of the data can show improved business results? In the course of the study we spoke with two
of the larger commercial users of Landsat data, the essence thereof is summarized below.
MDA Federal is a private company and one of the largest users of Landsat data. They report
that out of $30m annual revenues, over $10m are generated using Landsat data and that as
a result of the policy change, they have recruited an additional 125 employees.
Furthermore, whilst they used to have a business in correcting the data, this has been
replaced by additional processing in the PSB. In other words, the PSB has moved forward in
the value chain in a way that the industry approves of! It is also a great advantage for
Landsat data that it is easy for users to download, partly helped by the enhanced degree of
processing ensuring geo-location accuracy. This is an important point to return to because
it is insufficient to just make data available free, it must also be easy to access. If it is not, all
savings in data purchase go in to the time and effort needed to access the data.
GDA Corporation is another company to report on the benefits derived from Landsat’s
revised data policy. GDA Corp is a relatively young company, formed in 2002; it has about
10 employees. GDA offers a crop mapping service that is mainly used by federal and state
52
Encouraging Private Investment in Space Activities; Report to the US Congress, 1991.
53
USGS EROS data centre Annual report for Landsat sales 1987.
54
The users, uses and value of Landsat and Other Moderate-Resolution Satellite Imagery in the United States;
Miller et al. USGS 2011.
ABOUT GMES AND DATA : GEESE AND GOLDEN EGGS – Geoff Sawyer and Marc de Vries
39](https://image.slidesharecdn.com/opendatastudyfinalreport-130306143849-phpapp02/85/EARSC-Open-data-study-Final-Report-39-320.jpg)


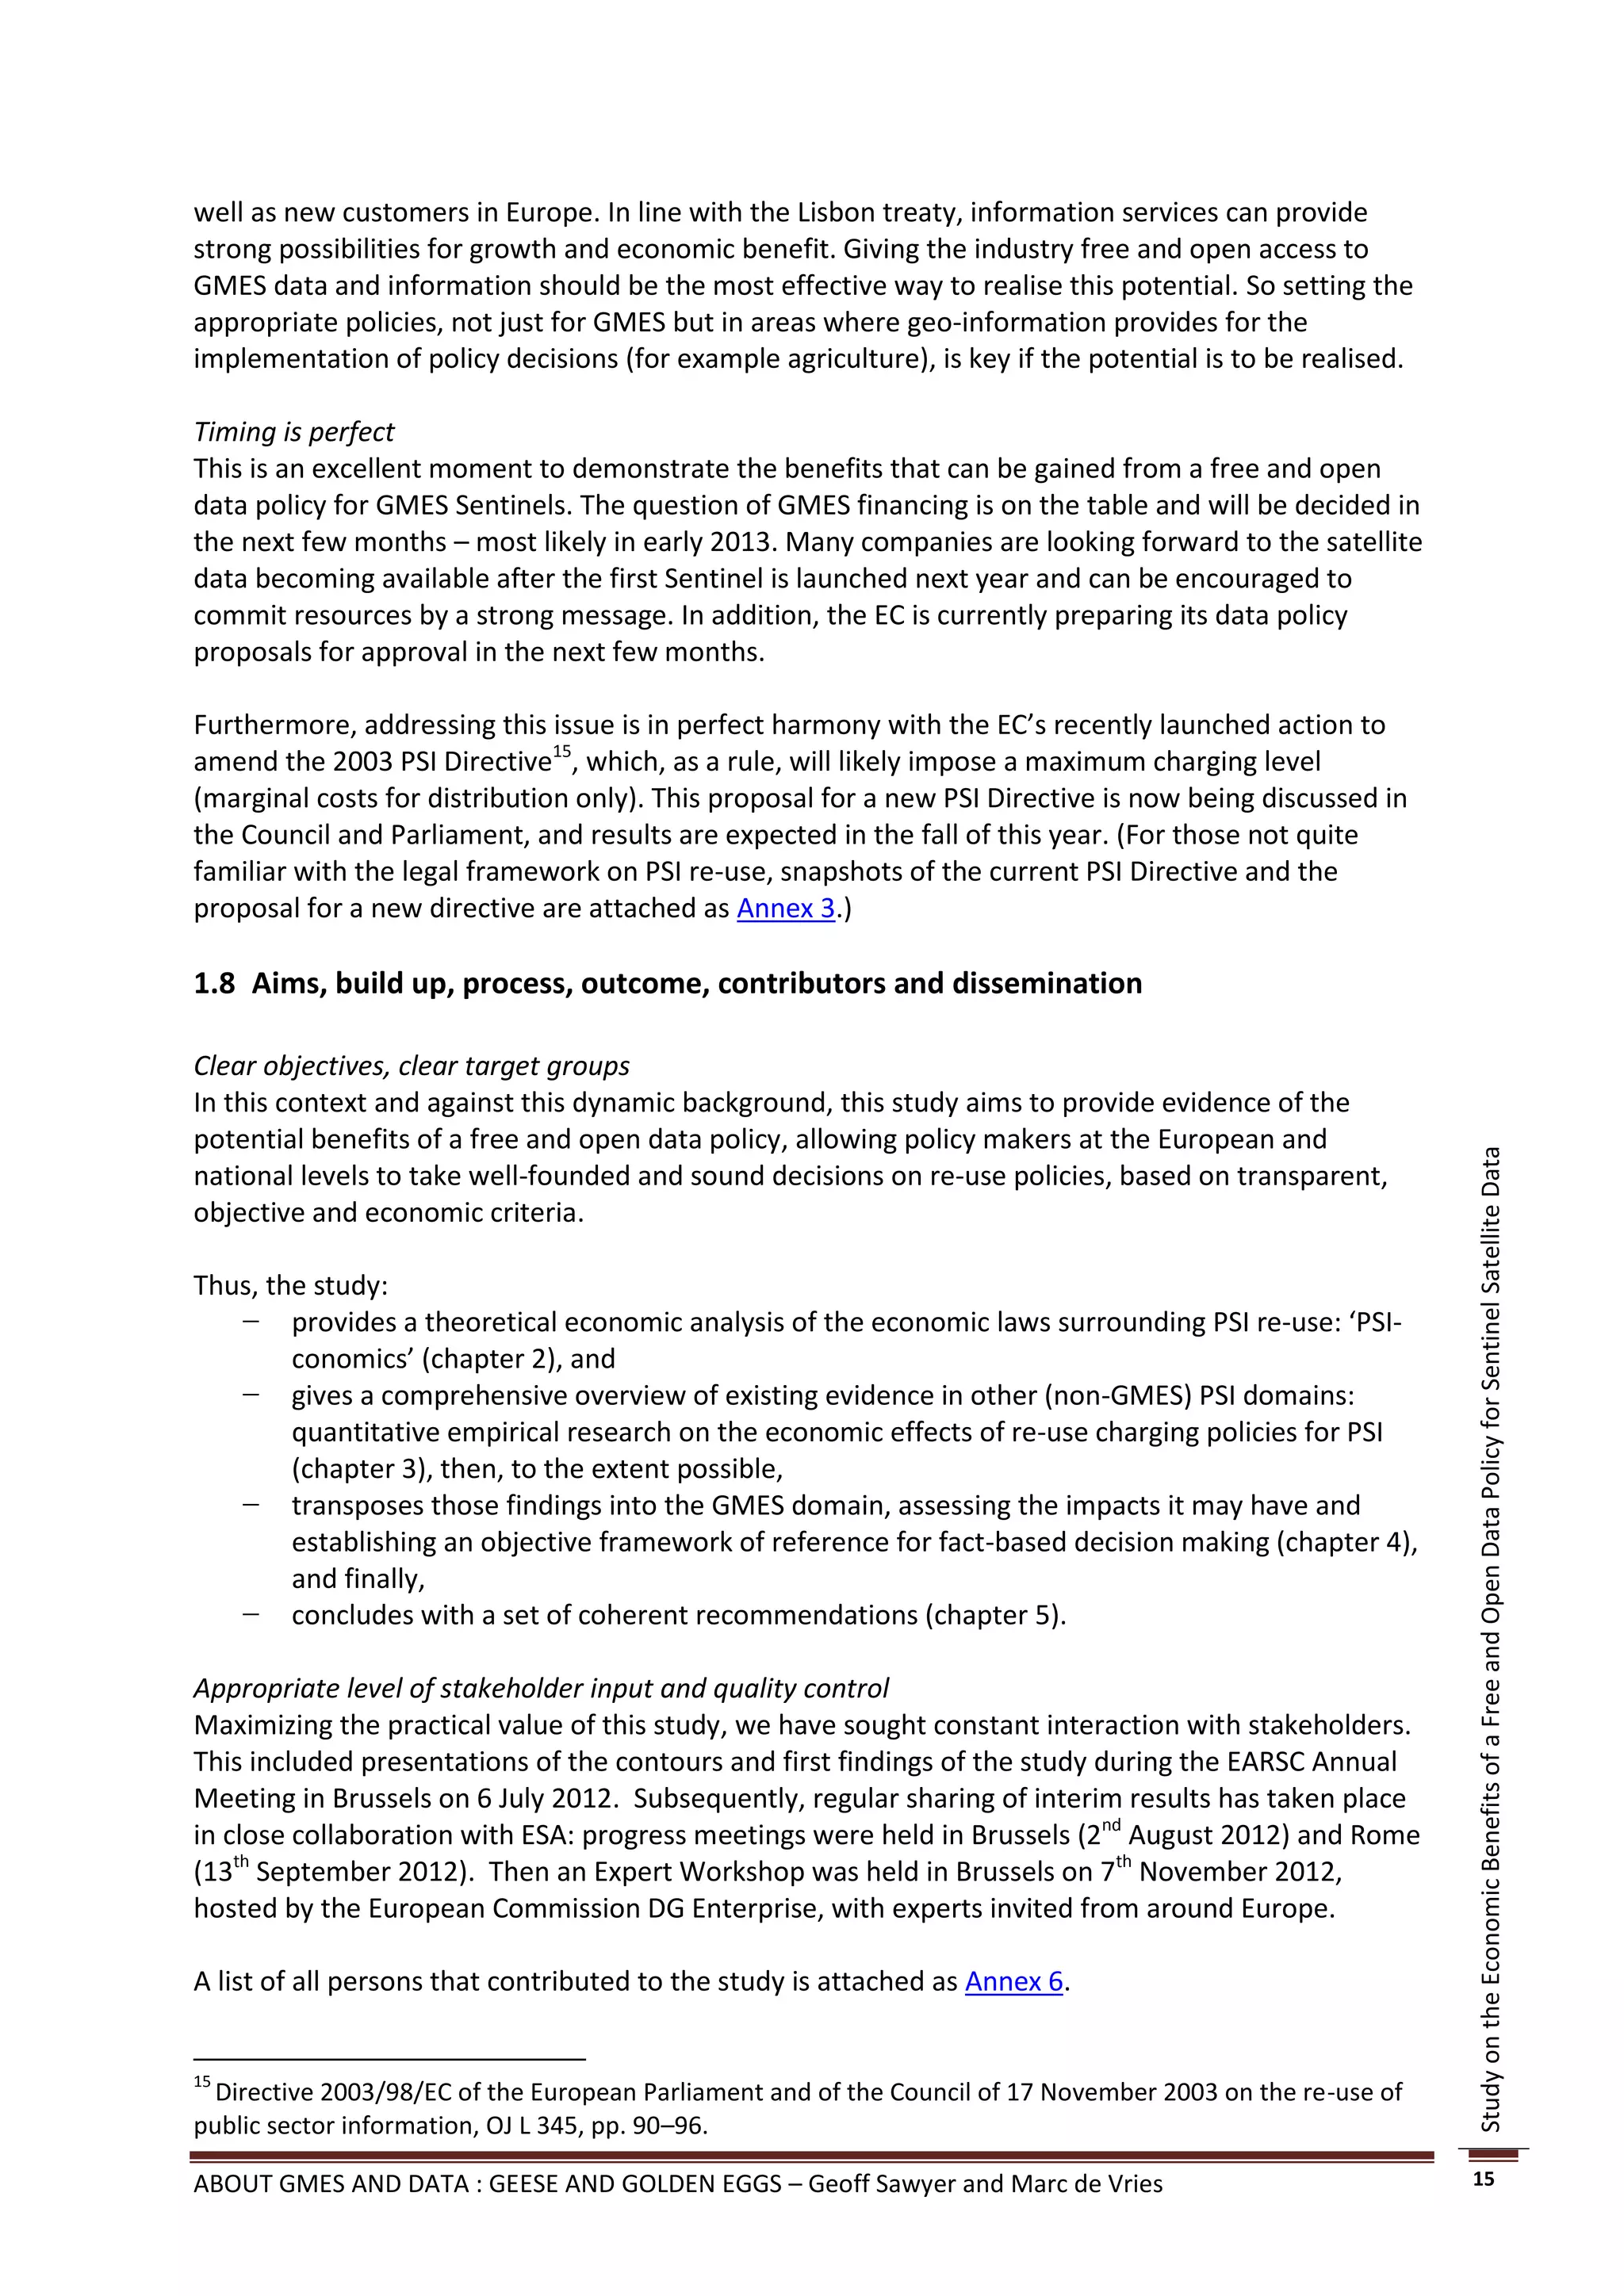
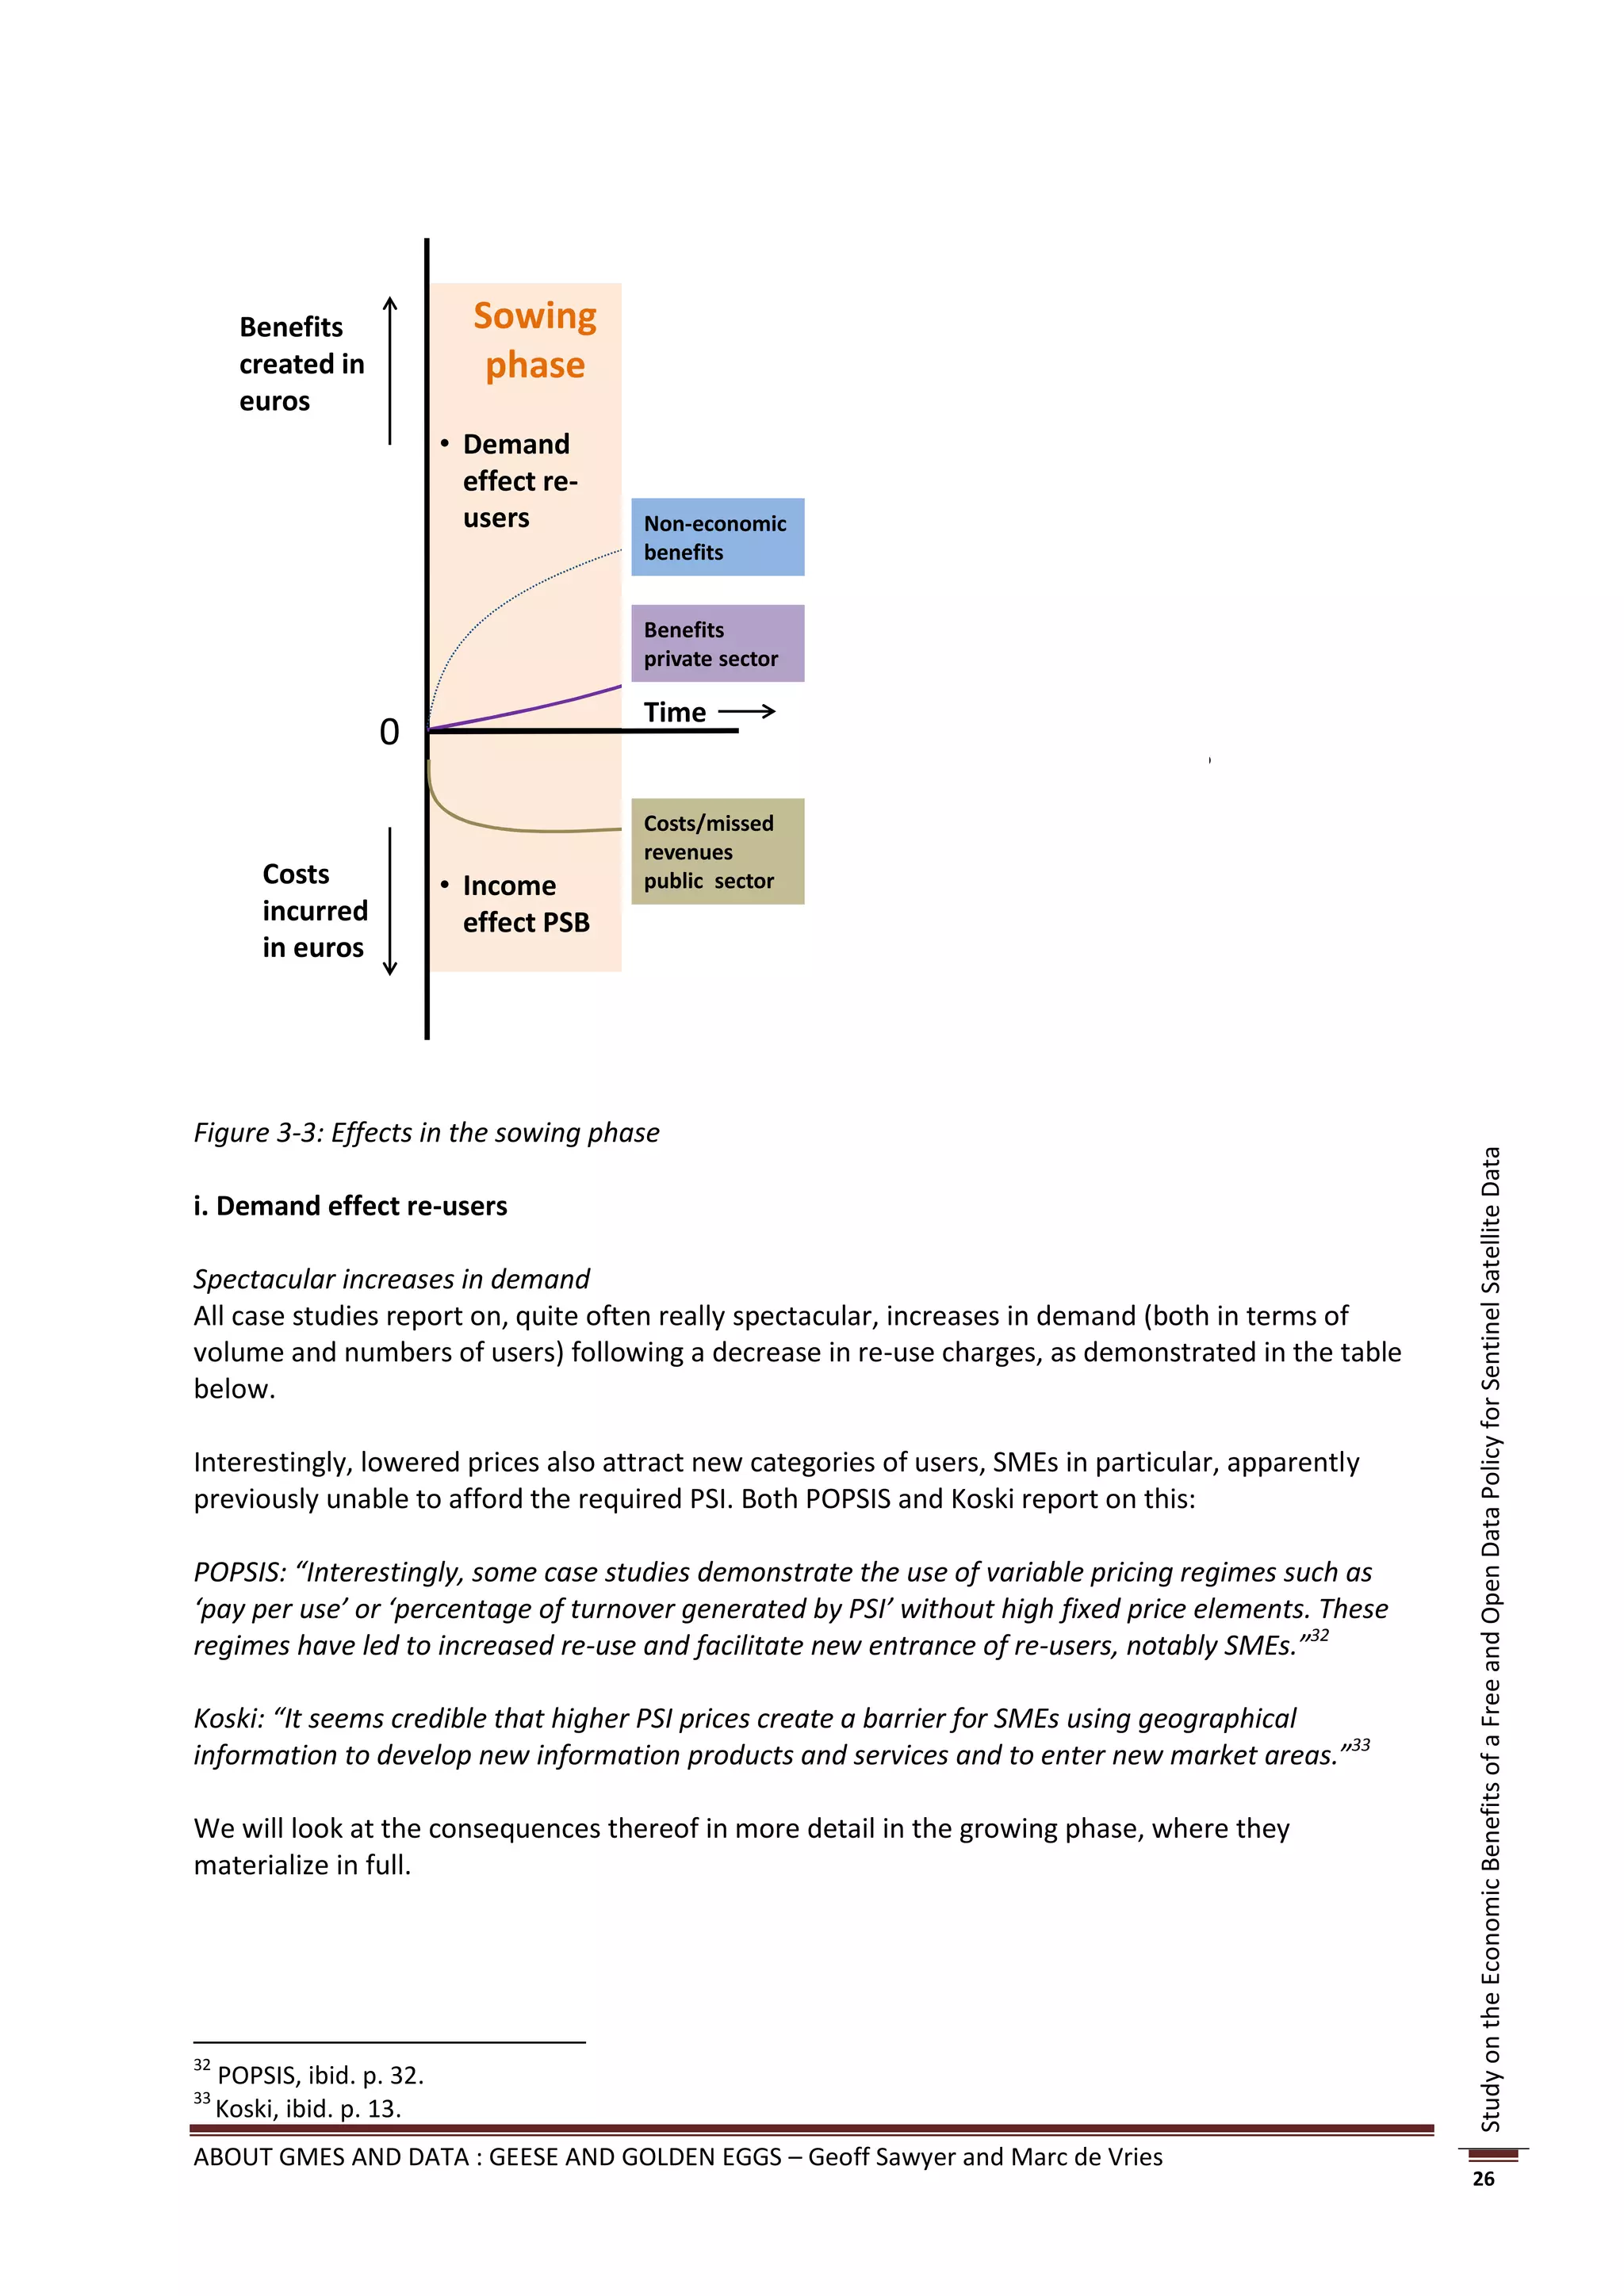
![several such bodies governed by public law.” (Art. 2(1) Directive
2003/98/EC)
Public sector "[E]xisting documents (holding content, whatever its medium and any
information (PSI) part of such content) held by PSBs of the EU Member States." (Art. 1(1)
j-o 2(3) Directive 2003/98/EC)
Public task Setting the scope of the public task (and its financing) is a political
decision taken at the national level (not the European level).
Nevertheless, to determine the public task, some thumb rules apply:
PSI is produced under the public task if:
a. the PSI is the result of the legal regime under which the PSB works.
Example: all constitutions assign the task of producing court
decisions to national courts; hence, their case law is produced under
the public task and falls under the PSI Directive.
b. the production, processing, or distribution of the PSI falls under the
core business and responsibility of the PSB. Example: the sole reason
for setting up the Dutch Chamber of Commerce was to maintain the
Dutch business registers; hence, those registers are produced under
the public task and fall under the PSI Directive.
c. there is a strong public interest involved in the production,
processing, or distribution of the PSI concerned, whereby society at
large benefits (i.e. the benefits do not accrue to just a small group of
people). Example: maintaining the quality of cadastral data is key as,
otherwise, there would be even higher risks involved in buying
property (i.e. the buyer might risk paying money to a person other
Study on the Economic Benefits of a Free and Open Data Policy for Sentinel Satellite Data
than the real property owner). Therefore, producing cadastral
information is done under the public task and falls under the PSI
Directive.
d. without the engagement of the government, the PSI would not be
produced because of market failure, i.e. the market would not be
able or willing to perform this task. Example: the private sector
cannot afford to build and launch the weather satellites required to
gather meteorological data. Therefore, national meteorological
services undertake these activities, which are regarded as falling
under the public task. Thus, the output falls under the PSI Directive.
Re-use Any use of PSI outside the public task including use by the PSBs
themselves (including the PSB that has produced the PSI under its
public task).
“Use by persons or legal entities of documents held by public sector
bodies, for commercial or non-commercial purposes other than the
initial purpose within the public task for which the documents were
produced. Exchange of documents between public sector bodies purely
in pursuit of their public tasks does not constitute re-use.” (Art. 2(4)
Directive 2003/98/EC)
Sentinels A system of five satellites being developed by the European Space
Agency, which will be used to provide EO data for GMES.
ABOUT GMES AND DATA : GEESE AND GOLDEN EGGS – Geoff Sawyer and Marc de Vries
55](https://image.slidesharecdn.com/opendatastudyfinalreport-130306143849-phpapp02/85/EARSC-Open-data-study-Final-Report-55-320.jpg)


![Case study PSI domain Price cut re- Increase in demand
use charges
Austrian Cadastre Topographical data Up to 97% Factor 2 – 7 in number of downloads34
(POPSIS + Koski)
DECA (POPSIS) Danish address data almost 100% Factor 100 in number of re-users
KNMI (POPSIS) Dutch meteo data 80% Factor 10 in number of re-users, 90%
of them being SMEs
MET.NO (POPSIS) Norwegian meteo 100% Factor 30 in numbers of unique
data weekly re-users, majority being SMEs
Spanish Cadastre Spanish 100% - Factor 80 – 100 in numbers of
(POPSIS + Koski) topographical data downloads
- Factor 25 in numbers of re-users
Houghton study Australian:
- Topographical - almost 100% - 172%
data - 100%
- Statistical data - Factor 3 in product downloads
- Hydrological data - 100%
- Factor 100 in data requests
- Factor 2 for extractions of re-use
Figure 3-4: Overview of increases in demand following lowered PSI re-use charges
PSI features relatively elastic demand
These figures confirm previous research (Trading Funds Study and Pollock Study) that suggested a
price elasticity of demand (PED) well above 1 (in absolute terms), meaning that in case a PSB lowers
its prices (so not dropping the charging all together) the relative increase in quantity outweighs the
relative discount, generating higher revenues than before.35
Study on the Economic Benefits of a Free and Open Data Policy for Sentinel Satellite Data
Pollock notes that evidence on price elasticity is limited, and its value will be determined by the
nature of the product at issue. Nevertheless, he estimates that elasticity is generally greater than 1,
and the range for the kinds of products that are the subject of this study is between 0.5 and 2.5.
According to the Trading Funds Study, elasticity of demand varies depending on the PSI, but for the
products associated with the PSI, average elasticity is estimated at between 1 and 2.
The POPSIS findings confirm this in the Austrian cadastre case and the Dutch KNMI case.
POPSIS: “[T]he Austrian Federal Office of Metrology and Surveying adopted a simplified and more
market-oriented PSI pricing approach with drastic price cuts of up to 97% within strict budget
constraints (there was no additional governmental funding). Due to the additional demand – notably
from SMEs – triggered by lower prices, PSI sales revenues and the associated cost-recovery ratio could
be kept stable or slightly increased. Without additional governmental funding, BEV could improve the
situation for re-use business and secure a wider use of its public data.”36
POPSIS: “In 1999, at the peak of competition between the commercial activities of the KNMI and the
private sector re-use activities, there were in essence two re-users of KNMI data. … About ten years
later, after full implementation of the new re-use policy, this picture had changed quite dramatically.
34
Cartographic products with a factor 2 – 15, digital ortho-images with a factor 70, digital cadastral map and
elevation model with factor 2.5, the digital landscape model with a factor 10.
35
The formula for the coefficient of price elasticity of demand (PED) is (dQ/Q)/(dP/P), whereby Q is the
quantity, P is the price and d is the changes therein. Generally, if PED for a good is relatively elastic (-∞ < Ed < -
1), the percentage change in quantity demanded is greater than that in price. Hence, when the price is
lowered, the total revenue increases.
36
POPSIS, ibid., p. 127.
ABOUT GMES AND DATA : GEESE AND GOLDEN EGGS – Geoff Sawyer and Marc de Vries
27](https://image.slidesharecdn.com/opendatastudyfinalreport-130306143849-phpapp02/75/EARSC-Open-data-study-Final-Report-27-2048.jpg)


![to oil rigs, based on its own high-tech forecast models. The high-end market services are highly
targeted, the number of clients is relatively low and yet the value of each transaction is high.
Conversely, in the low-end market, business models are based on reaching out to large volumes of
(generally non-professional) consumers who use high traffic web services and maybe apps on mobile
devices. Typically, these re-users merely mash up the PSI with other free content and integrate it into
services, not adding much value, other than distributing it widely. The re-users’ revenues come from
third-party advertisements, not from its users.
Backing this up, in the Dutch KNMI case, the POPSIS study reports:
“The lowered price level increased competition and sparked innovation: second-tier users of
meteorological information were offered smart, new products. For instance, the greenhouse sector in
the Netherlands was able to save about 10% on its energy costs due to its access to real-time detailed
forecasting of rainfall services. This allowed the sector to maximize the length of time that the
greenhouses can remain open to the air. This not only very beneficial for the crops but also for the
environment, since it reduces carbon dioxide emission quite considerably.... New business models
emerged: a new re-user entered the market and launched an innovative service under the name
‘Rainfall Radar’ (Buienradar). Anyone can use the service to determine whether it is going to rain in
the current location in the next few hours. This service is provided completely free of charge. It
generated around 300 million hits per year throughout Europe in 2010. As a result of this high traffic,
it is paid for through advertising revenues. Finally, since all KNMI data products are license free,
almost no restrictions in use or distribution are set. Some of the re-users have started activities as
distributors.”44
Stifling effects of strong PSB presence in the market
One may also ask what the consequences are when prices are not lowered. The two Pettifer studies
provide evidence of the consequent damage being incurred in the meteo domain: not lowering its re-
Study on the Economic Benefits of a Free and Open Data Policy for Sentinel Satellite Data
use charges and its own downstream market activities, the national Met Offices trifles with the
market, where high charges block SMEs from entering.
In his first paper ‘Pricing of PSI in the Meteorological Sector blocks market development’, Pettifer
considers three hypothetical SMEs, in Luxembourg, Poland and France that provide weather-related
services relating to forecasting, highways and energy, and uses 2010 prices on a cost-recovery basis.
The absolute minimum PSI meteorological data required to provide basic weather-related services,
with a market value of €6 ,000 to €20,000 per contract, would cost a typical SME between €84,000
and €400,000. Pettifer’s conclusion therefore is that SMEs cannot operate successfully or compete
with large firms when partial or full cost-recovery pricing principles are used: cost-recovery pricing
principles are likely to create barriers to market entry because SMEs are probably unable to find the
20 contracts required to operate profitably.
In Pettifer’s second paper, ‘PSI in European Meteorology – an Unfulfilled Potential’, he assesses the
damage from this current practice, by comparing the European market figures with those of the US.
“Recent estimates of the size of the 2006 market in value-added meteorological products of all
types in the USA and Europe are of the order of $1.4 billion per annum and $372 million (€530 million)
per annum respectively. ... It would appear therefore that [on the basis of GDP] only about 0.3% of
the potential European market in this sector is currently being supplied whereas in the US the
equivalent figure is around 0.7%. Moreover recent estimates suggest that in real terms, after allowing
for growth in GDP, the US market has grown at an average rate of around 17% per annum over the
past six or seven years while the European market has been growing at closer to 1.2% per annum in
the same period. This type of difference can be seen in specific market sectors as well as in the overall
44
POPSIS, ibid. p. 274.
ABOUT GMES AND DATA : GEESE AND GOLDEN EGGS – Geoff Sawyer and Marc de Vries
32](https://image.slidesharecdn.com/opendatastudyfinalreport-130306143849-phpapp02/75/EARSC-Open-data-study-Final-Report-32-2048.jpg)


![month—an incredible statistic when considering that for the entire year of 2001 (when the previous
record was set for data distribution) approximately 25,000 images were purchased.”50
In 2001, the year of highest downloads before 2008, nearly 20,000 scenes were taken at an average
of 53 scenes per day. In 2011, over 2 million scenes were downloaded at an average of over 5,000
per day; a 100-fold increase. Clearly the interest in the data is very strong. See Figure 4-1 below.
Study on the Economic Benefits of a Free and Open Data Policy for Sentinel Satellite Data
Figure 4-1: Landsat image downloads since 2008 (courtesy of USGS)
For a full history of the Landsat programme see [Wulder et al50 and USGS54].
Economic effects
In paragraph 3.4 we saw a series of economic effects resulting from the opening up of PSI in the
other domains. How do these compare to the Landsat case?
i) Demand effect
This dramatic increase in the use of the data corresponds with the findings in other domains seen in
the sowing phase (see paragraph 3.4). As the charging policy is changed and data is made freely
available, the interest increases by one or two orders of magnitude. There appears to be a definite
read-across from other PSI domains to the EO domain.
ii) Efficiency effect
The efficiency effect is where the PSB no longer has the cost overhead of maintaining the resources
needed to run the sales operation. In this respect, the USGS 2011 report says that “because the
internet makes it possible for users to download images directly … the bureau has realised savings
including eliminating the billing and accounting system.”51
50
Wulder, M.A., et al., Opening the archive: How free data has enabled the science and monitoring promise of
Landsat, Remote Sensing of Environment (2012), doi:10.1016/j.rse.2012.01.010
51
Landsat Fees, from the USGS website http://remotesensing.usgs.gov/landsat_fees.php
ABOUT GMES AND DATA : GEESE AND GOLDEN EGGS – Geoff Sawyer and Marc de Vries
38](https://image.slidesharecdn.com/opendatastudyfinalreport-130306143849-phpapp02/75/EARSC-Open-data-study-Final-Report-38-2048.jpg)
![As in the other domains, the income realised by the USGS was very low and barely covered the cost
of the sales system.
iii) Market dynamism effect
The users of Landsat imagery especially in the private sector have always been very sensitive to the
price demanded. Recall that in 1985, a single uncorrected Landsat scene cost $4,400, in 2001 it
would have been $600 and today it is free. The 1986 annual report on Landsat sales reported that:
“[T]he announcements in 1981, 1983 and 1985 that the prices would rise led to a roughly doubling of
demand in the months preceding the increase and to a drop in sales to very low sales immediately
following the increase52. [Furthermore,] in 1983 when prices tripled, government purchase revenues
increased 5 fold whilst the value of private purchases fell by one third”53.
Nevertheless, when the USGS made a survey of the users of the data in 2011, it found that “on
average, respondents were willing to pay $760 per scene which is greater than the previously
administratively set price.”54
This apparently rather confusing and somewhat surprising result provides evidence of the sensitivity
of entry barriers for commercial users. Since the majority of those downloading Landsat data are
“public good users”, it follows that the largest drop is from the commercial sector. Charging creates
too high an entry barrier and it is probably reasonable to conclude that the strongest impact falls on
SMEs. Certainly, intuitively, this would be the case.
Furthermore, the USGS study54 shows that it is the academic and federal government users that are
willing to pay the highest prices. As these are the largest users, in the set-up where Landsat charges
were made, most of the funds were simply circulating within government circles.
Study on the Economic Benefits of a Free and Open Data Policy for Sentinel Satellite Data
Cutting the charges spurs innovation and re-use and creates new markets for the information.
iv) Business effect.
The strong surges in data downloads provide evidence that the data has value. Are there cases where
users of the data can show improved business results? In the course of the study we spoke with two
of the larger commercial users of Landsat data, the essence thereof is summarized below.
MDA Federal is a private company and one of the largest users of Landsat data. They report
that out of $30m annual revenues, over $10m are generated using Landsat data and that as
a result of the policy change, they have recruited an additional 125 employees.
Furthermore, whilst they used to have a business in correcting the data, this has been
replaced by additional processing in the PSB. In other words, the PSB has moved forward in
the value chain in a way that the industry approves of! It is also a great advantage for
Landsat data that it is easy for users to download, partly helped by the enhanced degree of
processing ensuring geo-location accuracy. This is an important point to return to because
it is insufficient to just make data available free, it must also be easy to access. If it is not, all
savings in data purchase go in to the time and effort needed to access the data.
GDA Corporation is another company to report on the benefits derived from Landsat’s
revised data policy. GDA Corp is a relatively young company, formed in 2002; it has about
10 employees. GDA offers a crop mapping service that is mainly used by federal and state
52
Encouraging Private Investment in Space Activities; Report to the US Congress, 1991.
53
USGS EROS data centre Annual report for Landsat sales 1987.
54
The users, uses and value of Landsat and Other Moderate-Resolution Satellite Imagery in the United States;
Miller et al. USGS 2011.
ABOUT GMES AND DATA : GEESE AND GOLDEN EGGS – Geoff Sawyer and Marc de Vries
39](https://image.slidesharecdn.com/opendatastudyfinalreport-130306143849-phpapp02/75/EARSC-Open-data-study-Final-Report-39-2048.jpg)


![several such bodies governed by public law.” (Art. 2(1) Directive
2003/98/EC)
Public sector "[E]xisting documents (holding content, whatever its medium and any
information (PSI) part of such content) held by PSBs of the EU Member States." (Art. 1(1)
j-o 2(3) Directive 2003/98/EC)
Public task Setting the scope of the public task (and its financing) is a political
decision taken at the national level (not the European level).
Nevertheless, to determine the public task, some thumb rules apply:
PSI is produced under the public task if:
a. the PSI is the result of the legal regime under which the PSB works.
Example: all constitutions assign the task of producing court
decisions to national courts; hence, their case law is produced under
the public task and falls under the PSI Directive.
b. the production, processing, or distribution of the PSI falls under the
core business and responsibility of the PSB. Example: the sole reason
for setting up the Dutch Chamber of Commerce was to maintain the
Dutch business registers; hence, those registers are produced under
the public task and fall under the PSI Directive.
c. there is a strong public interest involved in the production,
processing, or distribution of the PSI concerned, whereby society at
large benefits (i.e. the benefits do not accrue to just a small group of
people). Example: maintaining the quality of cadastral data is key as,
otherwise, there would be even higher risks involved in buying
property (i.e. the buyer might risk paying money to a person other
Study on the Economic Benefits of a Free and Open Data Policy for Sentinel Satellite Data
than the real property owner). Therefore, producing cadastral
information is done under the public task and falls under the PSI
Directive.
d. without the engagement of the government, the PSI would not be
produced because of market failure, i.e. the market would not be
able or willing to perform this task. Example: the private sector
cannot afford to build and launch the weather satellites required to
gather meteorological data. Therefore, national meteorological
services undertake these activities, which are regarded as falling
under the public task. Thus, the output falls under the PSI Directive.
Re-use Any use of PSI outside the public task including use by the PSBs
themselves (including the PSB that has produced the PSI under its
public task).
“Use by persons or legal entities of documents held by public sector
bodies, for commercial or non-commercial purposes other than the
initial purpose within the public task for which the documents were
produced. Exchange of documents between public sector bodies purely
in pursuit of their public tasks does not constitute re-use.” (Art. 2(4)
Directive 2003/98/EC)
Sentinels A system of five satellites being developed by the European Space
Agency, which will be used to provide EO data for GMES.
ABOUT GMES AND DATA : GEESE AND GOLDEN EGGS – Geoff Sawyer and Marc de Vries
55](https://image.slidesharecdn.com/opendatastudyfinalreport-130306143849-phpapp02/75/EARSC-Open-data-study-Final-Report-55-2048.jpg)


This document provides an overview of a study on the economic benefits of a free and open data policy for data from the Sentinel satellites under the GMES program. The study examines the theoretical framework and empirical evidence from other public sector information domains that making data freely available can generate greater economic returns than cost recovery models. The evidence suggests that free reuse of GMES satellite data has the potential to stimulate the European Earth observation services industry and help it become a global leader, generating new businesses, jobs, and tax revenues. The study concludes by recommending policymakers adopt policies that improve the commercial environment for the industry to grow and contribute to economic growth in Europe.


![[Webinar] Il telerilevamento da droni aerei: Le soluzioni Hexagon Geospatial ...](https://cdn.slidesharecdn.com/ss_thumbnails/pkm026-594-1-150128104853-conversion-gate01-thumbnail.jpg?width=600ounds&width=560&fit=bounds)
![[Webinar] Il telerilevamento da droni aerei: I sensori PANOPTES nelle ispezio...](https://cdn.slidesharecdn.com/ss_thumbnails/webinardronidargeniopanoptes021214-150128102053-conversion-gate02-thumbnail.jpg?width=600ounds&width=560&fit=bounds)
![[Webinar] Il telerilevamento da droni aerei: soluzioni Leica Geosystems e cas...](https://cdn.slidesharecdn.com/ss_thumbnails/webinardronileicageosystems12015mlmod-150128101516-conversion-gate02-thumbnail.jpg?width=600ounds&width=560&fit=bounds)
![[Webinar] Il telerilevamento da droni aerei: La normativa italiana ENAC e il ...](https://cdn.slidesharecdn.com/ss_thumbnails/webinardroniassorpaspresentazione27gennaio2015-150128100431-conversion-gate01-thumbnail.jpg?width=600ounds&width=560&fit=bounds)


