Download as PDF, PPTX


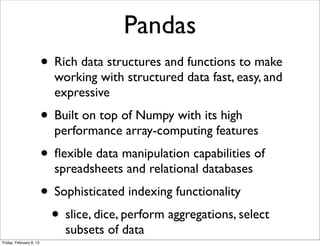


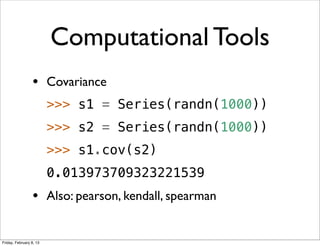
![Reindexing labels
>>> s
a -0.496848
b 0.607173
c -1.570596
>>> s.index
Index([a, b, c], dtype=object)
>>> s.reindex(['c','b','a'])
c -1.570596
b 0.607173
a -0.496848
Friday, February 8, 13](https://image.slidesharecdn.com/pandas-130208102614-phpapp01/85/Pandas-8-320.jpg)

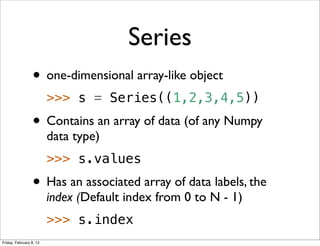
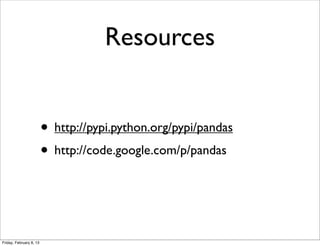
![DataFrame
>>> d = {'one': s*s, 'two': s+s}
>>> DataFrame(d)
one two
a 0.791886 -1.779760
b 1.214701 2.204269
c 4.784264 -4.374592
>>> df.index
Index([a, b, c], dtype=object)
>>> df.columns
Index([one, two], dtype=objec)
Friday, February 8, 13](https://image.slidesharecdn.com/pandas-130208102614-phpapp01/85/Pandas-11-320.jpg)
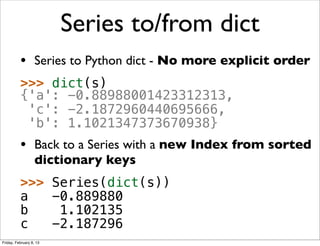
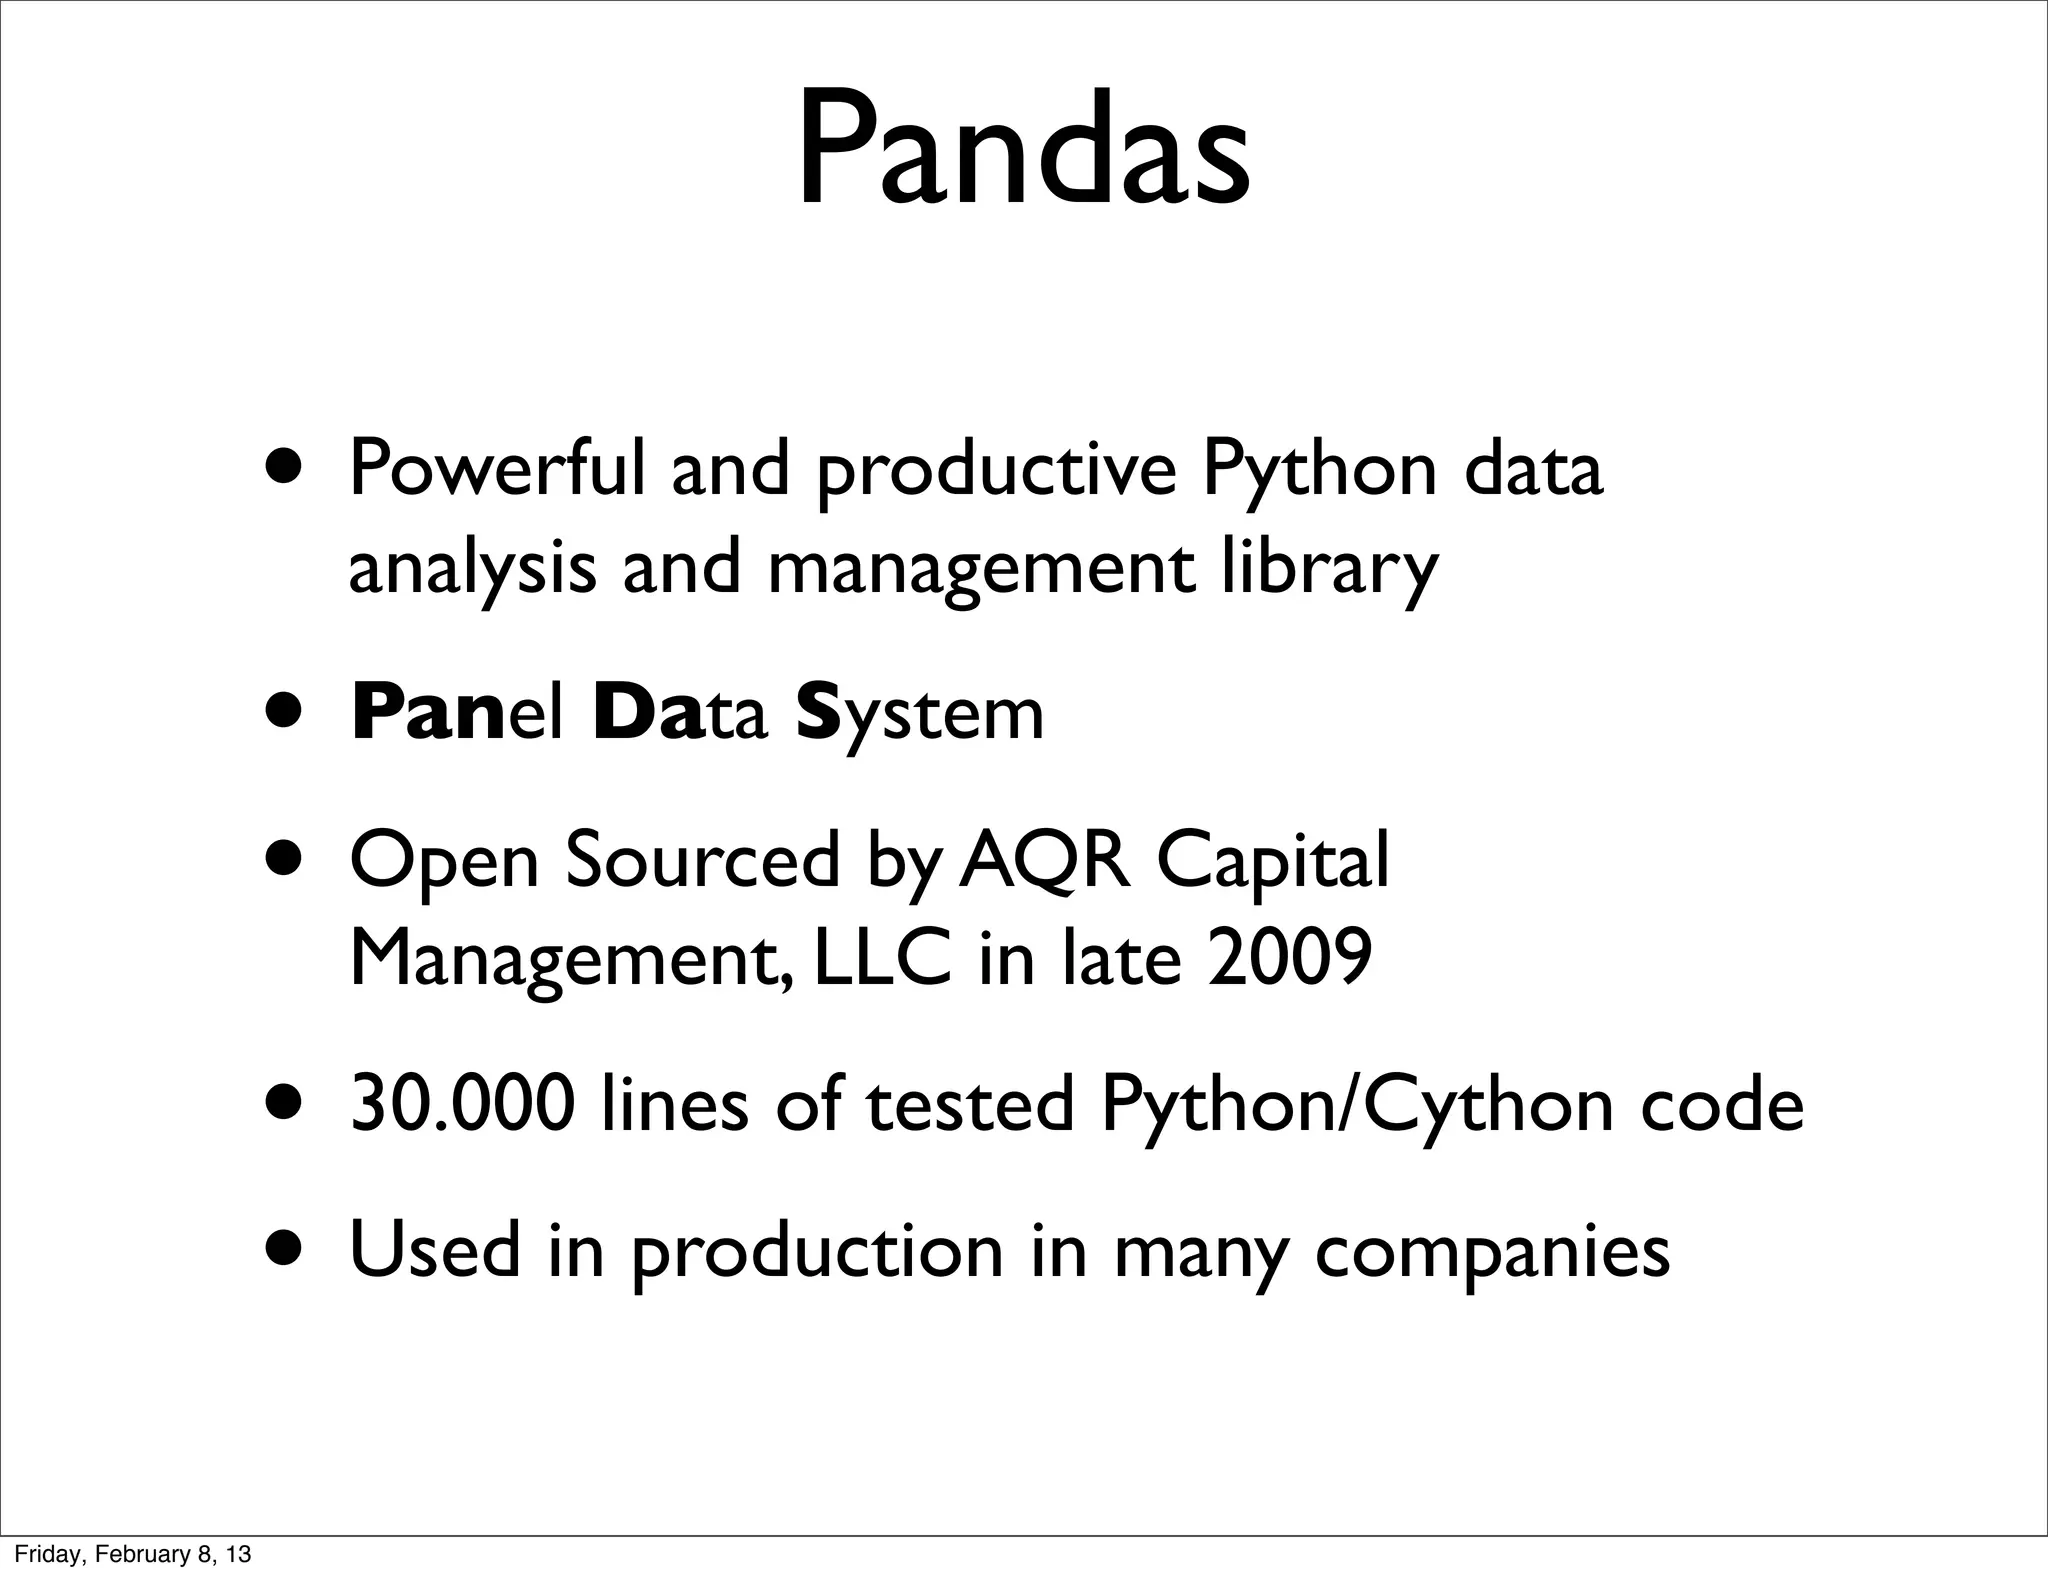
![Dataframe add column
• Add a third column
>>> df['three'] = s * 3
• It will share the existing index
>>> df
one two three
a 0.791886 -1.779760 -2.669640
b 1.214701 2.204269 3.306404
c 4.784264 -4.374592 -6.561888
Friday, February 8, 13](https://image.slidesharecdn.com/pandas-130208102614-phpapp01/85/Pandas-12-320.jpg)
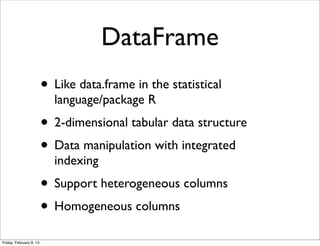
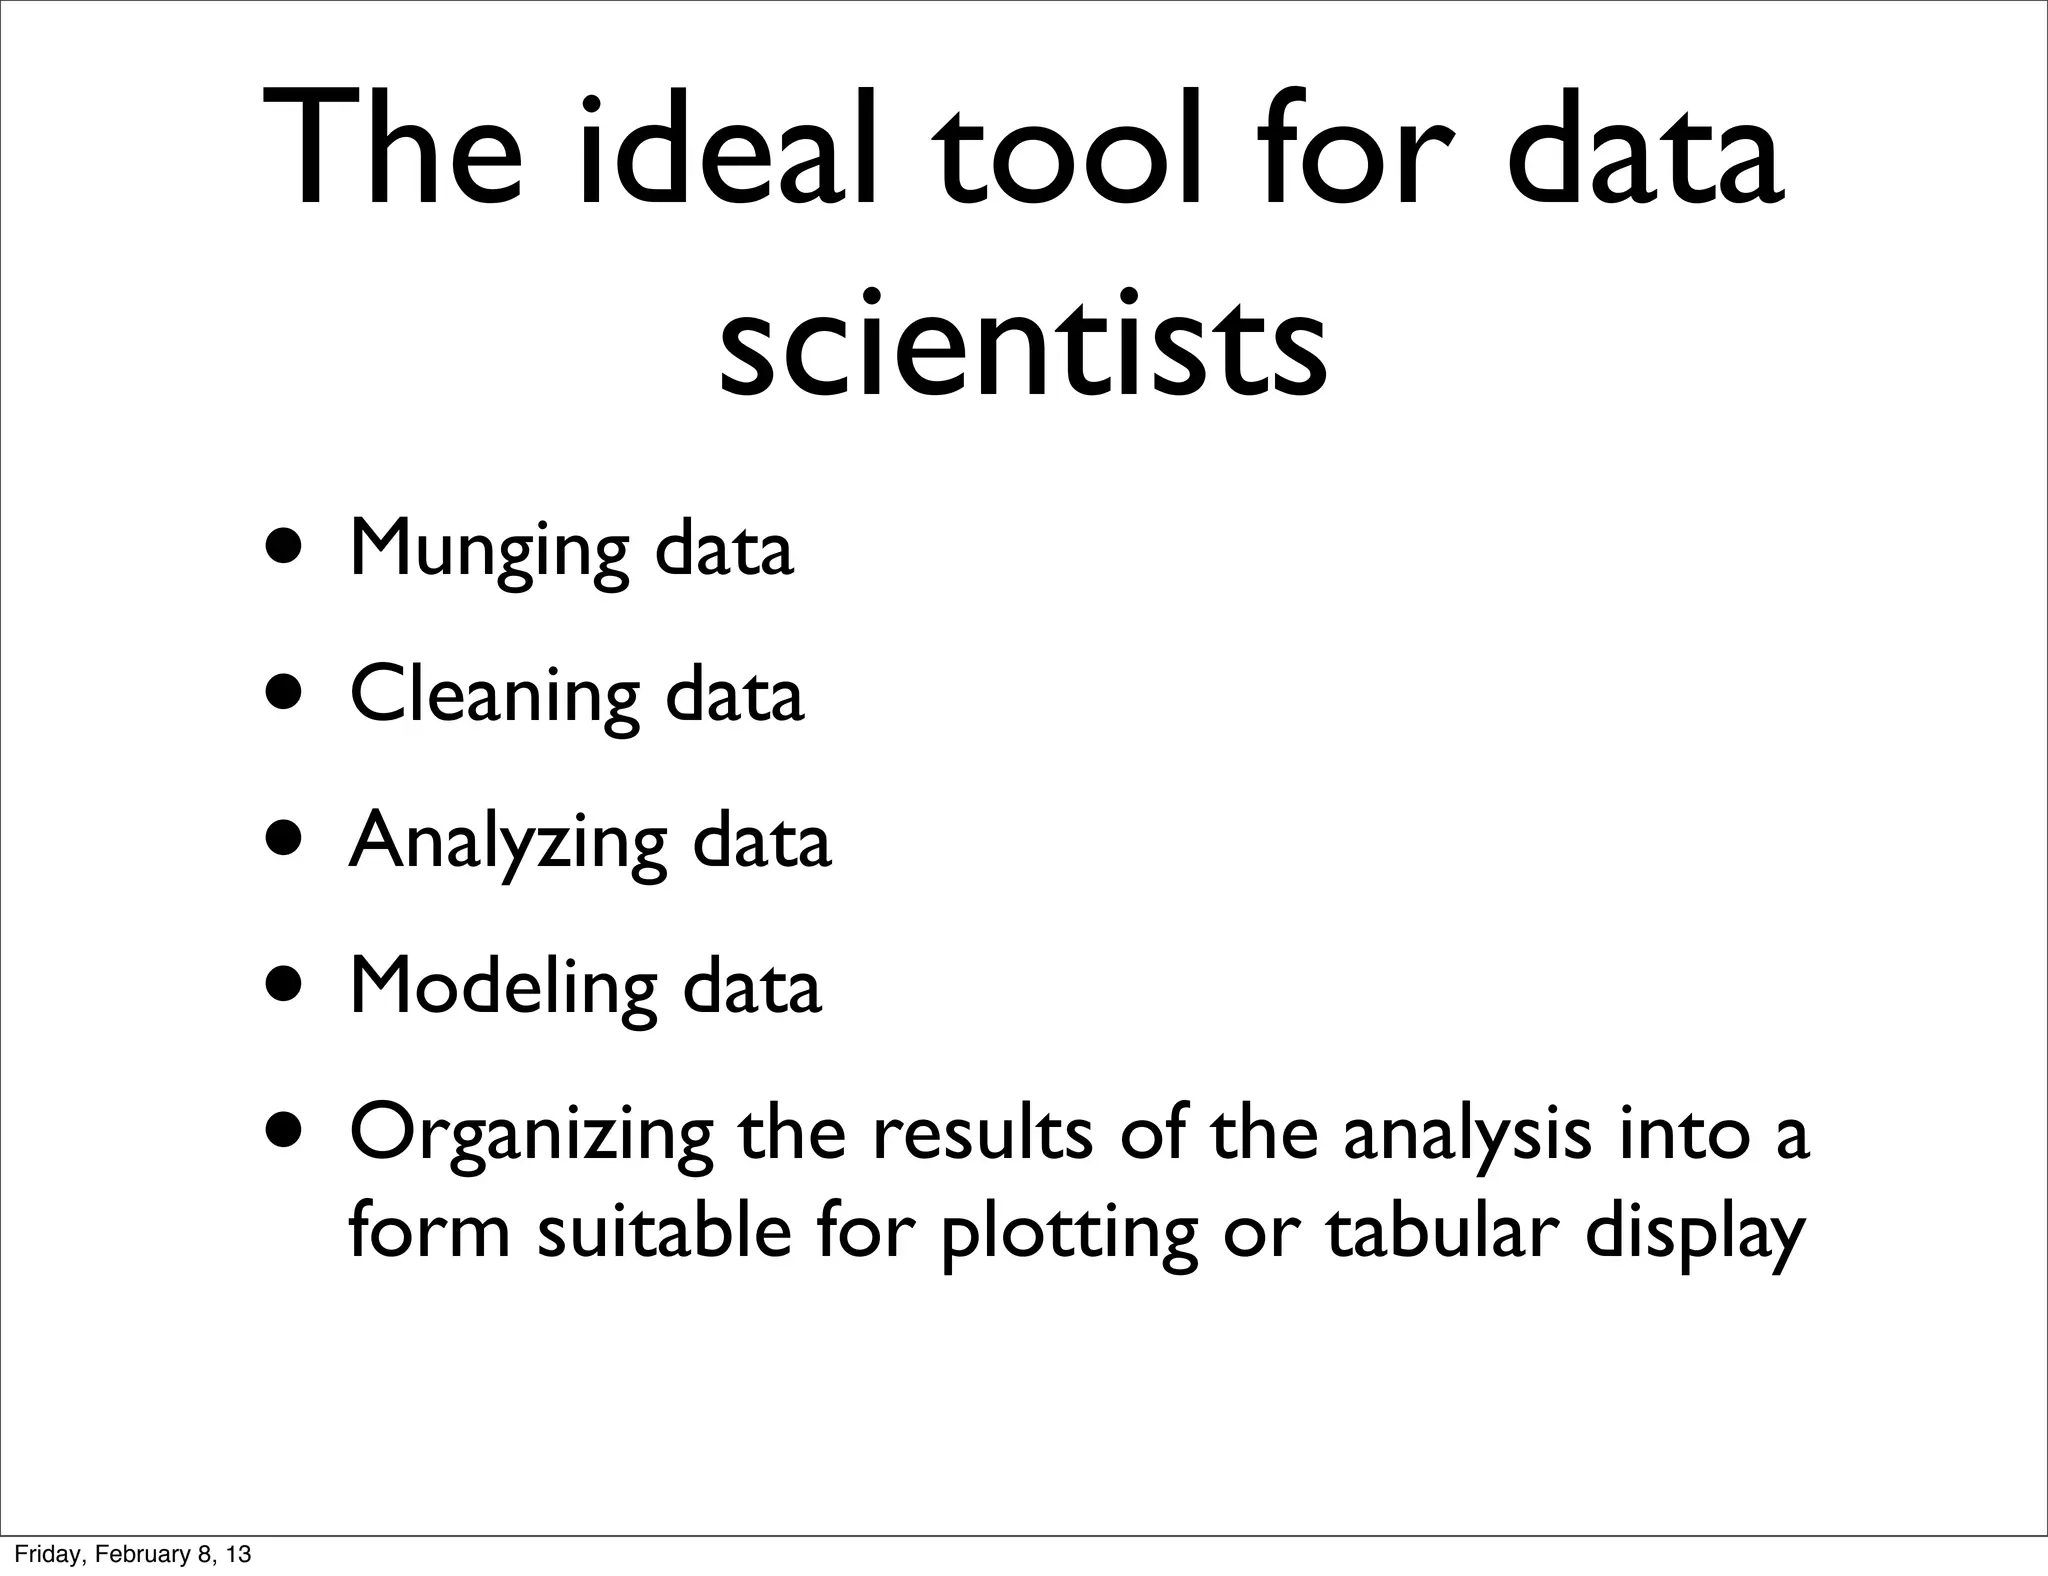
![Access to columns
• Access by attribute • Access by dict like
notation
>>> df.one >>> df['one']
one one
a 0.791886 a 0.791886
b 1.214701 b 1.214701
c 4.784264 c 4.784264
Friday, February 8, 13](https://image.slidesharecdn.com/pandas-130208102614-phpapp01/85/Pandas-13-320.jpg)
![Reindexing
>>> df.reindex(['c','b','a'])
>>> df
one two three
c 4.784264 -4.374592 -6.561888
b 1.214701 2.204269 3.306404
a 0.791886 -1.779760 -2.669640
Friday, February 8, 13](https://image.slidesharecdn.com/pandas-130208102614-phpapp01/85/Pandas-14-320.jpg)
![Drop entries from an axis
>>> df.drop('c')
b 1.214701 2.204269 3.306404
a 0.791886 -1.779760 -2.669640
>>> df.drop(['b,'a'])
one two three
c 4.784264 -4.374592 -6.561888
Friday, February 8, 13](https://image.slidesharecdn.com/pandas-130208102614-phpapp01/85/Pandas-15-320.jpg)


![Reindexing labels
>>> s
a -0.496848
b 0.607173
c -1.570596
>>> s.index
Index([a, b, c], dtype=object)
>>> s.reindex(['c','b','a'])
c -1.570596
b 0.607173
a -0.496848
Friday, February 8, 13](https://image.slidesharecdn.com/pandas-130208102614-phpapp01/75/Pandas-8-2048.jpg)

![DataFrame
>>> d = {'one': s*s, 'two': s+s}
>>> DataFrame(d)
one two
a 0.791886 -1.779760
b 1.214701 2.204269
c 4.784264 -4.374592
>>> df.index
Index([a, b, c], dtype=object)
>>> df.columns
Index([one, two], dtype=objec)
Friday, February 8, 13](https://image.slidesharecdn.com/pandas-130208102614-phpapp01/75/Pandas-11-2048.jpg)
![Dataframe add column
• Add a third column
>>> df['three'] = s * 3
• It will share the existing index
>>> df
one two three
a 0.791886 -1.779760 -2.669640
b 1.214701 2.204269 3.306404
c 4.784264 -4.374592 -6.561888
Friday, February 8, 13](https://image.slidesharecdn.com/pandas-130208102614-phpapp01/75/Pandas-12-2048.jpg)
![Access to columns
• Access by attribute • Access by dict like
notation
>>> df.one >>> df['one']
one one
a 0.791886 a 0.791886
b 1.214701 b 1.214701
c 4.784264 c 4.784264
Friday, February 8, 13](https://image.slidesharecdn.com/pandas-130208102614-phpapp01/75/Pandas-13-2048.jpg)
![Reindexing
>>> df.reindex(['c','b','a'])
>>> df
one two three
c 4.784264 -4.374592 -6.561888
b 1.214701 2.204269 3.306404
a 0.791886 -1.779760 -2.669640
Friday, February 8, 13](https://image.slidesharecdn.com/pandas-130208102614-phpapp01/75/Pandas-14-2048.jpg)
![Drop entries from an axis
>>> df.drop('c')
b 1.214701 2.204269 3.306404
a 0.791886 -1.779760 -2.669640
>>> df.drop(['b,'a'])
one two three
c 4.784264 -4.374592 -6.561888
Friday, February 8, 13](https://image.slidesharecdn.com/pandas-130208102614-phpapp01/75/Pandas-15-2048.jpg)

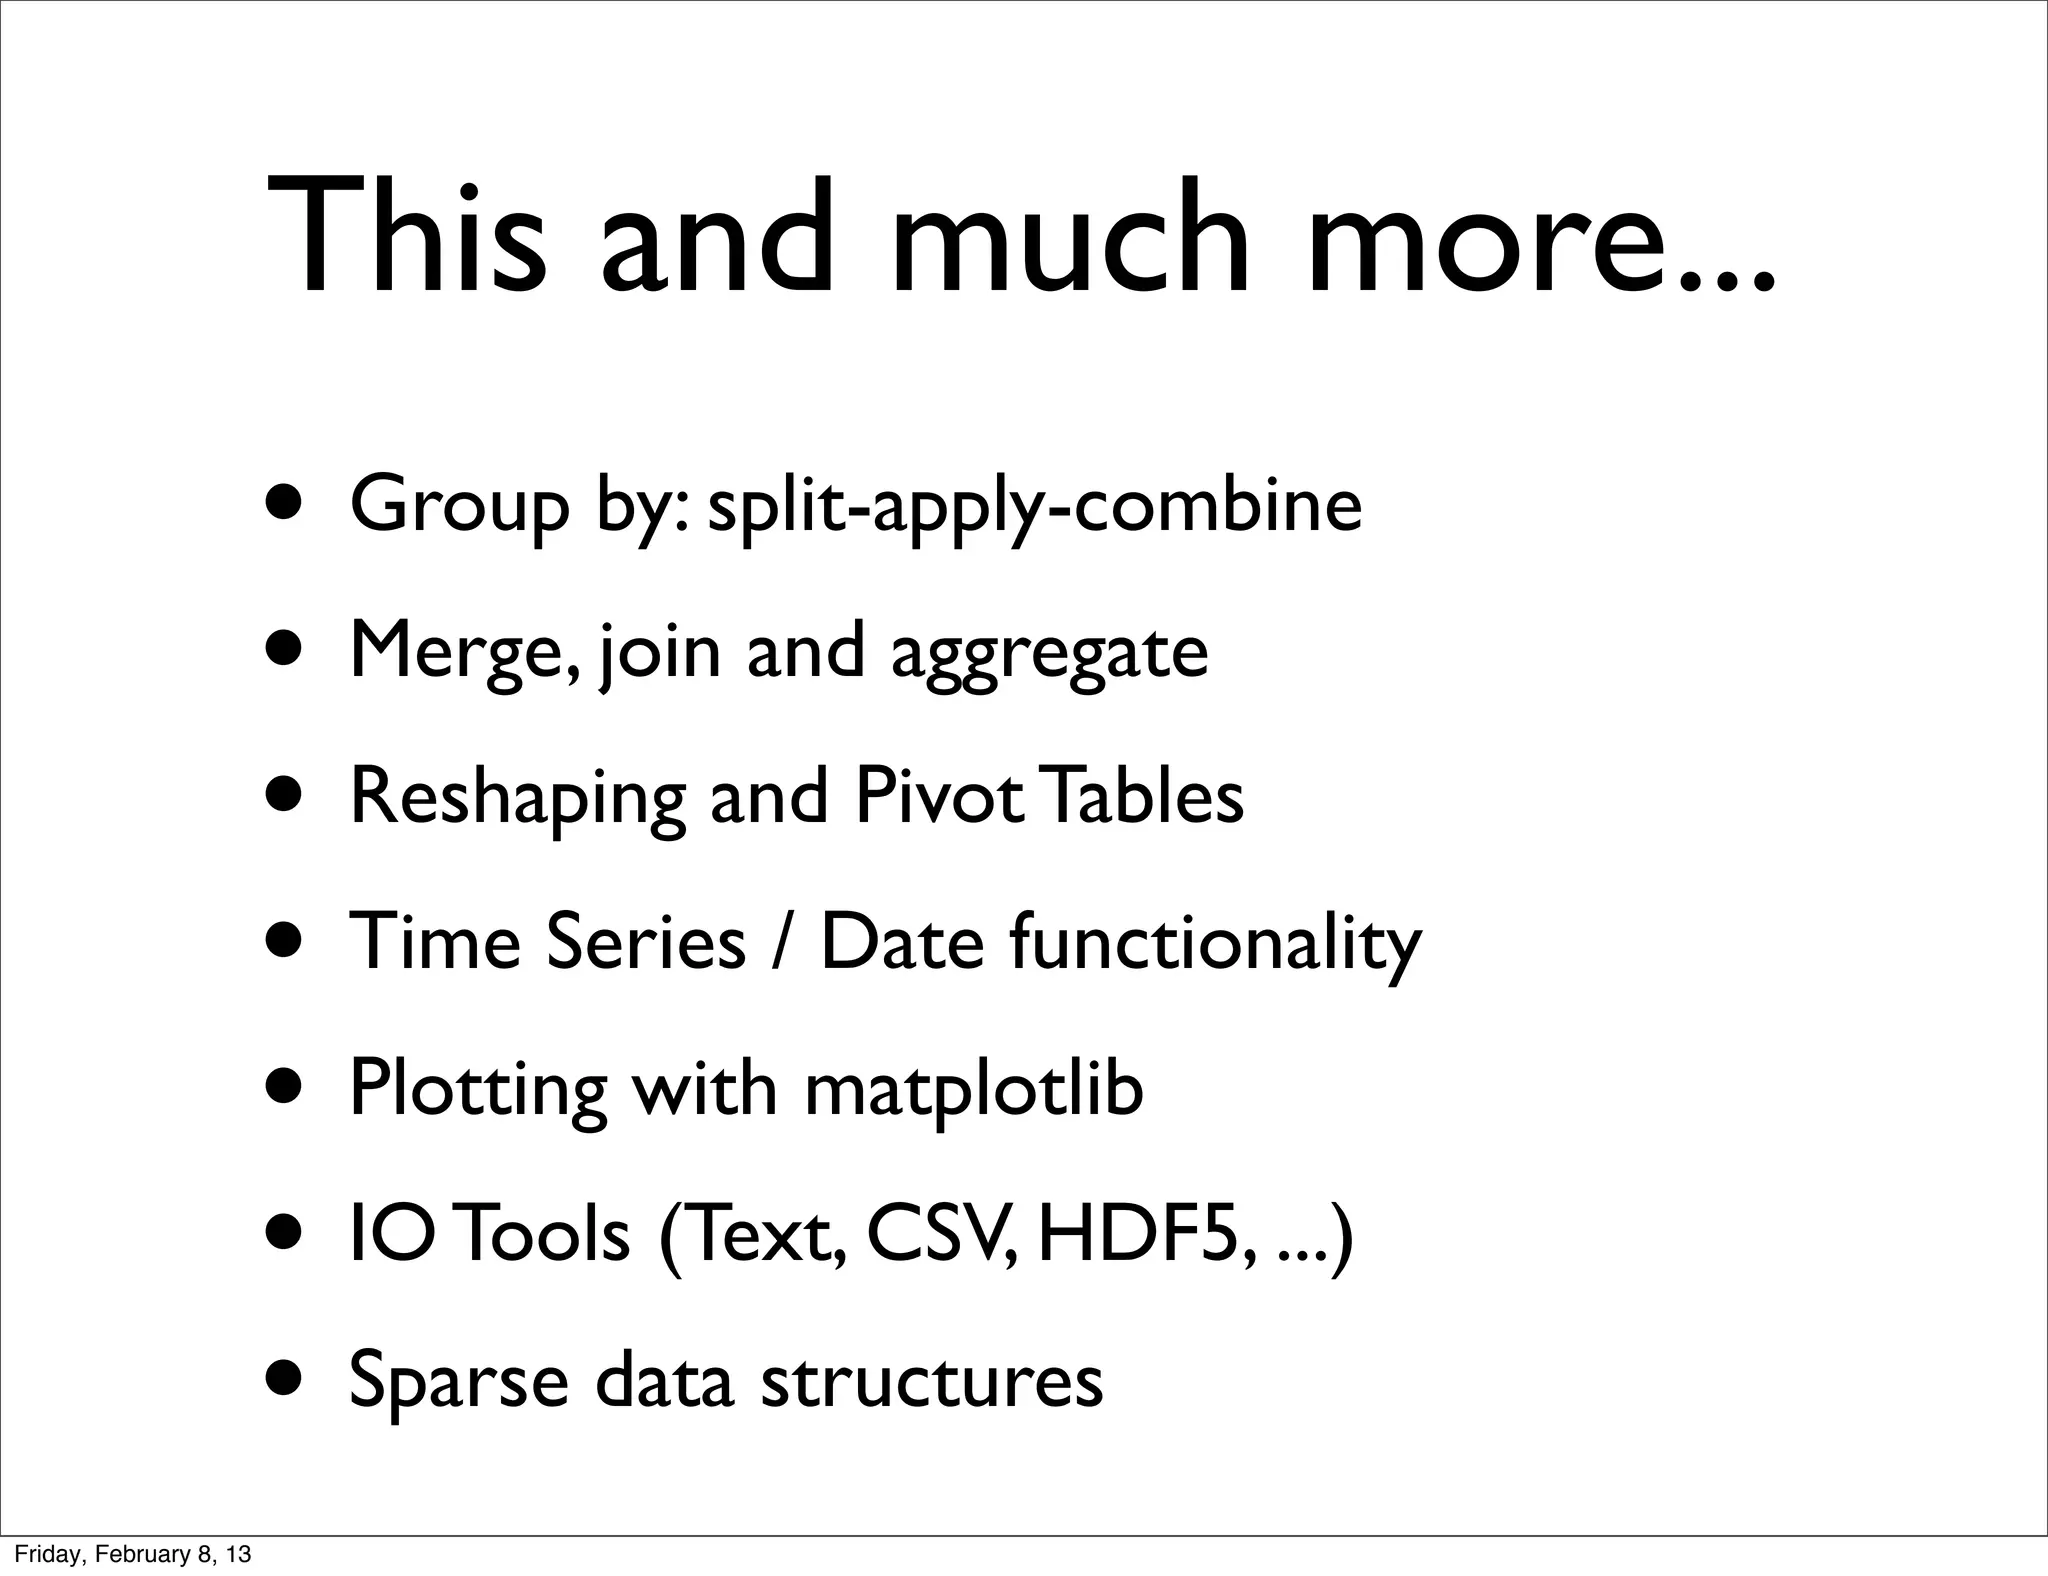

Pandas is a powerful Python library for data analysis and manipulation. It provides rich data structures for working with structured and time series data easily. Pandas allows for data cleaning, analysis, modeling, and visualization. It builds on NumPy and provides data frames for working with tabular data similarly to R's data frames, as well as time series functionality and tools for plotting, merging, grouping, and handling missing data.


![Introduction to Pandas and Time Series Analysis [PyCon DE]](https://cdn.slidesharecdn.com/ss_thumbnails/introductiontopandasandtimeseriesanalysispyconde-170617163724-thumbnail.jpg?width=600ounds&width=560&fit=bounds)


