SOME BASIC CONCEPTS
Factorialdesign:
To evaluate the combined effect of two or more factors when they are used
simultaneously.
= K factors, Z levels
3factors, 2levels
= 2factors, 3 levels
Factorial design is divided into two types:
i. Full factorial design (FD)
ii. Fractional factorial design(FFD)
3
4.
Contd…
Full factorial design(FD):
Itconsists of all possible factor combinations in an experiment and factors vary
simultaneously rather than one factor at given time.
Number of runs (N)=
Where, Z= number of levels,
= number of factors
E.g.- 3 factors, 2 levels each,
N = = 8 runs.
4
5.
Contd…
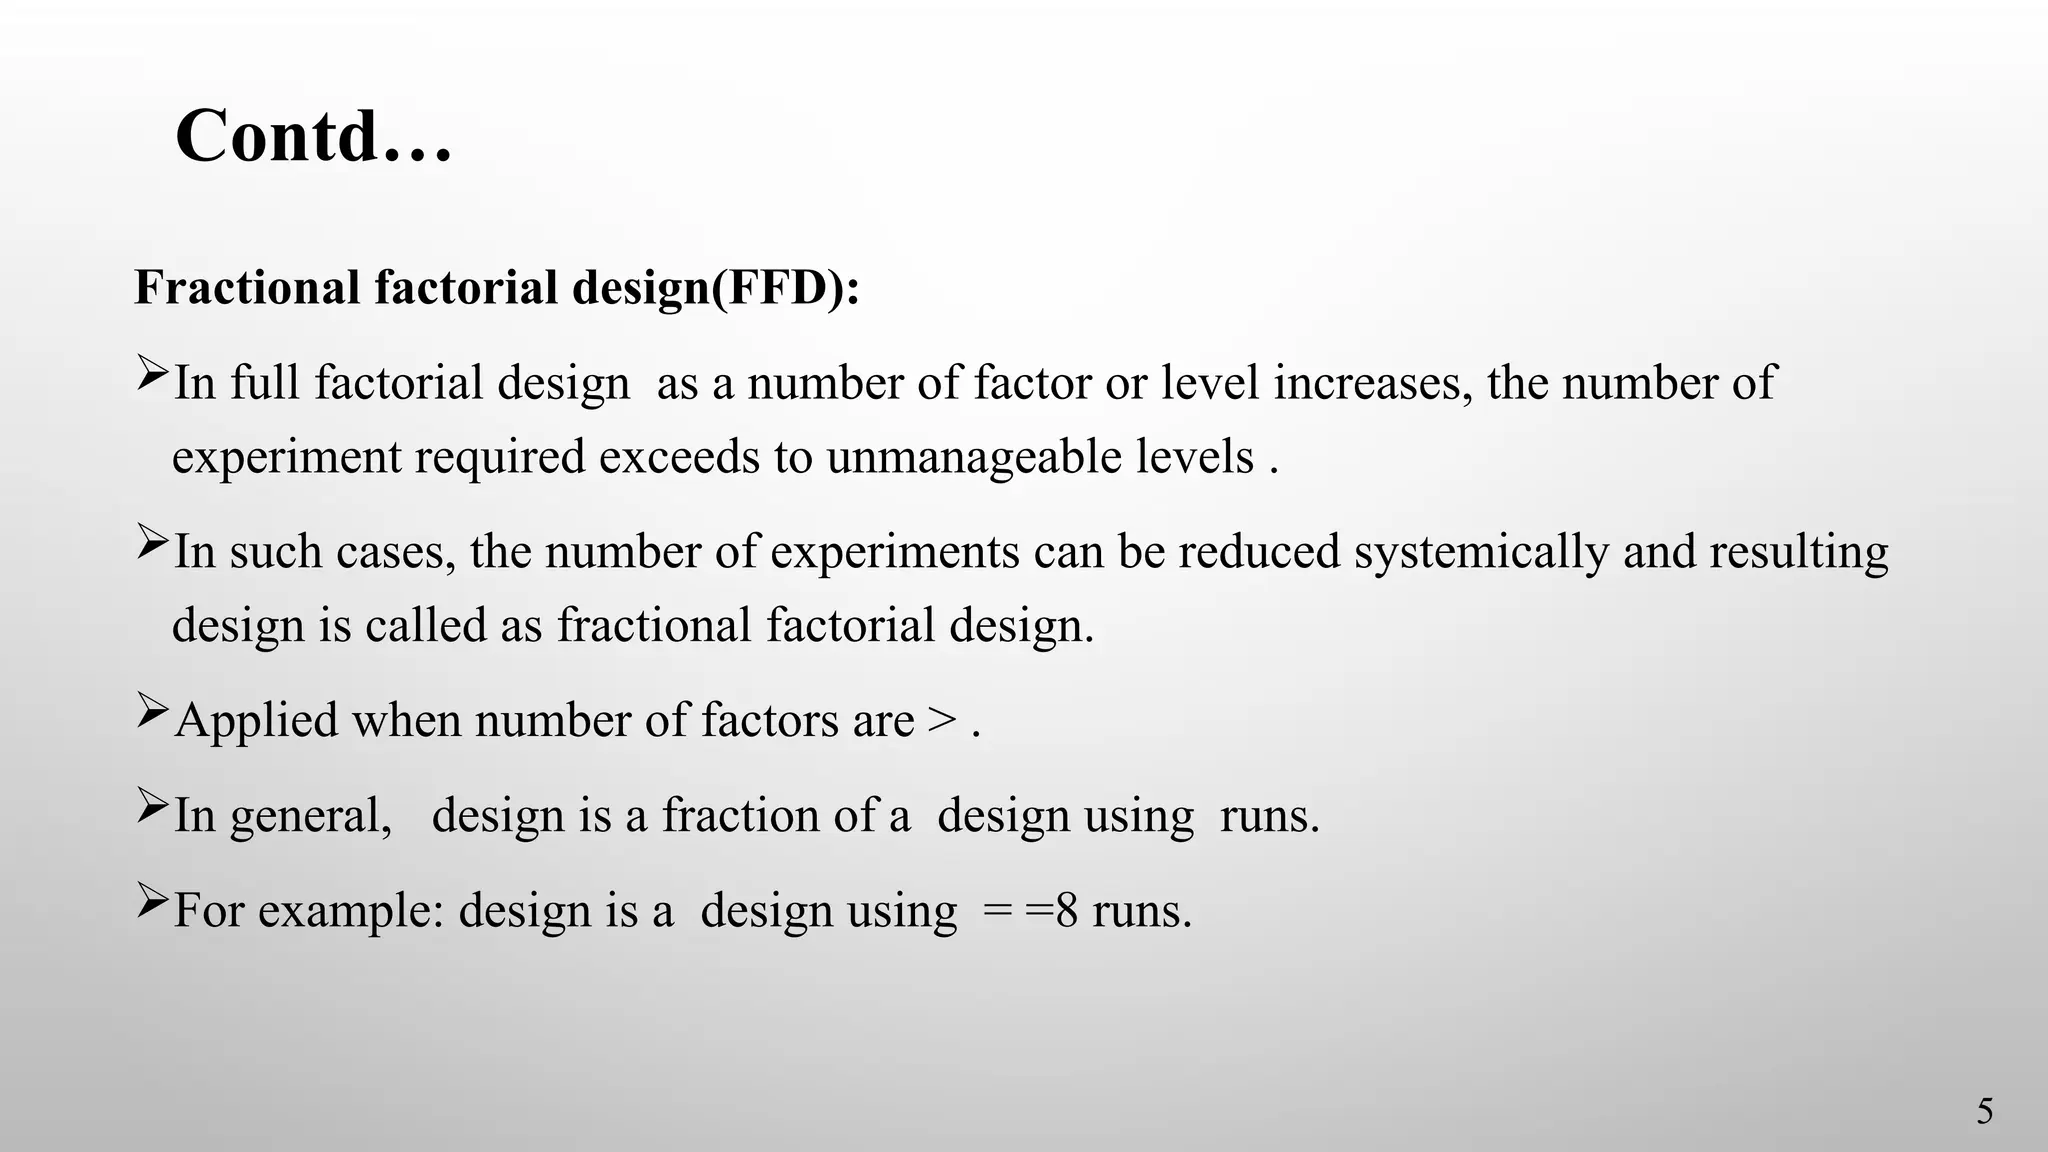
Fractional factorial design(FFD):
Infull factorial design as a number of factor or level increases, the number of
experiment required exceeds to unmanageable levels .
In such cases, the number of experiments can be reduced systemically and resulting
design is called as fractional factorial design.
Applied when number of factors are > .
In general, design is a fraction of a design using runs.
For example: design is a design using = =8 runs.
5
6.
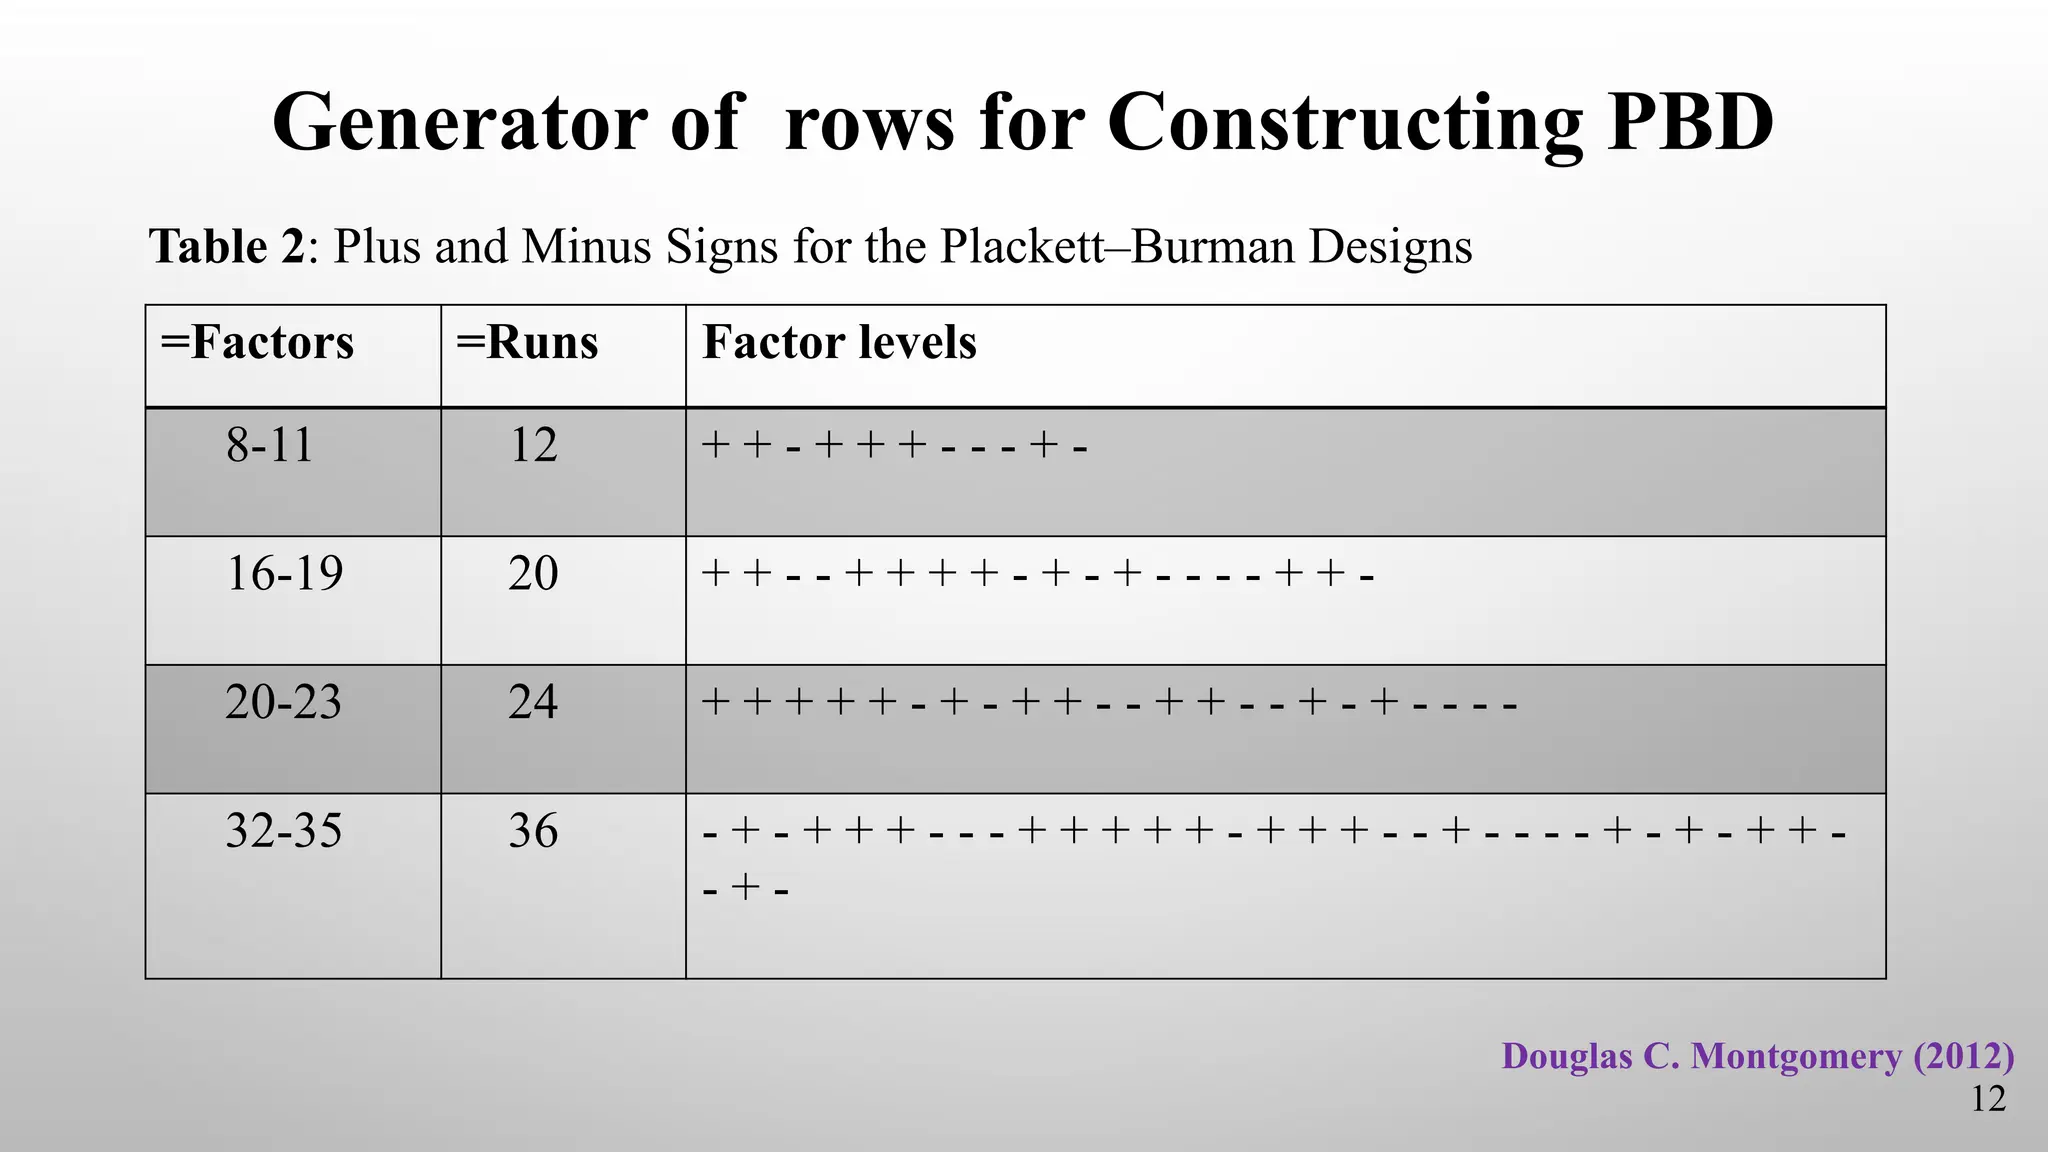
PLACKETT BURMAN DESIGN
Ina classic 1946 published research paper in the journal of Biometrika, the Plackett
and Burman showed how to construct 2-level orthogonal designs when the number
of runs ‘N’ is a multiple of (4,8,12,16,20,24, and so on).
If the run size is a power of 2(for example,8,16,32, ...), these designs are identical
to the fractional factorial designs.
As per the literature, this is called as popular screening design.
These designs are very efficient screening designs when only the main effects are
of interest to evaluate in complex way.
Johannes and Arthur()
6
7.
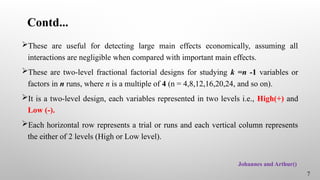
Contd...
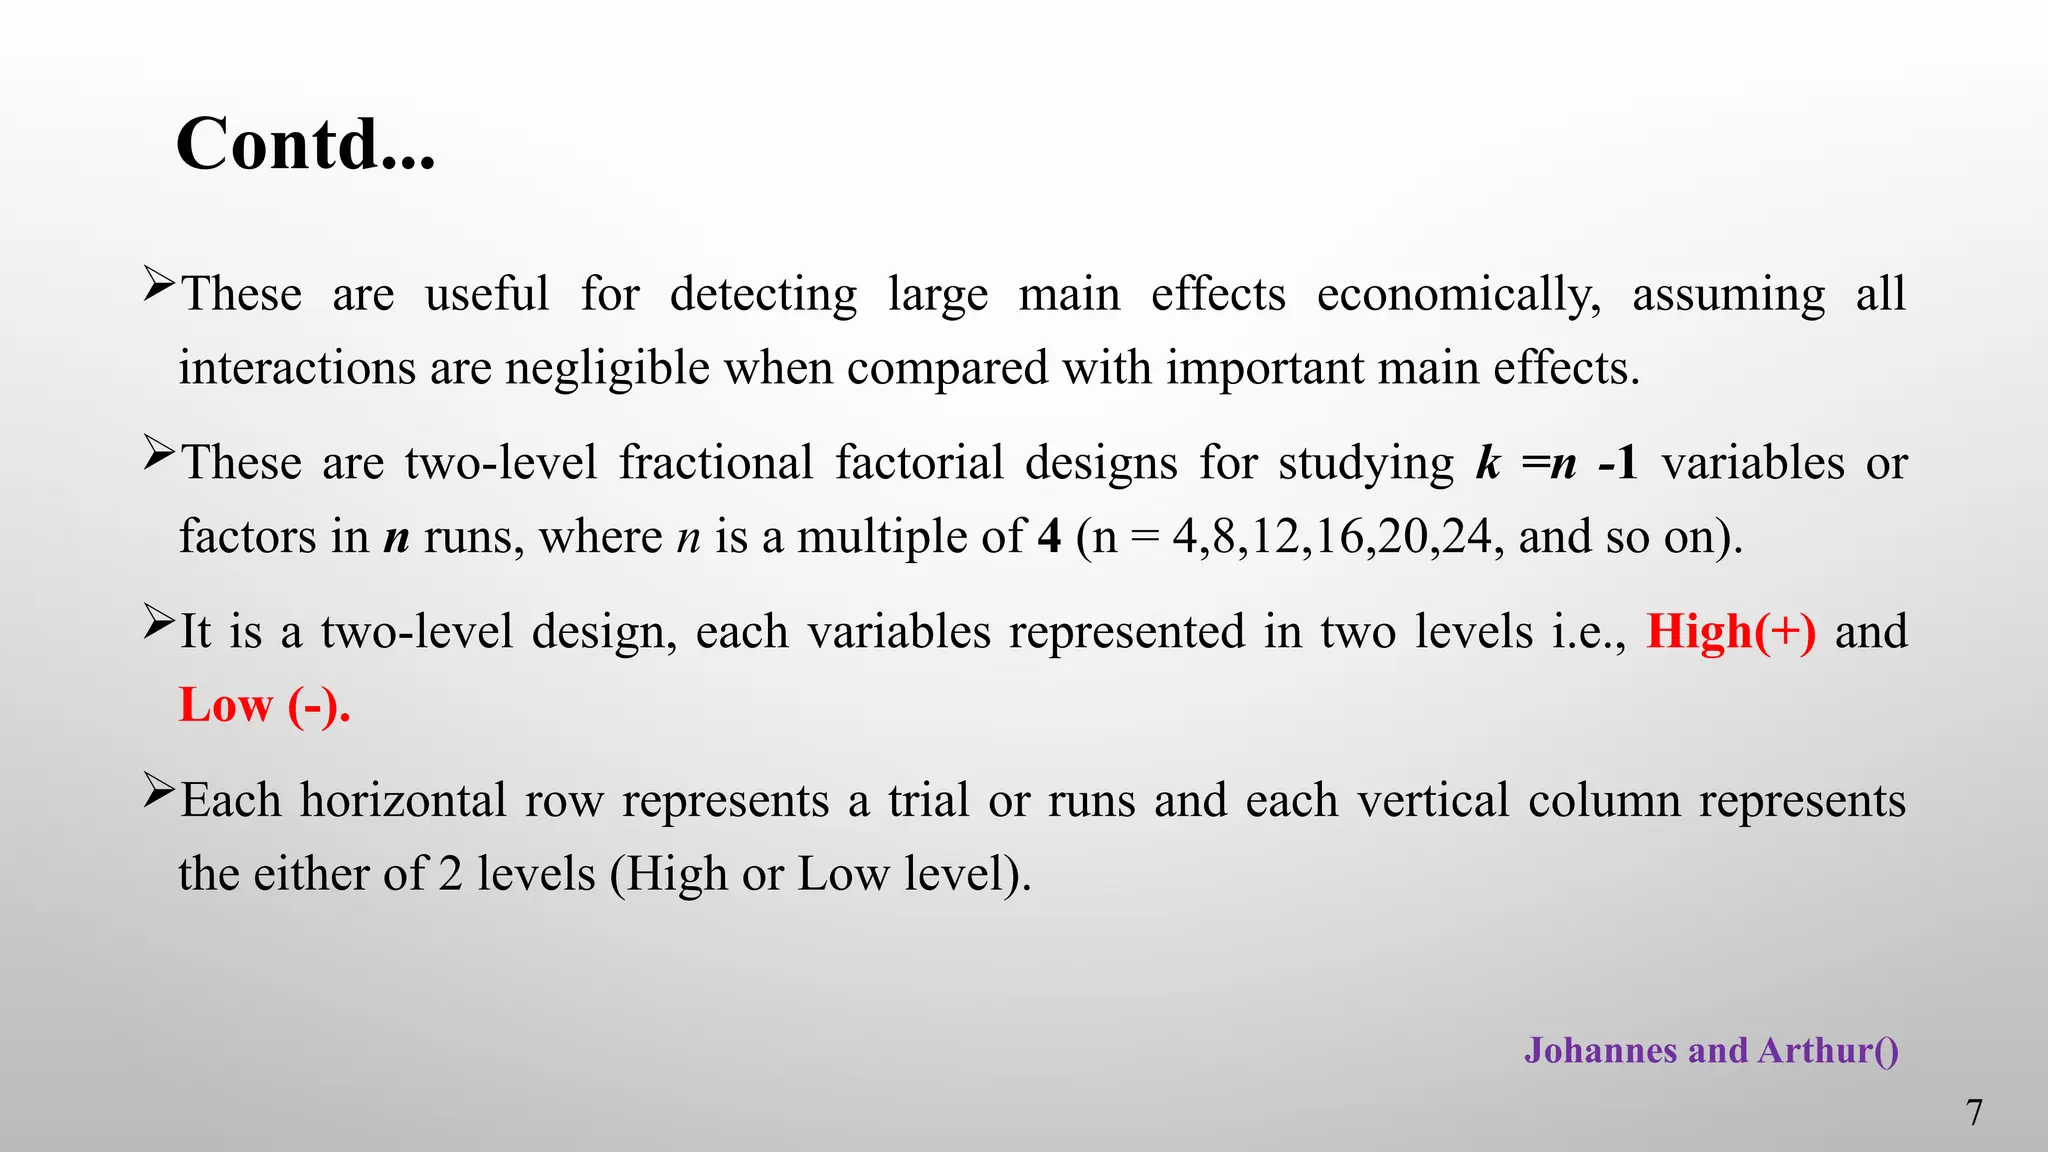
These are usefulfor detecting large main effects economically, assuming all
interactions are negligible when compared with important main effects.
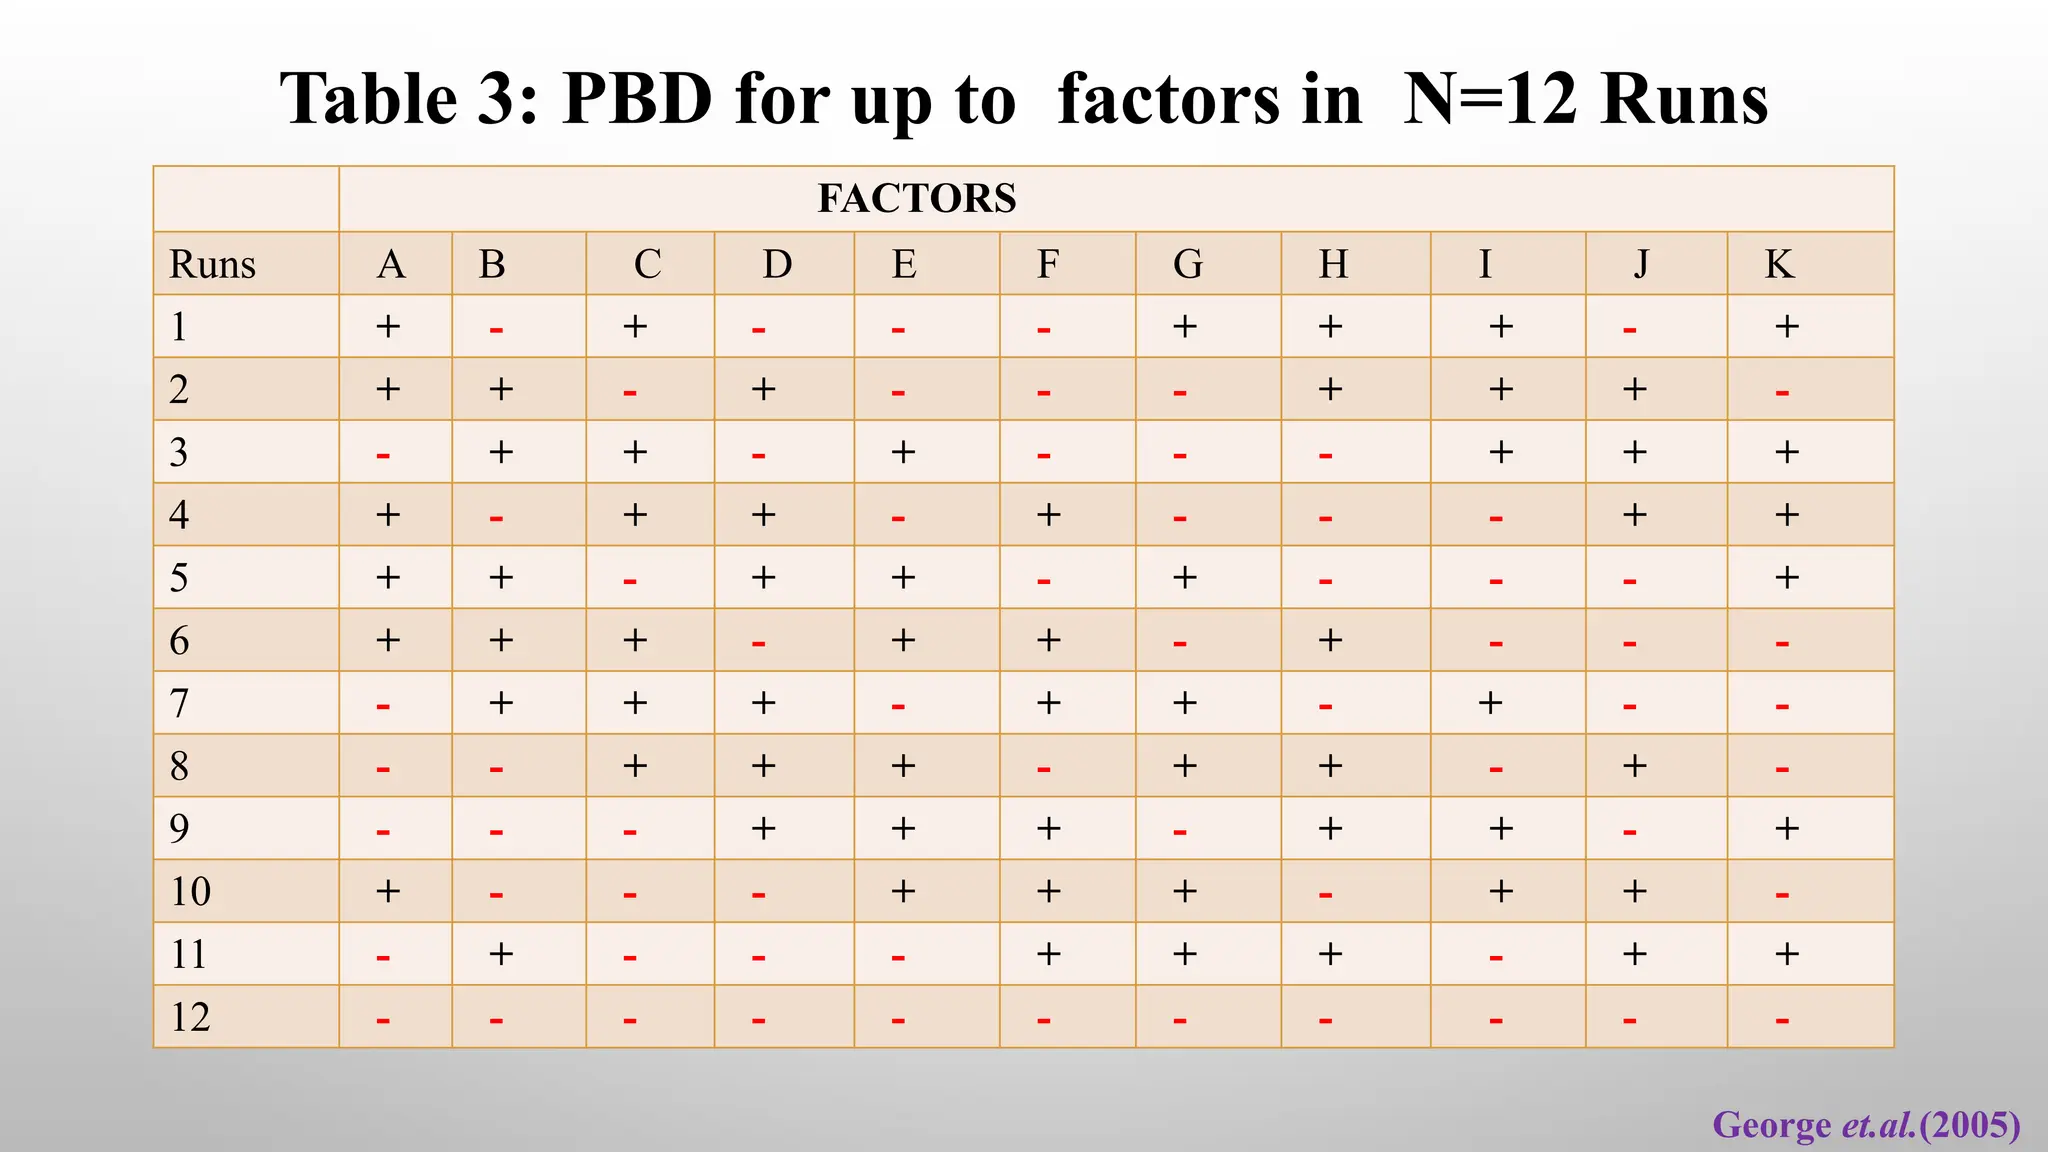
These are two-level fractional factorial designs for studying k =n -1 variables or
factors in n runs, where n is a multiple of 4 (n = 4,8,12,16,20,24, and so on).
It is a two-level design, each variables represented in two levels i.e., High(+) and
Low (-).
Each horizontal row represents a trial or runs and each vertical column represents
the either of 2 levels (High or Low level).
7
Johannes and Arthur()
8.
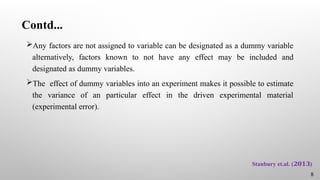
Contd...
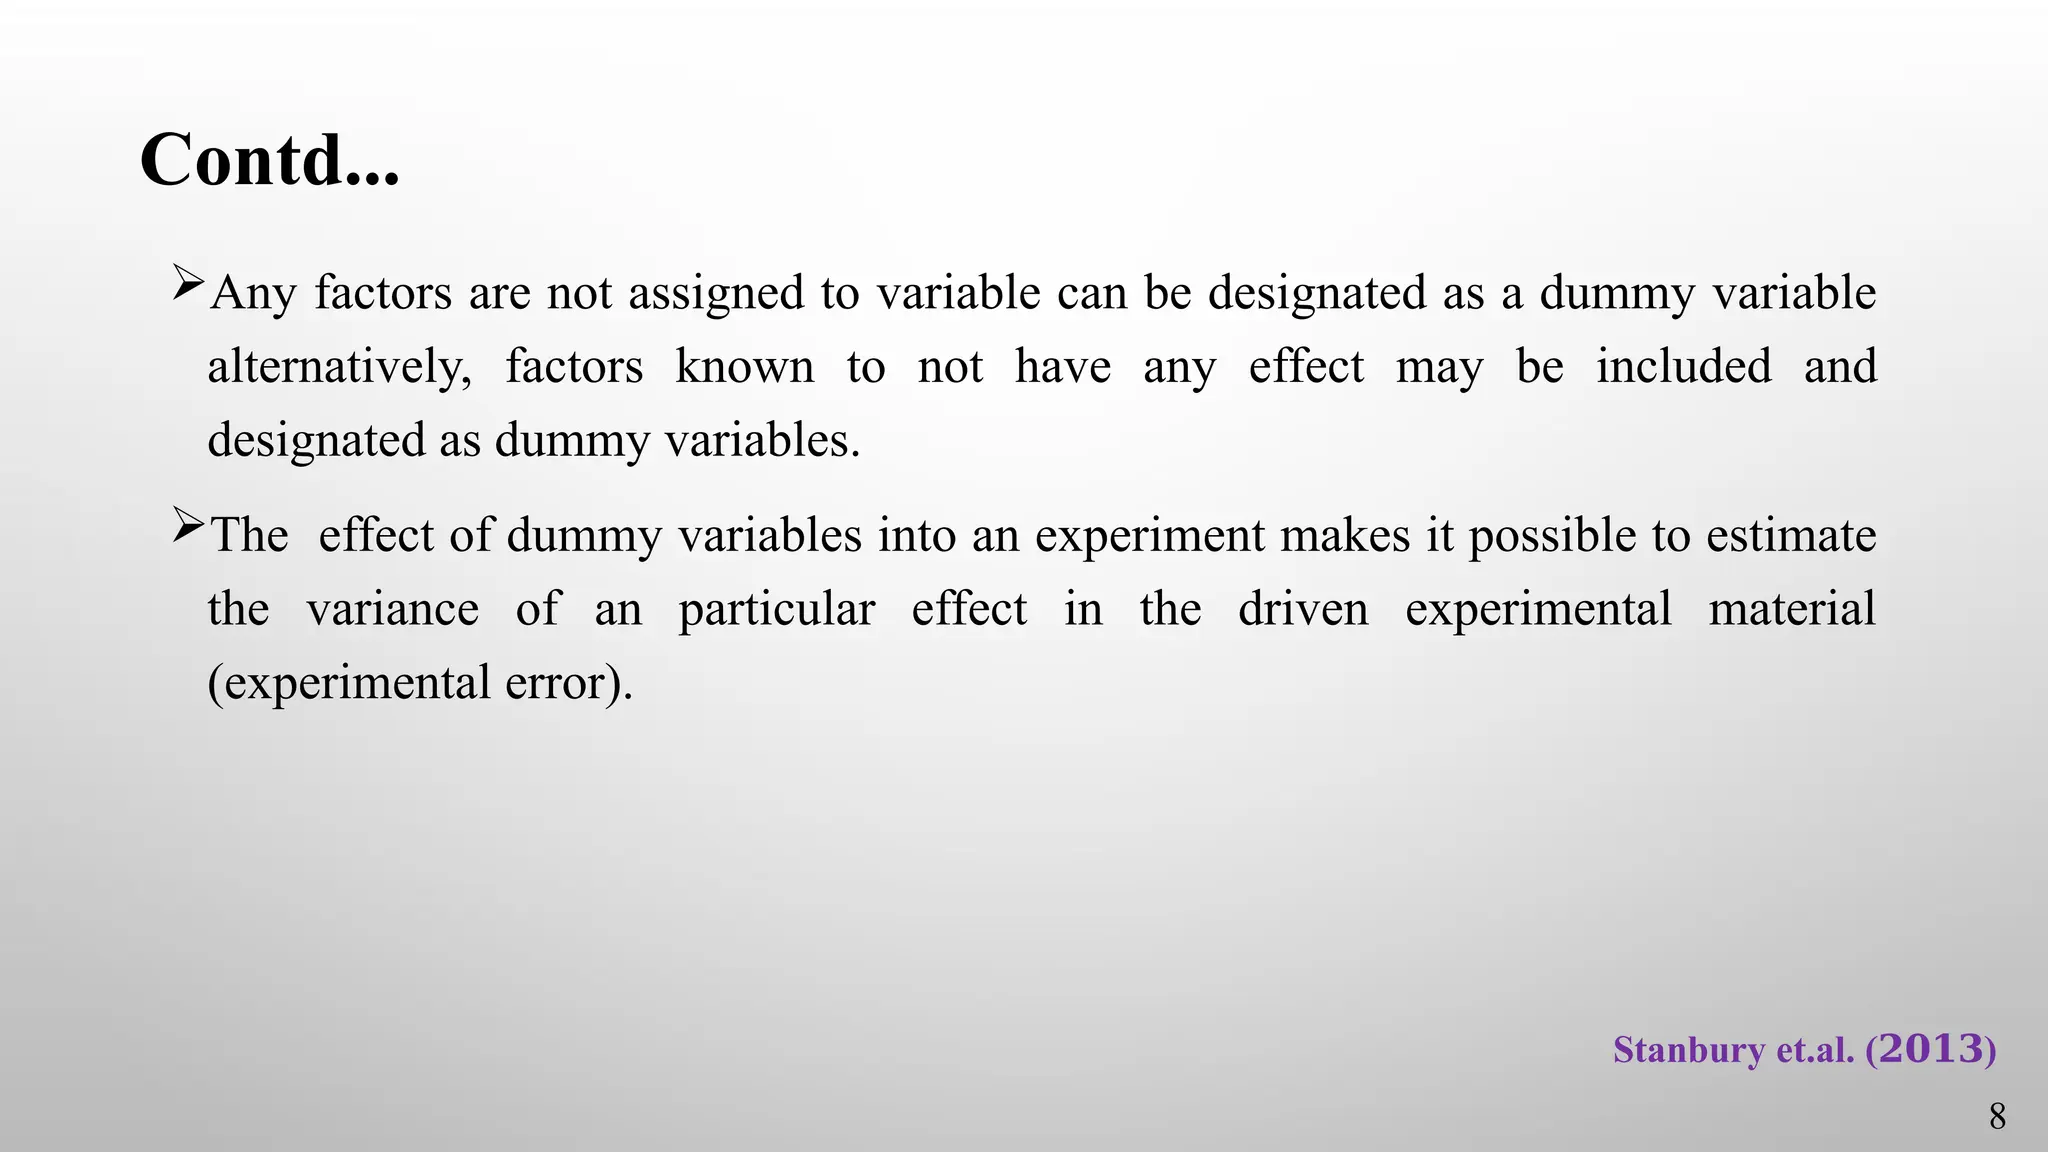
Any factors arenot assigned to variable can be designated as a dummy variable
alternatively, factors known to not have any effect may be included and
designated as dummy variables.
The effect of dummy variables into an experiment makes it possible to estimate
the variance of an particular effect in the driven experimental material
(experimental error).
8
Stanbury et.al. ( )
𝟐𝟎𝟏𝟑
9.
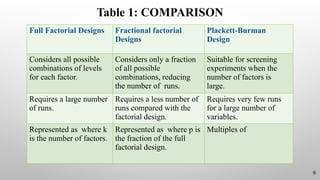
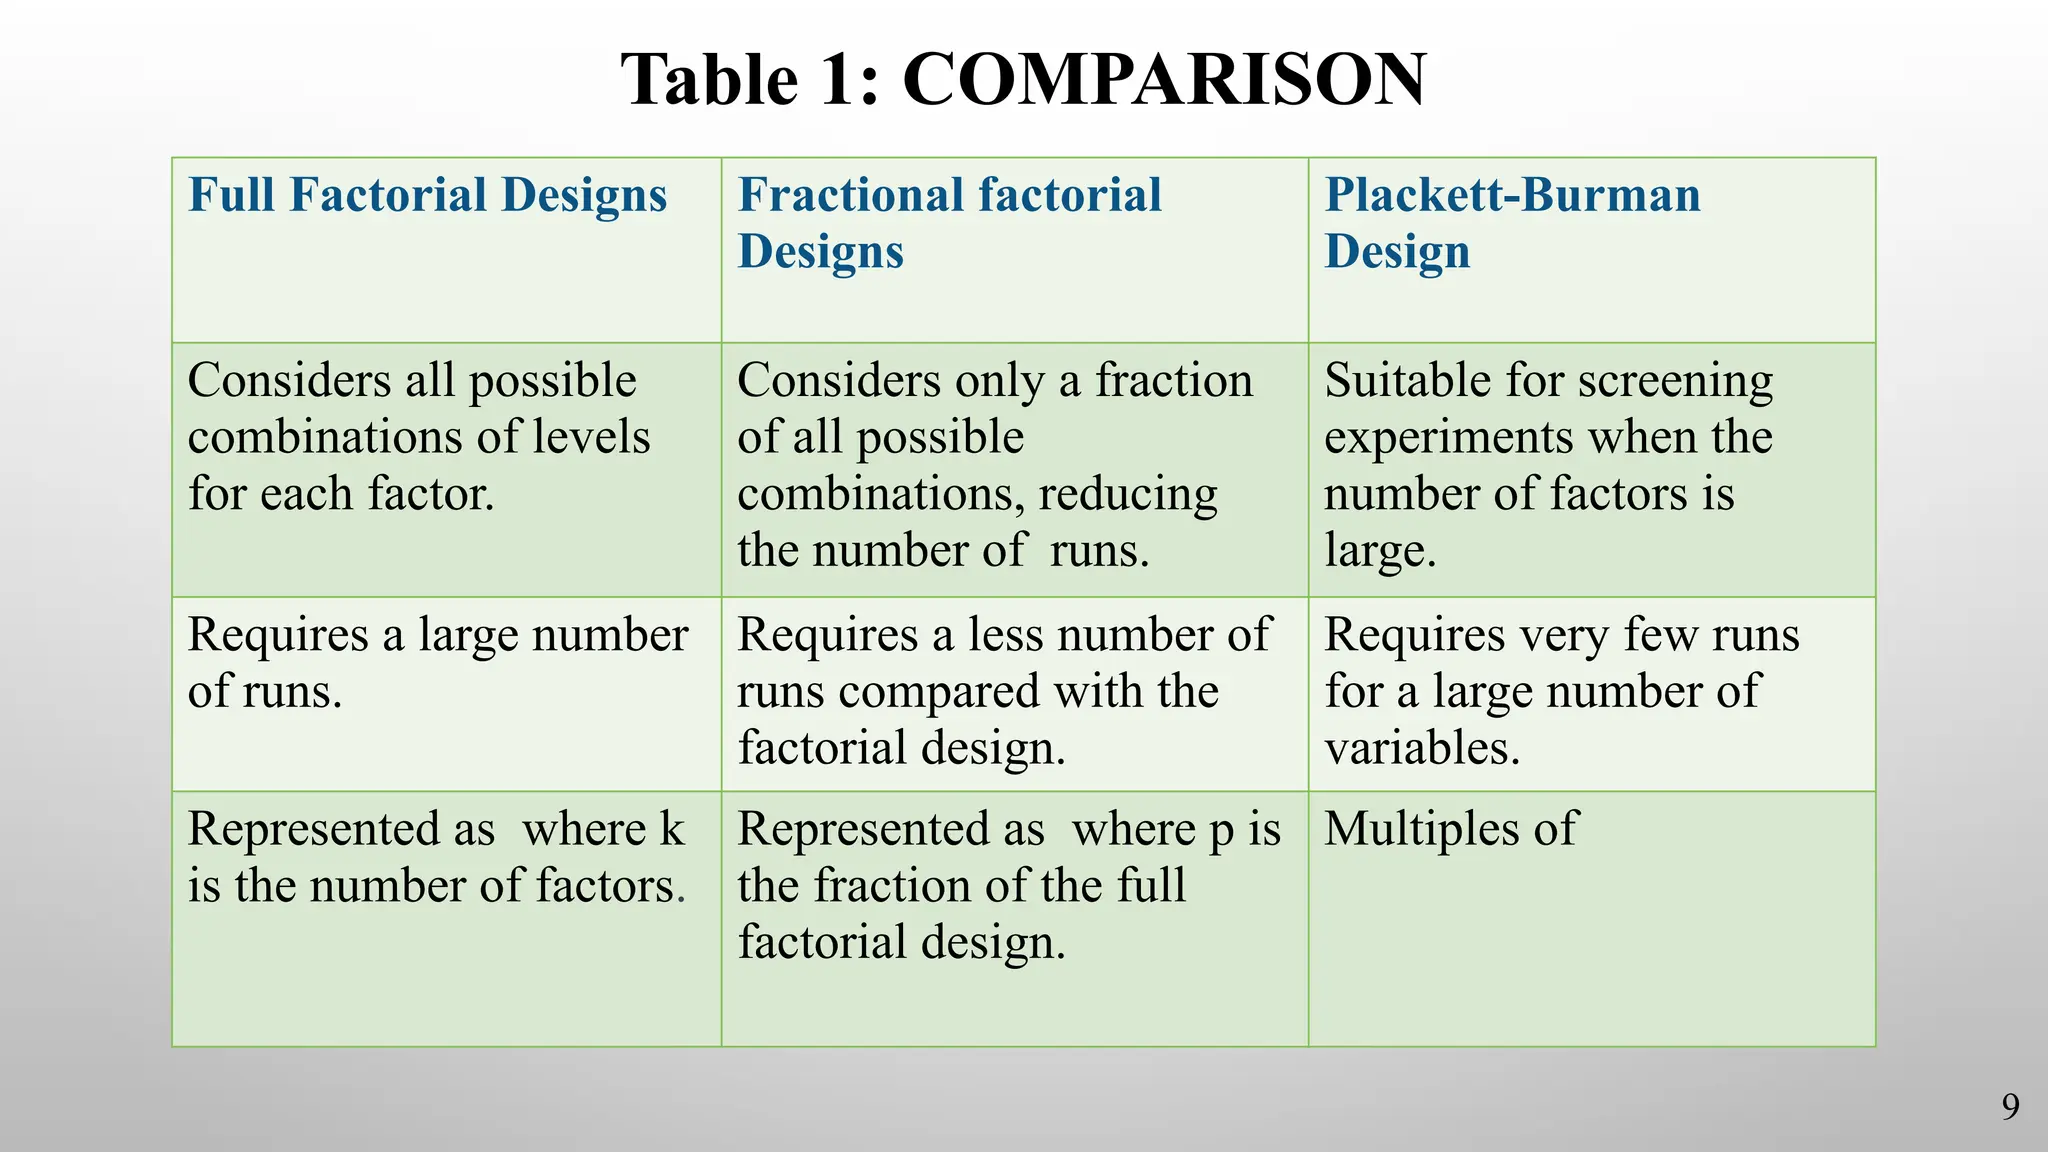
Table 1: COMPARISON
FullFactorial Designs Fractional factorial
Designs
Plackett-Burman
Design
Considers all possible
combinations of levels
for each factor.
Considers only a fraction
of all possible
combinations, reducing
the number of runs.
Suitable for screening
experiments when the
number of factors is
large.
Requires a large number
of runs.
Requires a less number of
runs compared with the
factorial design.
Requires very few runs
for a large number of
variables.
Represented as where k
is the number of factors.
Represented as where p is
the fraction of the full
factorial design.
Multiples of
9
10.
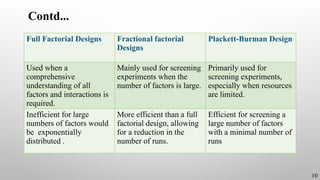
Contd...
Full Factorial DesignsFractional factorial
Designs
Plackett-Burman Design
Used when a
comprehensive
understanding of all
factors and interactions is
required.
Mainly used for screening
experiments when the
number of factors is large.
Primarily used for
screening experiments,
especially when resources
are limited.
Inefficient for large
numbers of factors would
be exponentially
distributed .
More efficient than a full
factorial design, allowing
for a reduction in the
number of runs.
Efficient for screening a
large number of factors
with a minimal number of
runs
10
11.
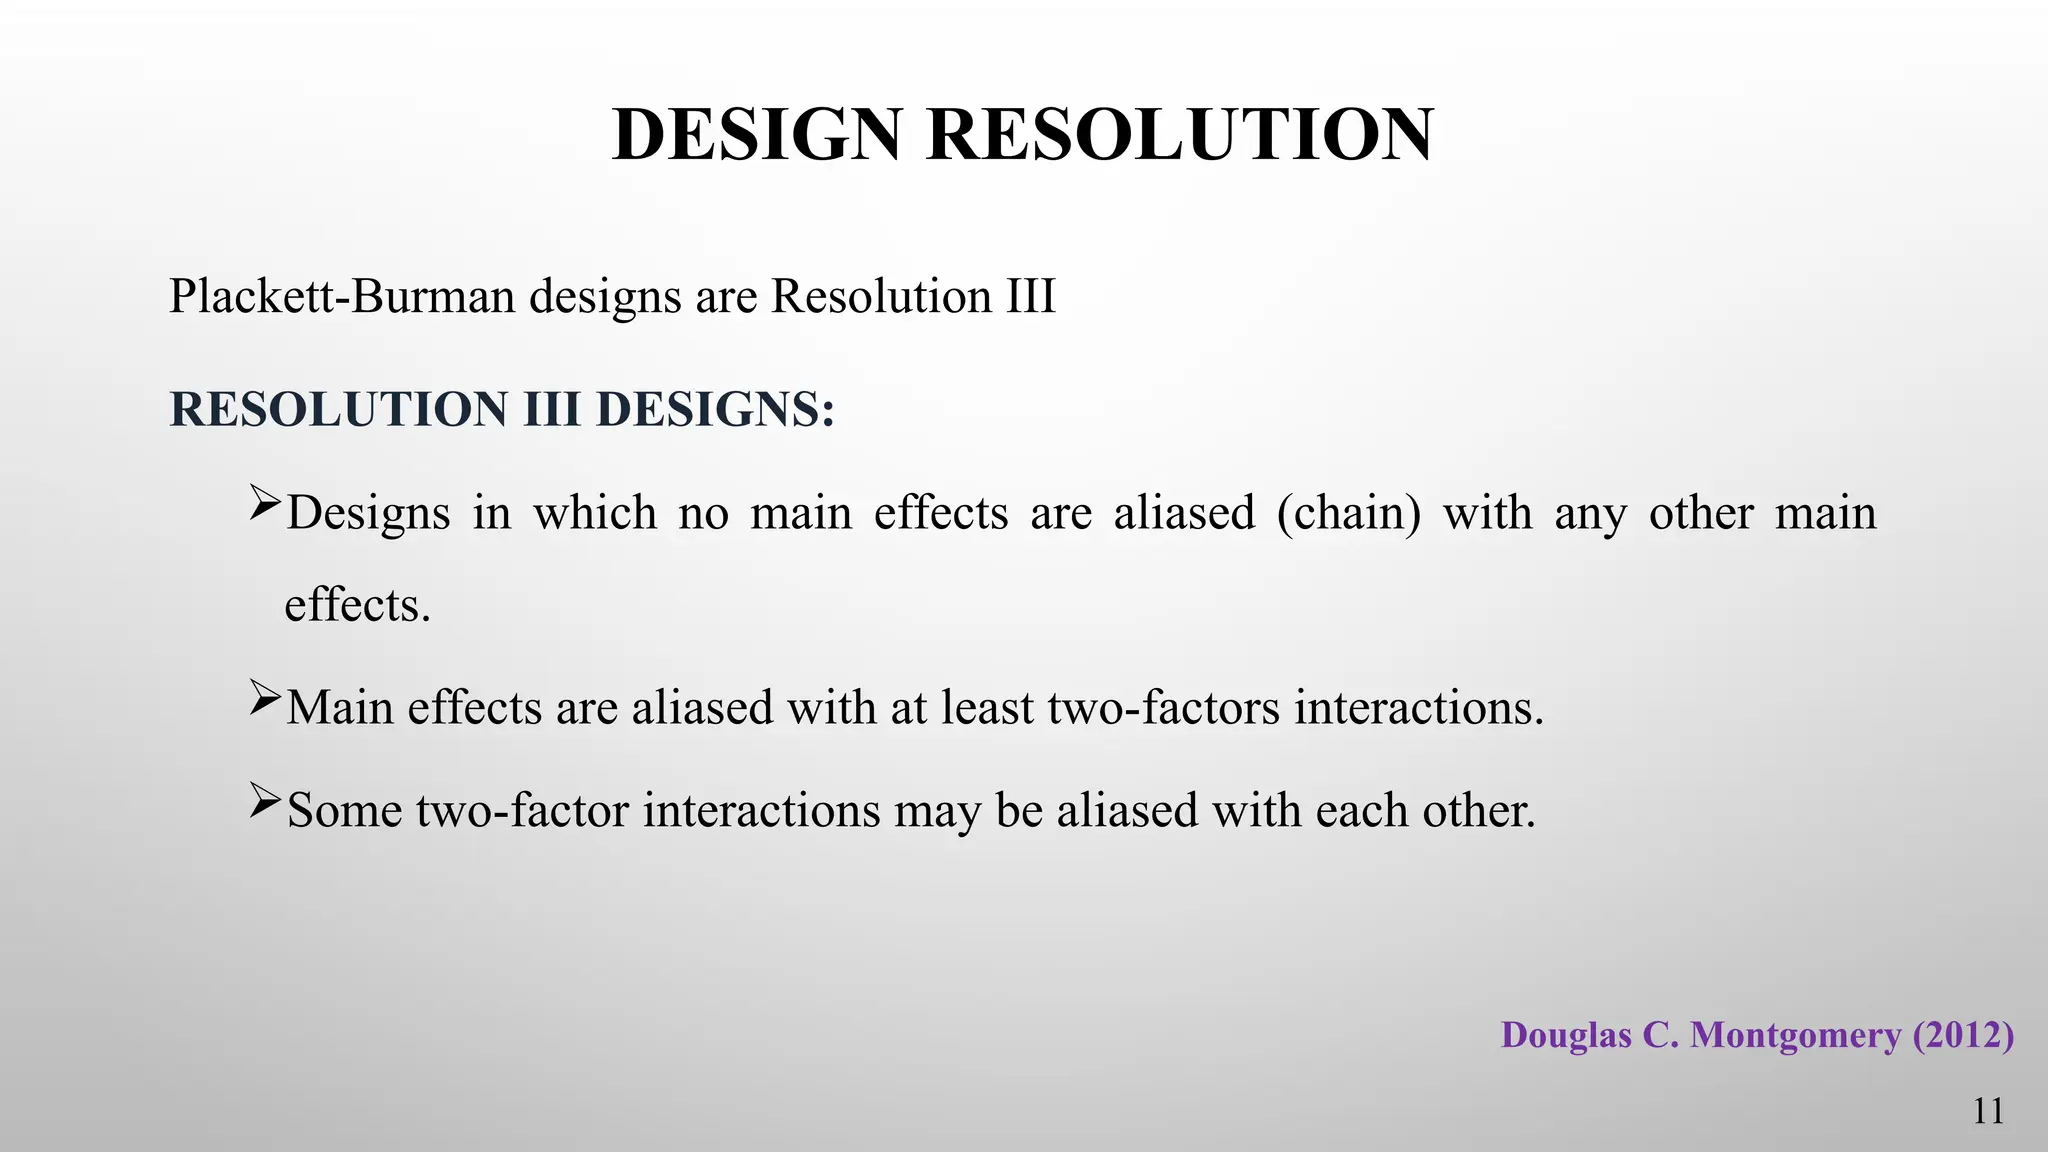
DESIGN RESOLUTION
Plackett-Burman designsare Resolution III
RESOLUTION III DESIGNS:
Designs in which no main effects are aliased (chain) with any other main
effects.
Main effects are aliased with at least two-factors interactions.
Some two-factor interactions may be aliased with each other.
11
Douglas C. Montgomery (2012)
USING F- VALUES.
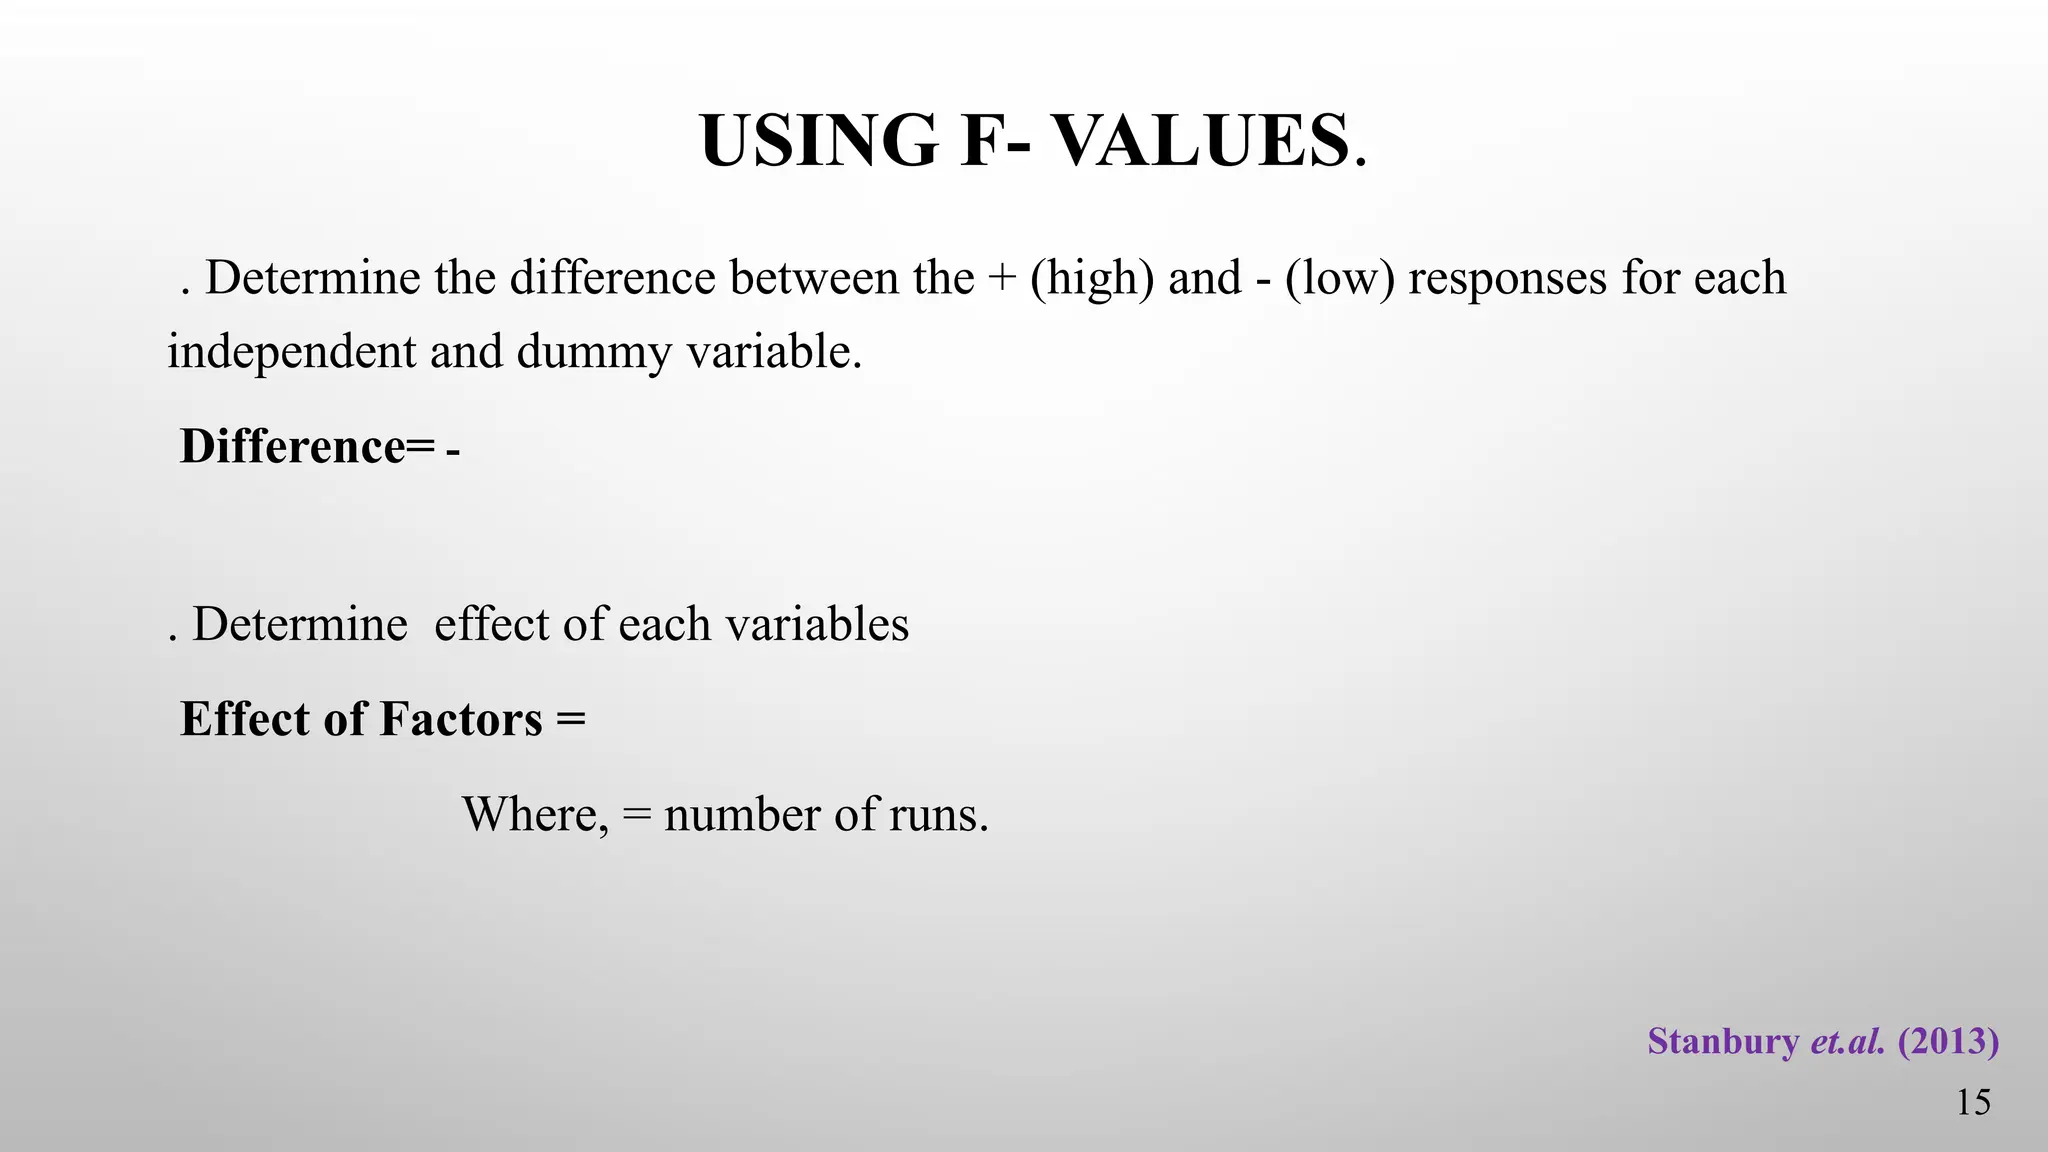
.Determine the difference between the + (high) and - (low) responses for each
independent and dummy variable.
Difference= -
. Determine effect of each variables
Effect of Factors =
Where, = number of runs.
15
Stanbury et.al. (2013)
16.
Contd…
. Estimate themean square of each variable (the variance of effect).
Factor Mean square =
. The experimental error can be calculated by averaging the mean squares of the
dummy effects.
EMS =
16
Stanbury et.al. (2013)
17.
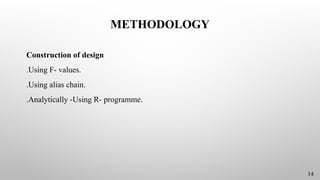
Contd…
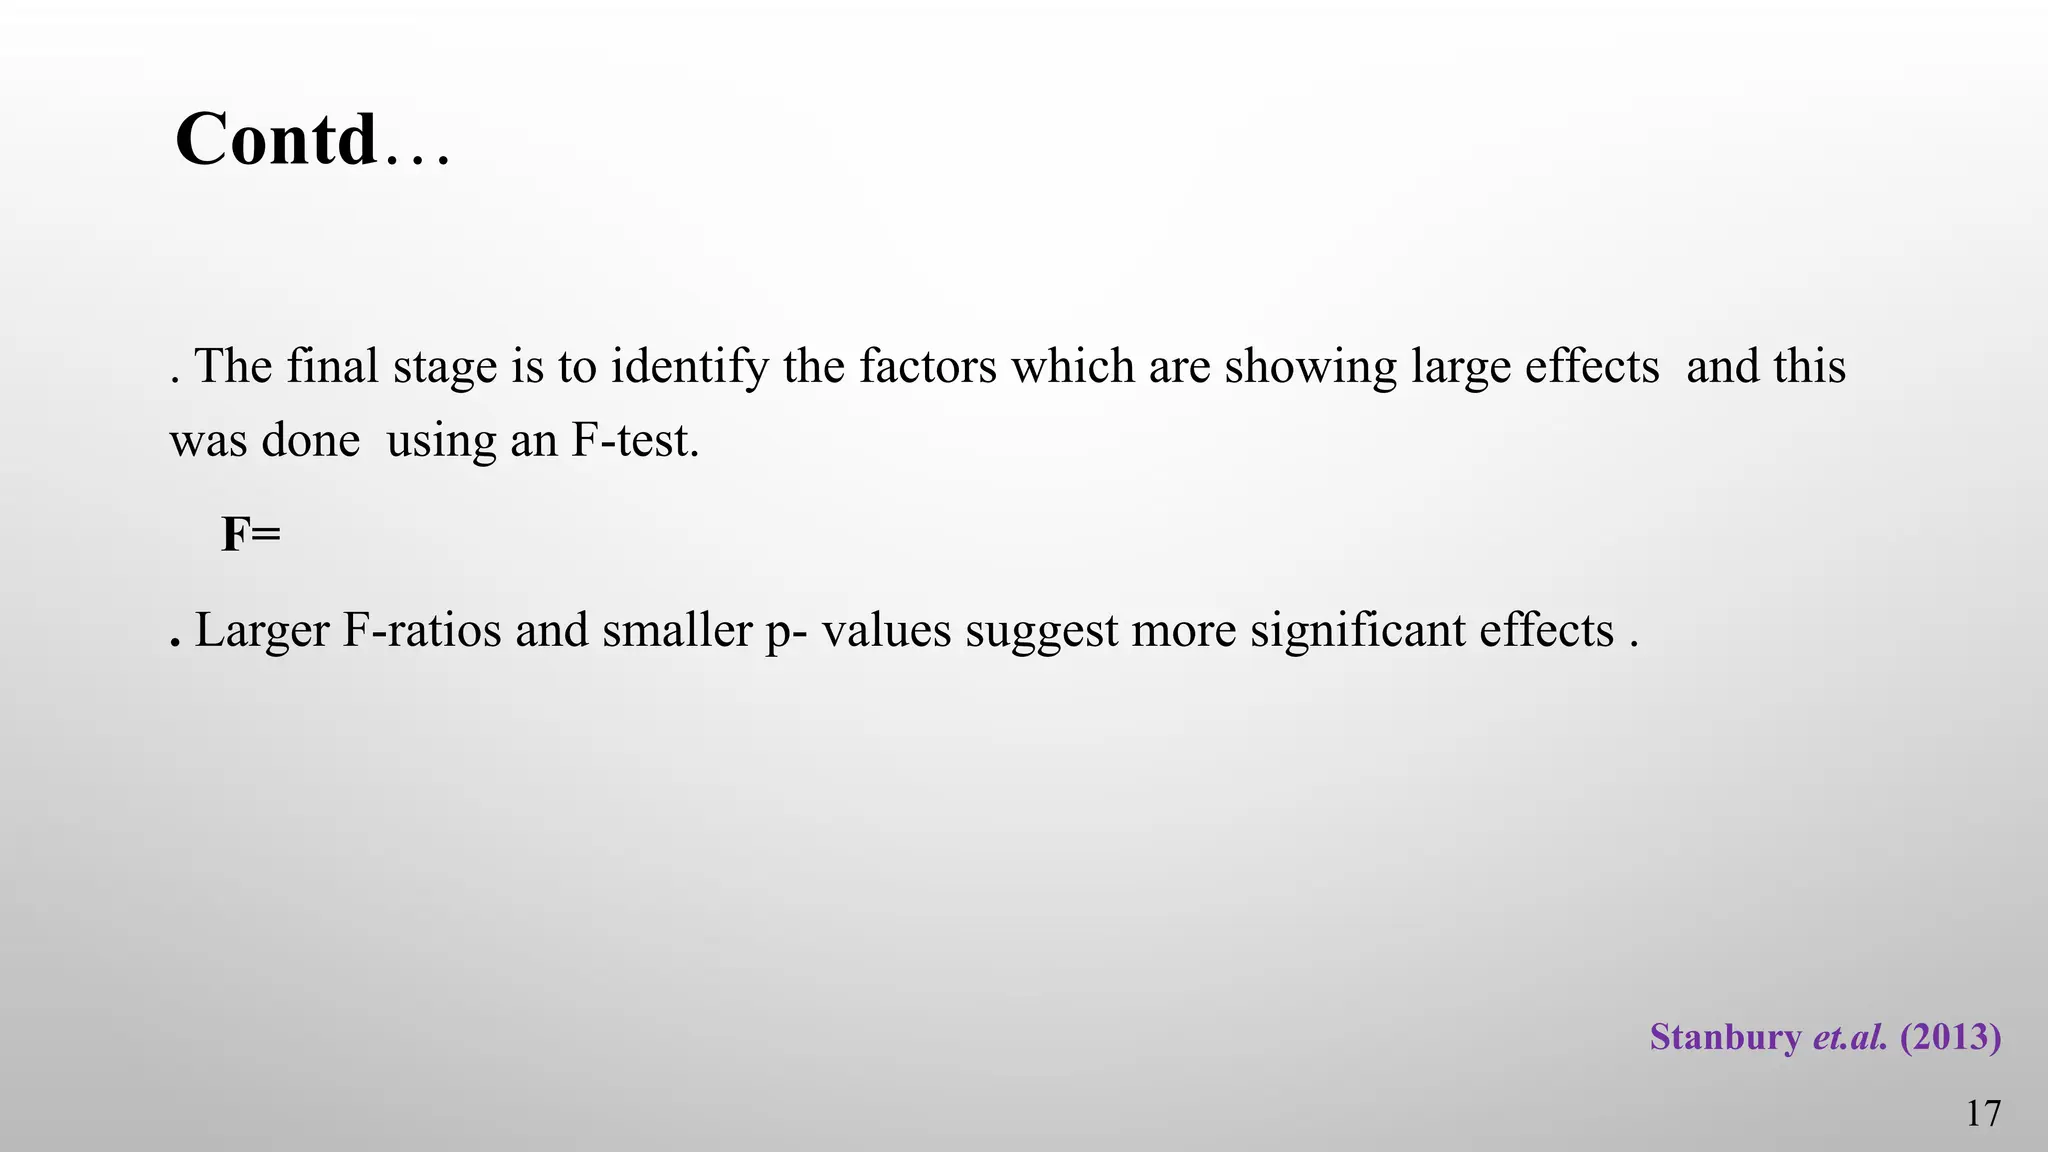
. The finalstage is to identify the factors which are showing large effects and this
was done using an F-test.
F=
. Larger F-ratios and smaller p- values suggest more significant effects .
17
Stanbury et.al. (2013)
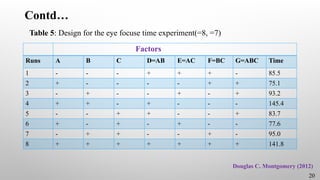
18.
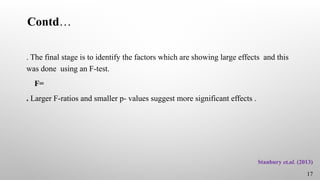
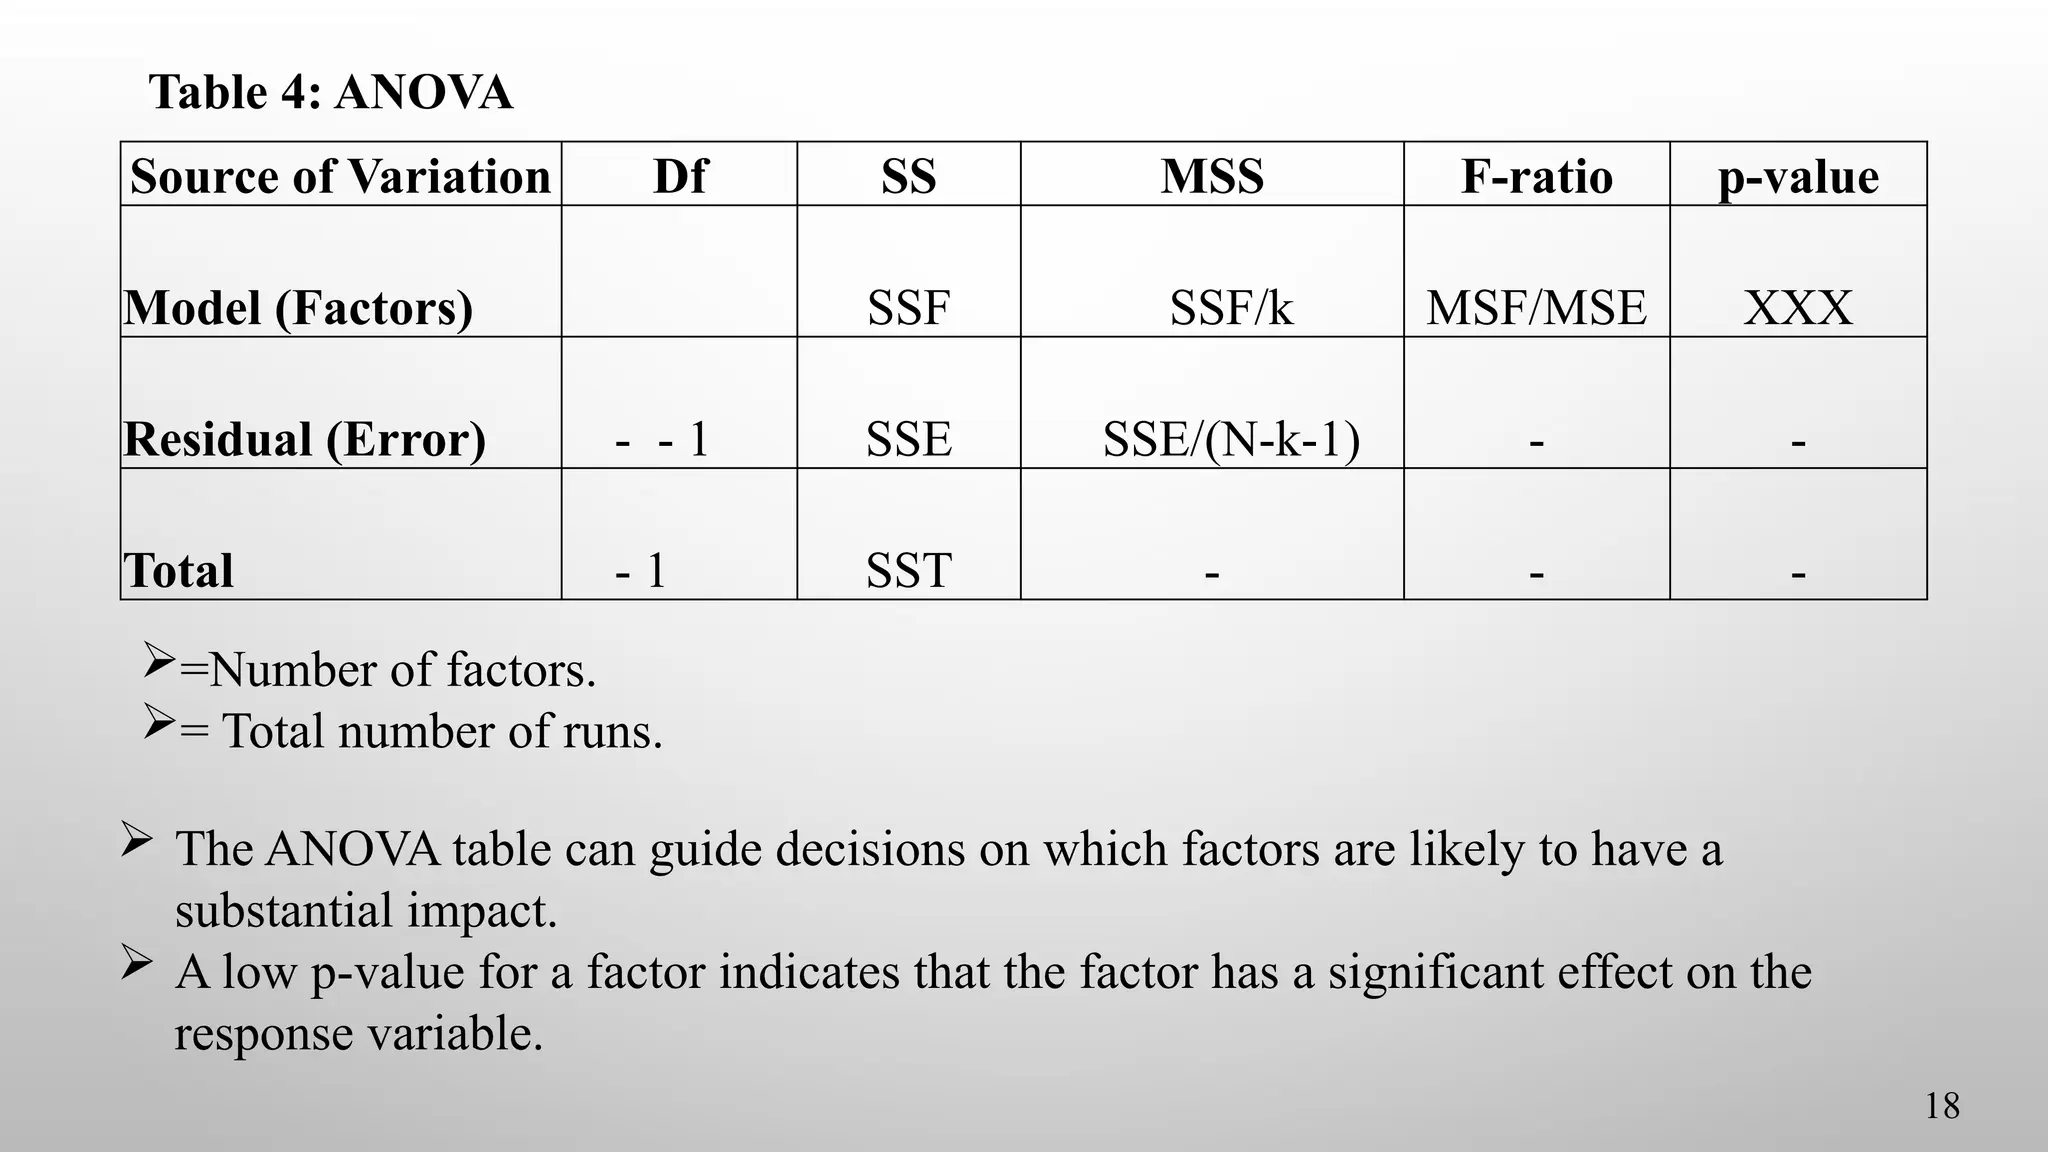
Table 4: ANOVA
Sourceof Variation Df SS MSS F-ratio p-value
Model (Factors) SSF SSF/k MSF/MSE XXX
Residual (Error) - - 1 SSE SSE/(N-k-1) - -
Total - 1 SST - - -
18
=Number of factors.
= Total number of runs.
The ANOVA table can guide decisions on which factors are likely to have a
substantial impact.
A low p-value for a factor indicates that the factor has a significant effect on the
response variable.
19.
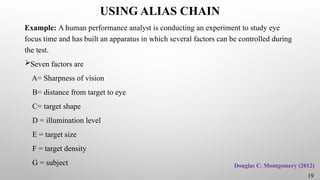
USING ALIAS CHAIN
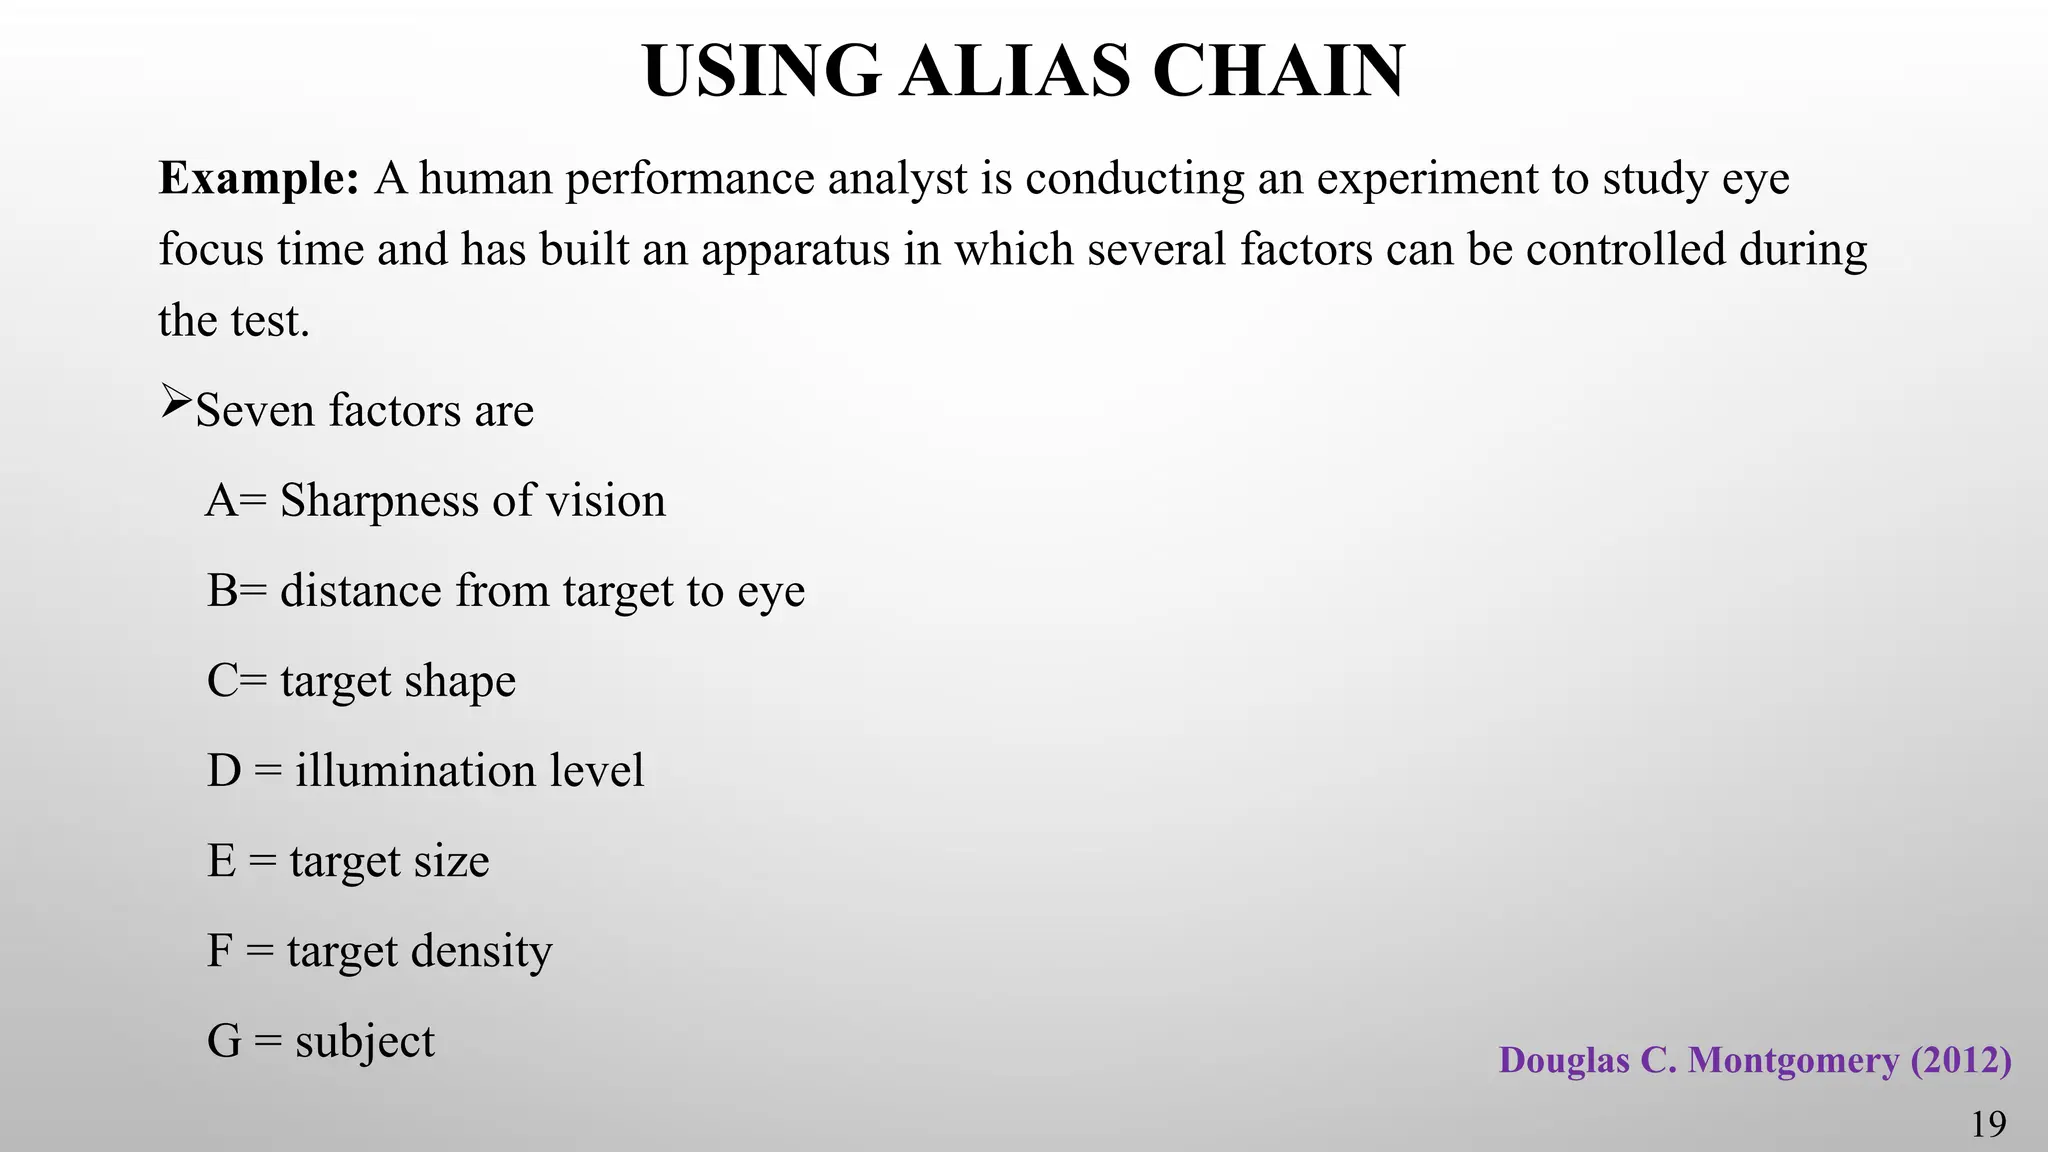
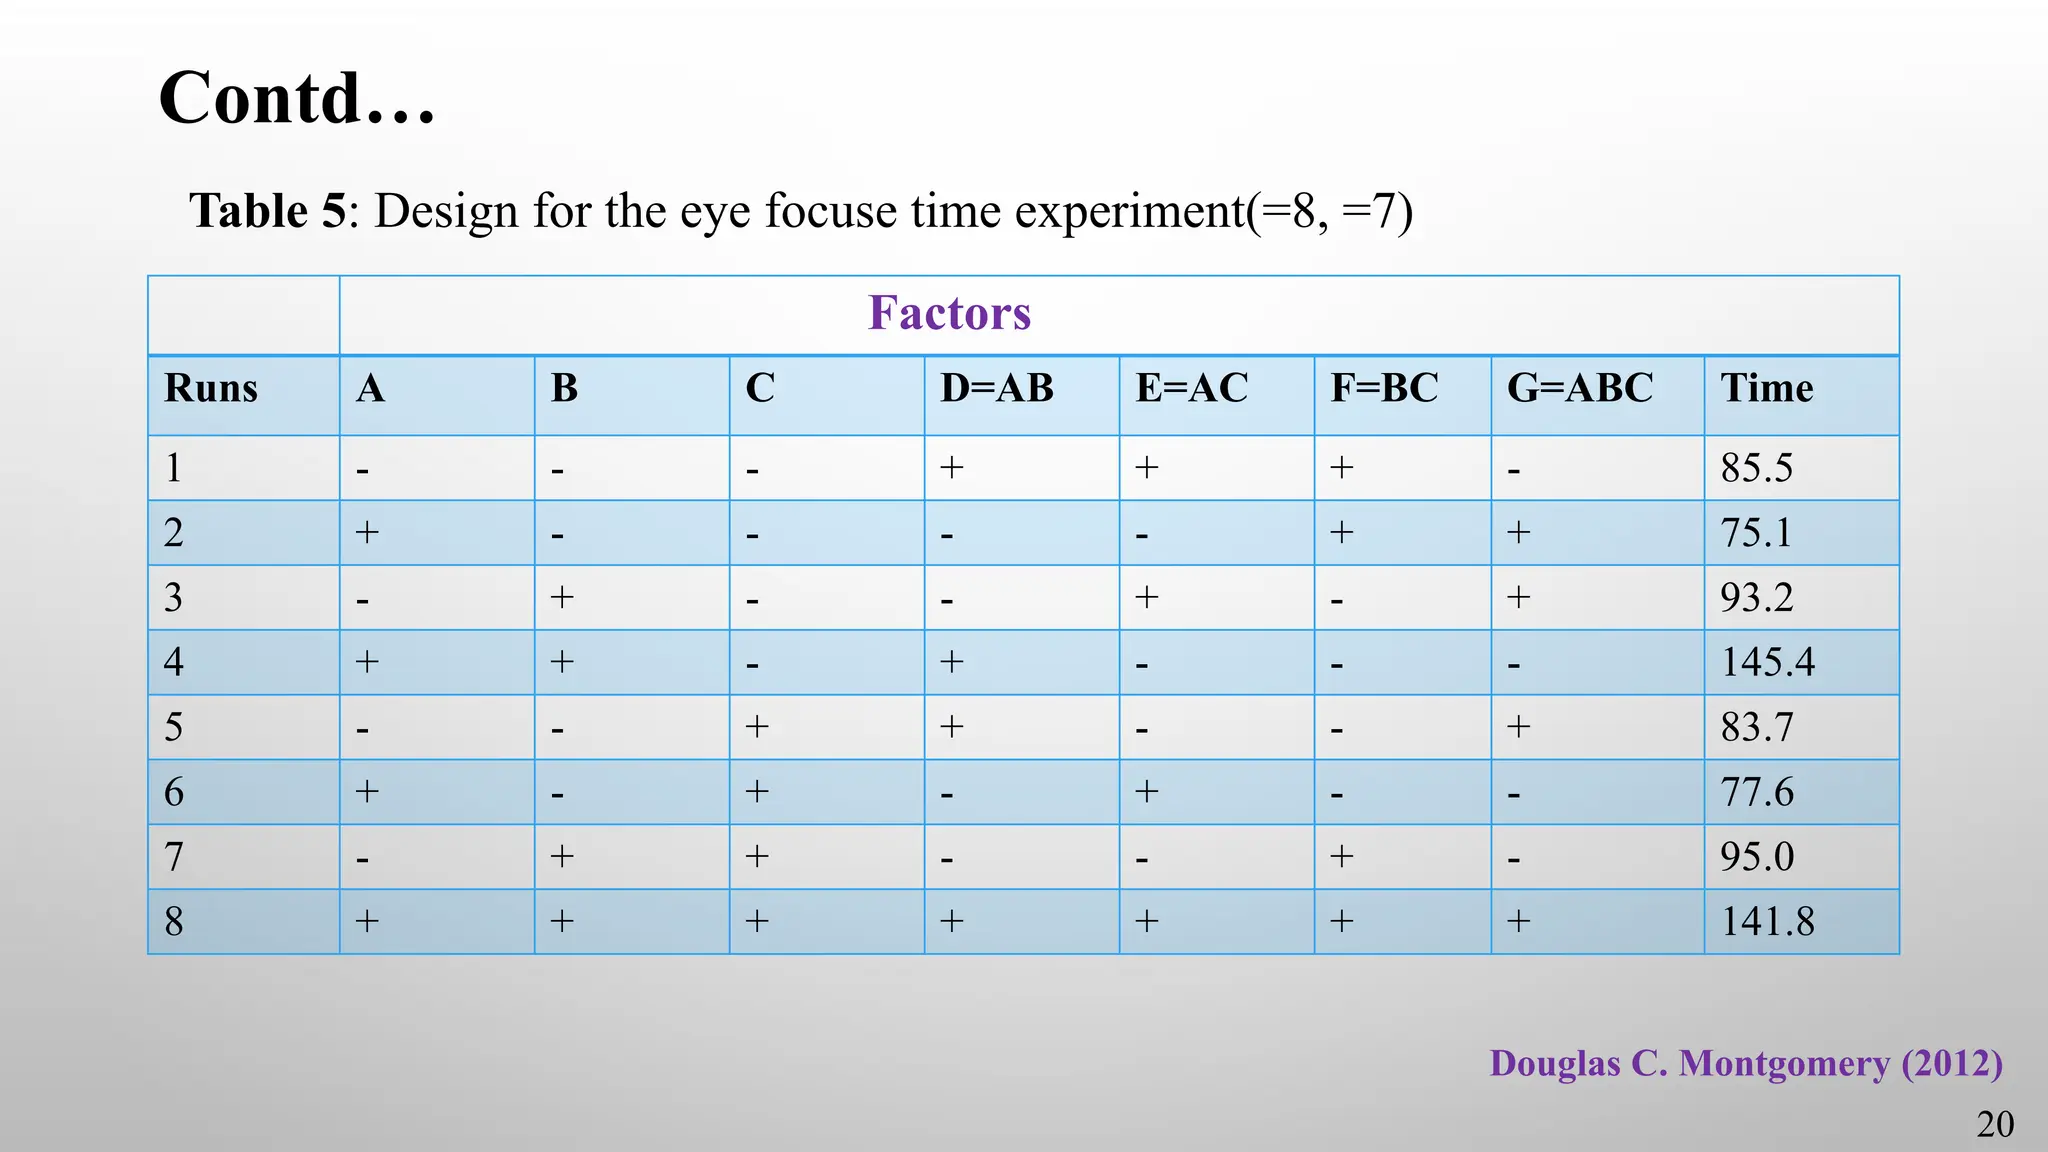
Example:A human performance analyst is conducting an experiment to study eye
focus time and has built an apparatus in which several factors can be controlled during
the test.
Seven factors are
A= Sharpness of vision
B= distance from target to eye
C= target shape
D = illumination level
E = target size
F = target density
G = subject Douglas C. Montgomery (2012)
19
Contd…
Seven main effectsand their aliases may be estimated from these data, the effects
and their aliases are
[A]=20.63 A+BD+CE+FG
[B]=38.38 B+AD+CF+EG
[C]=-0.28 C+AE+BF+DG
[D]=28.88 D+AB+CG+EF
[E]=-0.28 E+AC+BG+DF
[F]=0.63 F+BC+AG+DE
[G]=-2.43 G+CD+BE+AF
Douglas C. Montgomery (2012)
21
22.
USING R PROGRAMME
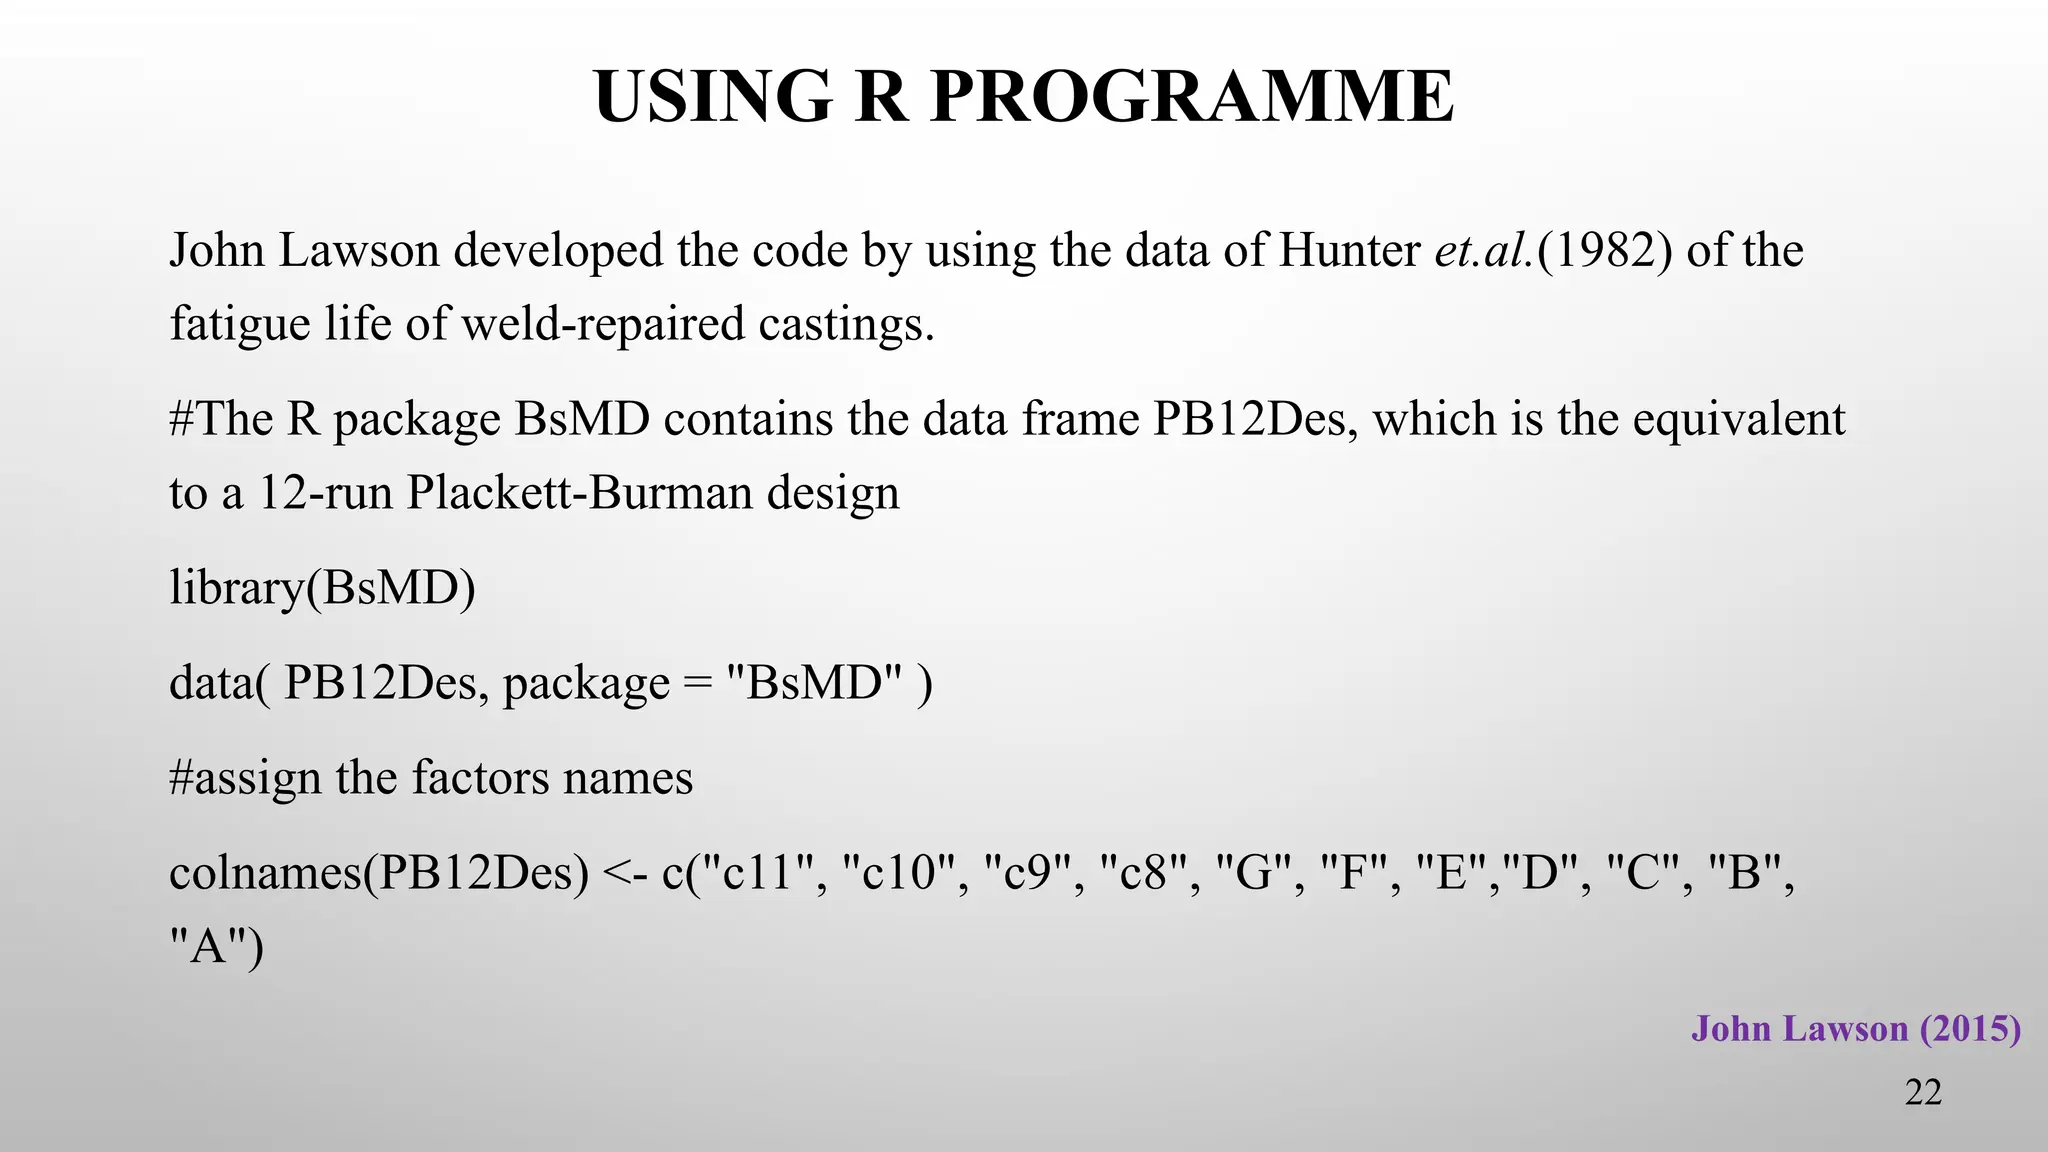
JohnLawson developed the code by using the data of Hunter et.al.(1982) of the
fatigue life of weld-repaired castings.
#The R package BsMD contains the data frame PB12Des, which is the equivalent
to a 12-run Plackett-Burman design
library(BsMD)
data( PB12Des, package = "BsMD" )
#assign the factors names
colnames(PB12Des) <- c("c11", "c10", "c9", "c8", "G", "F", "E","D", "C", "B",
"A")
22
John Lawson (2015)
23.
Contd…
#use PB12Des tocreate PB12 design matrix
castf <- PB12Des[c(11,10,9,8,7,6,5,4,3,2,1)]
#assign the response values
y <- c(4.733, 4.625, 5.899, 7.0, 5.752, 5.682, 6.607, 5.818, 5.917, 5.863, 6.058, 4.809)
#combind the response values and factors
castf1 <- cbind( castf, y )
#the lm function was used to estimate the coefficients for each of the 11 columns
modpb <- lm( y ~ (.), data = castf1 )
23
John Lawson (2015)
24.
Contd…
# package daewrwas used to create the
half-normal plot of effects.
library(daewr)
cfs <- coef(modpb)[2:12]
names<-names(cfs)
halfnorm(cfs, names, alpha = .35, refline=FALSE) Fig.1
John Lawson (2015)
24
25.
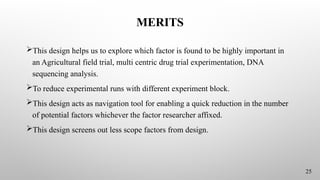
MERITS
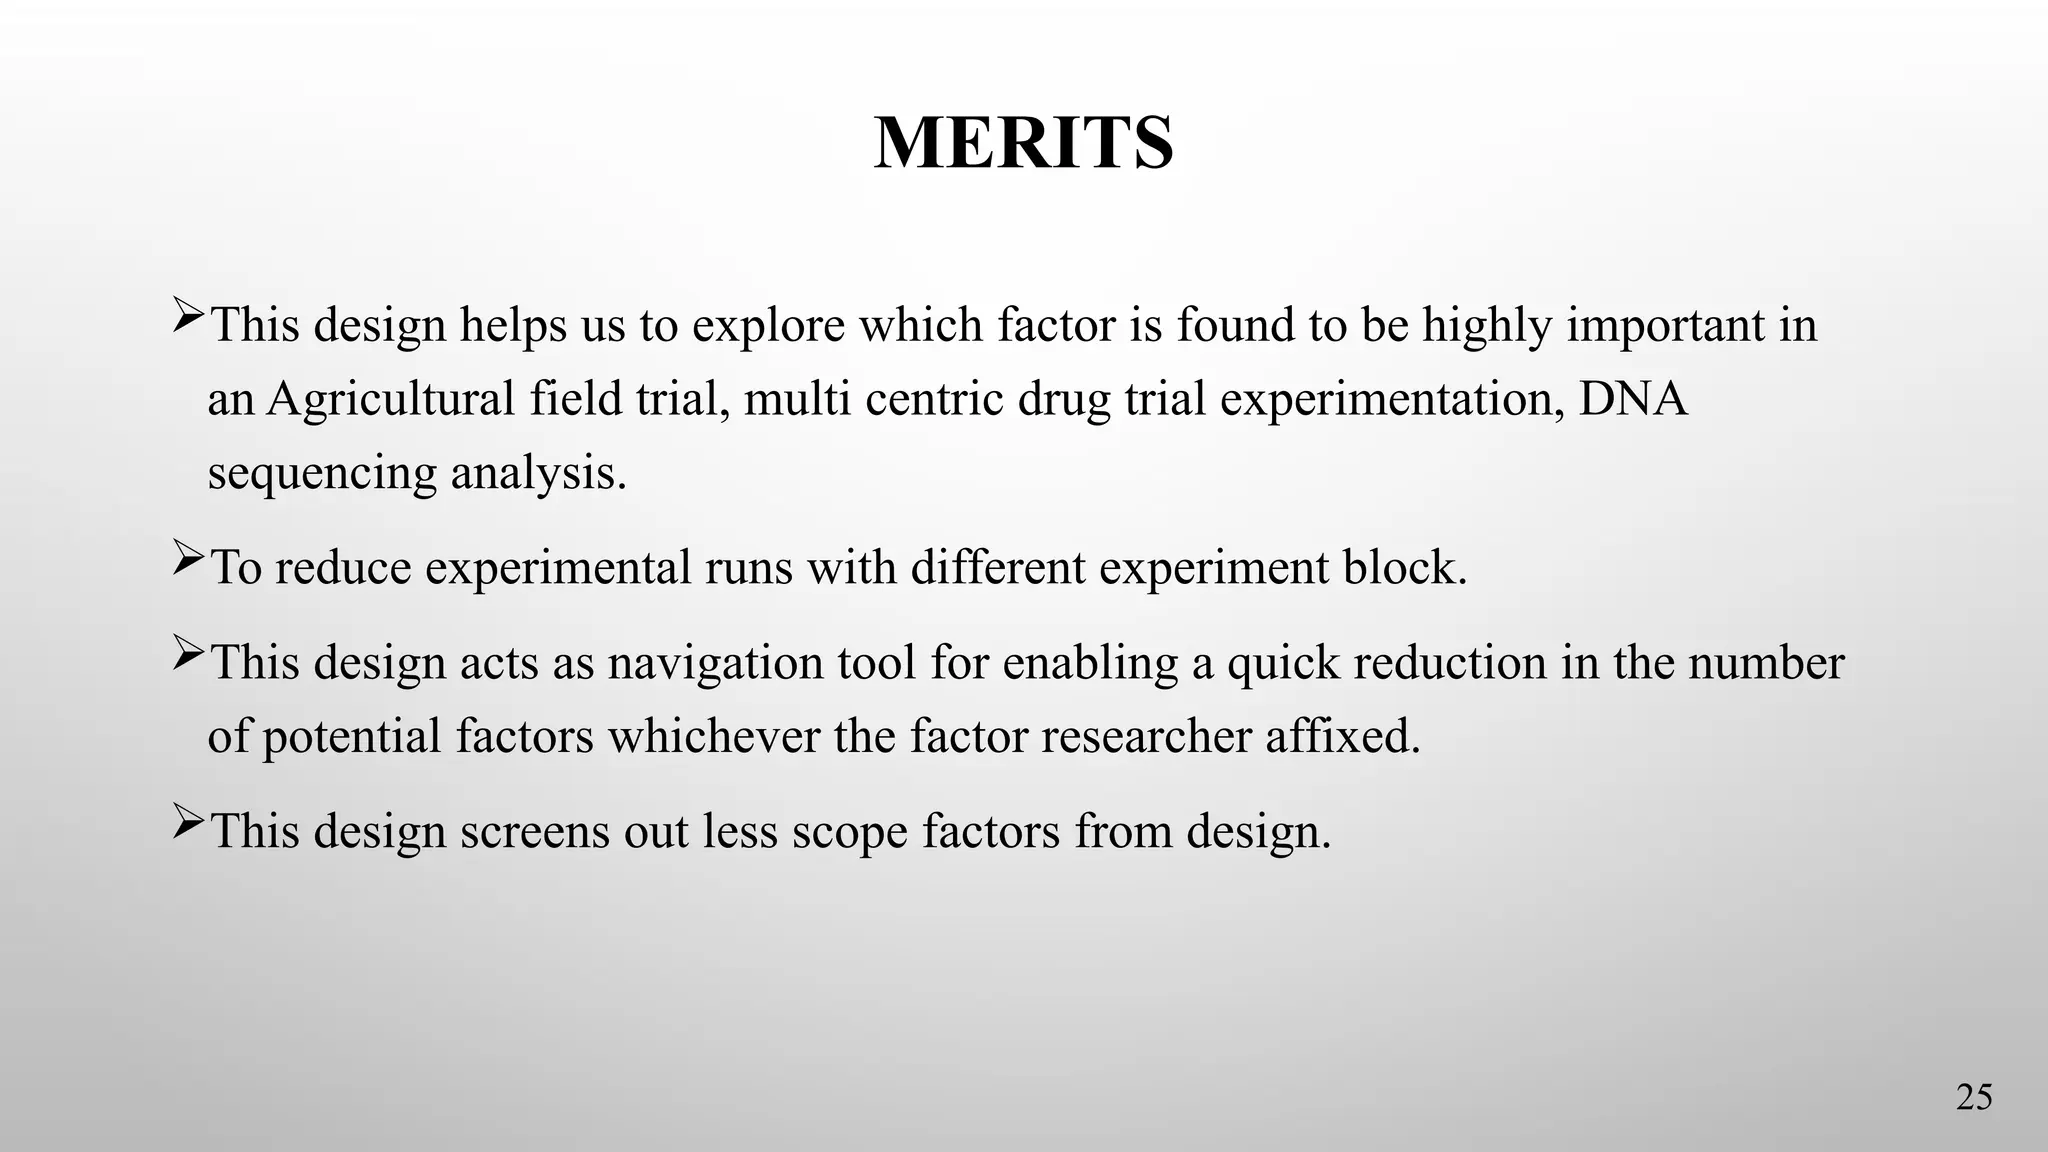
This design helpsus to explore which factor is found to be highly important in
an Agricultural field trial, multi centric drug trial experimentation, DNA
sequencing analysis.
To reduce experimental runs with different experiment block.
This design acts as navigation tool for enabling a quick reduction in the number
of potential factors whichever the factor researcher affixed.
This design screens out less scope factors from design.
25
26.
DEMERITS
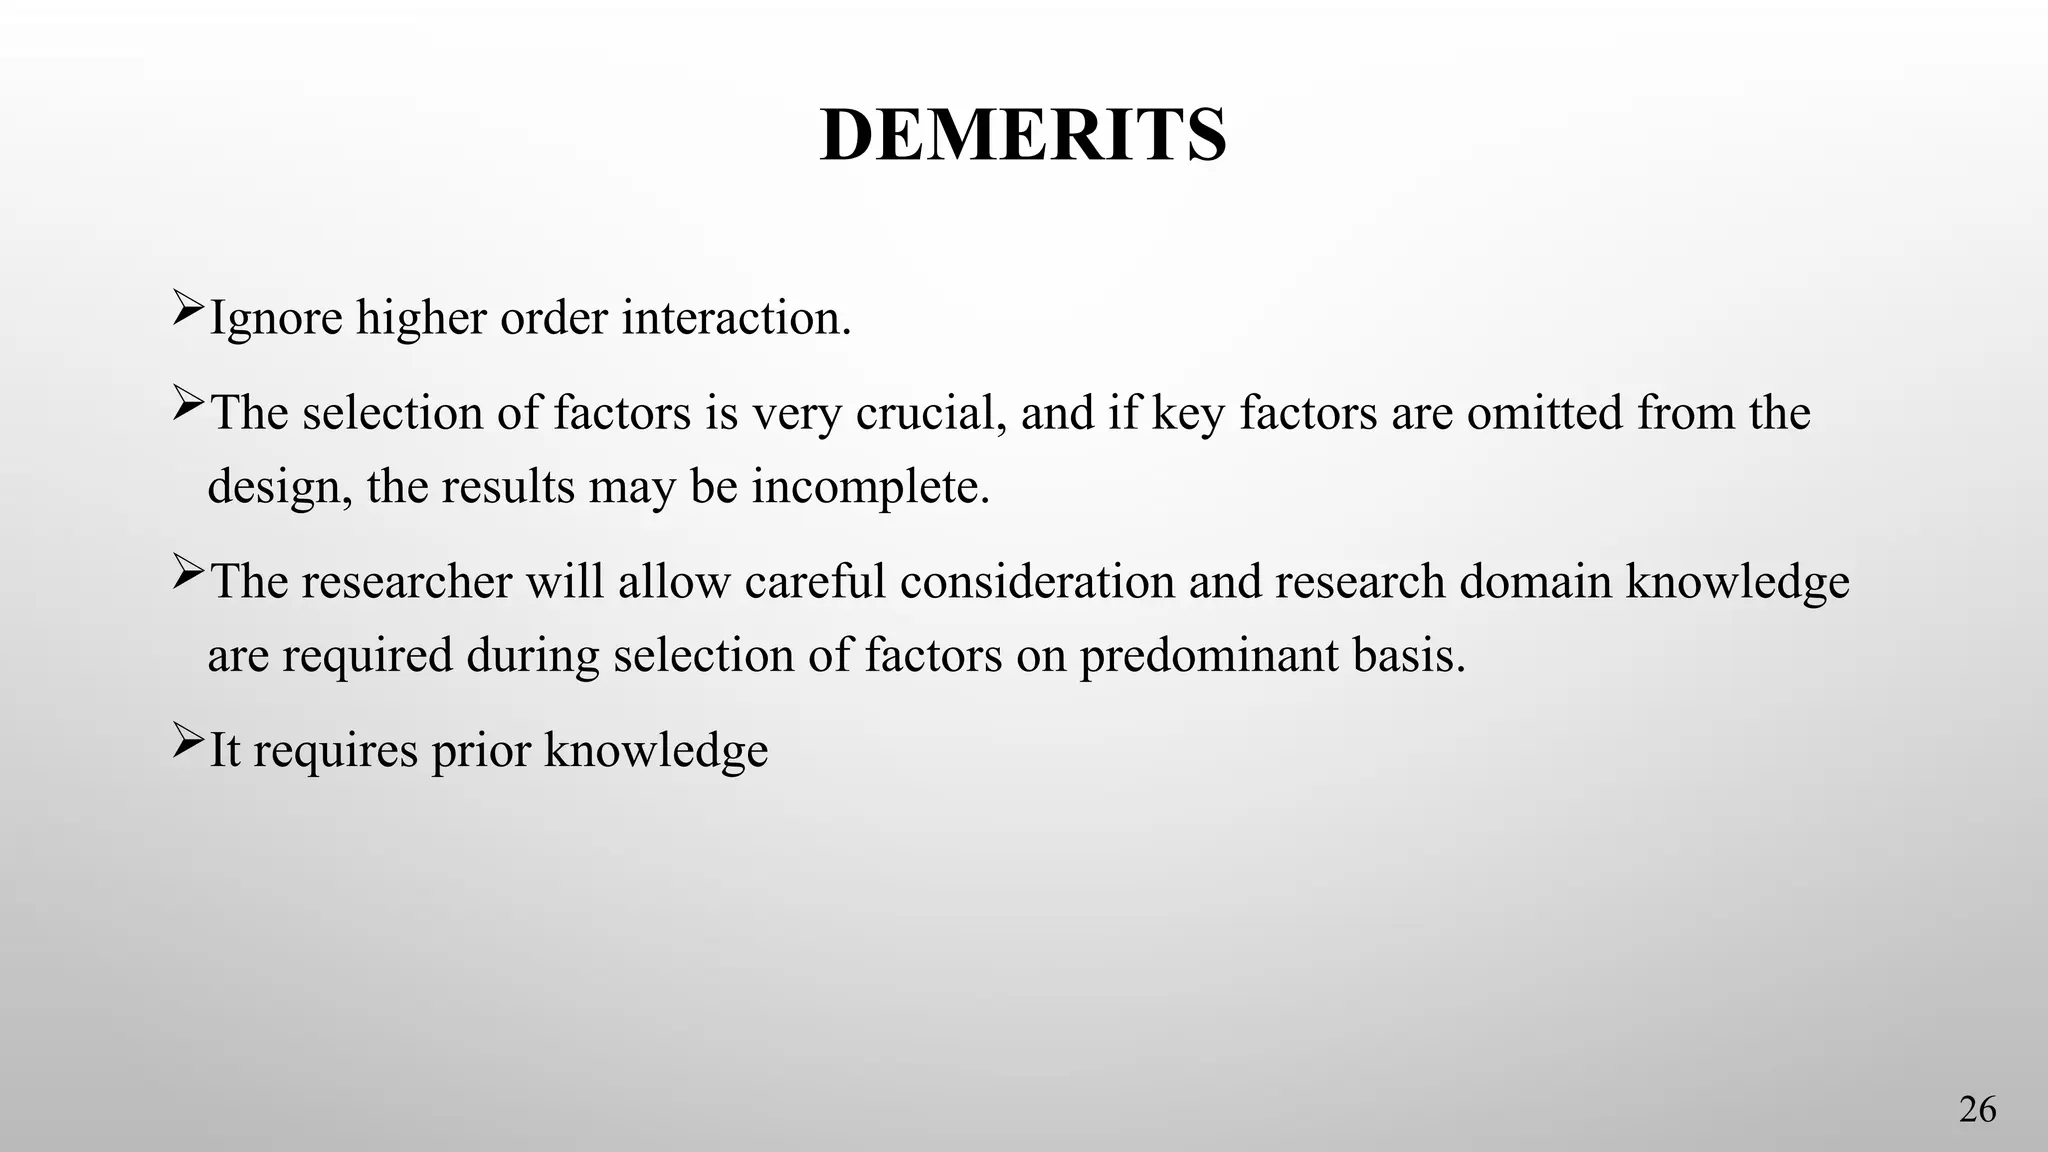
Ignore higher orderinteraction.
The selection of factors is very crucial, and if key factors are omitted from the
design, the results may be incomplete.
The researcher will allow careful consideration and research domain knowledge
are required during selection of factors on predominant basis.
It requires prior knowledge
26
27.
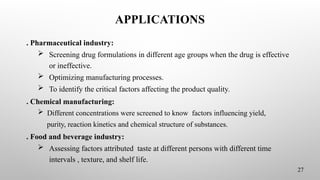
APPLICATIONS
. Pharmaceutical industry:
Screening drug formulations in different age groups when the drug is effective
or ineffective.
Optimizing manufacturing processes.
To identify the critical factors affecting the product quality.
. Chemical manufacturing:
Different concentrations were screened to know factors influencing yield,
purity, reaction kinetics and chemical structure of substances.
. Food and beverage industry:
Assessing factors attributed taste at different persons with different time
intervals , texture, and shelf life.
27
28.
Contd…
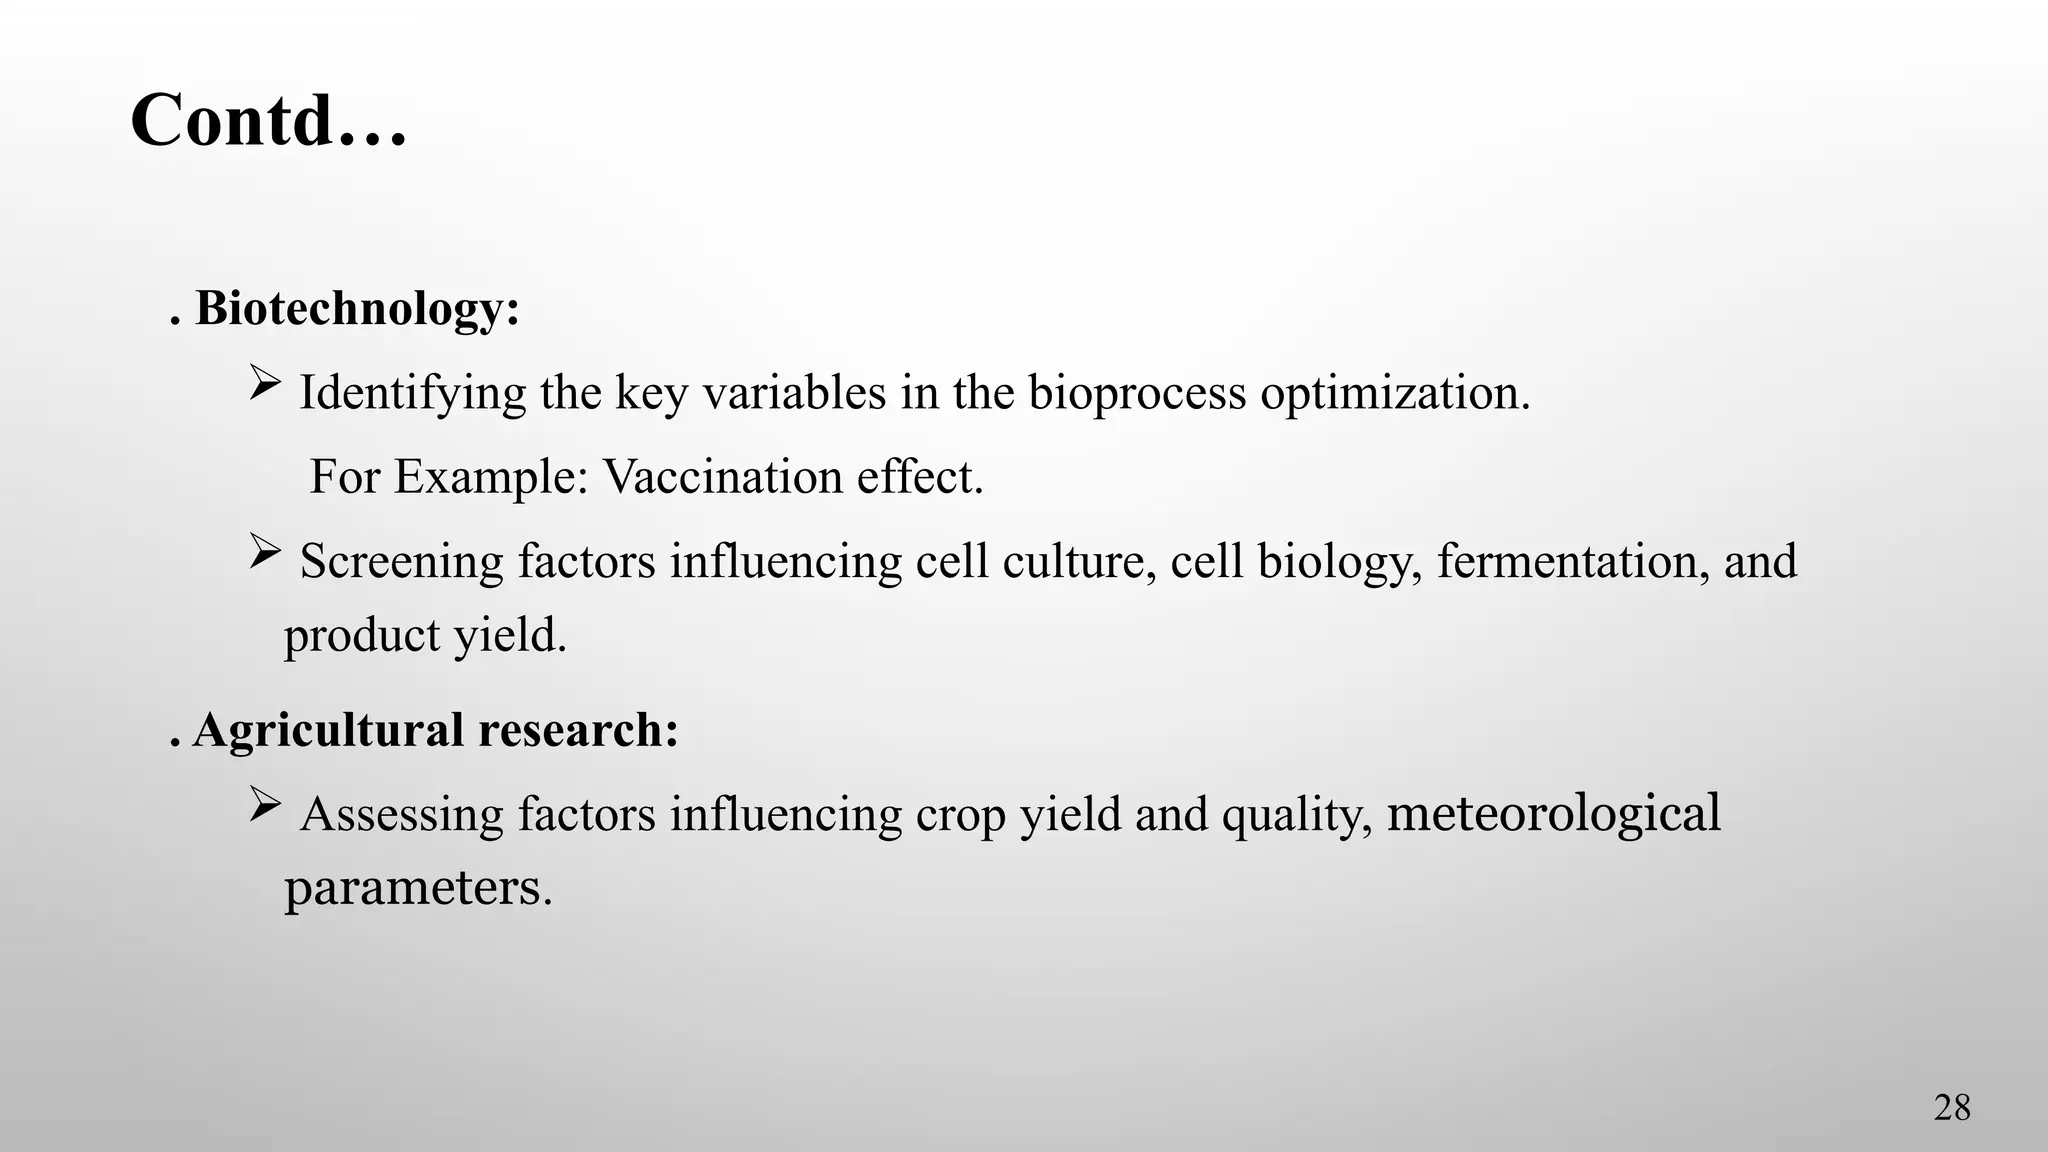
. Biotechnology:
Identifyingthe key variables in the bioprocess optimization.
For Example: Vaccination effect.
Screening factors influencing cell culture, cell biology, fermentation, and
product yield.
. Agricultural research:
Assessing factors influencing crop yield and quality, meteorological
parameters.
28
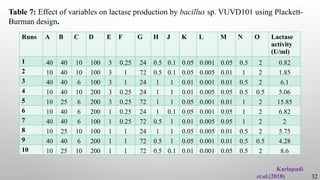
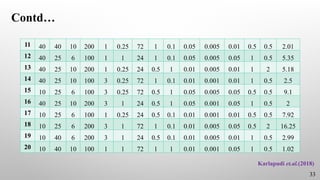
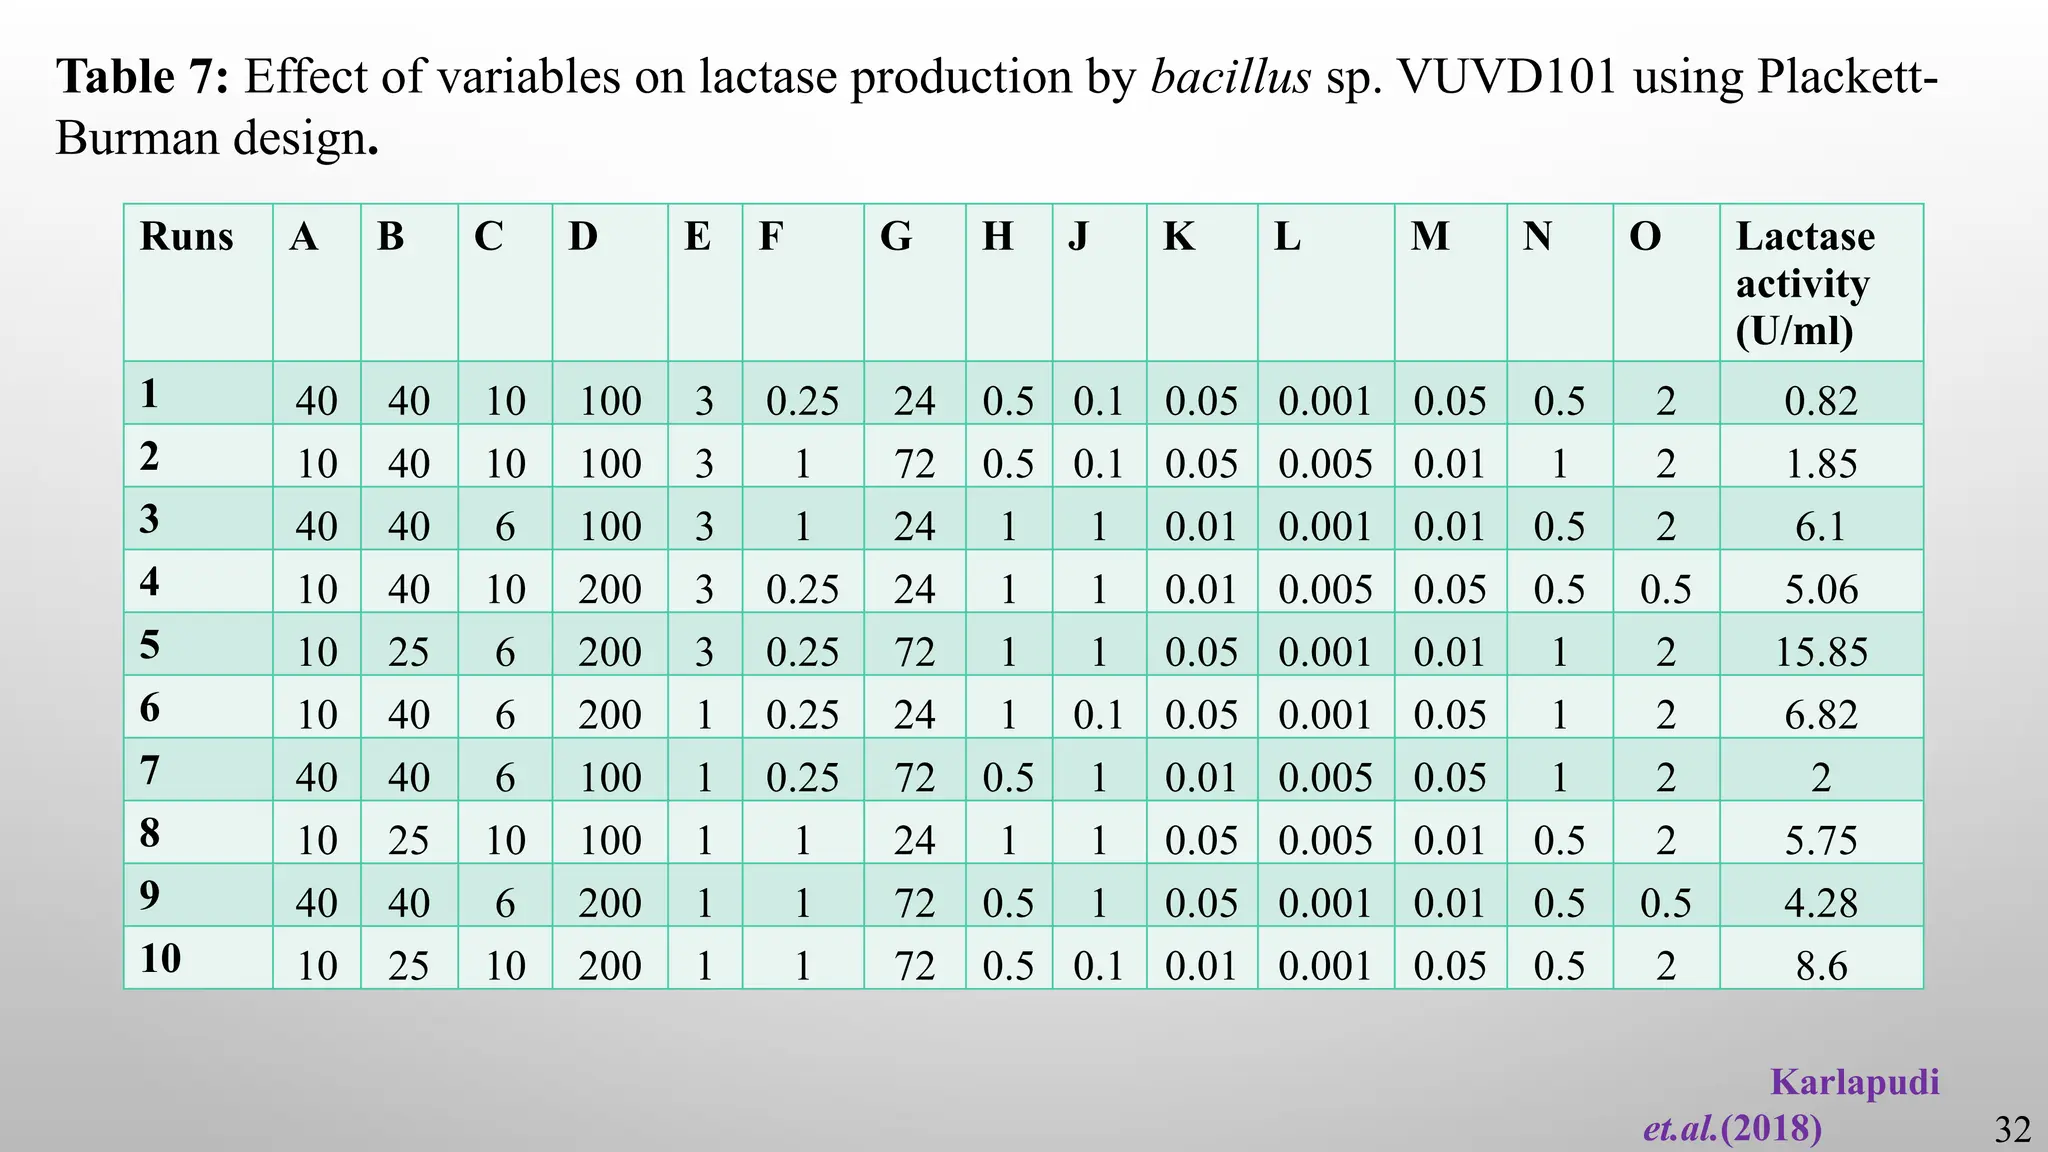
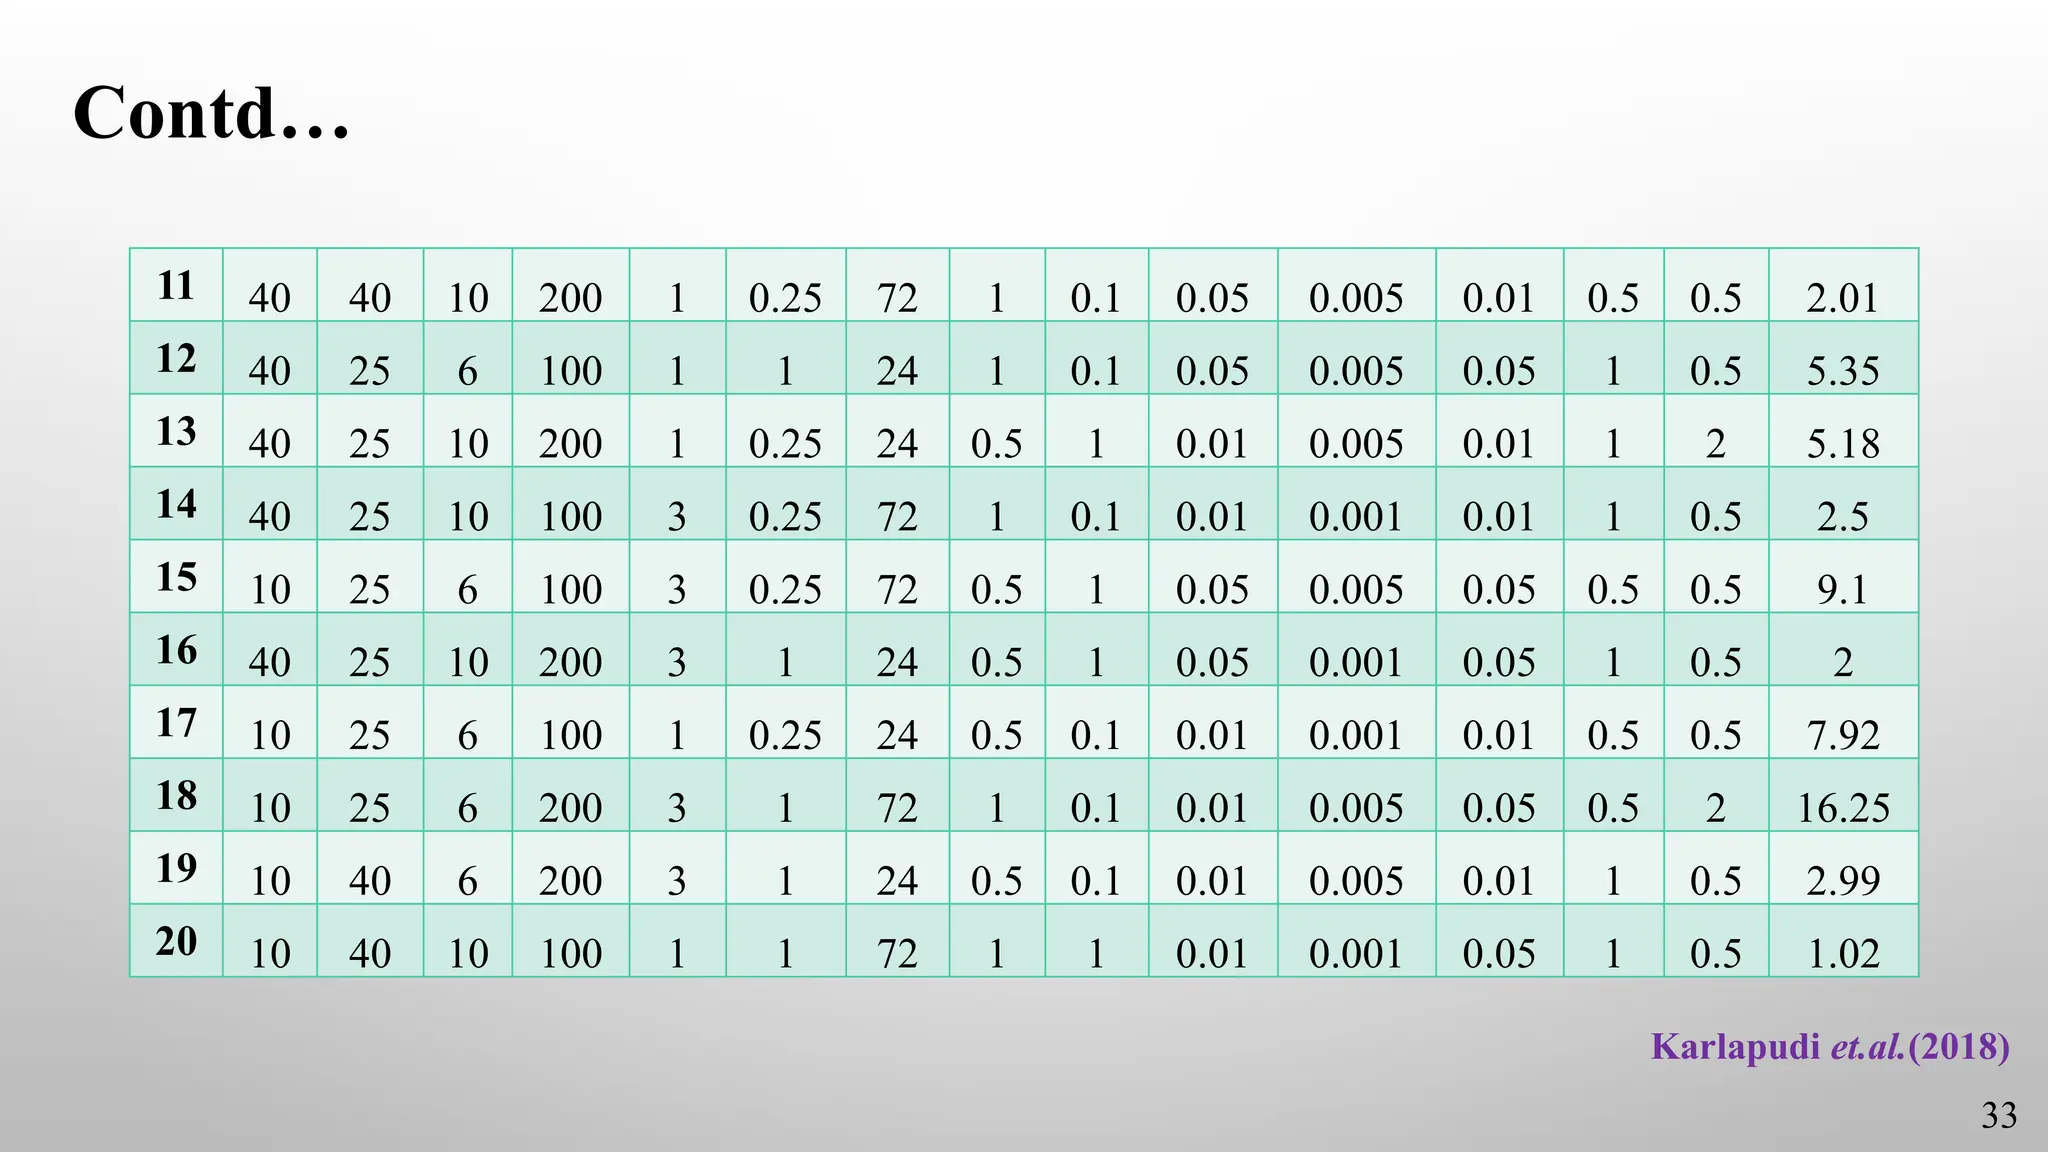
This study focuson Screening of process components and their effects on
production of lactase by newly isolated Bacillus sp. VUVD101 strain from dairy
effluent by using PBD.
Objectives:
Lactase production increases.
Screening the factors affecting of the production process.
Isolated bacterium increase more profit.
Karlapudi et.al.(2018)
30
31.
Contd…
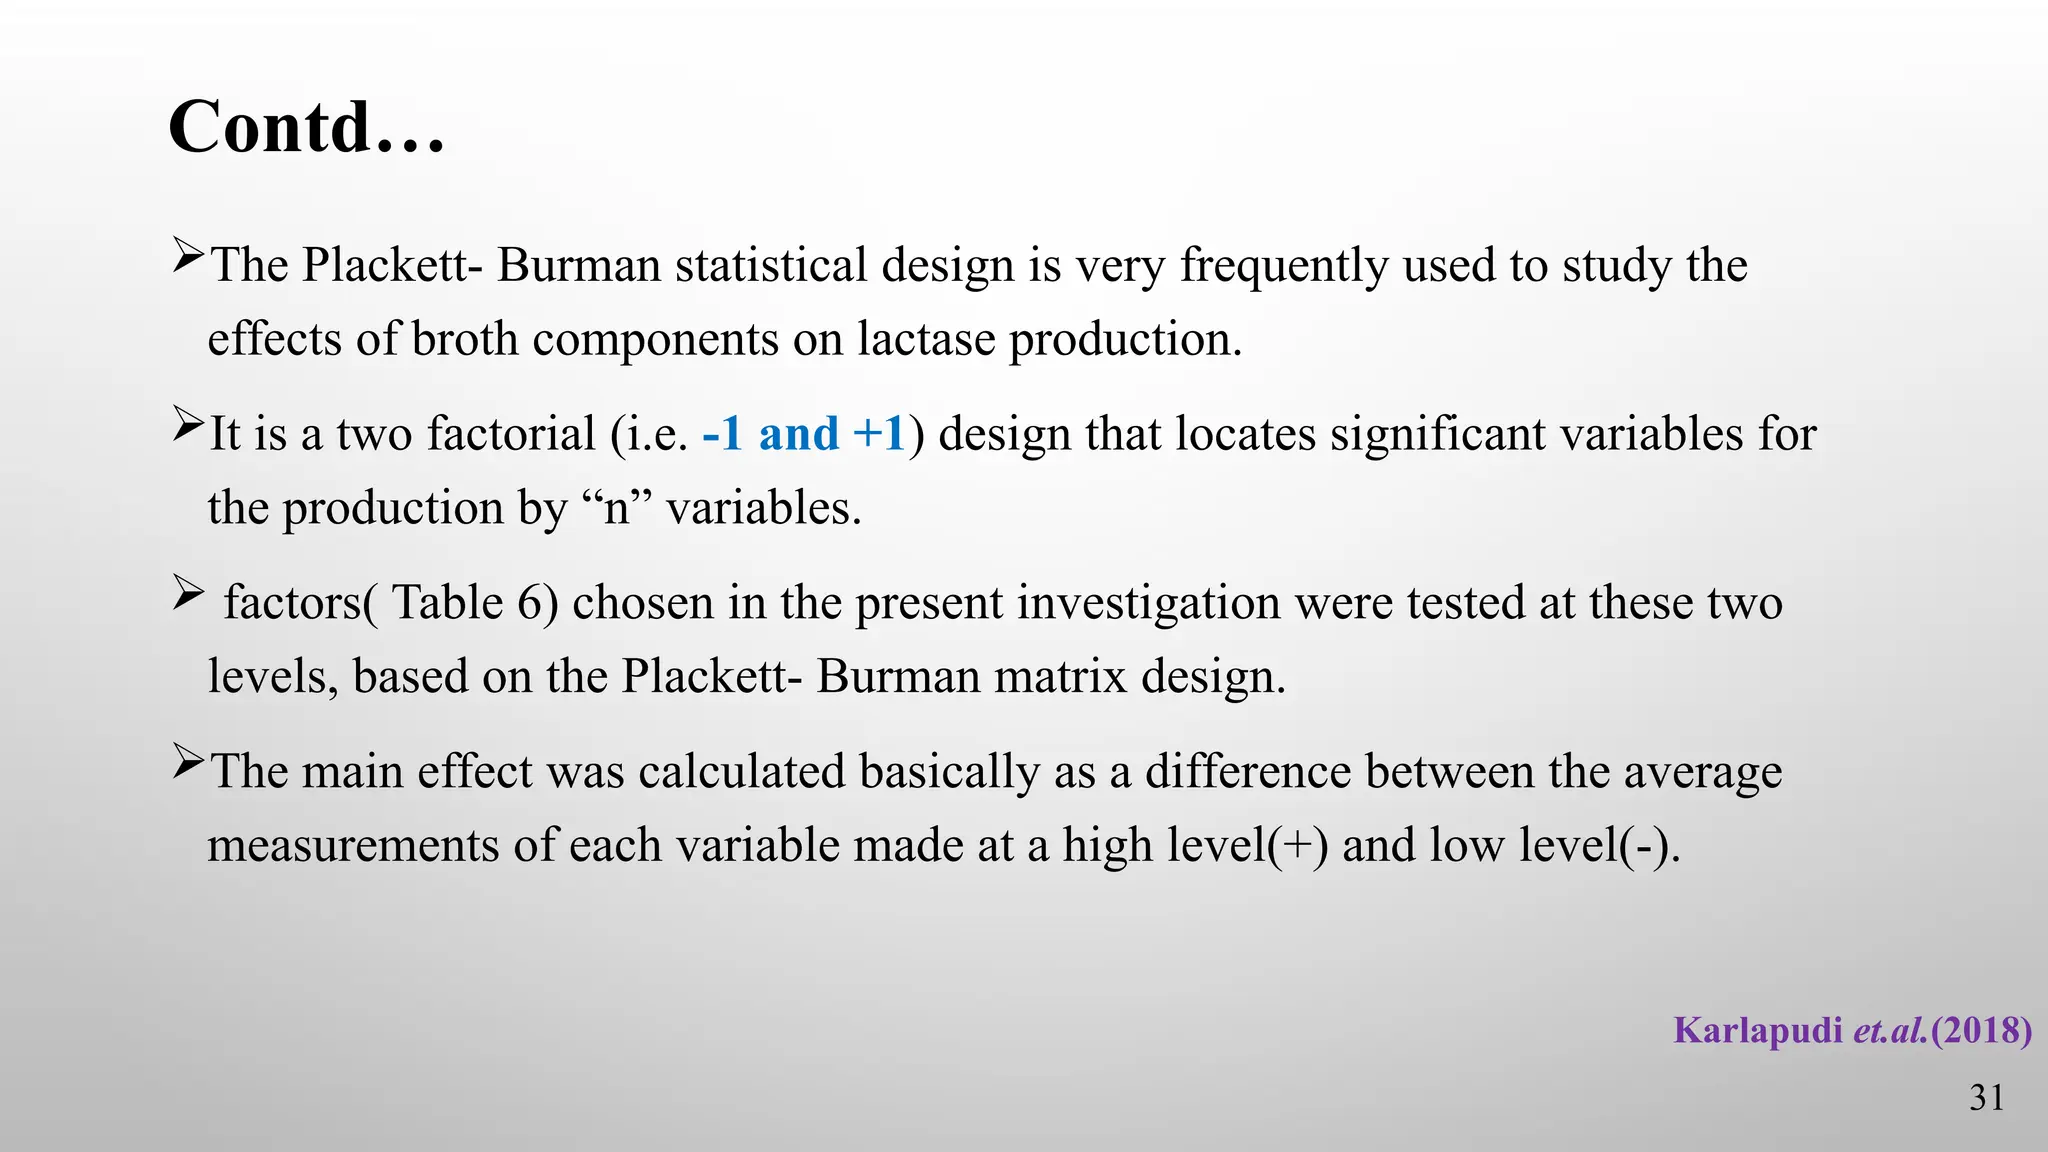
The Plackett- Burmanstatistical design is very frequently used to study the
effects of broth components on lactase production.
It is a two factorial (i.e. -1 and +1) design that locates significant variables for
the production by “n” variables.
factors( Table 6) chosen in the present investigation were tested at these two
levels, based on the Plackett- Burman matrix design.
The main effect was calculated basically as a difference between the average
measurements of each variable made at a high level(+) and low level(-).
Karlapudi et.al.(2018)
31
32.
Contd…
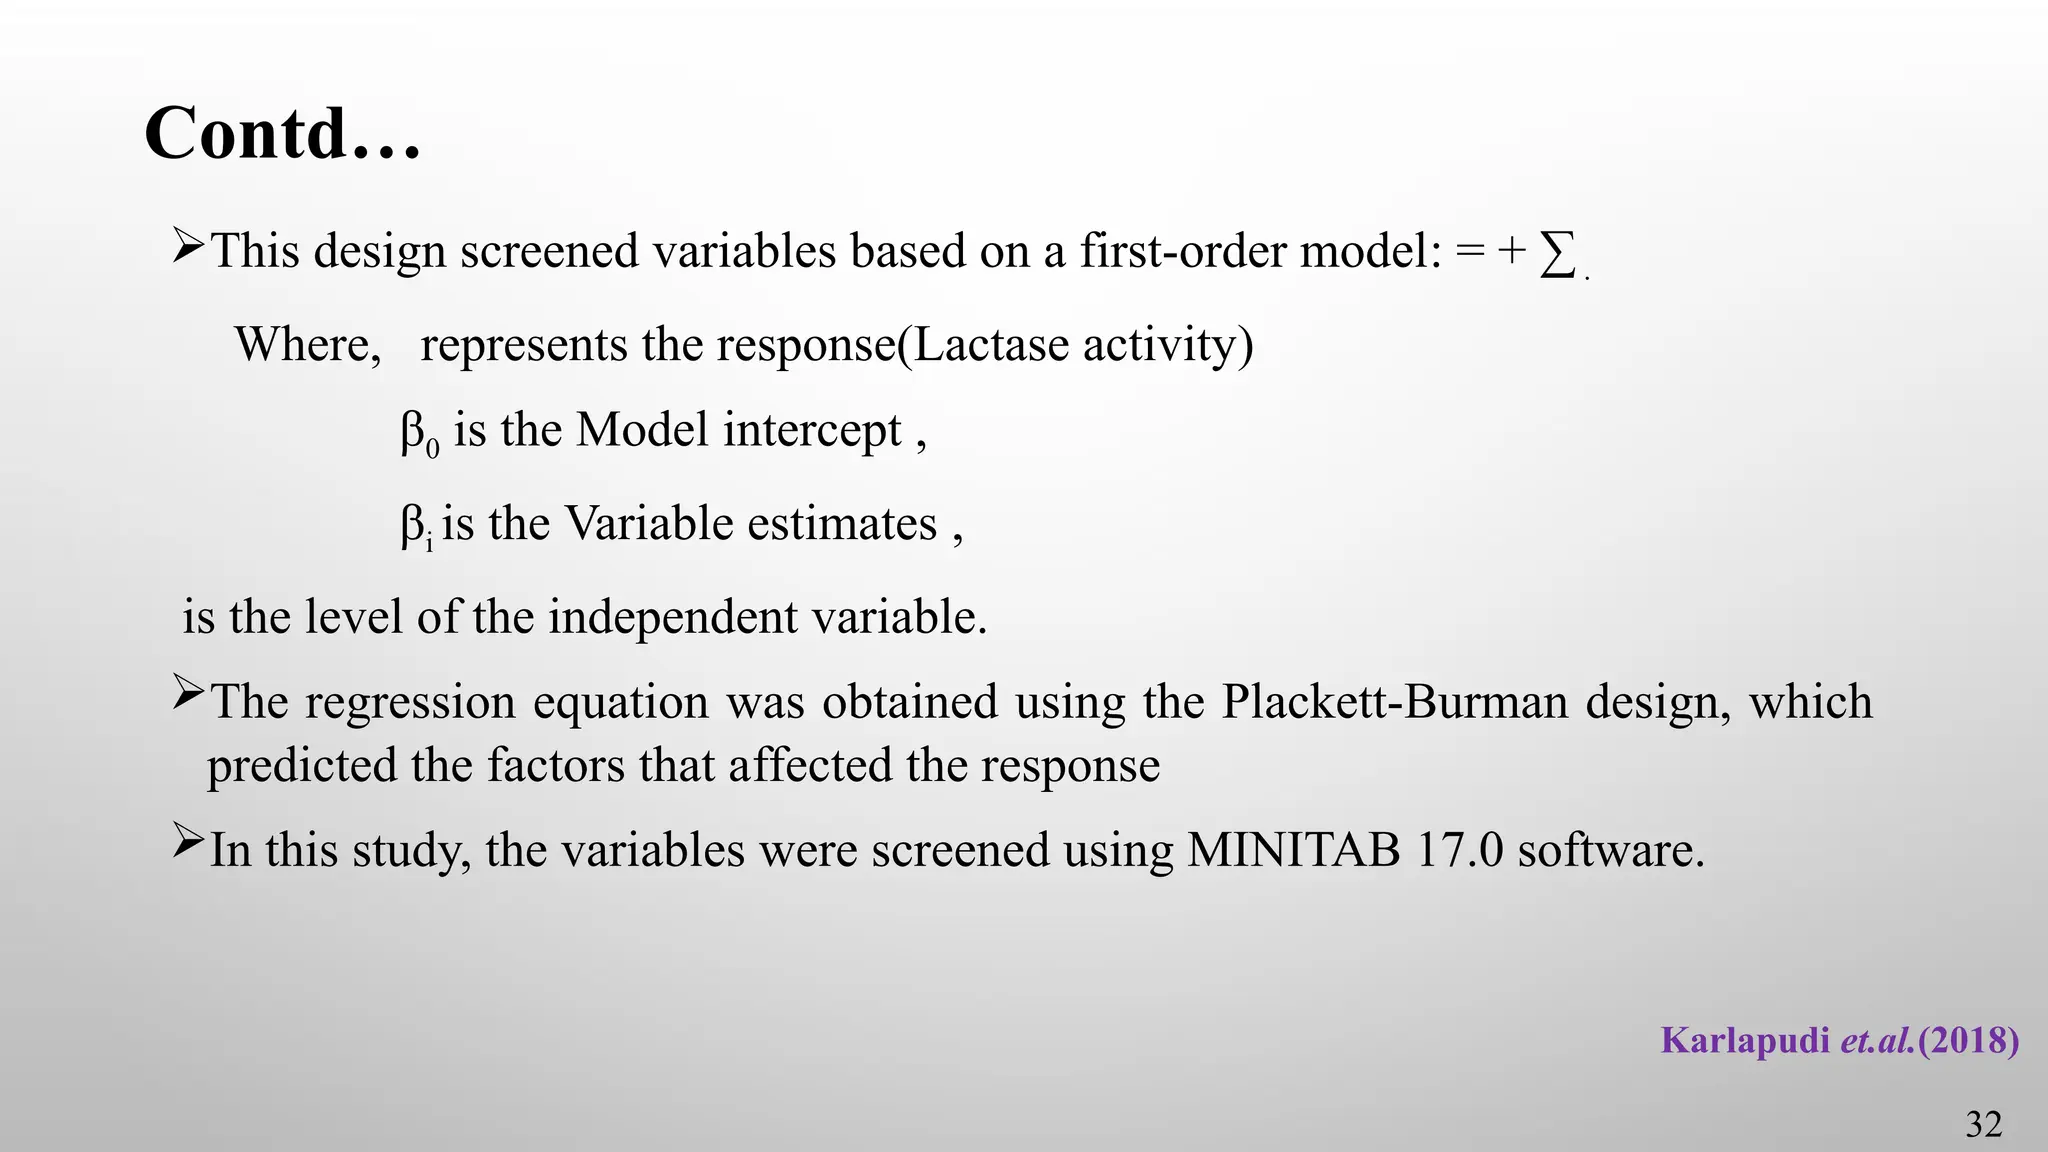
This design screenedvariables based on a first-order model: = + ∑.
Where, represents the response(Lactase activity)
β0 is the Model intercept ,
βi is the Variable estimates ,
is the level of the independent variable.
The regression equation was obtained using the Plackett-Burman design, which
predicted the factors that affected the response
In this study, the variables were screened using MINITAB 17.0 software.
Karlapudi et.al.(2018)
32
33.
33
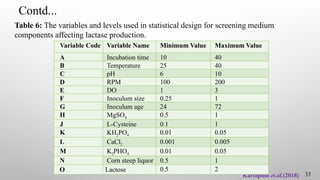
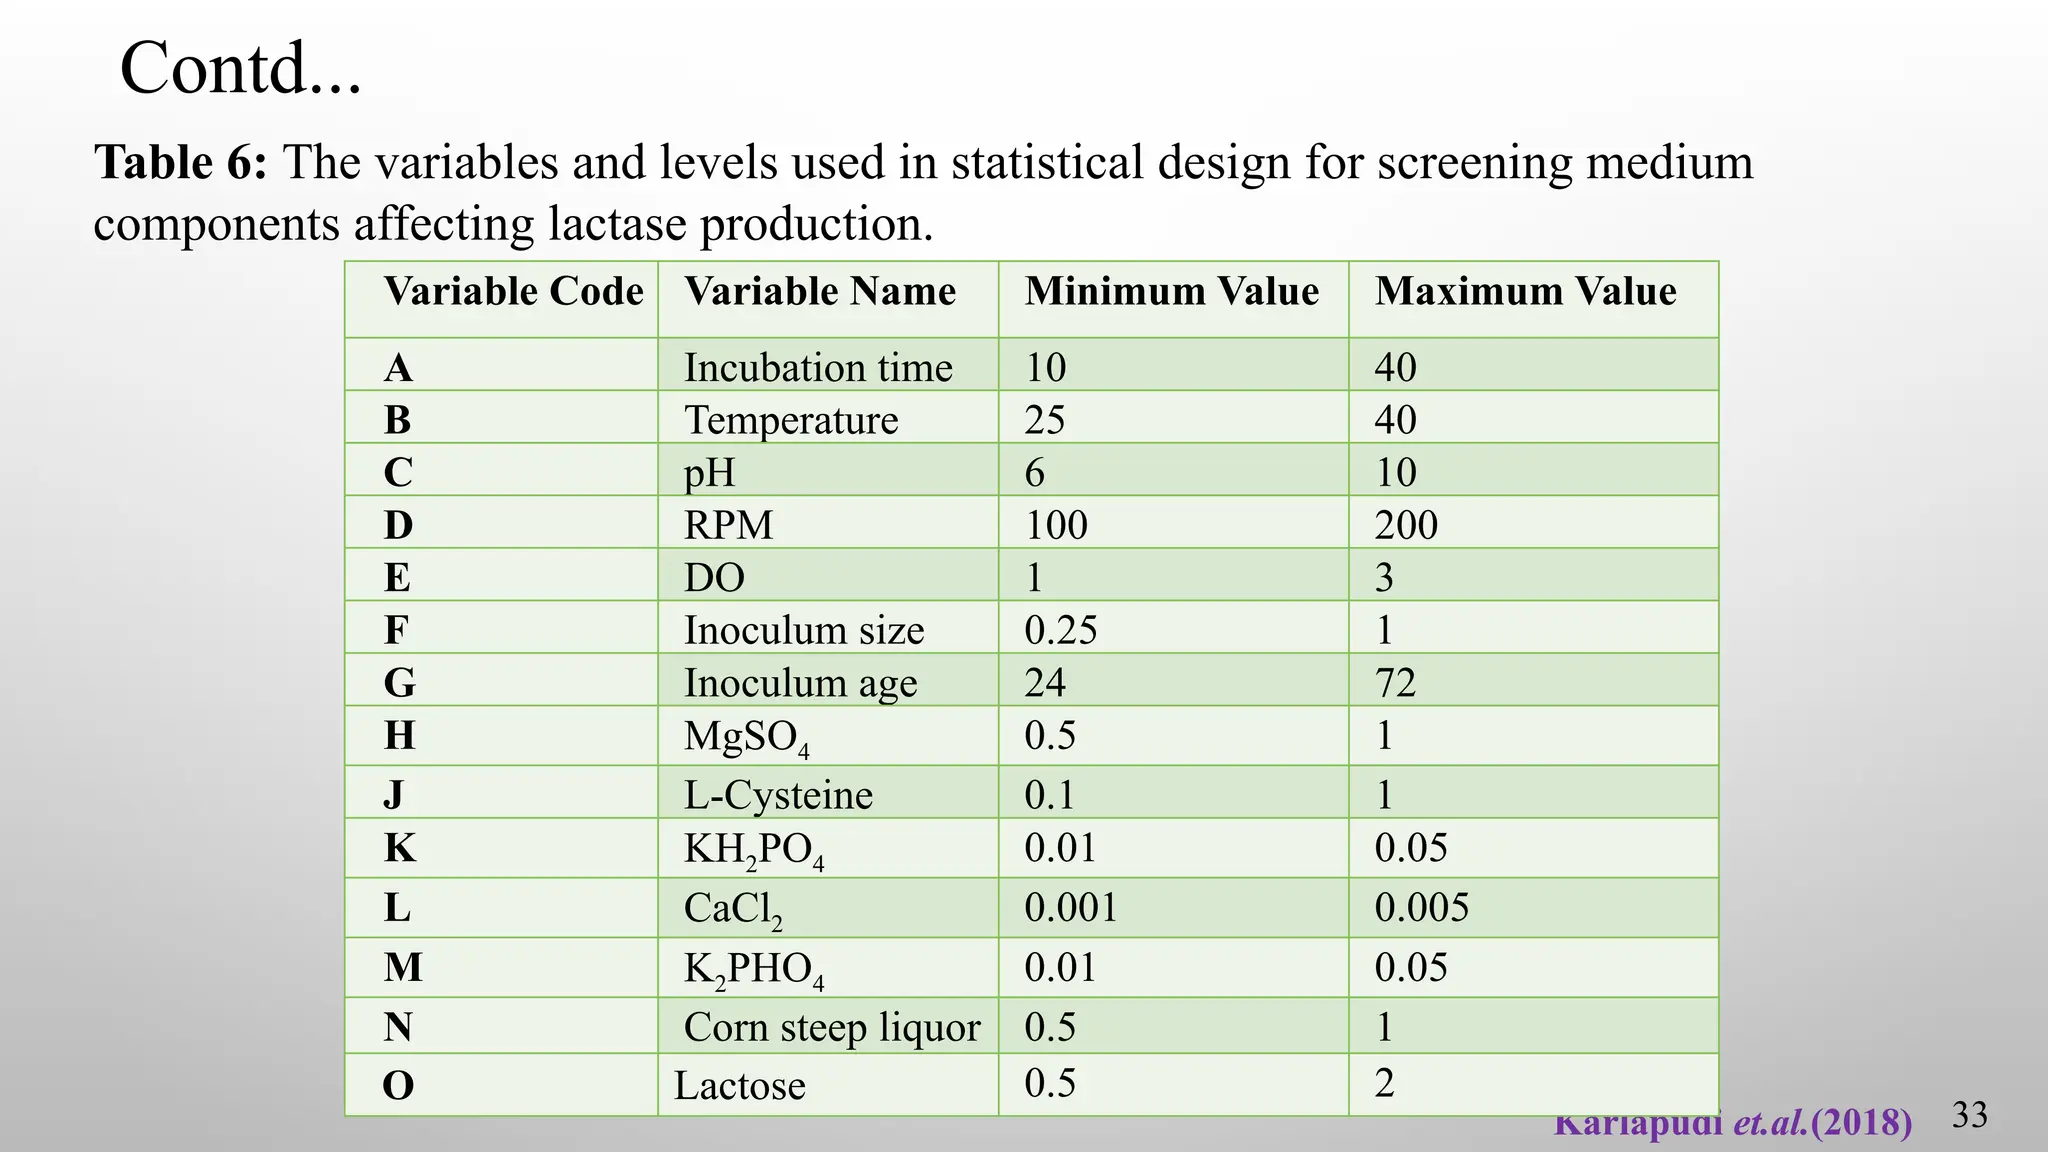
Table 6: Thevariables and levels used in statistical design for screening medium
components affecting lactase production.
Karlapudi et.al.(2018)
Variable Code Variable Name Minimum Value Maximum Value
A Incubation time 10 40
B Temperature 25 40
C pH 6 10
D RPM 100 200
E DO 1 3
F Inoculum size 0.25 1
G Inoculum age 24 72
H MgSO4 0.5 1
J L-Cysteine 0.1 1
K KH2PO4 0.01 0.05
L CaCl2 0.001 0.005
M K2PHO4 0.01 0.05
N Corn steep liquor 0.5 1
O Lactose 0.5 2
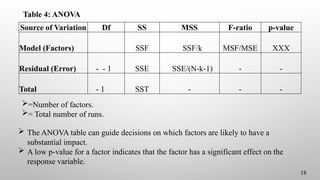
Contd...
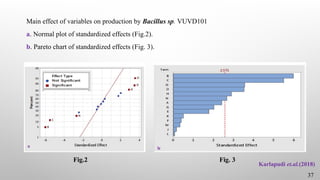
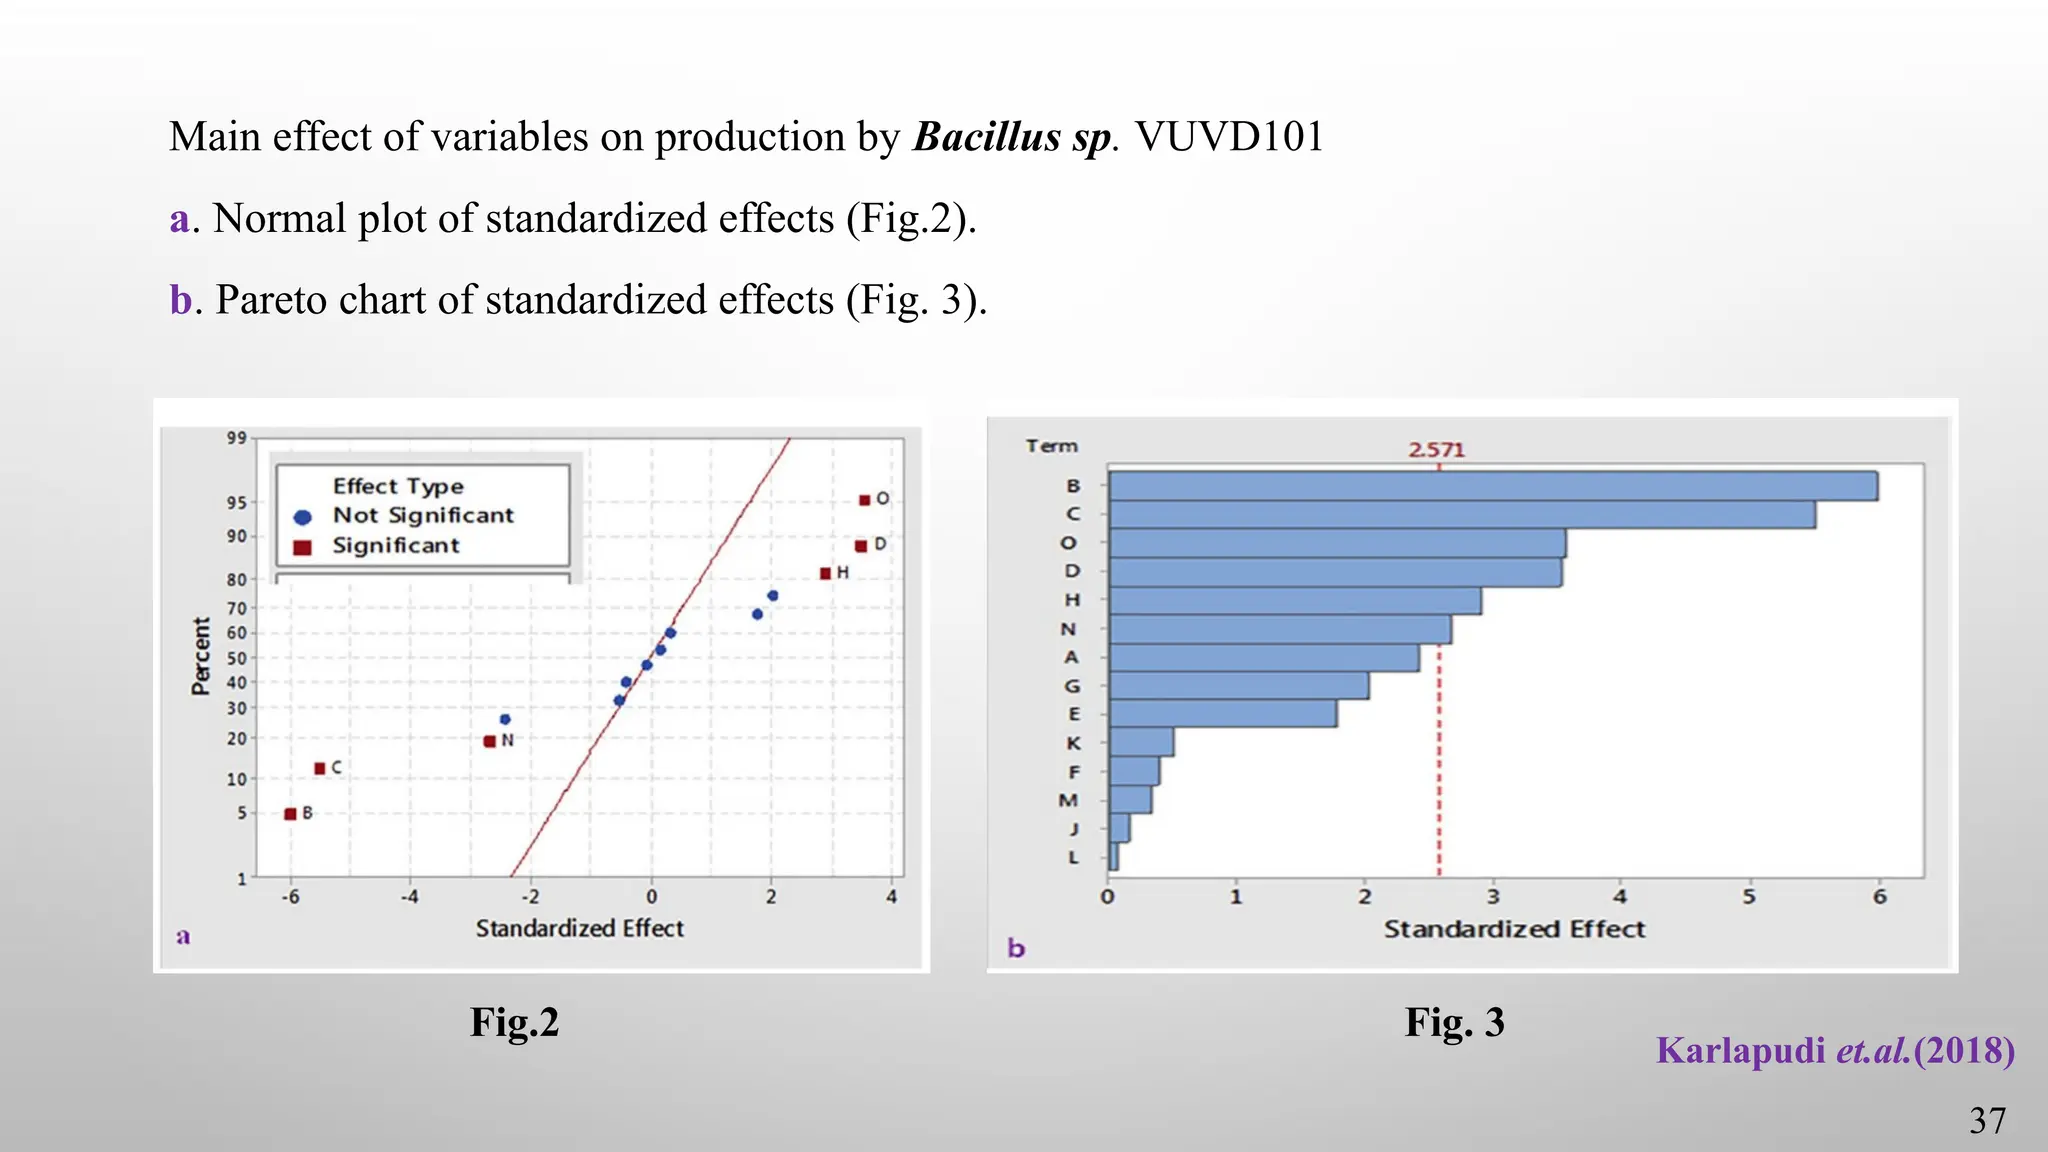
Main effect ofvariables on production by Bacillus sp. VUVD101
a. Normal plot of standardized effects (Fig.2).
b. Pareto chart of standardized effects (Fig. 3).
37
Karlapudi et.al.(2018)
Fig.2 Fig. 3
38.
CONCLUSION
This study hadled to the isolation of bacterium, Bacillus sp. VUVD101 strain
with high activity for lactose hydrolysis.
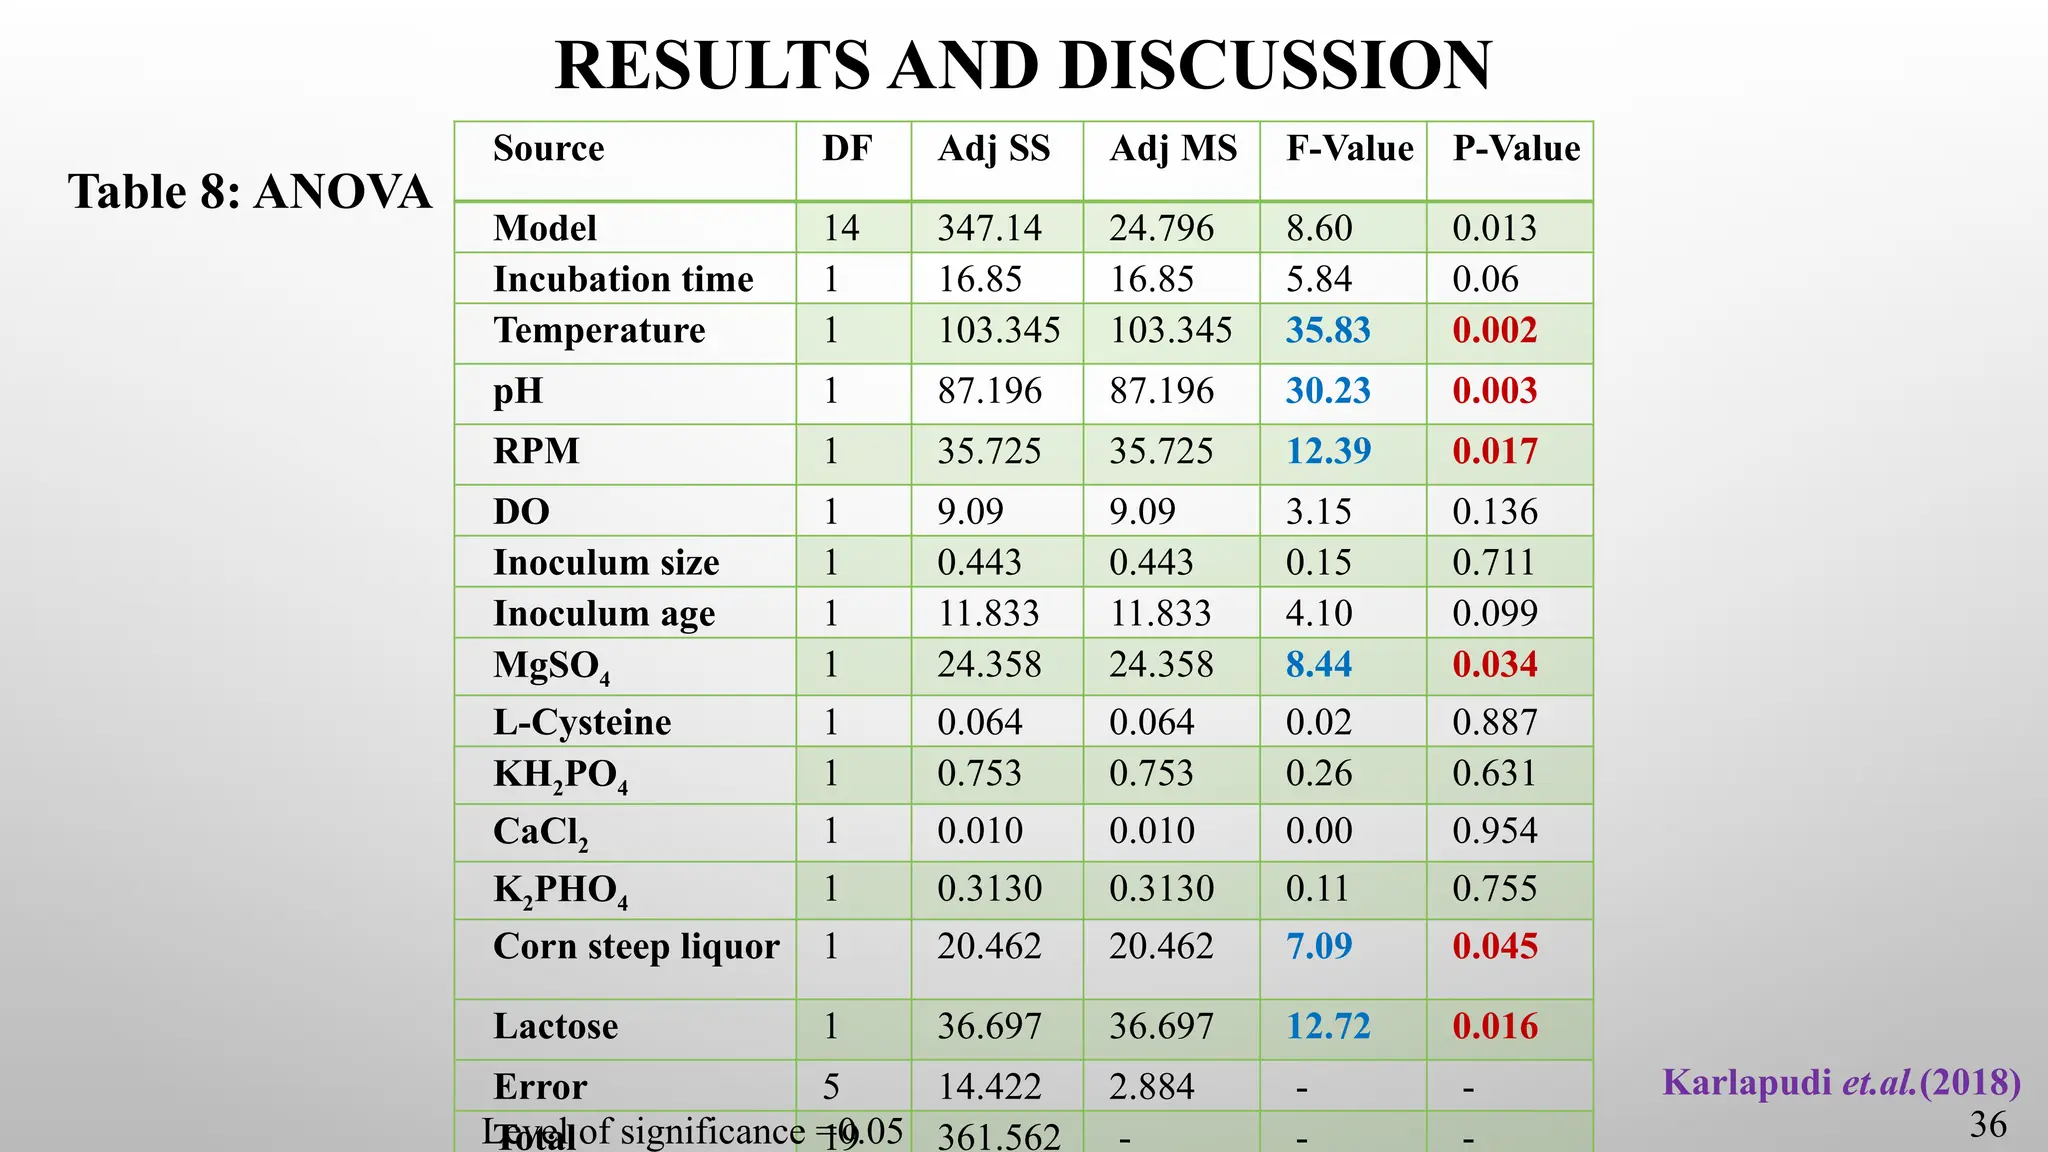
The components namely temperature, pH, RPM,MgSo4, Corn steep liquor and
lactose were found to be highly significant to achieve the maximum production
of lactose (18.31U/ml).
These results revealed that the isolated bacterium could be used as a good source
for industrial production of lactase.
38
Karlapudi et.al.(2018)
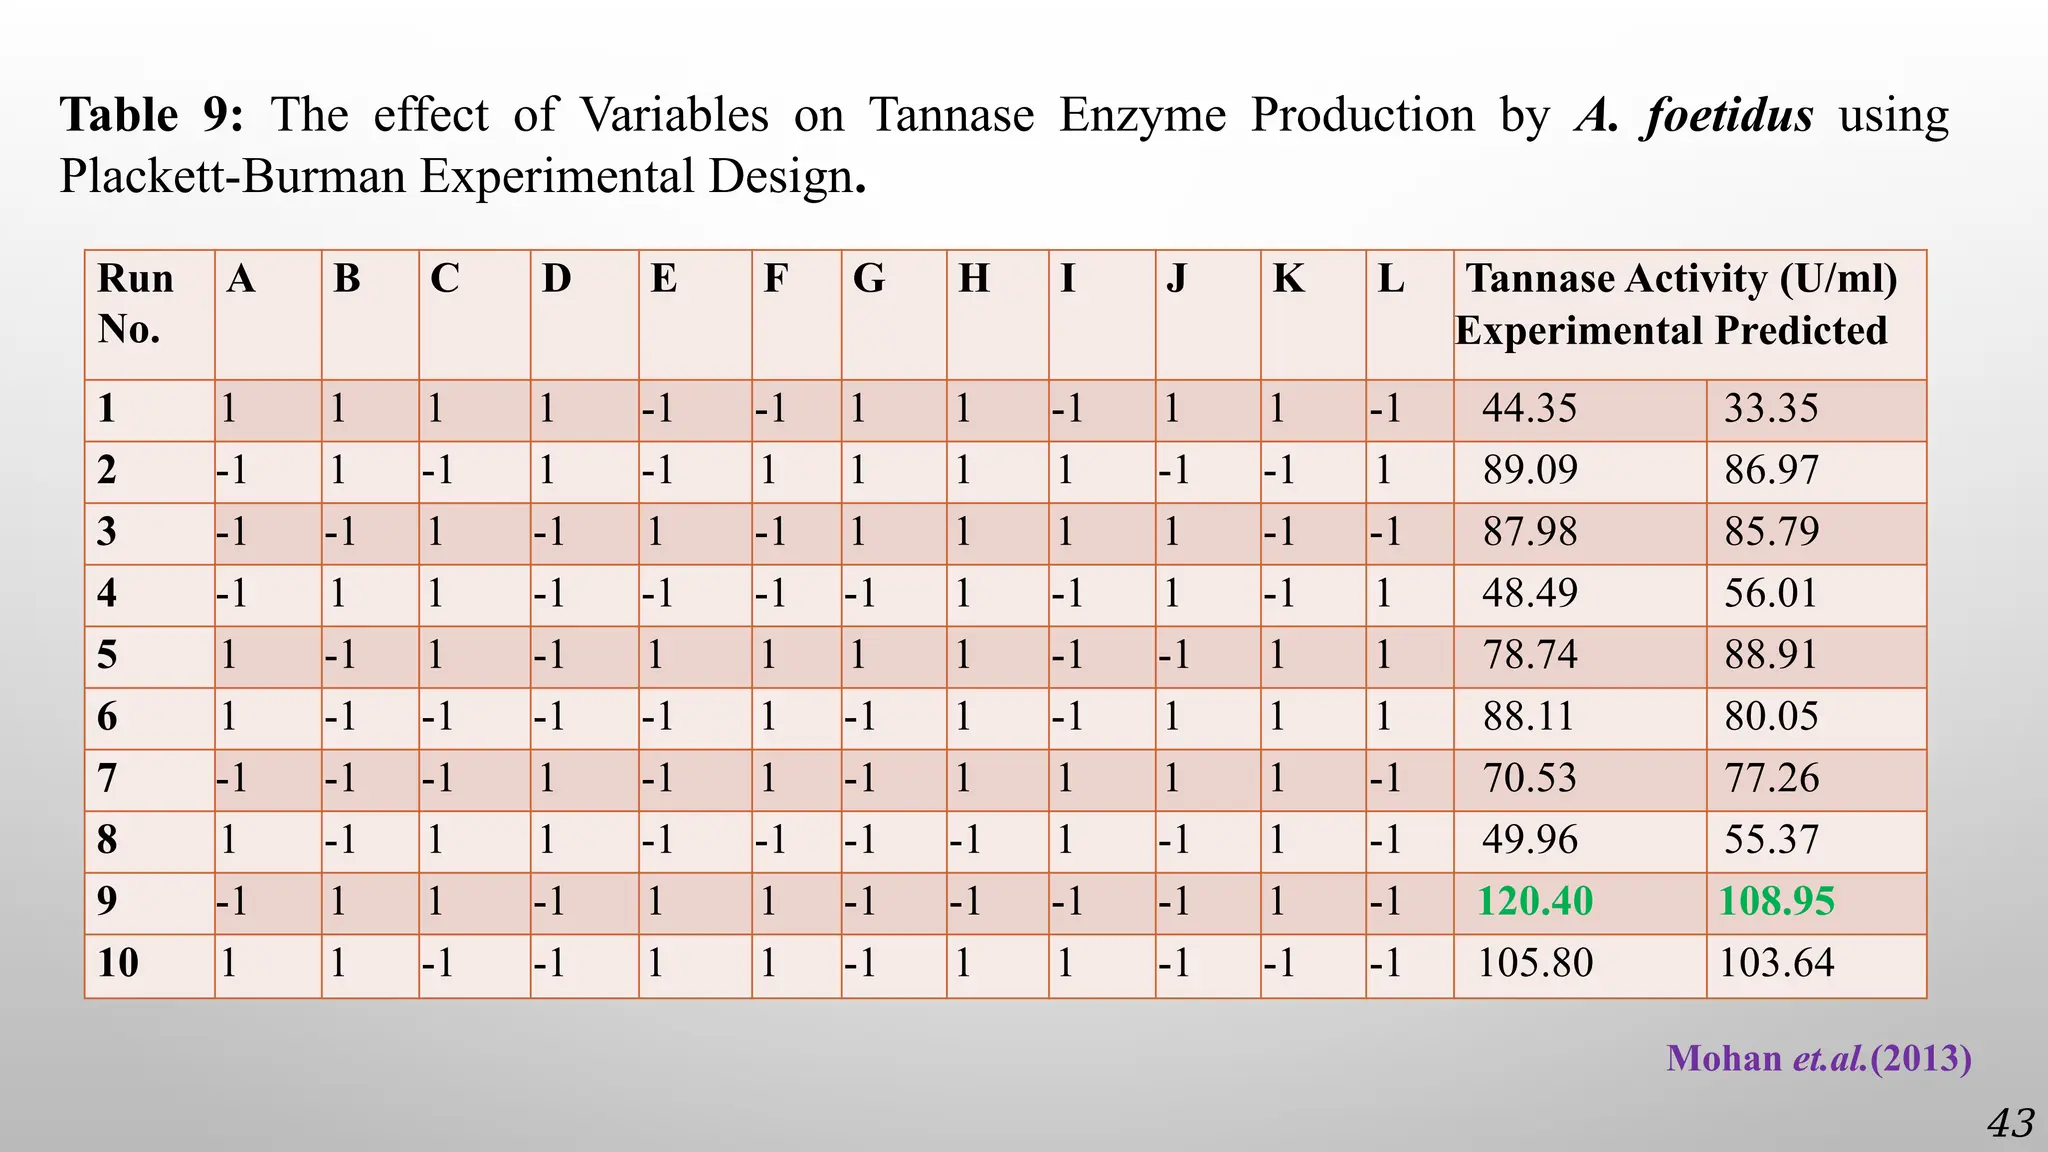
This study focuson application of Plackett-Burman Design for screening the
media components for tannase production from red gram husk using submerged
fermentation.
Objective:
To identify which ingredients of medium have significant effect on tannase
enzyme production.
Mohan et.al.(2013)
40
41.
Contd…
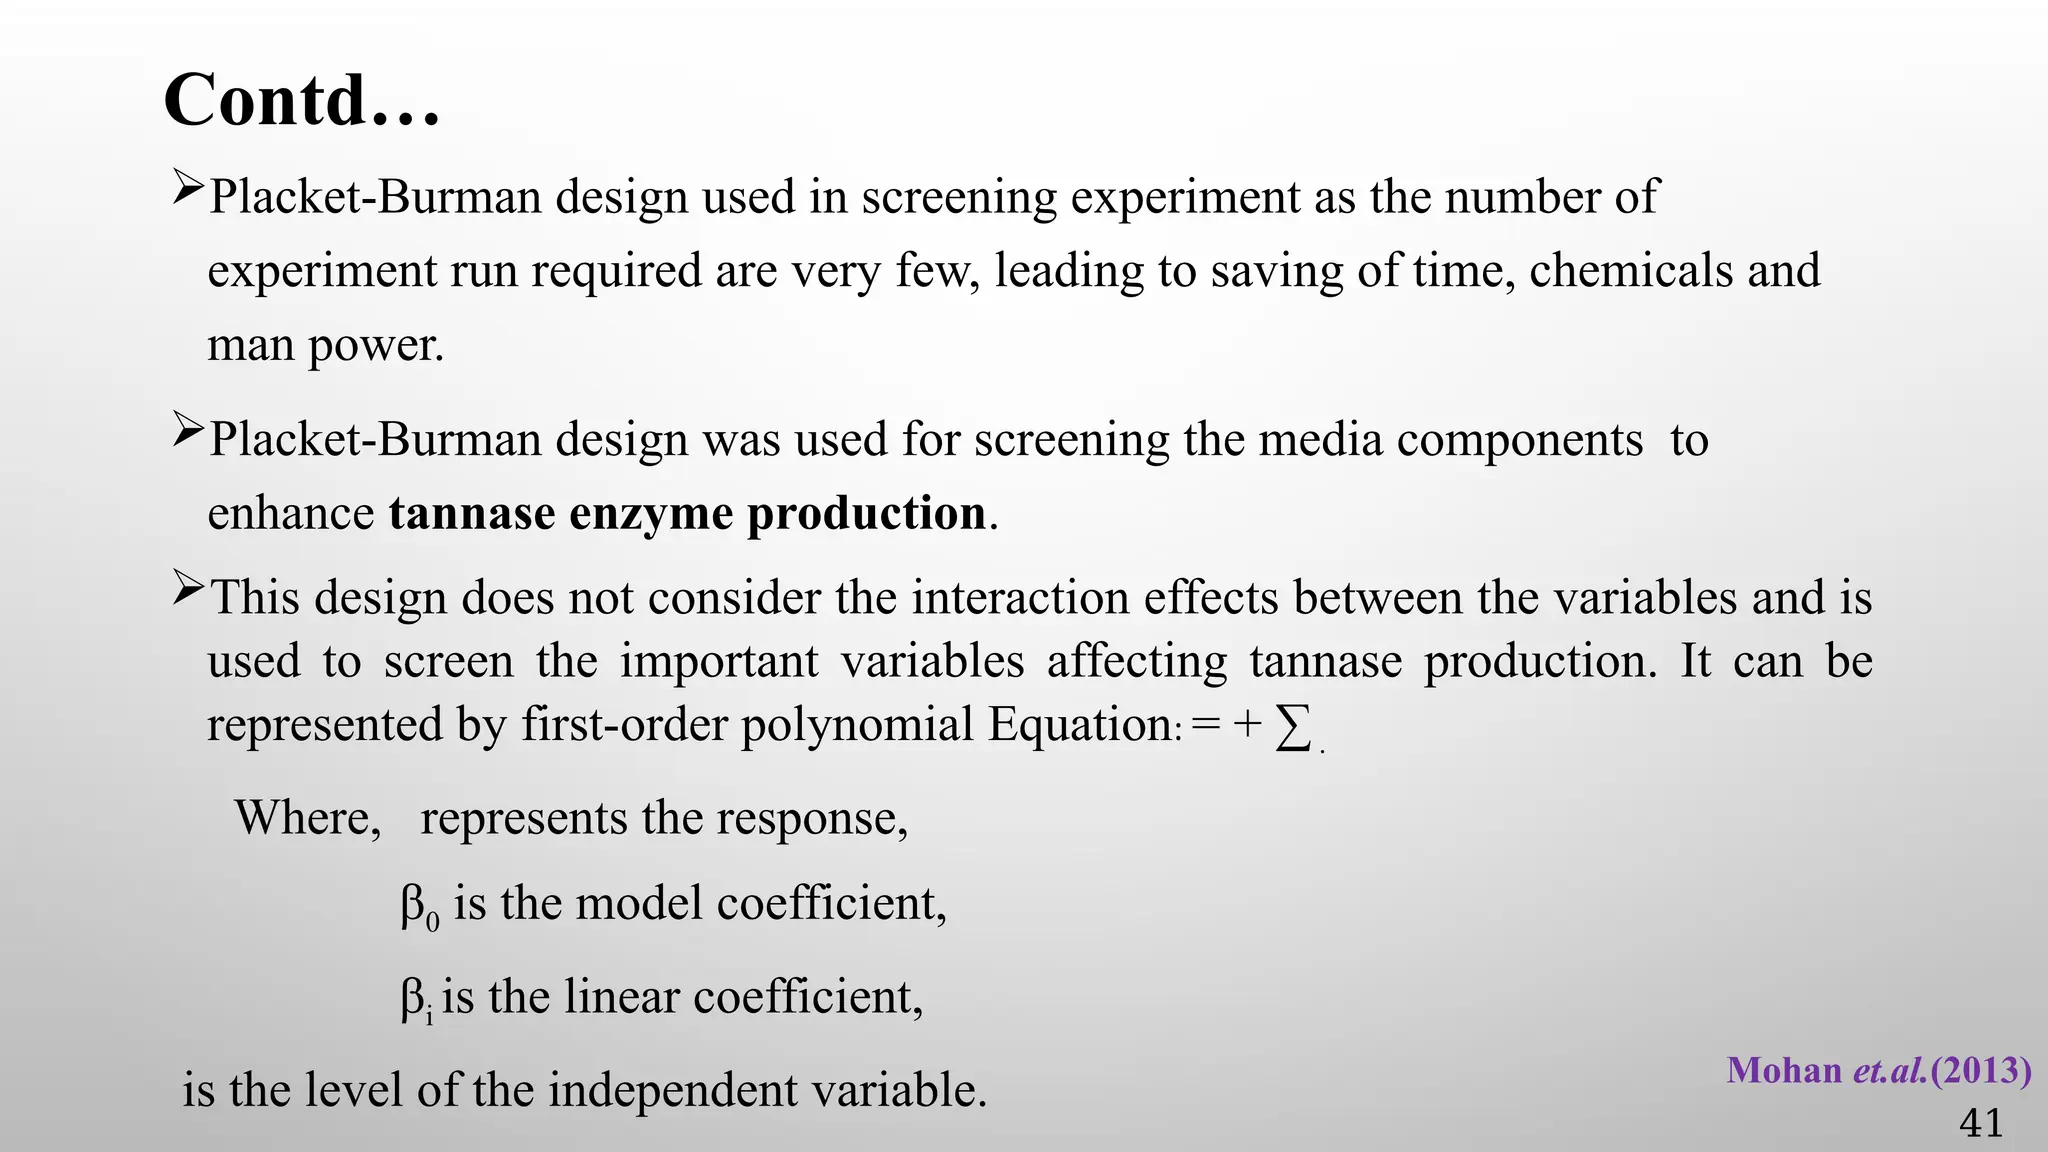
Placket-Burman design usedin screening experiment as the number of
experiment run required are very few, leading to saving of time, chemicals and
man power.
Placket-Burman design was used for screening the media components to
enhance tannase enzyme production.
This design does not consider the interaction effects between the variables and is
used to screen the important variables affecting tannase production. It can be
represented by first-order polynomial Equation: = + ∑.
Where, represents the response,
β0 is the model coefficient,
βi is the linear coefficient,
is the level of the independent variable. Mohan et.al.(2013)
41
42.
Contd…
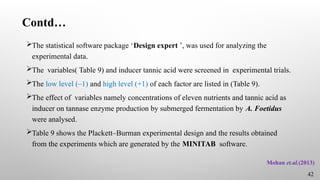
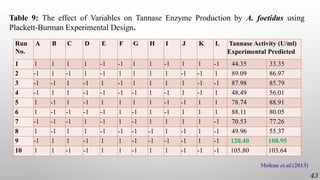
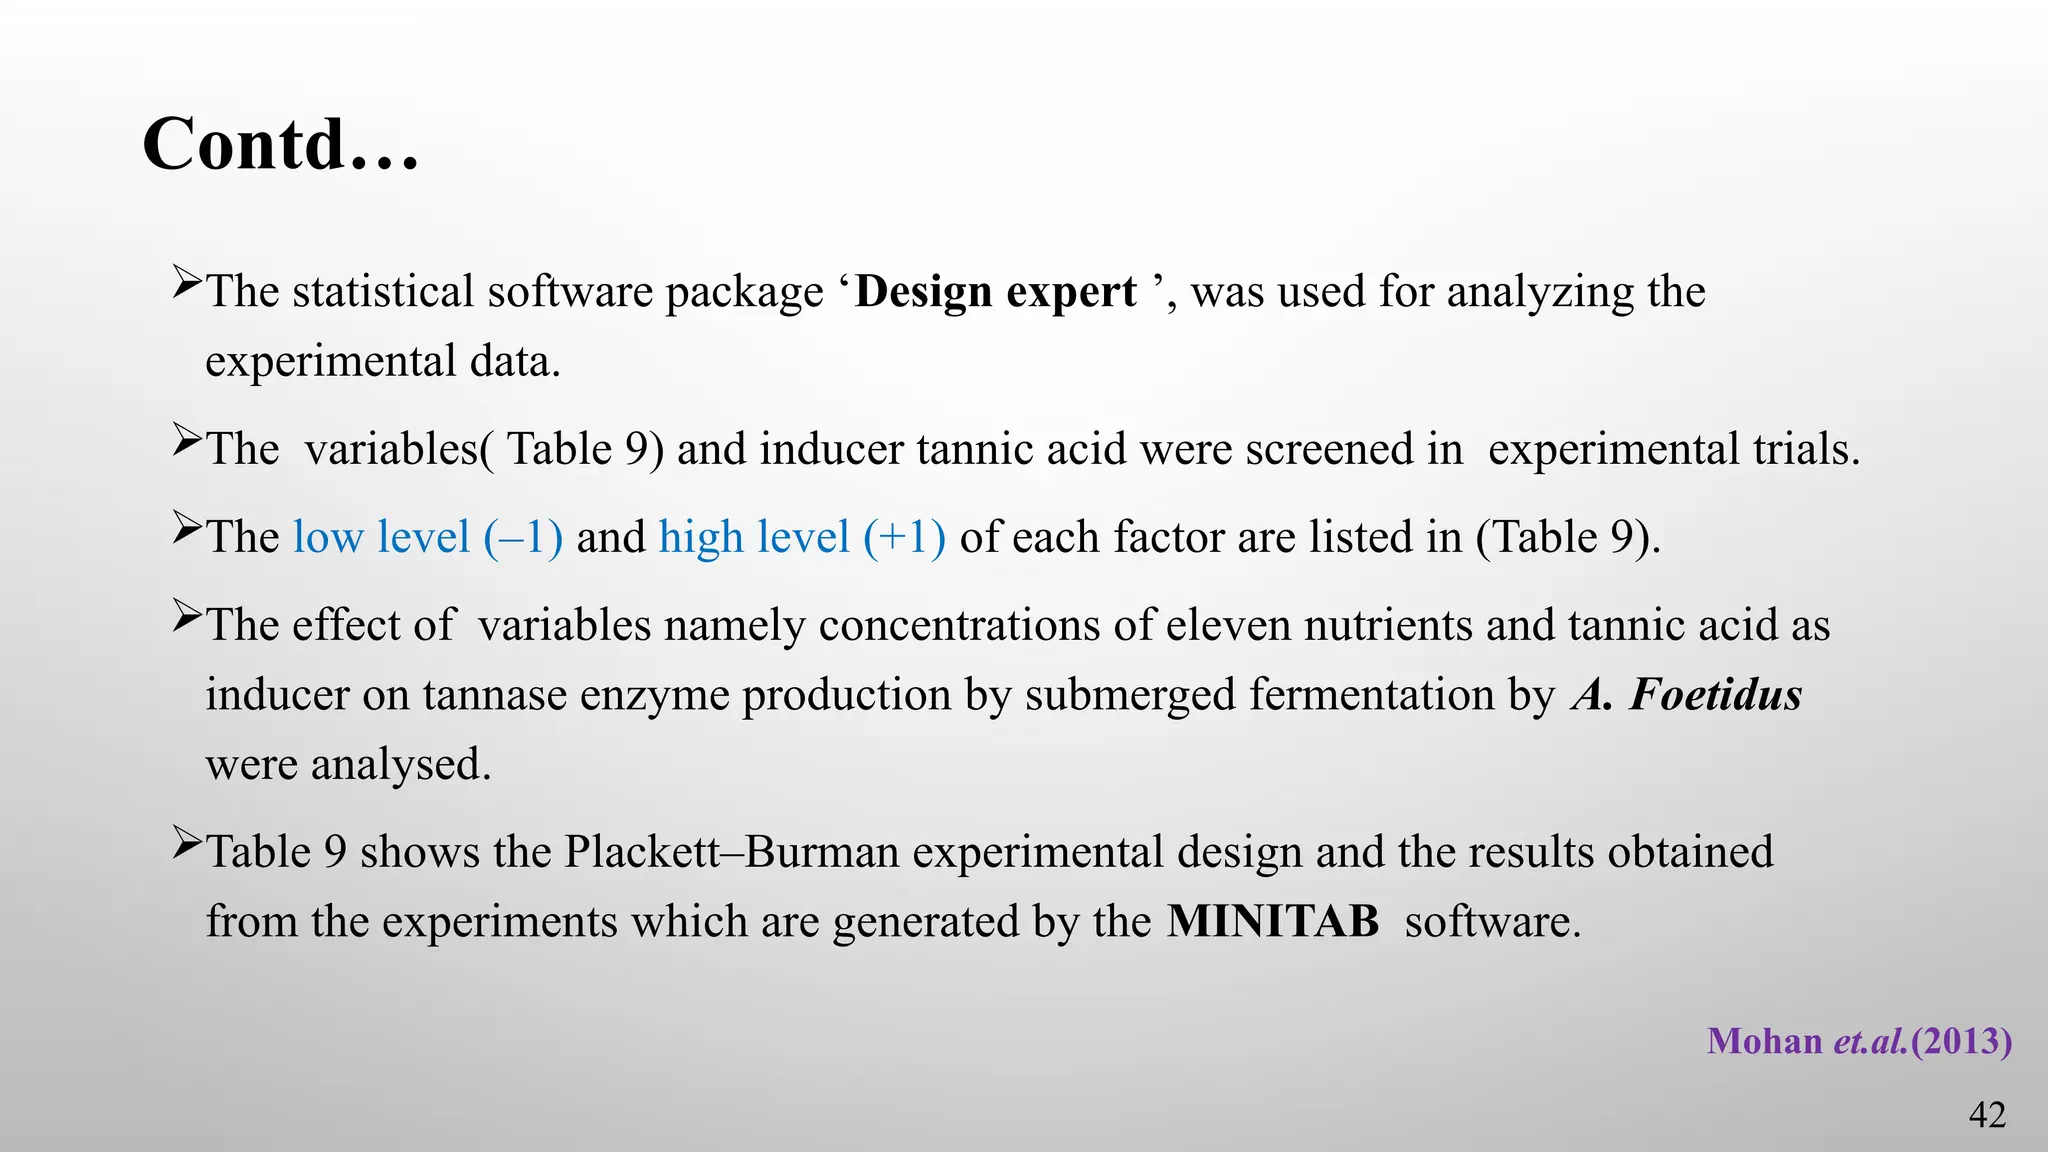
The statistical softwarepackage ‘Design expert ’, was used for analyzing the
experimental data.
The variables( Table 9) and inducer tannic acid were screened in experimental trials.
The low level (–1) and high level (+1) of each factor are listed in (Table 9).
The effect of variables namely concentrations of eleven nutrients and tannic acid as
inducer on tannase enzyme production by submerged fermentation by A. Foetidus
were analysed.
Table 9 shows the Plackett–Burman experimental design and the results obtained
from the experiments which are generated by the MINITAB software.
Mohan et.al.(2013)
42
Contd…
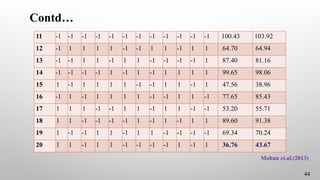
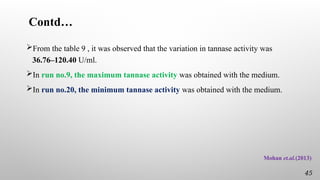
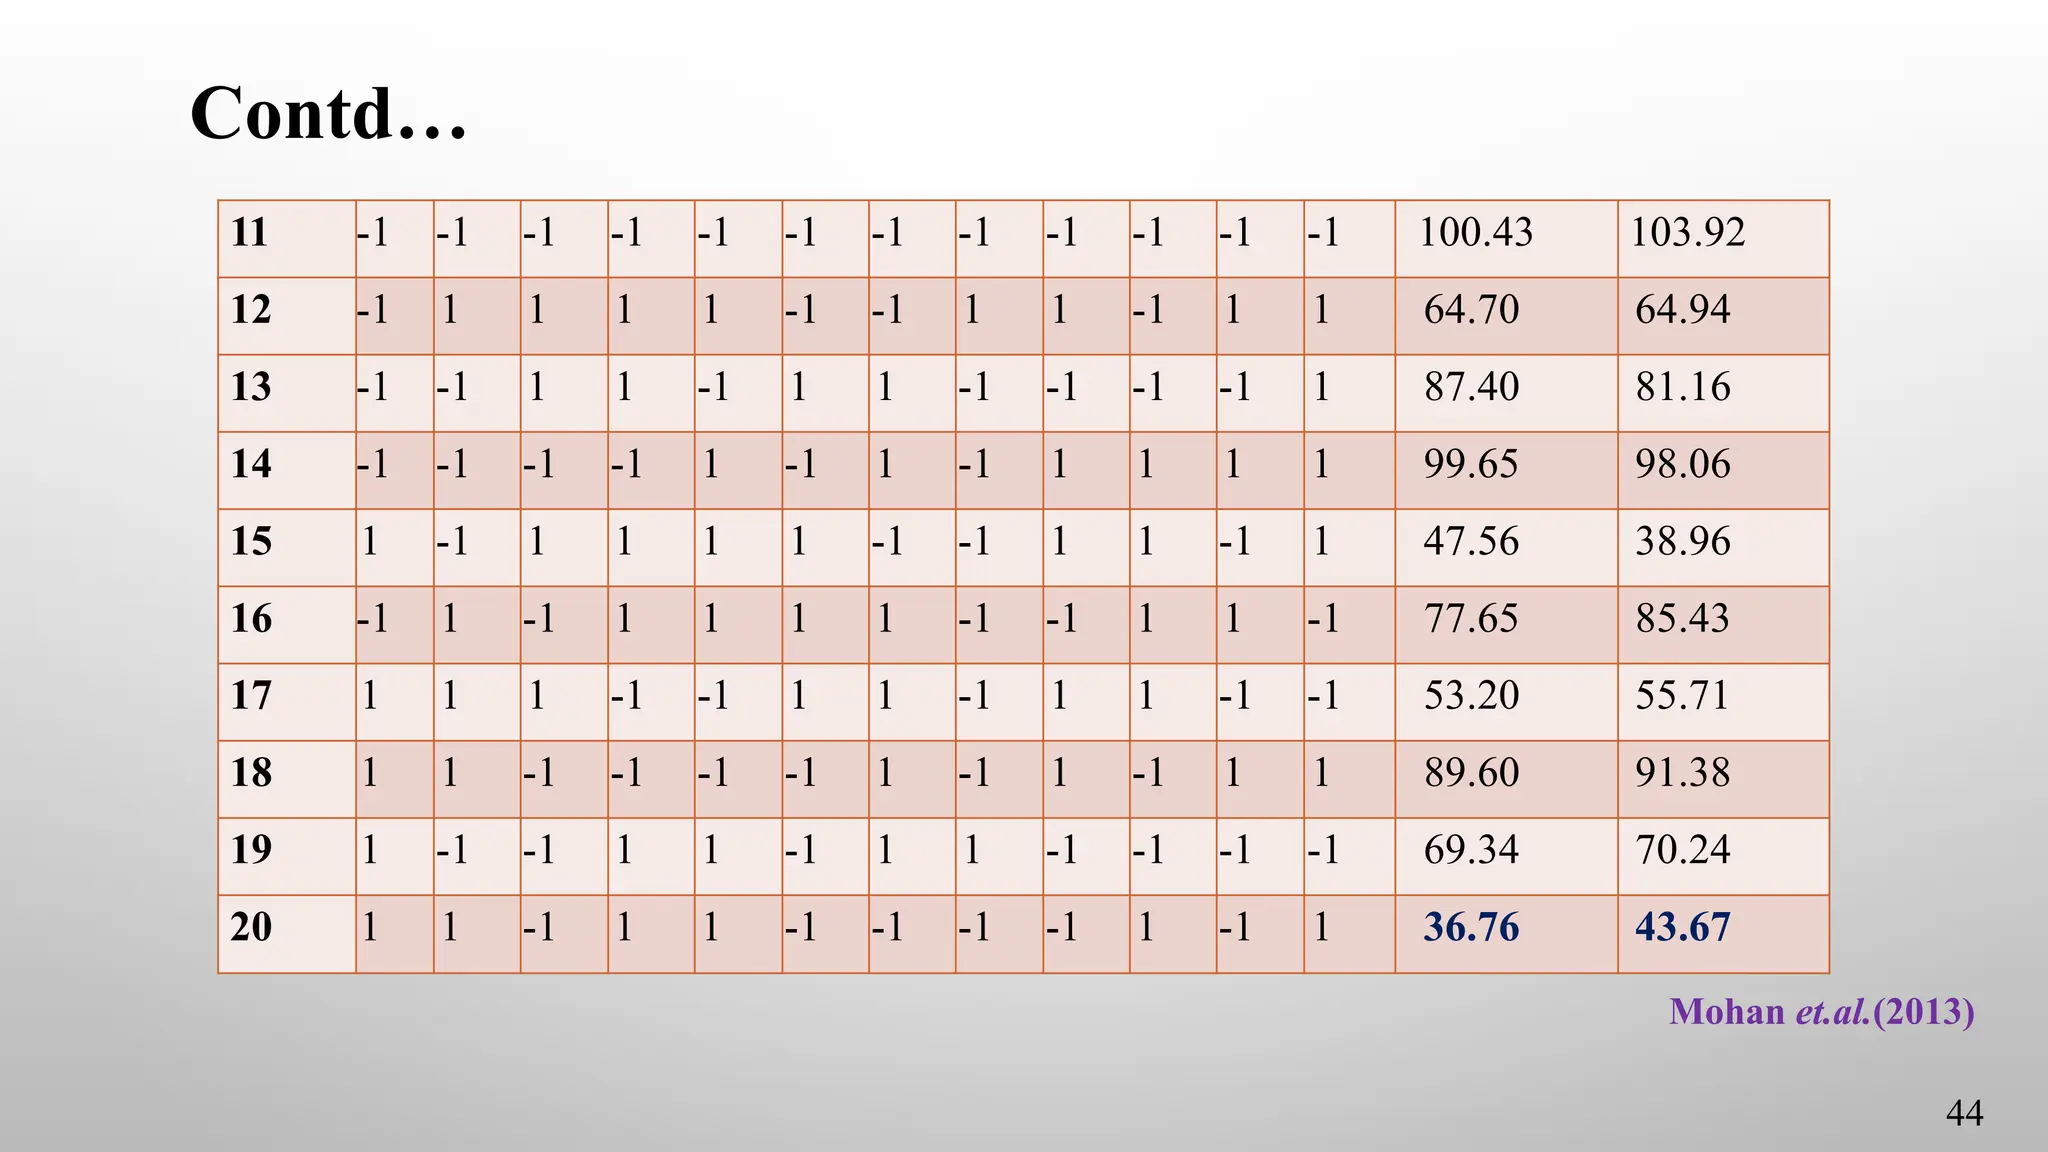
From the table9 , it was observed that the variation in tannase activity was
36.76–120.40 U/ml.
In run no.9, the maximum tannase activity was obtained with the medium.
In run no.20, the minimum tannase activity was obtained with the medium.
Mohan et.al.(2013)
45
46.
Nutrient
Code
Nutrient Minimum
Value
Maximum
Value
t-value p-value
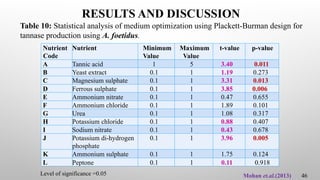
ATannic acid 1 5 3.40 0.011
B Yeast extract 0.1 1 1.19 0.273
C Magnesium sulphate 0.1 1 3.31 0.013
D Ferrous sulphate 0.1 1 3.85 0.006
E Ammonium nitrate 0.1 1 0.47 0.655
F Ammonium chloride 0.1 1 1.89 0.101
G Urea 0.1 1 1.08 0.317
H Potassium chloride 0.1 1 0.88 0.407
I Sodium nitrate 0.1 1 0.43 0.678
J Potassium di-hydrogen
phosphate
0.1 1 3.96 0.005
K Ammonium sulphate 0.1 1 1.75 0.124
L Peptone 0.1 1 0.11 0.918
Mohan et.al.(2013) 46
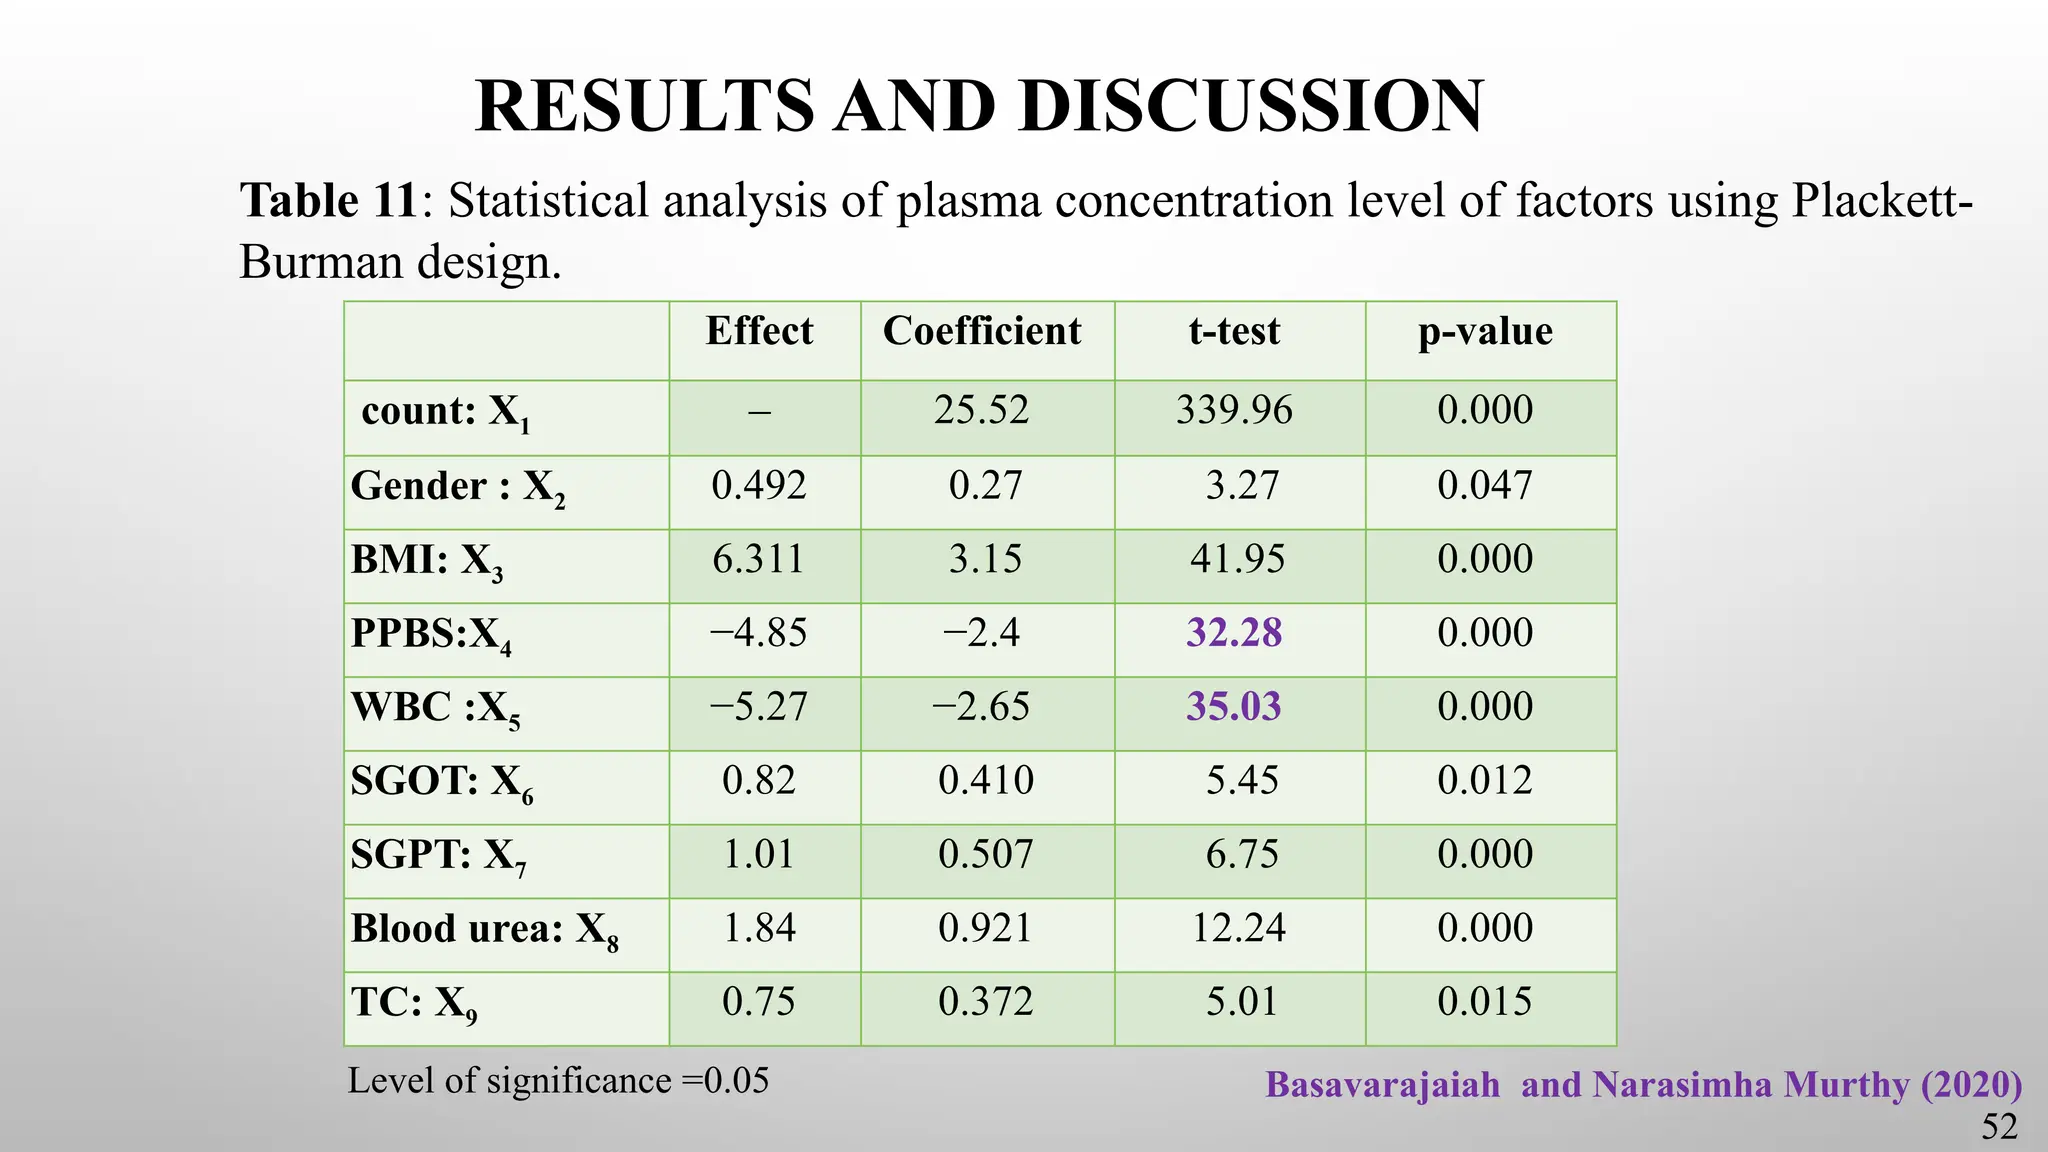
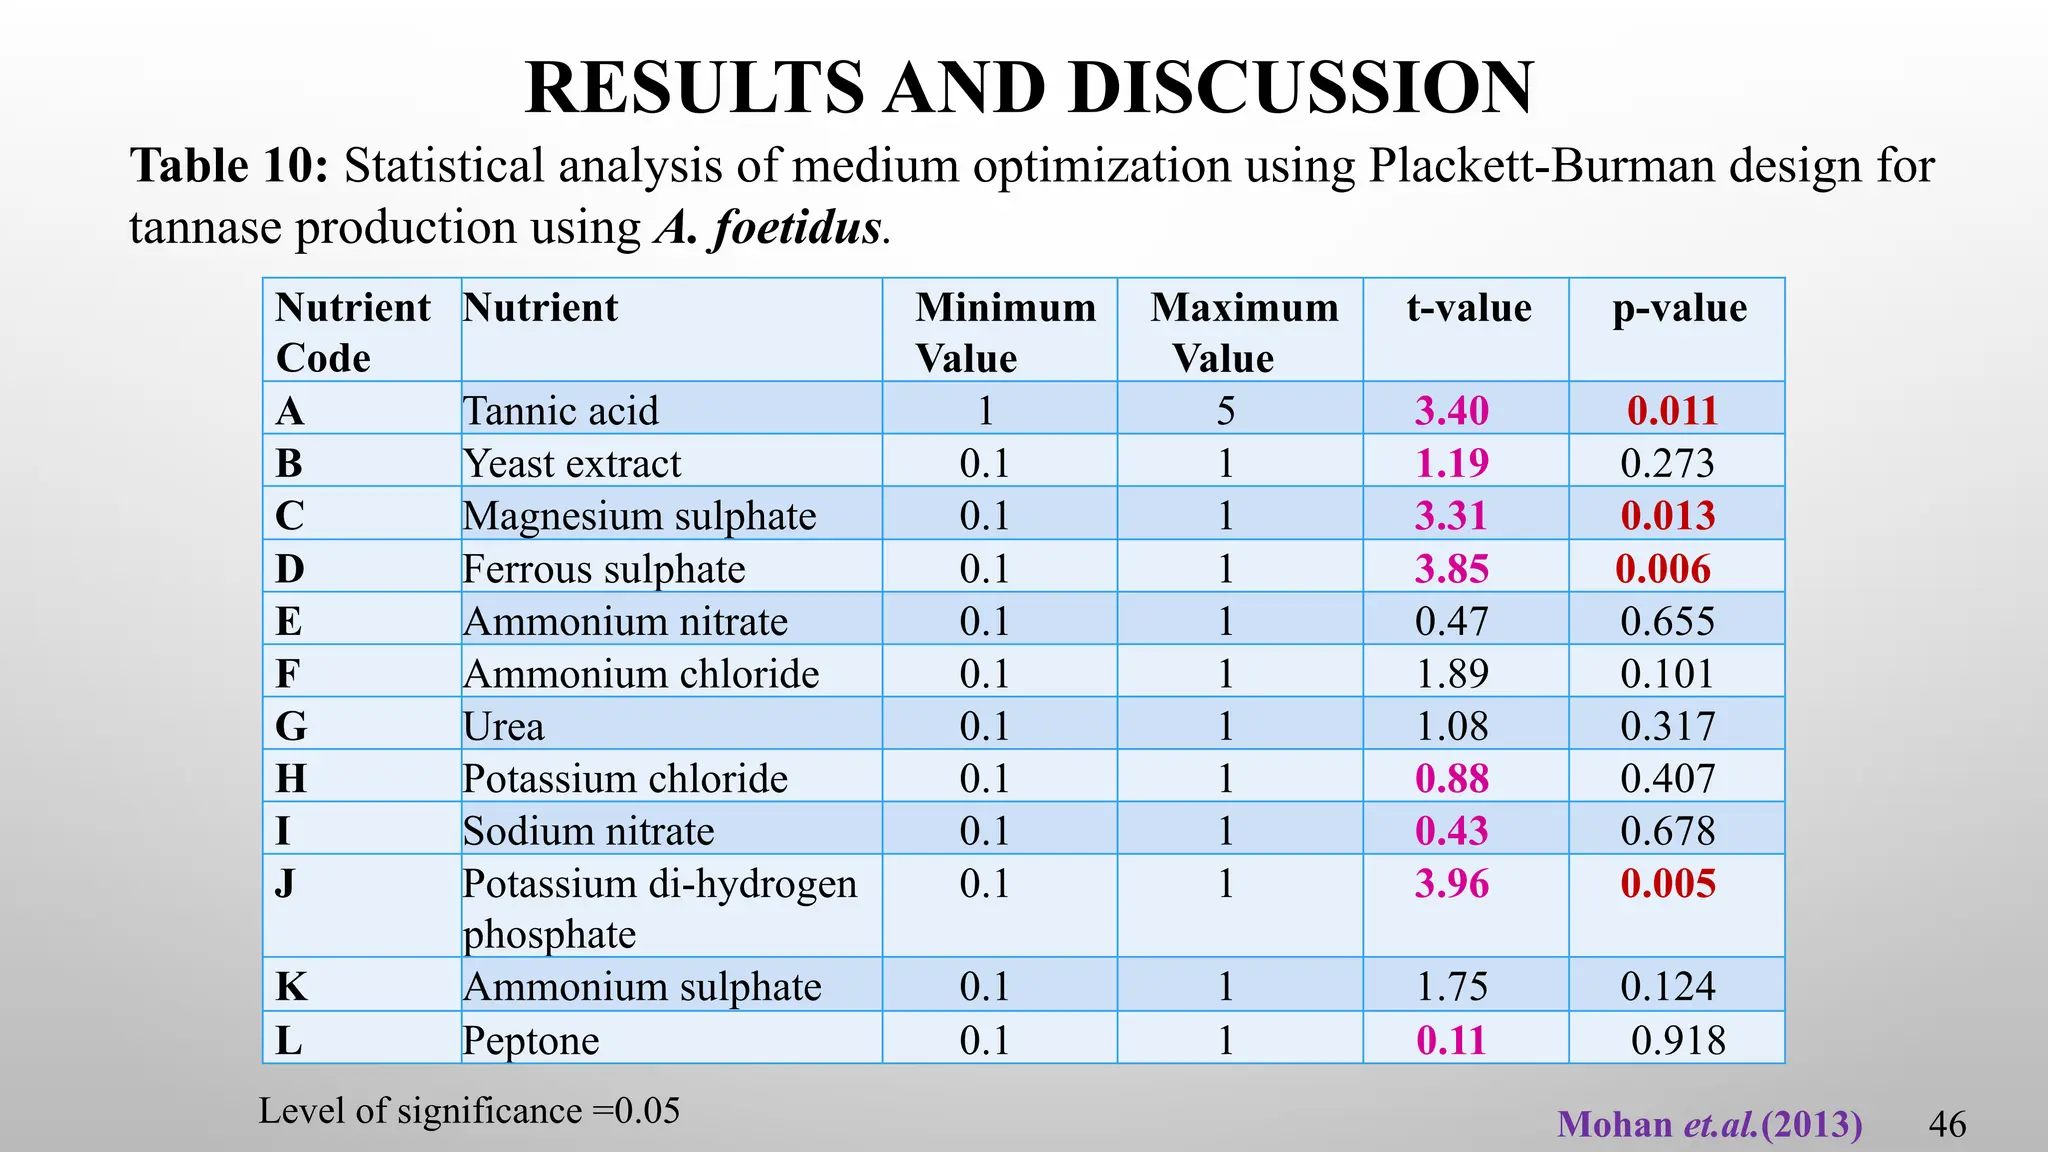
Table 10: Statistical analysis of medium optimization using Plackett-Burman design for
tannase production using A. foetidus.
RESULTS AND DISCUSSION
Level of significance =0.05
47.
Contd…
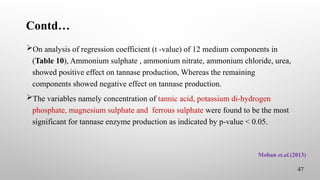
On analysis ofregression coefficient (t -value) of 12 medium components in
(Table 10), Ammonium sulphate , ammonium nitrate, ammonium chloride, urea,
showed positive effect on tannase production, Whereas the remaining
components showed negative effect on tannase production.
The variables namely concentration of tannic acid, potassium di-hydrogen
phosphate, magnesium sulphate and ferrous sulphate were found to be the most
significant for tannase enzyme production as indicated by p-value < 0.05.
Mohan et.al.(2013)
47
48.
Contd…
Mohan et.al.(2013)
48
’ ‘– ƒ • • ‹ —
‘ ˆ † ‹ Ǧ ǡ
’ Š ‘ • ’ Š ƒ – ‡
Š › † ” ‘ ‰ ‡ ‡ œ › ‡ ’ ” ‘ † — – ‹ ‘
/
,
(
+
*
%
.
)
&
$
'
-
6 W
DQGDUGL
] HG ( IIHFW
The Pareto chart as shown in (Fig.4)
offers a convenient way to view the
results obtained by PBD and the order of
significance of the variable affecting
tannase production.
Fig. 4
Pareto plot for Plackett-Burman Design of experiments for tannase production using
A. foetidus.
49.
CONCLUSION
The plackett-burman designwas effectively applied for screening of nutrients for
the production of tannase from aspergillus foetidus (MTCC3557) using redgram
husk as a substrate in submerged fermentation.
From standard plackett-burman data analysis it was conformed that,
concentration of tannic acid, concentration of potassium di-hydrogen phosphate,
concentration of magnesium sulphate and concentration of ferrous sulphate were
found to be the most significant for tannase enzyme production.
Mohan et.al.(2013)
49
50.
CASE STUDY 3
PBDassociated with Response Surface design.
Basavarajaiah and Narasimha Murthy (2020)
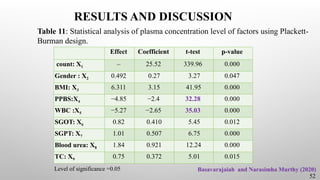
51.
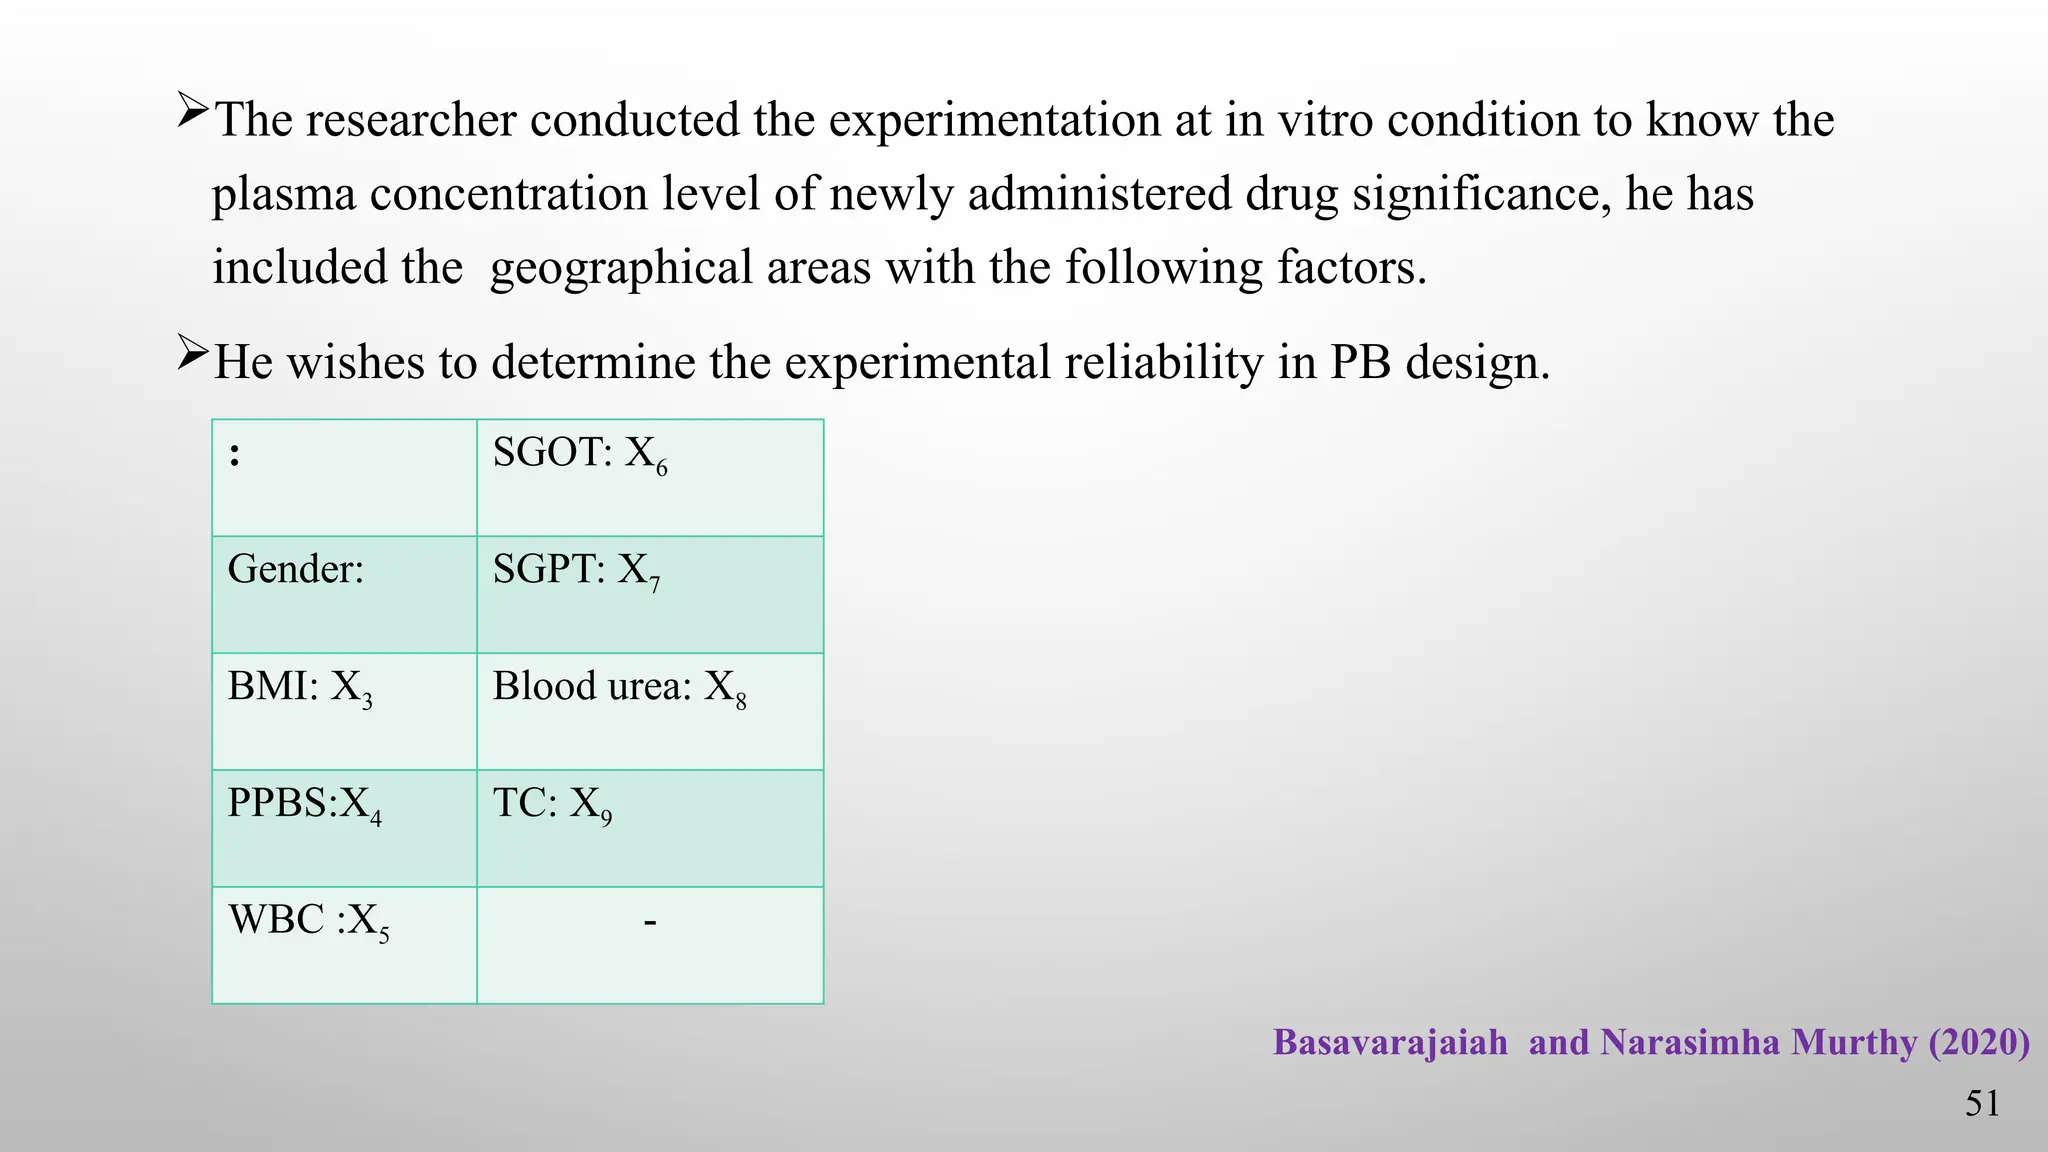
The researcher conductedthe experimentation at in vitro condition to know the
plasma concentration level of newly administered drug significance, he has
included the geographical areas with the following factors.
He wishes to determine the experimental reliability in PB design.
Basavarajaiah and Narasimha Murthy (2020)
51
: SGOT: X6
Gender: SGPT: X7
BMI: X3 Blood urea: X8
PPBS:X4 TC: X9
WBC :X5 -
CONCLUSION
The data wasanalyzed by PBD, further he has tested the variables by using response
surface design(in which variables are highly significant in response to the treatment)
The PBD is well suited for massive data sets of life threatening diseases(HIV,
Cancer, other neurological disorders) if the patient repeatedly undervent treatment
with periodically change of hematological parameters and biochemical parameters.
53
Basavarajaiah and Narasimha Murthy (2020)
54.
SUMMARY
Plackett-Burman design isa statistical technique used to identify important factors
that affect a process.
It is a type of screening design that allows researchers to efficiently explore a large
number of factors with a small number of experimental runs.
This seminar provides valuable insights into PBD and their construction,
methodologies and emphasizing their significance in screening most important
factors.
54
55.
Contd…
Additionally, three casestudies are presented: one focuses on screening of process
components and their effects on production of lactase, while second case study
involves screening the media components for tannase production from red gram
husk and third case study presence the plasma concentration level of newly
administered drug significance.
It is a great tool for optimizing processes and reducing costs in various fields,
including manufacturing and agriculture.
55
56.
REFERENCES
ABRAHAM, P. KARLAPUDI,KRUPANIDHI, S., ERVA, R., M. INDIRA, MD.
N. BOBBY, AND VEKATESWARULU, T.C., 2018, Plackett-Burman design
for screening of process components and their effects on production of lactase
by newly isolated Bacillus sp. VUVD101 strain from Dairy effluent. Beni-Suef
univ. j. basic appl. Sci.,7:543-546.
BASAVARAJAIAH, D. M. AND BHAMIDIPATI NARASIMHA MURTHY ,
2020 Design of experiments and advanced statistical techniques in clinical
research. Elsevier, pp.117-120.
56
57.
Contd…
GEORGE, E. P.BOX, J. STUART HUNTER AND WILLIAM, G. HUNTER, 2015,
Statistics for experimenters design, innovation and discovery John Wiley &
Sons,Inc., Hoboken, New Jersey, pp.281-282.
JOHN LAWSON, 2015, Design and analysis of experiments with R. Taylor &
Francis Group, New York,pp.231-232.
JOHANNES LEDOLTER AND ARTHUR J. SWERSEY, 2007, Testing 1–2–3
experimental design with applications in marketing and service operations.
Stanford University Press, Stanford, California, pp.150.
57
58.
Contd…
58
MONTGOMERY, D.C., 2012,Design and analysis of experiments. John Wiley &
Sons,Inc., Hoboken, New Jersey, pp.351-357.
MOHAN, S. K., VIRUTHAGIRI, T. AND ARUNKUMAR, C., 2013, Application
of plackett-burman design for screening the media components for tannase
production from redgram husk using submerged fermentation. Int. J. Pharma
res. Rev.,2(9):24-29.
PETER F. STANBURY, ALLAN WHITAKER, AND STEPHEN J. HALL, 2013,
Principles of fermentation technology. Elsevier, pp.110-112.


![Contd…
Seven main effects and their aliases may be estimated from these data, the effects
and their aliases are
[A]=20.63 A+BD+CE+FG
[B]=38.38 B+AD+CF+EG
[C]=-0.28 C+AE+BF+DG
[D]=28.88 D+AB+CG+EF
[E]=-0.28 E+AC+BG+DF
[F]=0.63 F+BC+AG+DE
[G]=-2.43 G+CD+BE+AF
Douglas C. Montgomery (2012)
21](https://image.slidesharecdn.com/nandiniseminarfinal-251017165444-08697f27/85/Placket-Burman-Design-PPT-Design-of-Experiments-21-320.jpg)

![Contd…
#use PB12Des to create PB12 design matrix
castf <- PB12Des[c(11,10,9,8,7,6,5,4,3,2,1)]
#assign the response values
y <- c(4.733, 4.625, 5.899, 7.0, 5.752, 5.682, 6.607, 5.818, 5.917, 5.863, 6.058, 4.809)
#combind the response values and factors
castf1 <- cbind( castf, y )
#the lm function was used to estimate the coefficients for each of the 11 columns
modpb <- lm( y ~ (.), data = castf1 )
23
John Lawson (2015)](https://image.slidesharecdn.com/nandiniseminarfinal-251017165444-08697f27/85/Placket-Burman-Design-PPT-Design-of-Experiments-23-320.jpg)
![Contd…
# package daewr was used to create the
half-normal plot of effects.
library(daewr)
cfs <- coef(modpb)[2:12]
names<-names(cfs)
halfnorm(cfs, names, alpha = .35, refline=FALSE) Fig.1
John Lawson (2015)
24](https://image.slidesharecdn.com/nandiniseminarfinal-251017165444-08697f27/85/Placket-Burman-Design-PPT-Design-of-Experiments-24-320.jpg)


![Contd…
Mohan et.al.(2013)
48
’ ‘ – ƒ • • ‹ —
‘ ˆ † ‹ Ǧ ǡ
’ Š ‘ • ’ Š ƒ – ‡
Š › † ” ‘ ‰ ‡ ‡ œ › ‡ ’ ” ‘ † — – ‹ ‘
/
,
(
+
*
%
.
)
&
$
'
-
6 W
DQGDUGL
] HG ( IIHFW
The Pareto chart as shown in (Fig.4)
offers a convenient way to view the
results obtained by PBD and the order of
significance of the variable affecting
tannase production.
Fig. 4
Pareto plot for Plackett-Burman Design of experiments for tannase production using
A. foetidus.](https://image.slidesharecdn.com/nandiniseminarfinal-251017165444-08697f27/85/Placket-Burman-Design-PPT-Design-of-Experiments-48-320.jpg)


![Contd…
Seven main effects and their aliases may be estimated from these data, the effects
and their aliases are
[A]=20.63 A+BD+CE+FG
[B]=38.38 B+AD+CF+EG
[C]=-0.28 C+AE+BF+DG
[D]=28.88 D+AB+CG+EF
[E]=-0.28 E+AC+BG+DF
[F]=0.63 F+BC+AG+DE
[G]=-2.43 G+CD+BE+AF
Douglas C. Montgomery (2012)
21](https://image.slidesharecdn.com/nandiniseminarfinal-251017165444-08697f27/75/Placket-Burman-Design-PPT-Design-of-Experiments-21-2048.jpg)
![Contd…
#use PB12Des to create PB12 design matrix
castf <- PB12Des[c(11,10,9,8,7,6,5,4,3,2,1)]
#assign the response values
y <- c(4.733, 4.625, 5.899, 7.0, 5.752, 5.682, 6.607, 5.818, 5.917, 5.863, 6.058, 4.809)
#combind the response values and factors
castf1 <- cbind( castf, y )
#the lm function was used to estimate the coefficients for each of the 11 columns
modpb <- lm( y ~ (.), data = castf1 )
23
John Lawson (2015)](https://image.slidesharecdn.com/nandiniseminarfinal-251017165444-08697f27/75/Placket-Burman-Design-PPT-Design-of-Experiments-23-2048.jpg)
![Contd…
# package daewr was used to create the
half-normal plot of effects.
library(daewr)
cfs <- coef(modpb)[2:12]
names<-names(cfs)
halfnorm(cfs, names, alpha = .35, refline=FALSE) Fig.1
John Lawson (2015)
24](https://image.slidesharecdn.com/nandiniseminarfinal-251017165444-08697f27/75/Placket-Burman-Design-PPT-Design-of-Experiments-24-2048.jpg)


![Contd…
Mohan et.al.(2013)
48
’ ‘ – ƒ • • ‹ —
‘ ˆ † ‹ Ǧ ǡ
’ Š ‘ • ’ Š ƒ – ‡
Š › † ” ‘ ‰ ‡ ‡ œ › ‡ ’ ” ‘ † — – ‹ ‘
/
,
(
+
*
%
.
)
&
$
'
-
6 W
DQGDUGL
] HG ( IIHFW
The Pareto chart as shown in (Fig.4)
offers a convenient way to view the
results obtained by PBD and the order of
significance of the variable affecting
tannase production.
Fig. 4
Pareto plot for Plackett-Burman Design of experiments for tannase production using
A. foetidus.](https://image.slidesharecdn.com/nandiniseminarfinal-251017165444-08697f27/75/Placket-Burman-Design-PPT-Design-of-Experiments-48-2048.jpg)