Download to read offline


![A Look Under The Hood
[software system demo]](https://image.slidesharecdn.com/pptguscsteam2ametroproject-160910125705/85/Ppt-gu-scs-team2_a_metro-project-11-320.jpg)


![A Look Under The Hood
[software system demo]](https://image.slidesharecdn.com/pptguscsteam2ametroproject-160910125705/75/Ppt-gu-scs-team2_a_metro-project-11-2048.jpg)
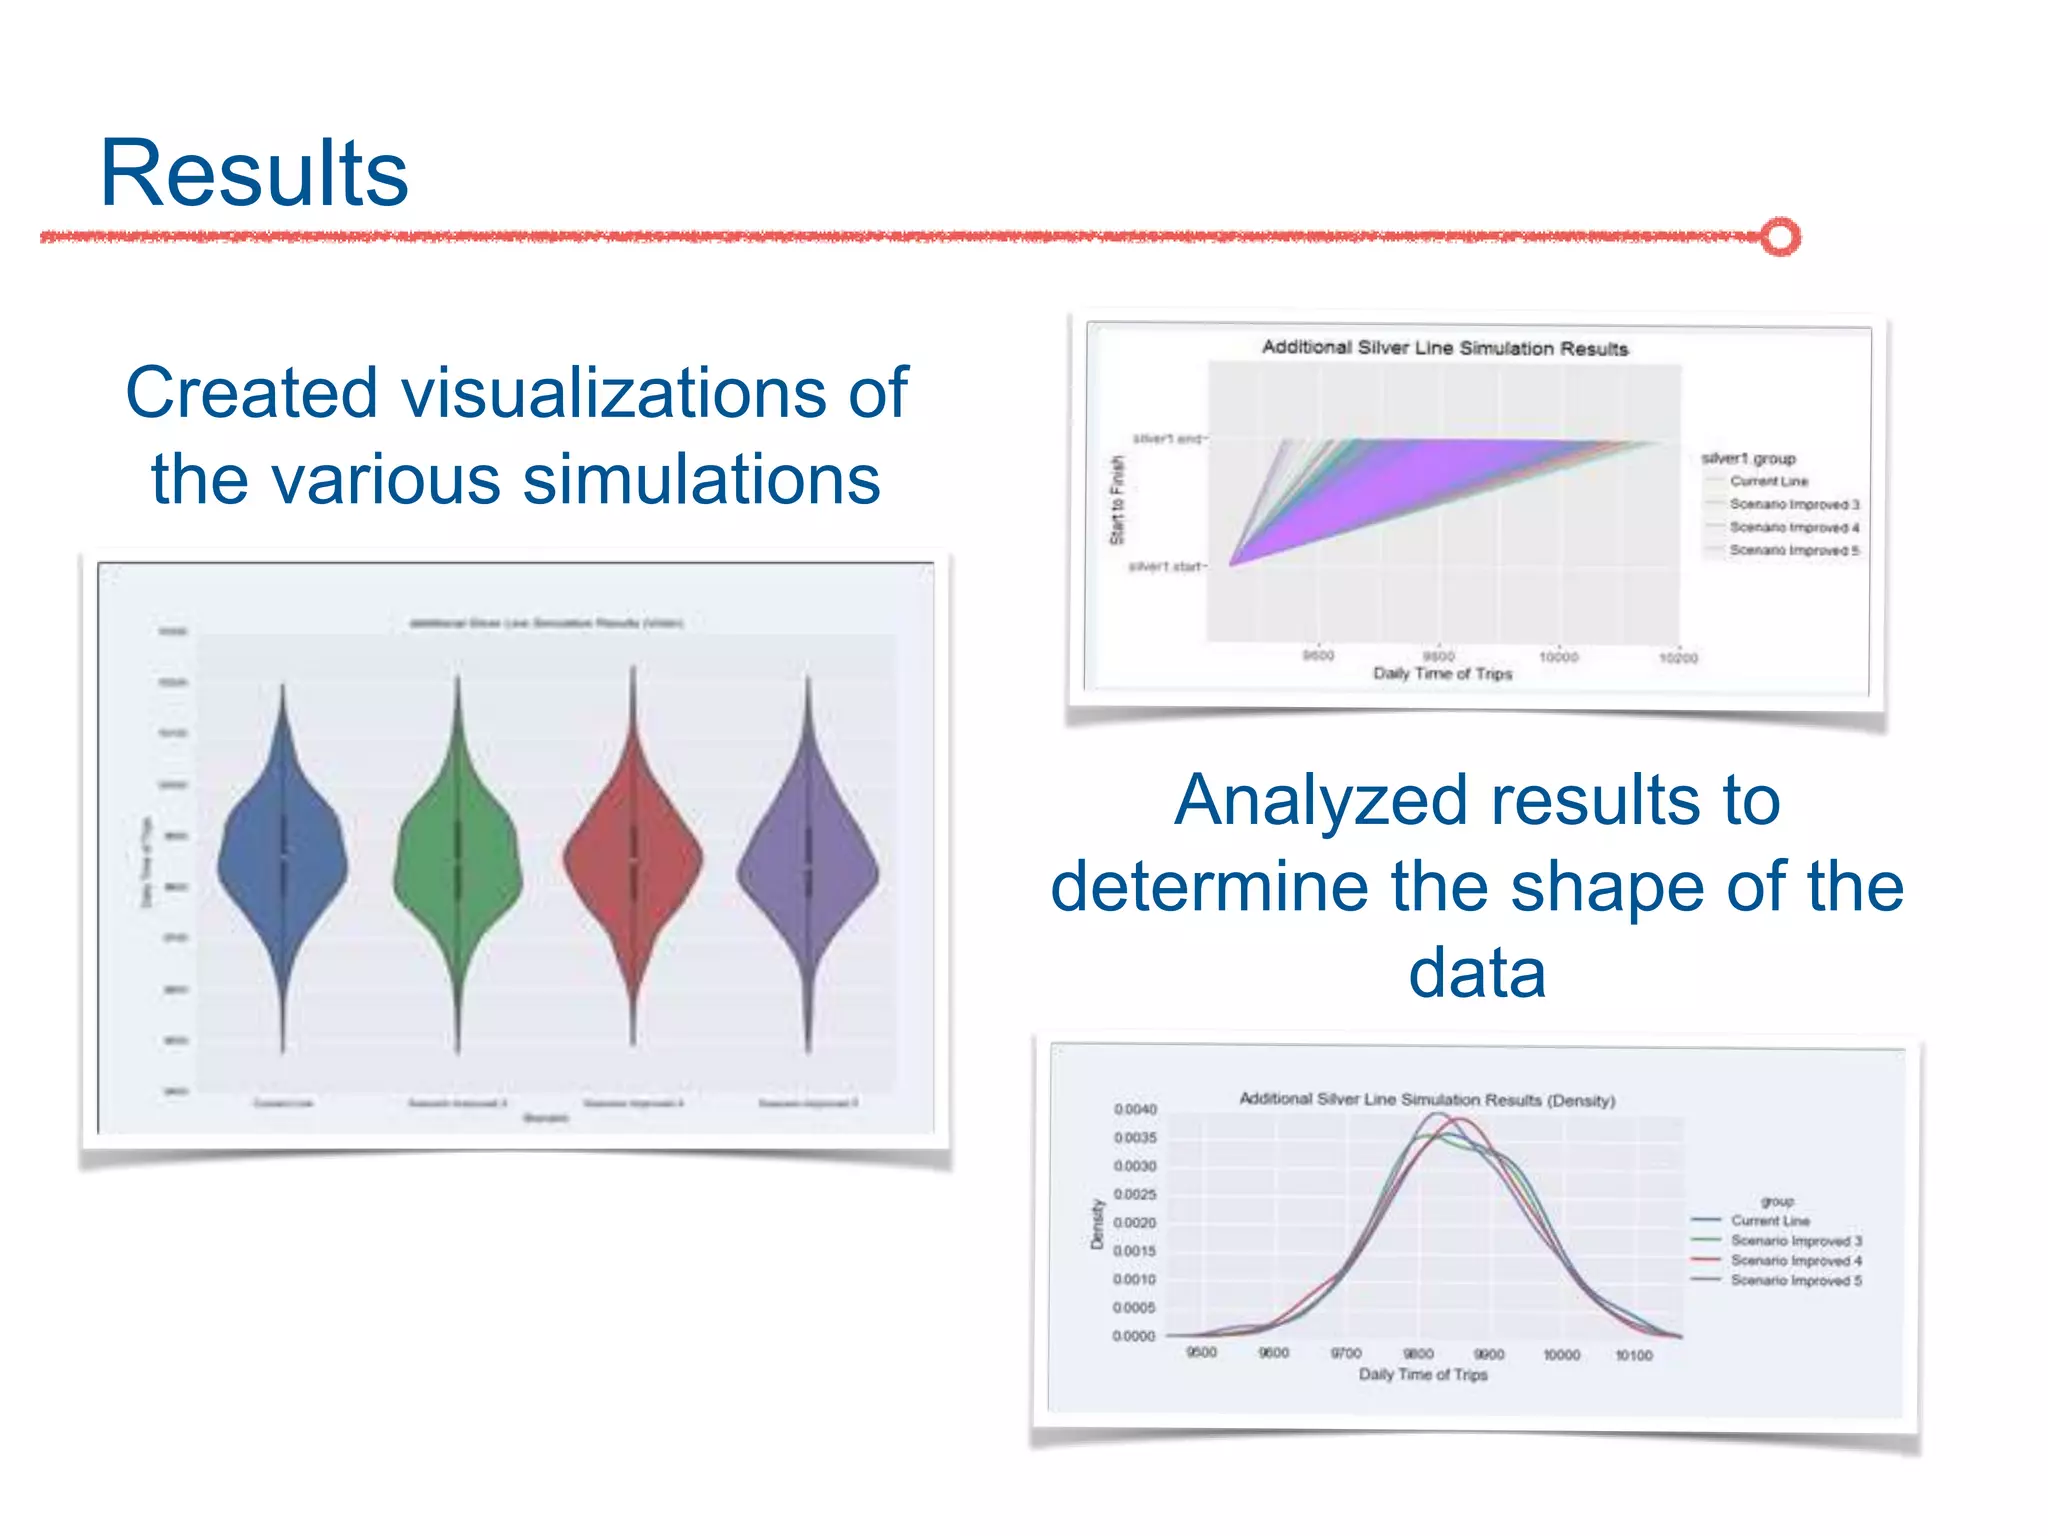
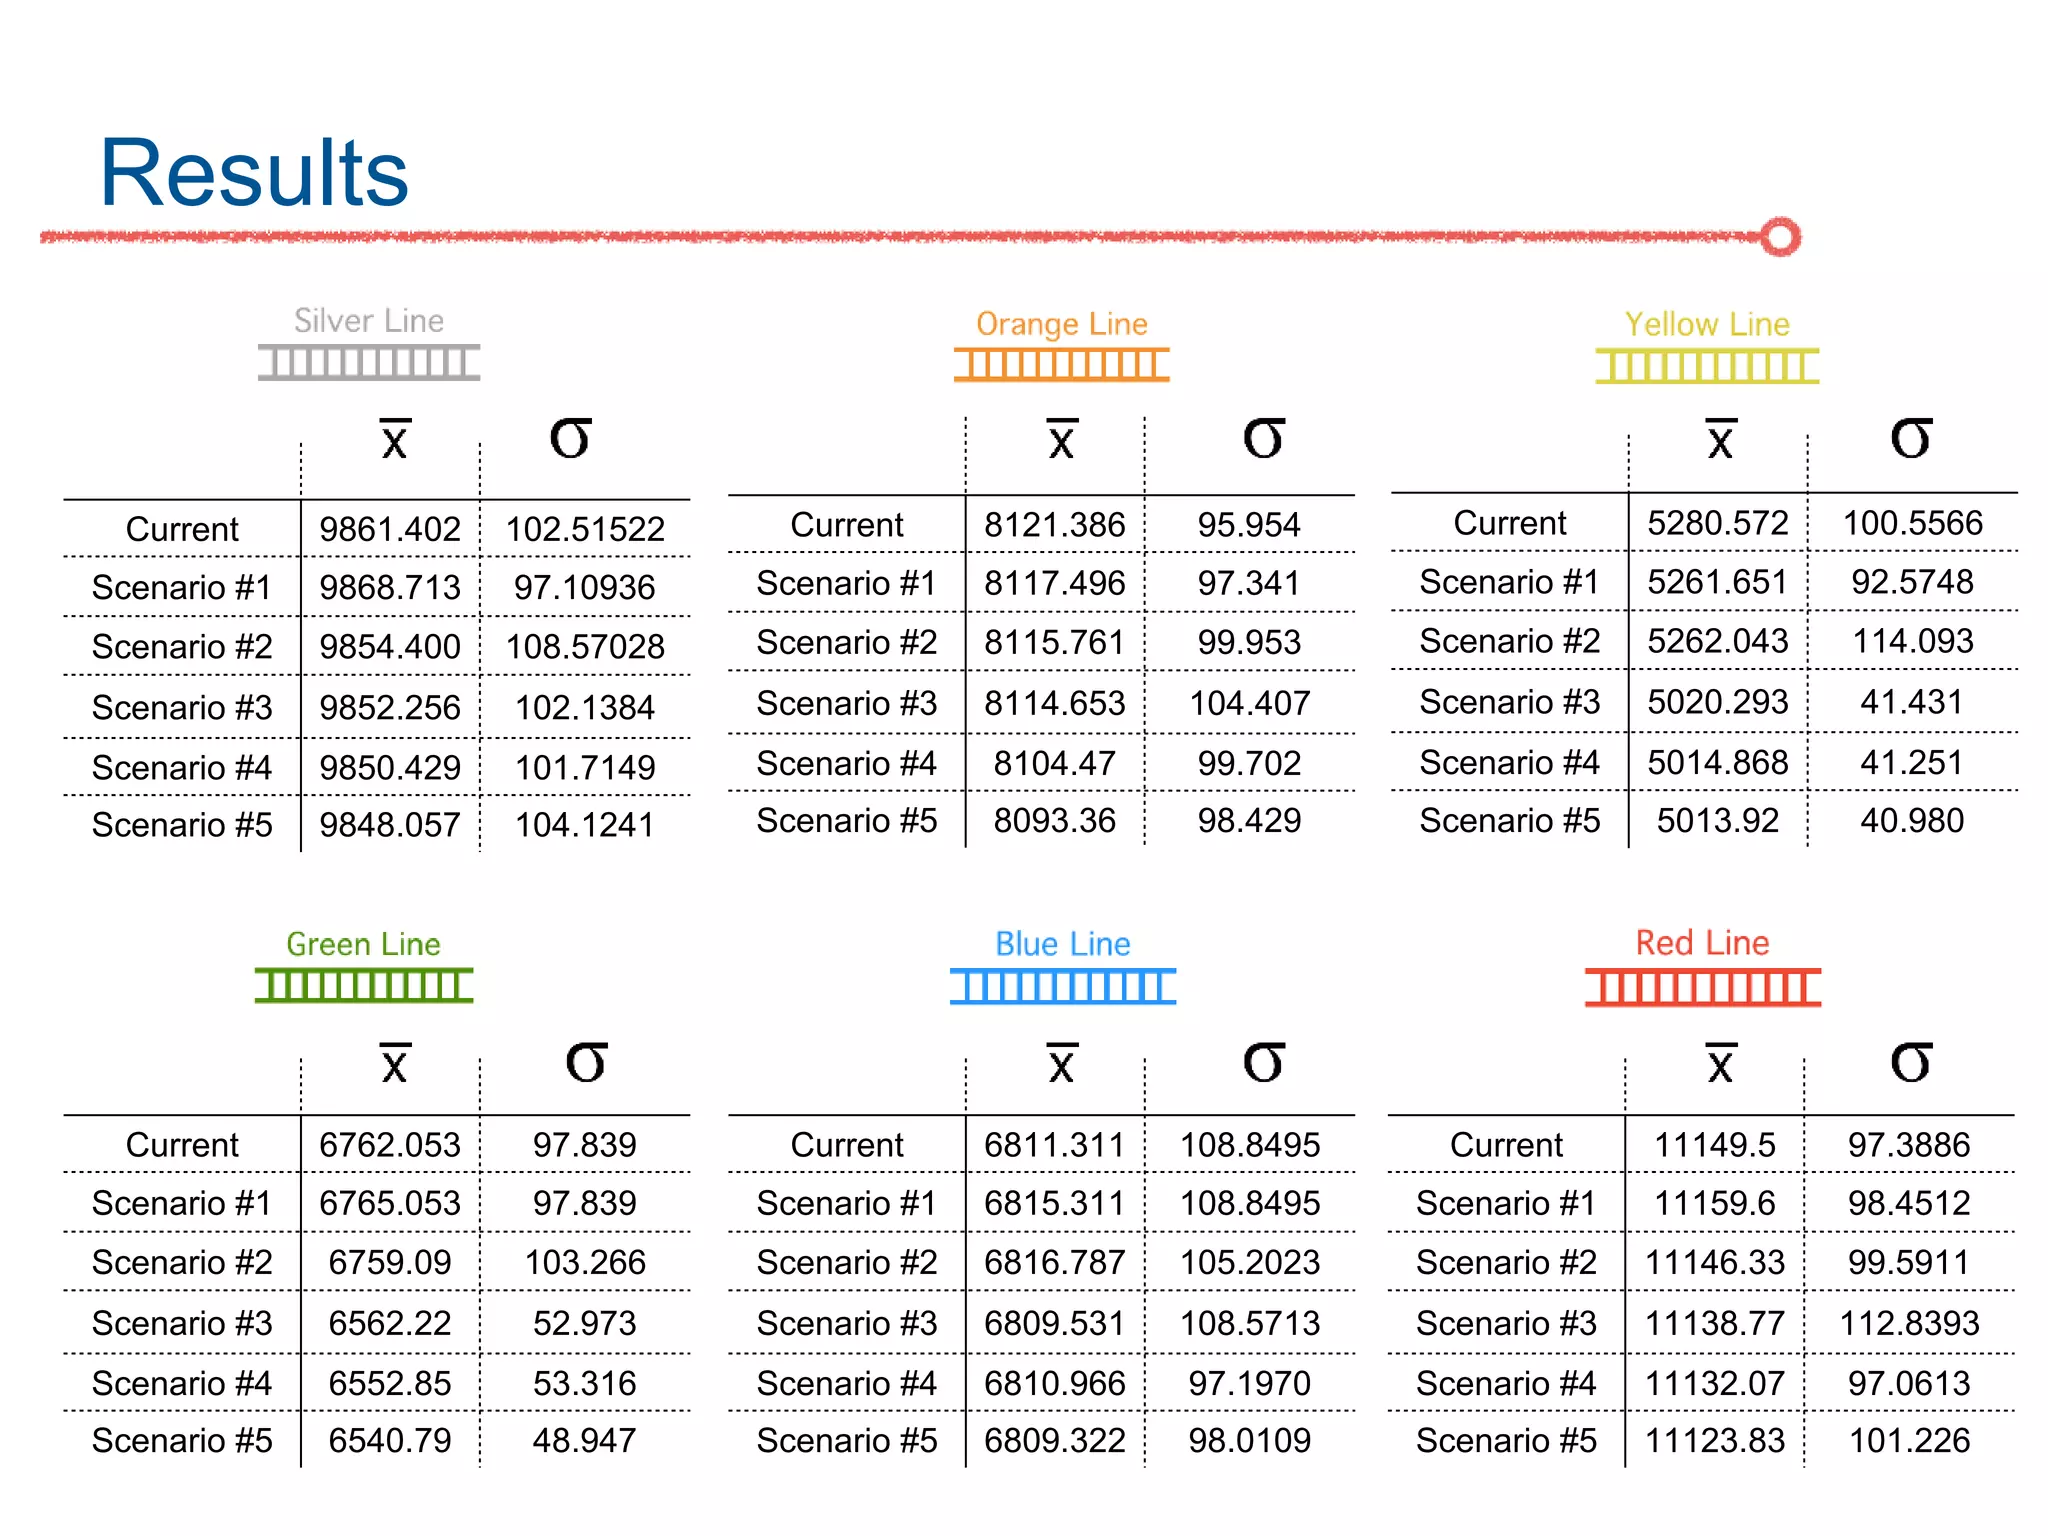
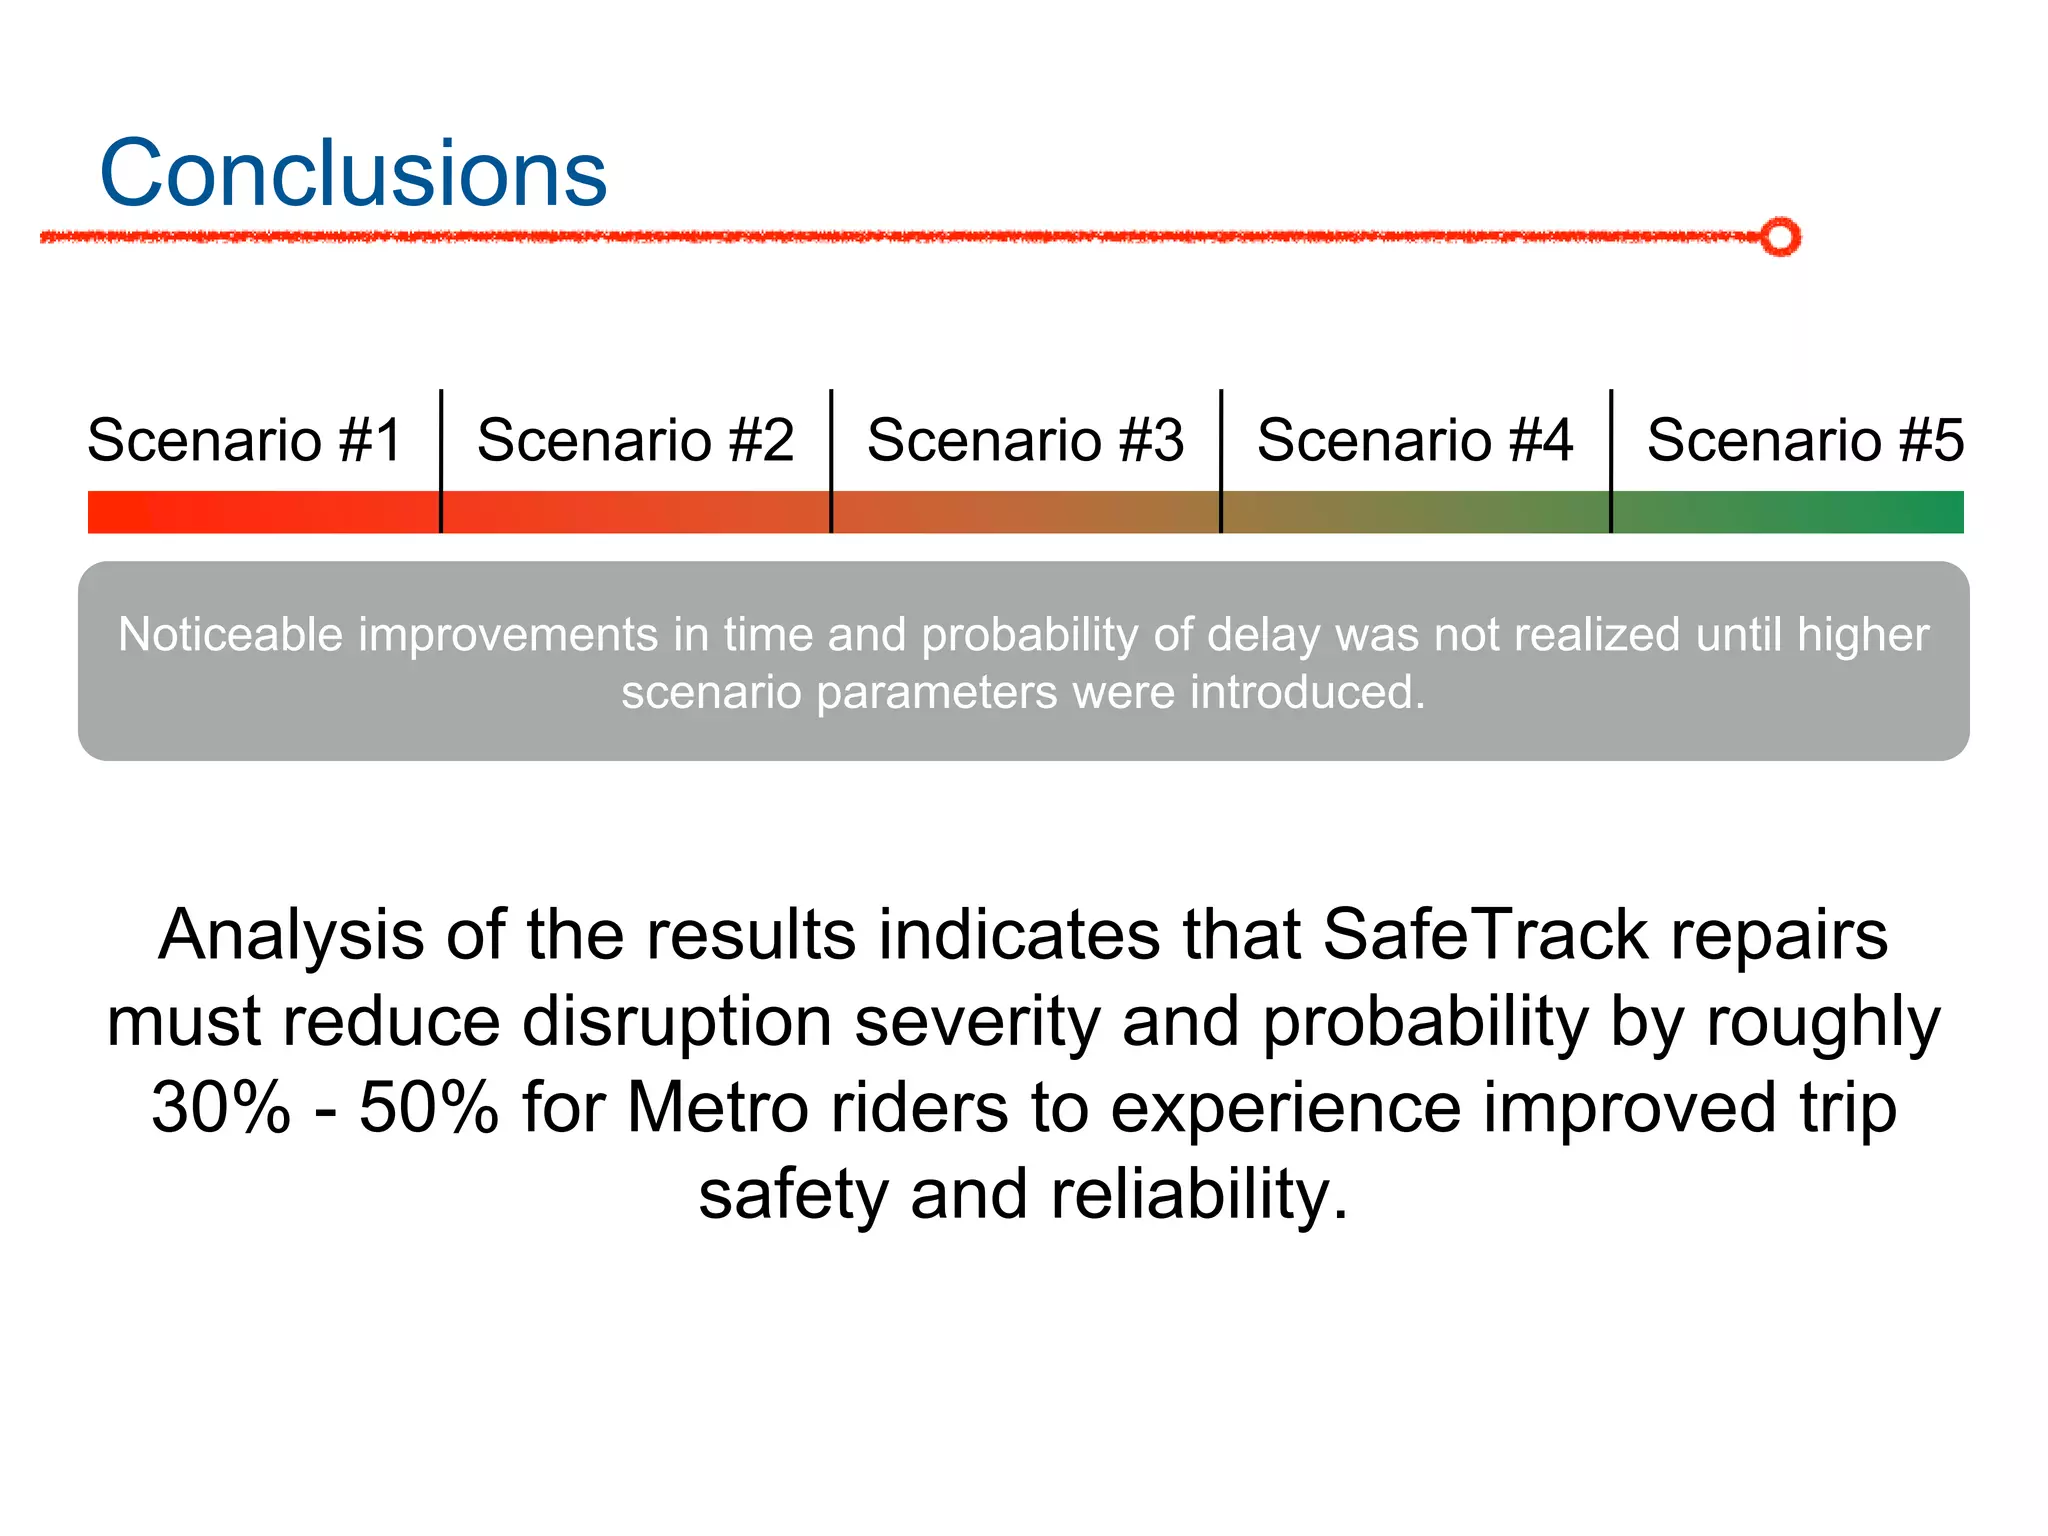
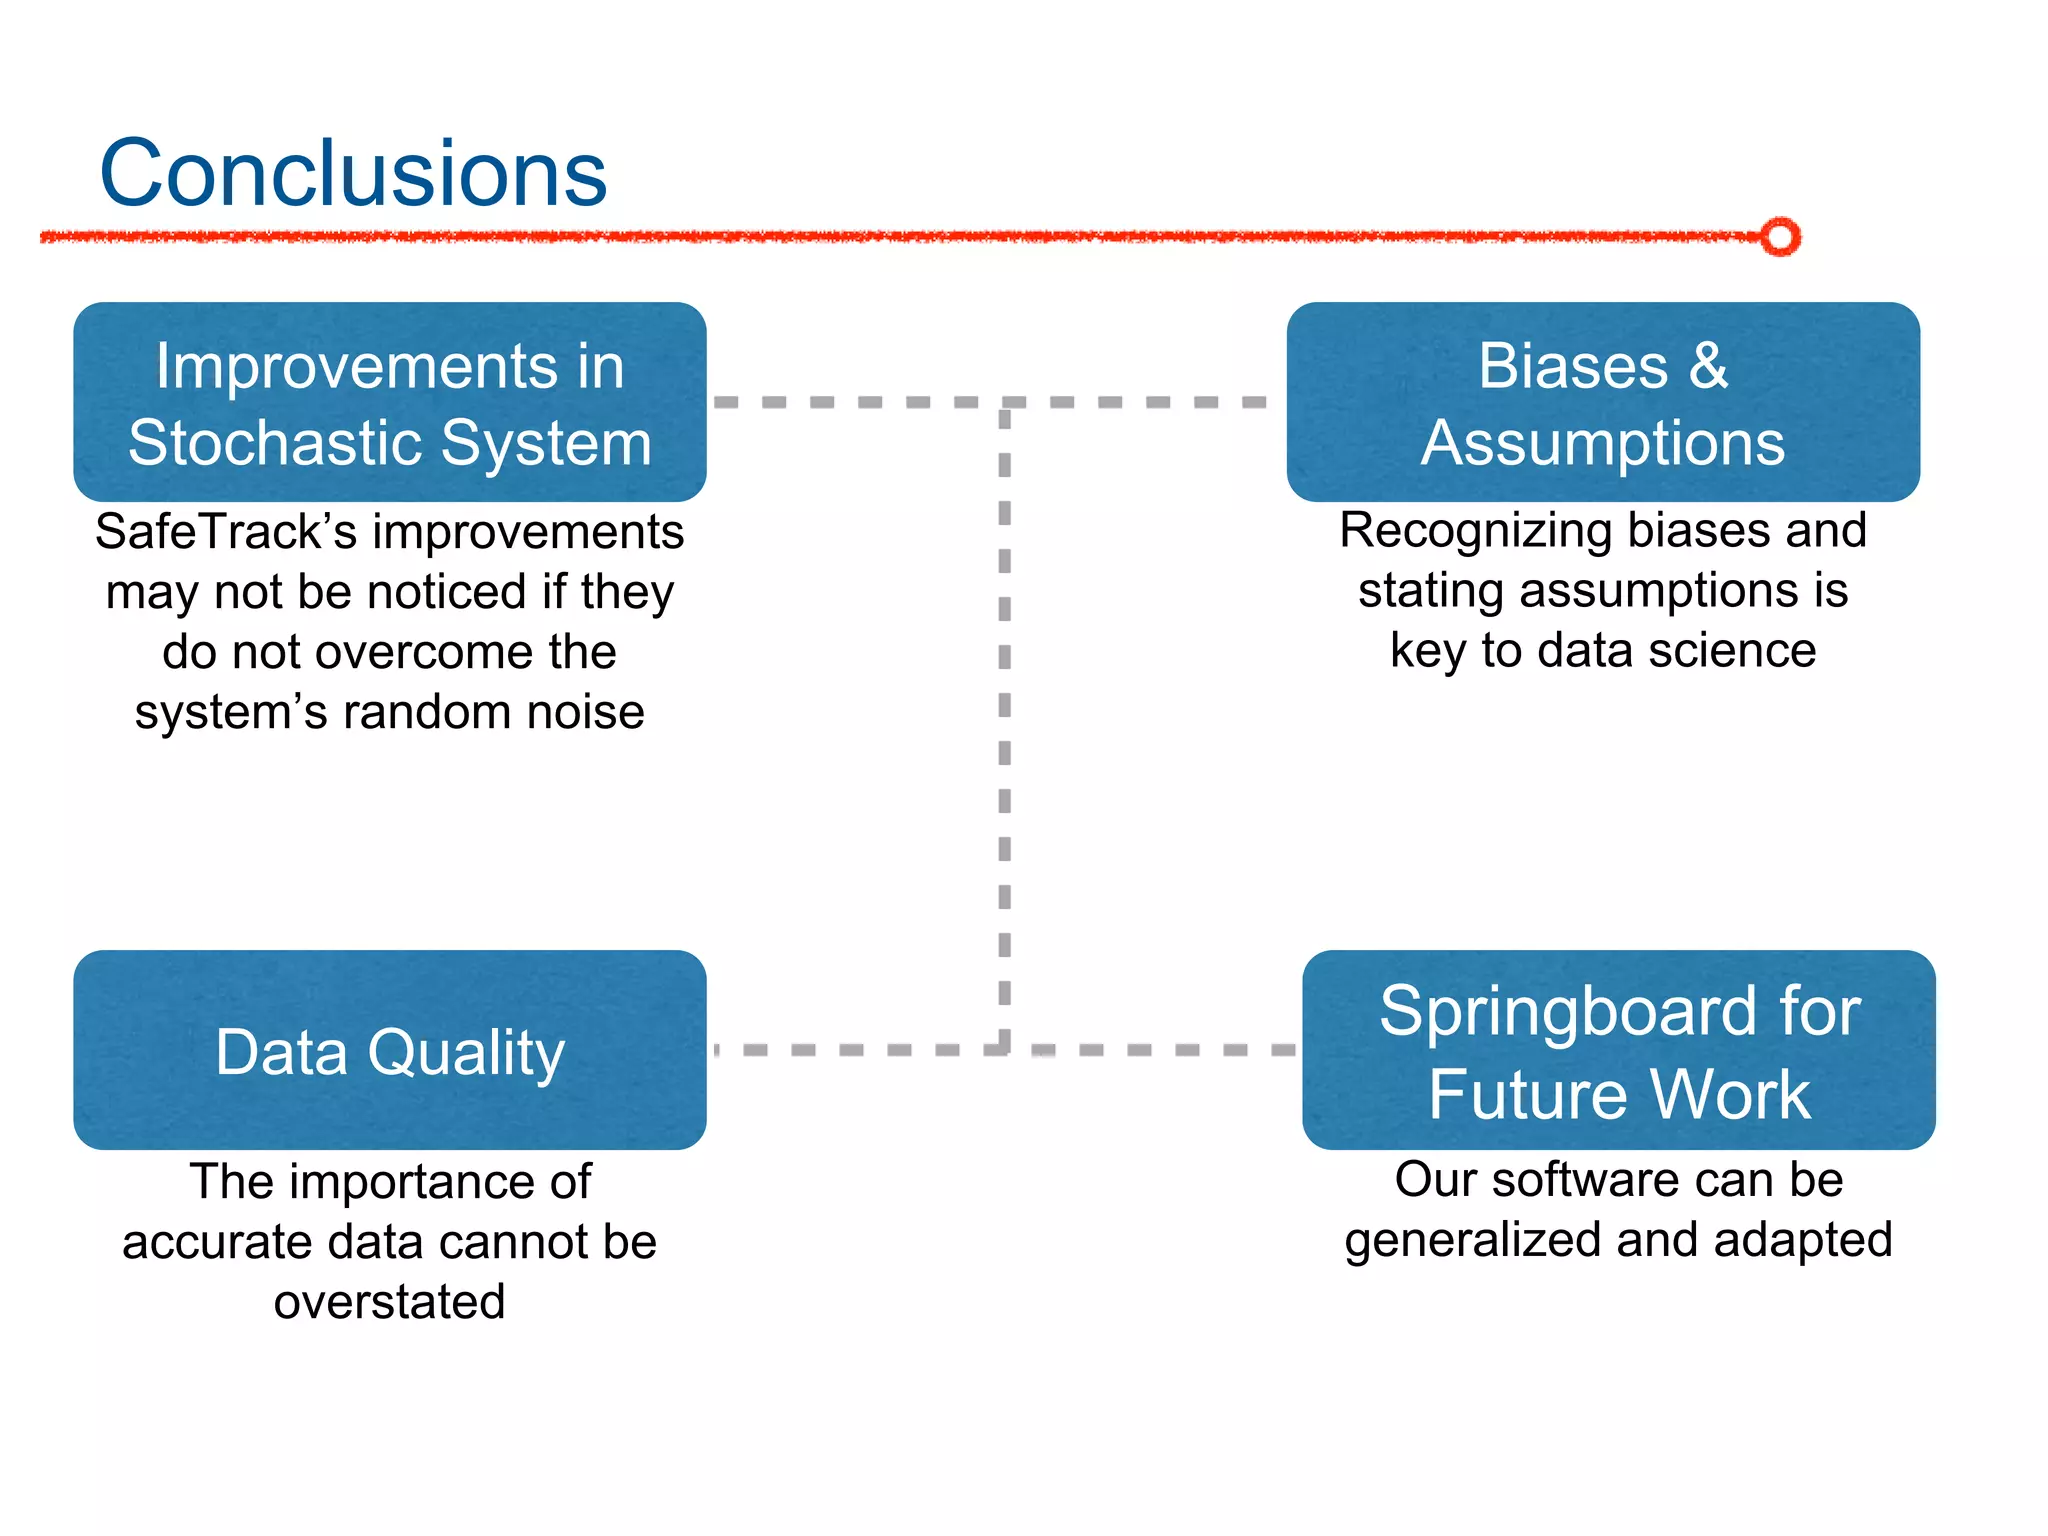

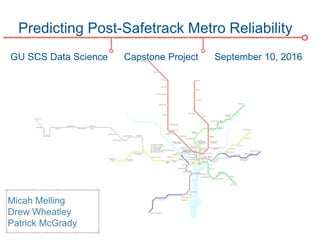
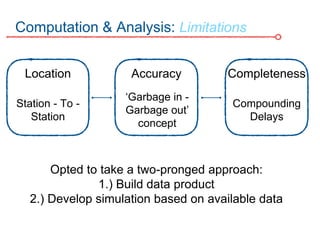
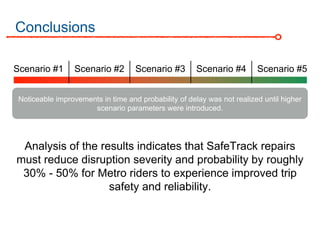
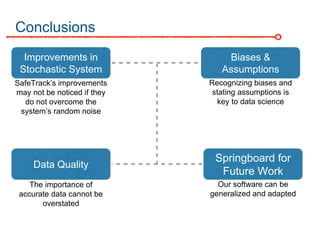
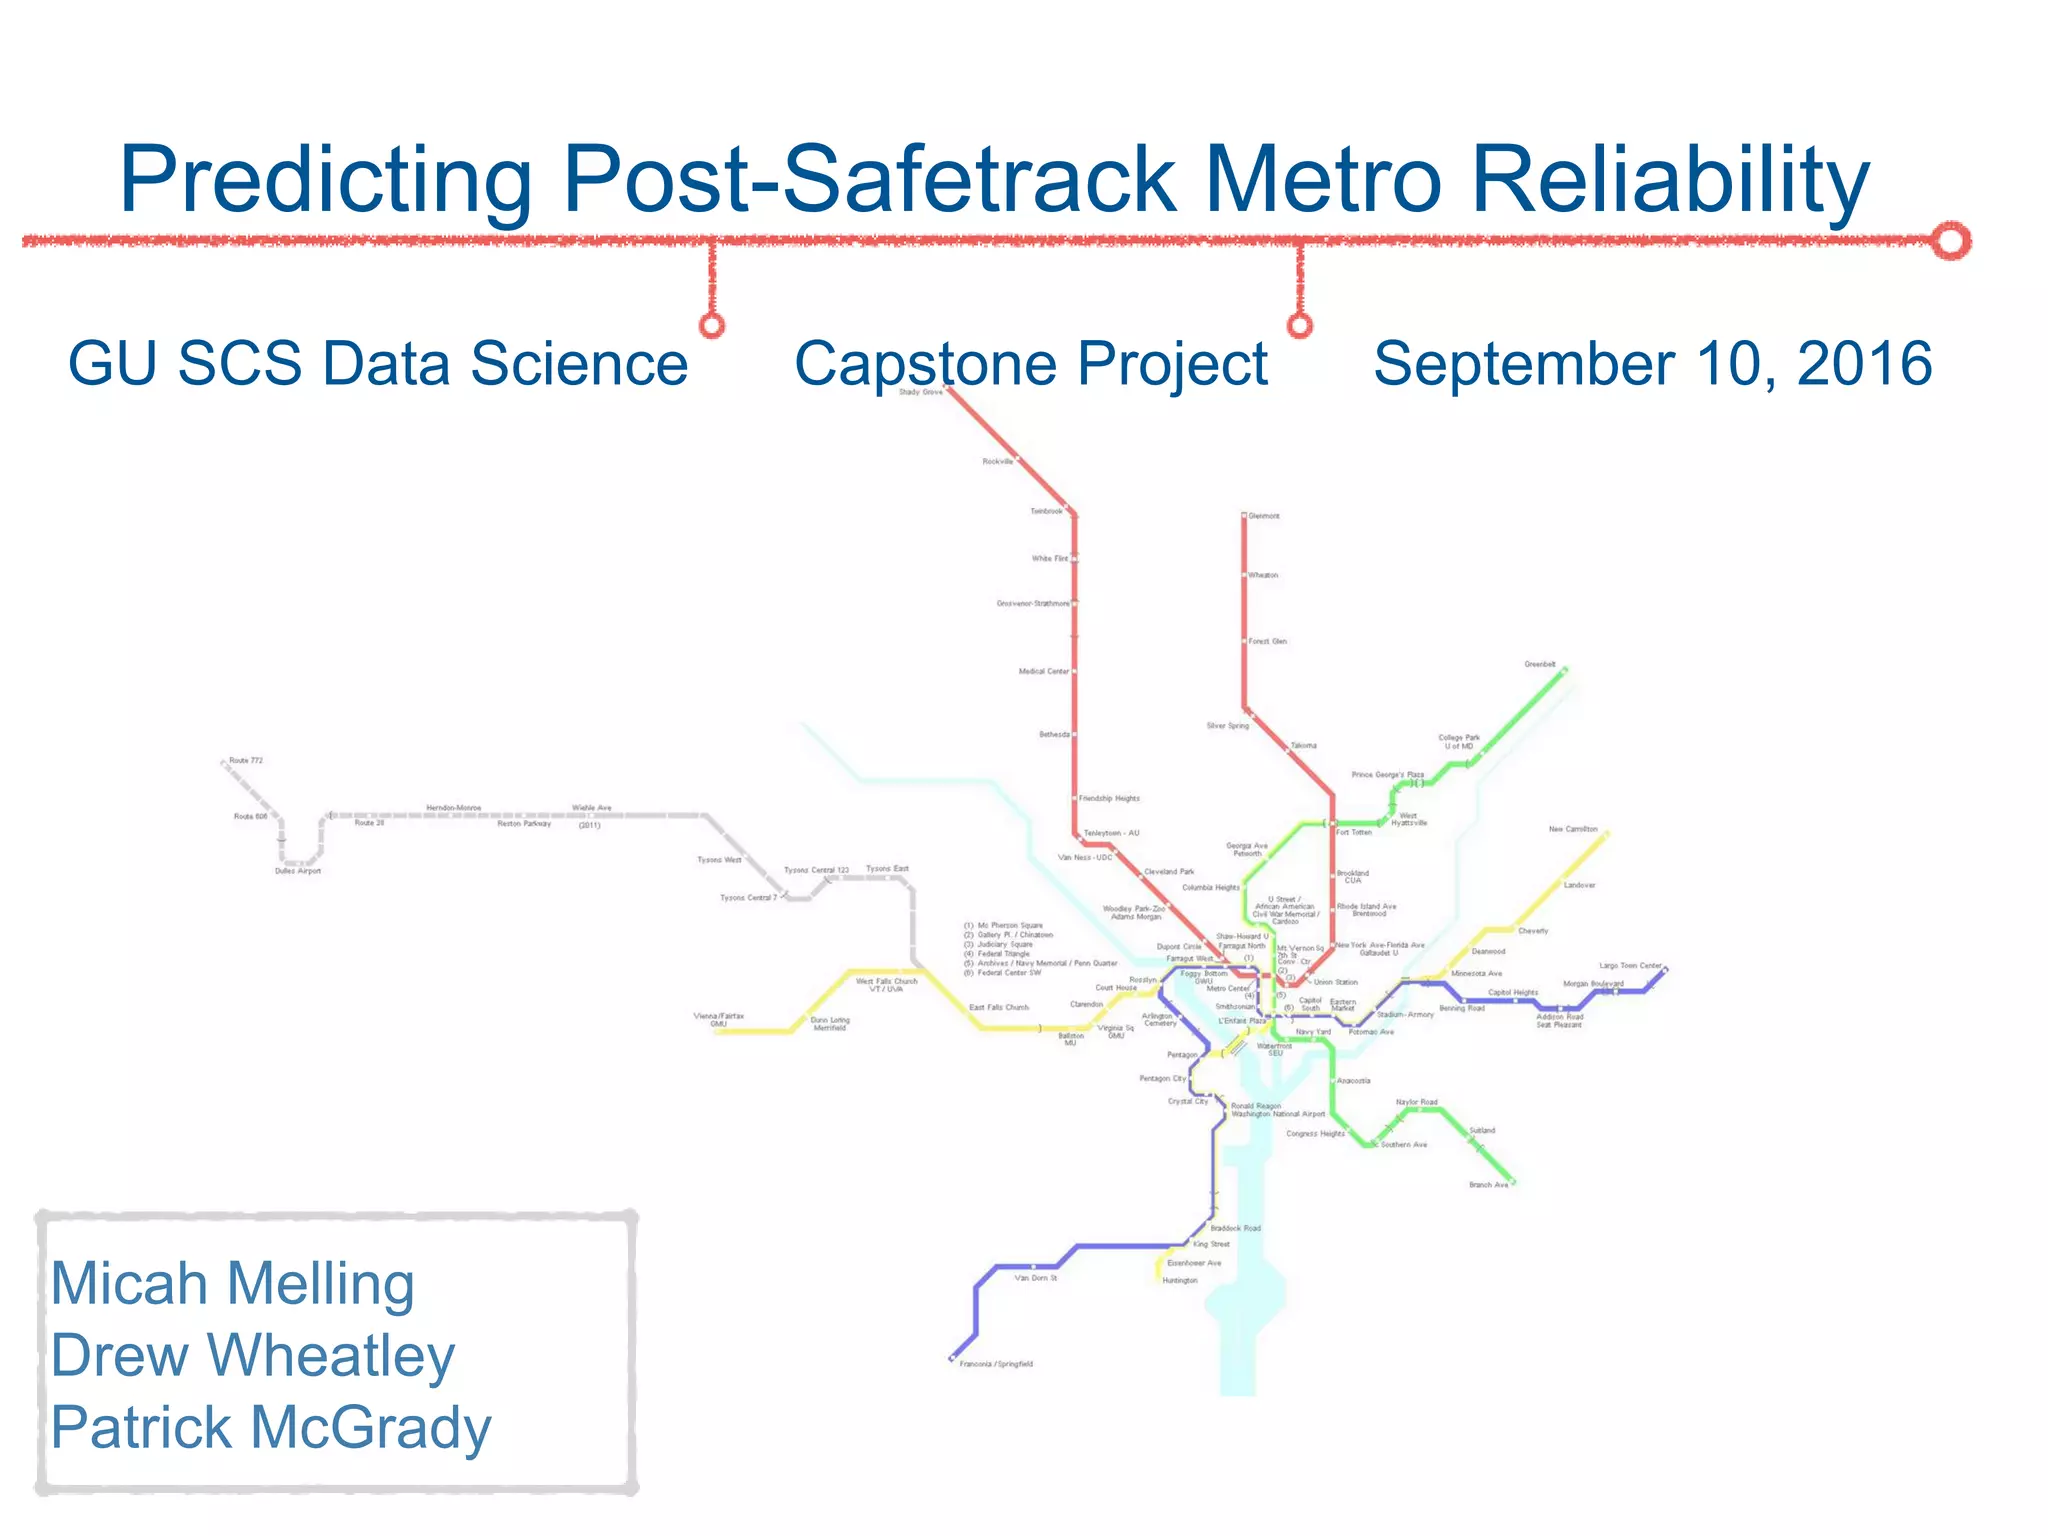
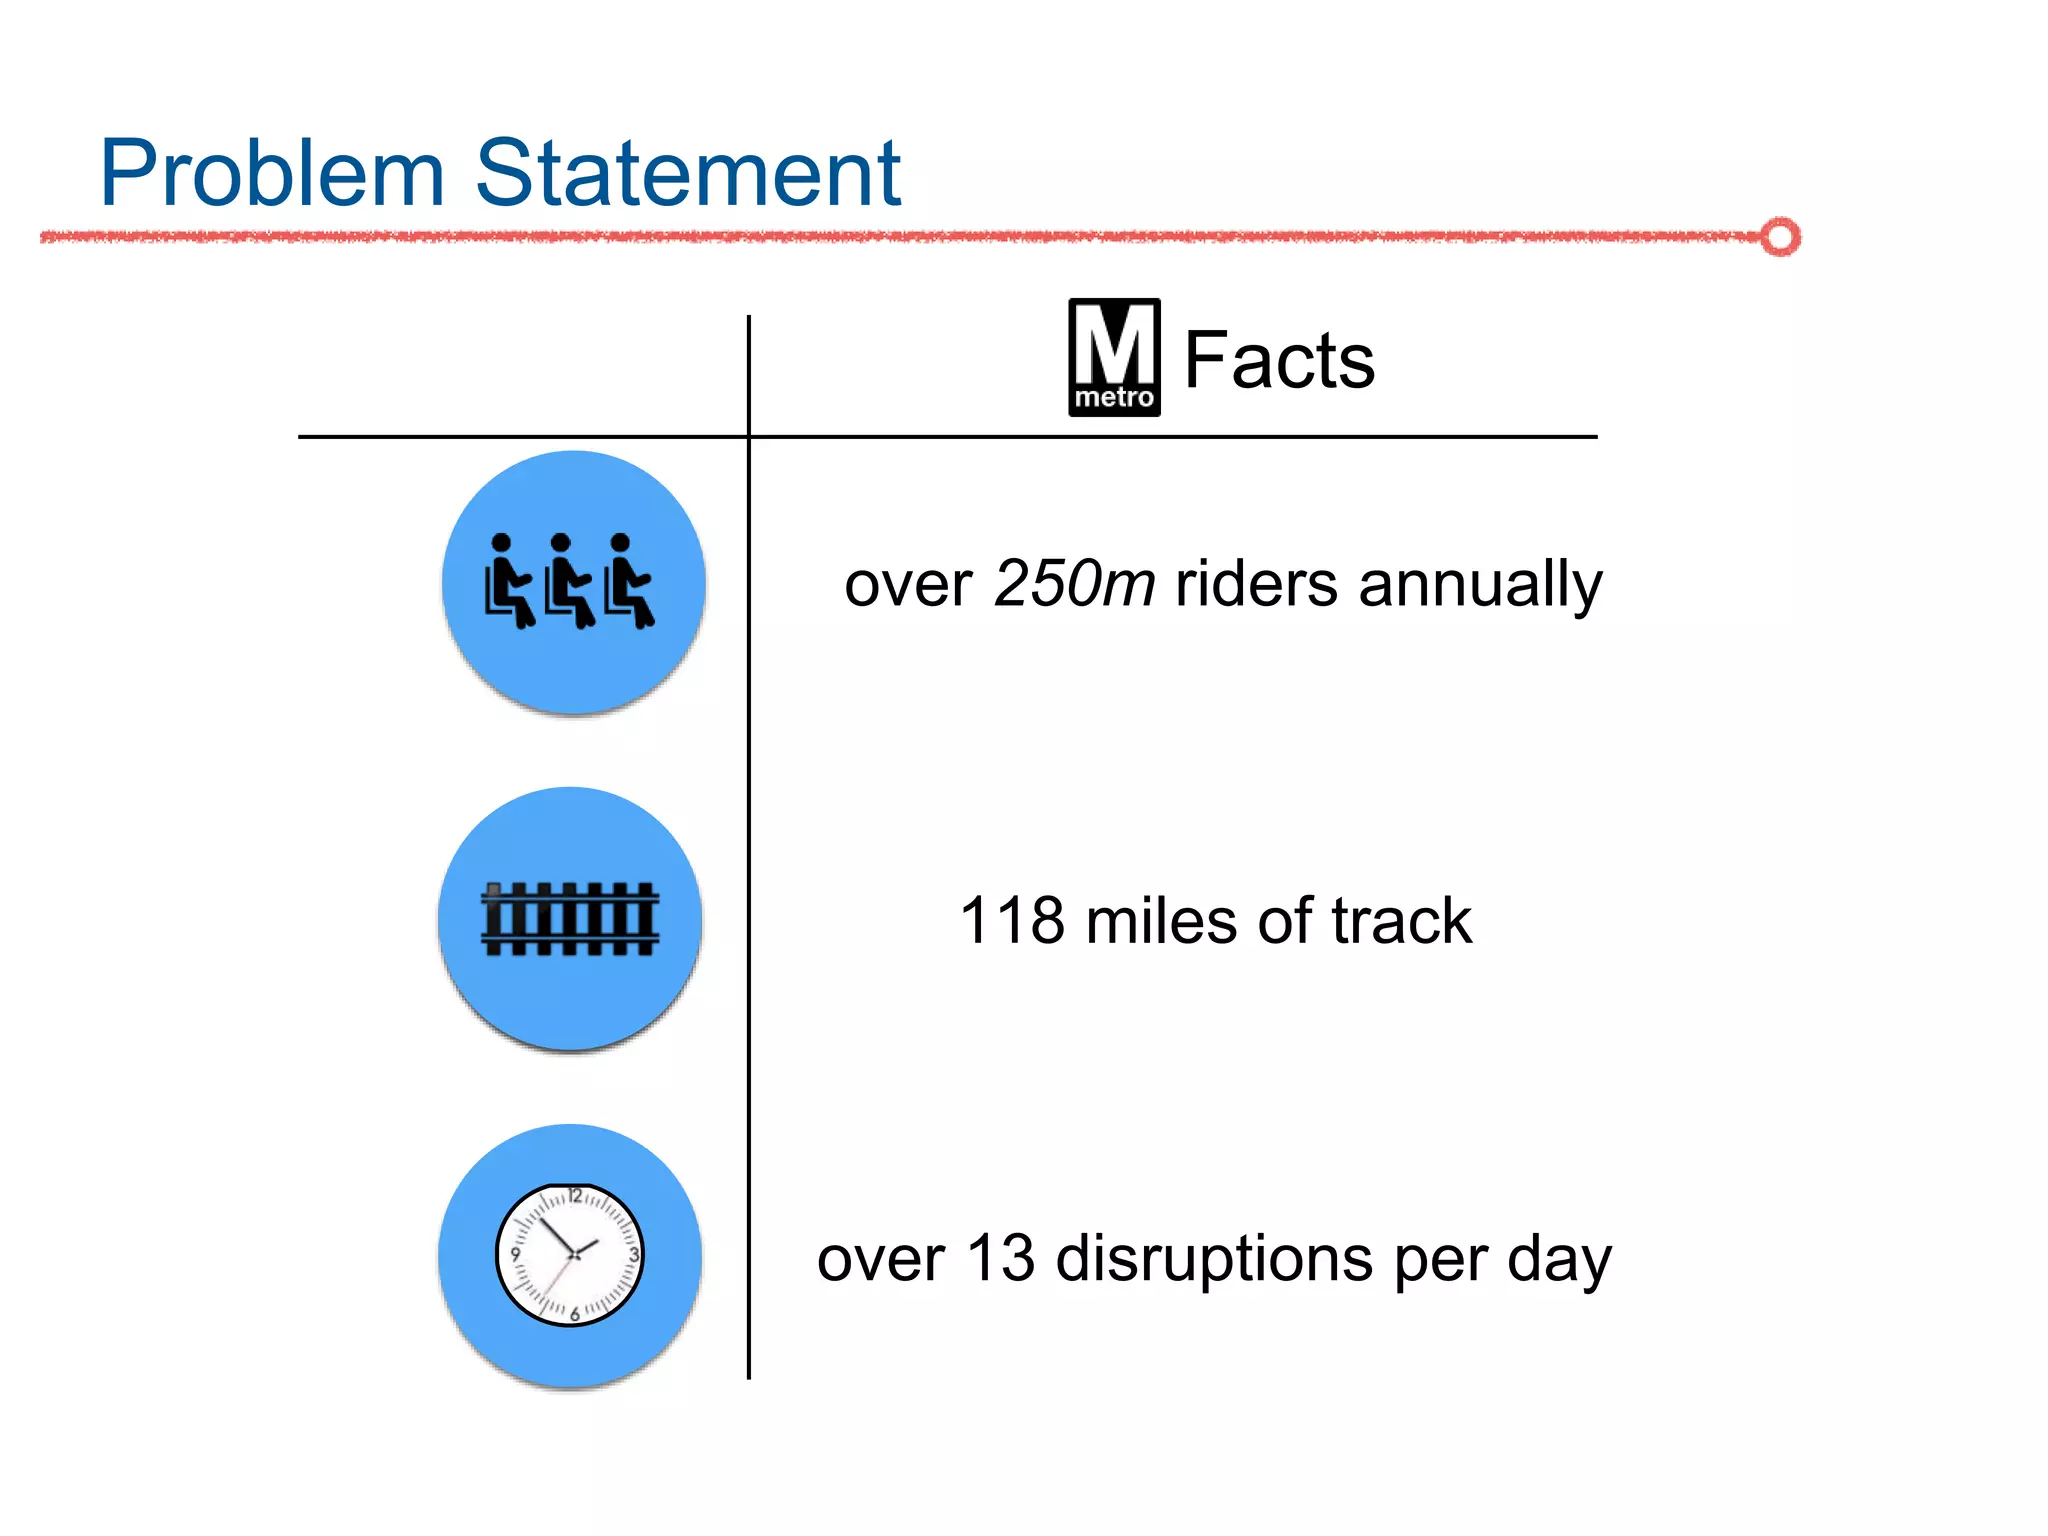
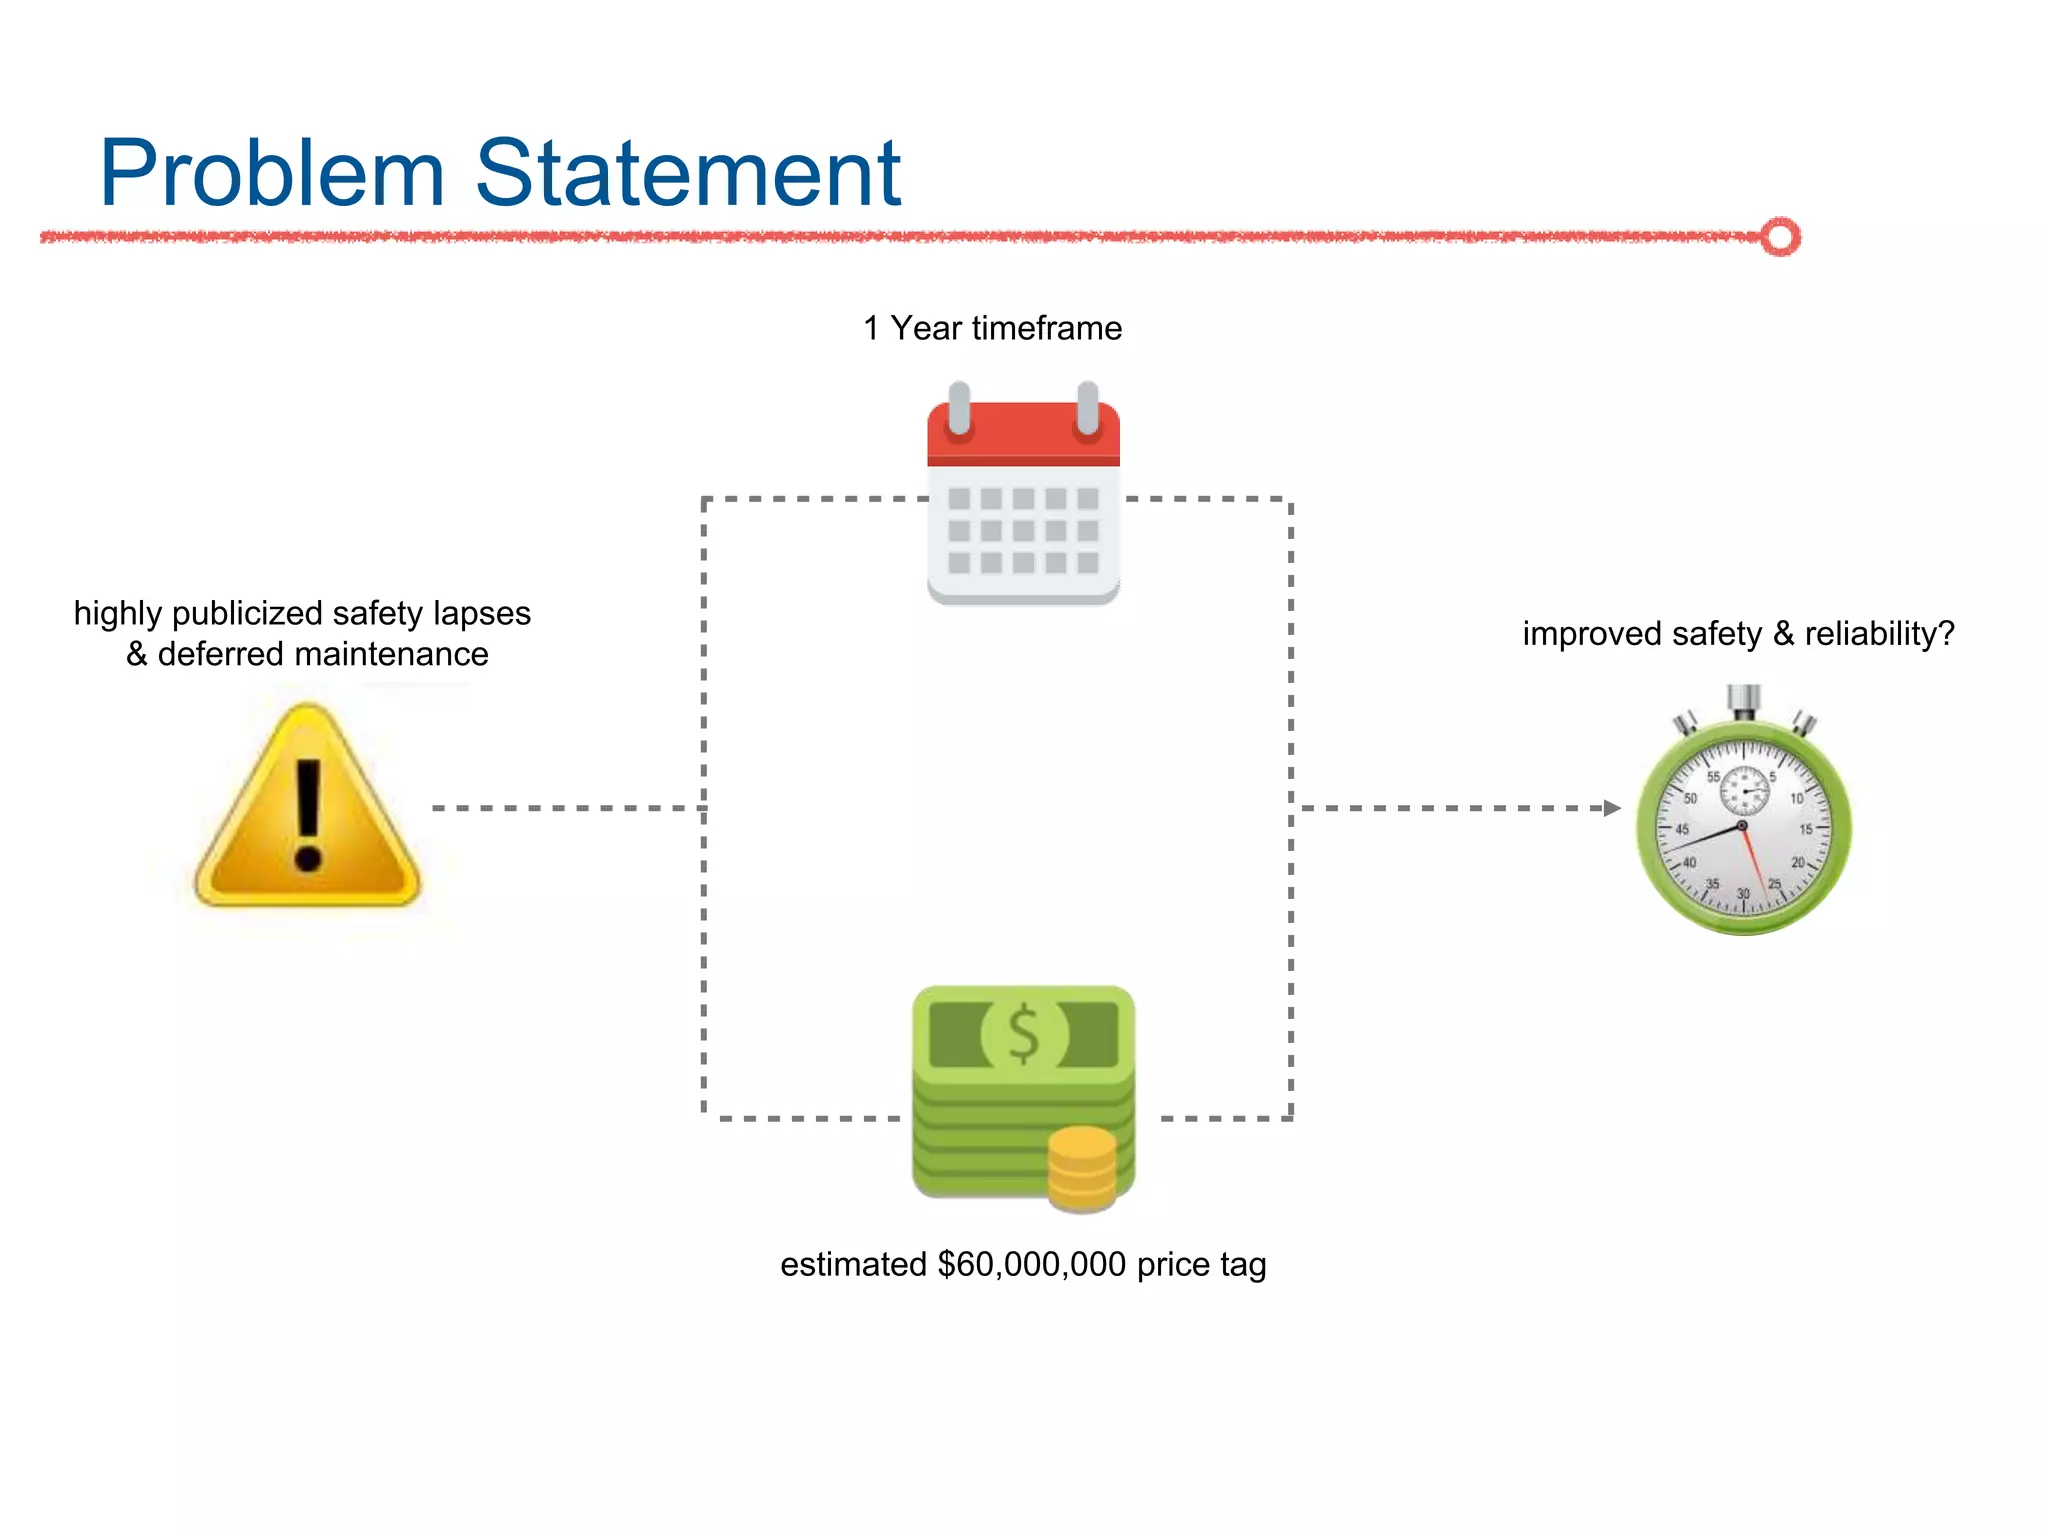
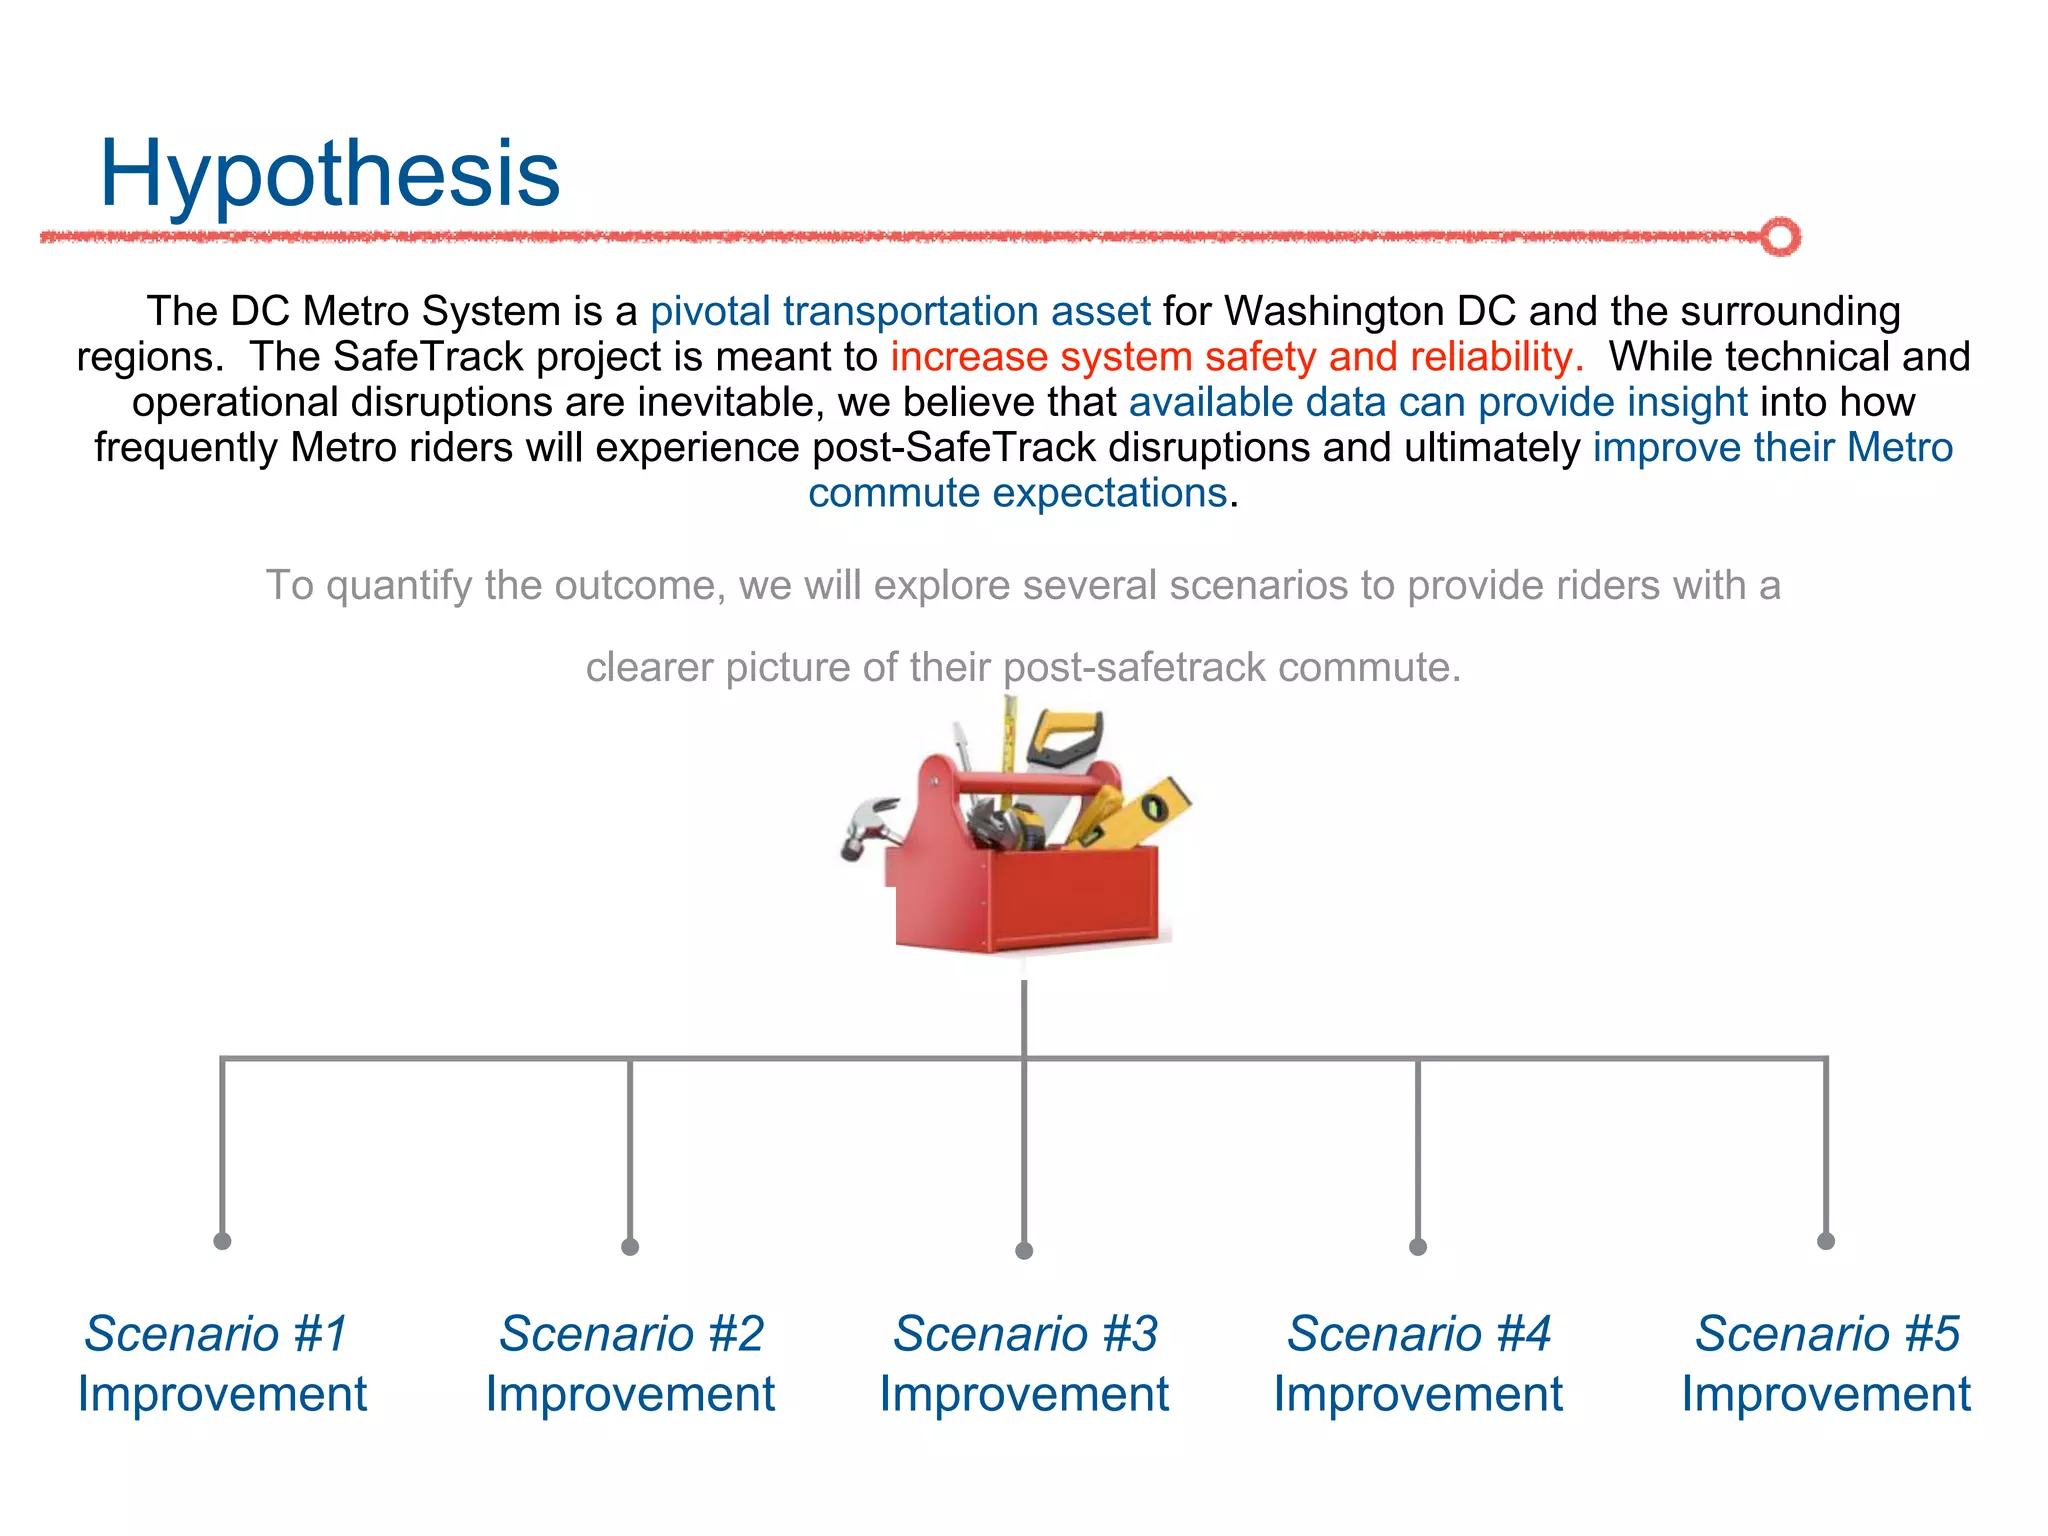
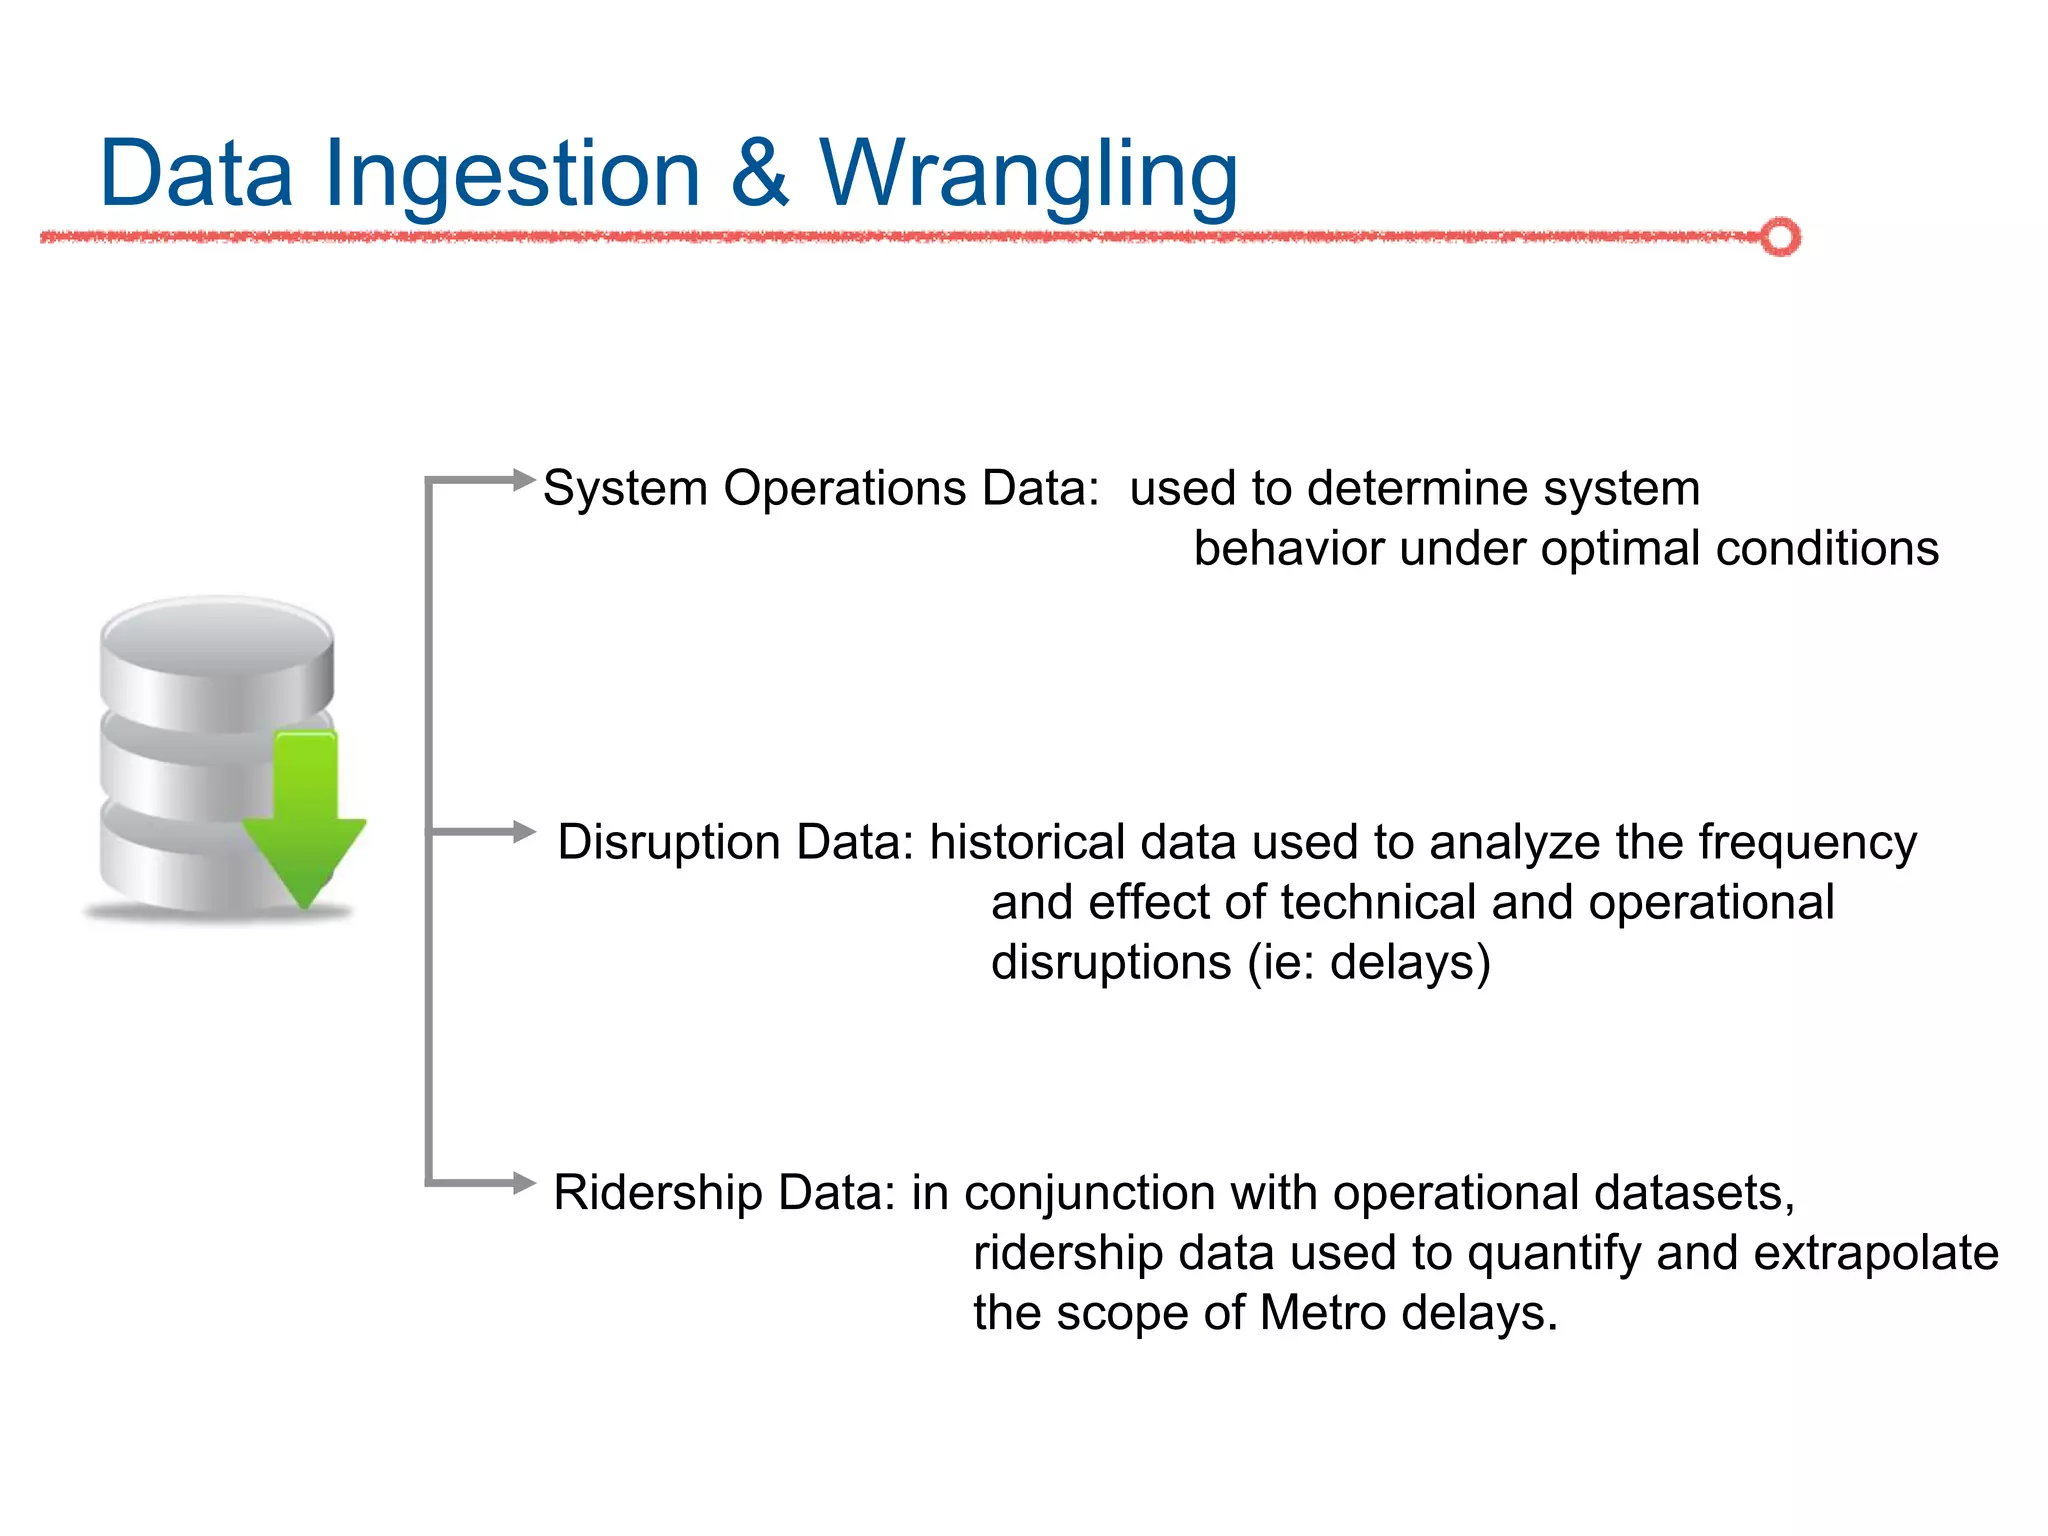
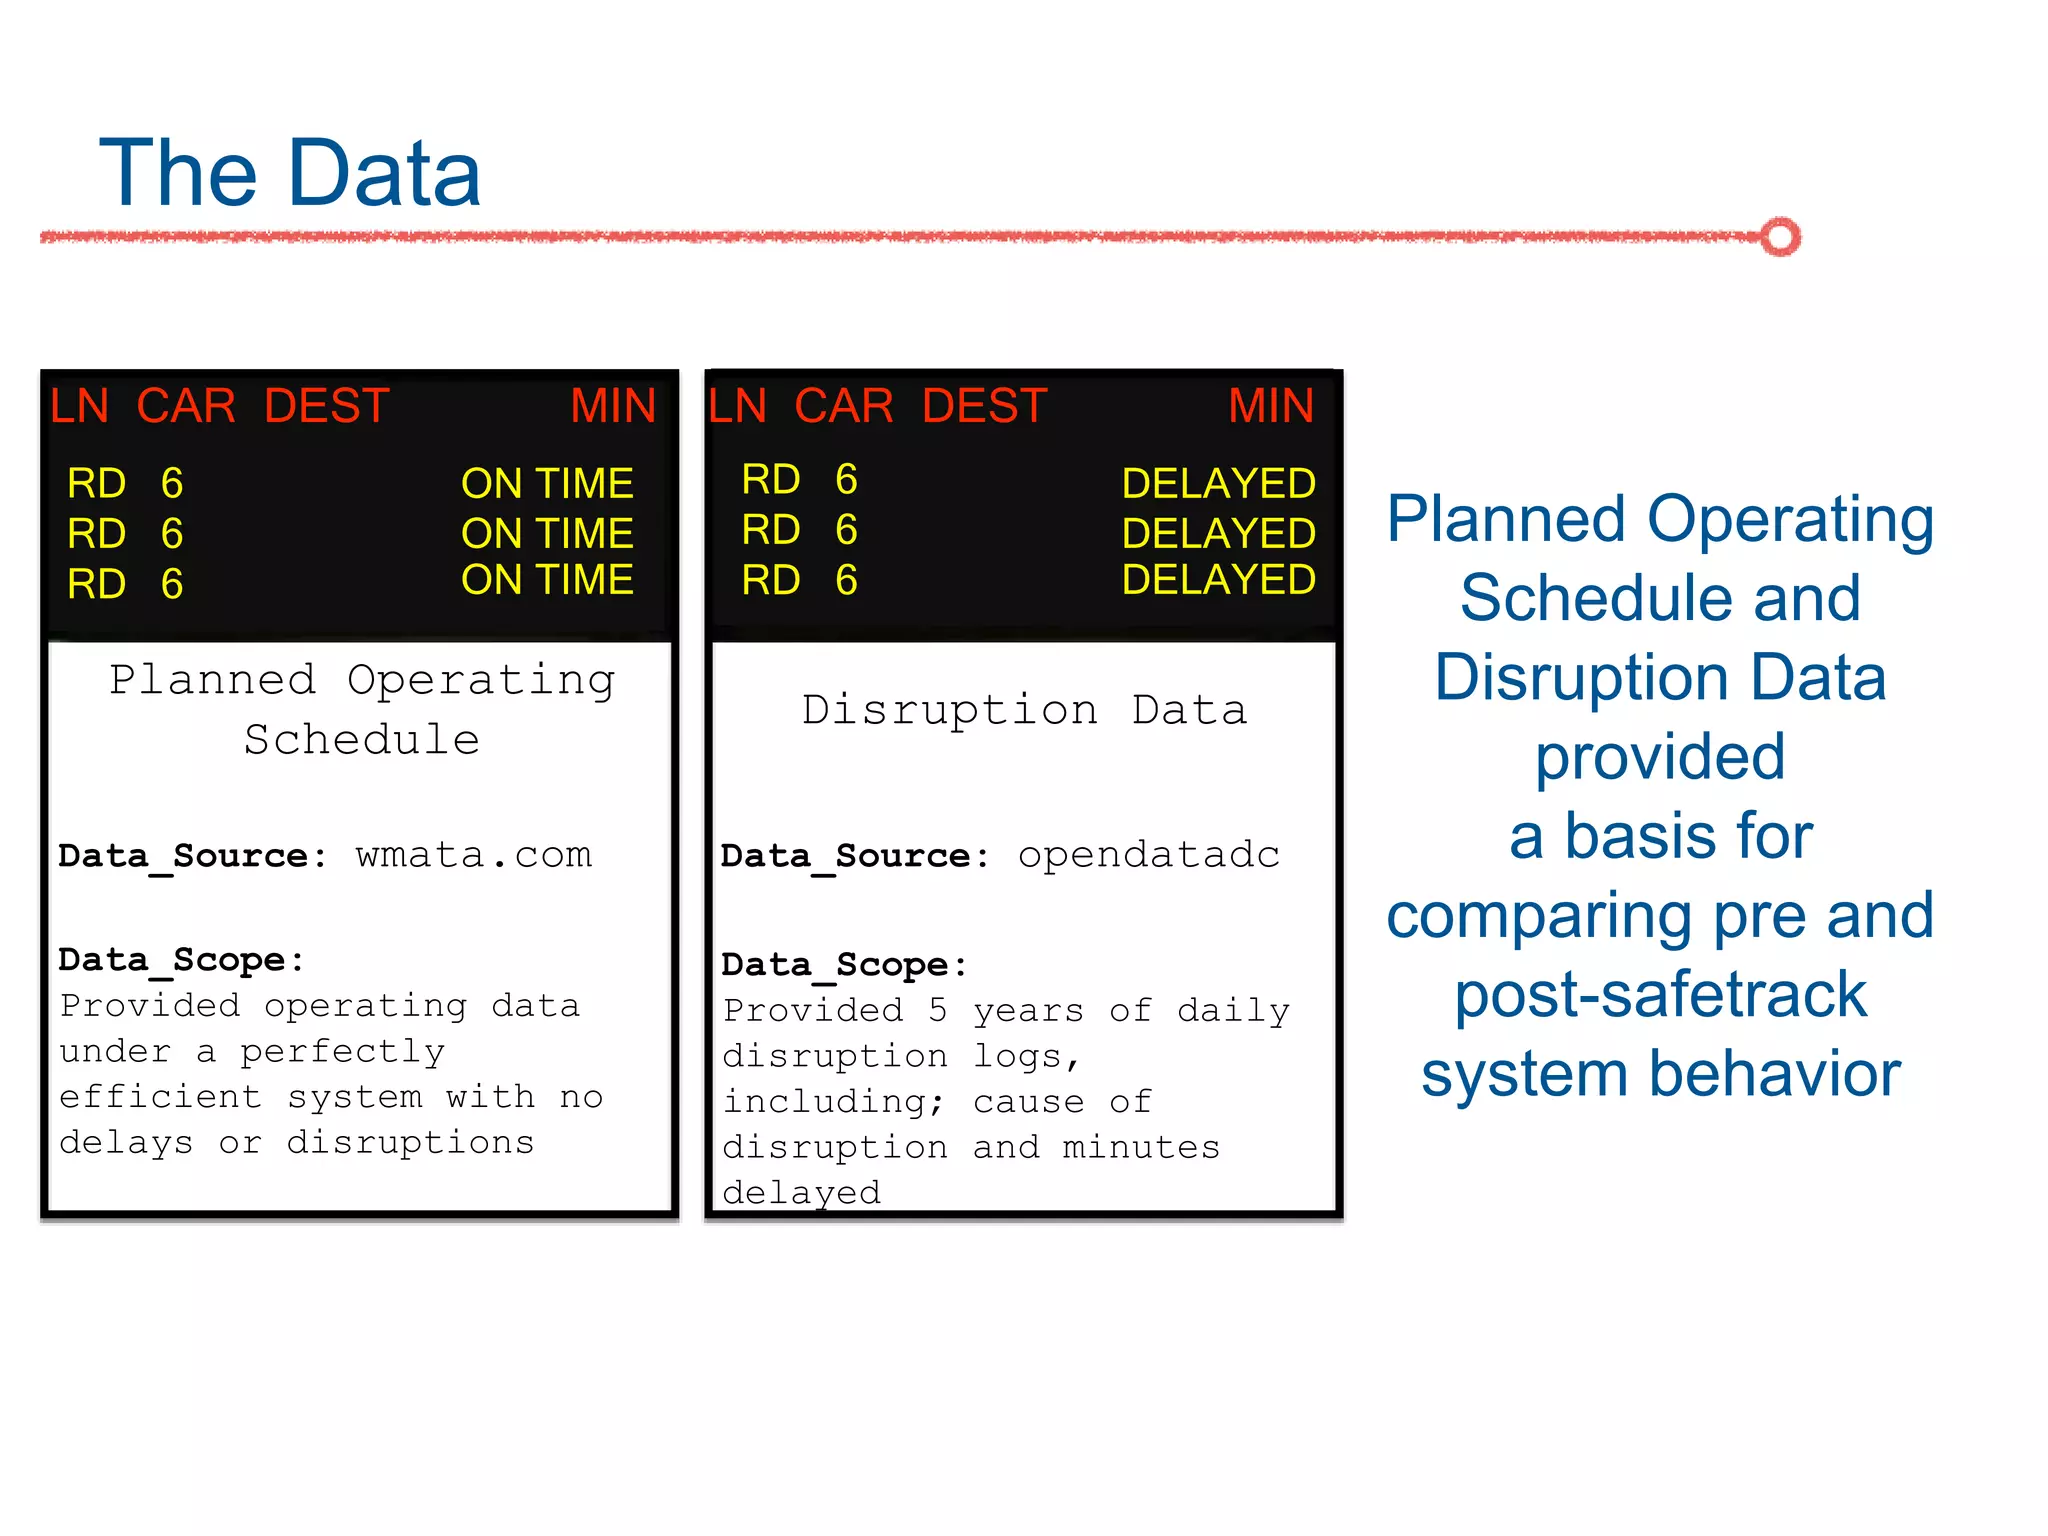
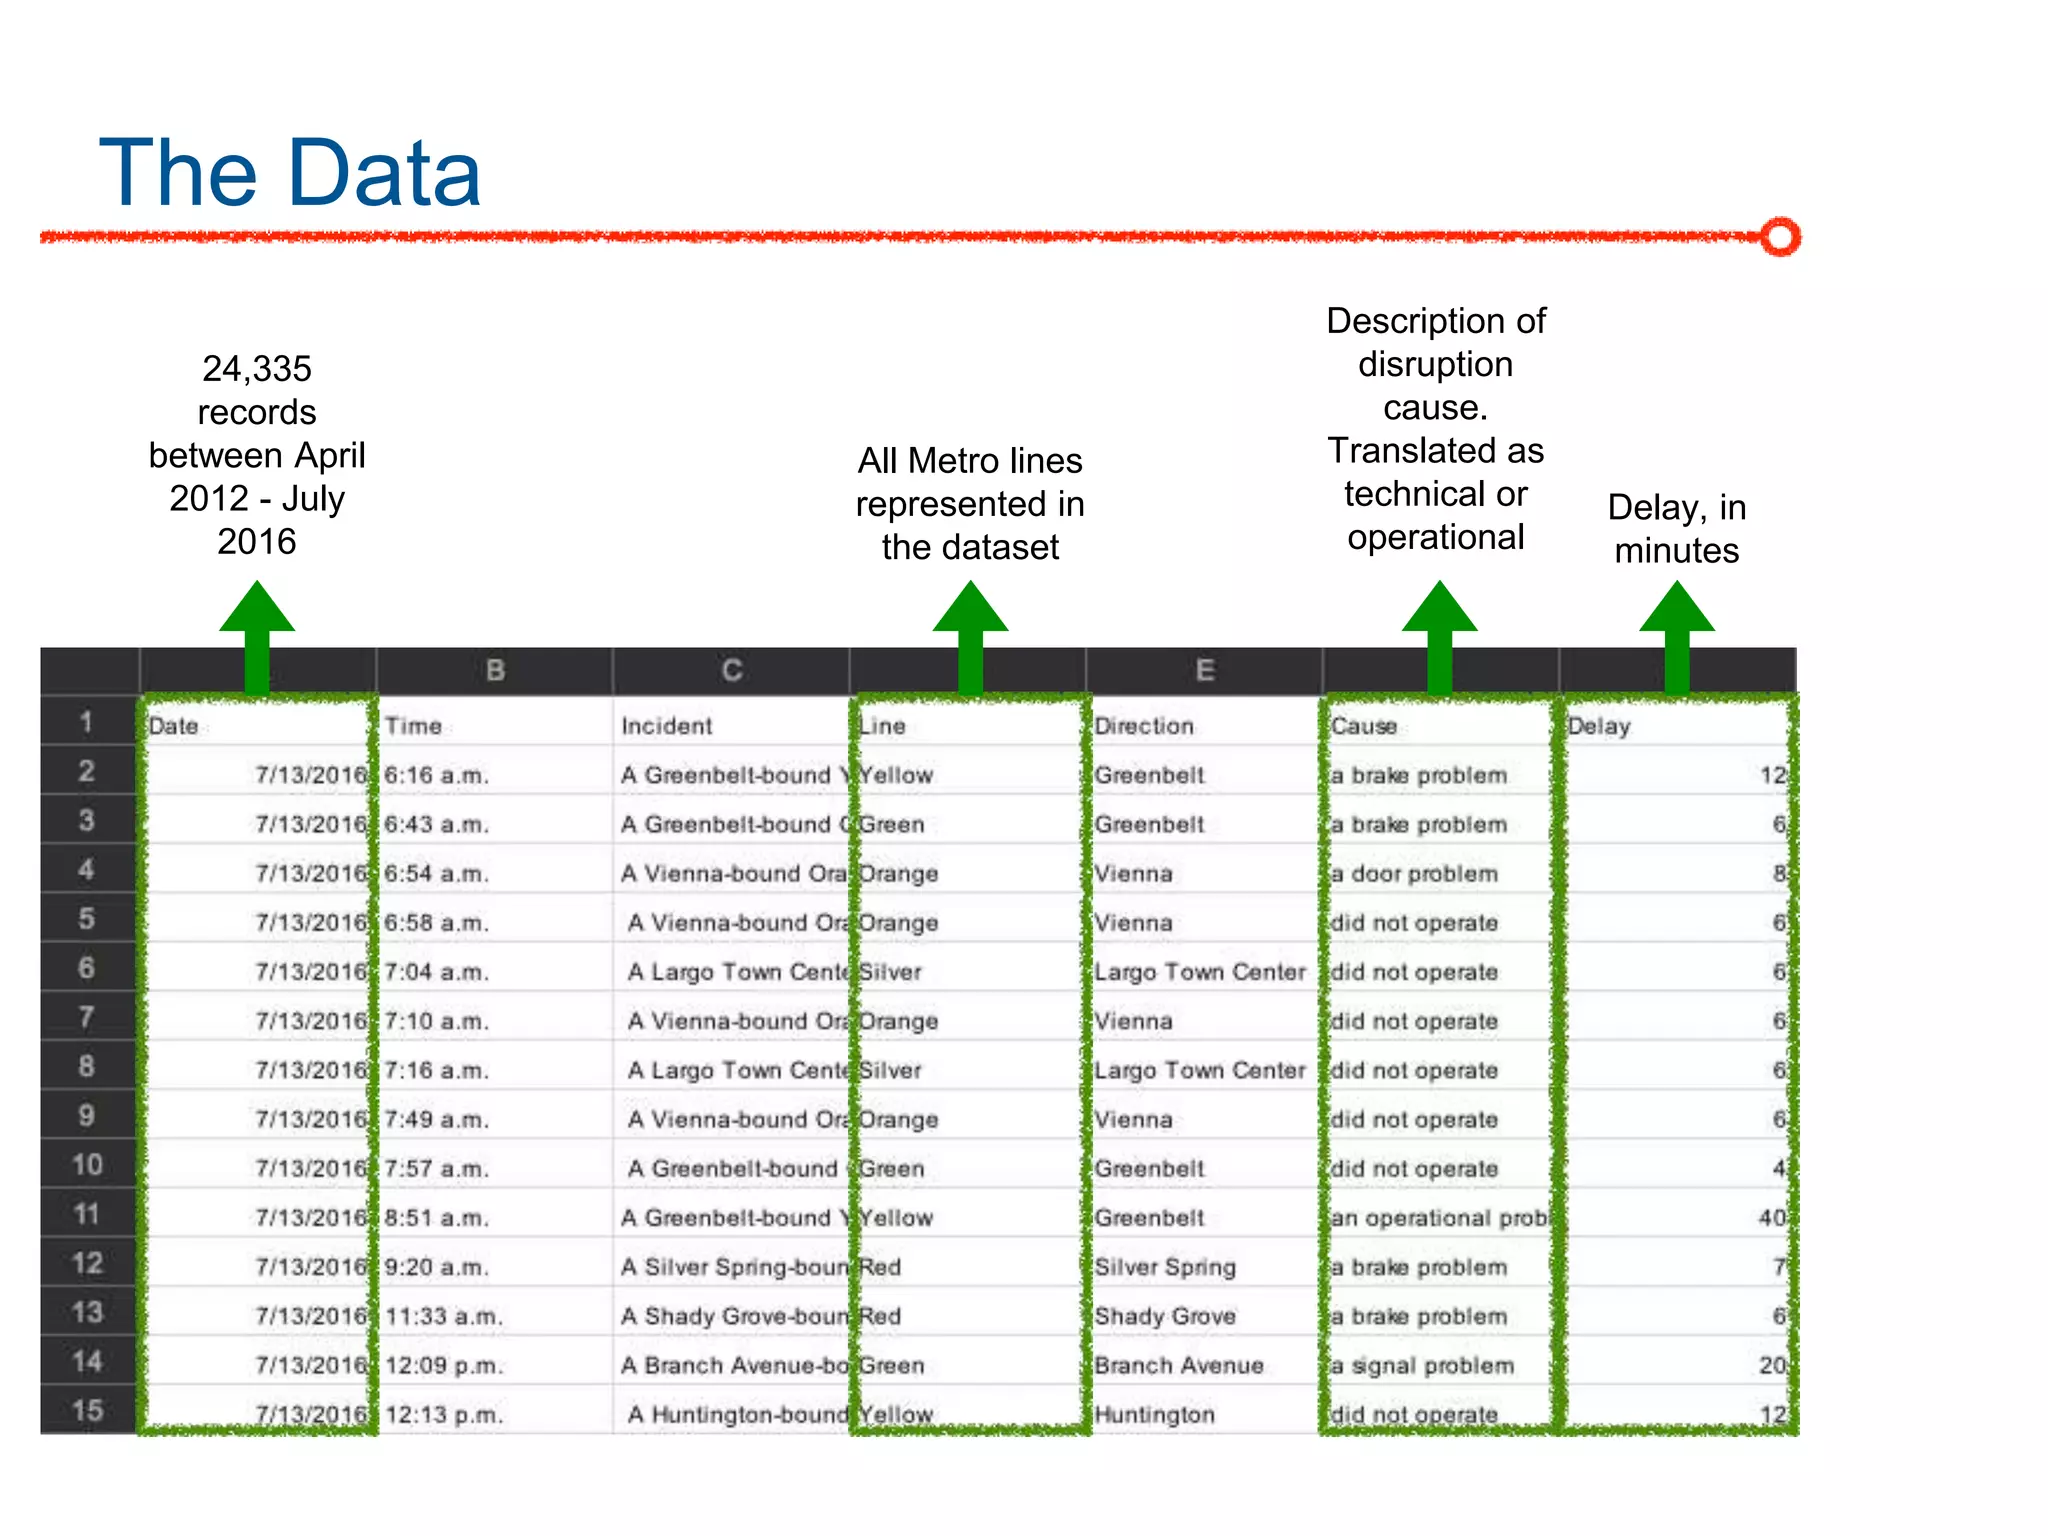
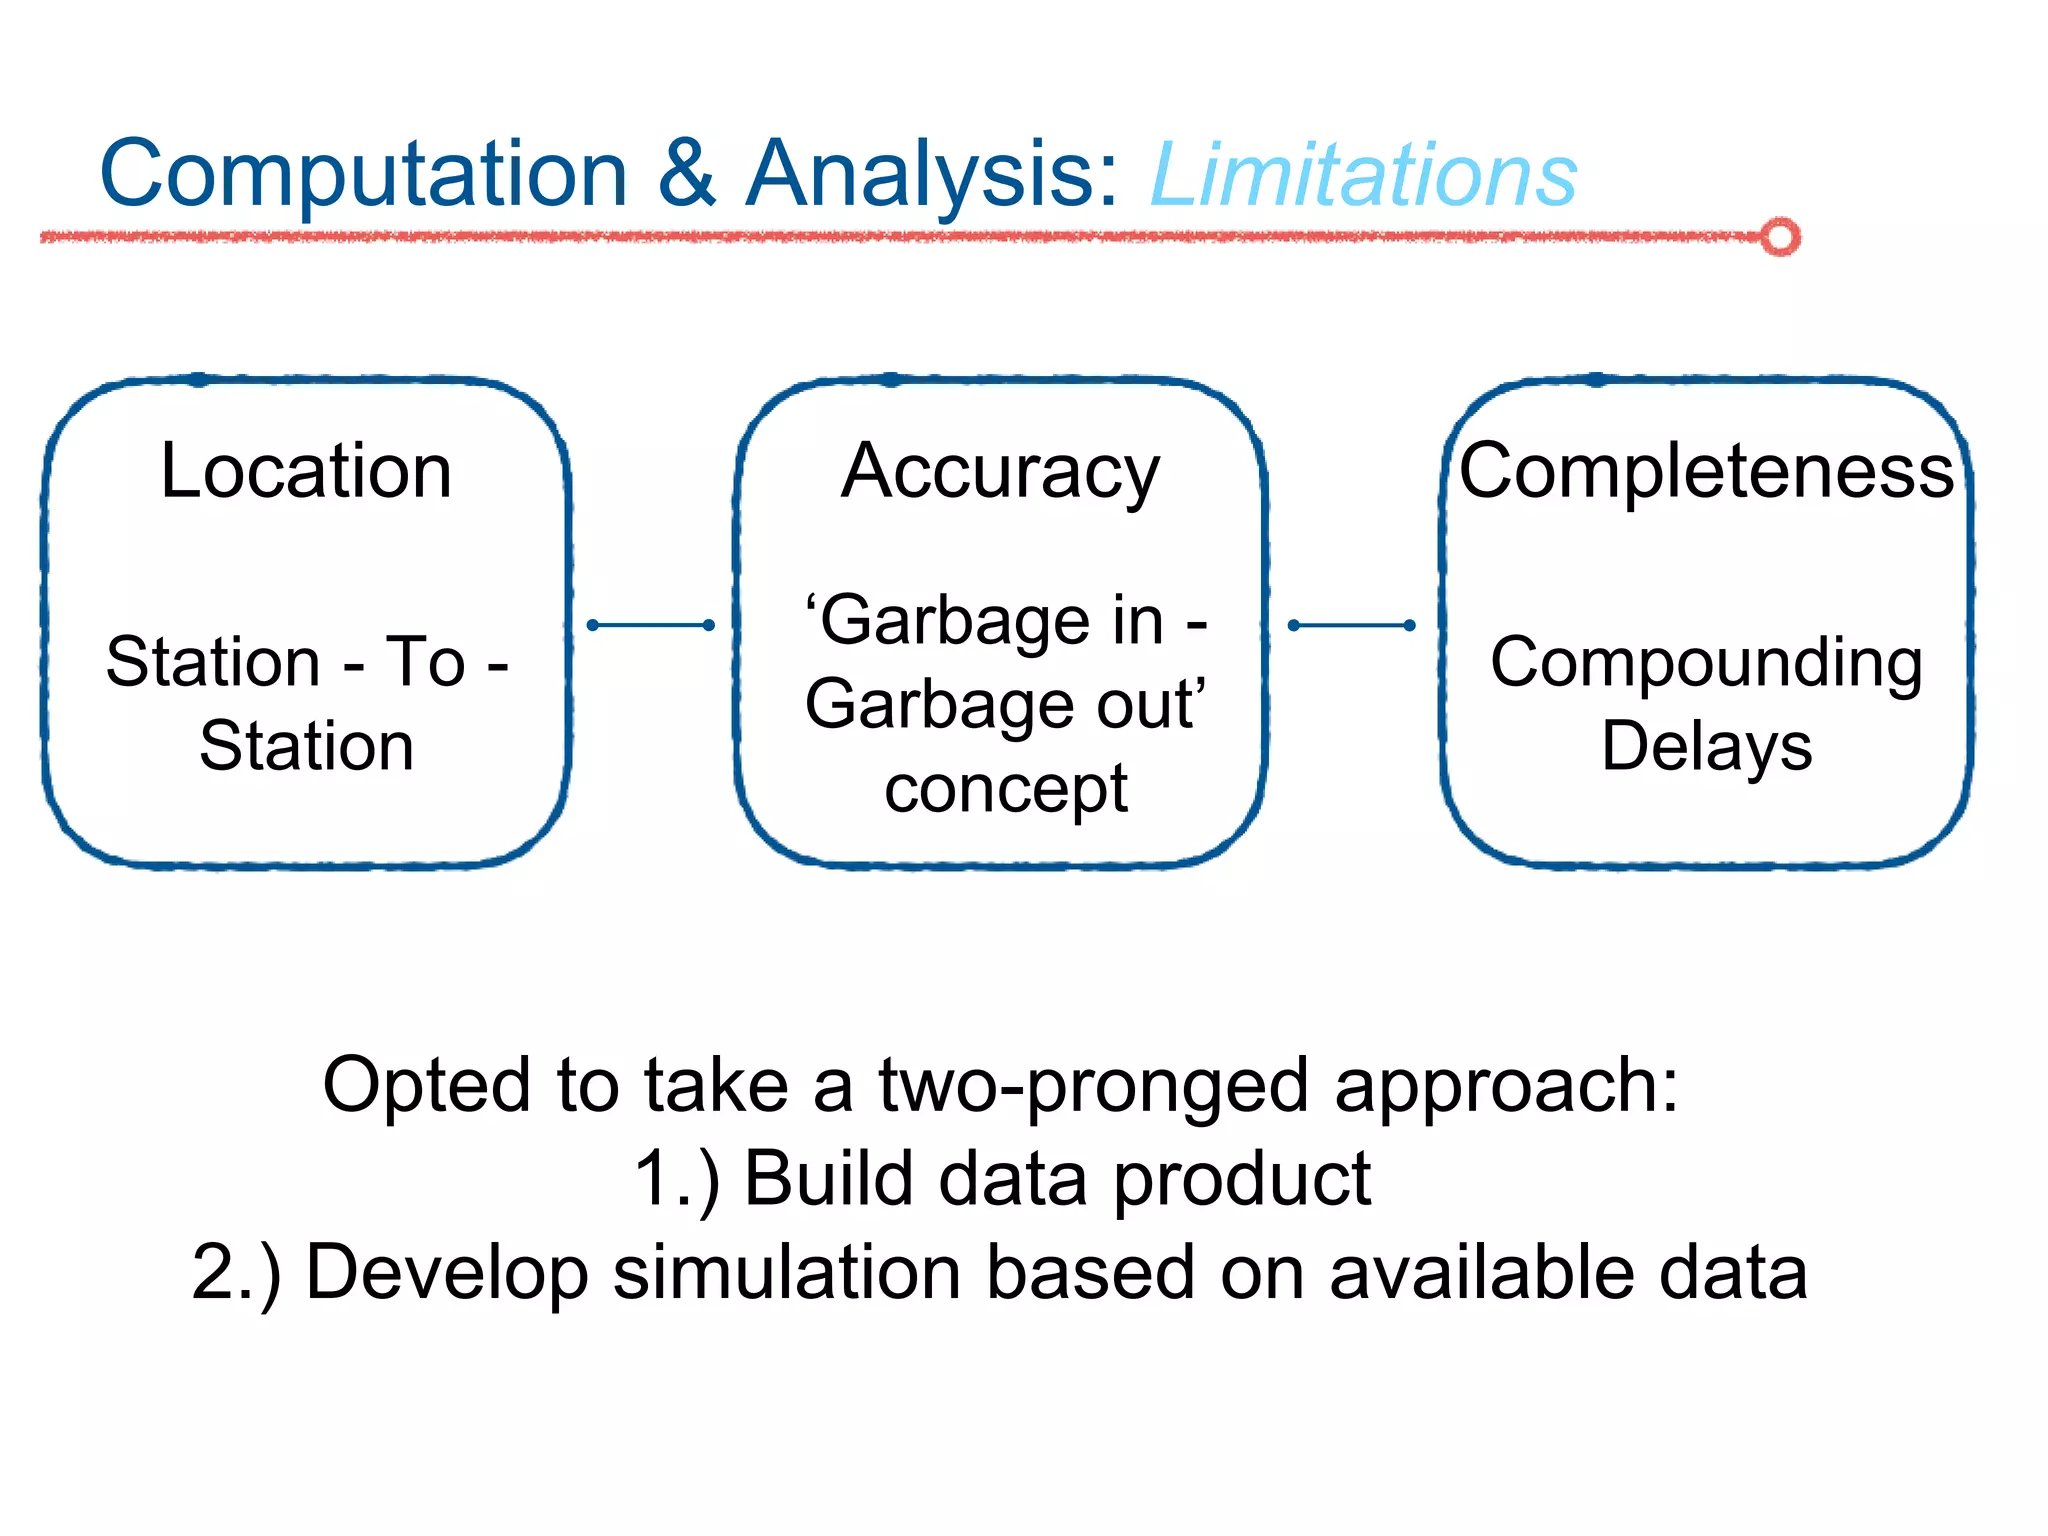
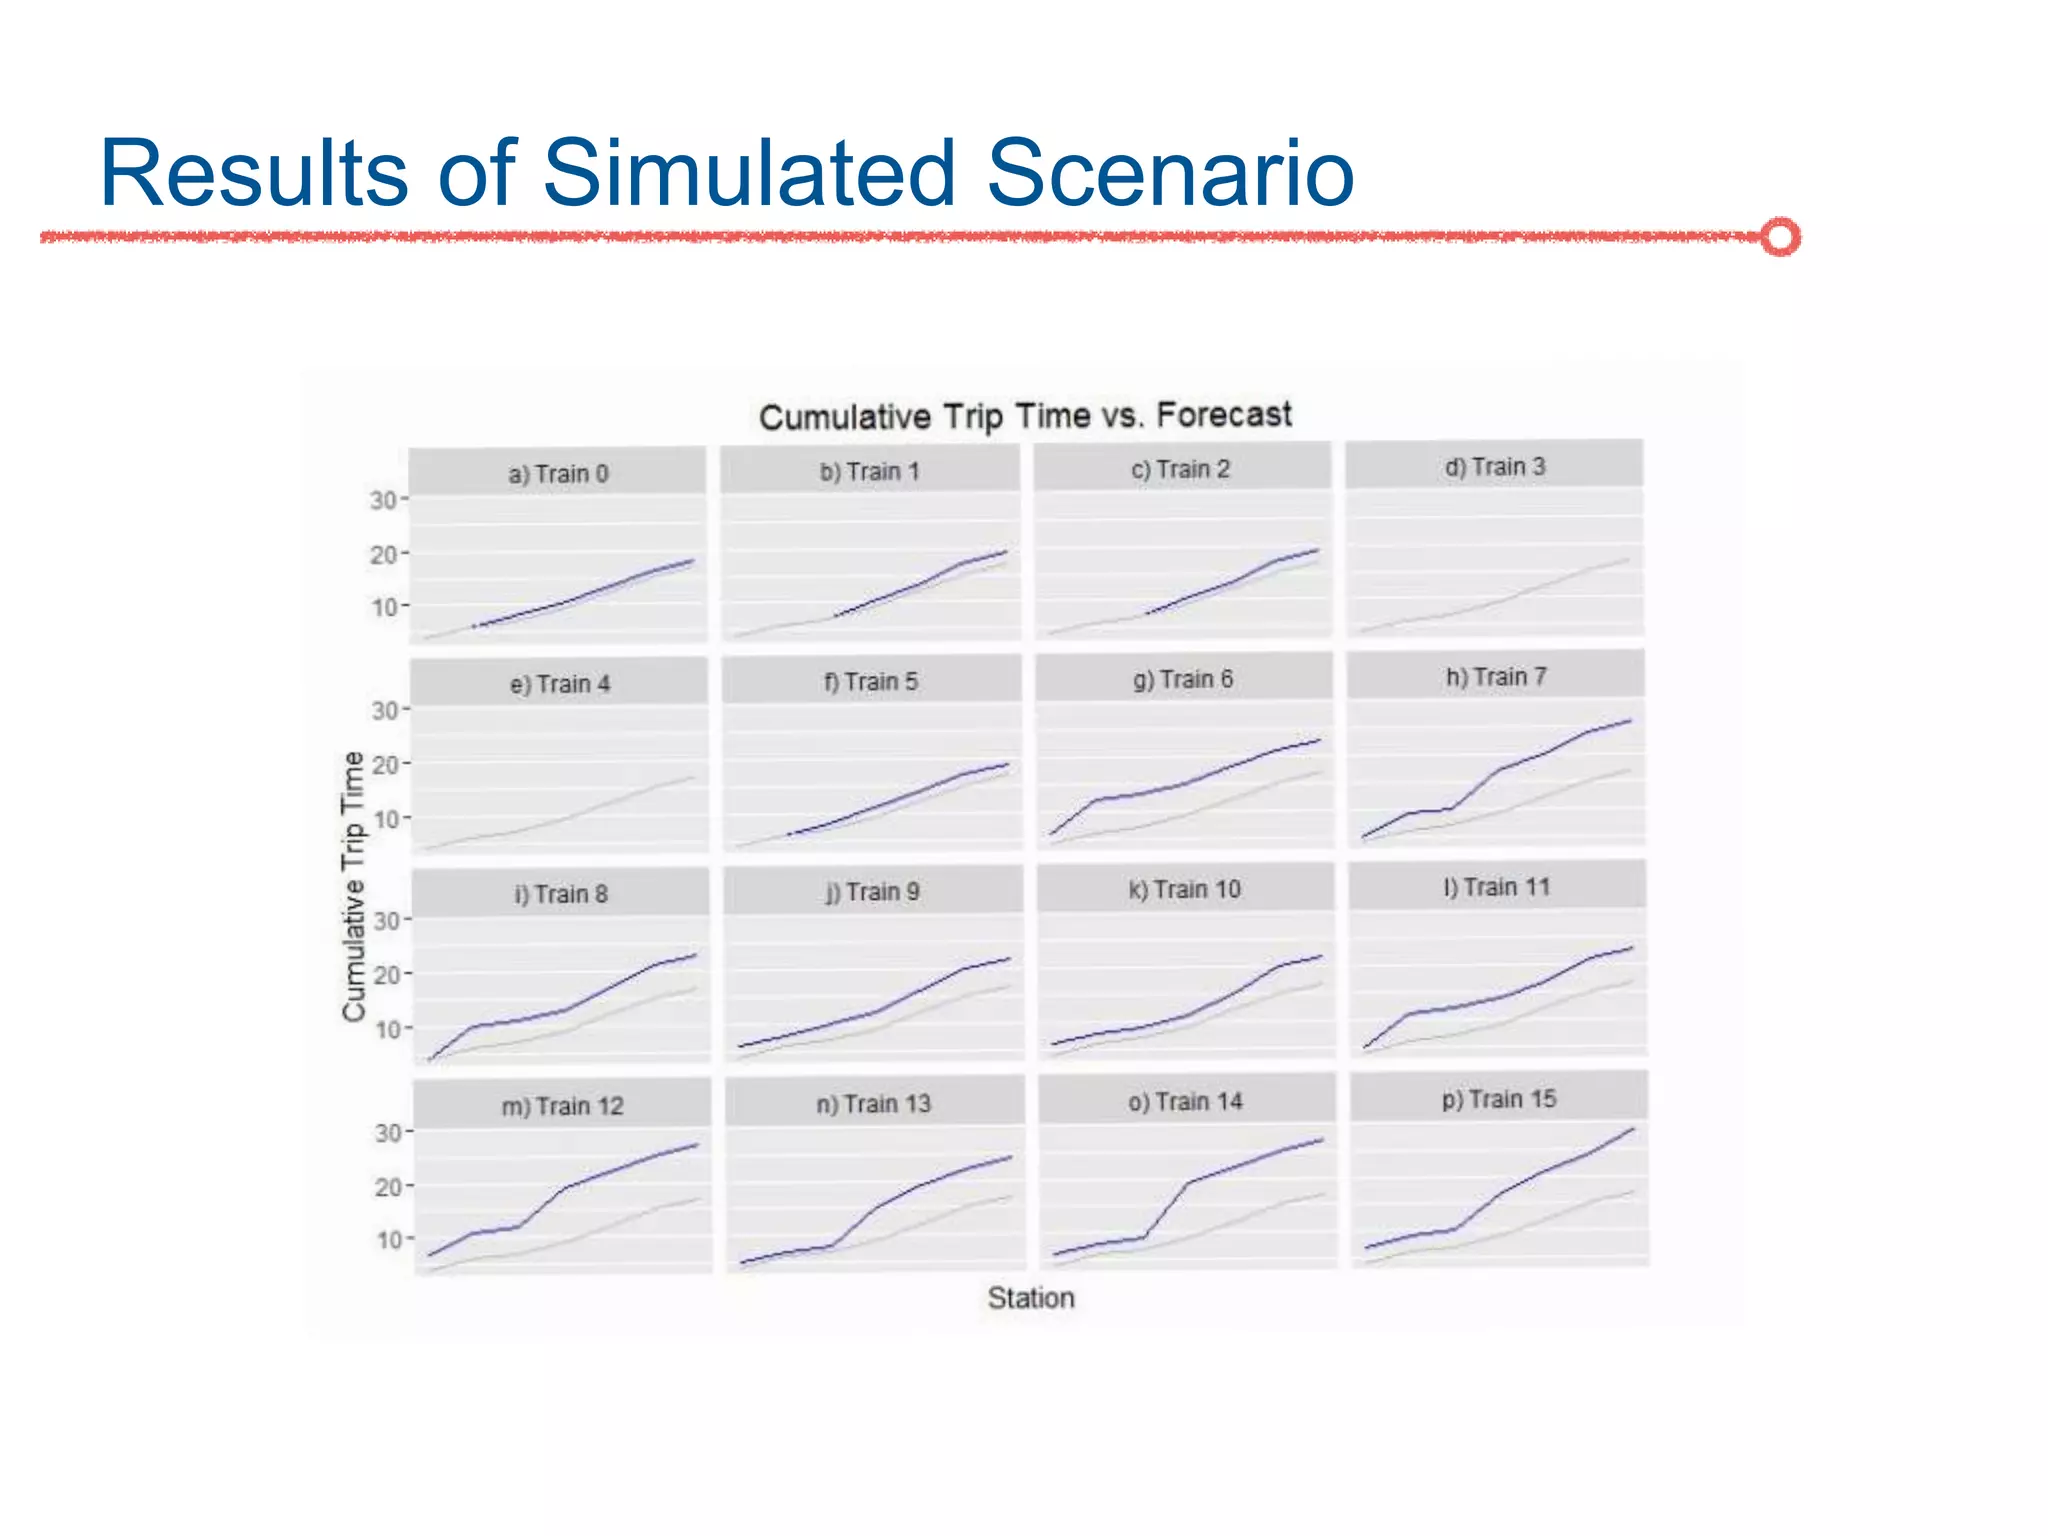
The DC Metro system carries over 250 million riders annually but experiences over 13 disruptions daily, prompting the $60 million SafeTrack maintenance project aimed at improving safety and reliability. To quantify the project's impact, the document's authors explore scenarios predicting post-SafeTrack reliability by analyzing historical operational, disruption and ridership data. Their results indicate SafeTrack repairs must reduce disruption severity and frequency by 30-50% for riders to experience improved trip safety and reliability. The authors also note limitations in data accuracy and completeness and see their work as a starting point for future reliability forecasting efforts.


![Matrix and determinant URT [Autosaved].pptx](https://cdn.slidesharecdn.com/ss_thumbnails/matrixanddeterminanturtautosaved-251018190340-9e6a6deb-thumbnail.jpg?width=600ounds&width=560&fit=bounds)