Downloaded 42 times


![Shapely GEOS
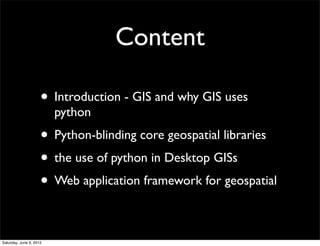
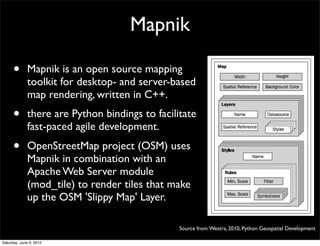
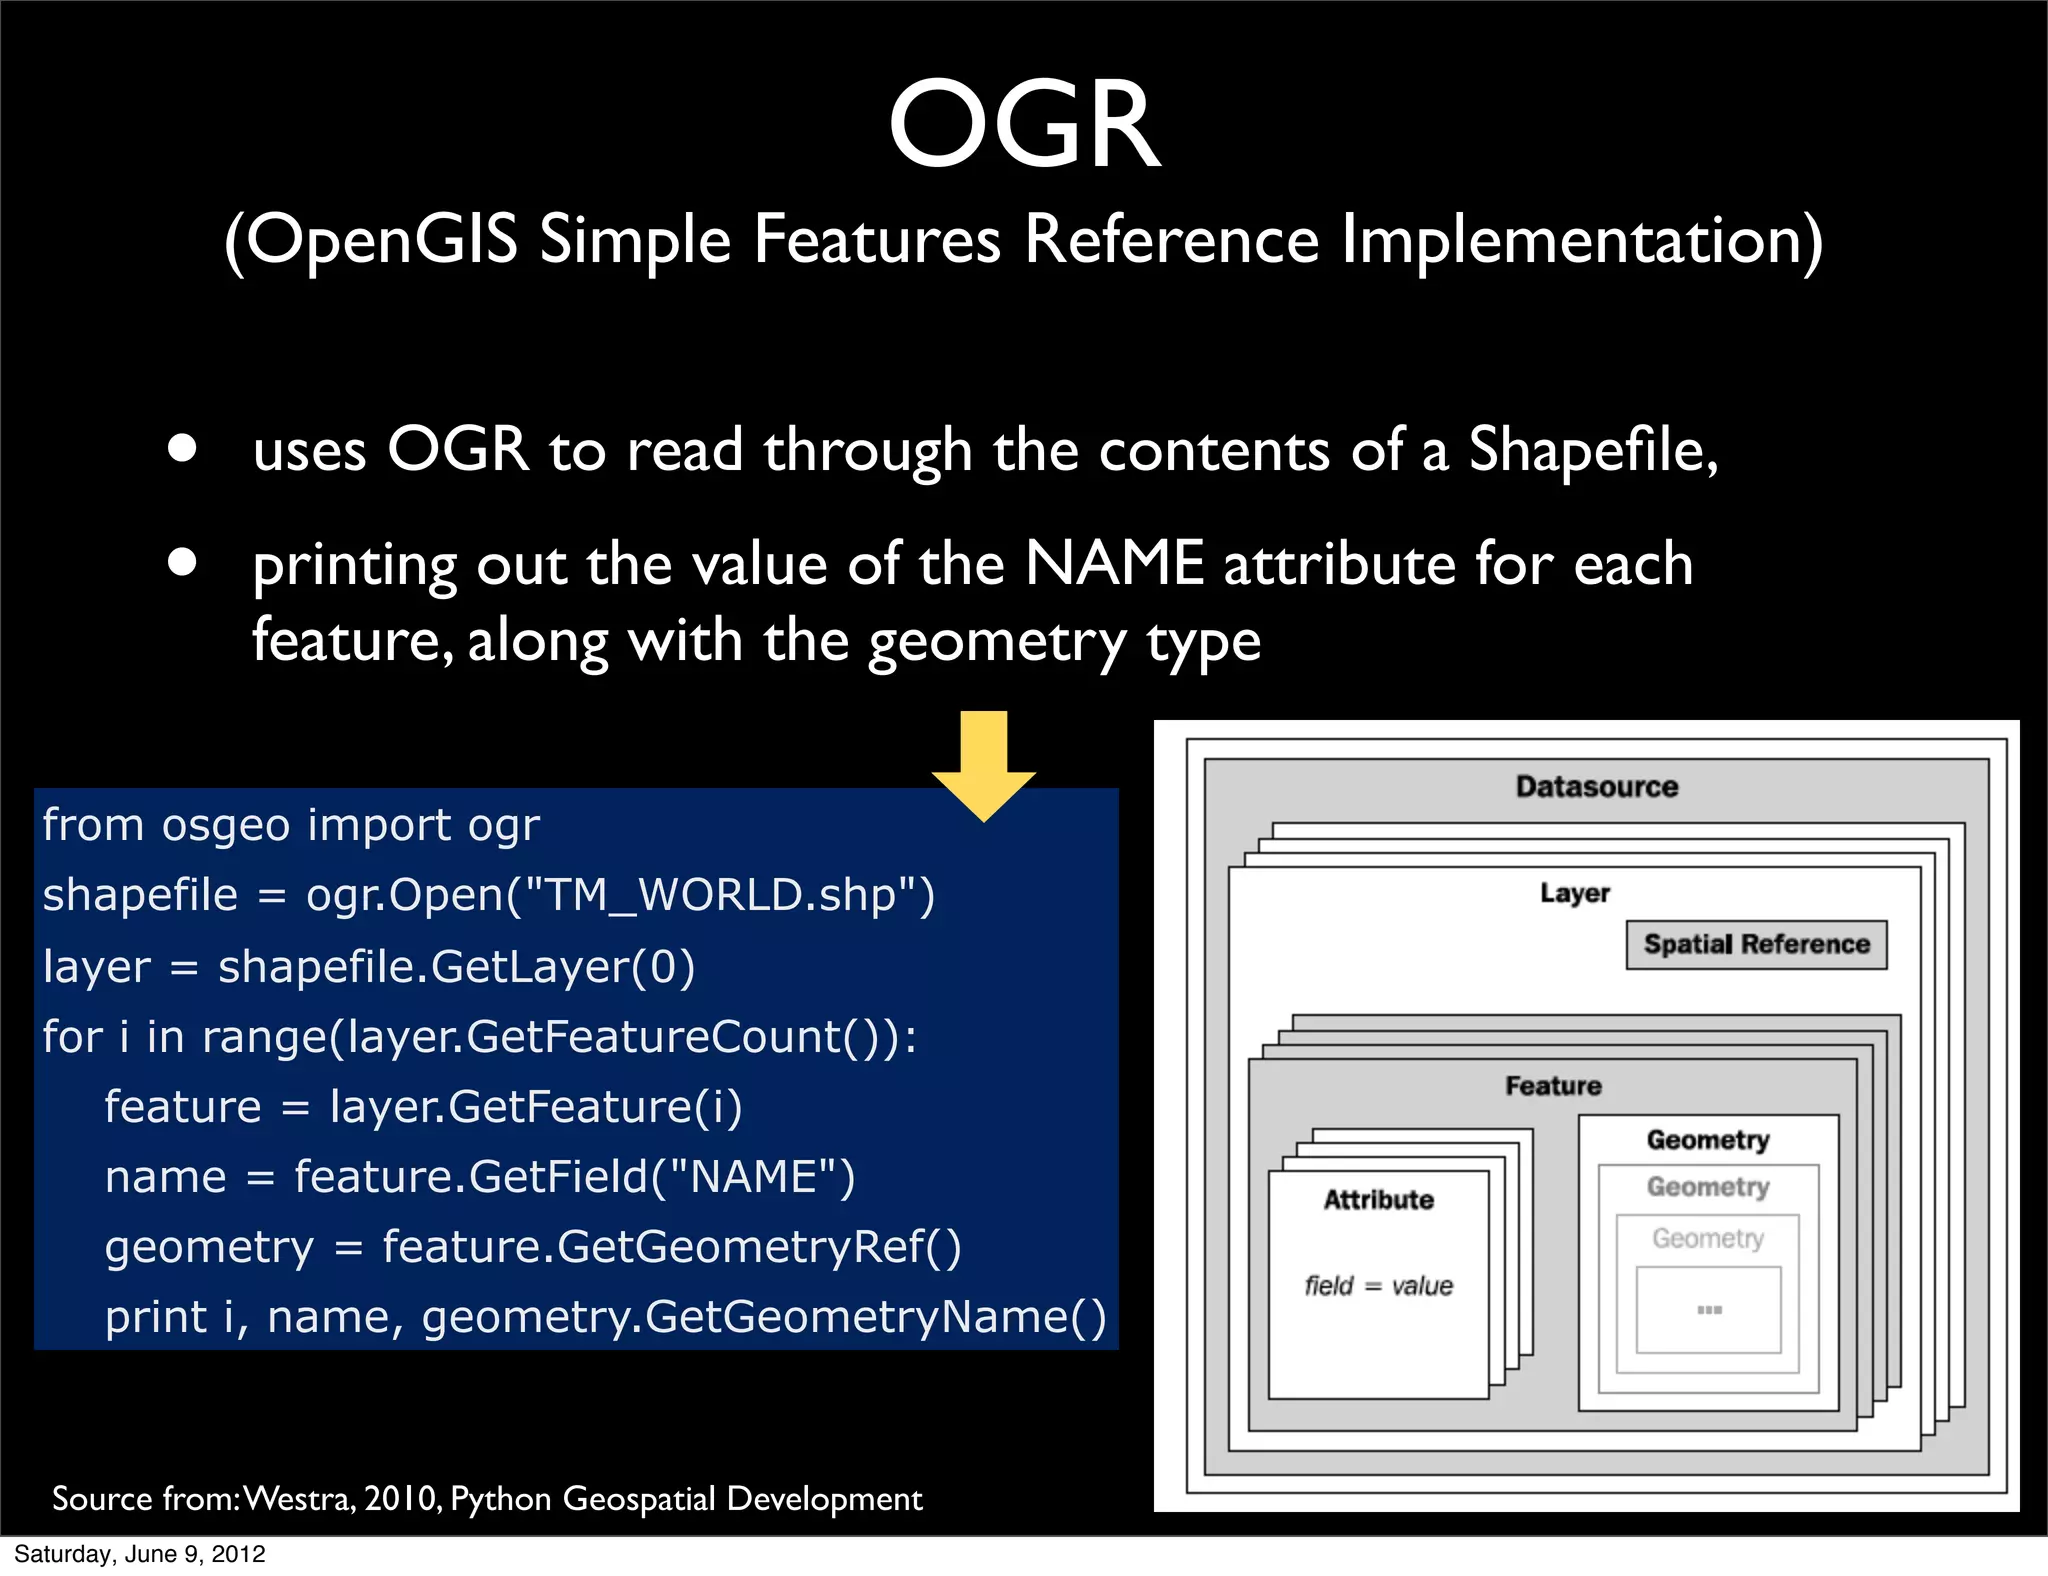
import shapely.geometry
pt = shapely.geometry.Point(0, 0)
circle = pt.buffer(1.0)
square = shapely.geometry.Polygon([(0, 0),
(1, 0),
(1, 1),
(0, 1),
(0, 0)])
intersect = circle.intersection(square)
for x,y in intersect.exterior.coords:
print x,y
Source from: Westra, 2010, Python Geospatial Development
Saturday, June 9, 2012](https://image.slidesharecdn.com/gis-dongpodeng-120610023530-phpapp02/85/Python-GIS-The-Year-Python-Takes-Over-GIS-13-320.jpg)


![Shapely GEOS
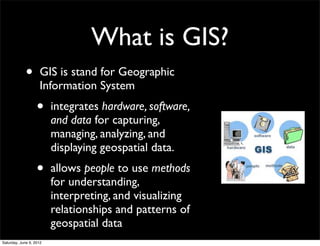
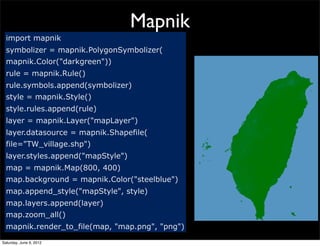
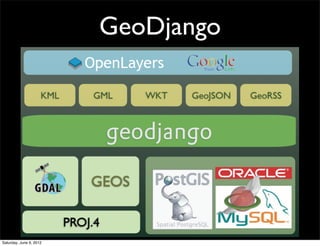
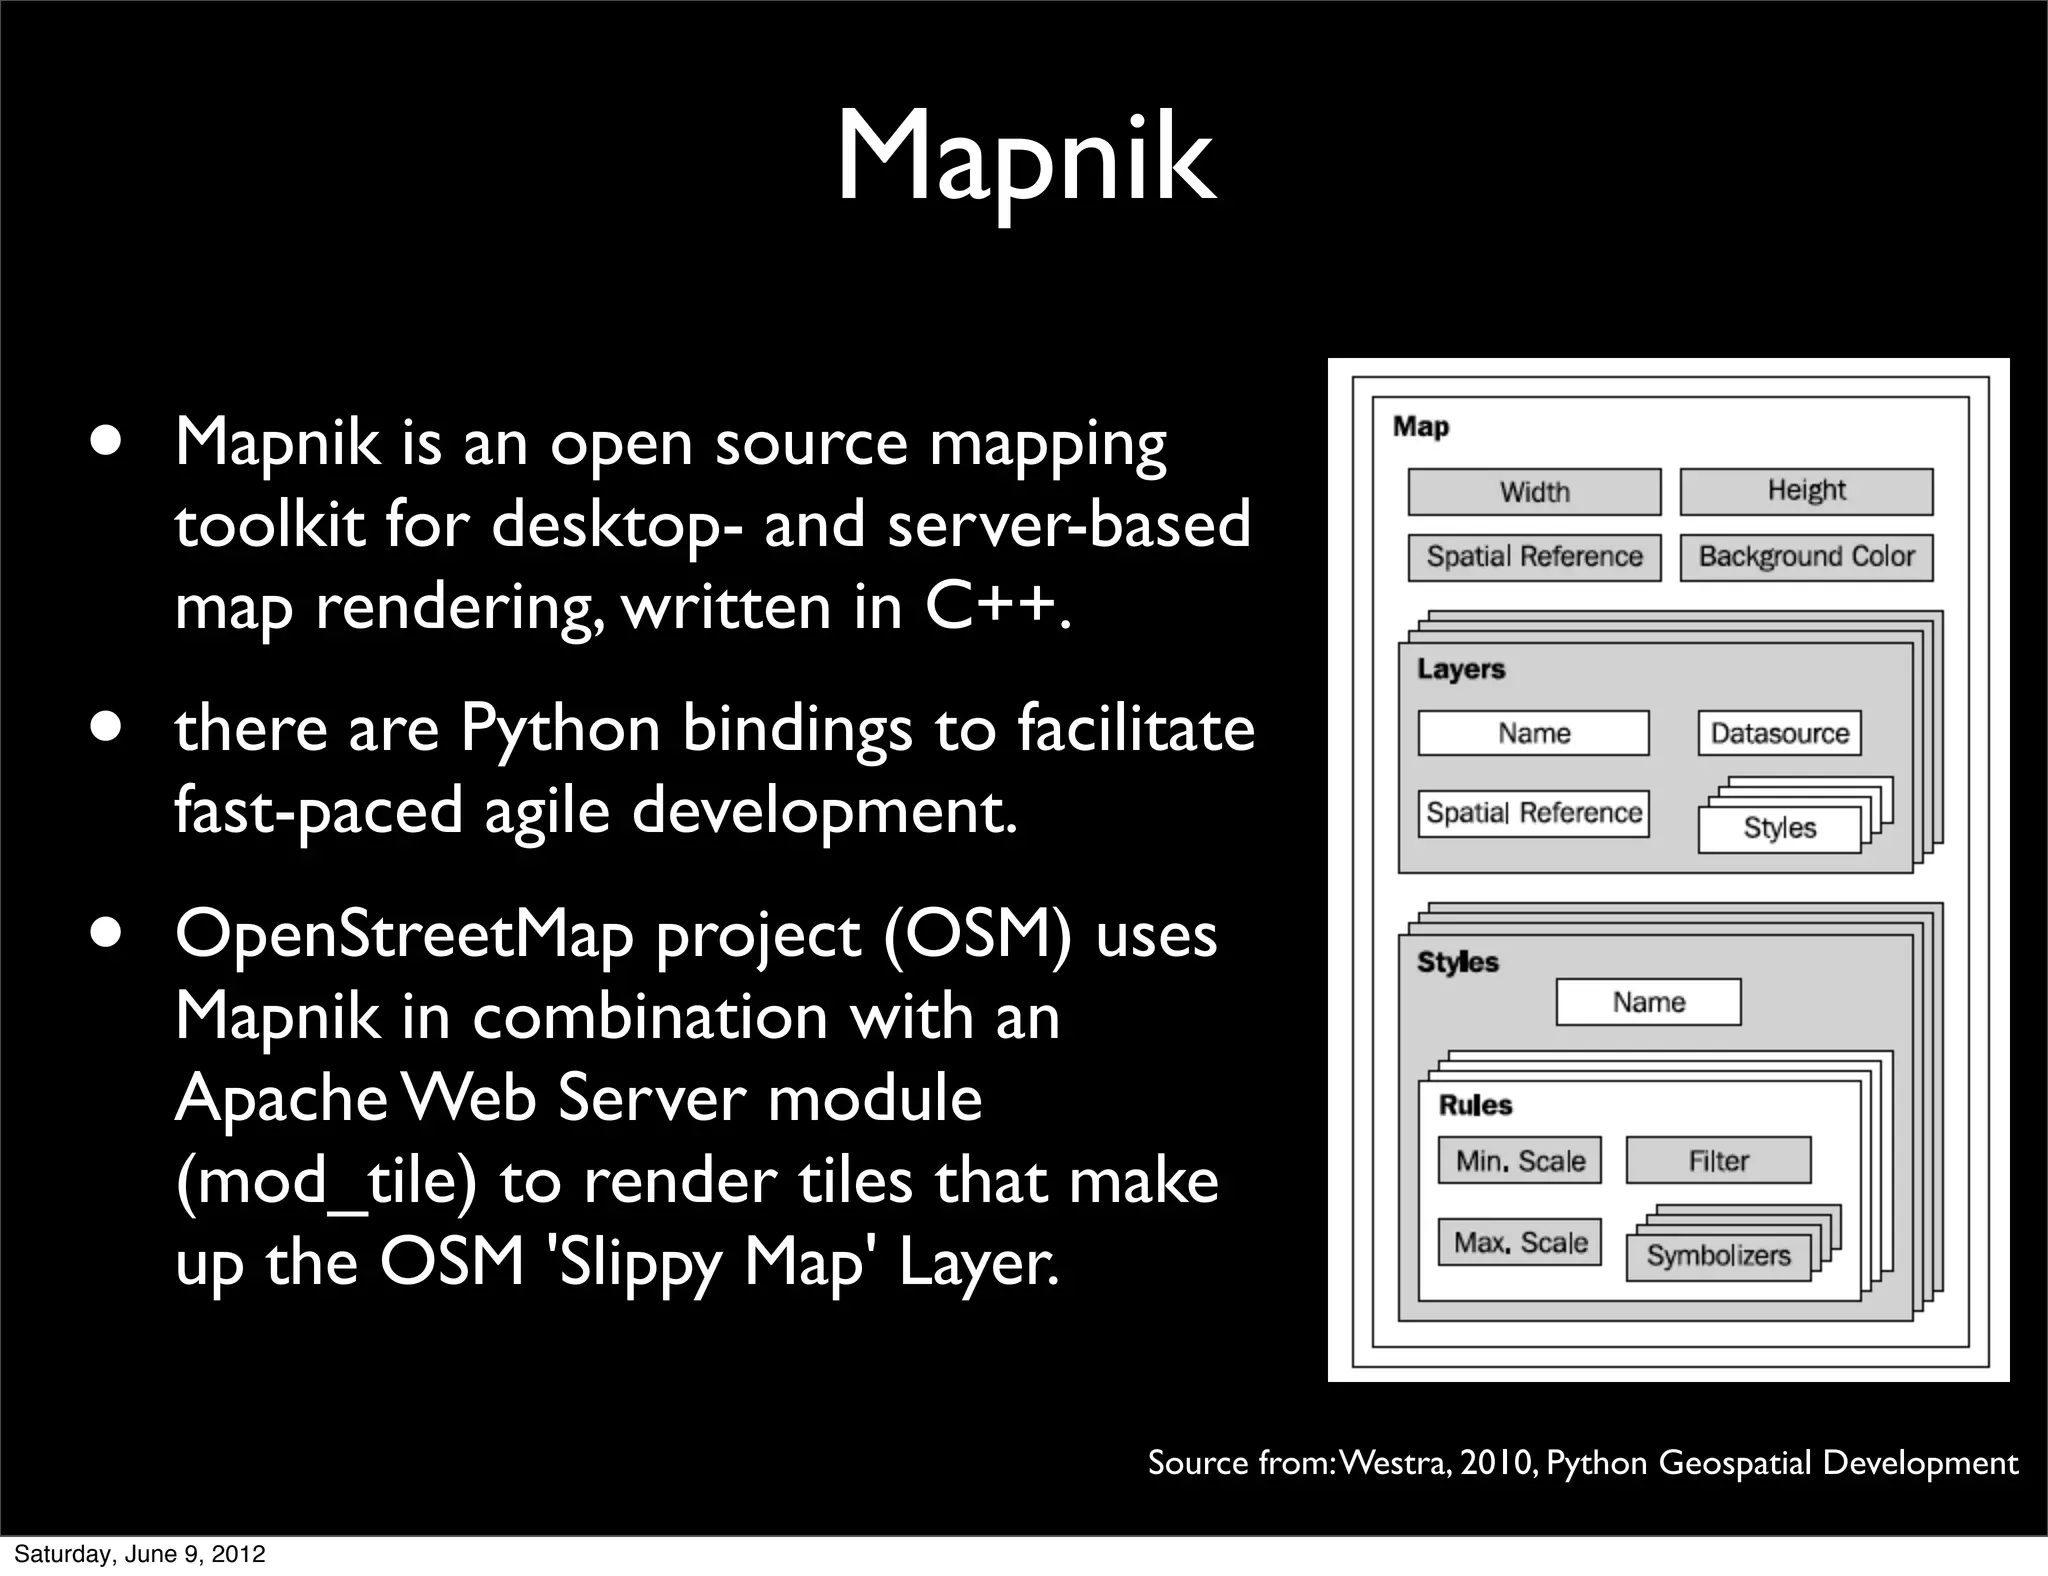
import shapely.geometry
pt = shapely.geometry.Point(0, 0)
circle = pt.buffer(1.0)
square = shapely.geometry.Polygon([(0, 0),
(1, 0),
(1, 1),
(0, 1),
(0, 0)])
intersect = circle.intersection(square)
for x,y in intersect.exterior.coords:
print x,y
Source from: Westra, 2010, Python Geospatial Development
Saturday, June 9, 2012](https://image.slidesharecdn.com/gis-dongpodeng-120610023530-phpapp02/75/Python-GIS-The-Year-Python-Takes-Over-GIS-13-2048.jpg)


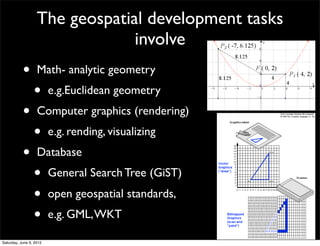
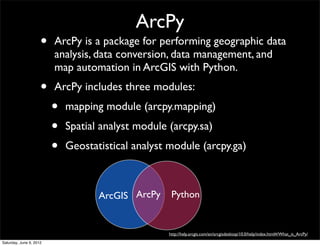
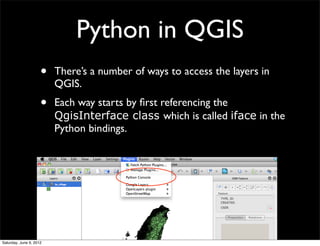
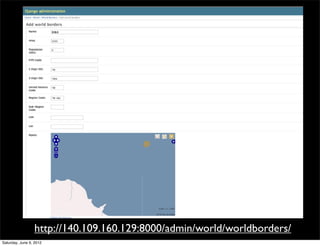
This document discusses the rise of Python in geospatial applications. It explains that Python is increasingly being used for geographic information systems (GIS) due to its ease of use, readable code, large community, and ability to interact with C and Java libraries. It then provides examples of how Python is being used with various geospatial libraries and software, including for visualization, analysis, and web mapping. Python is playing a growing role in both desktop and web-based GIS tools.


![UiPath Automation Suite Installation (Hands-On) [2/3]](https://cdn.slidesharecdn.com/ss_thumbnails/automationsuitecommunitysession2-251015095633-a6d862f1-thumbnail.jpg?width=600ounds&width=560&fit=bounds)


