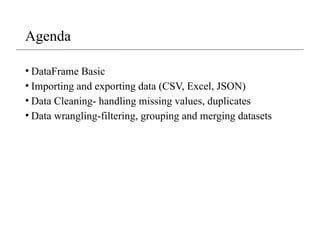
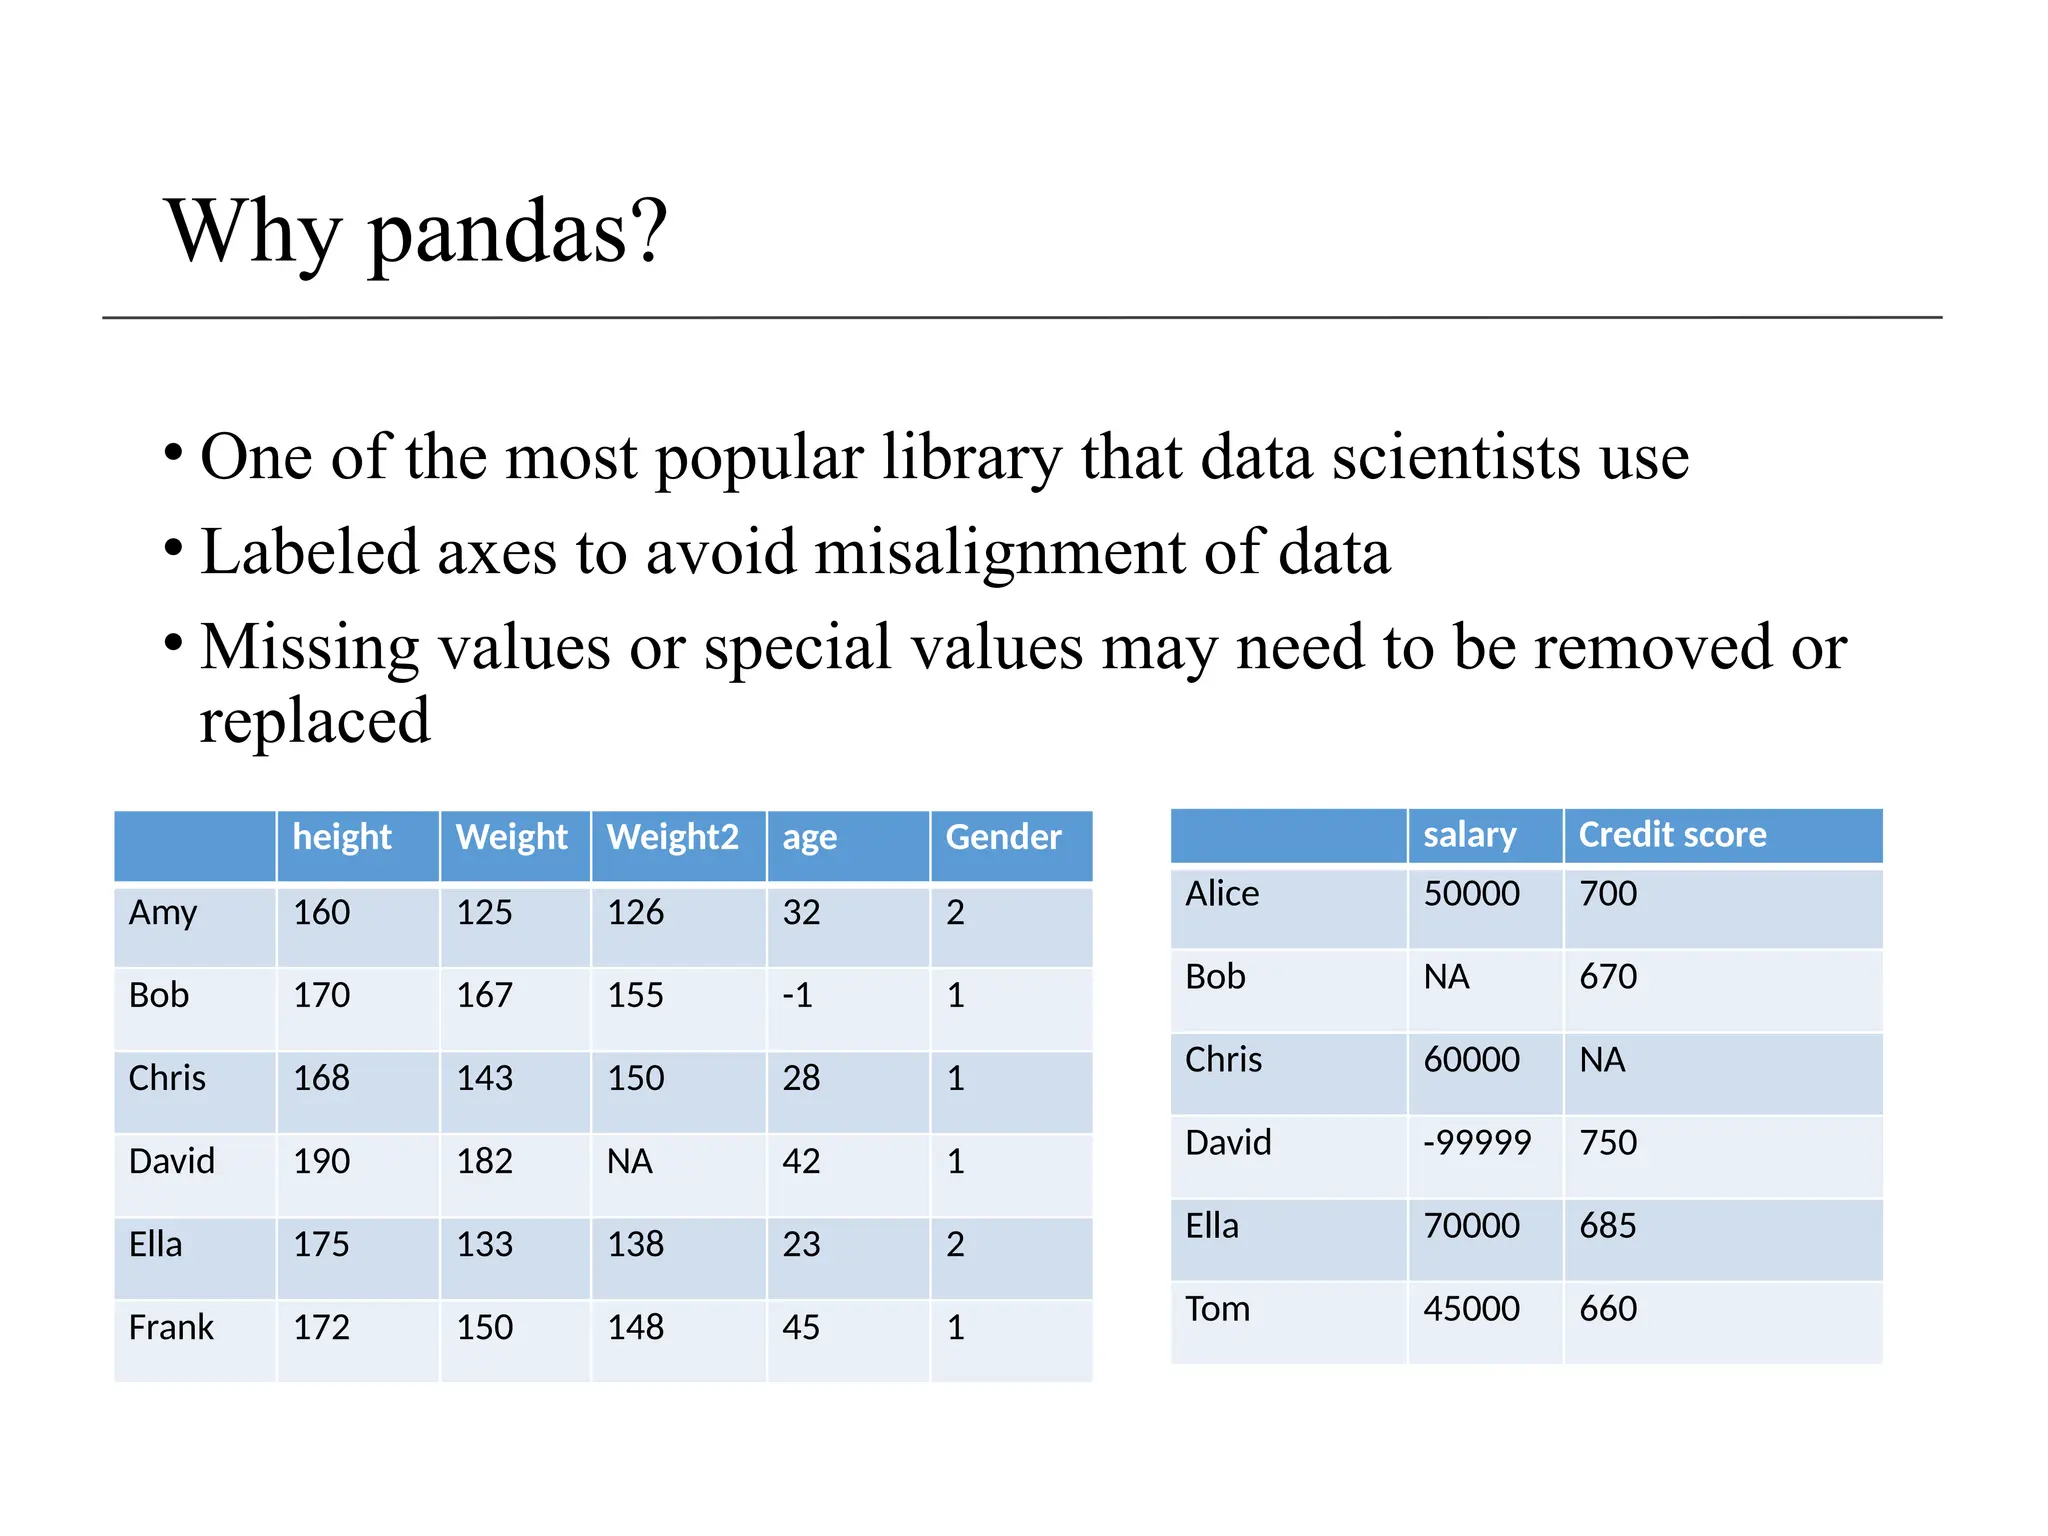
The document provides an overview of data analysis using the Pandas library in Python, covering key topics like data frames, importing/exporting data, data cleaning, and handling missing values. It discusses the structure of data frames and includes practical examples for filtering, modifying, and removing data, as well as addressing missing data with various methods. Additionally, it highlights the importance of Pandas as a powerful tool for data scientists due to its rich data structures and functionalities.


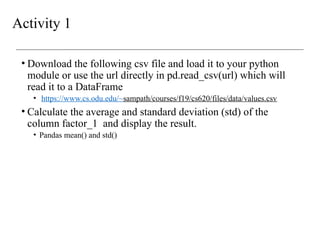
![DataFrame Basics
• A DataFrame is a tabular data structure comprised of rows and
columns, same as a spreadsheet or database table.
• It can be treated as an ordered collection of columns
• Each column can be a different data type
• Have both row and column indices
data = {'state': [‘Ohio', 'Ohio', 'Ohio', 'Nevada', 'Nevada'],
'year': [2000, 2001, 2002, 2001, 2002],
'pop': [1.5, 1.7, 3.6, 2.4, 2.9]}
frame = DataFrame(data)
print(frame)
#output
state year pop
0 Ohio 2000 1.5
1 Ohio 2001 1.7
2 Ohio 2002 3.6
3 Nevada 2001 2.4
4 Nevada 2002 2.9](https://image.slidesharecdn.com/pandas-250105045330-0b779f47/85/Python-libraries-for-analysis-Pandas-pptx-8-320.jpg)
![DataFrame – specifying columns and indices
• Order of columns/rows can be specified.
• Columns not in data will have NaN.
frame2 = DataFrame(data, columns=['year', 'state', 'pop', 'debt'], index=['A', 'B', 'C', 'D', 'E'])
Print(frame2)
year state pop debt
A 2000 Ohio 1.5 NaN
B 2001 Ohio 1.7 NaN
C 2002 Ohio 3.6 NaN
D 2001 Nevada 2.4 NaN
E 2002 Nevada 2.9 NaN
Same order
Initialized with NaN](https://image.slidesharecdn.com/pandas-250105045330-0b779f47/85/Python-libraries-for-analysis-Pandas-pptx-9-320.jpg)
![DataFrame – index, columns, values
frame3.index.name = 'year'
frame3.columns.name='state‘
print(frame3)
state Nevada Ohio
year
2000 NaN 1.5
2001 2.9 1.7
2002 2.9 3.6
print(frame3.index)
Int64Index([2000, 2001, 2002], dtype='int64', name='year')
print(frame3.columns)
Index(['Nevada', 'Ohio'], dtype='object', name='state')
print(frame3.values)
[[nan 1.5]
[2.9 1.7]
[2.9 3.6]]](https://image.slidesharecdn.com/pandas-250105045330-0b779f47/85/Python-libraries-for-analysis-Pandas-pptx-10-320.jpg)
![DataFrame – retrieving a column
• A column in a DataFrame can be retrieved as a Series by
dict-like notation or as attribute
data = {'state': ['Ohio', 'Ohio', 'Ohio', 'Nevada', 'Nevada'],
'year': [2000, 2001, 2002, 2001, 2002],
'pop': [1.5, 1.7, 3.6, 2.4, 2.9]}
frame = DataFrame(data)
print(frame['state'])
0 Ohio
1 Ohio
2 Ohio
3 Nevada
4 Nevada
Name: state, dtype: object
print(frame.state)
0 Ohio
1 Ohio
2 Ohio
3 Nevada
4 Nevada
Name: state, dtype: object](https://image.slidesharecdn.com/pandas-250105045330-0b779f47/85/Python-libraries-for-analysis-Pandas-pptx-11-320.jpg)
![DataFrame – getting rows
• loc for using indexes and iloc for using positions
• loc gets rows (or columns) with particular labels from the index.
• iloc gets rows (or columns) at particular positions in the index (so it only takes integers).
data = {'state': ['Ohio', 'Ohio', 'Ohio', 'Nevada', 'Nevada'],
'year': [2000, 2001, 2002, 2001, 2002],
'pop': [1.5, 1.7, 3.6, 2.4, 2.9]}
frame2 = DataFrame(data, columns=['year', 'state', 'pop', 'debt'], index=['A', 'B', 'C', 'D', 'E'])
print(frame2)
year state pop debt
A 2000 Ohio 1.5 NaN
B 2001 Ohio 1.7 NaN
C 2002 Ohio 3.6 NaN
D 2001 Nevada 2.4 NaN
E 2002 Nevada 2.9 NaN
print(frame2.loc['A'])
year 2000
state Ohio
pop 1.5
debt NaN
Name: A, dtype: object
print(frame2.loc[['A', 'B']])
year state pop debt
A 2000 Ohio 1.5 NaN
B 2001 Ohio 1.7 NaN
print(frame2.loc['A':'E',
['state','pop']])
state pop
A Ohio 1.5
B Ohio 1.7
C Ohio 3.6
D Nevada 2.4
E Nevada 2.9
print(frame2.iloc[1:3])
year state pop debt
B 2001 Ohio 1.7 NaN
C 2002 Ohio 3.6 NaN
print(frame2.iloc[:,1:3])
state pop
A Ohio 1.5
B Ohio 1.7
C Ohio 3.6
D Nevada 2.4
E Nevada 2.9](https://image.slidesharecdn.com/pandas-250105045330-0b779f47/85/Python-libraries-for-analysis-Pandas-pptx-13-320.jpg)
![DataFrame – modifying columns
frame2['debt'] = 0
print(frame2)
year state pop debt
A 2000 Ohio 1.5 0
B 2001 Ohio 1.7 0
C 2002 Ohio 3.6 0
D 2001 Nevada 2.4 0
E 2002 Nevada 2.9 0
frame2['debt'] = range(5)
print(frame2)
year state pop debt
A 2000 Ohio 1.5 0
B 2001 Ohio 1.7 1
C 2002 Ohio 3.6 2
D 2001 Nevada 2.4 3
E 2002 Nevada 2.9 4
val = Series([10, 10, 10], index = ['A', 'C', 'D'])
frame2['debt'] = val
print(frame2)
year state pop debt
A 2000 Ohio 1.5 10.0
B 2001 Ohio 1.7 NaN
C 2002 Ohio 3.6 10.0
D 2001 Nevada 2.4 10.0
E 2002 Nevada 2.9 NaN
Rows or individual elements can be
modified similarly. Using loc or iloc.](https://image.slidesharecdn.com/pandas-250105045330-0b779f47/85/Python-libraries-for-analysis-Pandas-pptx-14-320.jpg)
![DataFrame – removing columns
del frame2['debt']
print(frame2)
year state pop
A 2000 Ohio 1.5
B 2001 Ohio 1.7
C 2002 Ohio 3.6
D 2001 Nevada 2.4
E 2002 Nevada 2.9](https://image.slidesharecdn.com/pandas-250105045330-0b779f47/85/Python-libraries-for-analysis-Pandas-pptx-15-320.jpg)
![Removing rows/columns
print(frame)
c1 c2 c3
r1 0 1 2
r2 3 4 5
r3 6 7 8
print(frame.drop(['r1']))
c1 c2 c3
r2 3 4 5
r3 6 7 8
print(frame.drop(['r1','r3']))
c1 c2 c3
r2 3 4 5
print(frame.drop(['c1'], axis=1))
c2 c3
r1 1 2
r2 4 5
r3 7 8
This returns a new object](https://image.slidesharecdn.com/pandas-250105045330-0b779f47/85/Python-libraries-for-analysis-Pandas-pptx-16-320.jpg)
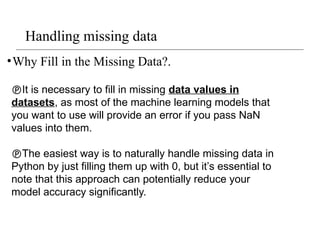

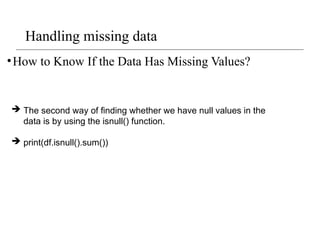
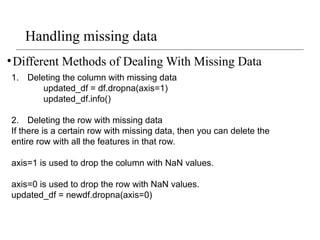
![Handling missing data
•Different Methods of Dealing With Missing Data
3. Filling the Missing Values – Imputation
The possible ways to do this are:
Filling the missing data with the mean or median value if it’s a
numerical variable.
Filling the missing data with mode if it’s a categorical value.
Filling the numerical value with 0 or -999, or some other number
that will not occur in the data. This can be done so that the machine
can recognize that the data is not real or is different.
Filling the categorical value with a new type for the missing values.
You can use the fillna() function to fill the null values in the dataset.
updated_df = df
updated_df['Age']=updated_df['Age'].fillna(updated_df['Age'].mean()
)](https://image.slidesharecdn.com/pandas-250105045330-0b779f47/85/Python-libraries-for-analysis-Pandas-pptx-21-320.jpg)


![DataFrame Basics
• A DataFrame is a tabular data structure comprised of rows and
columns, same as a spreadsheet or database table.
• It can be treated as an ordered collection of columns
• Each column can be a different data type
• Have both row and column indices
data = {'state': [‘Ohio', 'Ohio', 'Ohio', 'Nevada', 'Nevada'],
'year': [2000, 2001, 2002, 2001, 2002],
'pop': [1.5, 1.7, 3.6, 2.4, 2.9]}
frame = DataFrame(data)
print(frame)
#output
state year pop
0 Ohio 2000 1.5
1 Ohio 2001 1.7
2 Ohio 2002 3.6
3 Nevada 2001 2.4
4 Nevada 2002 2.9](https://image.slidesharecdn.com/pandas-250105045330-0b779f47/75/Python-libraries-for-analysis-Pandas-pptx-8-2048.jpg)
![DataFrame – specifying columns and indices
• Order of columns/rows can be specified.
• Columns not in data will have NaN.
frame2 = DataFrame(data, columns=['year', 'state', 'pop', 'debt'], index=['A', 'B', 'C', 'D', 'E'])
Print(frame2)
year state pop debt
A 2000 Ohio 1.5 NaN
B 2001 Ohio 1.7 NaN
C 2002 Ohio 3.6 NaN
D 2001 Nevada 2.4 NaN
E 2002 Nevada 2.9 NaN
Same order
Initialized with NaN](https://image.slidesharecdn.com/pandas-250105045330-0b779f47/75/Python-libraries-for-analysis-Pandas-pptx-9-2048.jpg)
![DataFrame – index, columns, values
frame3.index.name = 'year'
frame3.columns.name='state‘
print(frame3)
state Nevada Ohio
year
2000 NaN 1.5
2001 2.9 1.7
2002 2.9 3.6
print(frame3.index)
Int64Index([2000, 2001, 2002], dtype='int64', name='year')
print(frame3.columns)
Index(['Nevada', 'Ohio'], dtype='object', name='state')
print(frame3.values)
[[nan 1.5]
[2.9 1.7]
[2.9 3.6]]](https://image.slidesharecdn.com/pandas-250105045330-0b779f47/75/Python-libraries-for-analysis-Pandas-pptx-10-2048.jpg)
![DataFrame – retrieving a column
• A column in a DataFrame can be retrieved as a Series by
dict-like notation or as attribute
data = {'state': ['Ohio', 'Ohio', 'Ohio', 'Nevada', 'Nevada'],
'year': [2000, 2001, 2002, 2001, 2002],
'pop': [1.5, 1.7, 3.6, 2.4, 2.9]}
frame = DataFrame(data)
print(frame['state'])
0 Ohio
1 Ohio
2 Ohio
3 Nevada
4 Nevada
Name: state, dtype: object
print(frame.state)
0 Ohio
1 Ohio
2 Ohio
3 Nevada
4 Nevada
Name: state, dtype: object](https://image.slidesharecdn.com/pandas-250105045330-0b779f47/75/Python-libraries-for-analysis-Pandas-pptx-11-2048.jpg)
![DataFrame – getting rows
• loc for using indexes and iloc for using positions
• loc gets rows (or columns) with particular labels from the index.
• iloc gets rows (or columns) at particular positions in the index (so it only takes integers).
data = {'state': ['Ohio', 'Ohio', 'Ohio', 'Nevada', 'Nevada'],
'year': [2000, 2001, 2002, 2001, 2002],
'pop': [1.5, 1.7, 3.6, 2.4, 2.9]}
frame2 = DataFrame(data, columns=['year', 'state', 'pop', 'debt'], index=['A', 'B', 'C', 'D', 'E'])
print(frame2)
year state pop debt
A 2000 Ohio 1.5 NaN
B 2001 Ohio 1.7 NaN
C 2002 Ohio 3.6 NaN
D 2001 Nevada 2.4 NaN
E 2002 Nevada 2.9 NaN
print(frame2.loc['A'])
year 2000
state Ohio
pop 1.5
debt NaN
Name: A, dtype: object
print(frame2.loc[['A', 'B']])
year state pop debt
A 2000 Ohio 1.5 NaN
B 2001 Ohio 1.7 NaN
print(frame2.loc['A':'E',
['state','pop']])
state pop
A Ohio 1.5
B Ohio 1.7
C Ohio 3.6
D Nevada 2.4
E Nevada 2.9
print(frame2.iloc[1:3])
year state pop debt
B 2001 Ohio 1.7 NaN
C 2002 Ohio 3.6 NaN
print(frame2.iloc[:,1:3])
state pop
A Ohio 1.5
B Ohio 1.7
C Ohio 3.6
D Nevada 2.4
E Nevada 2.9](https://image.slidesharecdn.com/pandas-250105045330-0b779f47/75/Python-libraries-for-analysis-Pandas-pptx-13-2048.jpg)
![DataFrame – modifying columns
frame2['debt'] = 0
print(frame2)
year state pop debt
A 2000 Ohio 1.5 0
B 2001 Ohio 1.7 0
C 2002 Ohio 3.6 0
D 2001 Nevada 2.4 0
E 2002 Nevada 2.9 0
frame2['debt'] = range(5)
print(frame2)
year state pop debt
A 2000 Ohio 1.5 0
B 2001 Ohio 1.7 1
C 2002 Ohio 3.6 2
D 2001 Nevada 2.4 3
E 2002 Nevada 2.9 4
val = Series([10, 10, 10], index = ['A', 'C', 'D'])
frame2['debt'] = val
print(frame2)
year state pop debt
A 2000 Ohio 1.5 10.0
B 2001 Ohio 1.7 NaN
C 2002 Ohio 3.6 10.0
D 2001 Nevada 2.4 10.0
E 2002 Nevada 2.9 NaN
Rows or individual elements can be
modified similarly. Using loc or iloc.](https://image.slidesharecdn.com/pandas-250105045330-0b779f47/75/Python-libraries-for-analysis-Pandas-pptx-14-2048.jpg)
![DataFrame – removing columns
del frame2['debt']
print(frame2)
year state pop
A 2000 Ohio 1.5
B 2001 Ohio 1.7
C 2002 Ohio 3.6
D 2001 Nevada 2.4
E 2002 Nevada 2.9](https://image.slidesharecdn.com/pandas-250105045330-0b779f47/75/Python-libraries-for-analysis-Pandas-pptx-15-2048.jpg)
![Removing rows/columns
print(frame)
c1 c2 c3
r1 0 1 2
r2 3 4 5
r3 6 7 8
print(frame.drop(['r1']))
c1 c2 c3
r2 3 4 5
r3 6 7 8
print(frame.drop(['r1','r3']))
c1 c2 c3
r2 3 4 5
print(frame.drop(['c1'], axis=1))
c2 c3
r1 1 2
r2 4 5
r3 7 8
This returns a new object](https://image.slidesharecdn.com/pandas-250105045330-0b779f47/75/Python-libraries-for-analysis-Pandas-pptx-16-2048.jpg)


![Handling missing data
•Different Methods of Dealing With Missing Data
3. Filling the Missing Values – Imputation
The possible ways to do this are:
Filling the missing data with the mean or median value if it’s a
numerical variable.
Filling the missing data with mode if it’s a categorical value.
Filling the numerical value with 0 or -999, or some other number
that will not occur in the data. This can be done so that the machine
can recognize that the data is not real or is different.
Filling the categorical value with a new type for the missing values.
You can use the fillna() function to fill the null values in the dataset.
updated_df = df
updated_df['Age']=updated_df['Age'].fillna(updated_df['Age'].mean()
)](https://image.slidesharecdn.com/pandas-250105045330-0b779f47/75/Python-libraries-for-analysis-Pandas-pptx-21-2048.jpg)


