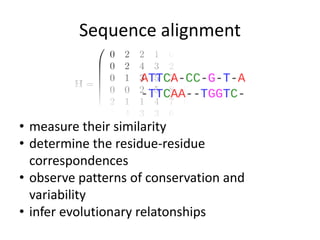
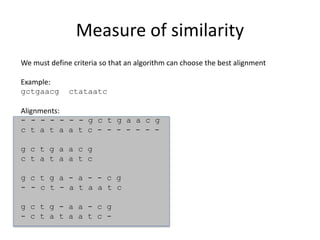
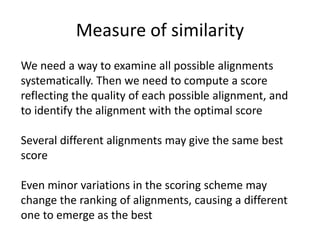
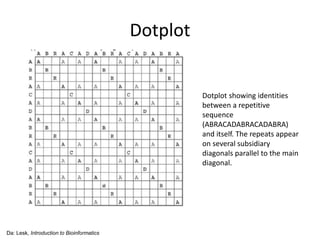
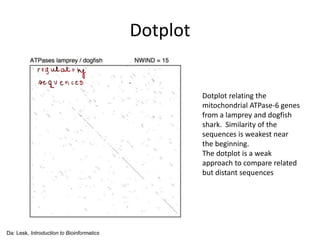
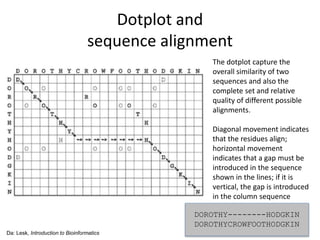
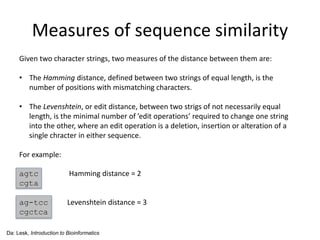
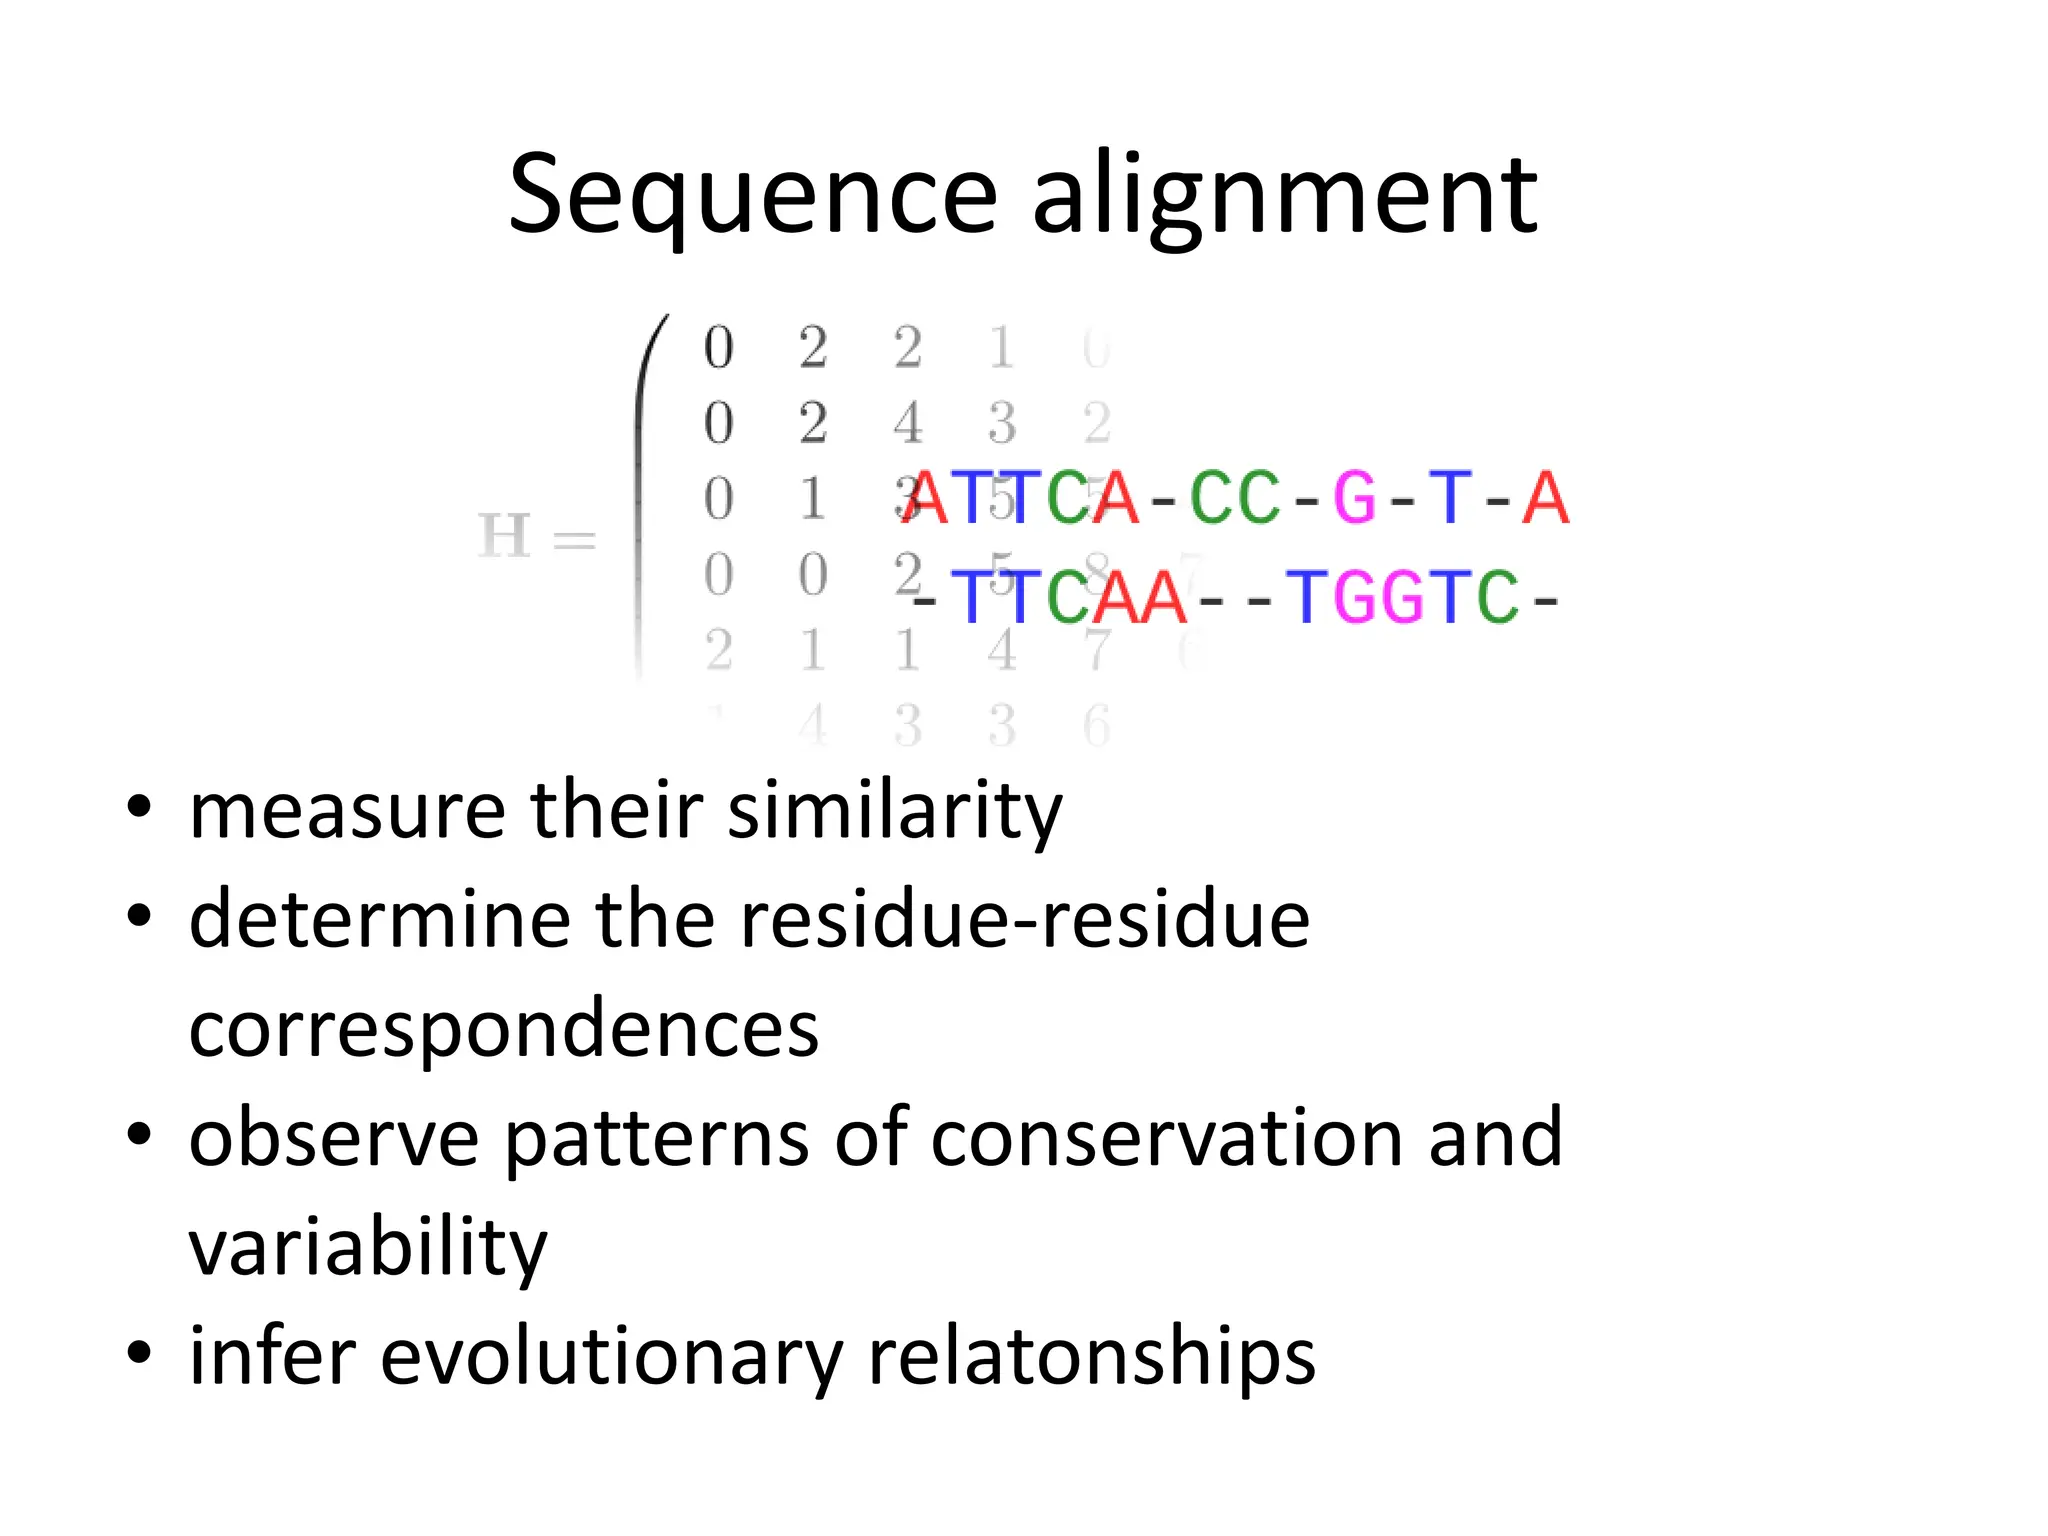
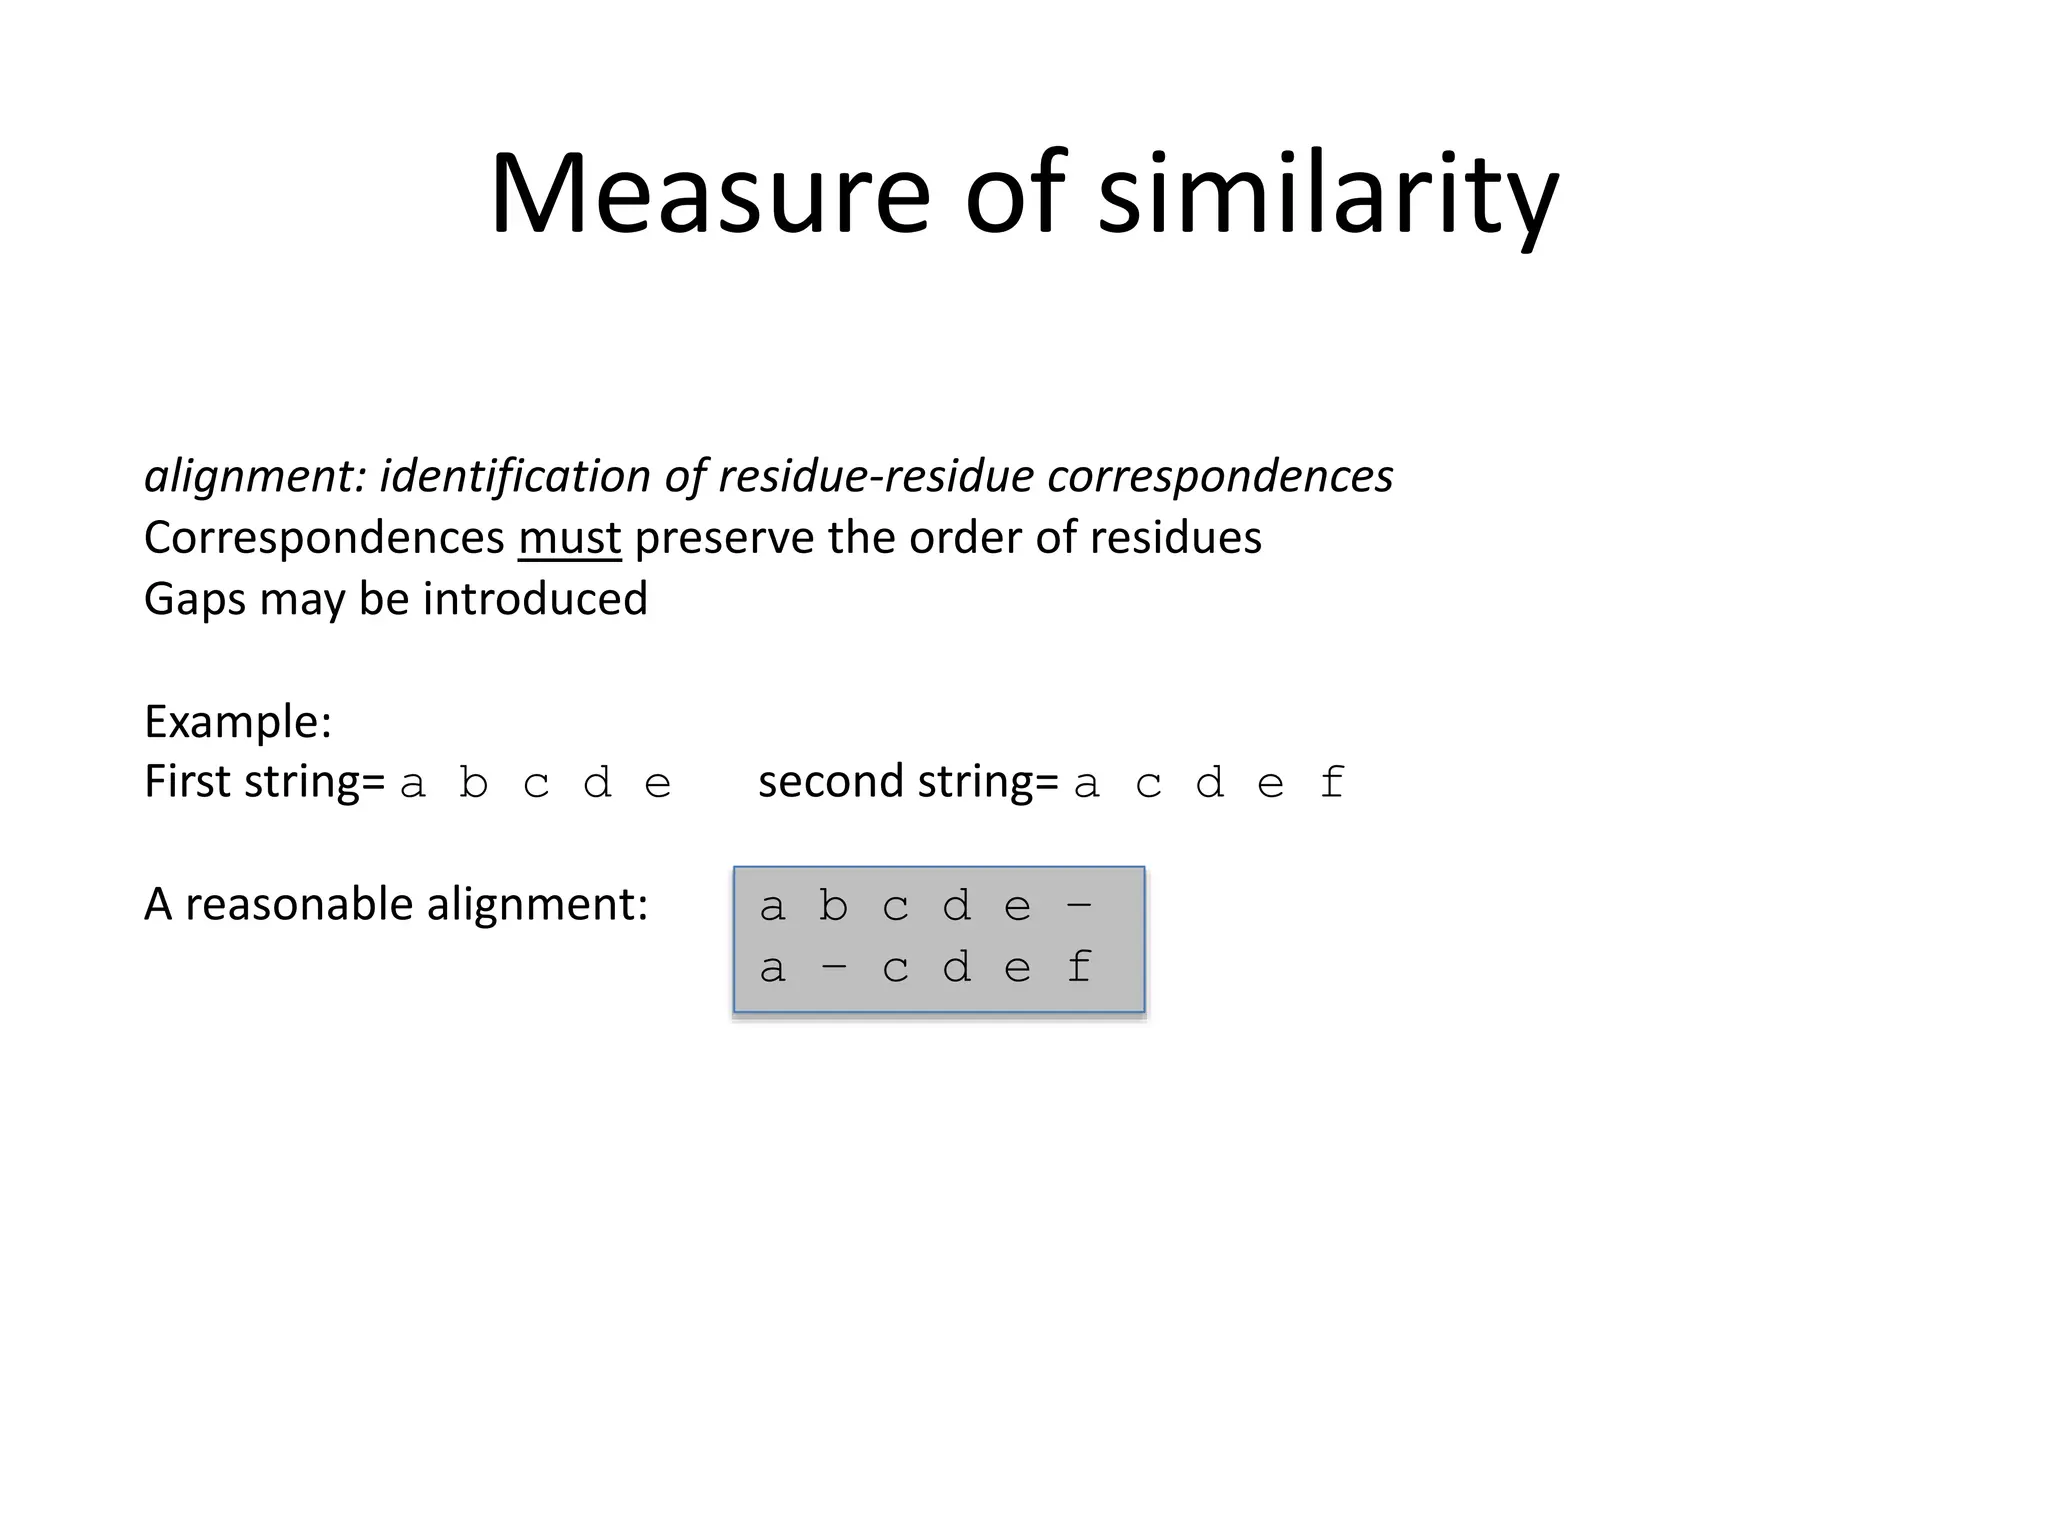
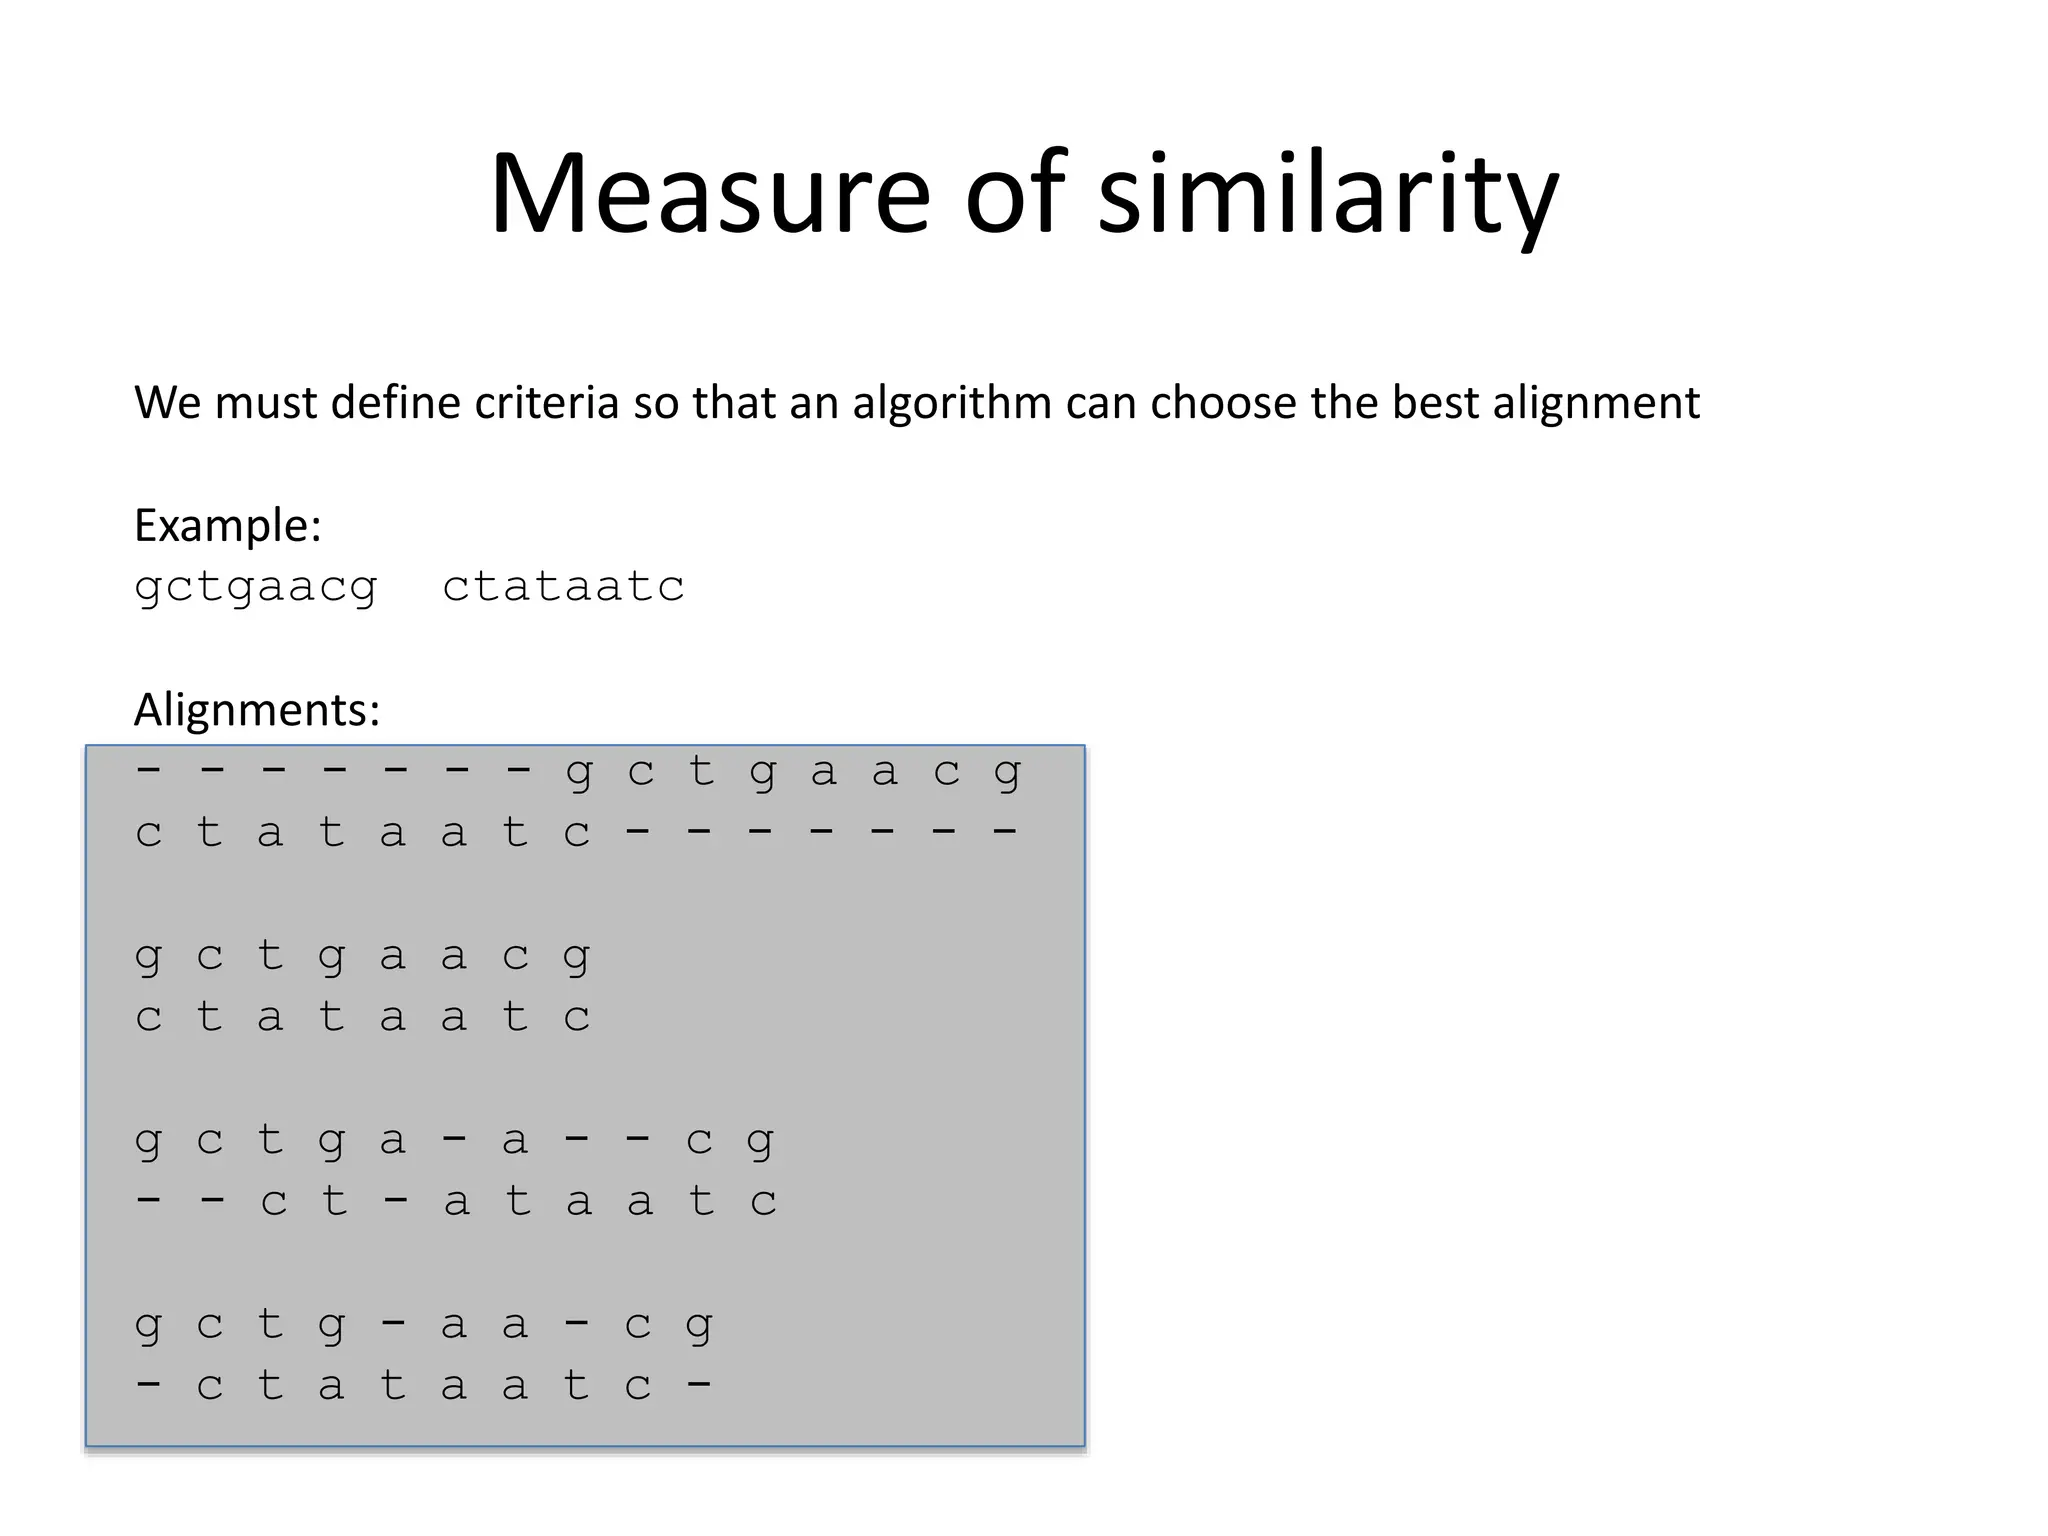
KEMBAR78
Sequence Alignment - Data Bioinformatics Introduction | PPTX
Learning from primary structure
Sequence alignment
Sequence alignment
• measure their similarity
• determine the residue-residue
correspondences
• observe patterns of conservation and
variability
• infer evolutionary relatonships
Measure of similarity
alignment: identification of residue-residue correspondences
Correspondences must preserve the order of residues
Gaps may be introduced
Example:
First string= a b c d e second string= a c d e f
A reasonable alignment: a b c d e –
a – c d e f
Measure of similarity
We must define criteria so that an algorithm can choose the best alignment
Example:
gctgaacg ctataatc
Alignments:
- - - - - - - g c t g a a c g
c t a t a a t c - - - - - - -
g c t g a a c g
c t a t a a t c
g c t g a - a - - c g
- - c t - a t a a t c
g c t g - a a - c g
- c t a t a a t c -
Measure of similarity
We need a way to examine all possible alignments
systematically. Then we need to compute a score
reflecting the quality of each possible alignment, and
to identify the alignment with the optimal score
Several different alignments may give the same best
score
Even minor variations in the scoring scheme may
change the ranking of alignments, causing a different
one to emerge as the best
Dotplot
• give an overview of the similarities between two sequences
• have a close relationship with the alignment between two sequences
Da: Lesk, Introduction to Bioinformatics
Dotplot showing
identities between short
name
(DOROTHYHODGKIN)
and full name
(DOROTHYCROWFOOTH
ODGKIN)
Dotplot
Da: Lesk, Introduction to Bioinformatics
Dotplot showing identities
between a repetitive
sequence
(ABRACADABRACADABRA)
and itself. The repeats appear
on several subsidiary
diagonals parallel to the main
diagonal.
Dotplot
Da: Lesk, Introduction to Bioinformatics
Dotplot showing identities
between the palindromic
sequence MAX I STAY AWAY
AT SIX AM and itself. The
palindrome reveals itself as a
stretch of matches
perpendicular to the main
diagonal
Remember that: Restriction
enzymes and transcriptional
regulatory factors may
recognize palindrome
sequences
EcoRI: GAATTC
CTTAAG
Dotplot
Da: Lesk, Introduction to Bioinformatics
Dotplot relating the
mitochondrial ATPase-6 genes
from a lamprey and dogfish
shark. Similarity of the
sequences is weakest near
the beginning.
The dotplot is a weak
approach to compare related
but distant sequences
Dotplot
Proteins dotplot: a dotplot
relating PAX-6 protein of
mouse and the eyeless
protein of Drosophila
melanogaster.
The mouse sequence shows
an insertion that is missing in
Drosophila
Rielaborato da: Lesk, Introduction to Bioinformatics
Dotplot and
sequence alignment
The dotplot capture the
overall similarity of two
sequences and also the
complete set and relative
quality of different possible
alignments.
Diagonal movement indicates
that the residues align;
horizontal movement
indicates that a gap must be
introduced in the sequence
shown in the lines; if it is
vertical, the gap is introduced
in the column sequence
Da: Lesk, Introduction to Bioinformatics
DOROTHY--------HODGKIN
DOROTHYCROWFOOTHODGKIN
Measures of sequence similarity
Given two character strings, two measures of the distance between them are:
• The Hamming distance, defined between two strings of equal length, is the
number of positions with mismatching characters.
• The Levenshtein, or edit distance, between two strigs of not necessarily equal
length, is the minimal number of ’edit operations’ required to change one string
into the other, where an edit operation is a deletion, insertion or alteration of a
single chracter in either sequence.
For example:
agtc Hamming distance = 2
cgta
ag-tcc Levenshtein distance = 3
cgctca
Da: Lesk, Introduction to Bioinformatics

Sequence Alignment - Data Bioinformatics Introduction

  • 1.
    Learning from primarystructure Sequence alignment
  • 2.
    Sequence alignment • measuretheir similarity • determine the residue-residue correspondences • observe patterns of conservation and variability • infer evolutionary relatonships
  • 3.
    Measure of similarity alignment:identification of residue-residue correspondences Correspondences must preserve the order of residues Gaps may be introduced Example: First string= a b c d e second string= a c d e f A reasonable alignment: a b c d e – a – c d e f
  • 4.
    Measure of similarity Wemust define criteria so that an algorithm can choose the best alignment Example: gctgaacg ctataatc Alignments: - - - - - - - g c t g a a c g c t a t a a t c - - - - - - - g c t g a a c g c t a t a a t c g c t g a - a - - c g - - c t - a t a a t c g c t g - a a - c g - c t a t a a t c -
  • 5.
    Measure of similarity Weneed a way to examine all possible alignments systematically. Then we need to compute a score reflecting the quality of each possible alignment, and to identify the alignment with the optimal score Several different alignments may give the same best score Even minor variations in the scoring scheme may change the ranking of alignments, causing a different one to emerge as the best
  • 6.
    Dotplot • give anoverview of the similarities between two sequences • have a close relationship with the alignment between two sequences Da: Lesk, Introduction to Bioinformatics Dotplot showing identities between short name (DOROTHYHODGKIN) and full name (DOROTHYCROWFOOTH ODGKIN)
  • 7.
    Dotplot Da: Lesk, Introductionto Bioinformatics Dotplot showing identities between a repetitive sequence (ABRACADABRACADABRA) and itself. The repeats appear on several subsidiary diagonals parallel to the main diagonal.
  • 8.
    Dotplot Da: Lesk, Introductionto Bioinformatics Dotplot showing identities between the palindromic sequence MAX I STAY AWAY AT SIX AM and itself. The palindrome reveals itself as a stretch of matches perpendicular to the main diagonal Remember that: Restriction enzymes and transcriptional regulatory factors may recognize palindrome sequences EcoRI: GAATTC CTTAAG
  • 9.
    Dotplot Da: Lesk, Introductionto Bioinformatics Dotplot relating the mitochondrial ATPase-6 genes from a lamprey and dogfish shark. Similarity of the sequences is weakest near the beginning. The dotplot is a weak approach to compare related but distant sequences
  • 10.
    Dotplot Proteins dotplot: adotplot relating PAX-6 protein of mouse and the eyeless protein of Drosophila melanogaster. The mouse sequence shows an insertion that is missing in Drosophila Rielaborato da: Lesk, Introduction to Bioinformatics
  • 11.
    Dotplot and sequence alignment Thedotplot capture the overall similarity of two sequences and also the complete set and relative quality of different possible alignments. Diagonal movement indicates that the residues align; horizontal movement indicates that a gap must be introduced in the sequence shown in the lines; if it is vertical, the gap is introduced in the column sequence Da: Lesk, Introduction to Bioinformatics DOROTHY--------HODGKIN DOROTHYCROWFOOTHODGKIN
  • 12.
    Measures of sequencesimilarity Given two character strings, two measures of the distance between them are: • The Hamming distance, defined between two strings of equal length, is the number of positions with mismatching characters. • The Levenshtein, or edit distance, between two strigs of not necessarily equal length, is the minimal number of ’edit operations’ required to change one string into the other, where an edit operation is a deletion, insertion or alteration of a single chracter in either sequence. For example: agtc Hamming distance = 2 cgta ag-tcc Levenshtein distance = 3 cgctca Da: Lesk, Introduction to Bioinformatics