Download as PDF, PPTX


![Low cmplexity regionLow cmplexity region
Low-complexity regions in sequences can be found as regions around the diagonal all
obtaining a high score. Low complexity regions are calculated from the redundancy of
amino acids within a limited region [Wootton and Federhen,1993].](https://image.slidesharecdn.com/shwetadotplot-160504054350/85/dot-plot-analysis-13-320.jpg)


![Low cmplexity regionLow cmplexity region
Low-complexity regions in sequences can be found as regions around the diagonal all
obtaining a high score. Low complexity regions are calculated from the redundancy of
amino acids within a limited region [Wootton and Federhen,1993].](https://image.slidesharecdn.com/shwetadotplot-160504054350/75/dot-plot-analysis-13-2048.jpg)


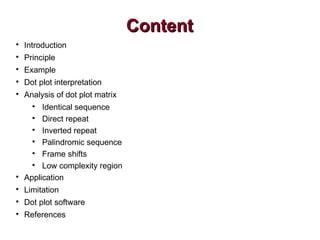
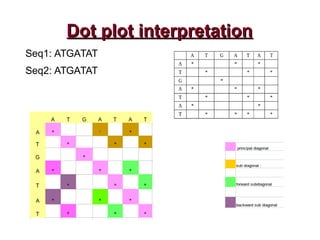
This document discusses dot plot analysis, which allows comparison of two biological sequences to identify similar regions. It describes how dot plots are generated using a similarity matrix and defines different features that can be observed, such as identical sequences appearing on the principal diagonal, direct and inverted repeats appearing as multiple diagonals, and low complexity regions forming boxes. Applications of dot plot analysis include identifying alignments, self-base pairing, sequence transposition, and gene locations between genomes. Limitations include high memory needs for long sequences and low efficiency for global alignments.
Introduction to dot plots in bioinformatics for comparing biological sequences.
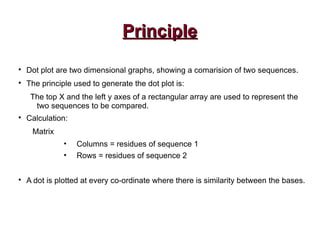
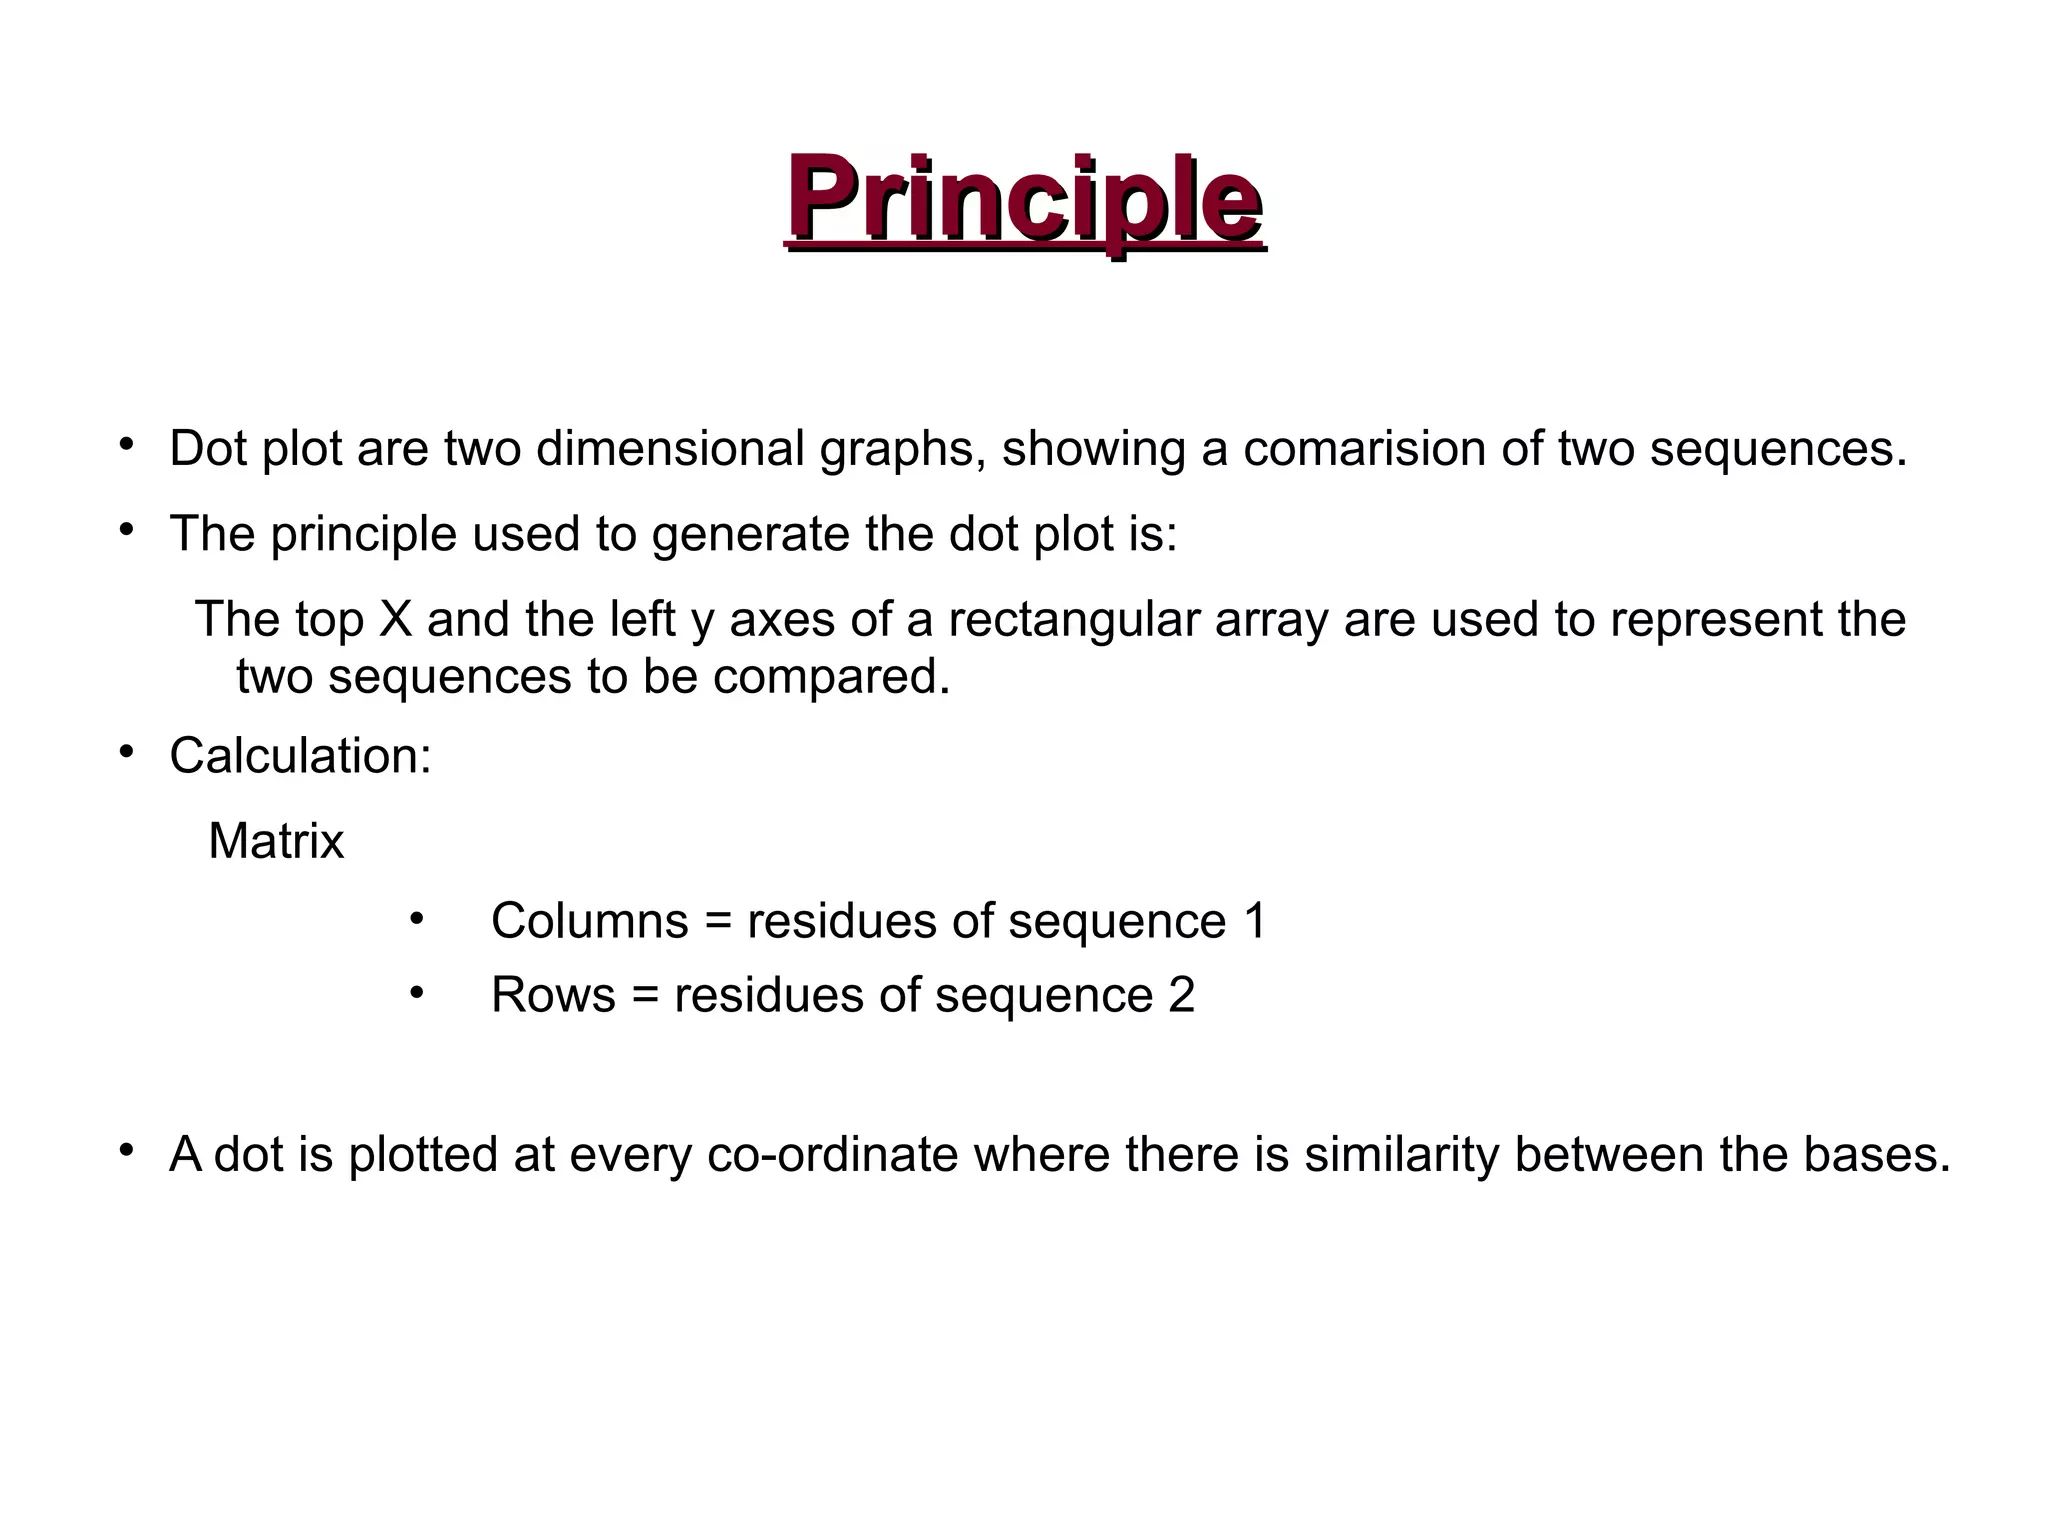
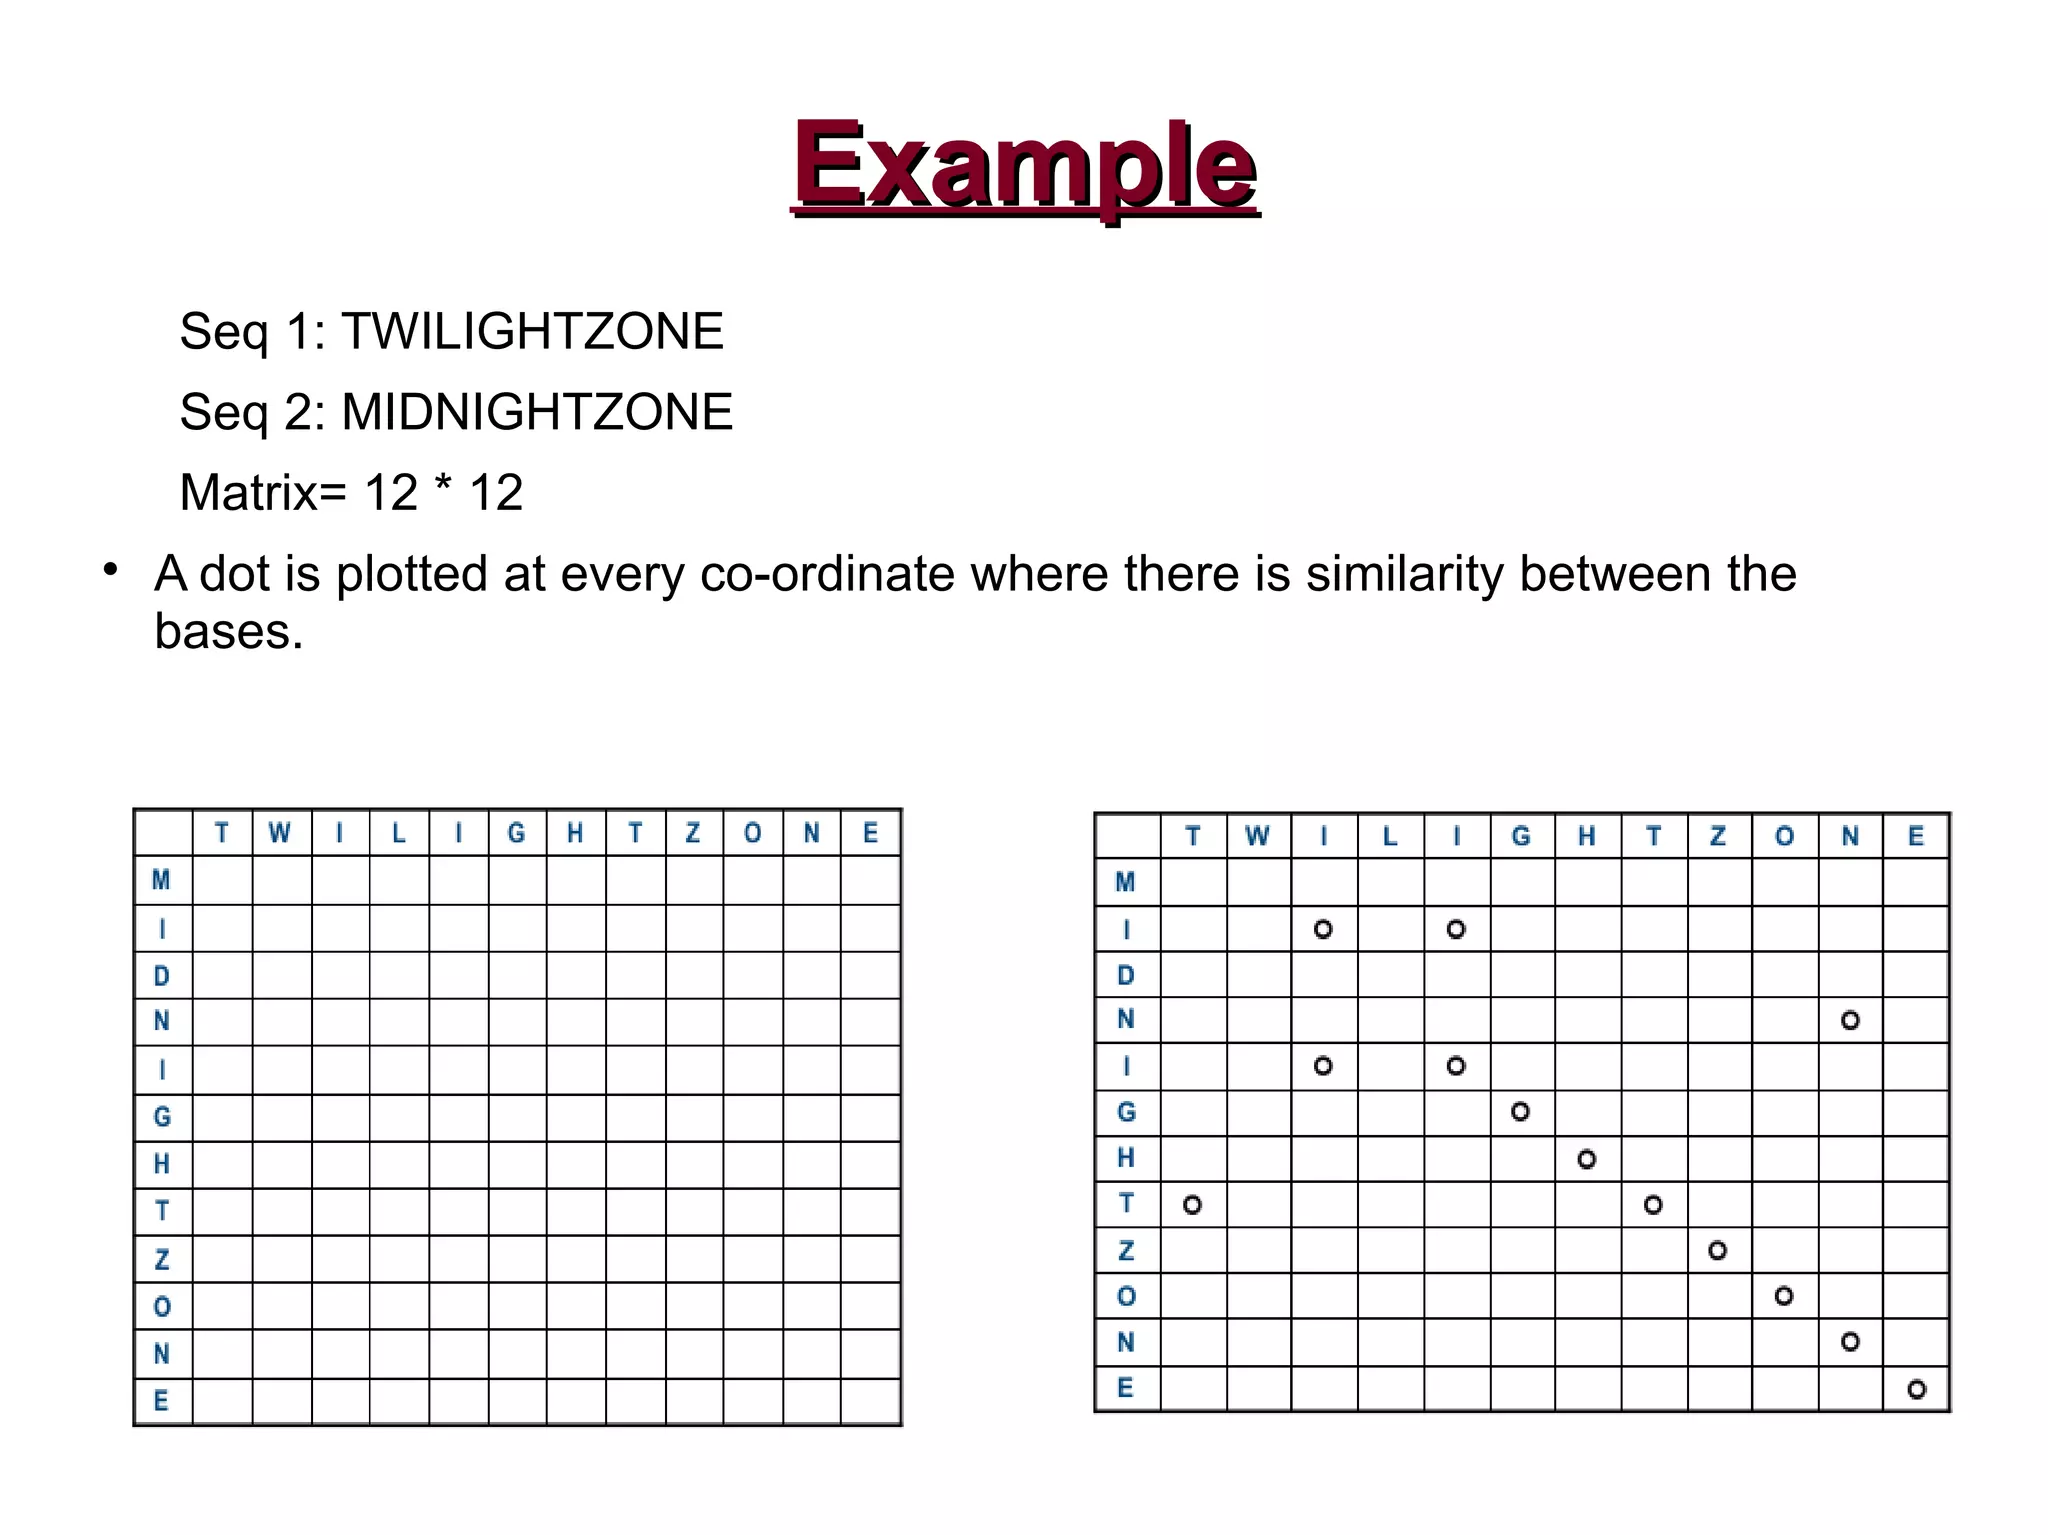
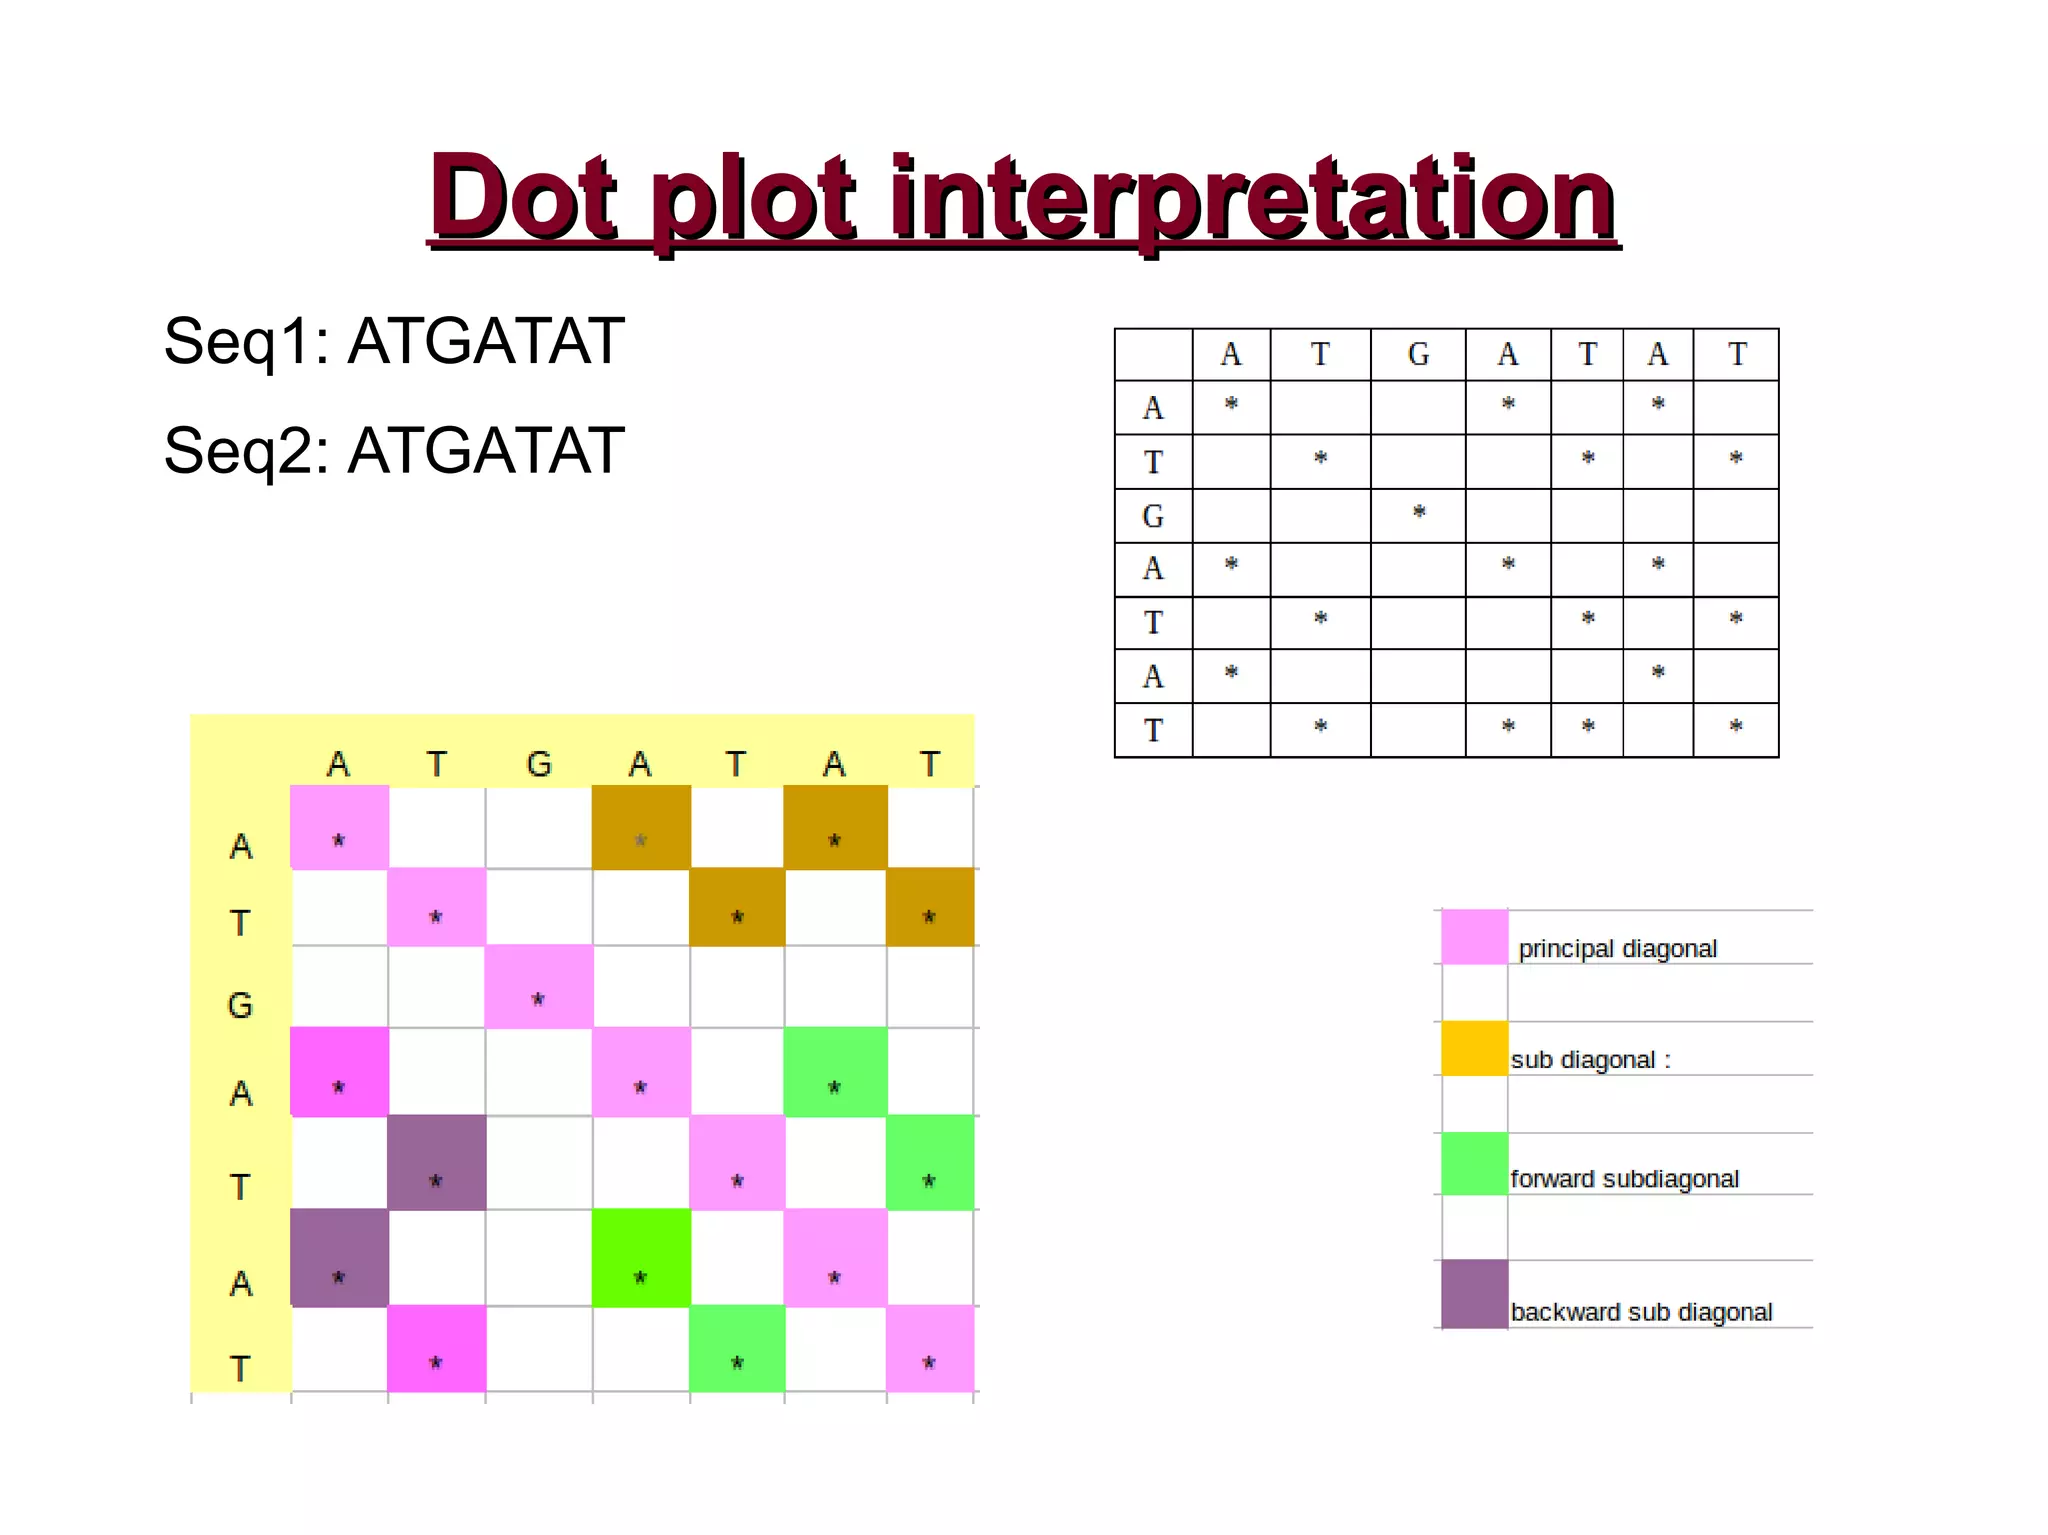
Principles of creating dot plots and calculating similarity between sequences.
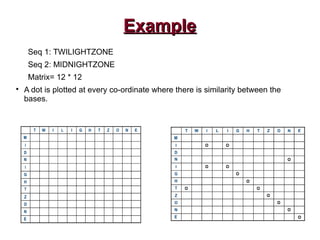
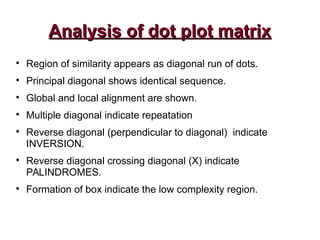
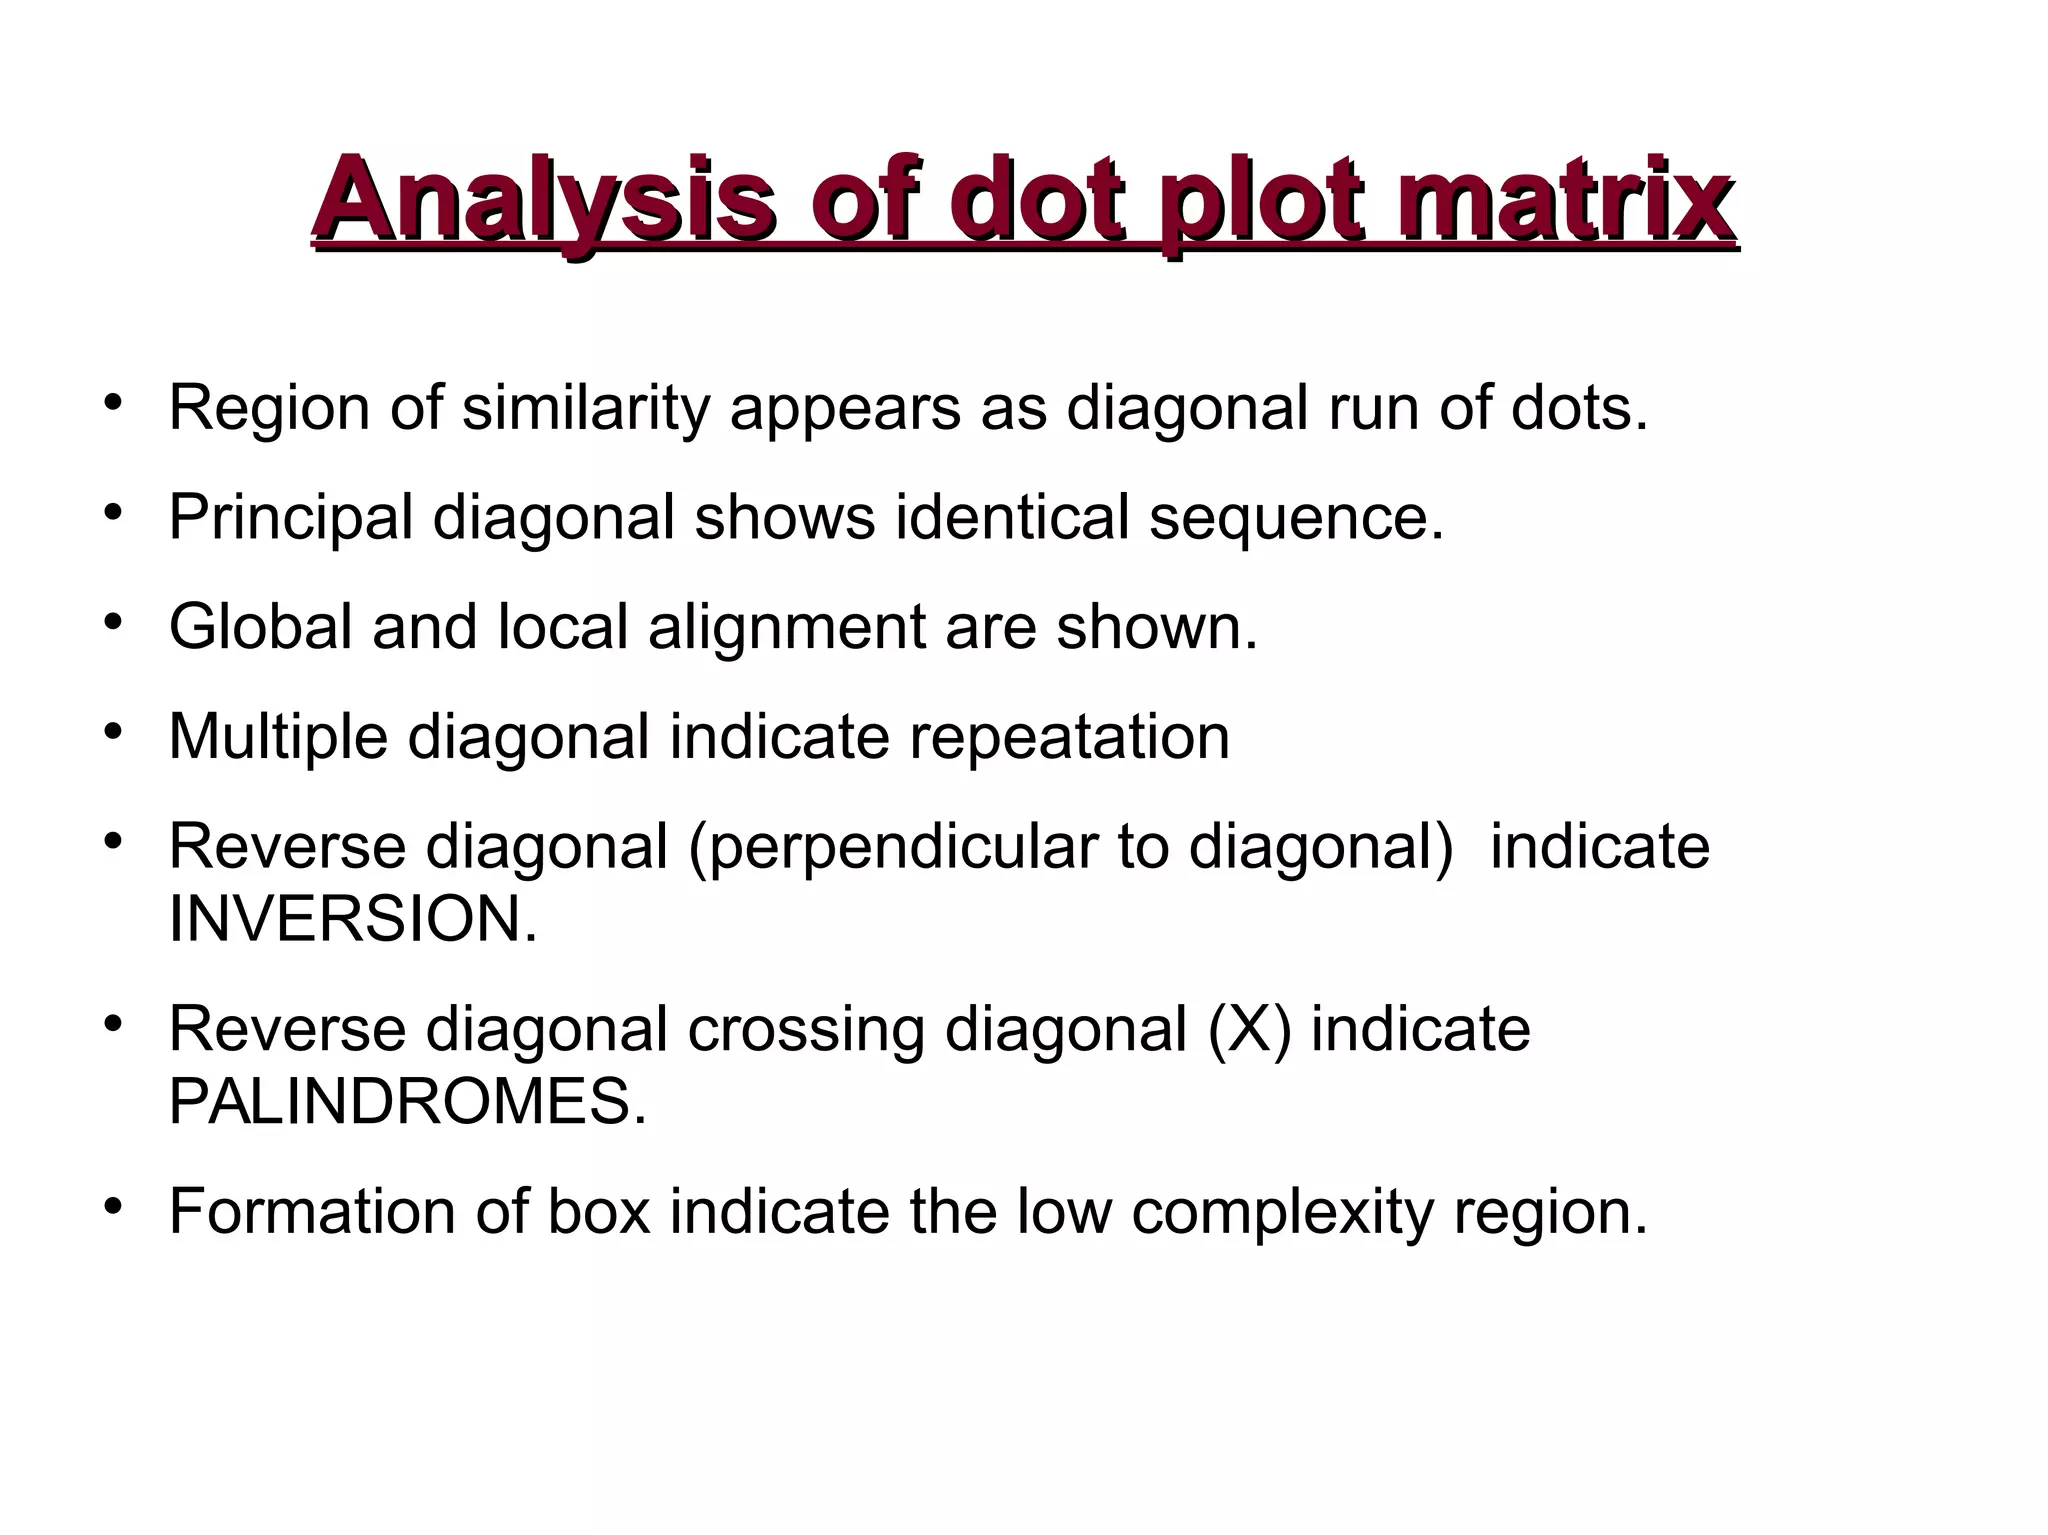
Interpretation of dot plot matrices including regions of similarity and various patterns.
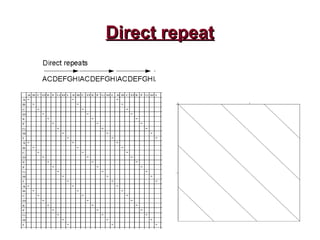
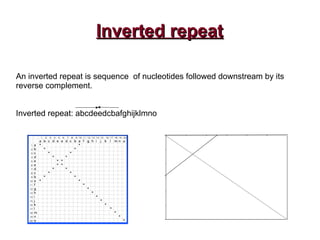
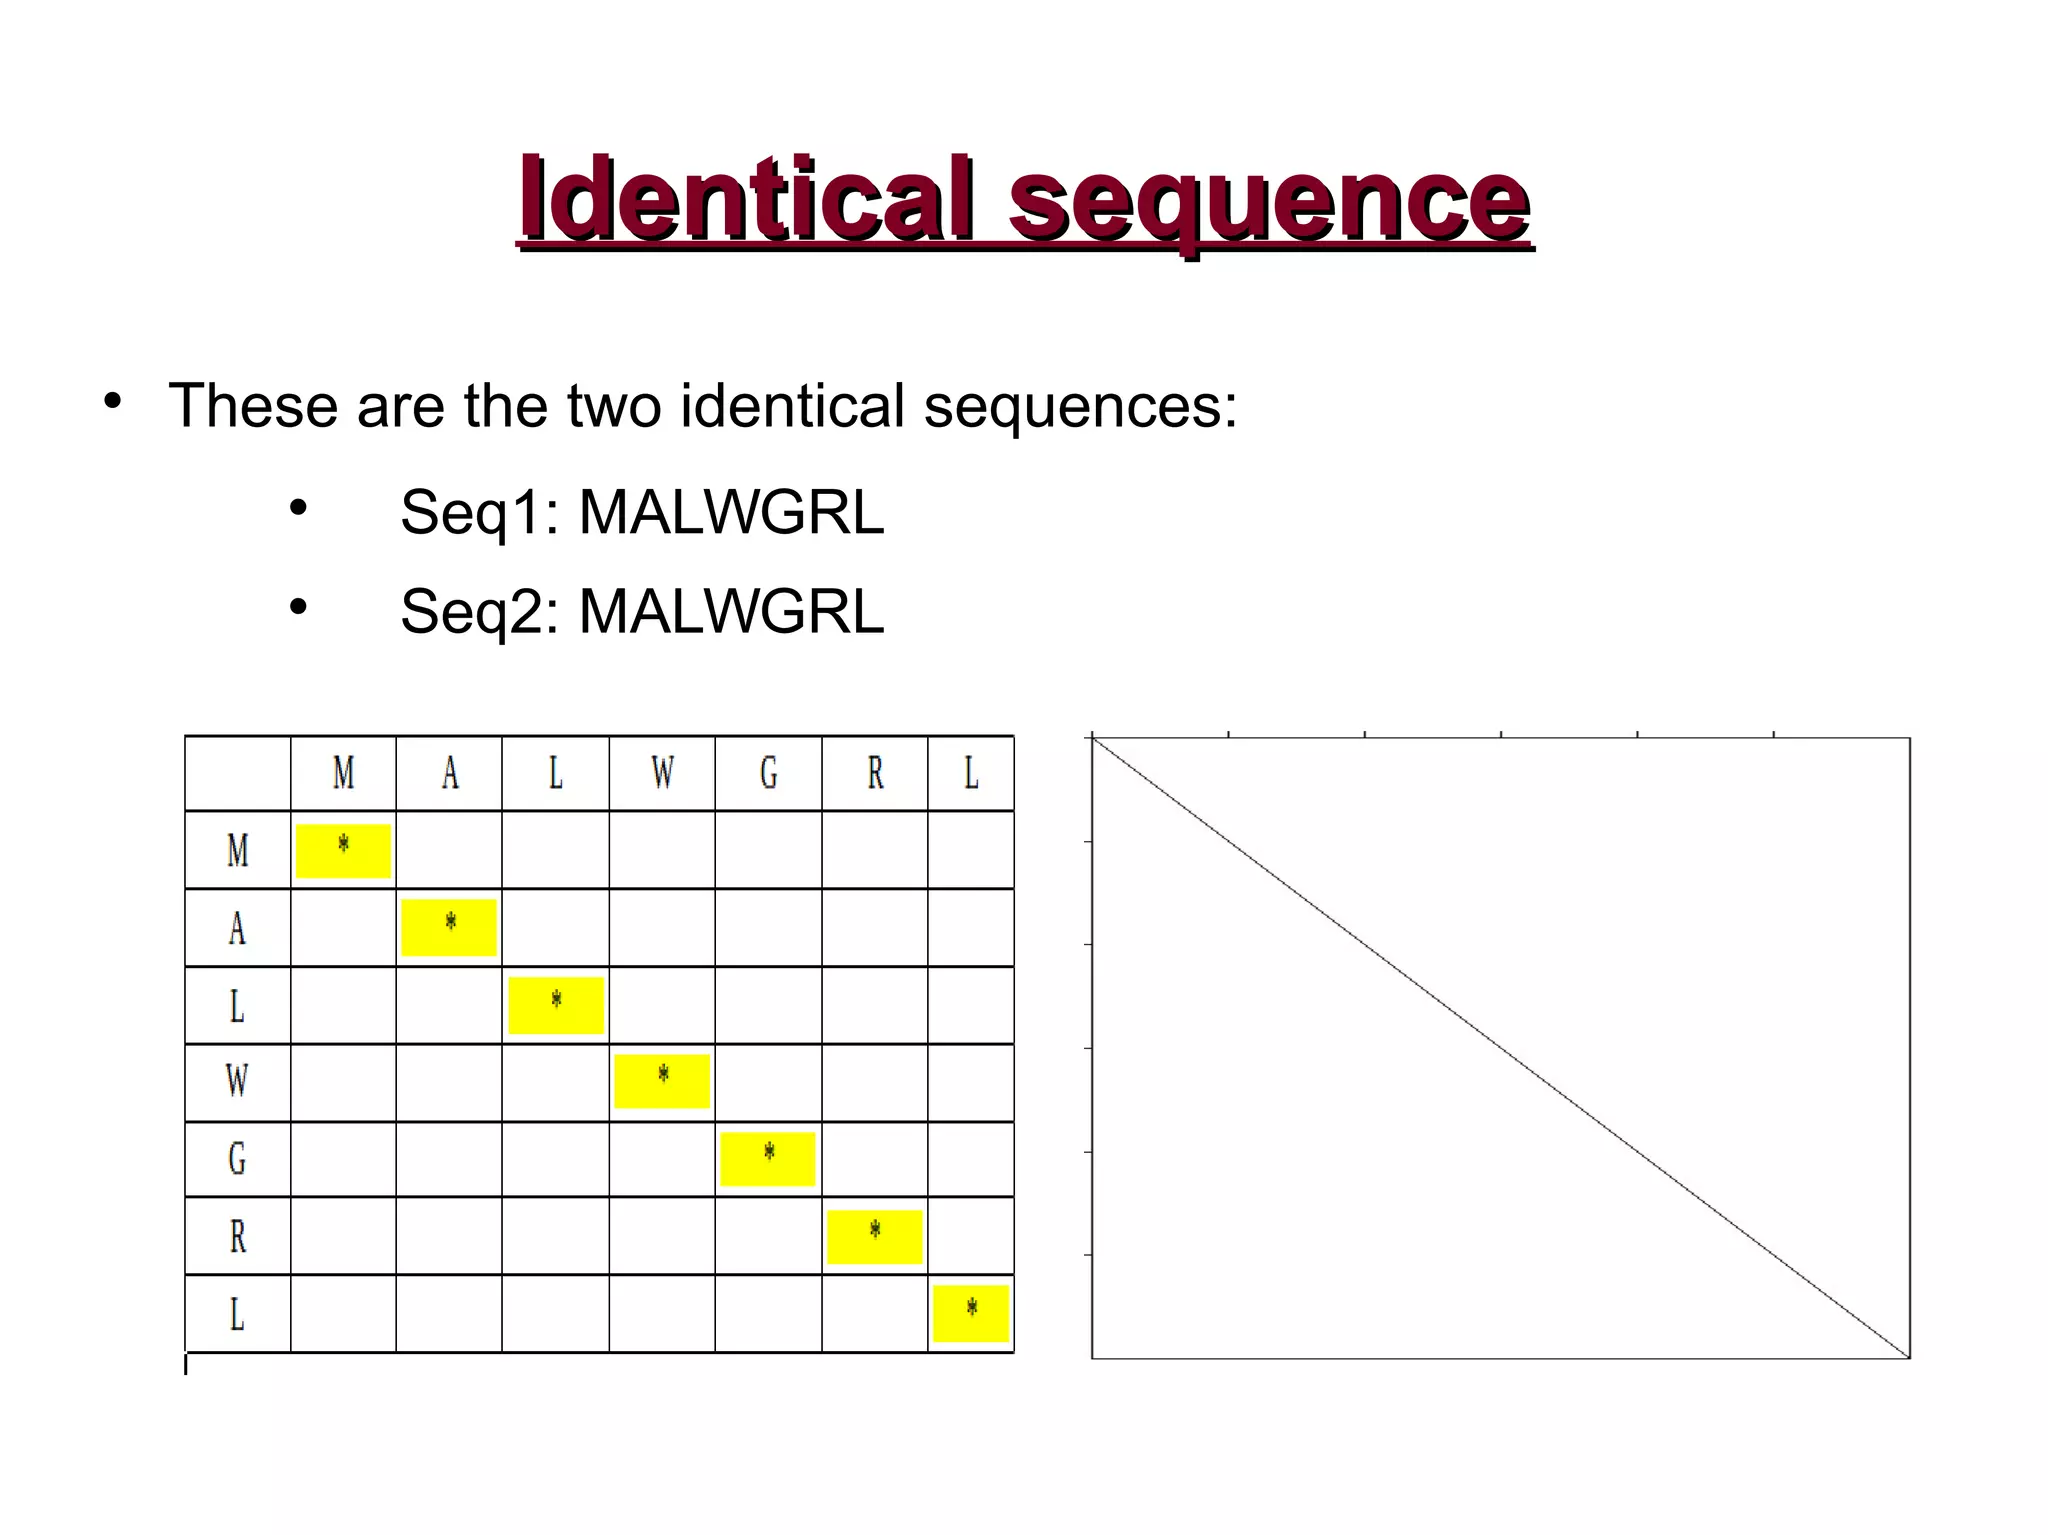
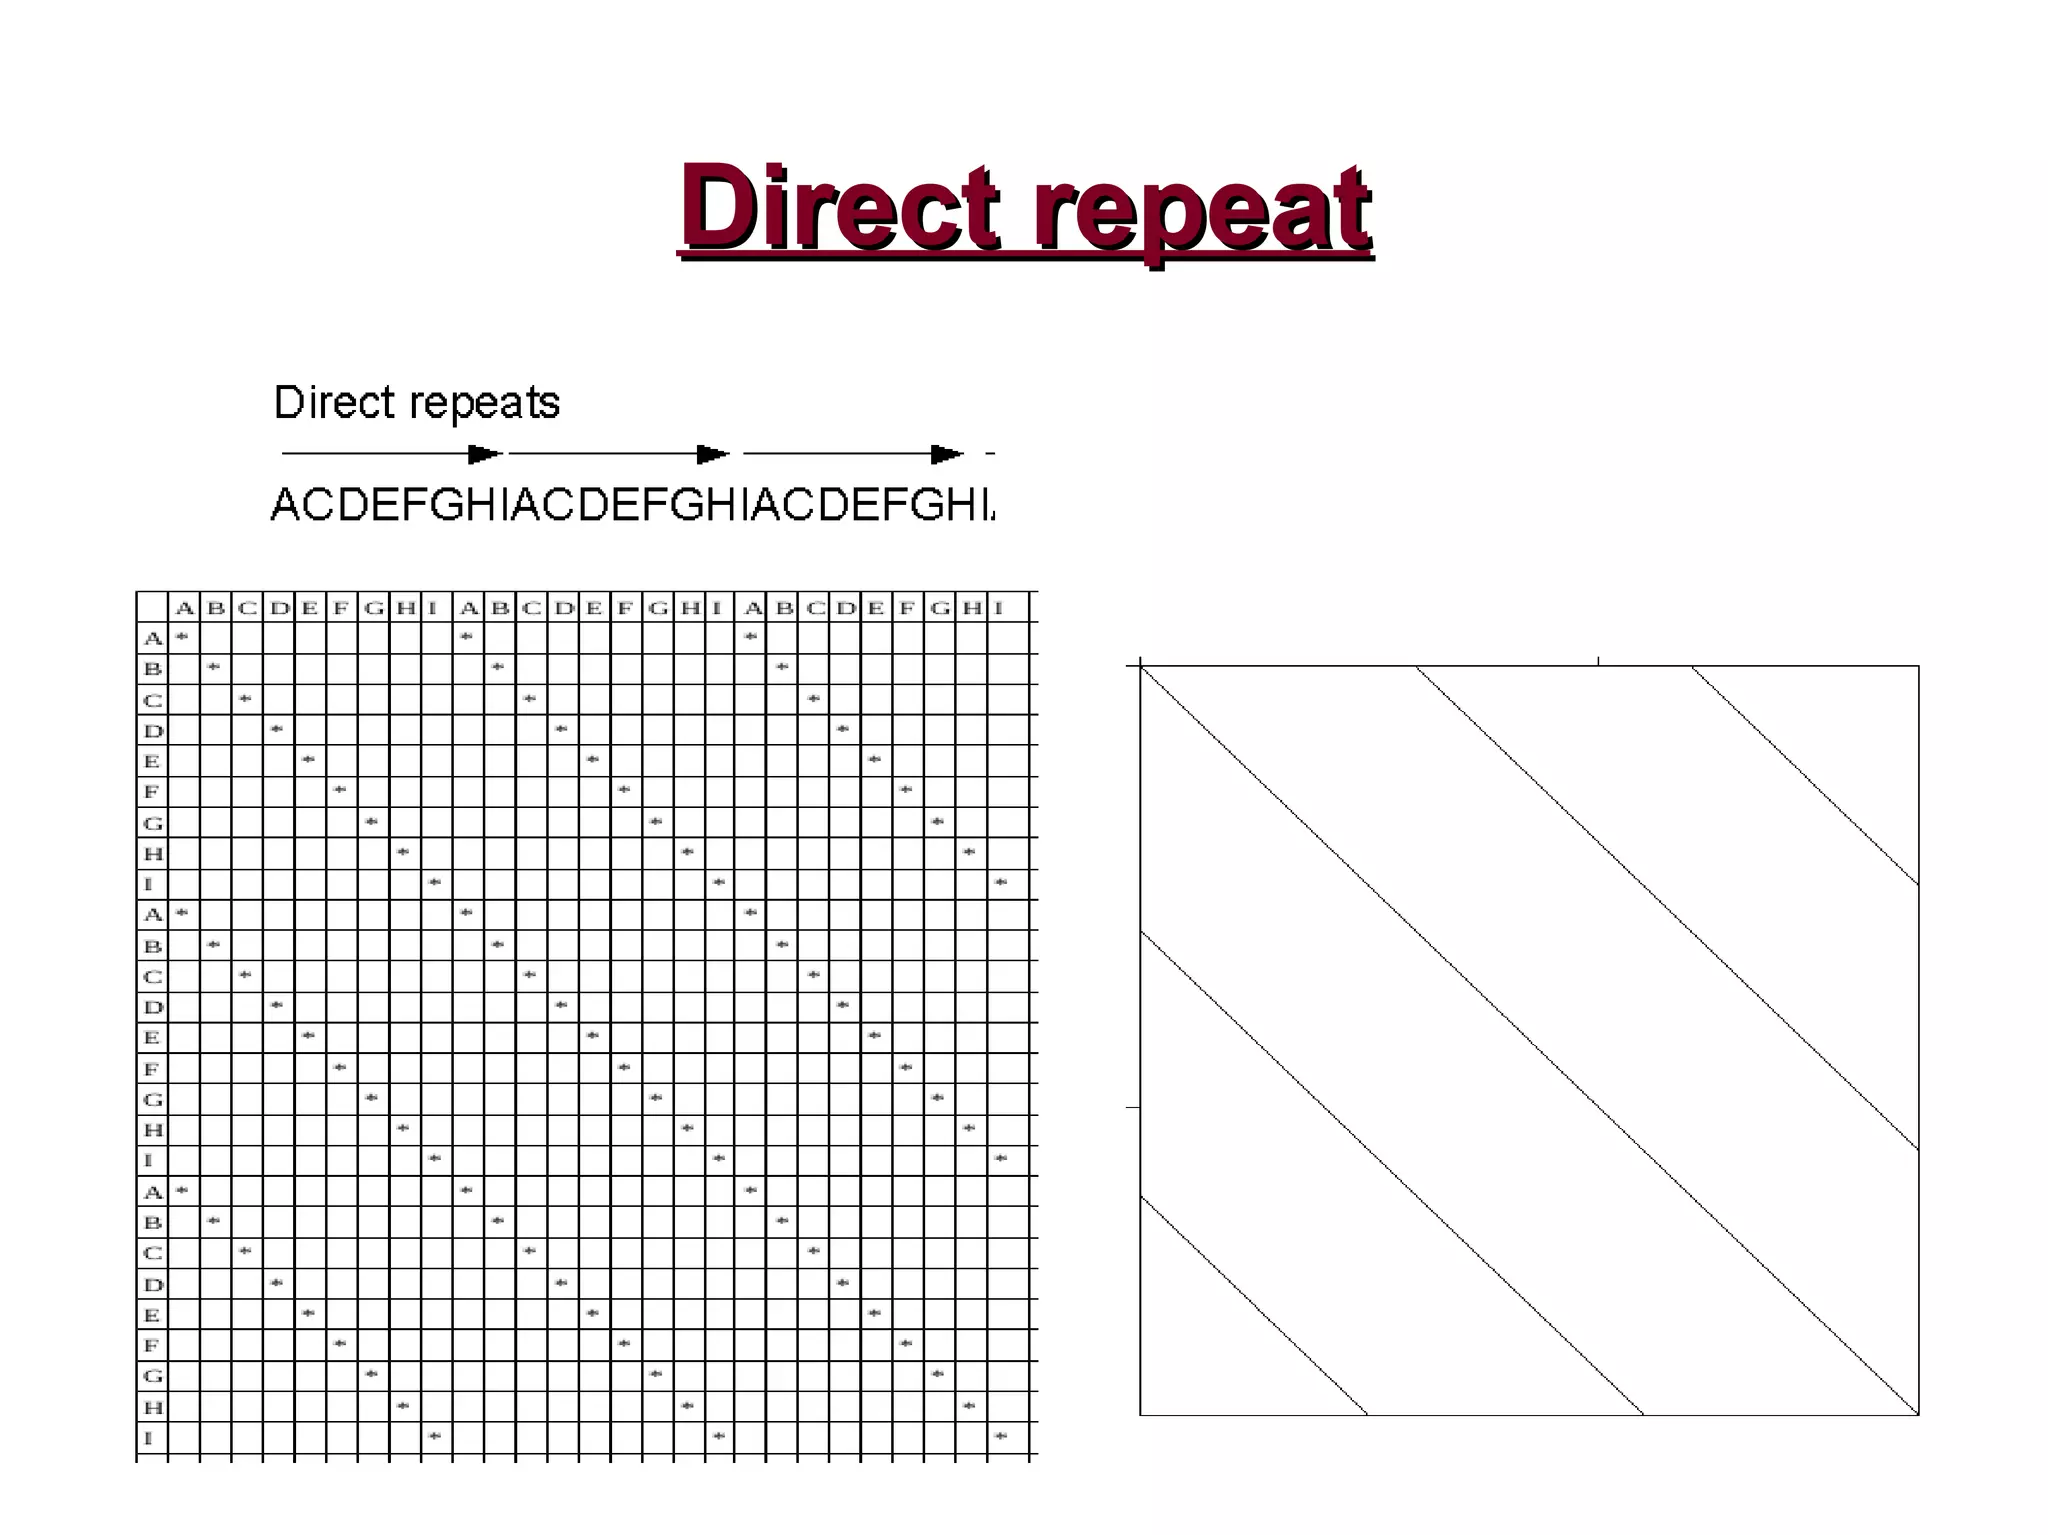
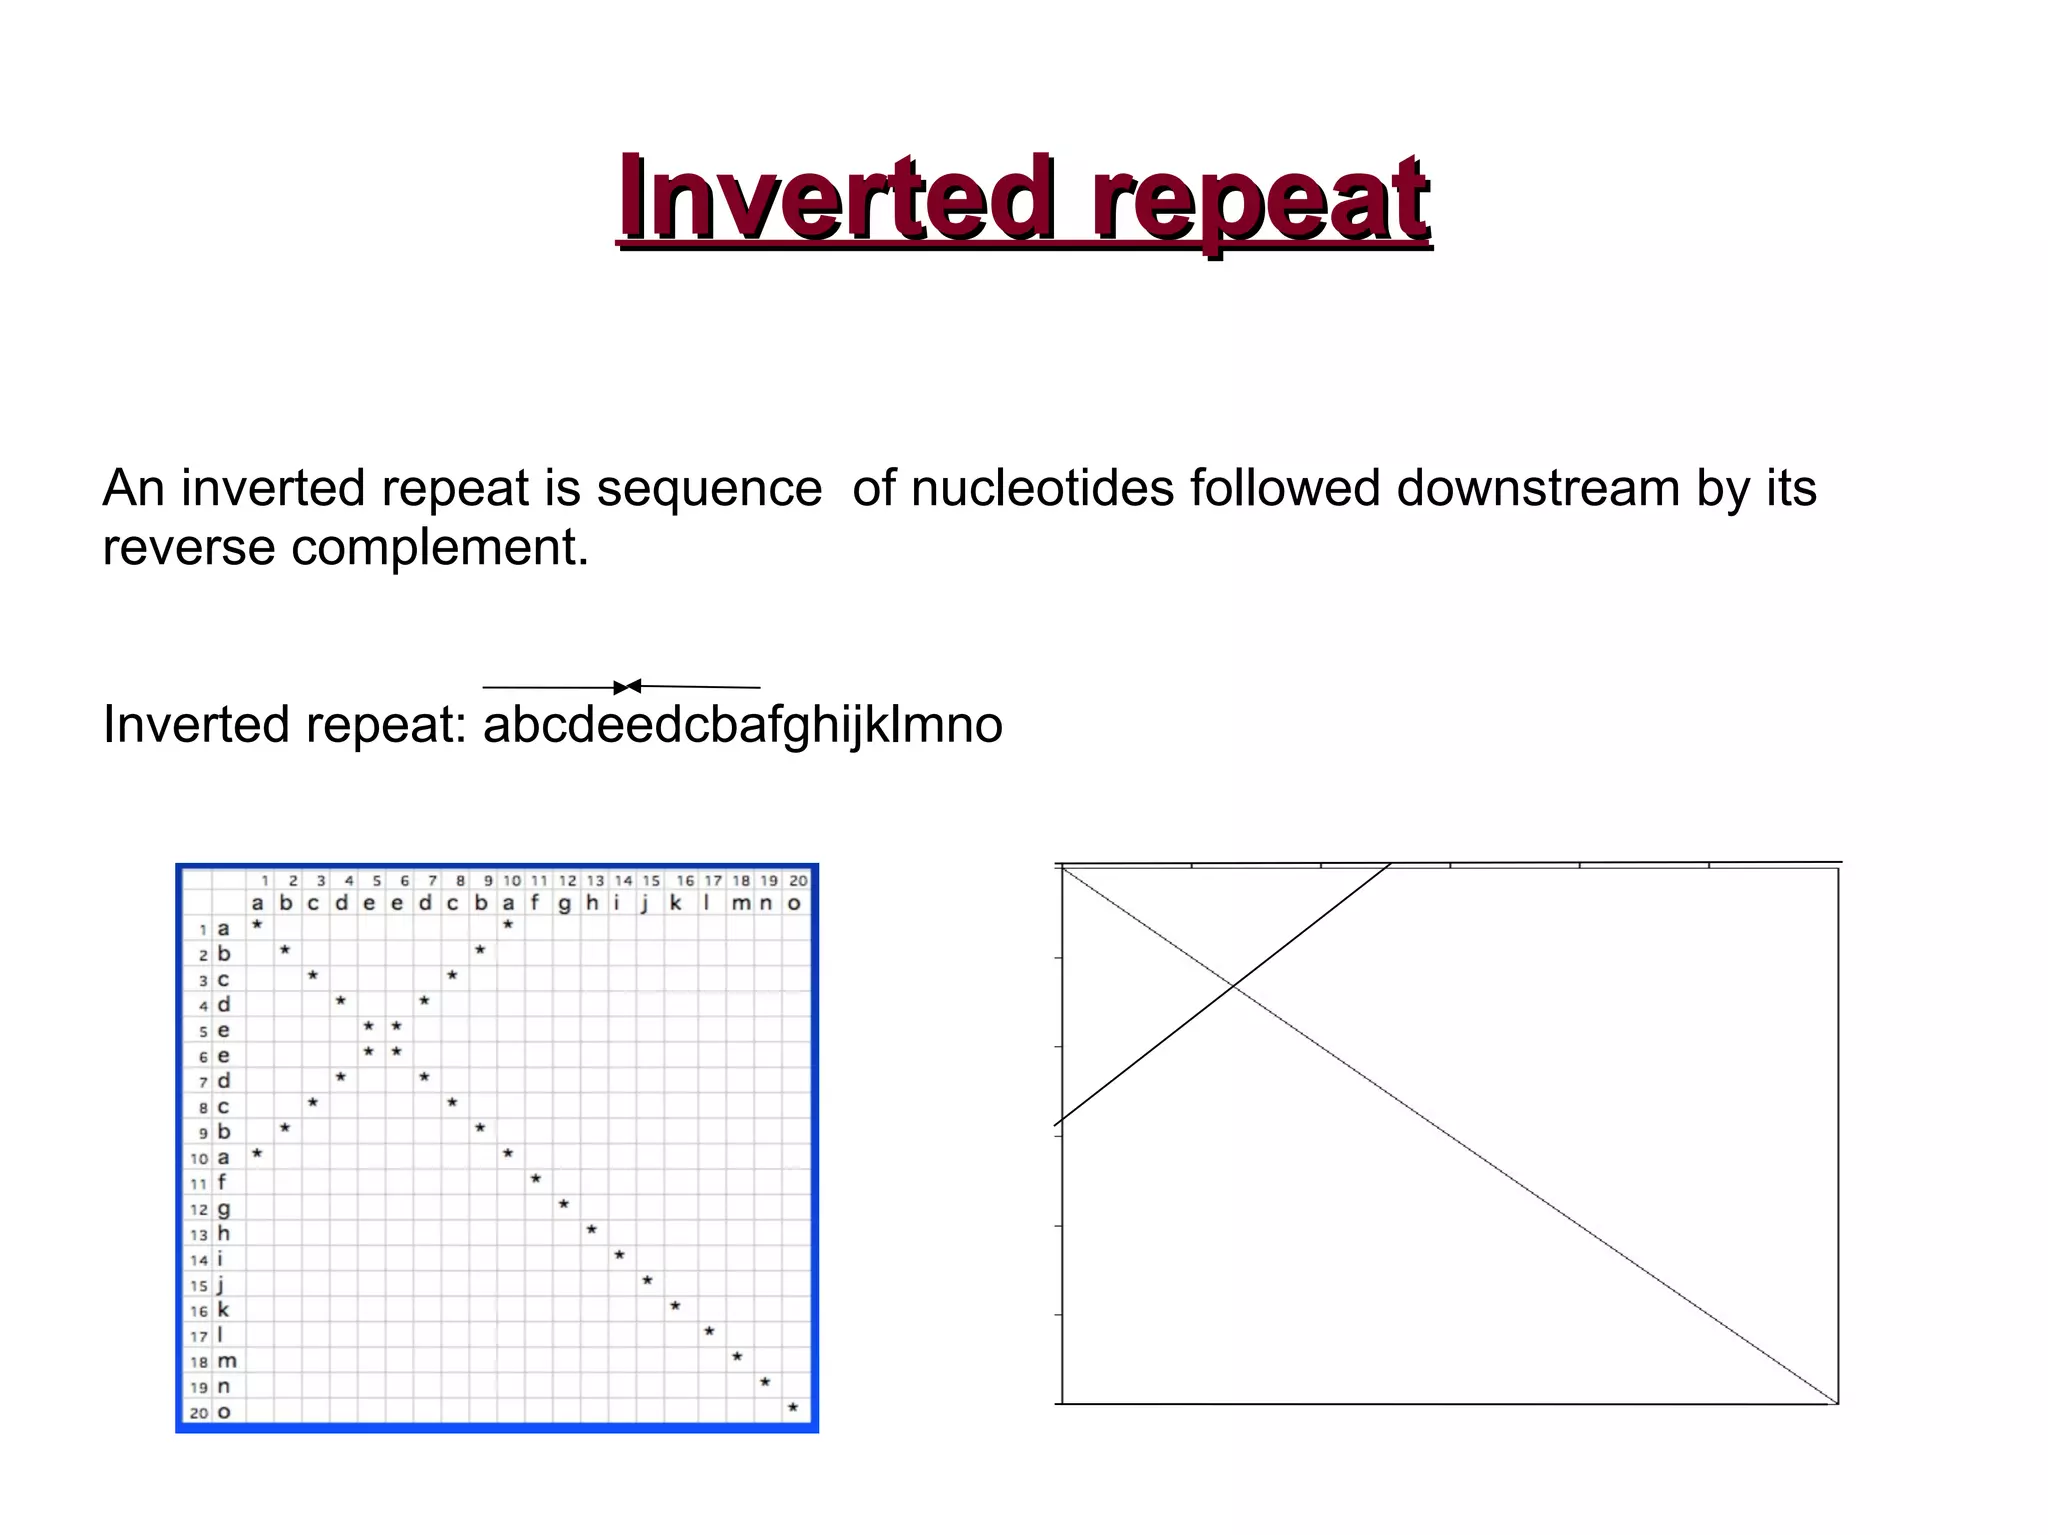
Identical sequences, direct repeats, and inverted repeats are highlighted.
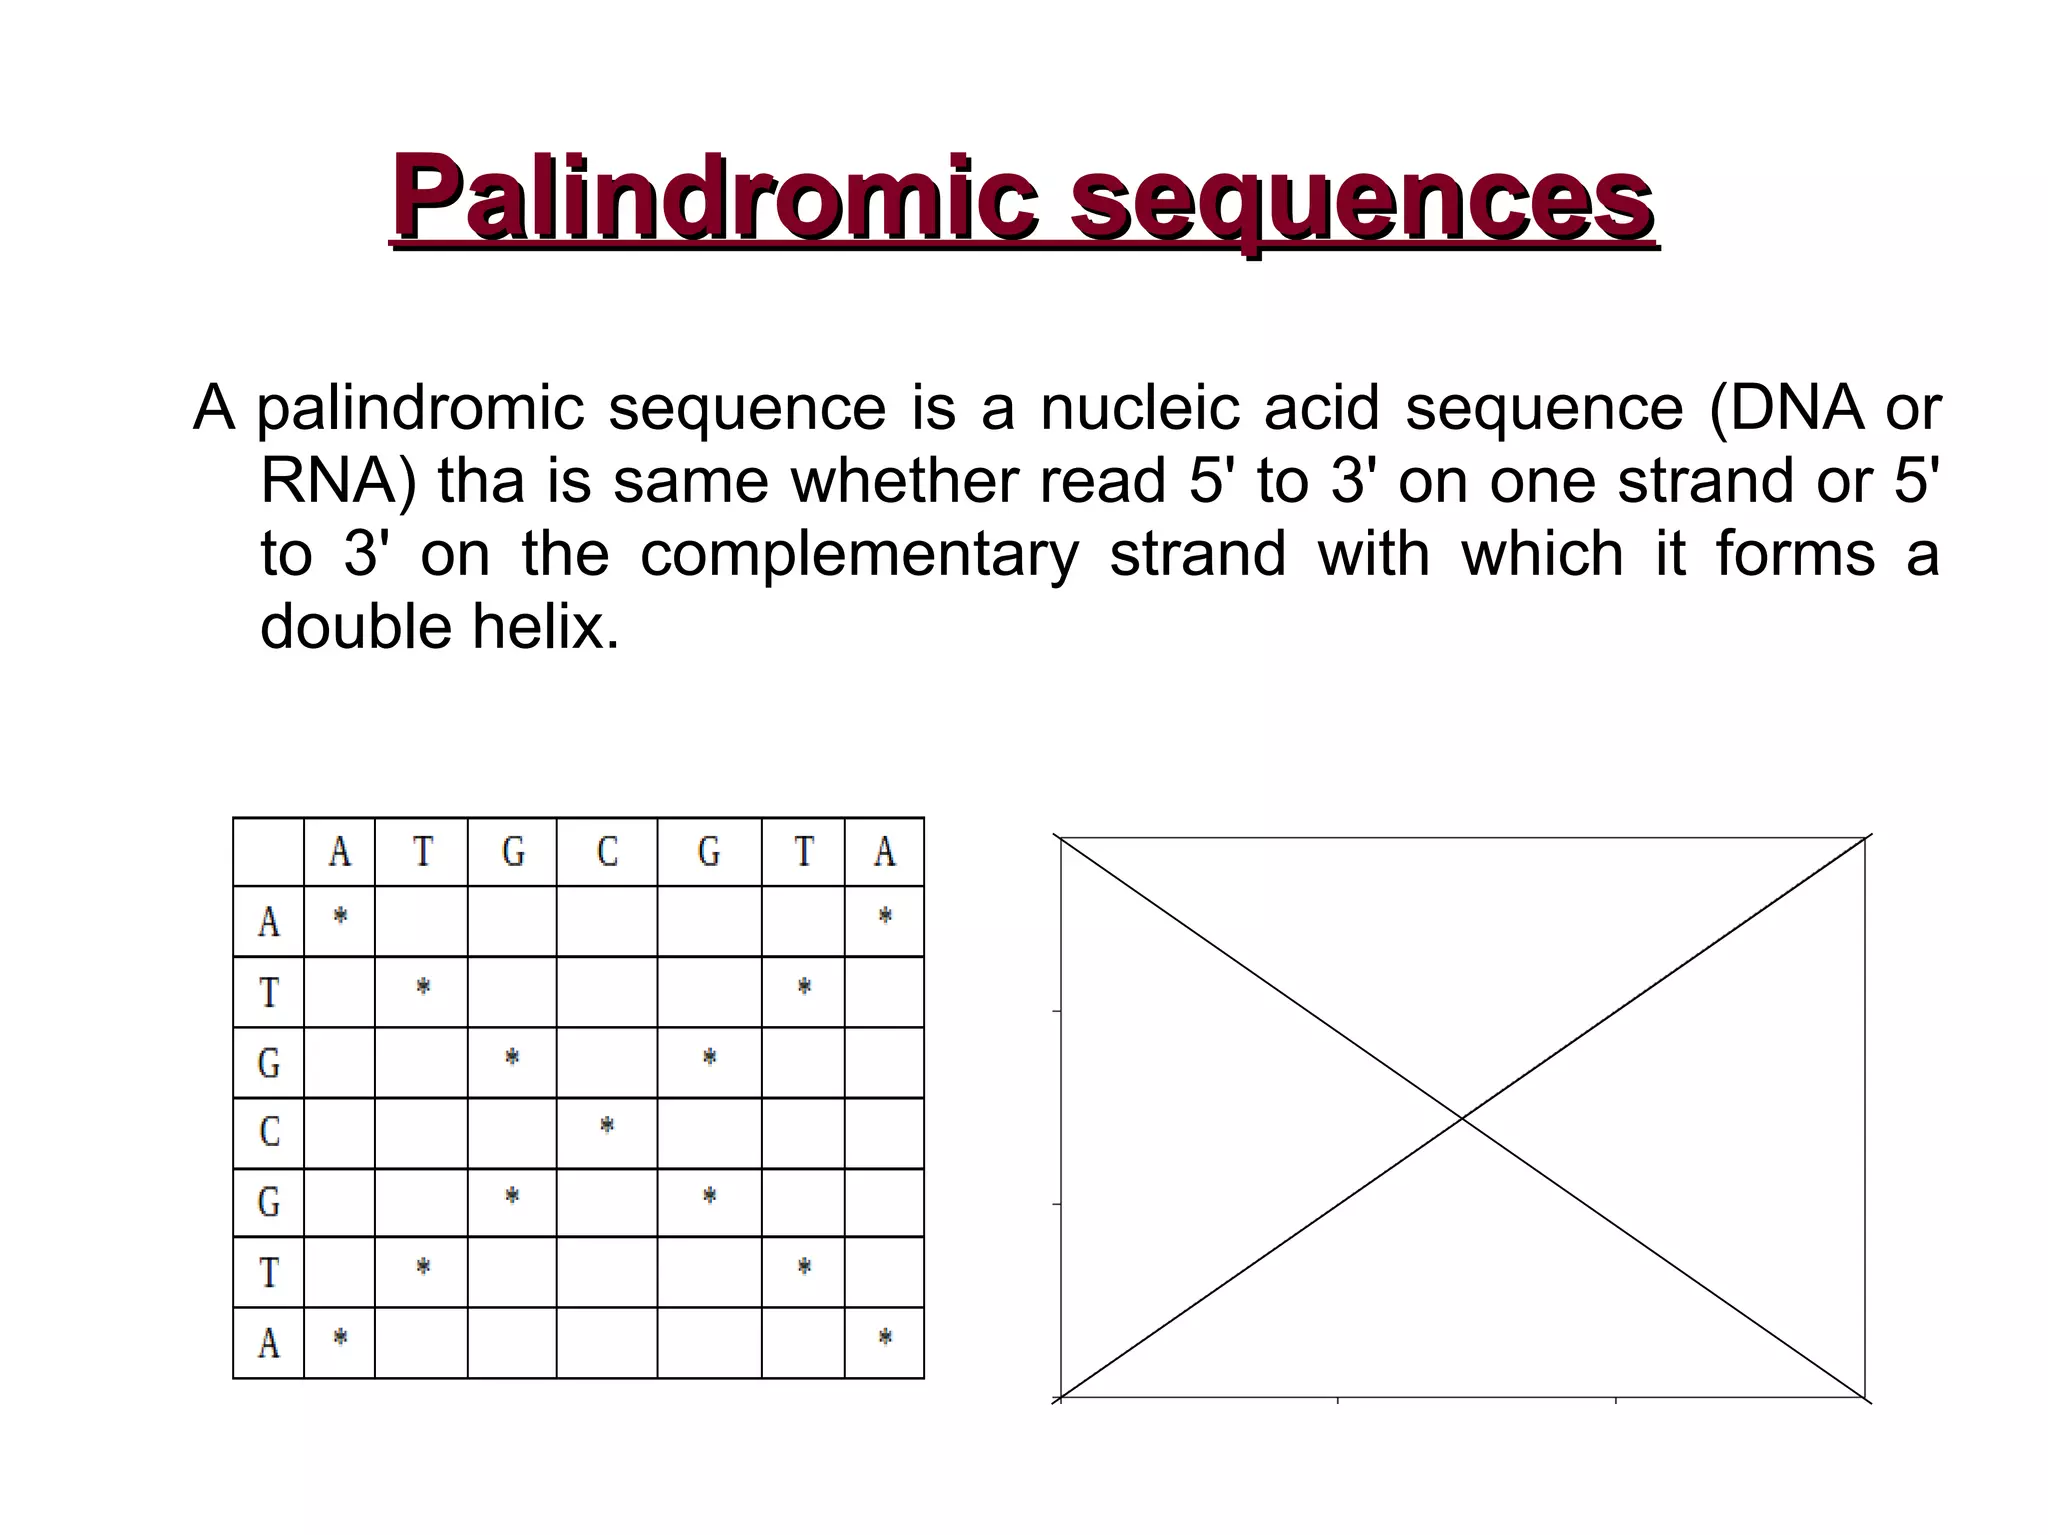
Description of palindromic sequences in nucleic acids.
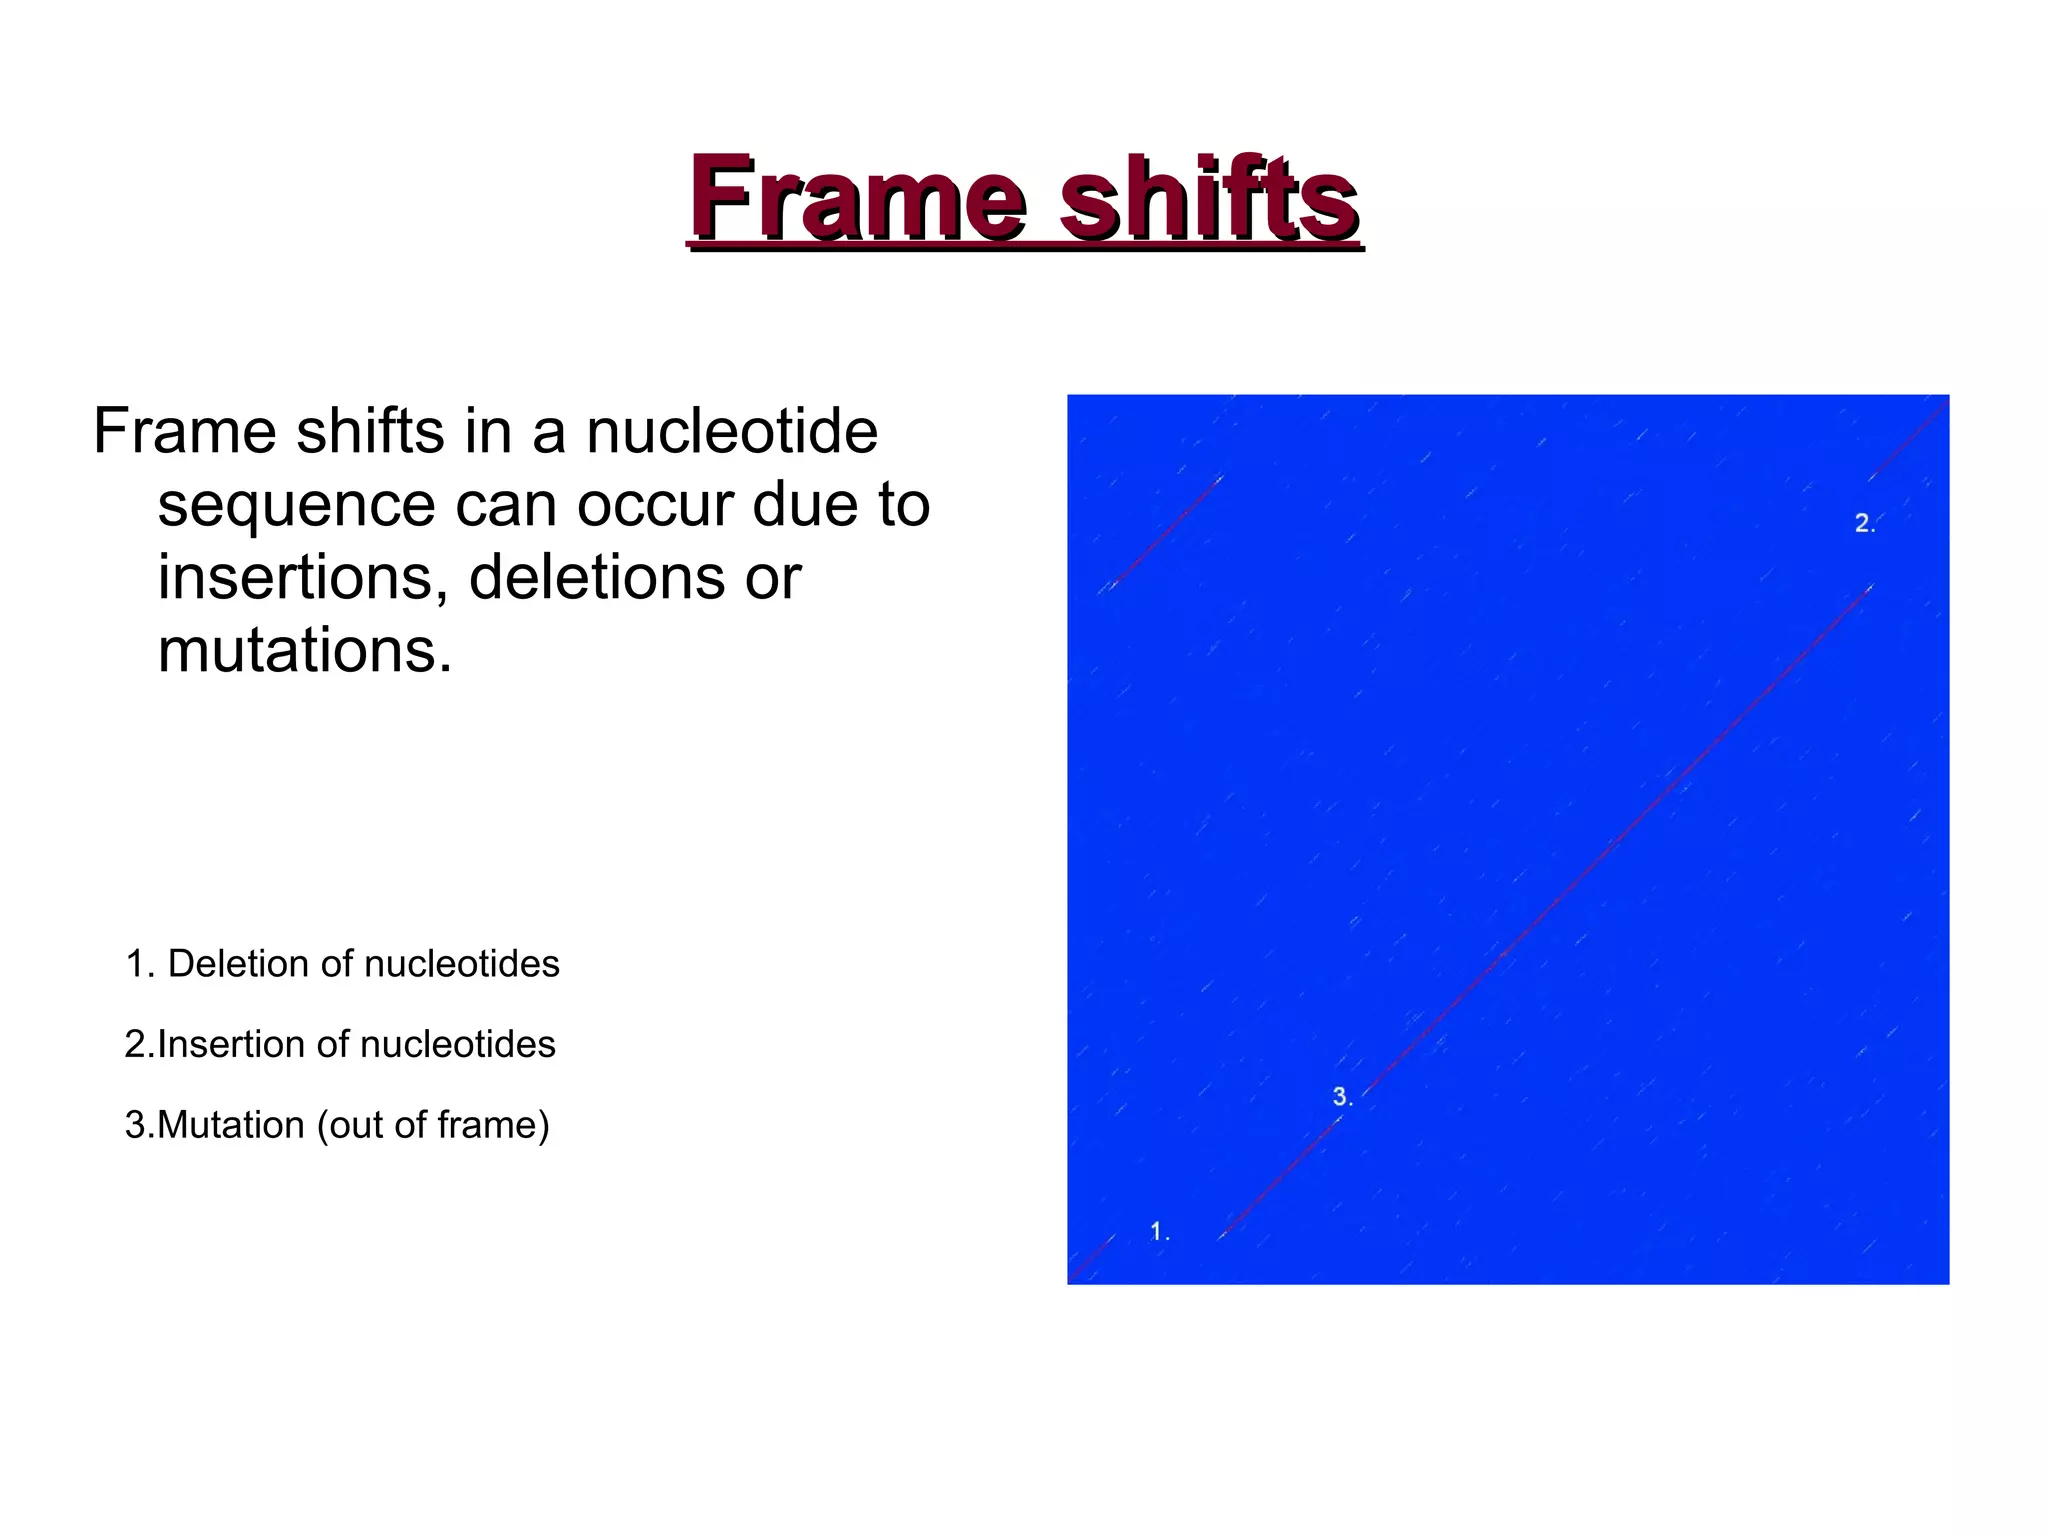
Causes of frame shifts in sequences due to insertions, deletions, or mutations.
Introduction to low complexity regions and their calculation from amino acid redundancy.
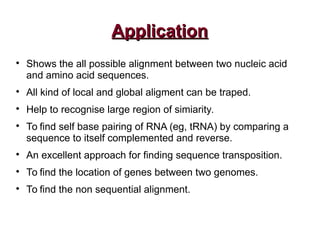
Applications include alignment of sequences, identification of similarity, and gene location.
Challenges faced such as high memory requirements for long sequences and inefficiency.
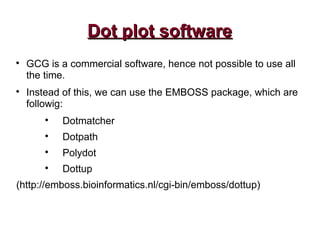
Examples of software used for creating dot plots including commercial and open-source options.
Citations related to bioinformatics literature and sources for further reading.


