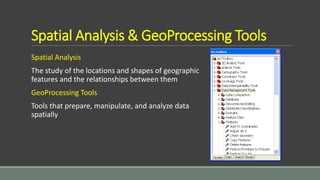
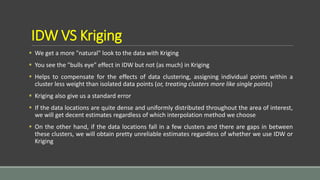
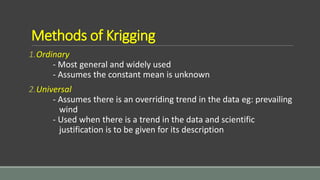
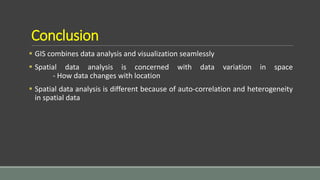
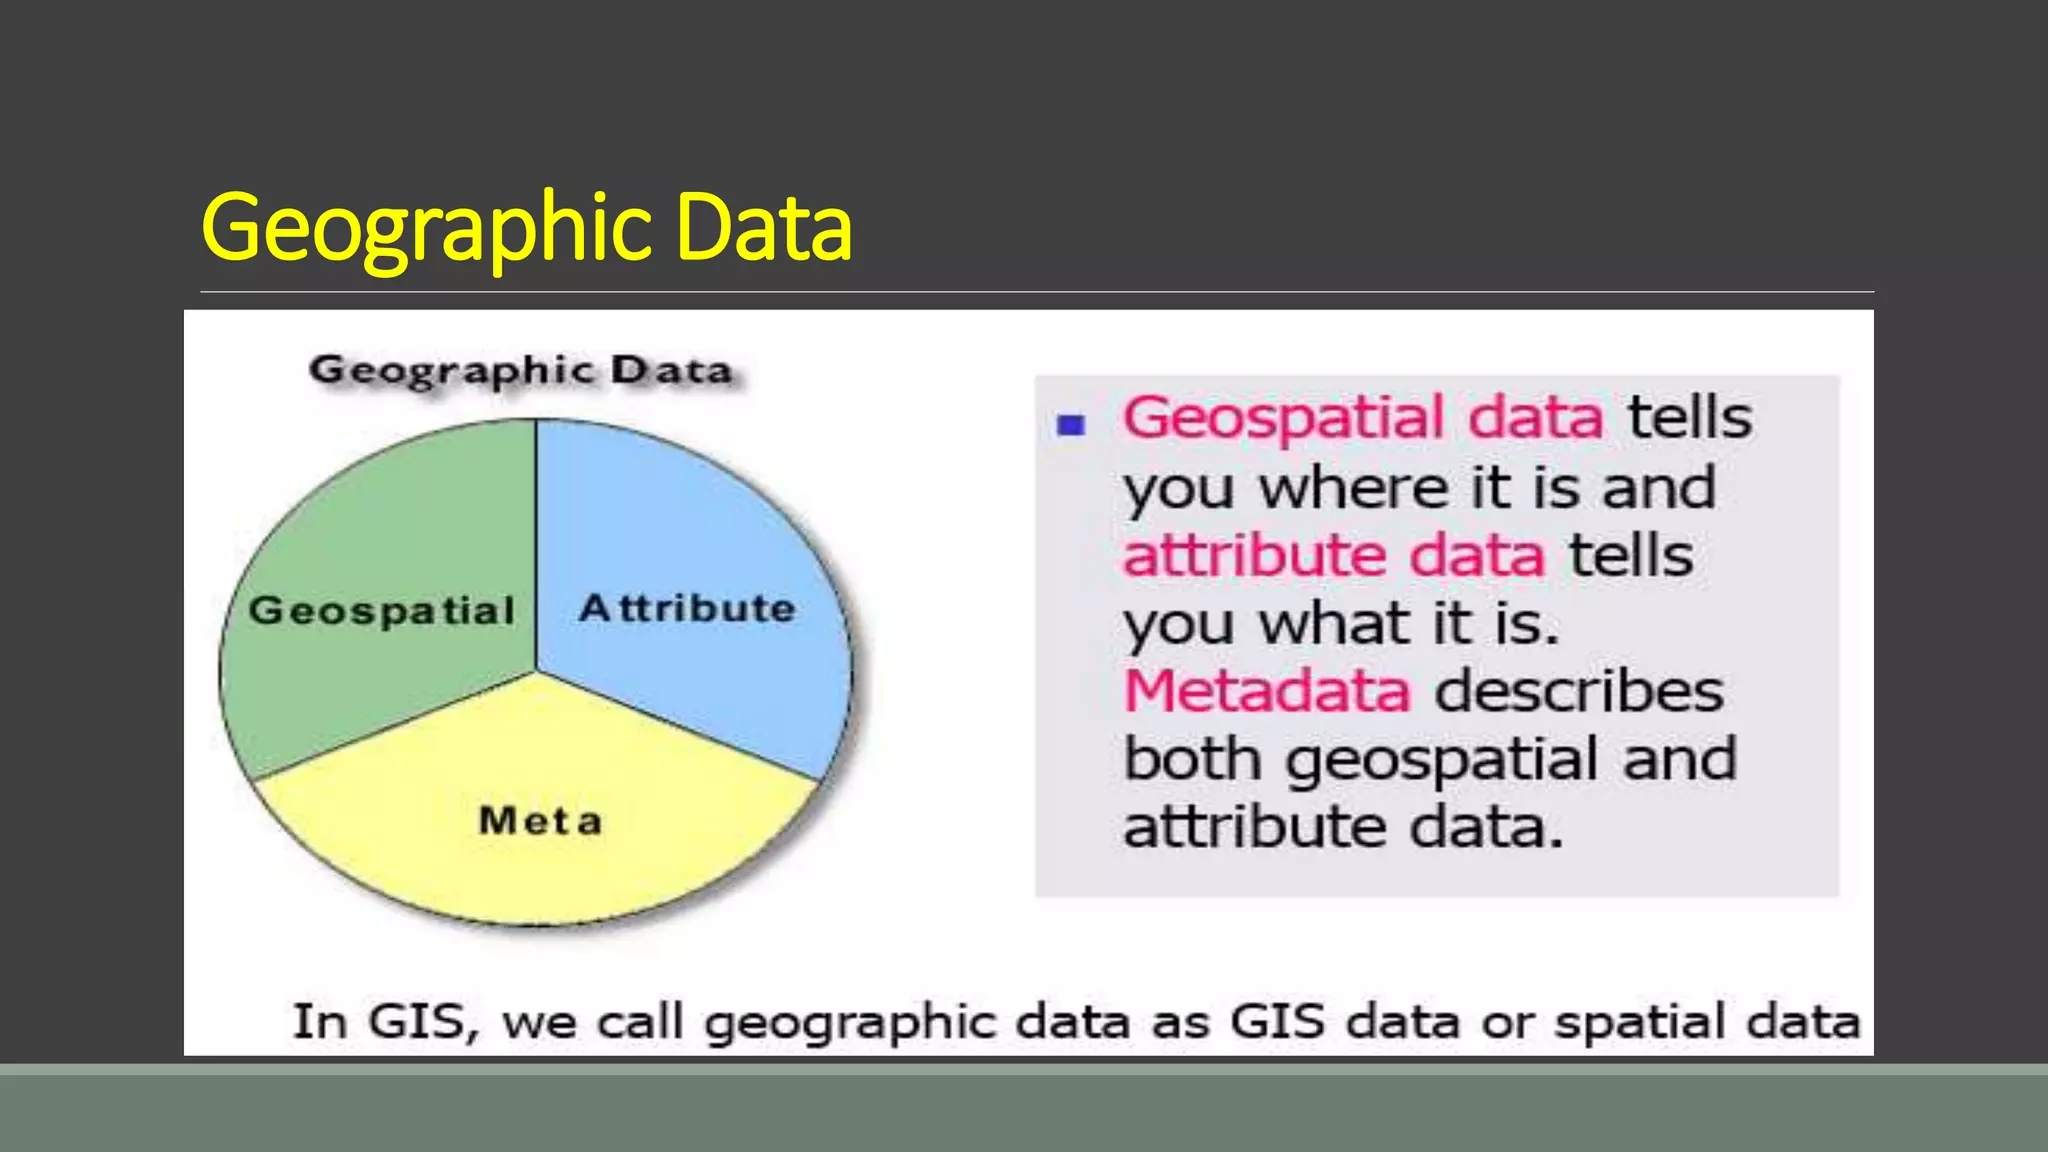
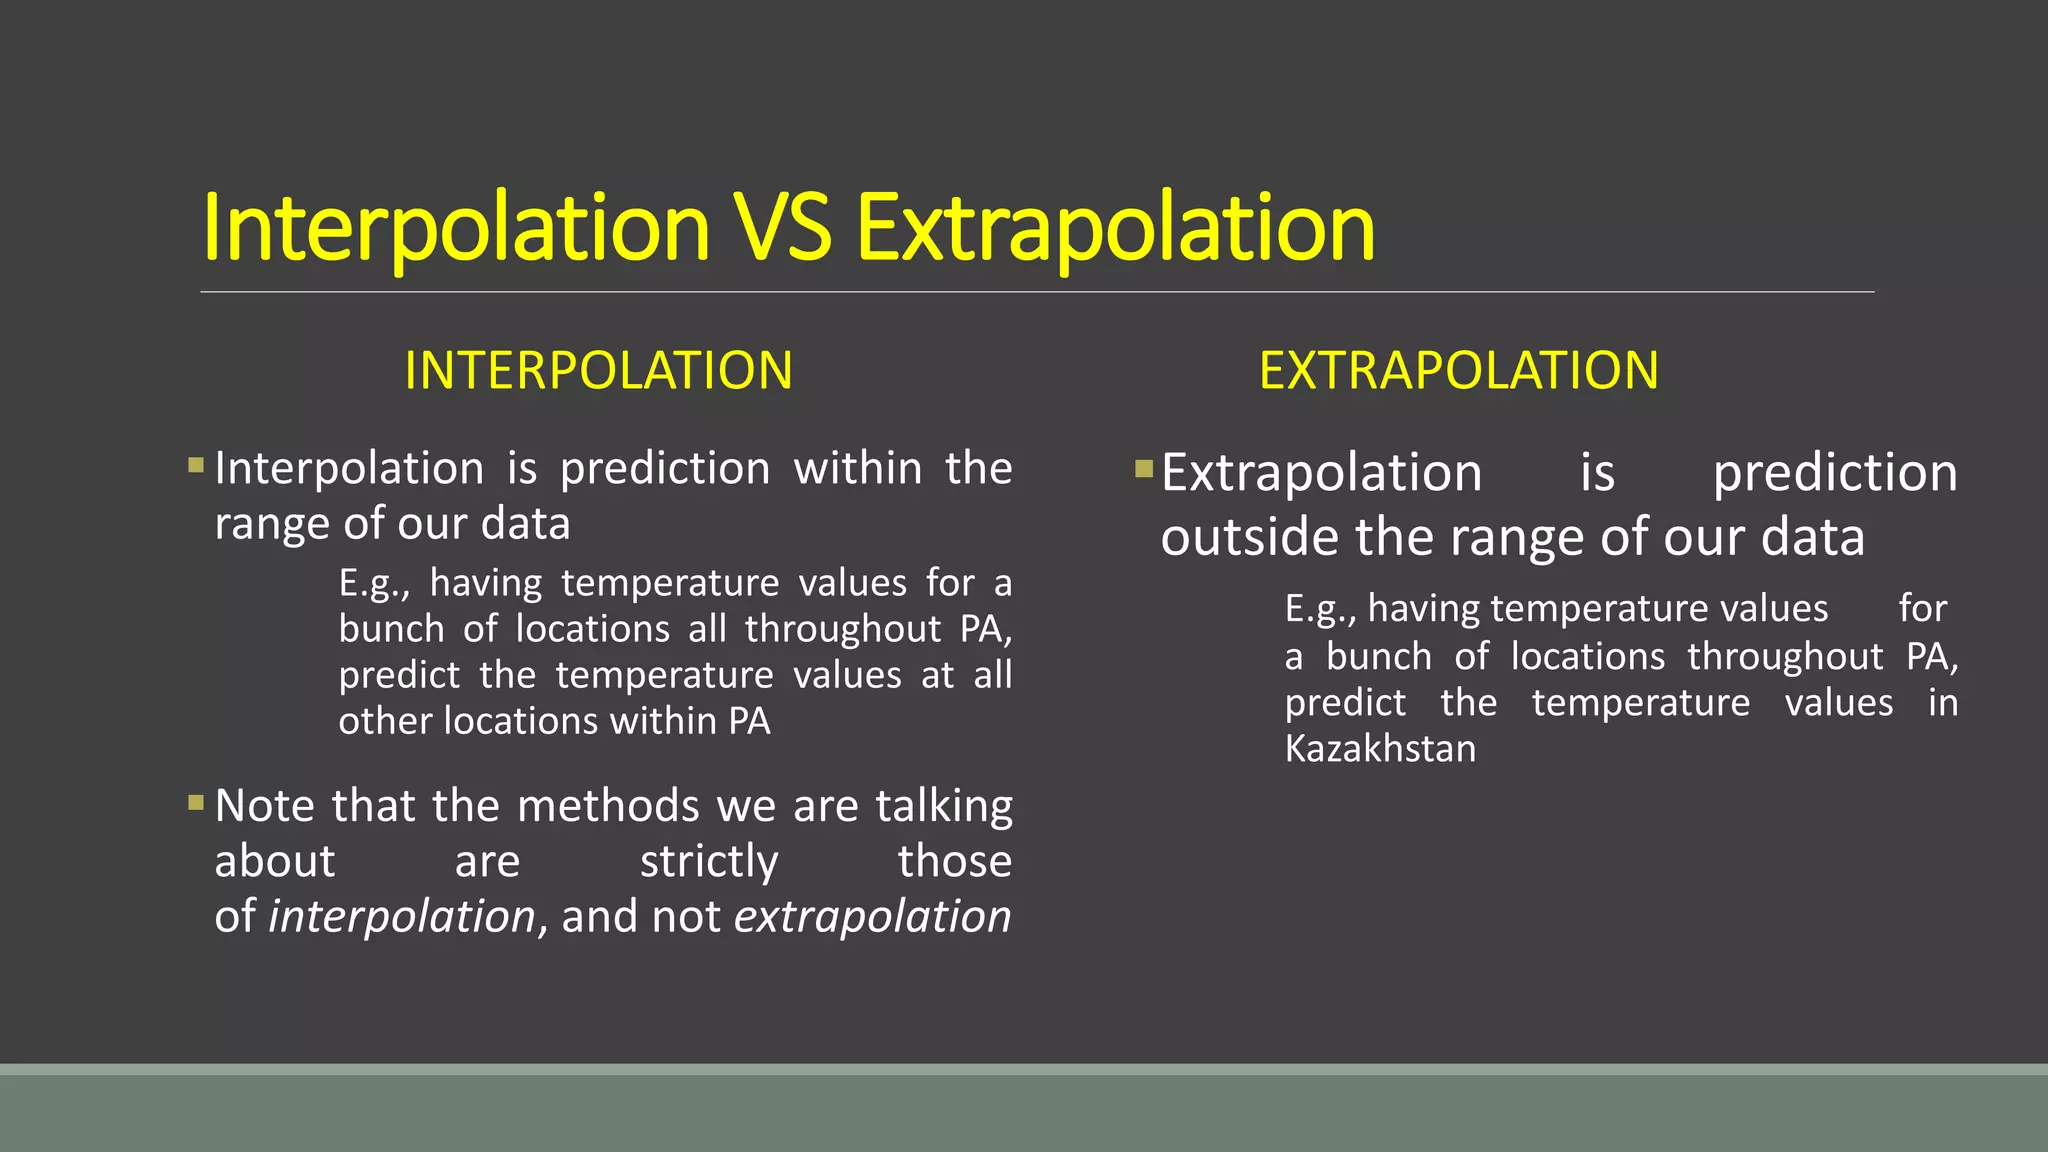
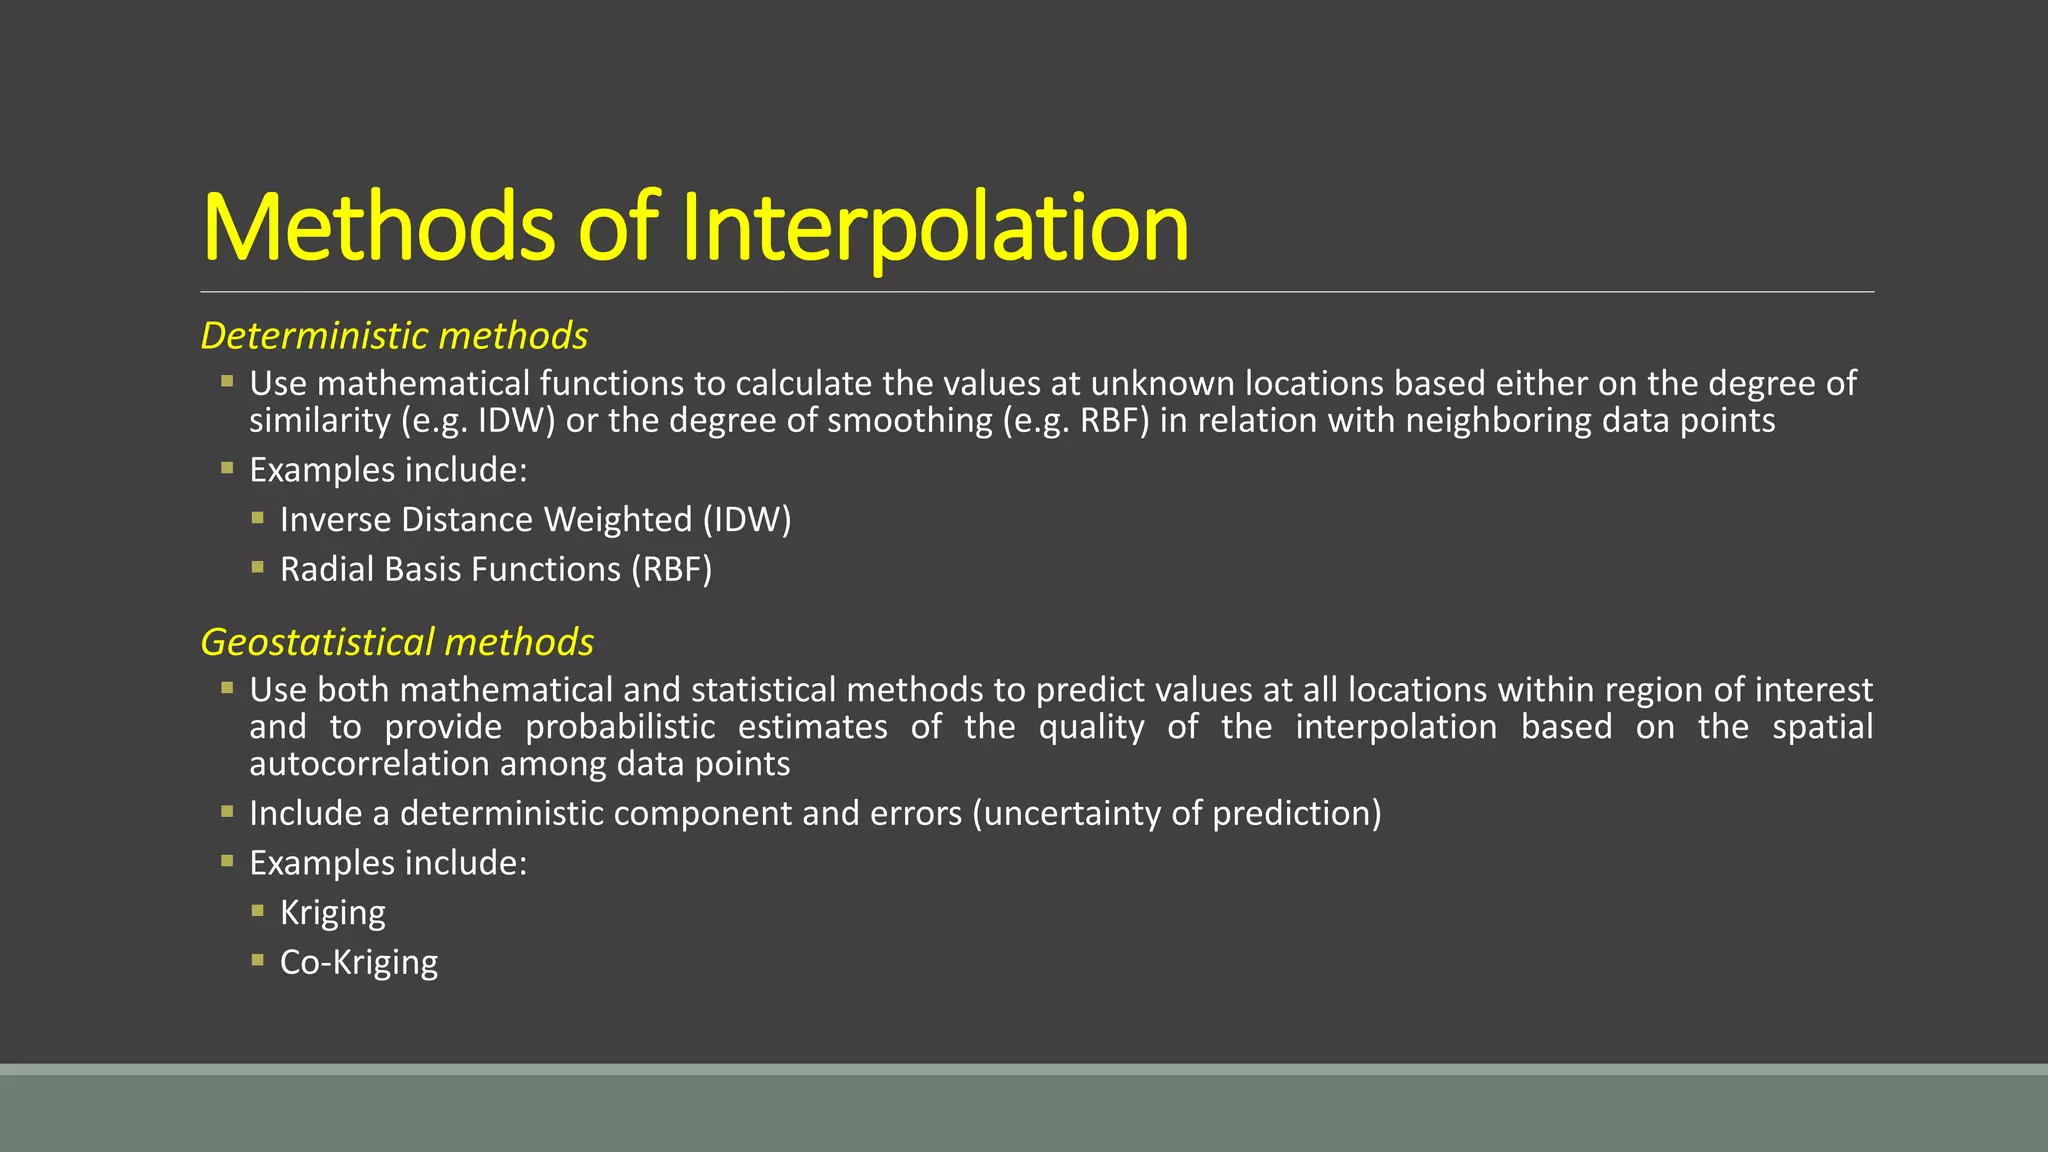
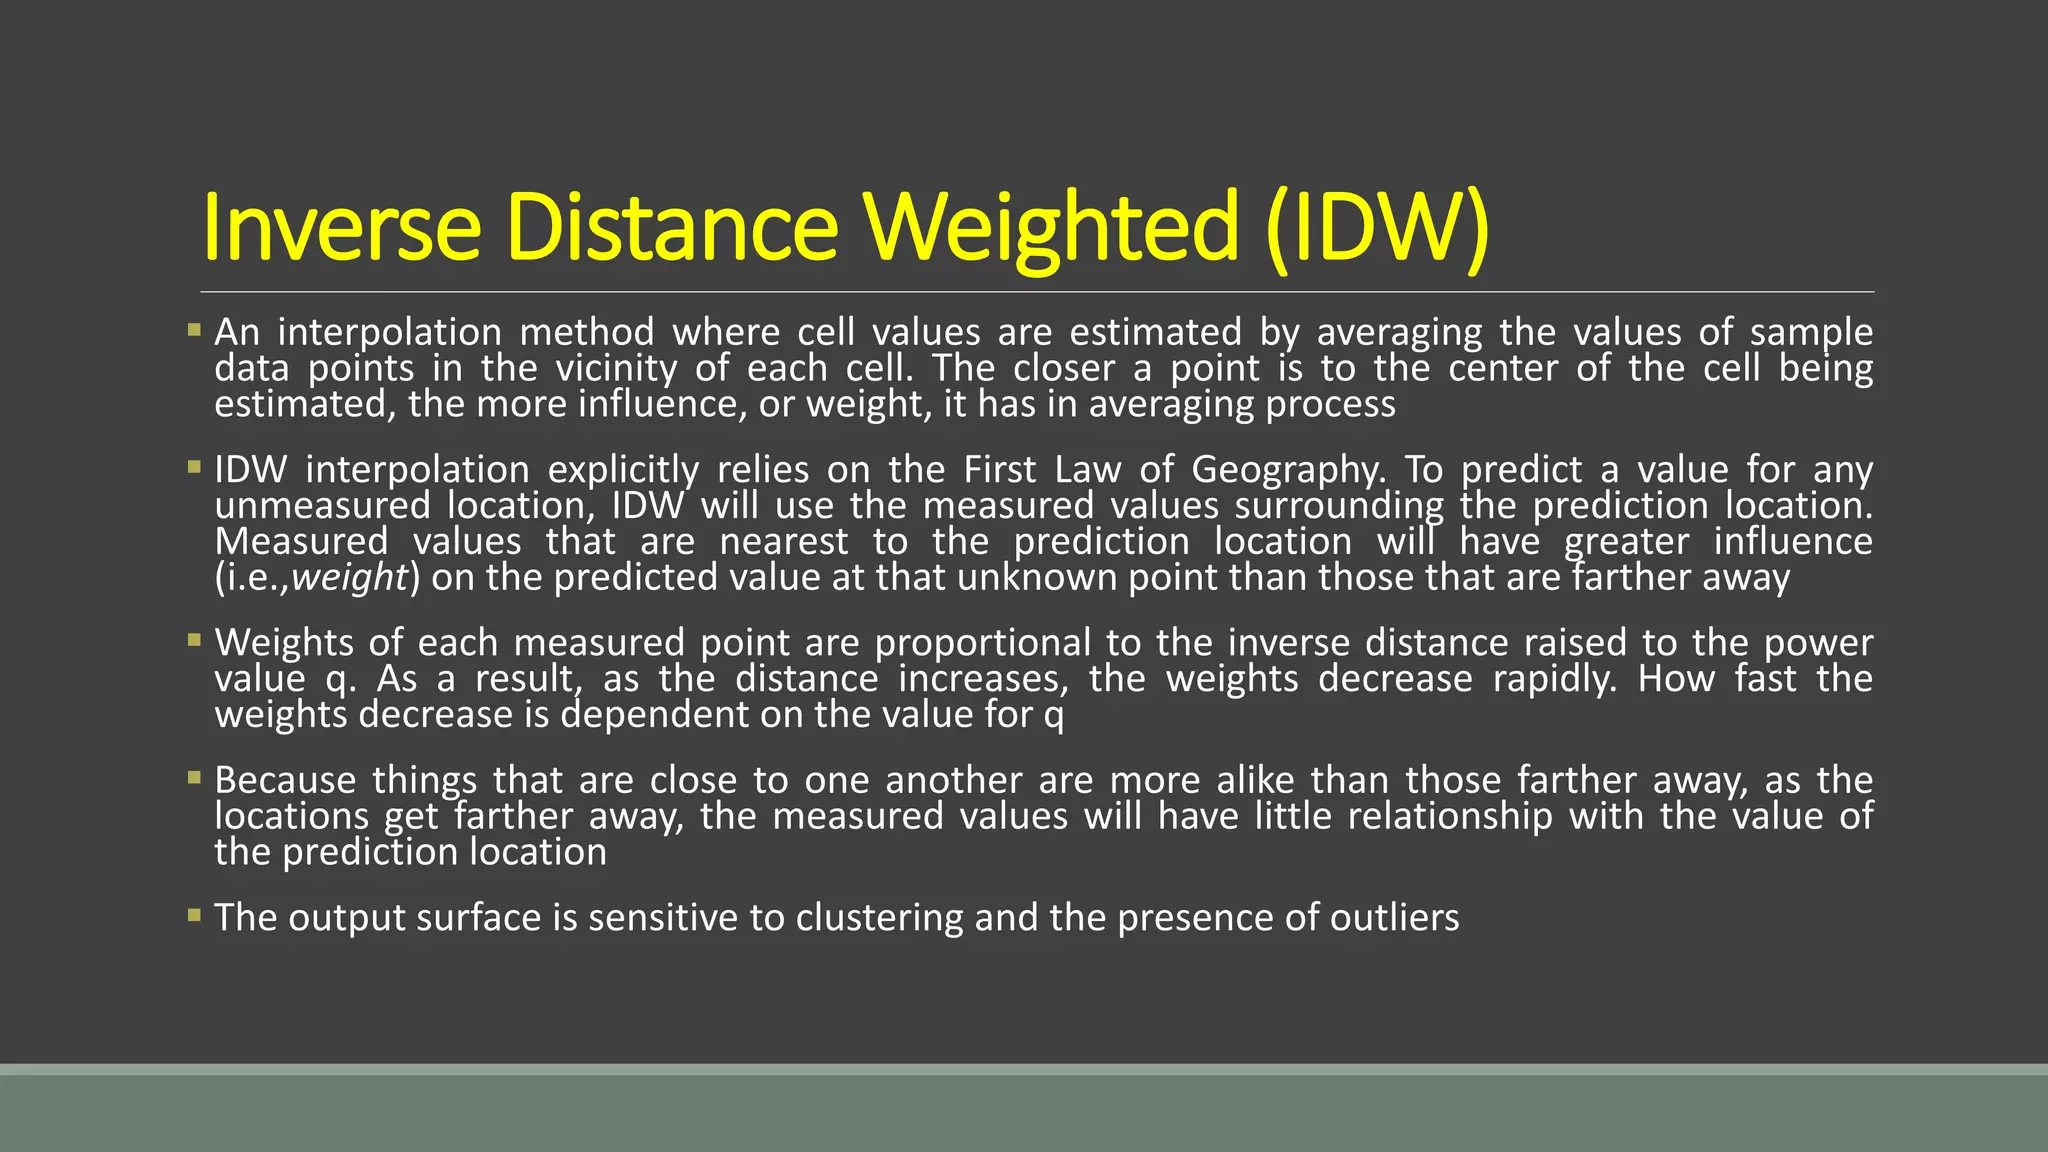
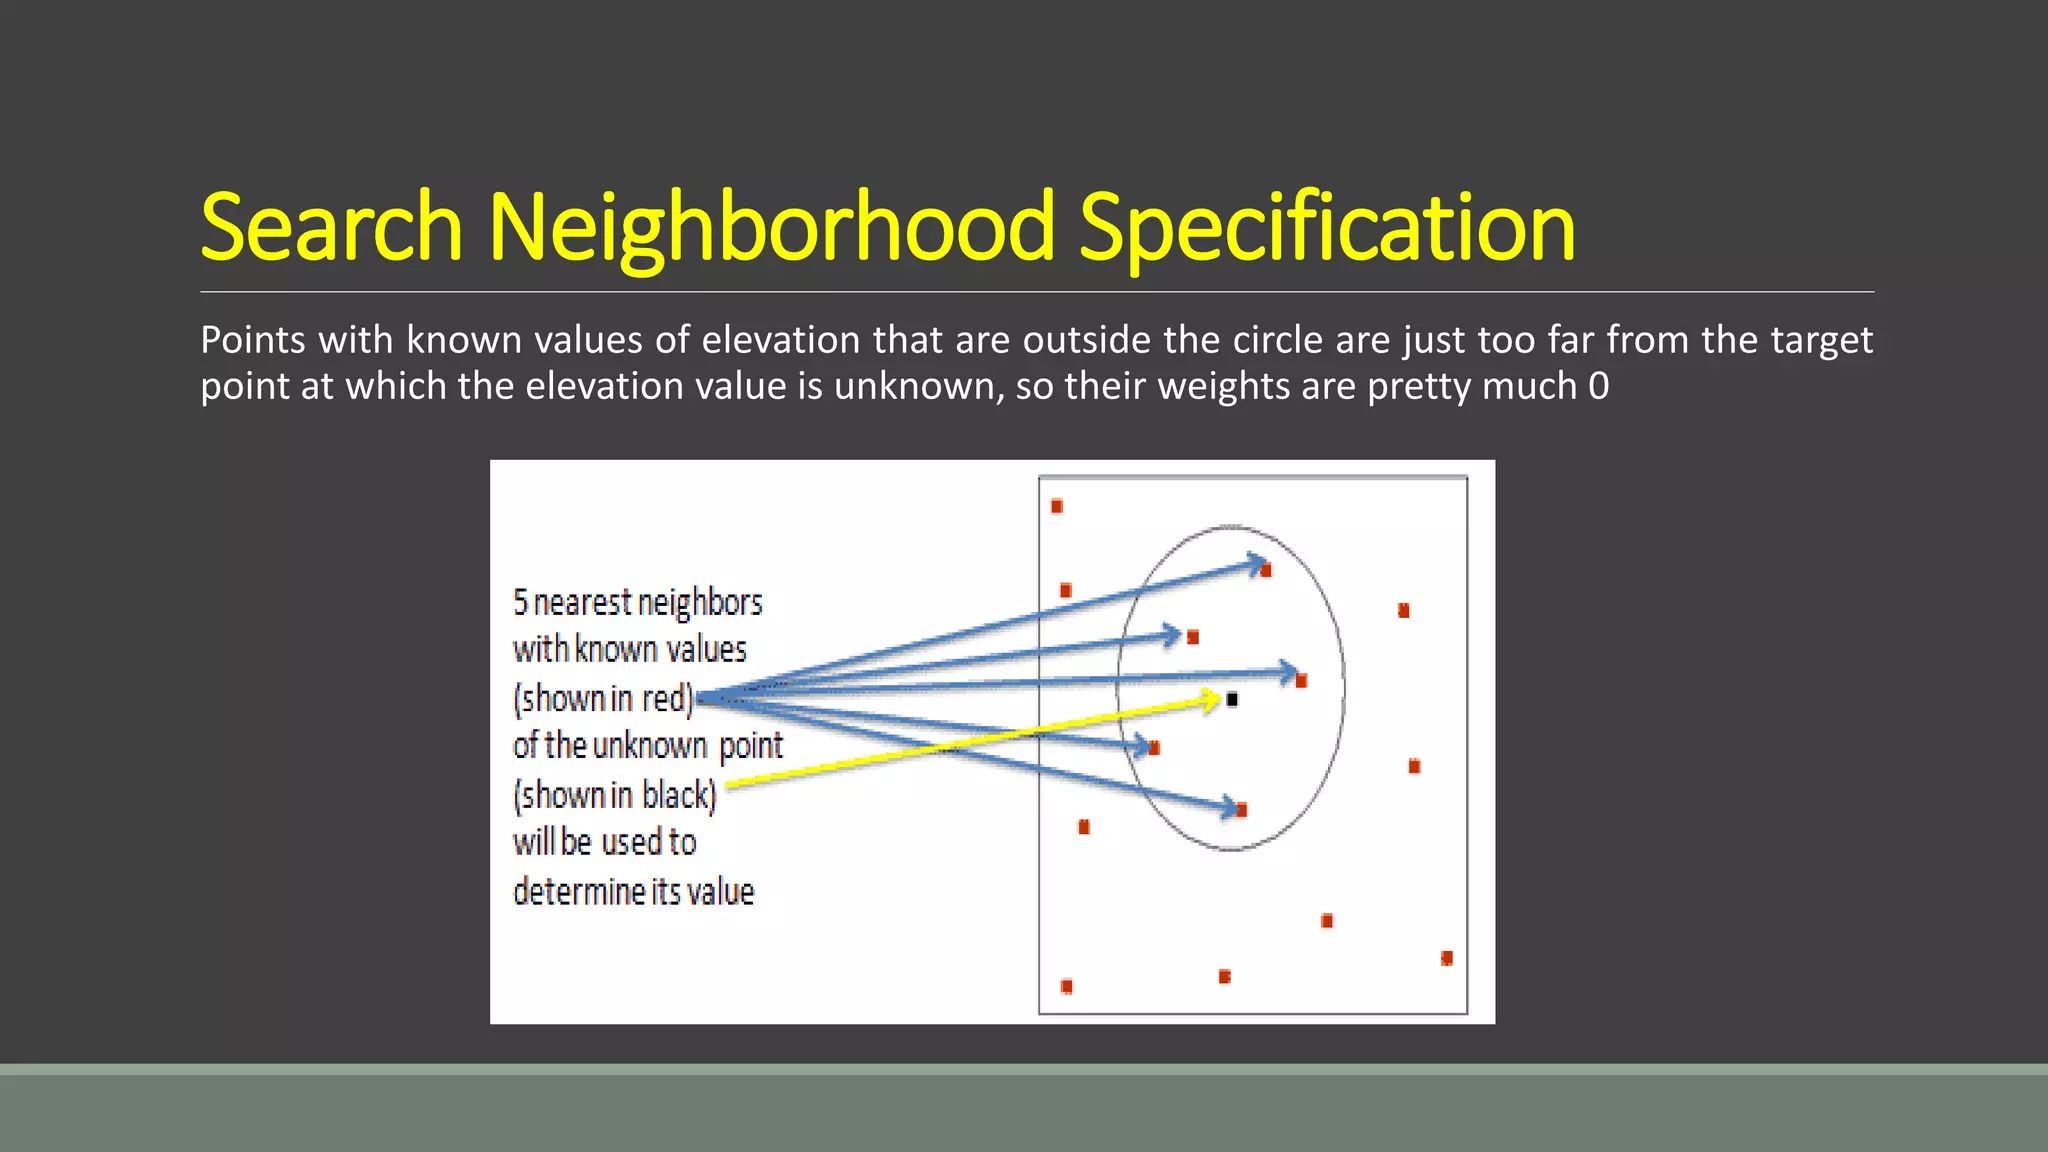
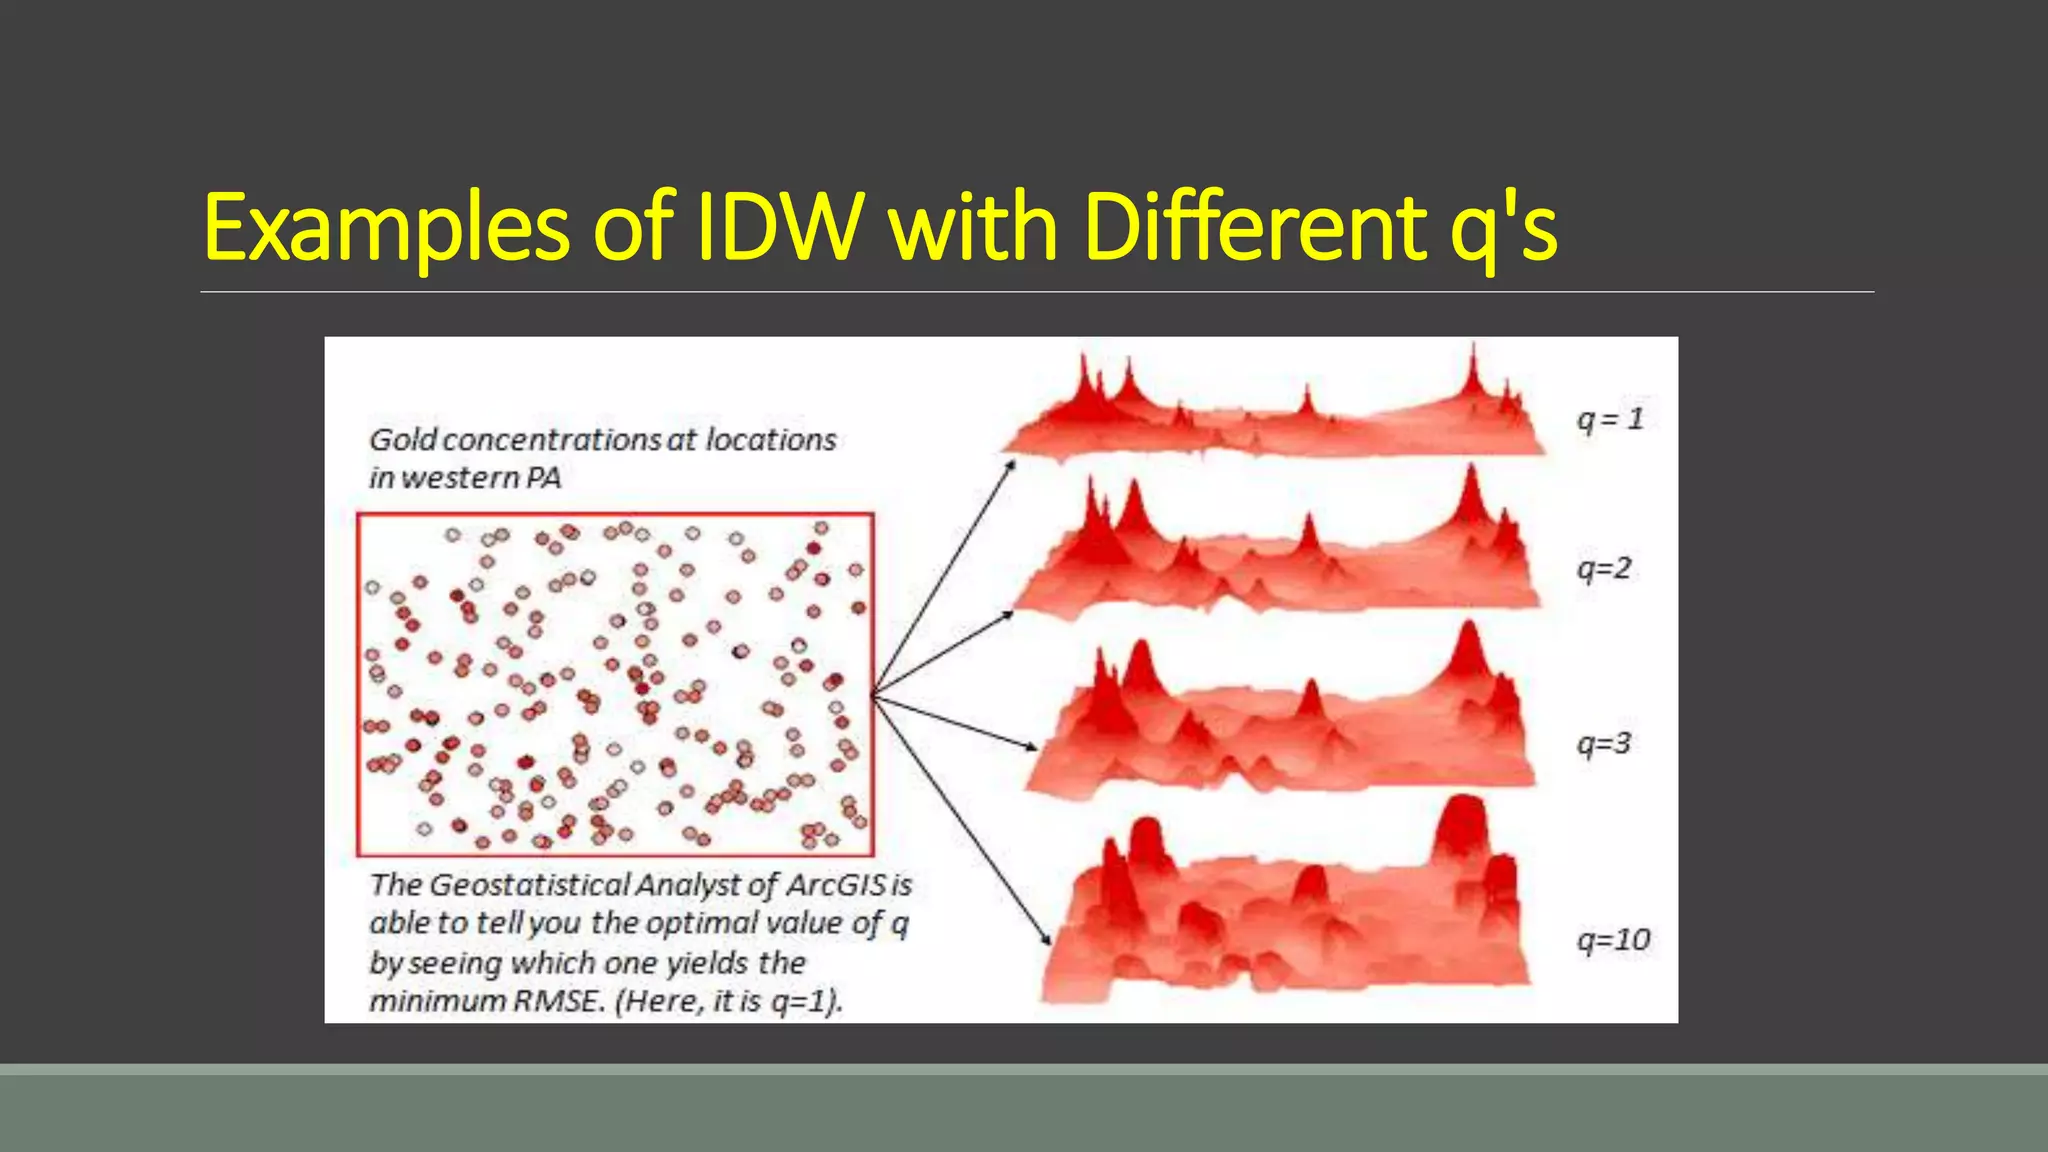
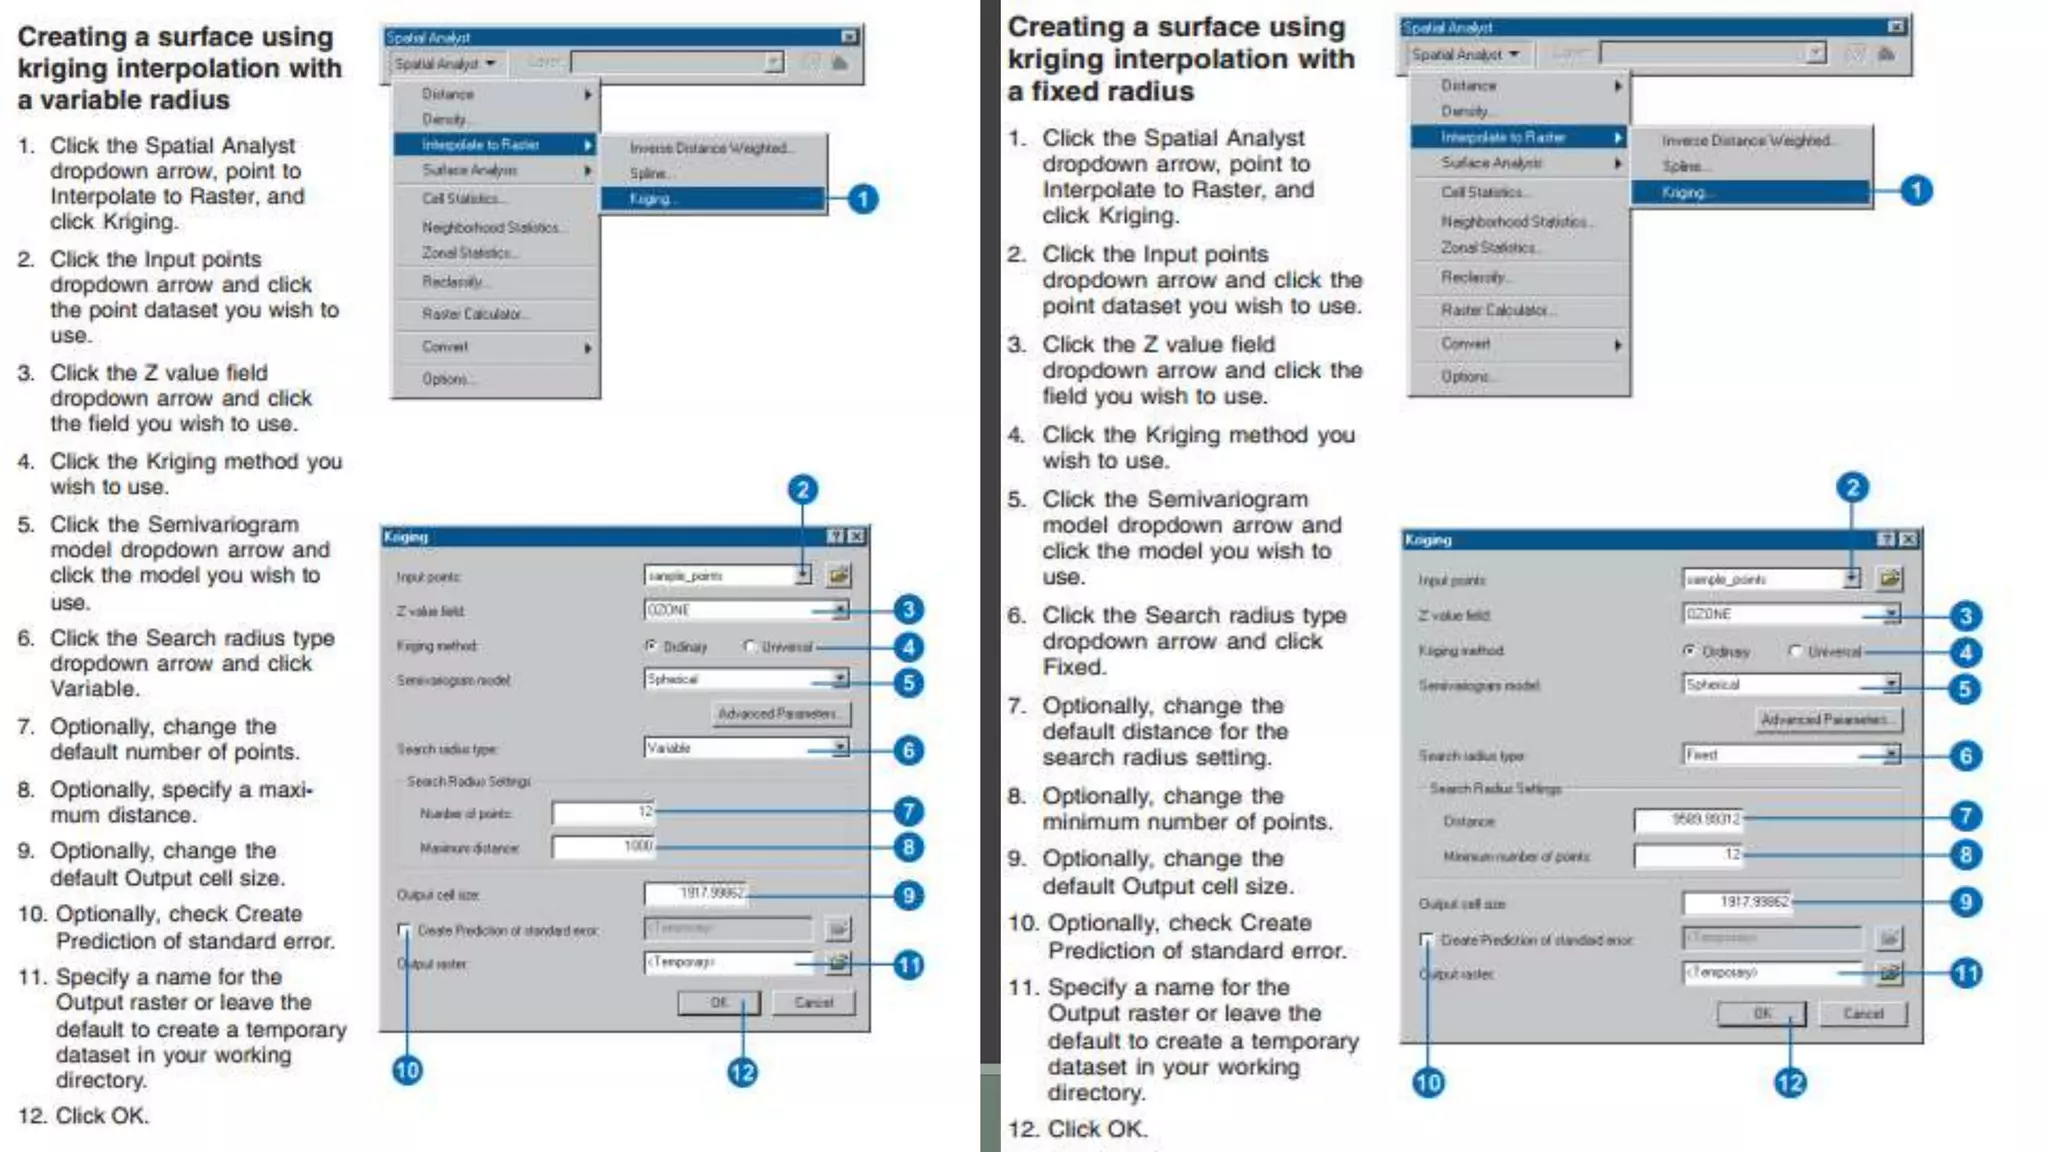
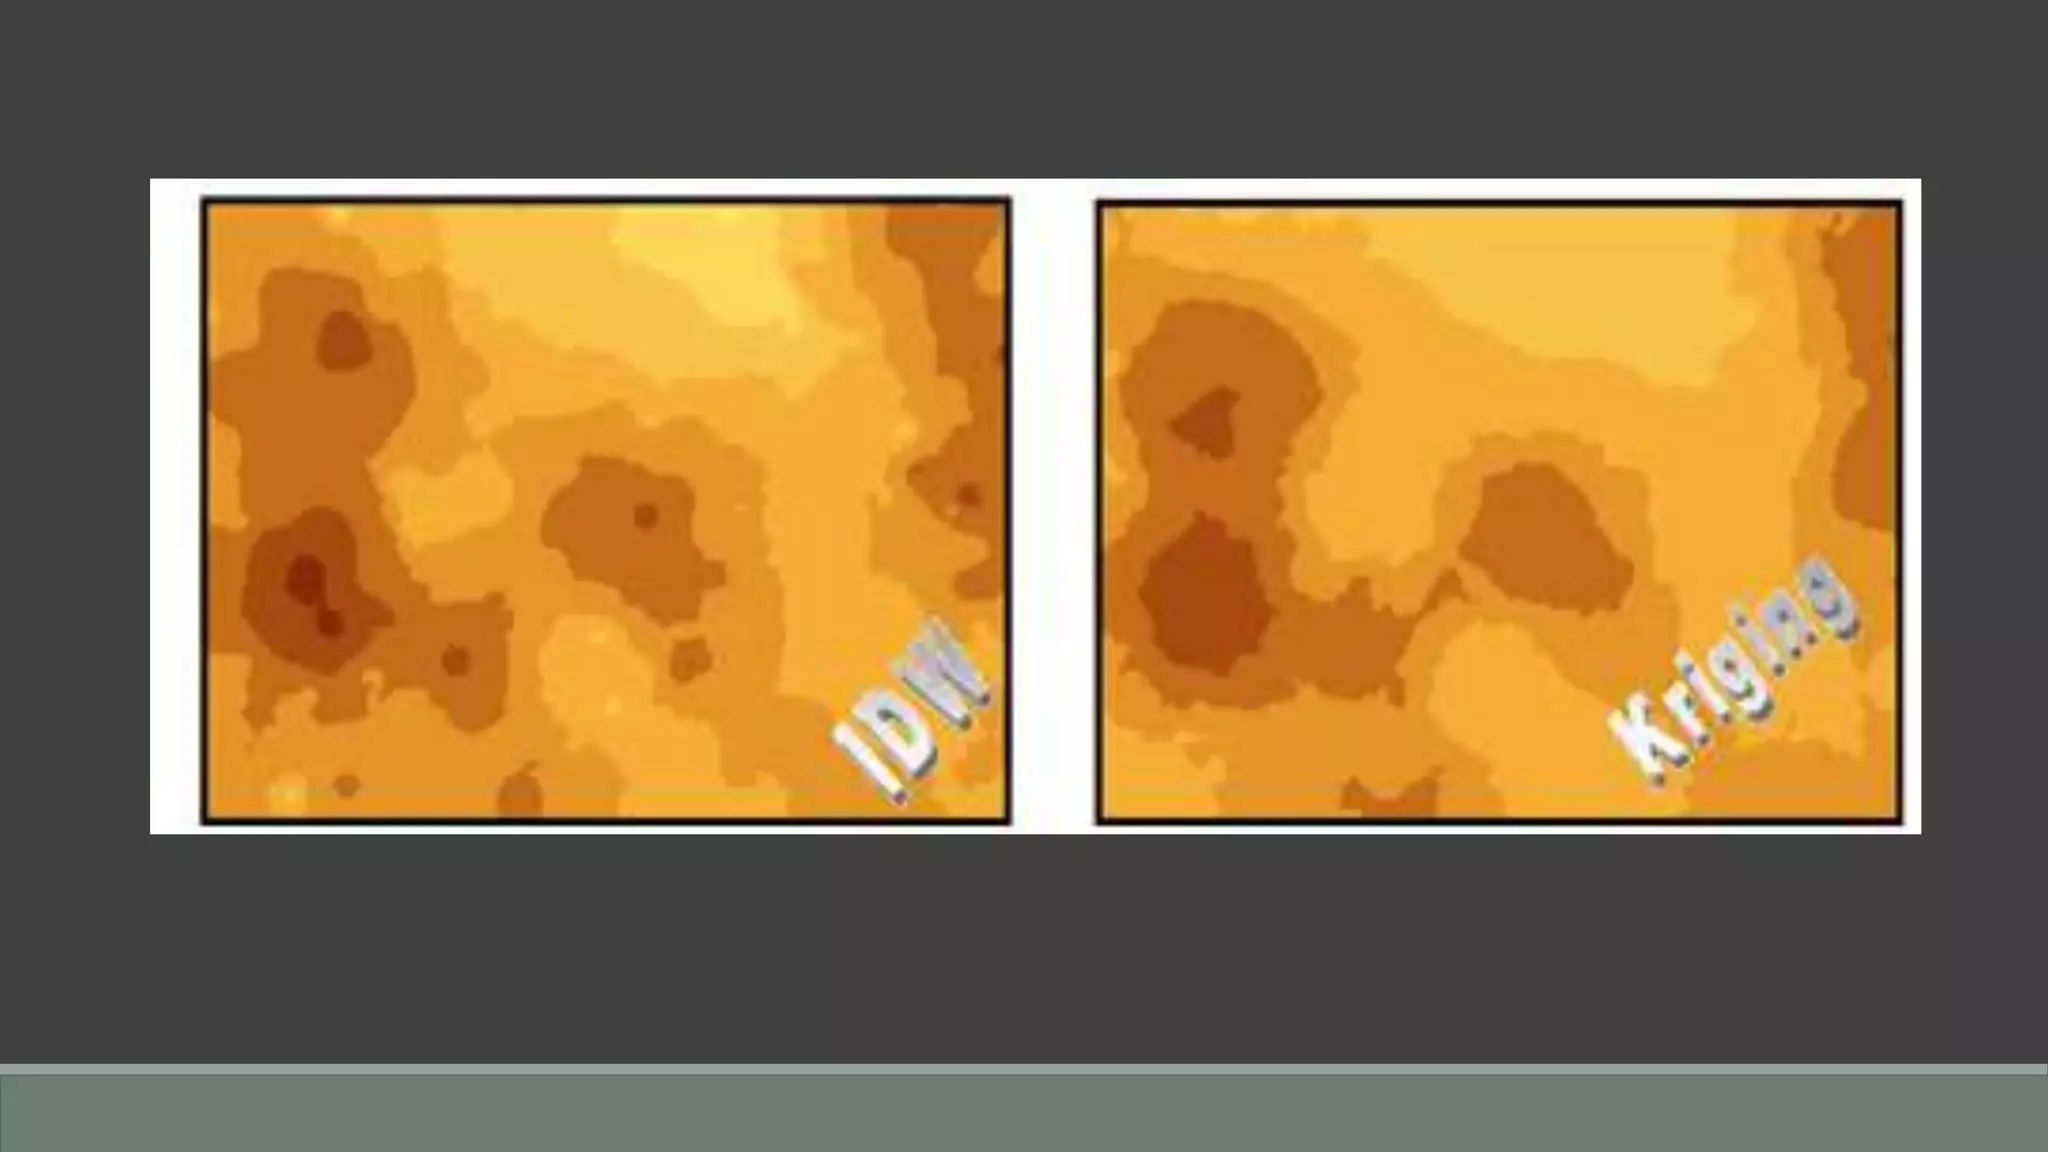
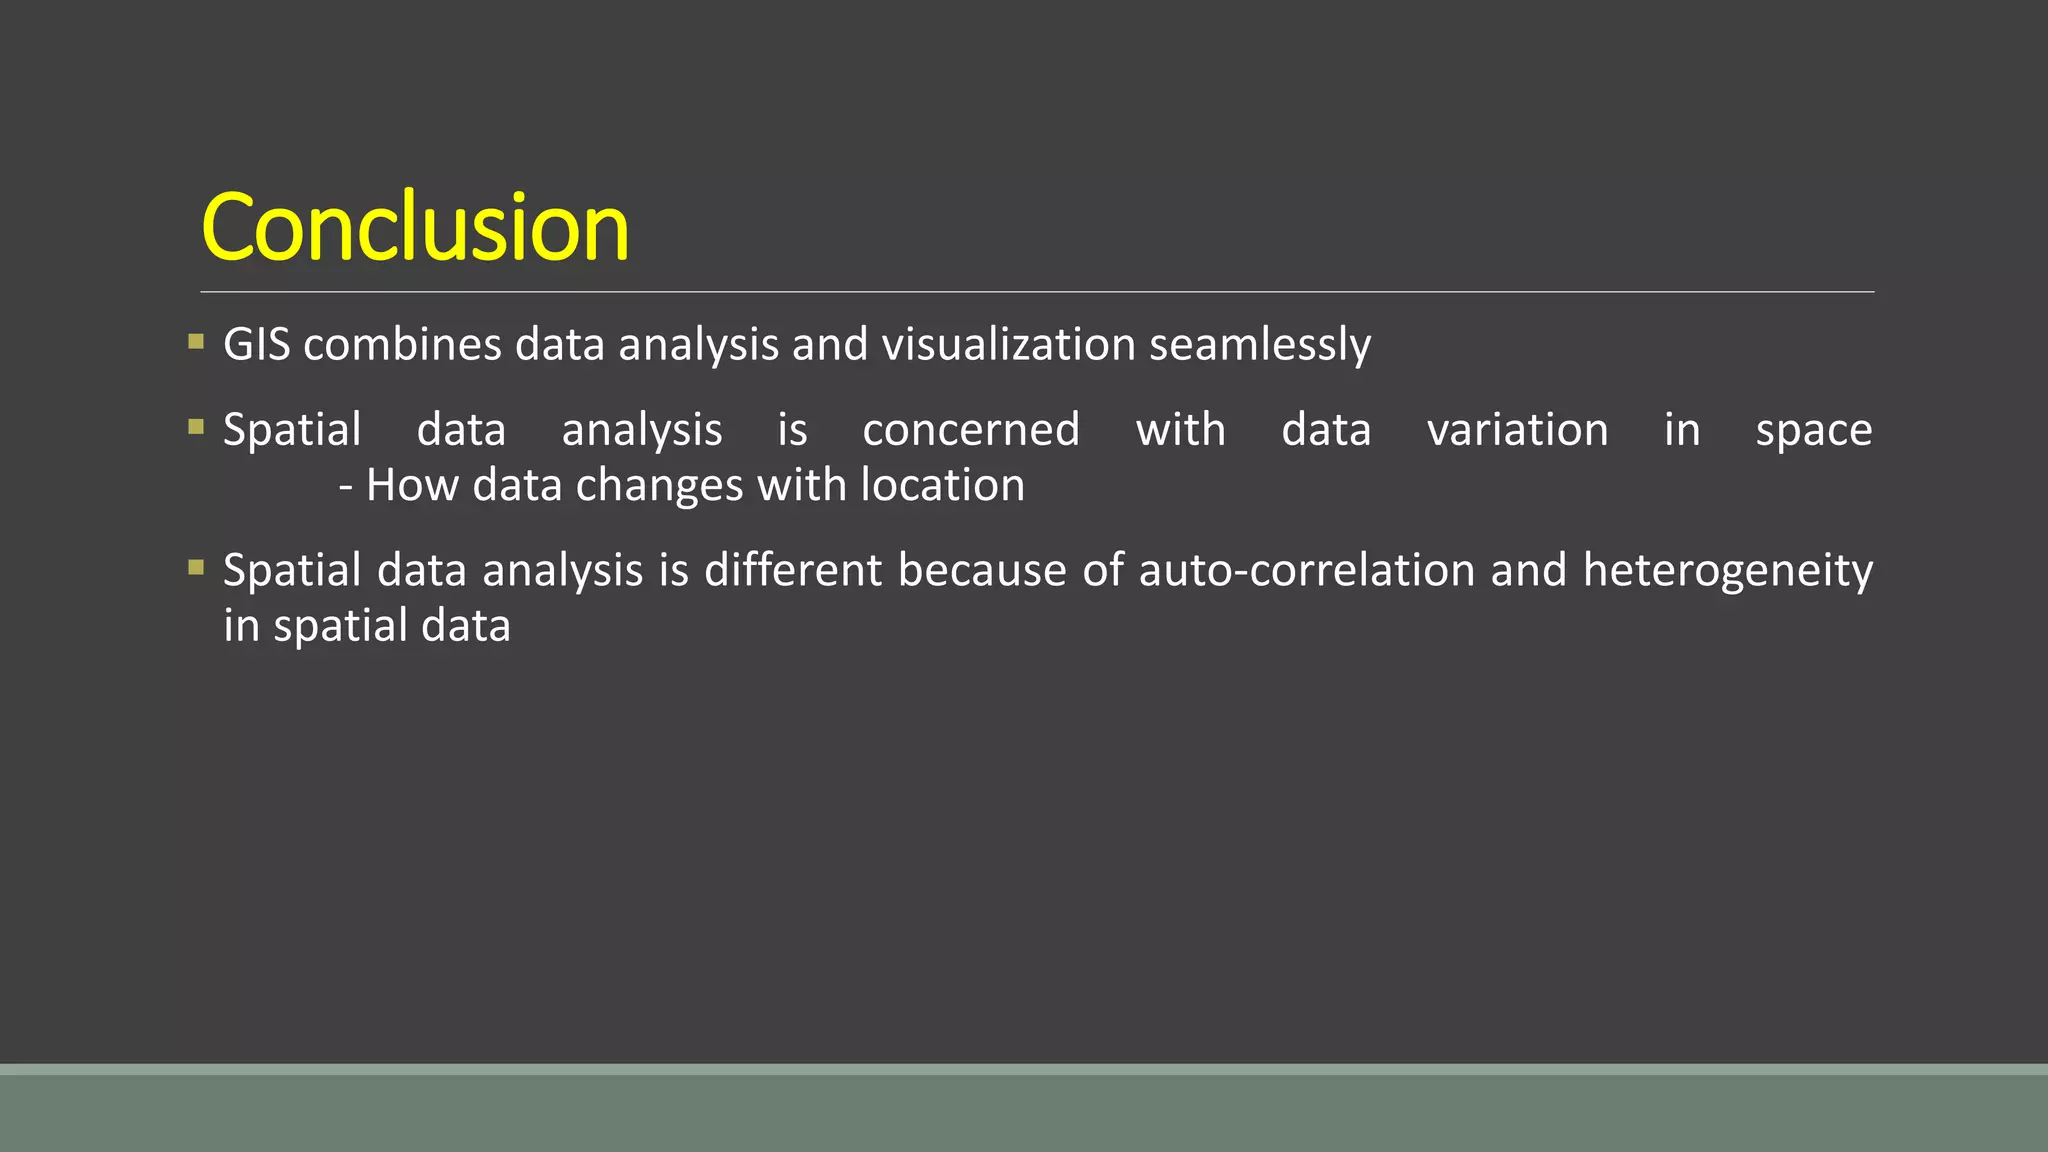
KEMBAR78
Spatial analysis & interpolation in ARC GIS | PPTX
Spatial Analysis & Spatial Interpolation
Basic Terminologies
Spatial Analysis
The study of the locations and shapes of geographic features and the relationships between them. Spatial
Analysis is useful when evaluating suitability, when making predictions and for gaining a better
understanding of how geographic features and phenomenon are located and distributed.
Spatial Data
The locations and shapes of geometric features with descriptions of each..
Spatial Function
An operation that performs spatial analysis. All spatial operations on the Spatial Analyst user interface are
classified as spatial functions for eg; slope, distance, density.
Spatial Reference
Specifies the coordinate system of the dataset.
Geographic Data
Spatial Analysis & GeoProcessing Tools
Spatial Analysis
The study of the locations and shapes of geographic
features and the relationships between them
GeoProcessing Tools
Tools that prepare, manipulate, and analyze data
spatially
Spatial Analysis & GIS
 GIS contains some of spatial analysis operators, functions and
techniques and is the main, but not the only, supporting technology
 A key benefit of GIS is the ability to apply spatial operators to GIS
data to derive new information. This ability forms the foundation
for spatial modelling and geoprocessing
Role GIS can play in Spatial Analysis
GIS is a tool with unique capabilities:
 Can handle geographically-referenced data
 Spatial/attribute data entry/update capabilities
 Data conversion functions
 Storage and organization of a variety of spatial and attribute data
 Manipulation of spatial and attribute data (encompasses many different
operations)
 Presentation/display capabilities
 Spatial analysis tools (many tools may be used in combination)
Spatial Data Formats
Spatial data formats are the product of the private sector working to
create data files that allow users to:
Create maps
Manipulate spatial data
Perform spatial analysis
Example ESRI spatial data formats (files): shapefiles, coverages,
GRIDs, geodatabases, TINs, Routes
Performing Spatial Analysis
Spatial Analyst provides you with the tools to perform spatial
analysis on your data that help you to solve your spatial problems
The Spatial Analyst functions accept layers added to ArcMap and
raster or feature datasets that you can browse to in each function
dialog box
The Spatial Analyst functions also support selection on layers, so you
can select certain values in an attribute table or on the map and use
this selection in your analysis
What is Interpolation
“A set of Spatial Analyst functions that predict values for a surface from a
limited number of sample data points, creating a continuous raster”
Assume we are dealing with a variable which has meaningful values at
every point within a region (e.g., temperature, elevation, concentration of
some mineral)
Then, given the values of that variable at a set of sample points, we can
use an interpolation method to predict values of this variable
at every point
 For any unknown point, we take some form of weighted average of the values at
surrounding points to predict the value at the point where the value is unknown
 In other words, we create a continuous surface from a set of points
As an example used throughout this presentation, imagine we have data on the concentration of
gold in western Pennsylvania at a set of 200 sample locations
Interpolation VS Extrapolation
INTERPOLATION
Interpolation is prediction within the
range of our data
E.g., having temperature values for a
bunch of locations all throughout PA,
predict the temperature values at all
other locations within PA
Note that the methods we are talking
about are strictly those
of interpolation, and not extrapolation
EXTRAPOLATION
Extrapolation is prediction
outside the range of our data
E.g., having temperature values for
a bunch of locations throughout PA,
predict the temperature values in
Kazakhstan
Methods of Interpolation
Deterministic methods
 Use mathematical functions to calculate the values at unknown locations based either on the degree of
similarity (e.g. IDW) or the degree of smoothing (e.g. RBF) in relation with neighboring data points
 Examples include:
 Inverse Distance Weighted (IDW)
 Radial Basis Functions (RBF)
Geostatistical methods
 Use both mathematical and statistical methods to predict values at all locations within region of interest
and to provide probabilistic estimates of the quality of the interpolation based on the spatial
autocorrelation among data points
 Include a deterministic component and errors (uncertainty of prediction)
 Examples include:
 Kriging
 Co-Kriging
Inverse Distance Weighted (IDW)
 An interpolation method where cell values are estimated by averaging the values of sample
data points in the vicinity of each cell. The closer a point is to the center of the cell being
estimated, the more influence, or weight, it has in averaging process
 IDW interpolation explicitly relies on the First Law of Geography. To predict a value for any
unmeasured location, IDW will use the measured values surrounding the prediction location.
Measured values that are nearest to the prediction location will have greater influence
(i.e.,weight) on the predicted value at that unknown point than those that are farther away
 Weights of each measured point are proportional to the inverse distance raised to the power
value q. As a result, as the distance increases, the weights decrease rapidly. How fast the
weights decrease is dependent on the value for q
 Because things that are close to one another are more alike than those farther away, as the
locations get farther away, the measured values will have little relationship with the value of
the prediction location
 The output surface is sensitive to clustering and the presence of outliers
First Law of Geography
"Everything is related to everything else, but near things are more
related than distant things."
- Waldo Tobler (1970)
Search Neighborhood Specification
Points with known values of elevation that are outside the circle are just too far from the target
point at which the elevation value is unknown, so their weights are pretty much 0
Examples of IDW with Different q's
Krigging
A surface interpolation method available in spatial Analyst. It is a geostatistical interpolation
method based on statistical models that include autocorrelation-the statistical relationship
among the measured points. Krigging weights the surrounding measured values to derive a
prediction for an unmeasured location. Weights are based on the distance between the
measured points, the predicted location and the overall arrangement among the measured
points
IDW VS Kriging
 We get a more "natural" look to the data with Kriging
 You see the "bulls eye" effect in IDW but not (as much) in Kriging
 Helps to compensate for the effects of data clustering, assigning individual points within a
cluster less weight than isolated data points (or, treating clusters more like single points)
 Kriging also give us a standard error
 If the data locations are quite dense and uniformly distributed throughout the area of interest,
we will get decent estimates regardless of which interpolation method we choose
 On the other hand, if the data locations fall in a few clusters and there are gaps in between
these clusters, we will obtain pretty unreliable estimates regardless of whether we use IDW or
Kriging
Methods of Krigging
1.Ordinary
- Most general and widely used
- Assumes the constant mean is unknown
2.Universal
- Assumes there is an overriding trend in the data eg: prevailing
wind
- Used when there is a trend in the data and scientific
justification is to be given for its description
Conclusion
 GIS combines data analysis and visualization seamlessly
 Spatial data analysis is concerned with data variation in space
- How data changes with location
 Spatial data analysis is different because of auto-correlation and heterogeneity
in spatial data

Spatial analysis & interpolation in ARC GIS

  • 1.
    Spatial Analysis &Spatial Interpolation
  • 2.
    Basic Terminologies Spatial Analysis Thestudy of the locations and shapes of geographic features and the relationships between them. Spatial Analysis is useful when evaluating suitability, when making predictions and for gaining a better understanding of how geographic features and phenomenon are located and distributed. Spatial Data The locations and shapes of geometric features with descriptions of each.. Spatial Function An operation that performs spatial analysis. All spatial operations on the Spatial Analyst user interface are classified as spatial functions for eg; slope, distance, density. Spatial Reference Specifies the coordinate system of the dataset.
  • 3.
  • 4.
    Spatial Analysis &GeoProcessing Tools Spatial Analysis The study of the locations and shapes of geographic features and the relationships between them GeoProcessing Tools Tools that prepare, manipulate, and analyze data spatially
  • 5.
    Spatial Analysis &GIS  GIS contains some of spatial analysis operators, functions and techniques and is the main, but not the only, supporting technology  A key benefit of GIS is the ability to apply spatial operators to GIS data to derive new information. This ability forms the foundation for spatial modelling and geoprocessing
  • 6.
    Role GIS canplay in Spatial Analysis GIS is a tool with unique capabilities:  Can handle geographically-referenced data  Spatial/attribute data entry/update capabilities  Data conversion functions  Storage and organization of a variety of spatial and attribute data  Manipulation of spatial and attribute data (encompasses many different operations)  Presentation/display capabilities  Spatial analysis tools (many tools may be used in combination)
  • 7.
    Spatial Data Formats Spatialdata formats are the product of the private sector working to create data files that allow users to: Create maps Manipulate spatial data Perform spatial analysis Example ESRI spatial data formats (files): shapefiles, coverages, GRIDs, geodatabases, TINs, Routes
  • 8.
    Performing Spatial Analysis SpatialAnalyst provides you with the tools to perform spatial analysis on your data that help you to solve your spatial problems The Spatial Analyst functions accept layers added to ArcMap and raster or feature datasets that you can browse to in each function dialog box The Spatial Analyst functions also support selection on layers, so you can select certain values in an attribute table or on the map and use this selection in your analysis
  • 9.
    What is Interpolation “Aset of Spatial Analyst functions that predict values for a surface from a limited number of sample data points, creating a continuous raster” Assume we are dealing with a variable which has meaningful values at every point within a region (e.g., temperature, elevation, concentration of some mineral) Then, given the values of that variable at a set of sample points, we can use an interpolation method to predict values of this variable at every point  For any unknown point, we take some form of weighted average of the values at surrounding points to predict the value at the point where the value is unknown  In other words, we create a continuous surface from a set of points
  • 10.
    As an exampleused throughout this presentation, imagine we have data on the concentration of gold in western Pennsylvania at a set of 200 sample locations
  • 11.
    Interpolation VS Extrapolation INTERPOLATION Interpolationis prediction within the range of our data E.g., having temperature values for a bunch of locations all throughout PA, predict the temperature values at all other locations within PA Note that the methods we are talking about are strictly those of interpolation, and not extrapolation EXTRAPOLATION Extrapolation is prediction outside the range of our data E.g., having temperature values for a bunch of locations throughout PA, predict the temperature values in Kazakhstan
  • 12.
    Methods of Interpolation Deterministicmethods  Use mathematical functions to calculate the values at unknown locations based either on the degree of similarity (e.g. IDW) or the degree of smoothing (e.g. RBF) in relation with neighboring data points  Examples include:  Inverse Distance Weighted (IDW)  Radial Basis Functions (RBF) Geostatistical methods  Use both mathematical and statistical methods to predict values at all locations within region of interest and to provide probabilistic estimates of the quality of the interpolation based on the spatial autocorrelation among data points  Include a deterministic component and errors (uncertainty of prediction)  Examples include:  Kriging  Co-Kriging
  • 13.
    Inverse Distance Weighted(IDW)  An interpolation method where cell values are estimated by averaging the values of sample data points in the vicinity of each cell. The closer a point is to the center of the cell being estimated, the more influence, or weight, it has in averaging process  IDW interpolation explicitly relies on the First Law of Geography. To predict a value for any unmeasured location, IDW will use the measured values surrounding the prediction location. Measured values that are nearest to the prediction location will have greater influence (i.e.,weight) on the predicted value at that unknown point than those that are farther away  Weights of each measured point are proportional to the inverse distance raised to the power value q. As a result, as the distance increases, the weights decrease rapidly. How fast the weights decrease is dependent on the value for q  Because things that are close to one another are more alike than those farther away, as the locations get farther away, the measured values will have little relationship with the value of the prediction location  The output surface is sensitive to clustering and the presence of outliers
  • 14.
    First Law ofGeography "Everything is related to everything else, but near things are more related than distant things." - Waldo Tobler (1970)
  • 15.
    Search Neighborhood Specification Pointswith known values of elevation that are outside the circle are just too far from the target point at which the elevation value is unknown, so their weights are pretty much 0
  • 16.
    Examples of IDWwith Different q's
  • 17.
    Krigging A surface interpolationmethod available in spatial Analyst. It is a geostatistical interpolation method based on statistical models that include autocorrelation-the statistical relationship among the measured points. Krigging weights the surrounding measured values to derive a prediction for an unmeasured location. Weights are based on the distance between the measured points, the predicted location and the overall arrangement among the measured points
  • 19.
    IDW VS Kriging We get a more "natural" look to the data with Kriging  You see the "bulls eye" effect in IDW but not (as much) in Kriging  Helps to compensate for the effects of data clustering, assigning individual points within a cluster less weight than isolated data points (or, treating clusters more like single points)  Kriging also give us a standard error  If the data locations are quite dense and uniformly distributed throughout the area of interest, we will get decent estimates regardless of which interpolation method we choose  On the other hand, if the data locations fall in a few clusters and there are gaps in between these clusters, we will obtain pretty unreliable estimates regardless of whether we use IDW or Kriging
  • 21.
    Methods of Krigging 1.Ordinary -Most general and widely used - Assumes the constant mean is unknown 2.Universal - Assumes there is an overriding trend in the data eg: prevailing wind - Used when there is a trend in the data and scientific justification is to be given for its description
  • 22.
    Conclusion  GIS combinesdata analysis and visualization seamlessly  Spatial data analysis is concerned with data variation in space - How data changes with location  Spatial data analysis is different because of auto-correlation and heterogeneity in spatial data