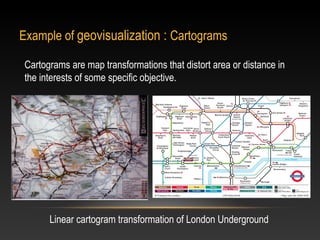
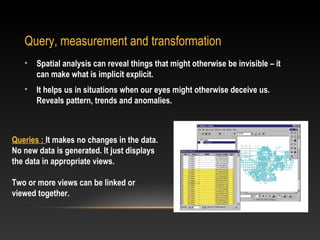
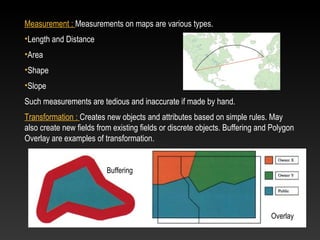
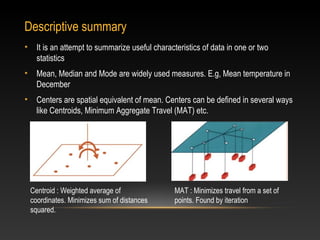
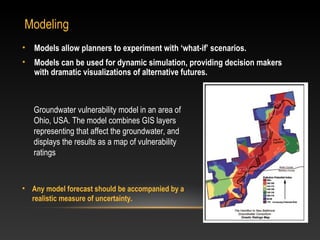
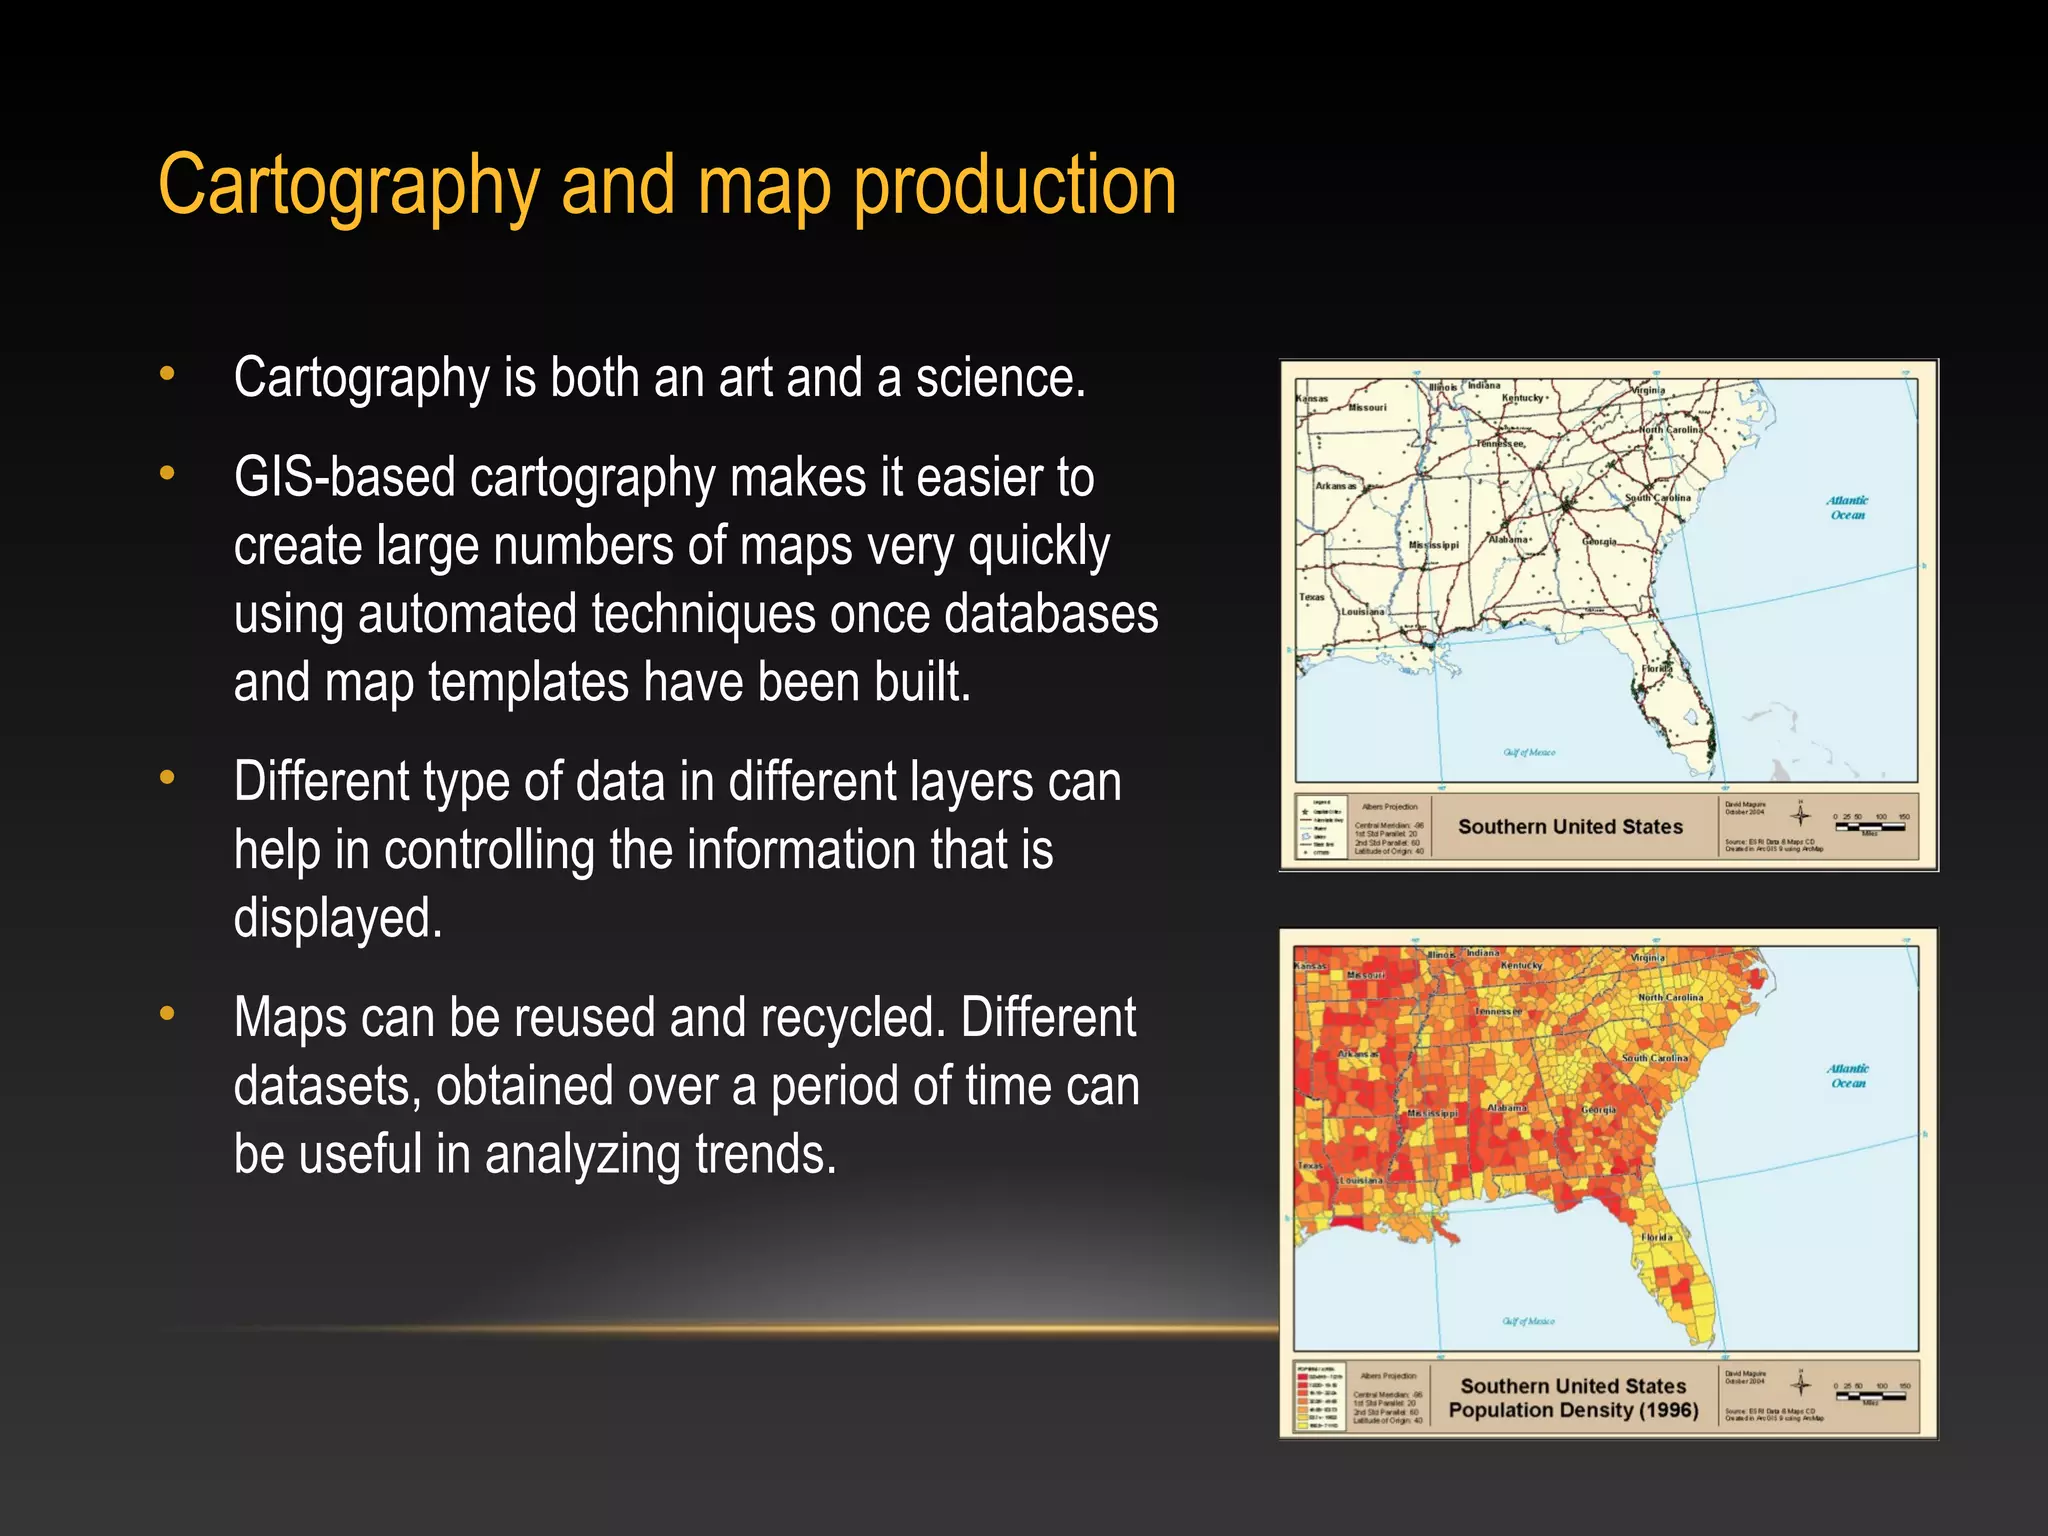
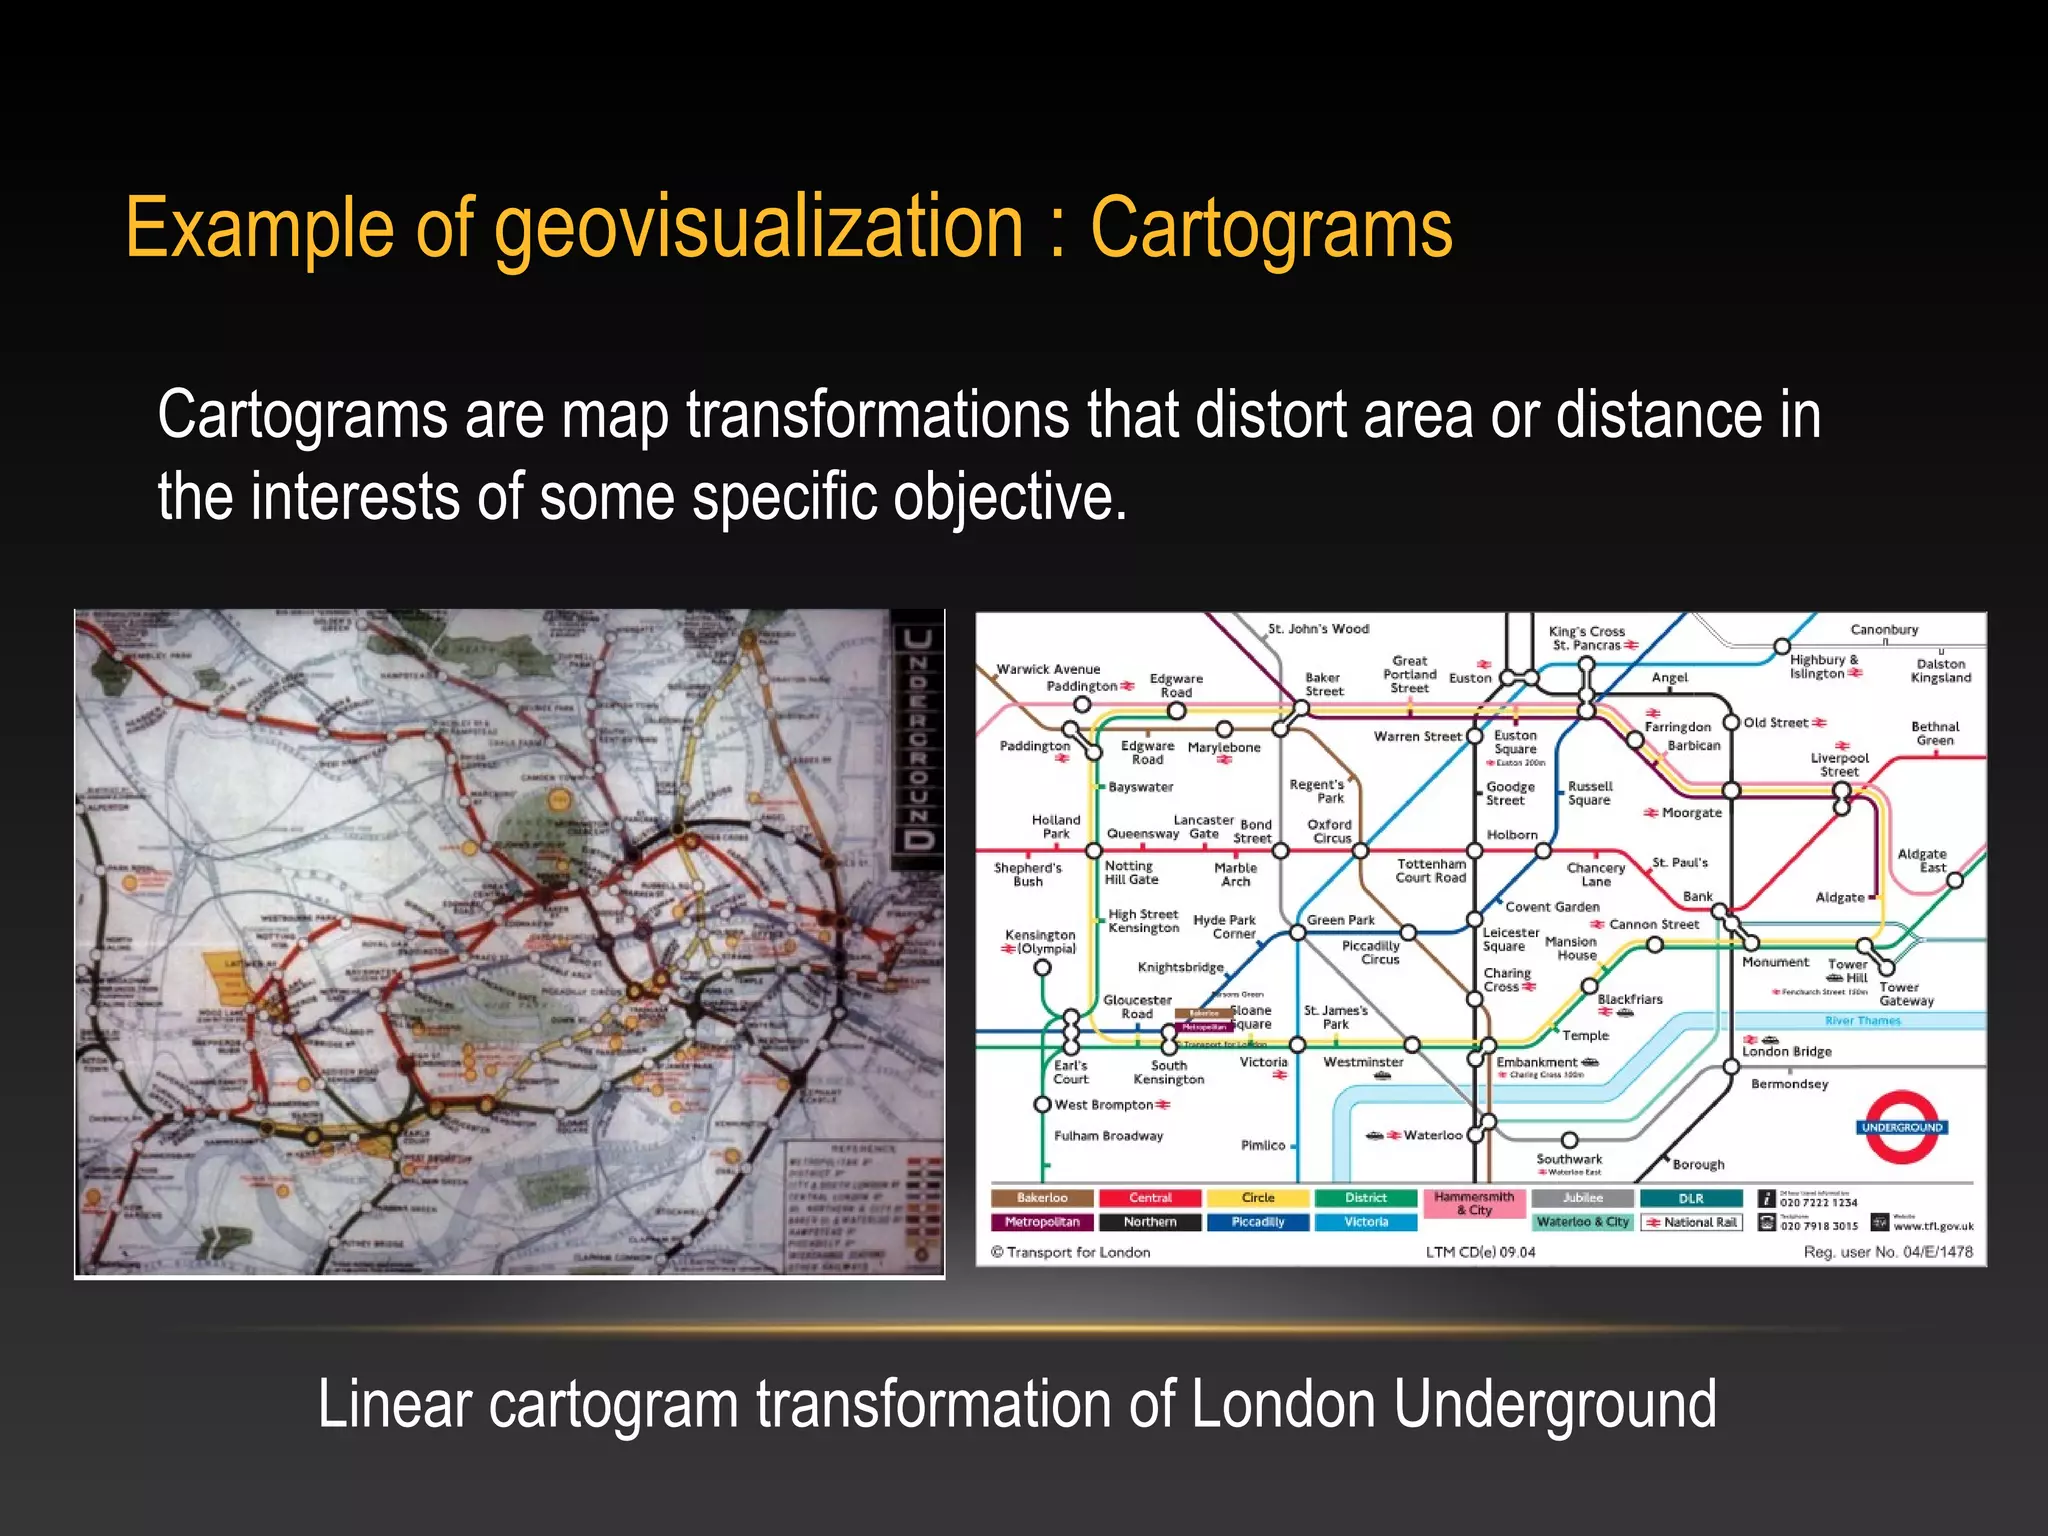
KEMBAR78
Spatial Analysis Using GIS | PPS
Spatial analysis in gis

                 Prachi Sukumar Mehta
                              MG 0712
                Date: 7th February, 2013
                       CEPT University
WHY analyze using gIS?
1. Visual representation of data – Human mind can comprehend
   better
2. Vector data – precise, mathematical operations can be performed
3. Database – Spatial data with non-spatial attributes
4. Updatable – Easily can be modified, scaled
5. In-built functionalities
What kind of analysis can be made using gis?
• Map production
• Geovisulization
• Query, Measurement, Transformation
• Descriptive Summary
• Modeling
Cartography and map production

• Cartography is both an art and a science.
• GIS-based cartography makes it easier to
  create large numbers of maps very quickly
  using automated techniques once databases
  and map templates have been built.
• Different type of data in different layers can
  help in controlling the information that is
  displayed.
• Maps can be reused and recycled. Different
  datasets, obtained over a period of time can
  be useful in analyzing trends.
geovisualization

There are four principal purposes of geovisualization:
1.Exploration: for example, to determine the general message of a
dataset is affected by inclusion or exclusion of particular data
elements.
2.Synthesis: To view to data in desired form.
3.Presentation: Enable the user to understand the representation.
4.Analysis: Support a range of methods and techniques of spatial
analysis.
Example of geovisualization : Cartograms

 Cartograms are map transformations that distort area or distance in
 the interests of some specific objective.


       Linear cartogram transformation of London Underground
Query, measurement and transformation
   •   Spatial analysis can reveal things that might otherwise be invisible – it
       can make what is implicit explicit.
   •   It helps us in situations when our eyes might otherwise deceive us.
       Reveals pattern, trends and anomalies.


Queries : It makes no changes in the data.
No new data is generated. It just displays
the data in appropriate views.

Two or more views can be linked or
viewed together.
Measurement : Measurements on maps are various types.
•Length and Distance
•Area
•Shape
•Slope
Such measurements are tedious and inaccurate if made by hand.
Transformation : Creates new objects and attributes based on simple rules. May
also create new fields from existing fields or discrete objects. Buffering and Polygon
Overlay are examples of transformation.


                          Buffering


                                                                              Overlay
Descriptive summary
•     It is an attempt to summarize useful characteristics of data in one or two
      statistics
•     Mean, Median and Mode are widely used measures. E.g, Mean temperature in
      December
•     Centers are spatial equivalent of mean. Centers can be defined in several ways
      like Centroids, Minimum Aggregate Travel (MAT) etc.


    Centroid : Weighted average of                MAT : Minimizes travel from a set of
    coordinates. Minimizes sum of distances       points. Found by iteration
    squared.
Modeling
•   Models allow planners to experiment with ‘what-if’ scenarios.
•   Models can be used for dynamic simulation, providing decision makers
    with dramatic visualizations of alternative futures.


    Groundwater vulnerability model in an area of
    Ohio, USA. The model combines GIS layers
    representing that affect the groundwater, and
    displays the results as a map of vulnerability
    ratings


• Any model forecast should be accompanied by a
  realistic measure of uncertainty.
Reference

• Geographic Information Systems and Science (2E) by Paul
  A. Longley, Michael F. Goodchild, David J. Maguire, David
  W. Rhind
Thank You

Spatial Analysis Using GIS

  • 1.
    Spatial analysis ingis Prachi Sukumar Mehta MG 0712 Date: 7th February, 2013 CEPT University
  • 2.
    WHY analyze usinggIS? 1. Visual representation of data – Human mind can comprehend better 2. Vector data – precise, mathematical operations can be performed 3. Database – Spatial data with non-spatial attributes 4. Updatable – Easily can be modified, scaled 5. In-built functionalities
  • 3.
    What kind ofanalysis can be made using gis? • Map production • Geovisulization • Query, Measurement, Transformation • Descriptive Summary • Modeling
  • 4.
    Cartography and mapproduction • Cartography is both an art and a science. • GIS-based cartography makes it easier to create large numbers of maps very quickly using automated techniques once databases and map templates have been built. • Different type of data in different layers can help in controlling the information that is displayed. • Maps can be reused and recycled. Different datasets, obtained over a period of time can be useful in analyzing trends.
  • 5.
    geovisualization There are fourprincipal purposes of geovisualization: 1.Exploration: for example, to determine the general message of a dataset is affected by inclusion or exclusion of particular data elements. 2.Synthesis: To view to data in desired form. 3.Presentation: Enable the user to understand the representation. 4.Analysis: Support a range of methods and techniques of spatial analysis.
  • 6.
    Example of geovisualization: Cartograms Cartograms are map transformations that distort area or distance in the interests of some specific objective. Linear cartogram transformation of London Underground
  • 7.
    Query, measurement andtransformation • Spatial analysis can reveal things that might otherwise be invisible – it can make what is implicit explicit. • It helps us in situations when our eyes might otherwise deceive us. Reveals pattern, trends and anomalies. Queries : It makes no changes in the data. No new data is generated. It just displays the data in appropriate views. Two or more views can be linked or viewed together.
  • 8.
    Measurement : Measurementson maps are various types. •Length and Distance •Area •Shape •Slope Such measurements are tedious and inaccurate if made by hand. Transformation : Creates new objects and attributes based on simple rules. May also create new fields from existing fields or discrete objects. Buffering and Polygon Overlay are examples of transformation. Buffering Overlay
  • 9.
    Descriptive summary • It is an attempt to summarize useful characteristics of data in one or two statistics • Mean, Median and Mode are widely used measures. E.g, Mean temperature in December • Centers are spatial equivalent of mean. Centers can be defined in several ways like Centroids, Minimum Aggregate Travel (MAT) etc. Centroid : Weighted average of MAT : Minimizes travel from a set of coordinates. Minimizes sum of distances points. Found by iteration squared.
  • 10.
    Modeling • Models allow planners to experiment with ‘what-if’ scenarios. • Models can be used for dynamic simulation, providing decision makers with dramatic visualizations of alternative futures. Groundwater vulnerability model in an area of Ohio, USA. The model combines GIS layers representing that affect the groundwater, and displays the results as a map of vulnerability ratings • Any model forecast should be accompanied by a realistic measure of uncertainty.
  • 11.
    Reference • Geographic InformationSystems and Science (2E) by Paul A. Longley, Michael F. Goodchild, David J. Maguire, David W. Rhind
  • 12.