Downloaded 5,524 times


![Create curriculumSelect courses to teachCreate Activity Diagram for registration systemRegistrarProfessorcatalogMail catalog Place catalog to studentsin bookstoreOpen registration[ Registration time period expired ]SwimlanesClose registration48](https://image.slidesharecdn.com/sadvsooad-100513043350-phpapp01/85/Structured-Vs-Object-Oriented-Analysis-and-Design-48-320.jpg)
![54public class BlogAccount { // Attribute introduced thanks to the association with the BlogEntry classprivate BlogEntry[] entries; // ... Other Attributes and Methods declared here ...}public class BlogEntry{ // The blog attribute has been removed as it is not necessary for the // BlogEntry to know about the BlogAccount that it belongs to. // ... Other Attributes and Methods declared here ...}](https://image.slidesharecdn.com/sadvsooad-100513043350-phpapp01/85/Structured-Vs-Object-Oriented-Analysis-and-Design-54-320.jpg)
![61public class MessageReceiver{public void foo( ) { // Do something inside foo. }}public class MessageCaller{ private MessageReceivermessageReceiver; // Other Methods and Attributes of the class are declared here // The messageRecevier attribute is initialized elsewhere in // the class. public doSomething(String[] args) { // The MessageCaller invokes the foo( ) methodthis.messageReceiver.foo( ); // then waits for the method to return // before carrying on here with the rest of its work }}](https://image.slidesharecdn.com/sadvsooad-100513043350-phpapp01/85/Structured-Vs-Object-Oriented-Analysis-and-Design-61-320.jpg)


![Create curriculumSelect courses to teachCreate Activity Diagram for registration systemRegistrarProfessorcatalogMail catalog Place catalog to studentsin bookstoreOpen registration[ Registration time period expired ]SwimlanesClose registration48](https://image.slidesharecdn.com/sadvsooad-100513043350-phpapp01/75/Structured-Vs-Object-Oriented-Analysis-and-Design-48-2048.jpg)
![54public class BlogAccount { // Attribute introduced thanks to the association with the BlogEntry classprivate BlogEntry[] entries; // ... Other Attributes and Methods declared here ...}public class BlogEntry{ // The blog attribute has been removed as it is not necessary for the // BlogEntry to know about the BlogAccount that it belongs to. // ... Other Attributes and Methods declared here ...}](https://image.slidesharecdn.com/sadvsooad-100513043350-phpapp01/75/Structured-Vs-Object-Oriented-Analysis-and-Design-54-2048.jpg)
![61public class MessageReceiver{public void foo( ) { // Do something inside foo. }}public class MessageCaller{ private MessageReceivermessageReceiver; // Other Methods and Attributes of the class are declared here // The messageRecevier attribute is initialized elsewhere in // the class. public doSomething(String[] args) { // The MessageCaller invokes the foo( ) methodthis.messageReceiver.foo( ); // then waits for the method to return // before carrying on here with the rest of its work }}](https://image.slidesharecdn.com/sadvsooad-100513043350-phpapp01/75/Structured-Vs-Object-Oriented-Analysis-and-Design-61-2048.jpg)


This document discusses structured vs object-oriented analysis and design (SAD vs OOAD) for software development. It outlines the phases and modeling techniques used in SAD like data flow diagrams, decision tables, and entity relationship diagrams. It also outlines the phases and modeling techniques used in OOAD like use cases, class diagrams, sequence diagrams, and state machine diagrams. The document compares key differences between SAD and OOAD, discusses textbooks on software engineering and UML, and references papers on using UML in practice and evaluating the impact and costs/benefits of UML in software maintenance.
Outlines the theme of structured (SAD) vs object-oriented (OOAD) analysis and design phases.
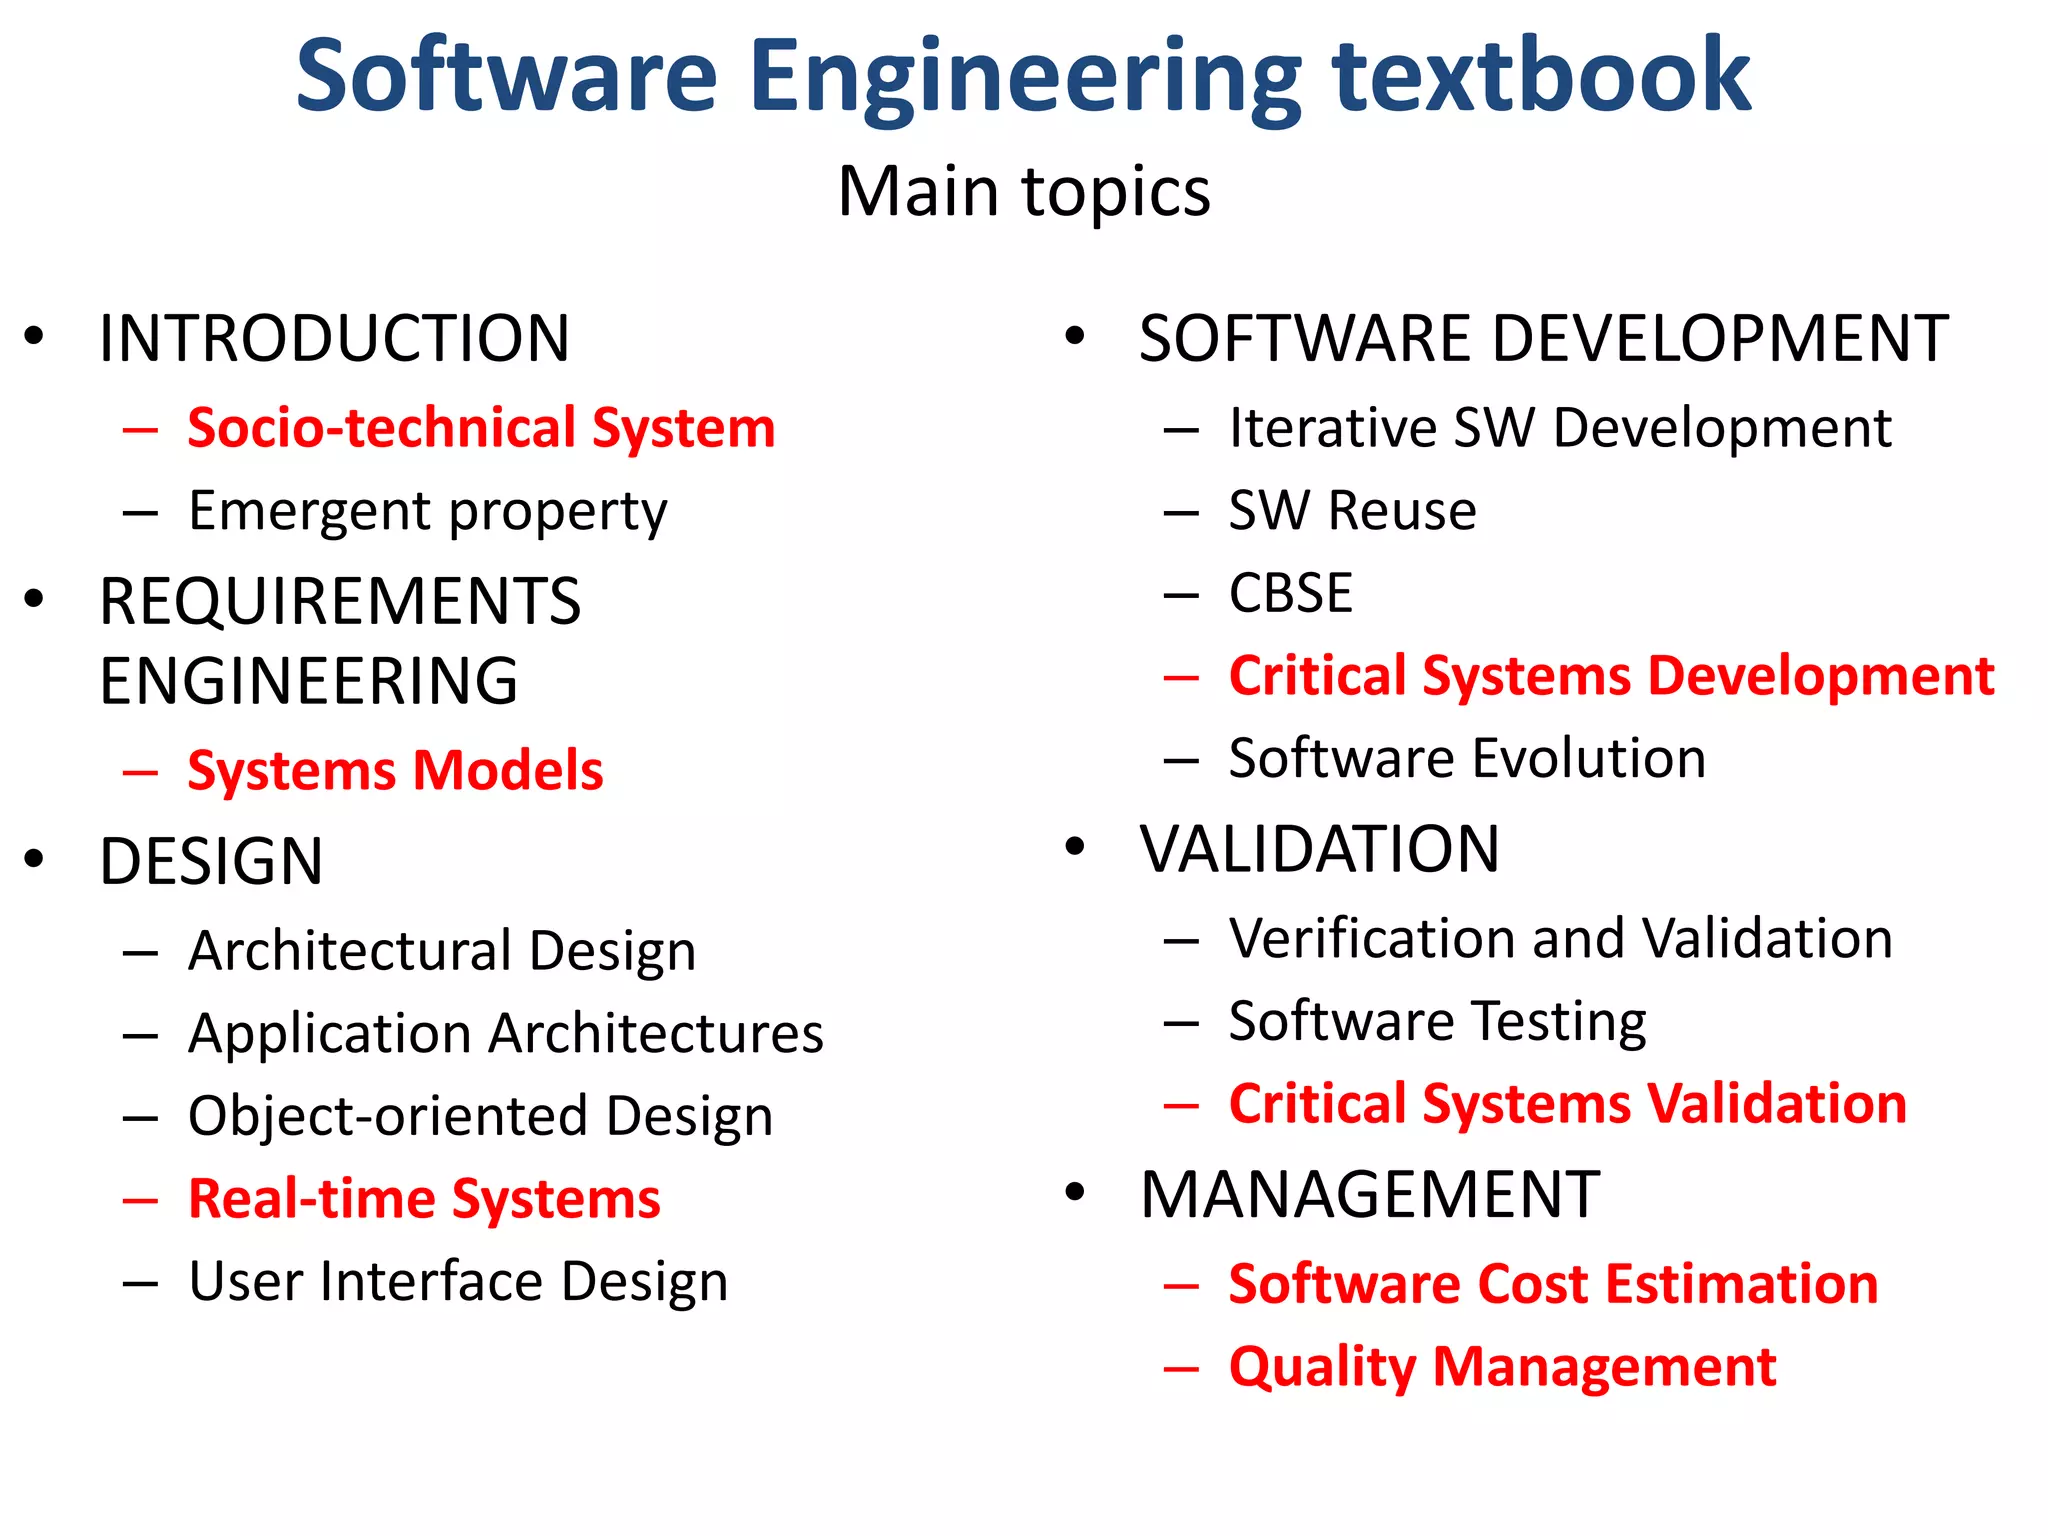
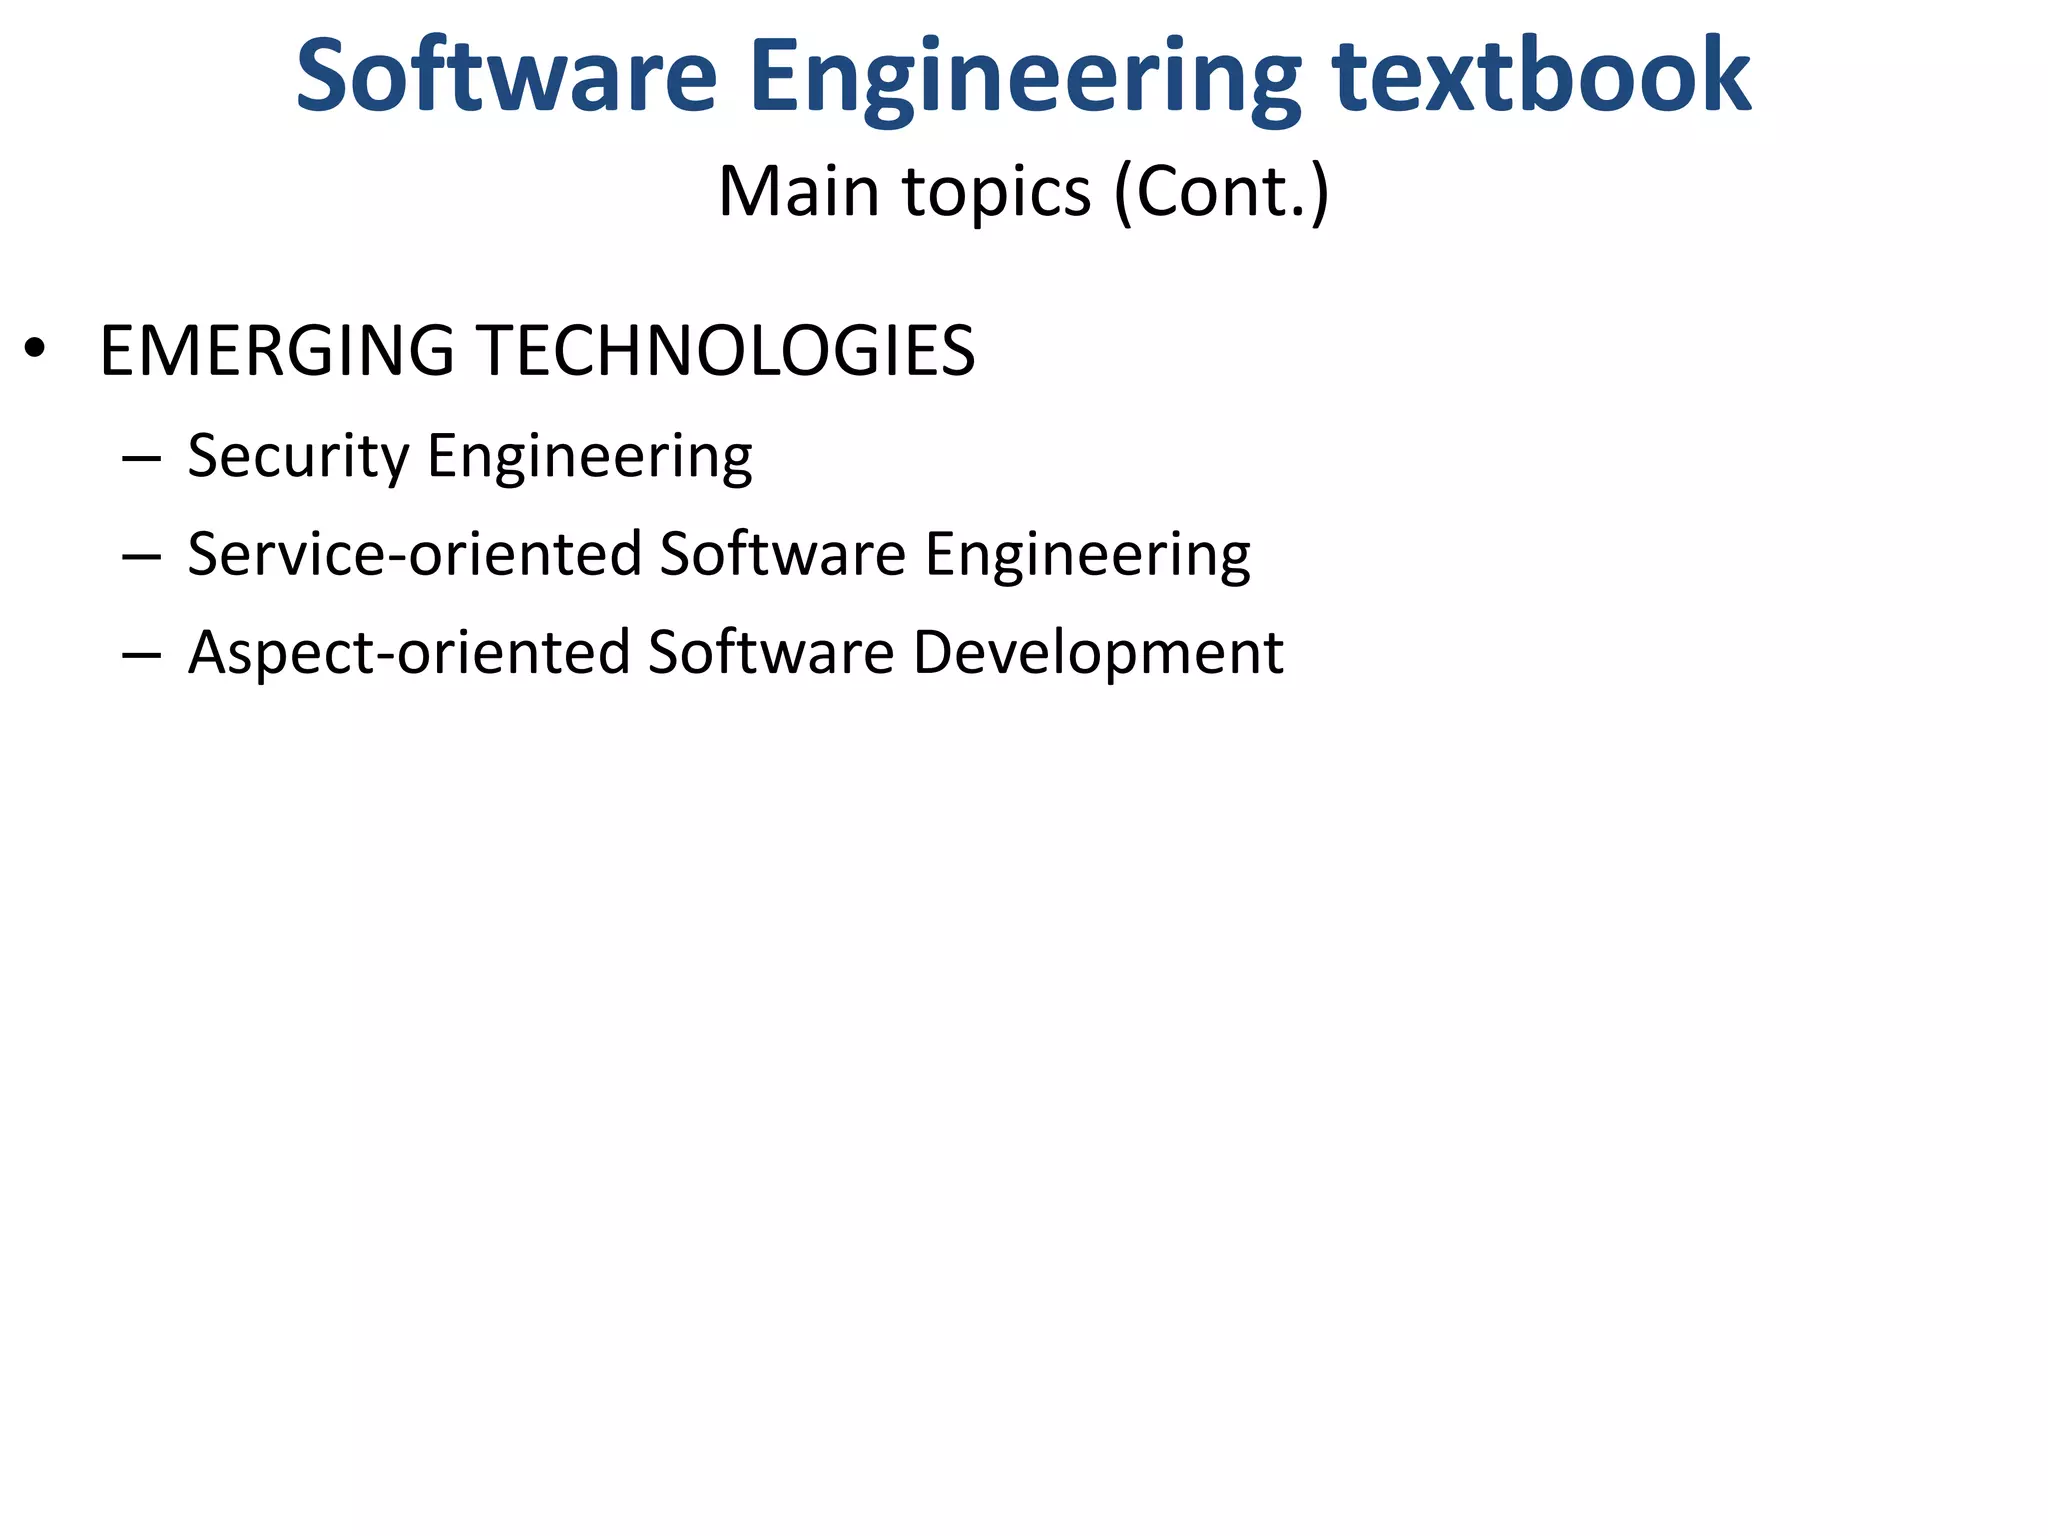
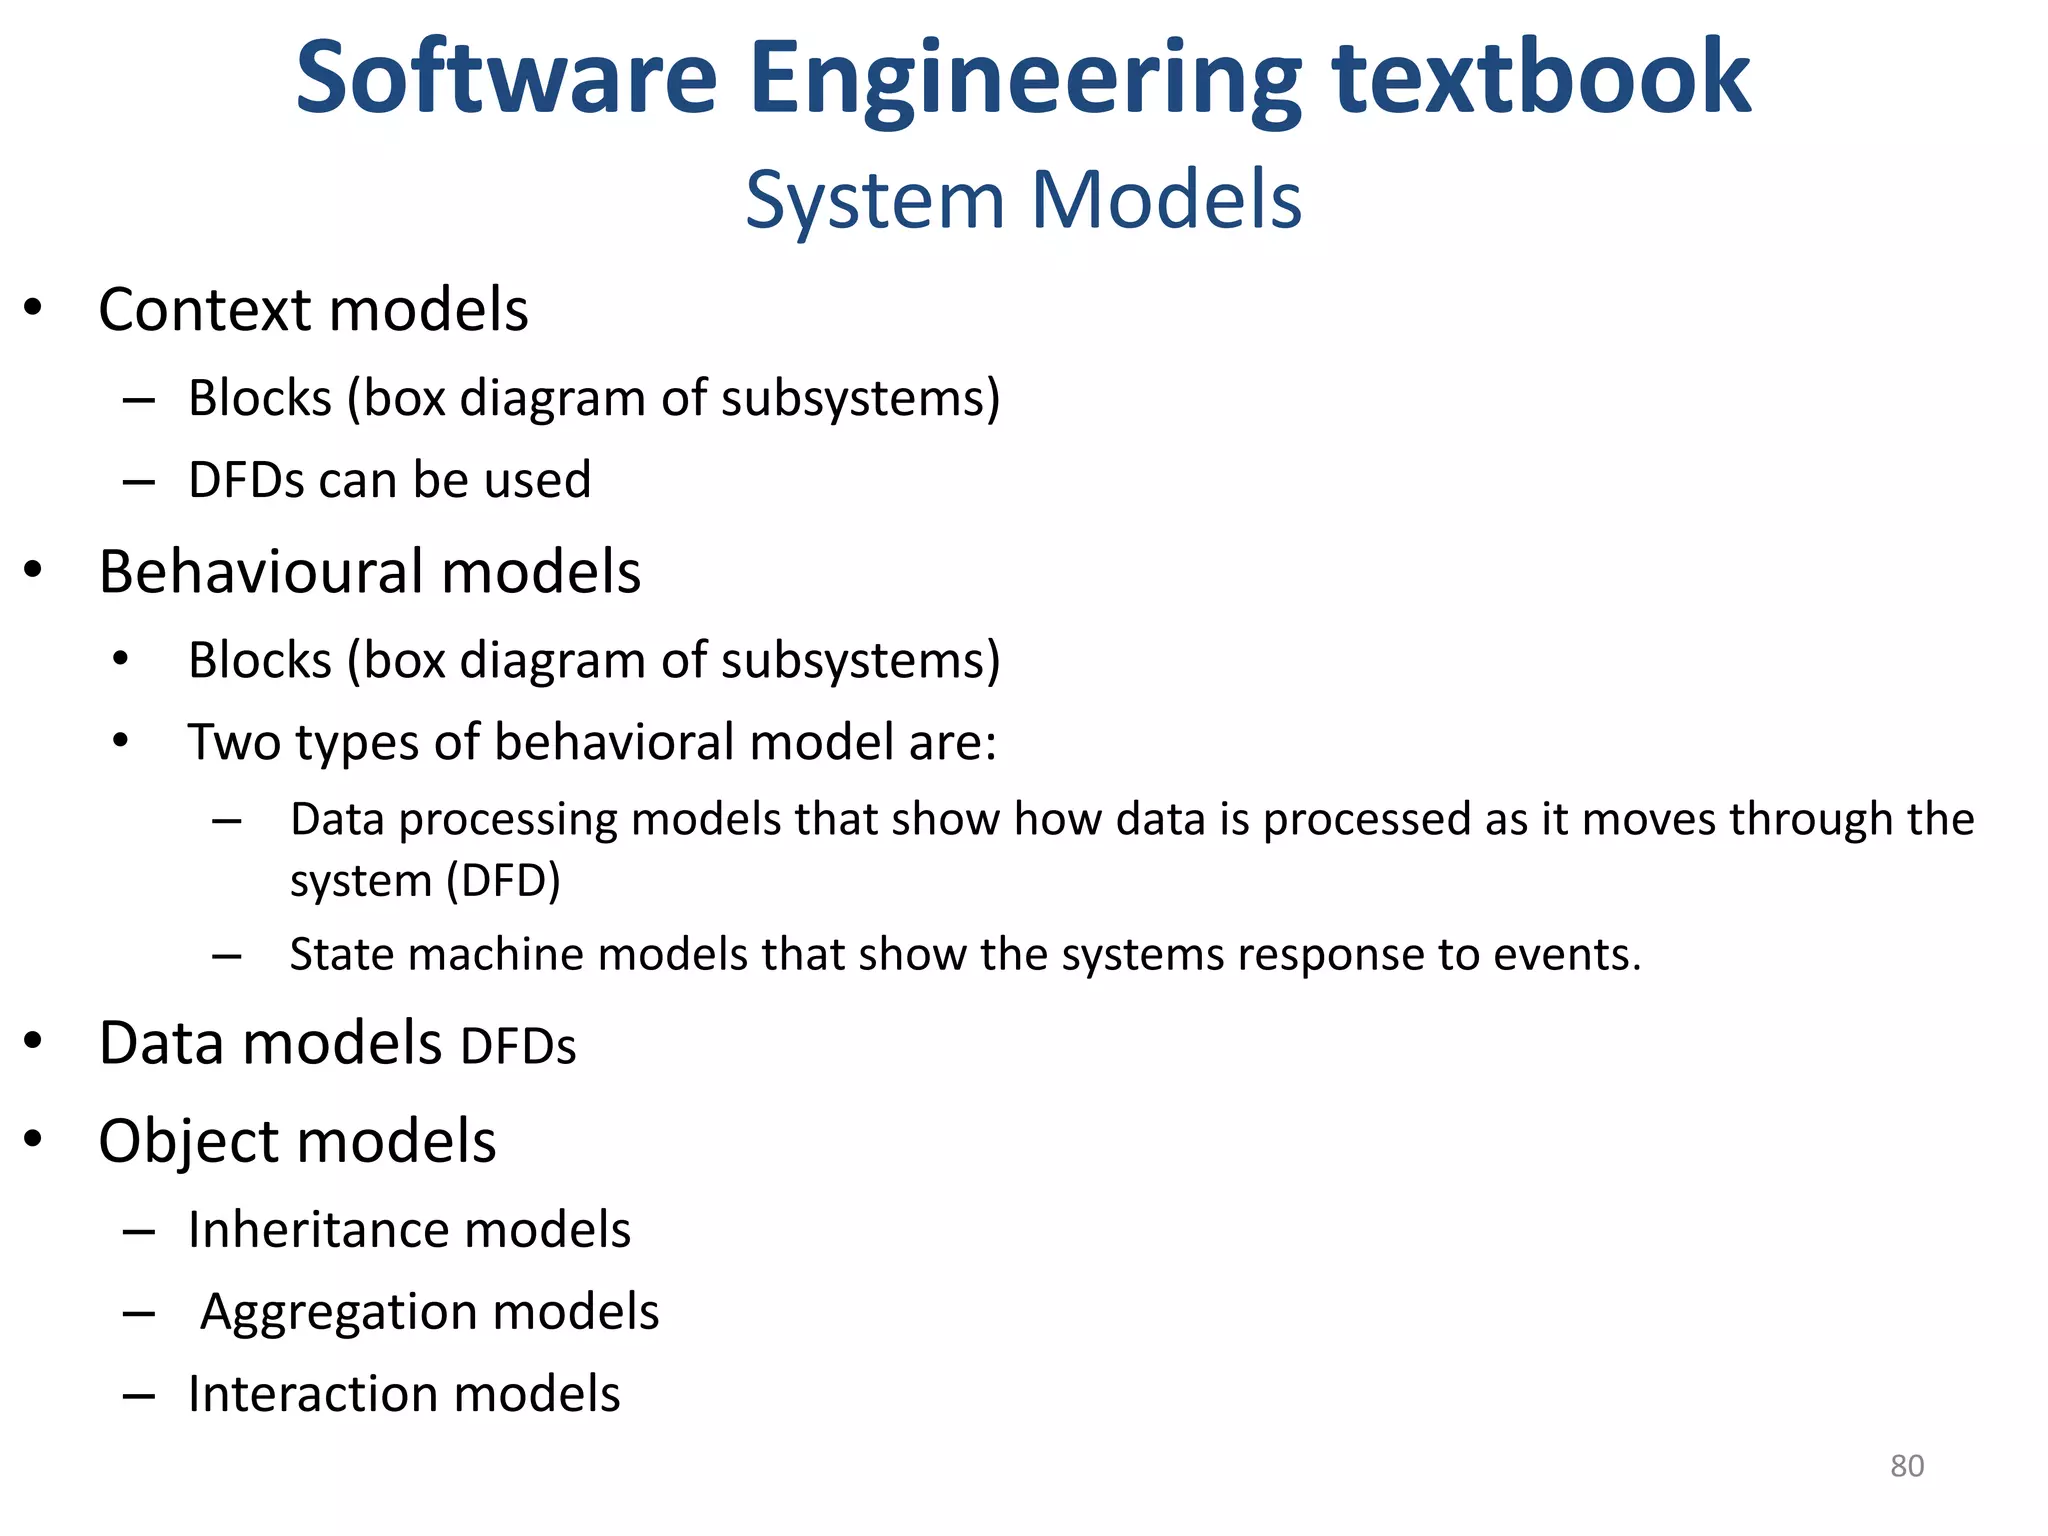
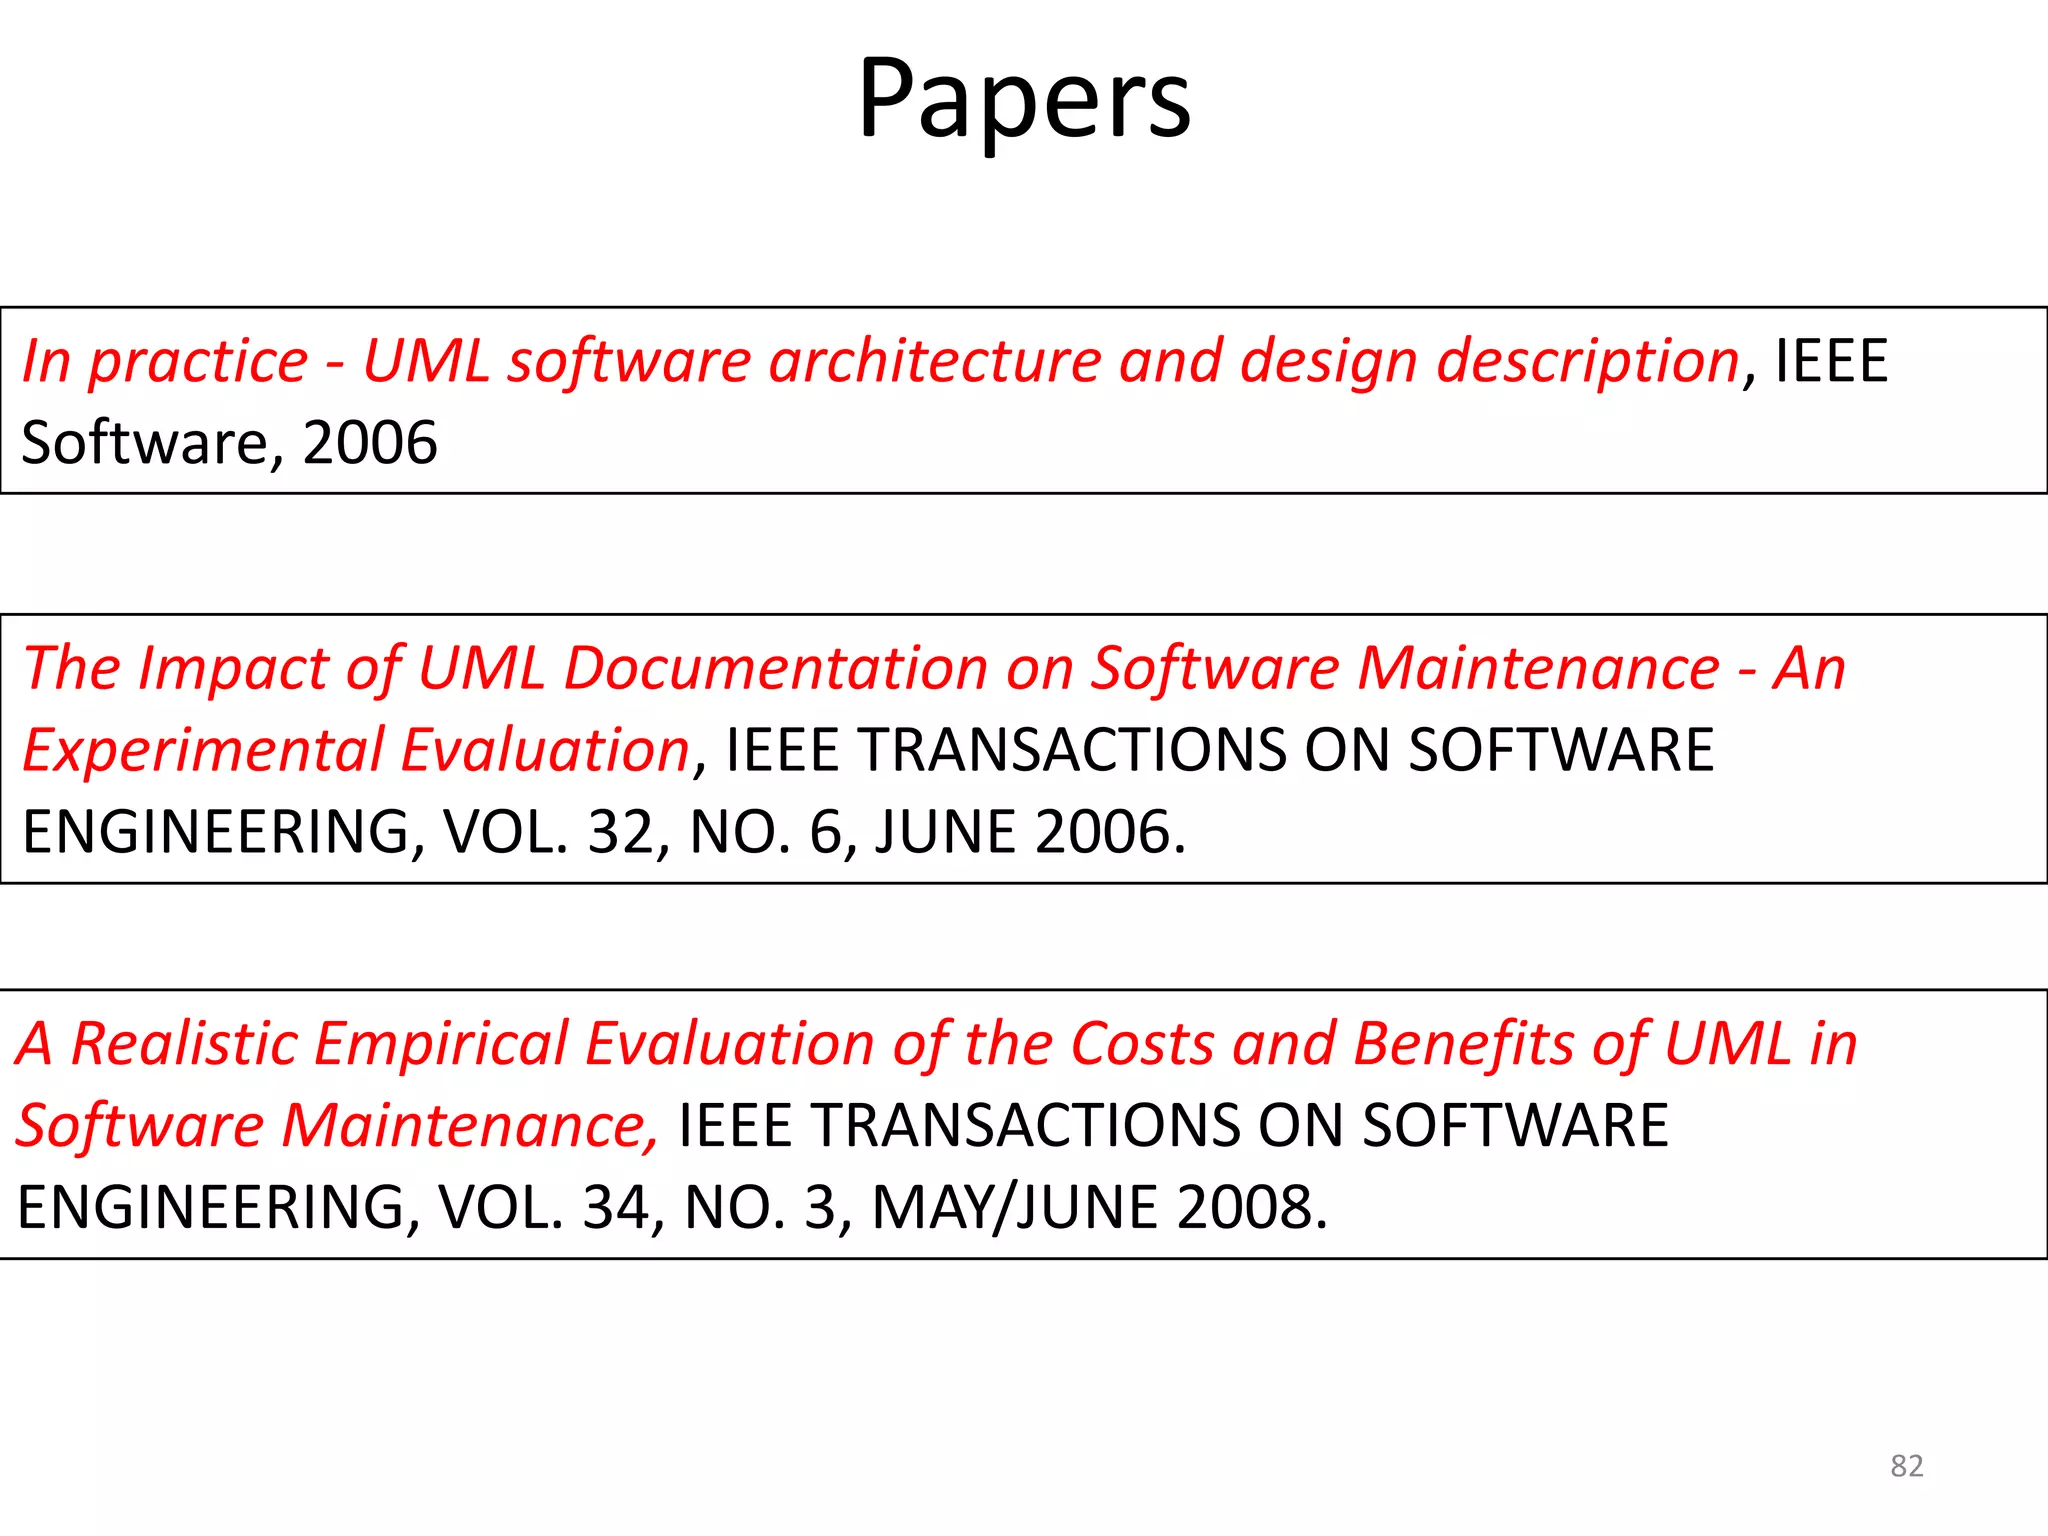
Lists textbooks and important papers that shape the study of software analysis and design.
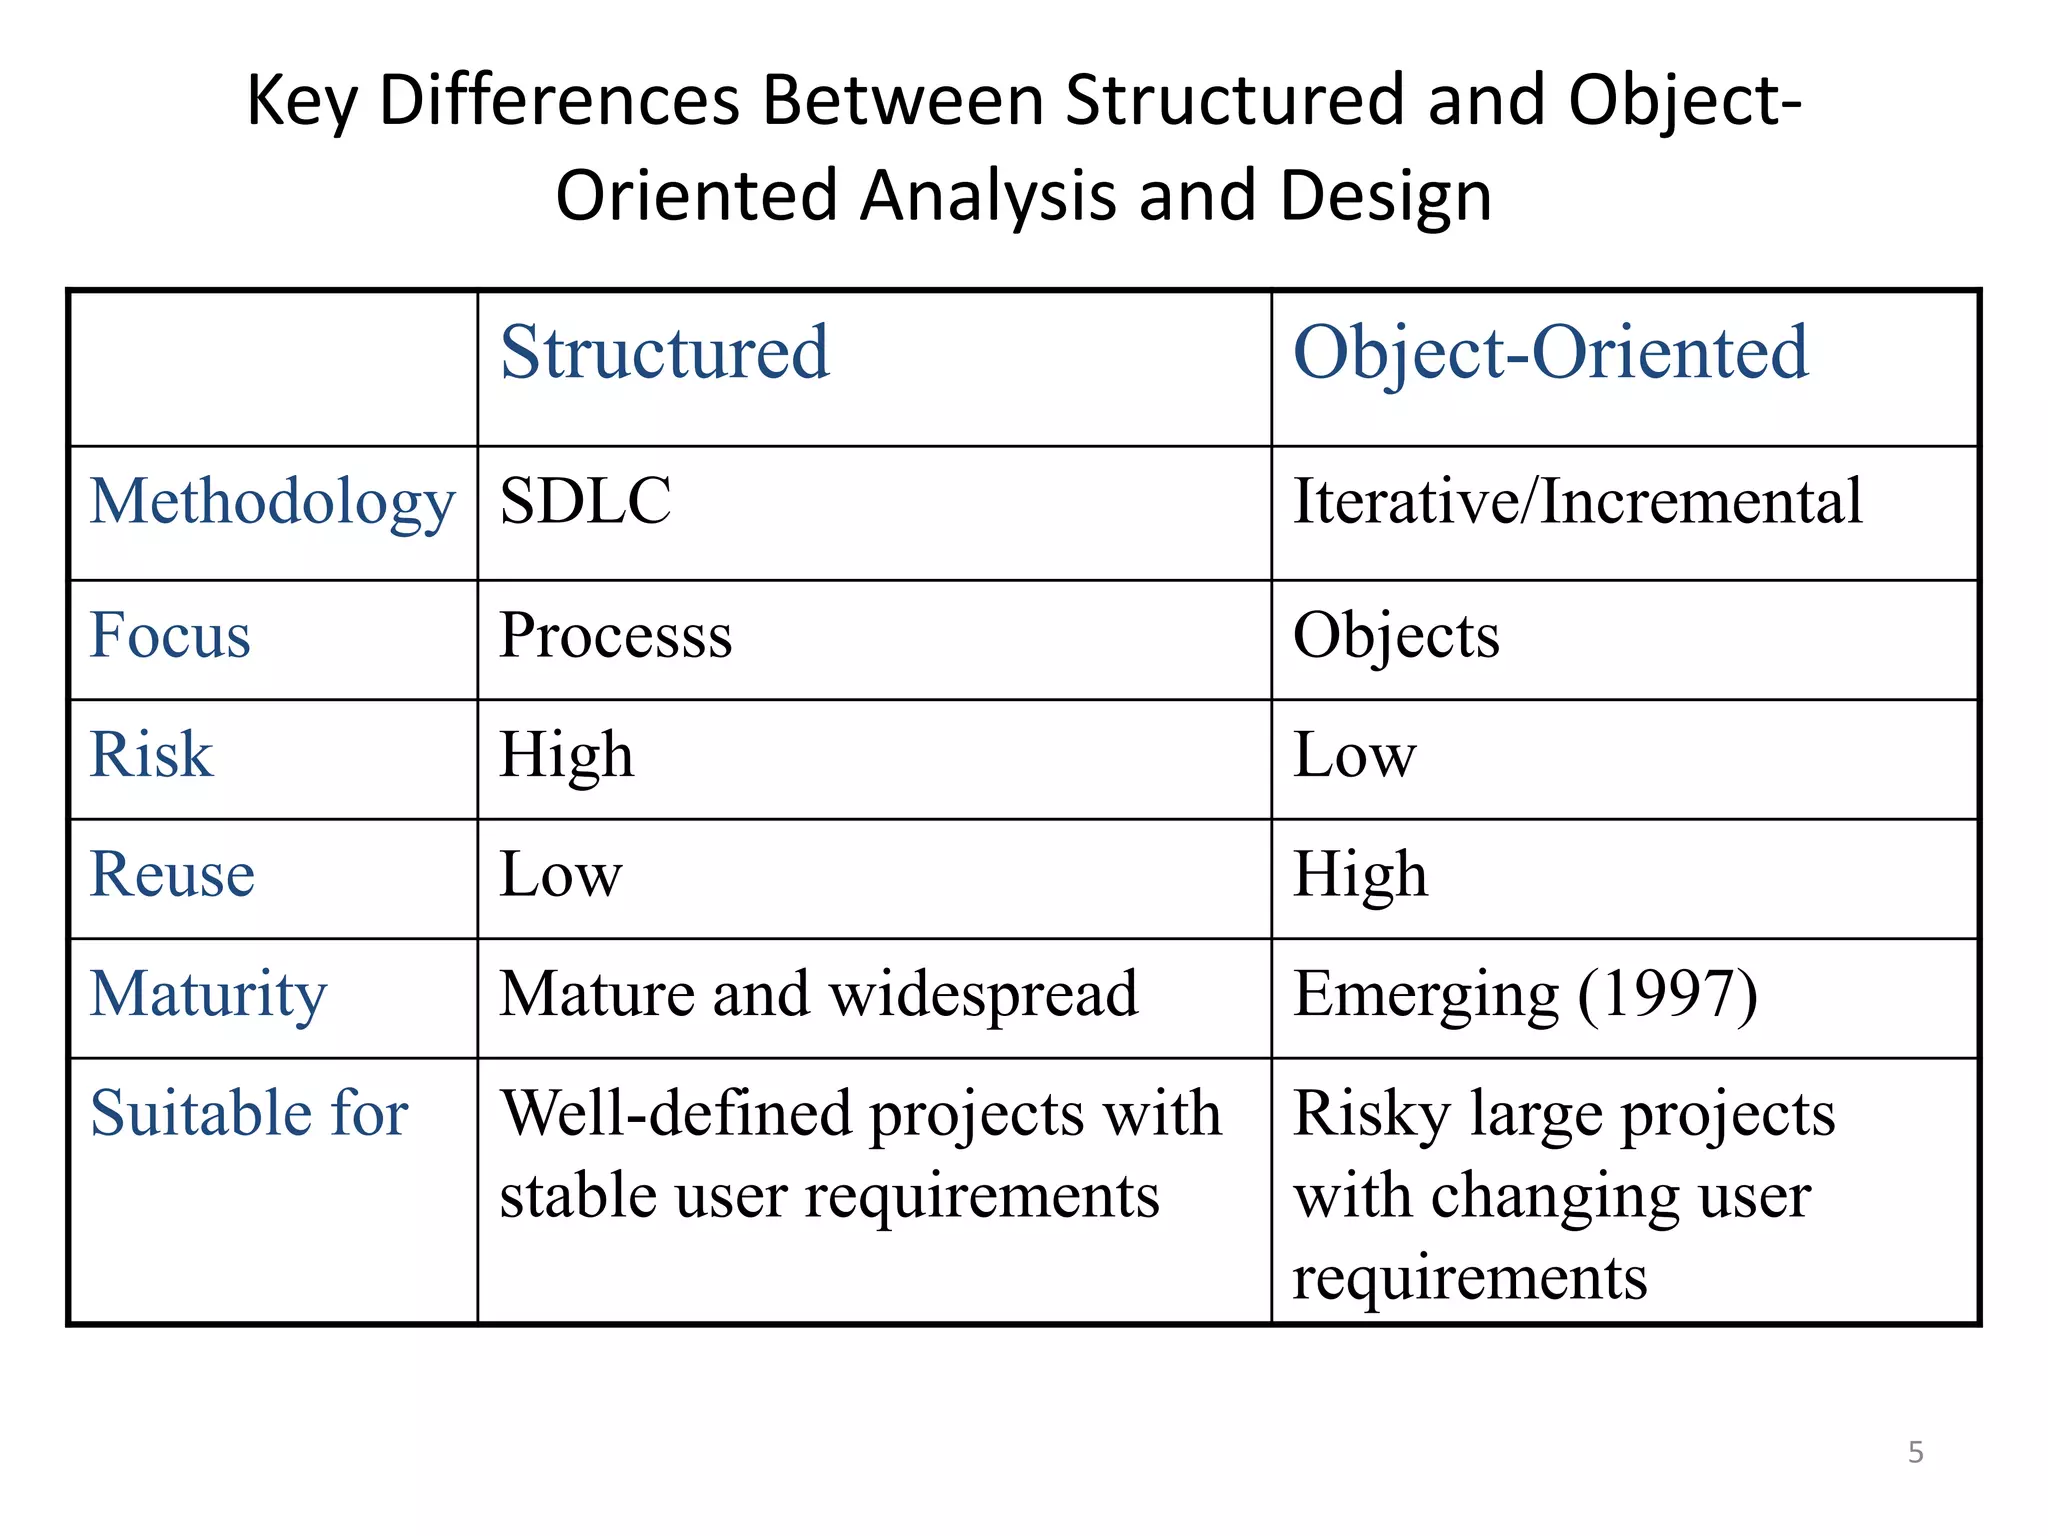
Describes key differences between structured (SAD) and object-oriented analysis and design (OOAD) methodologies.
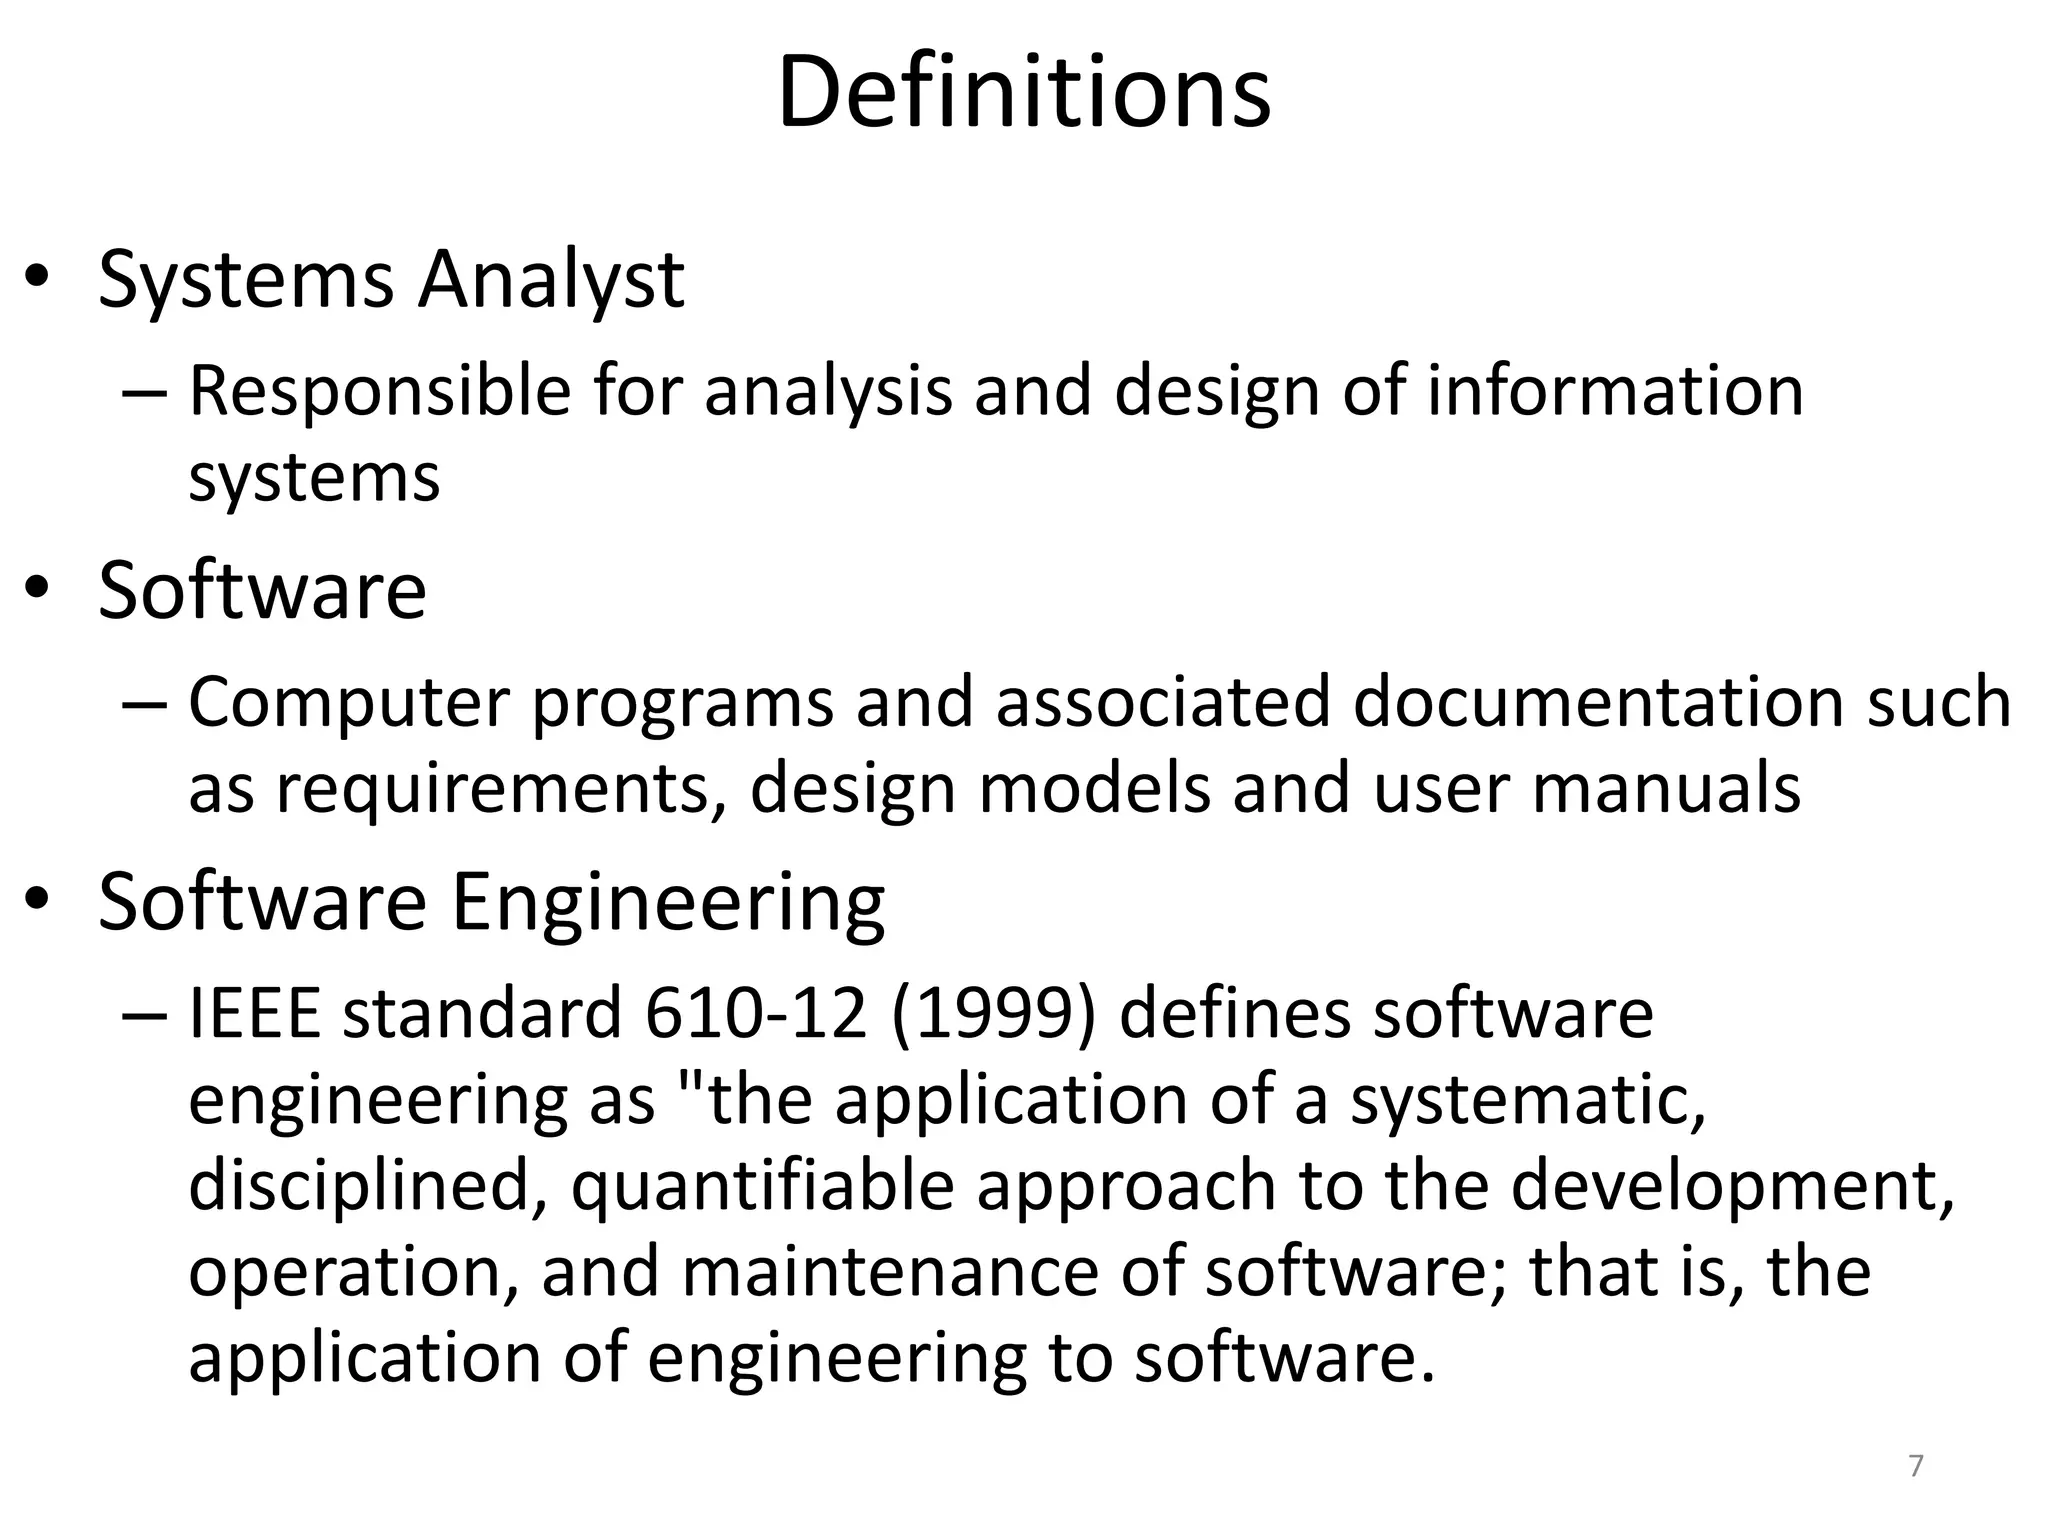
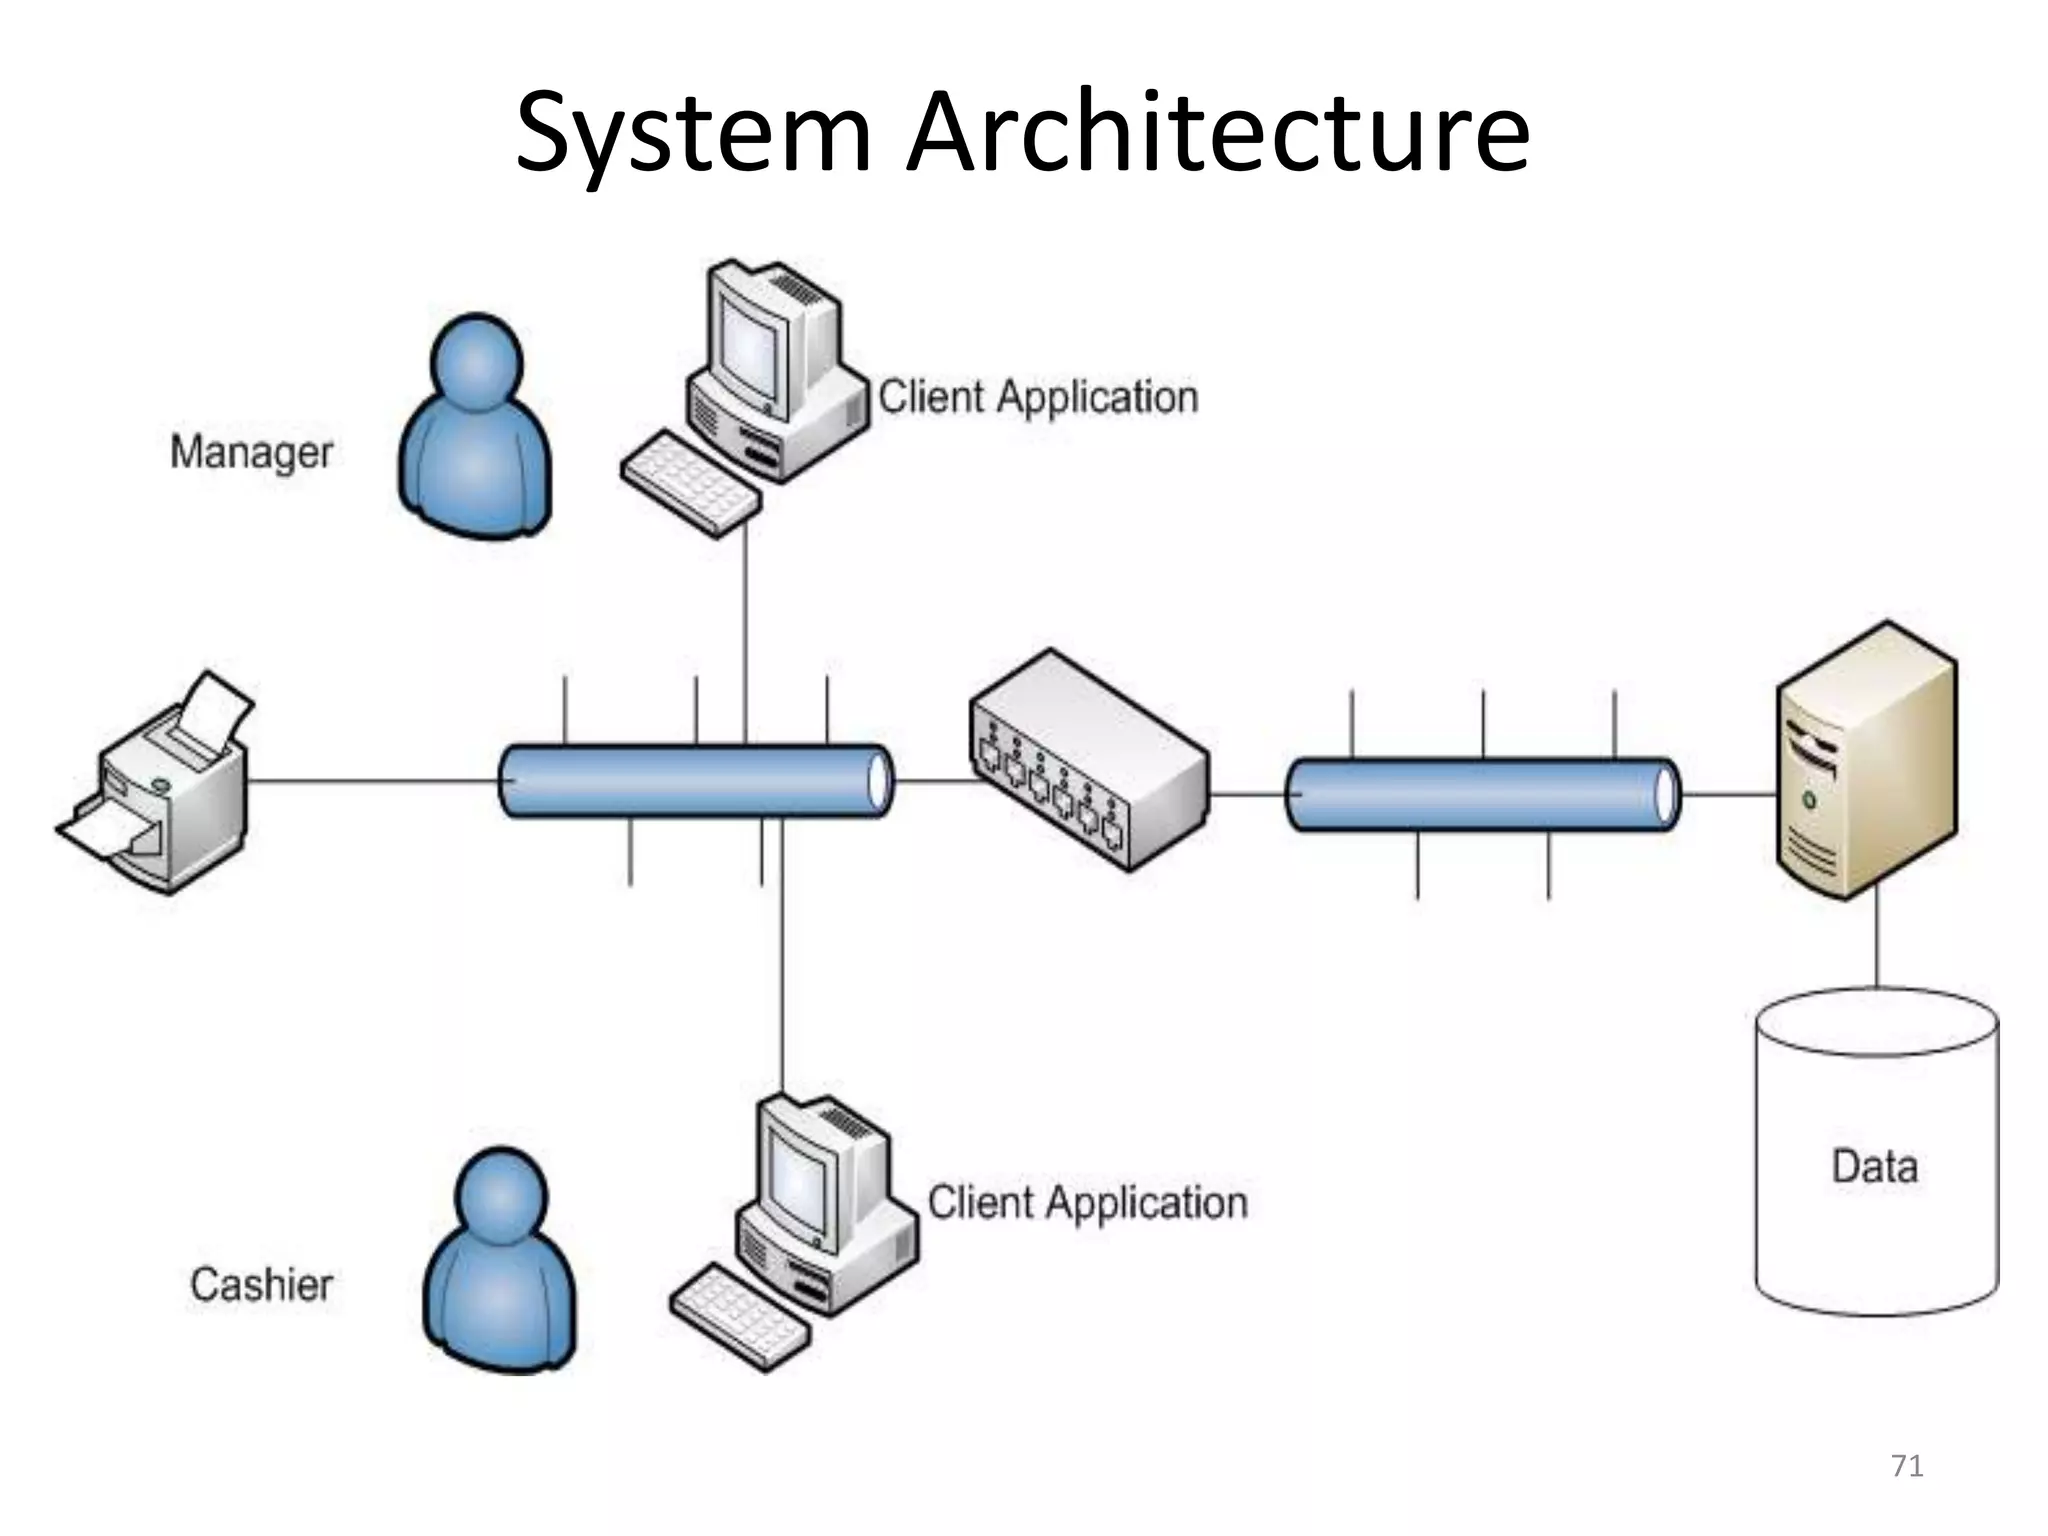
Defines systems analyst responsibilities and outlines general software project phases.
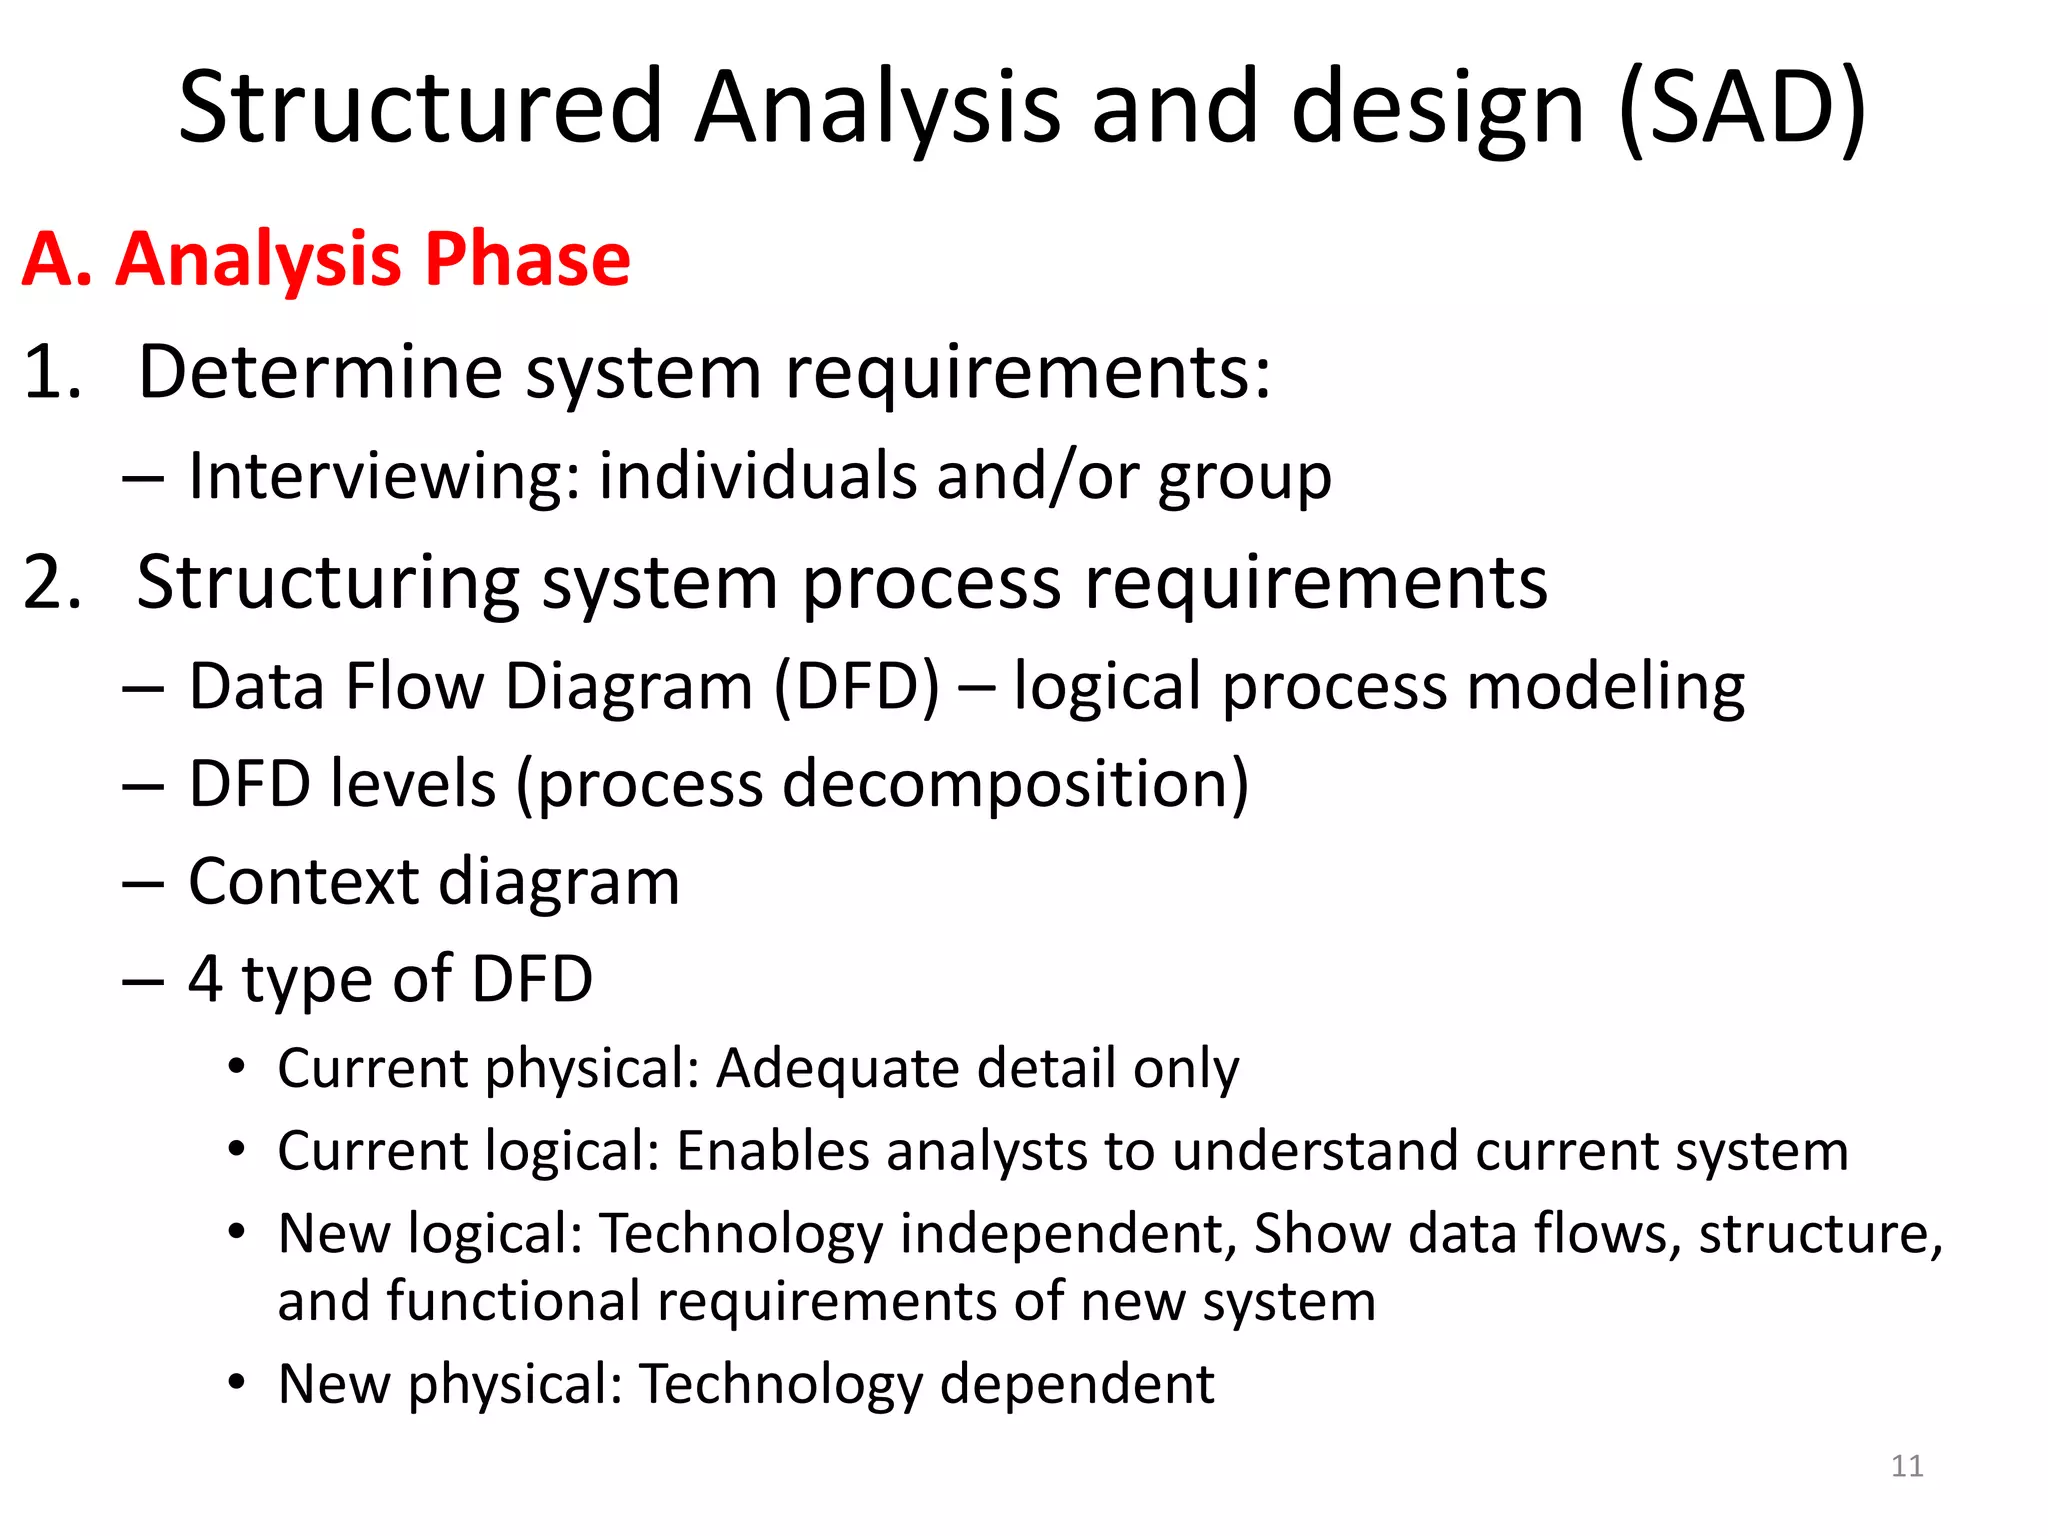
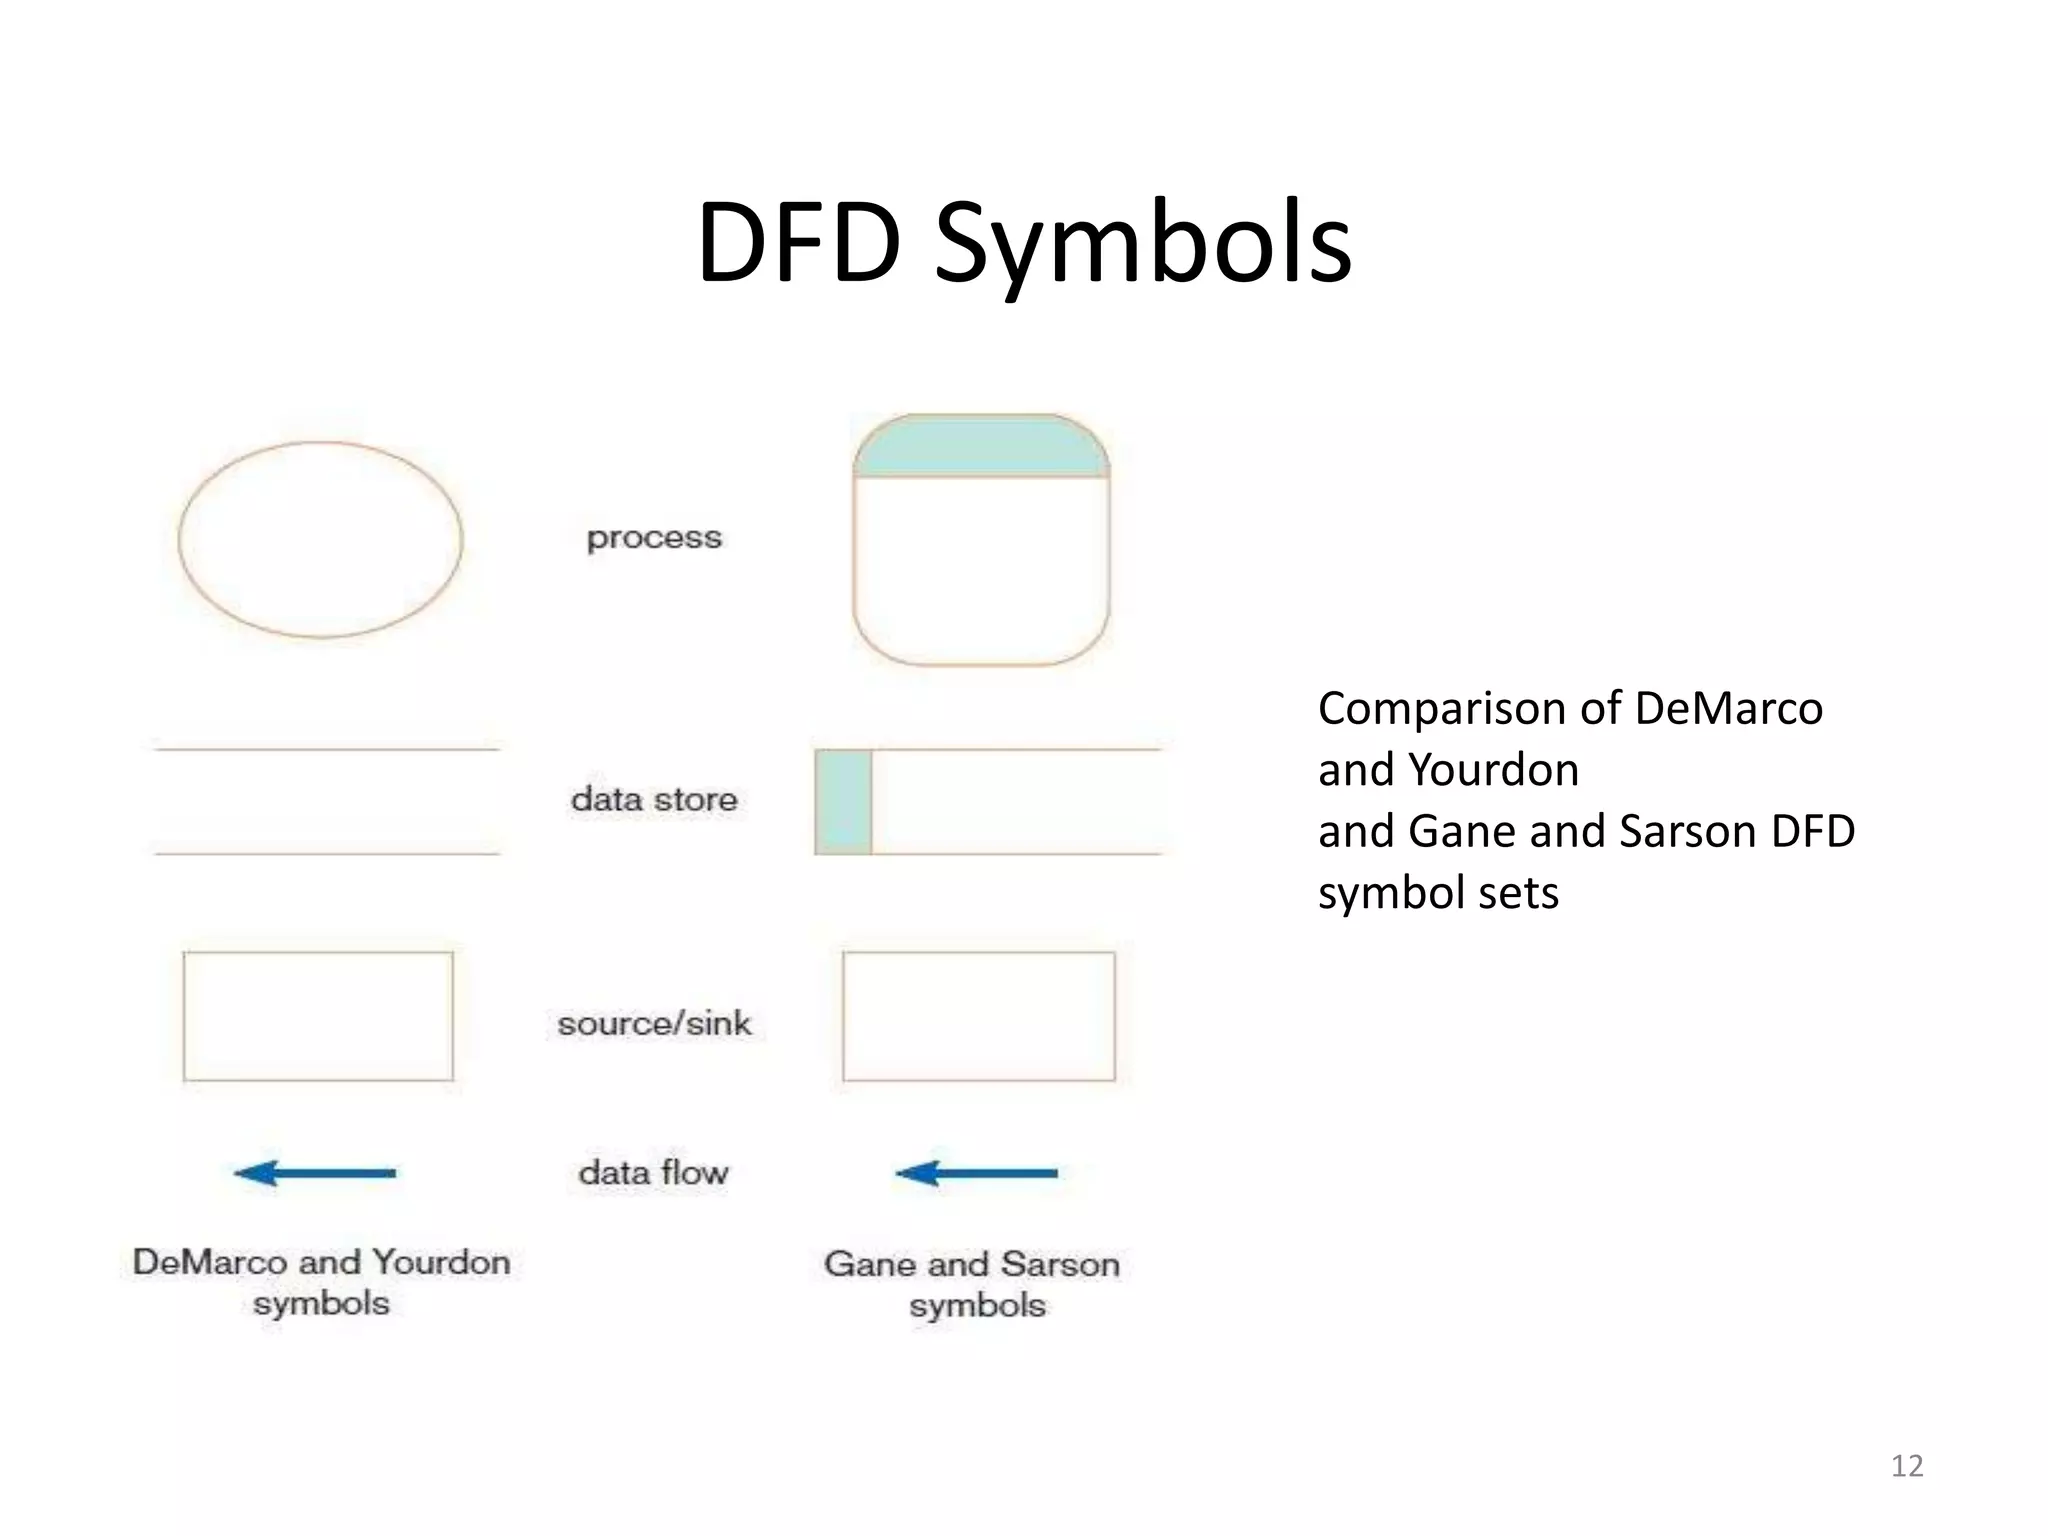
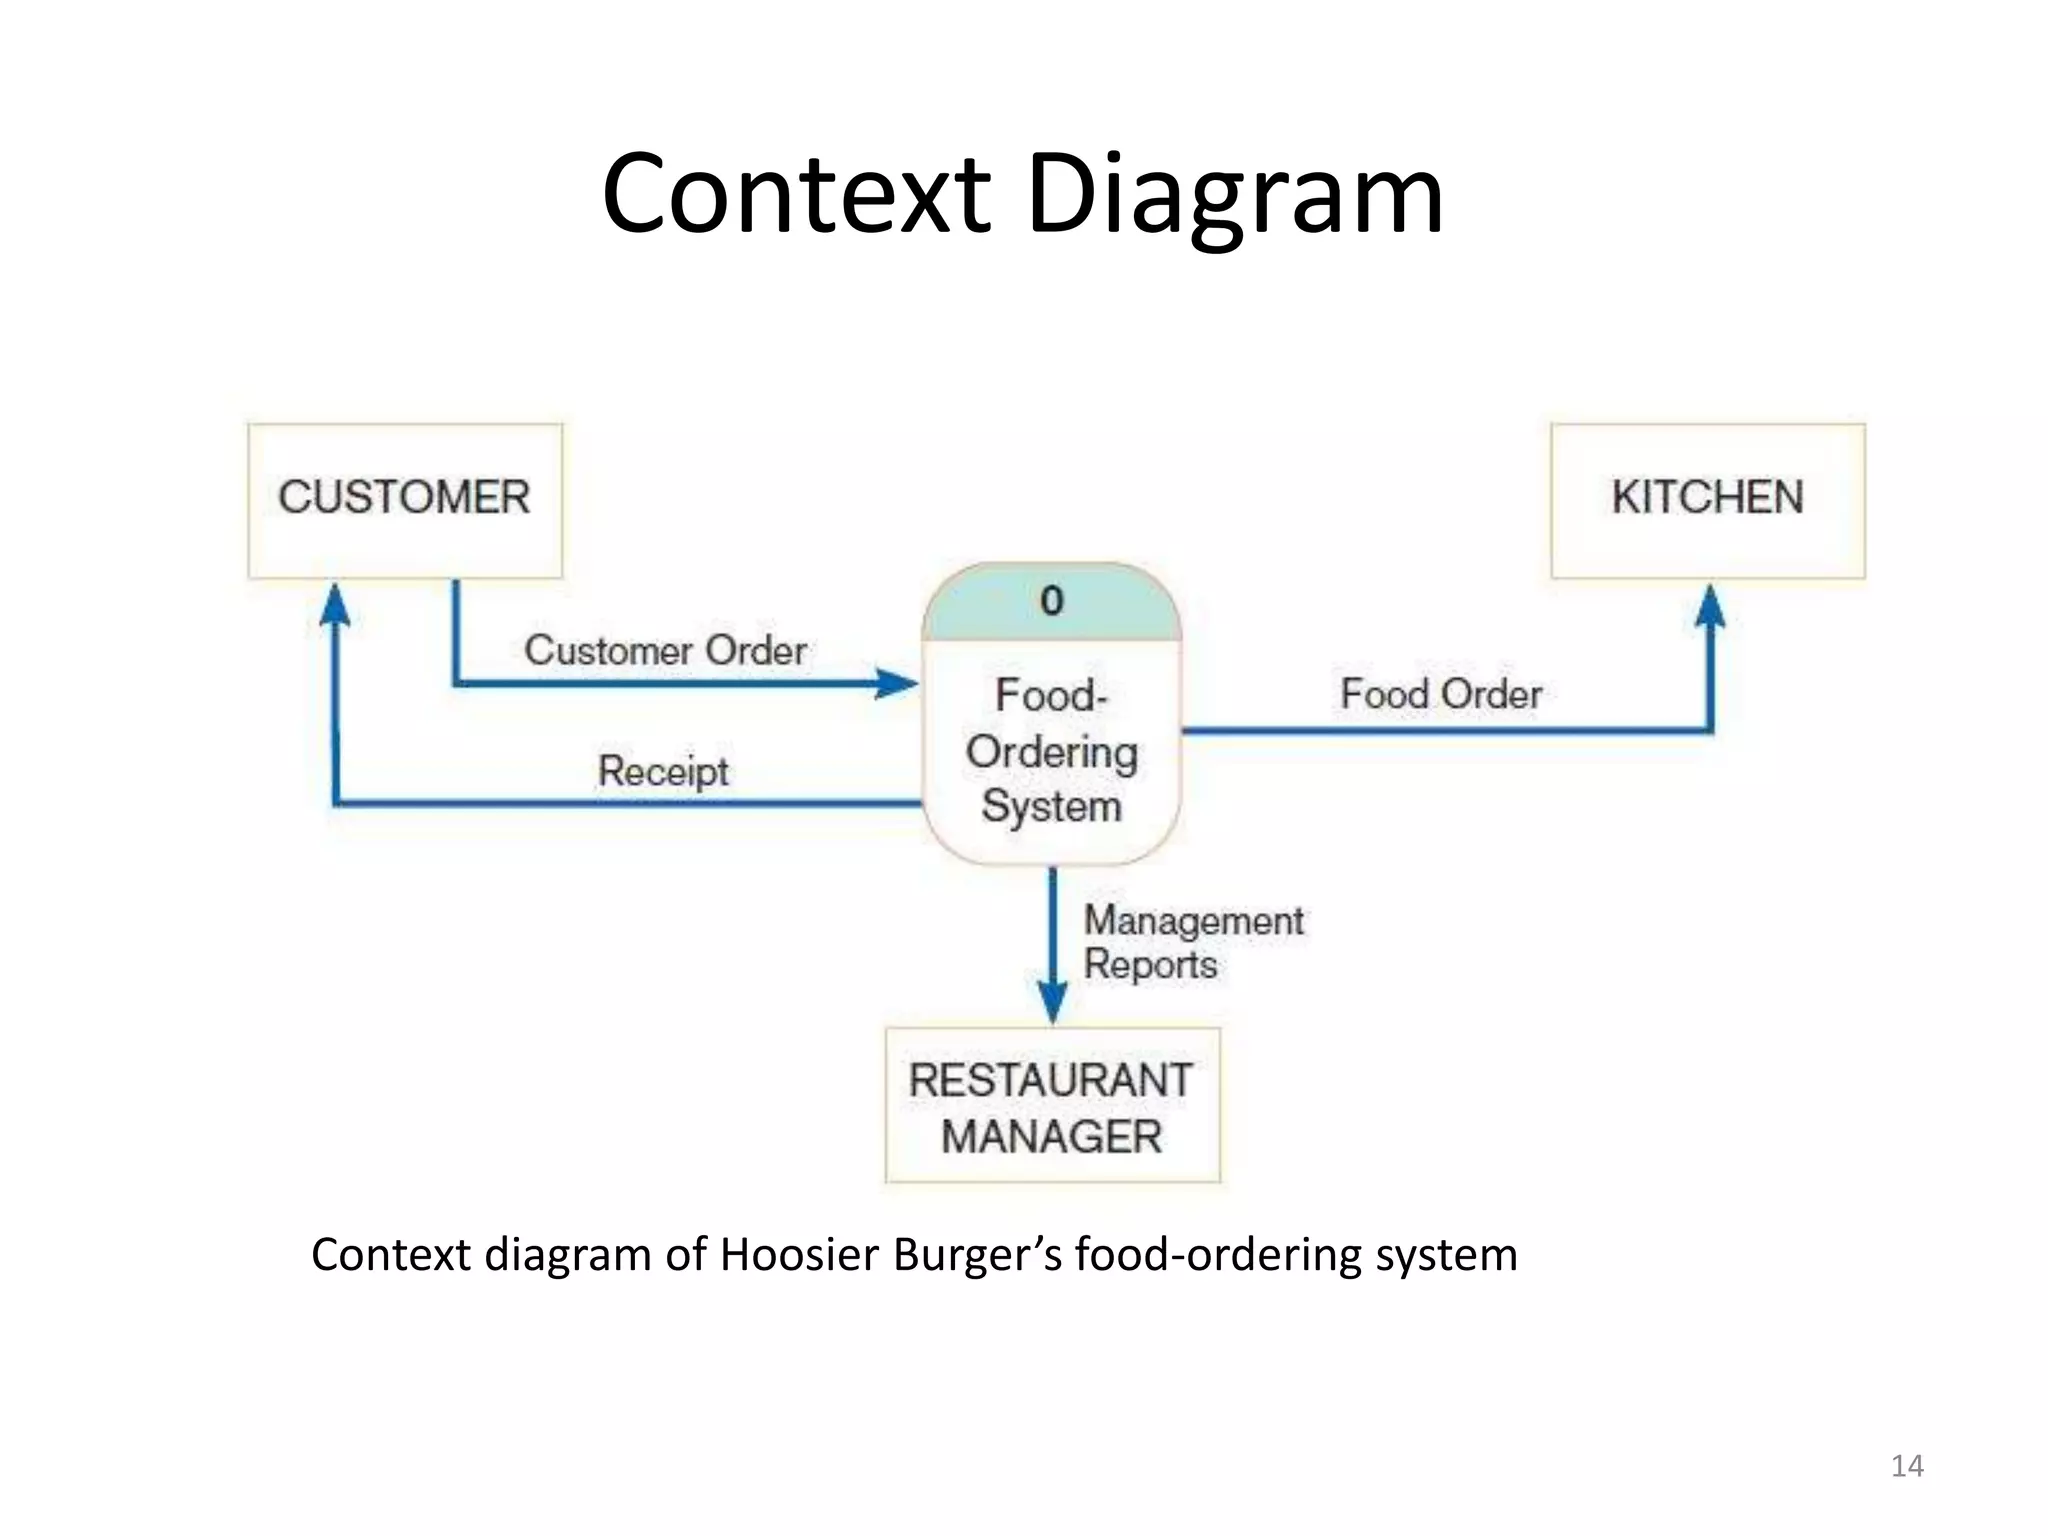
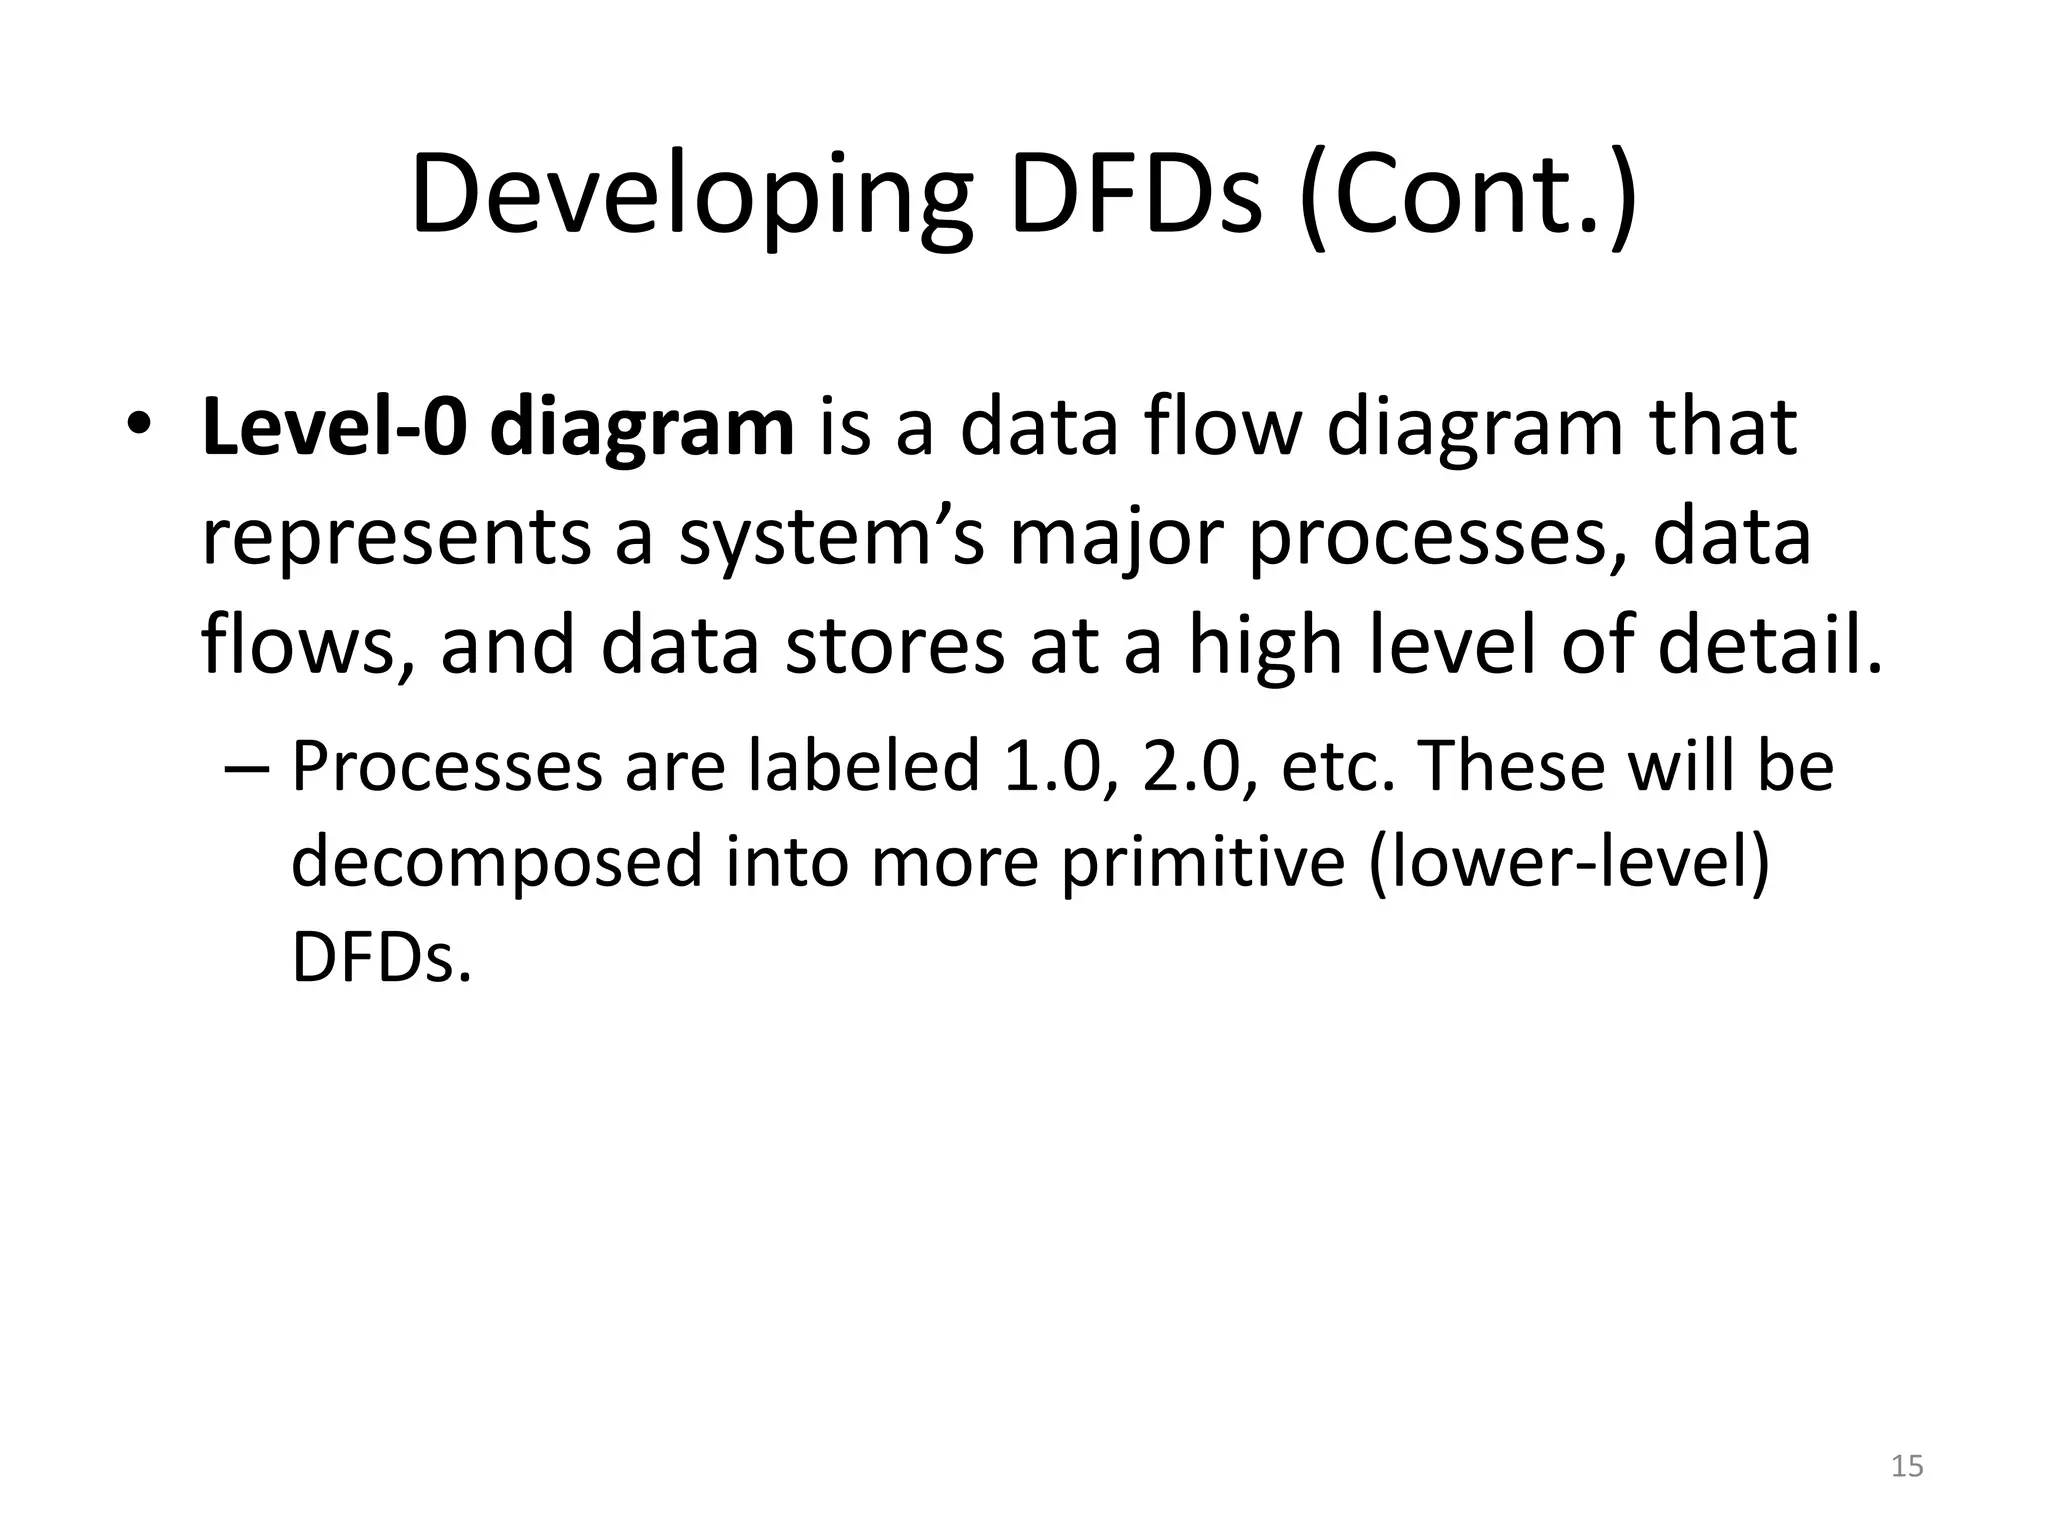
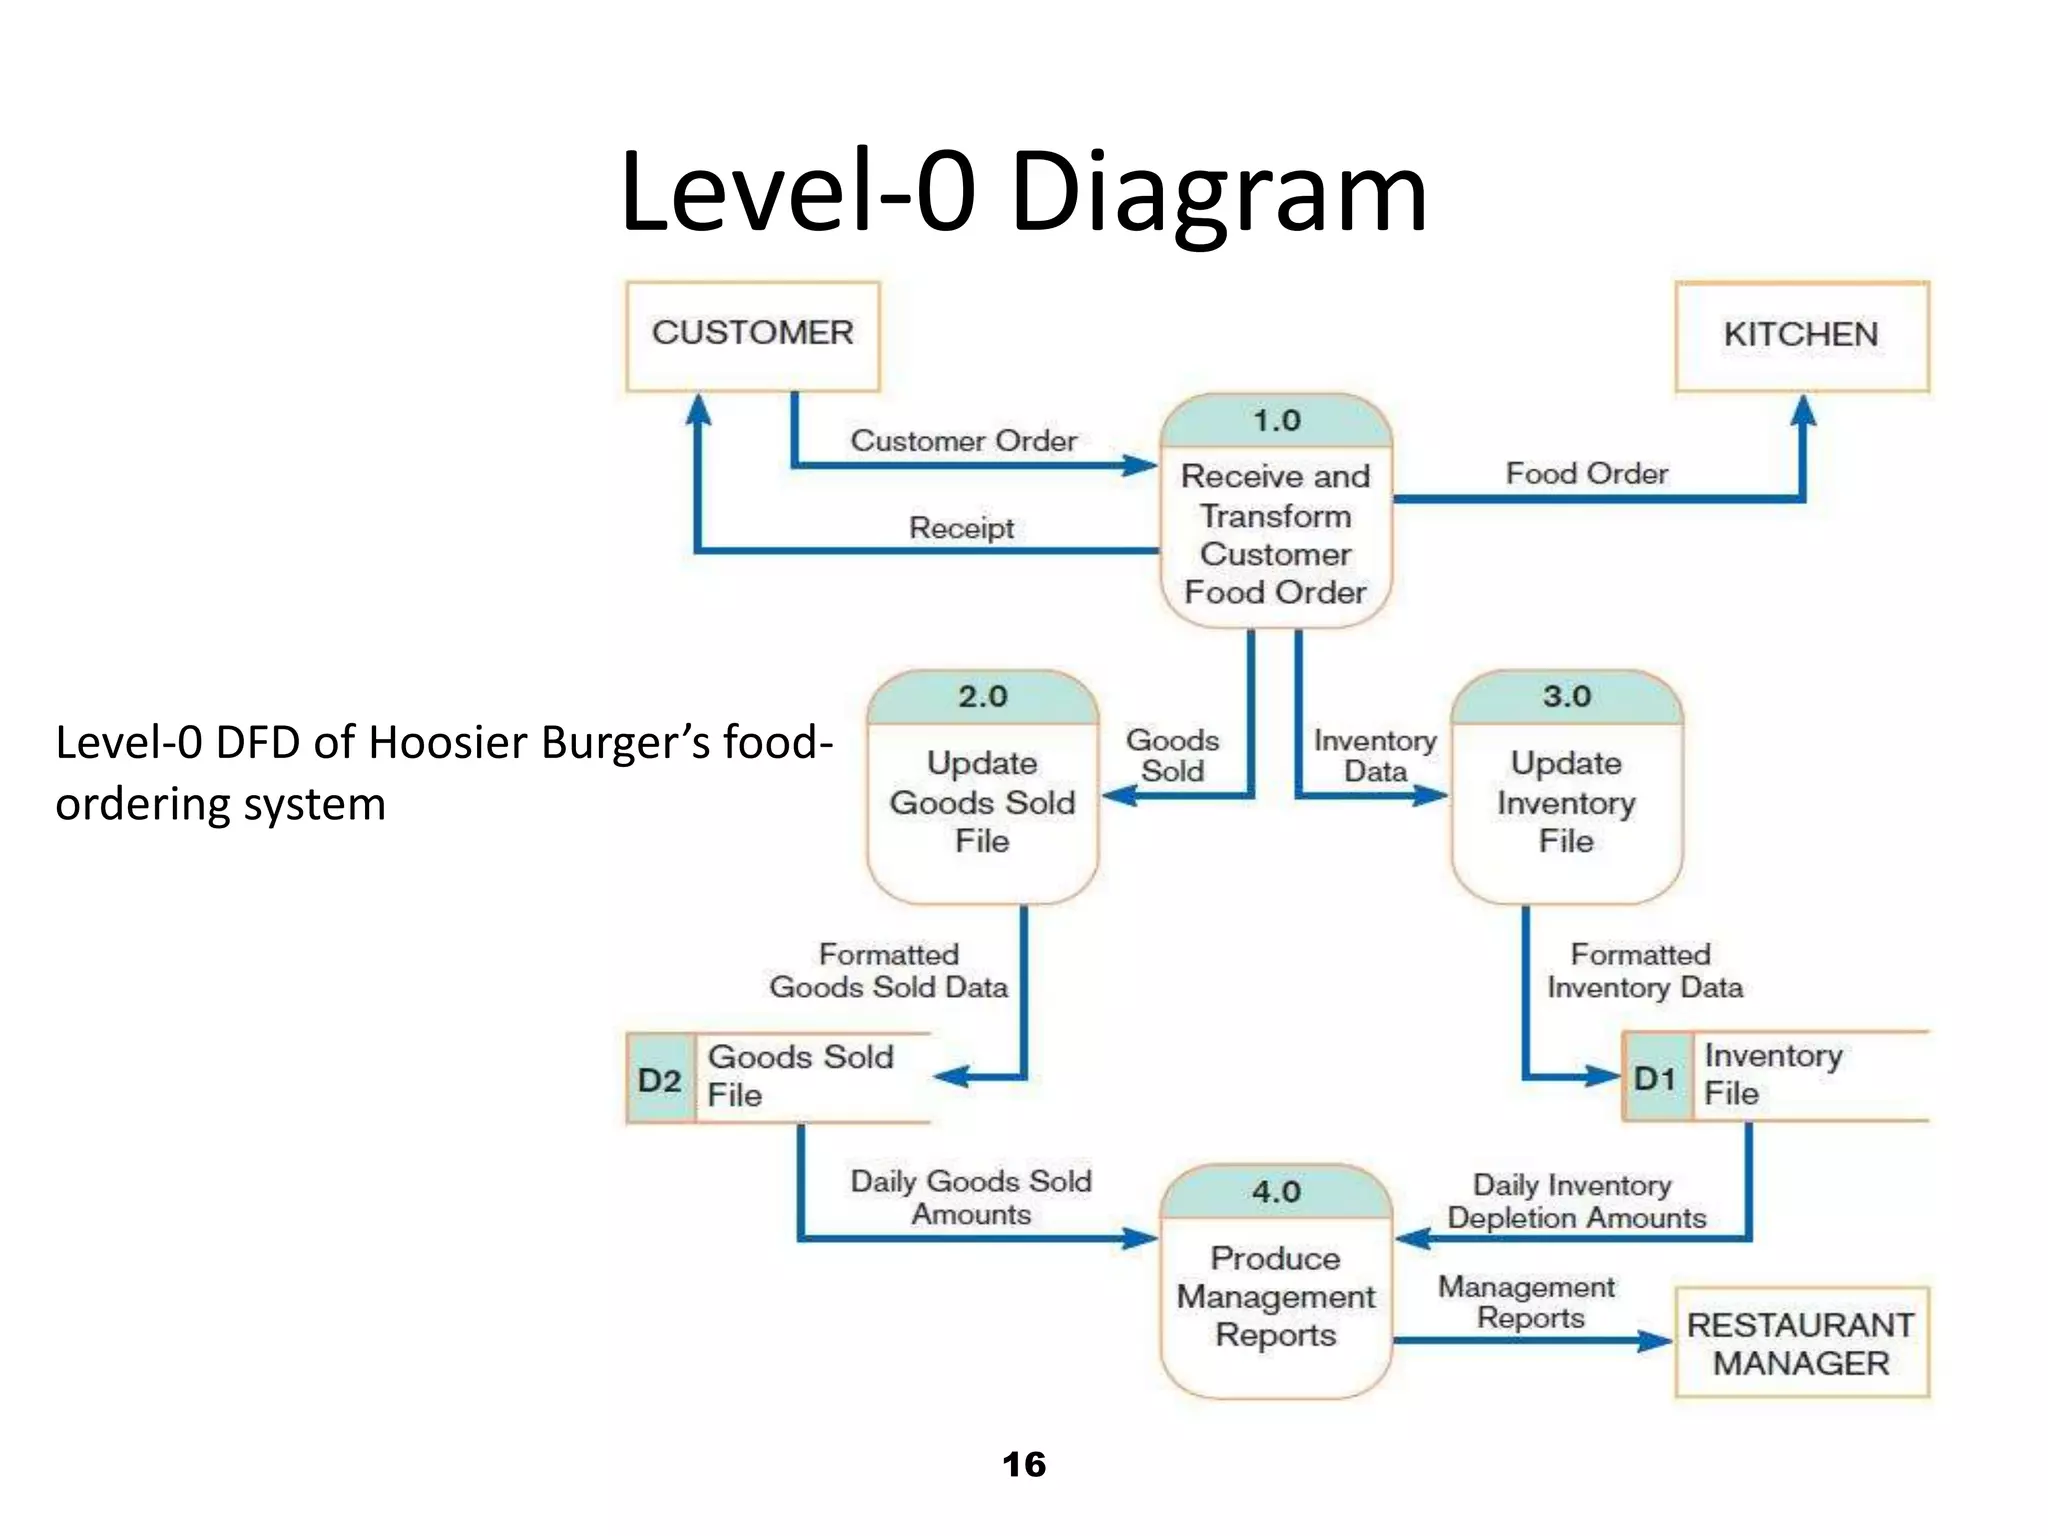
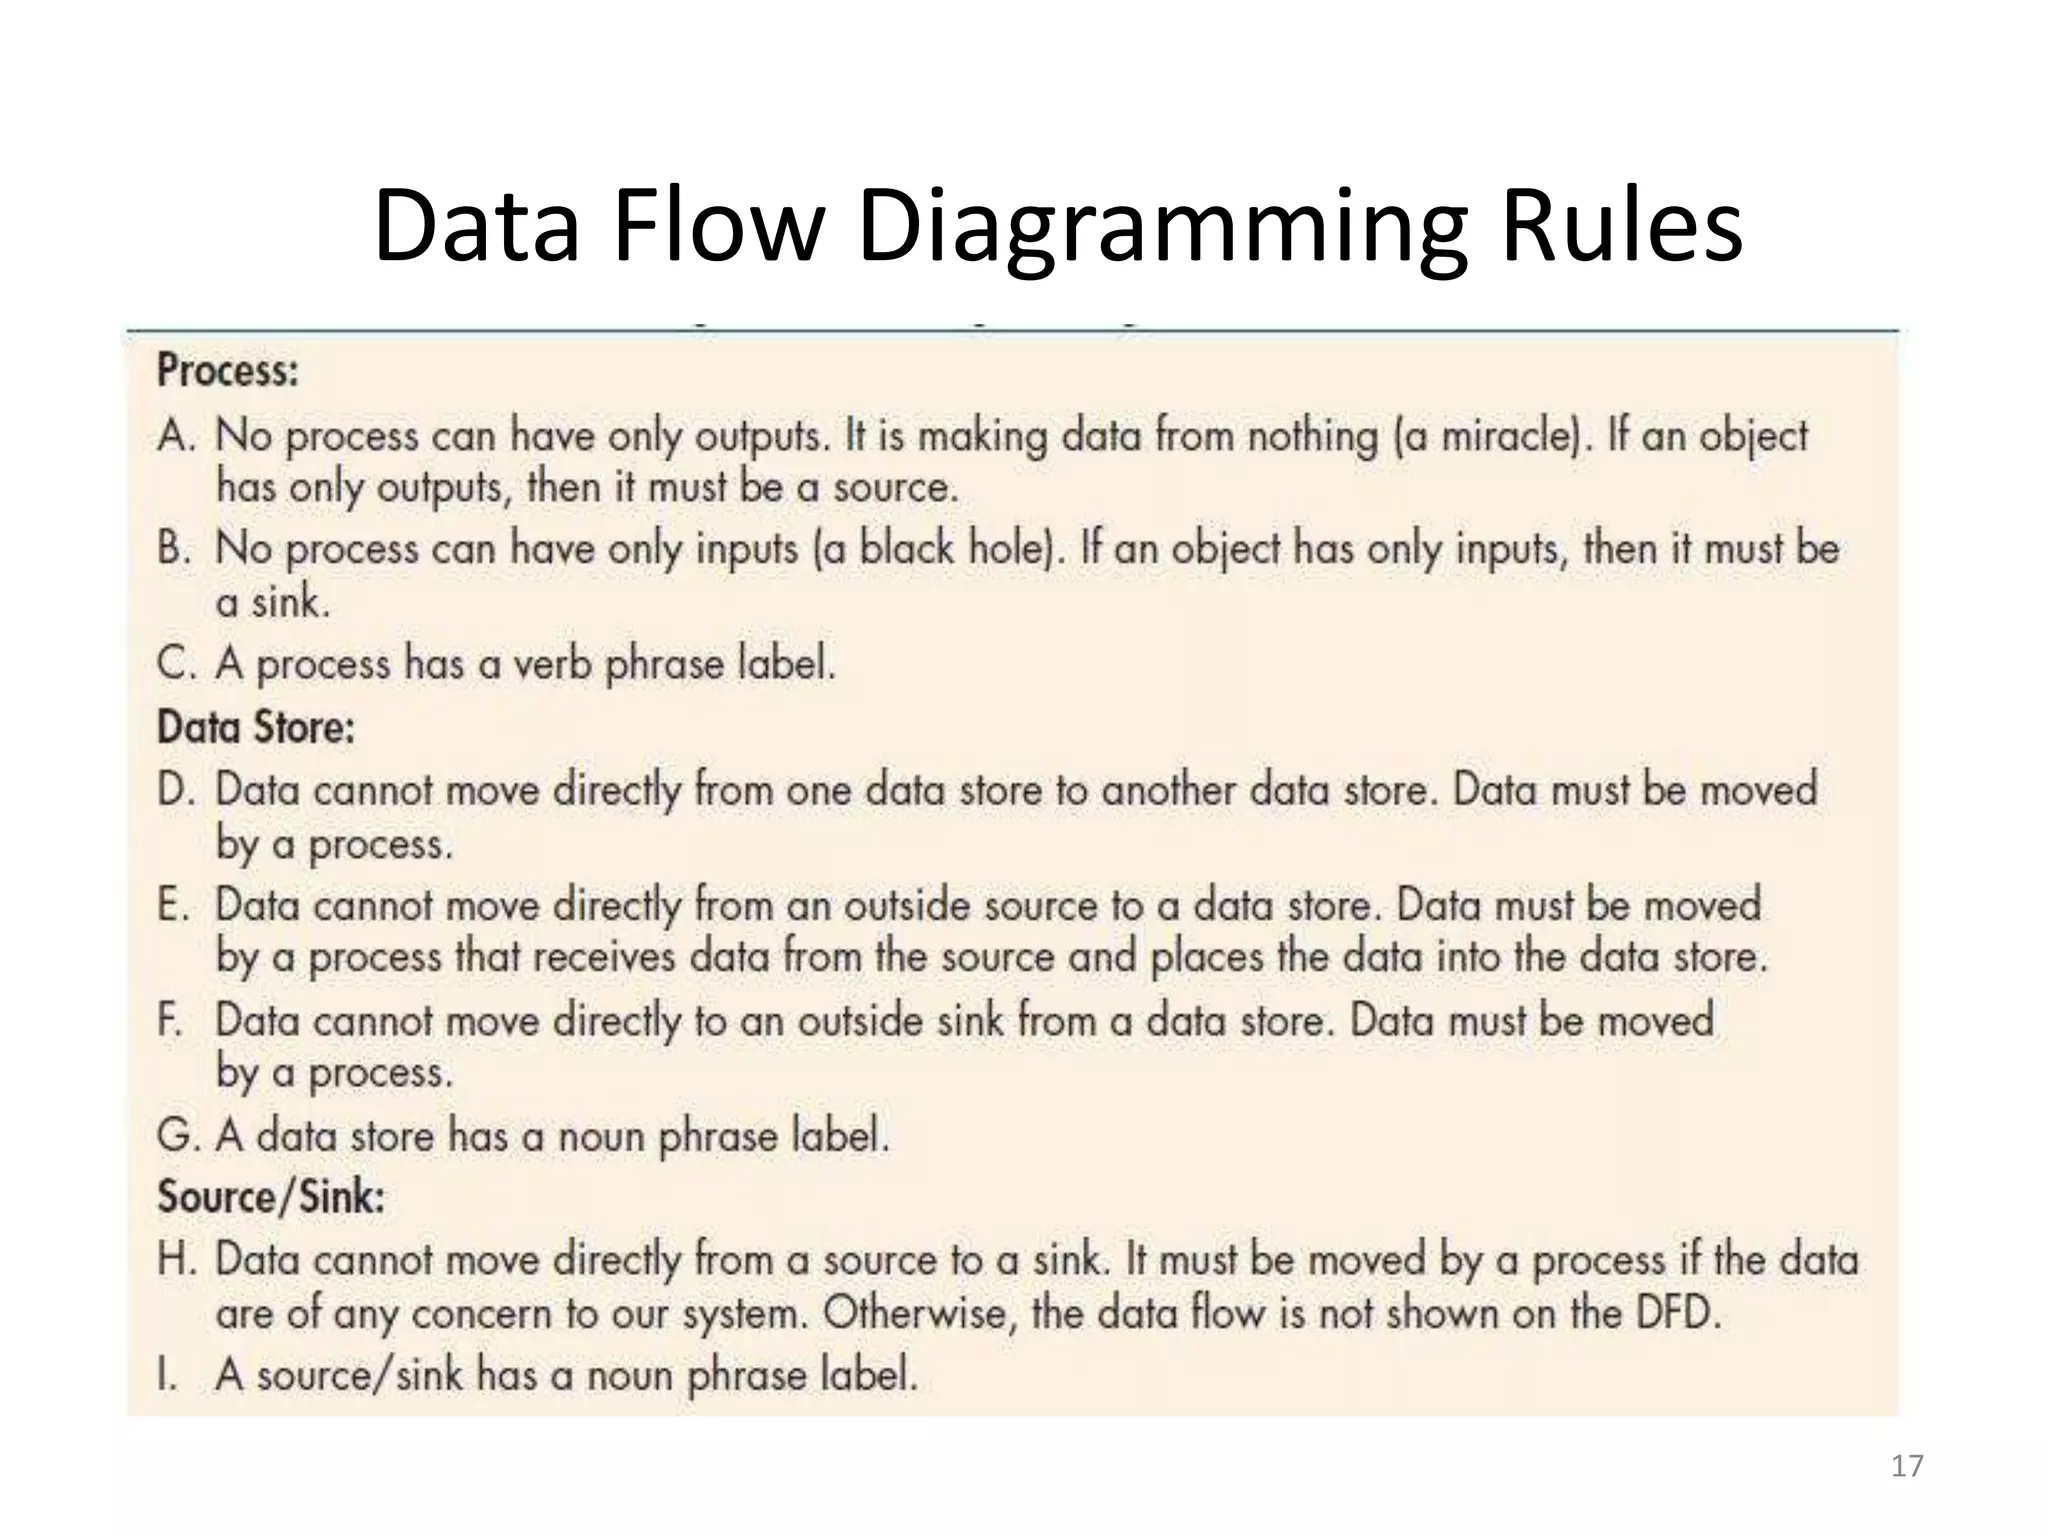
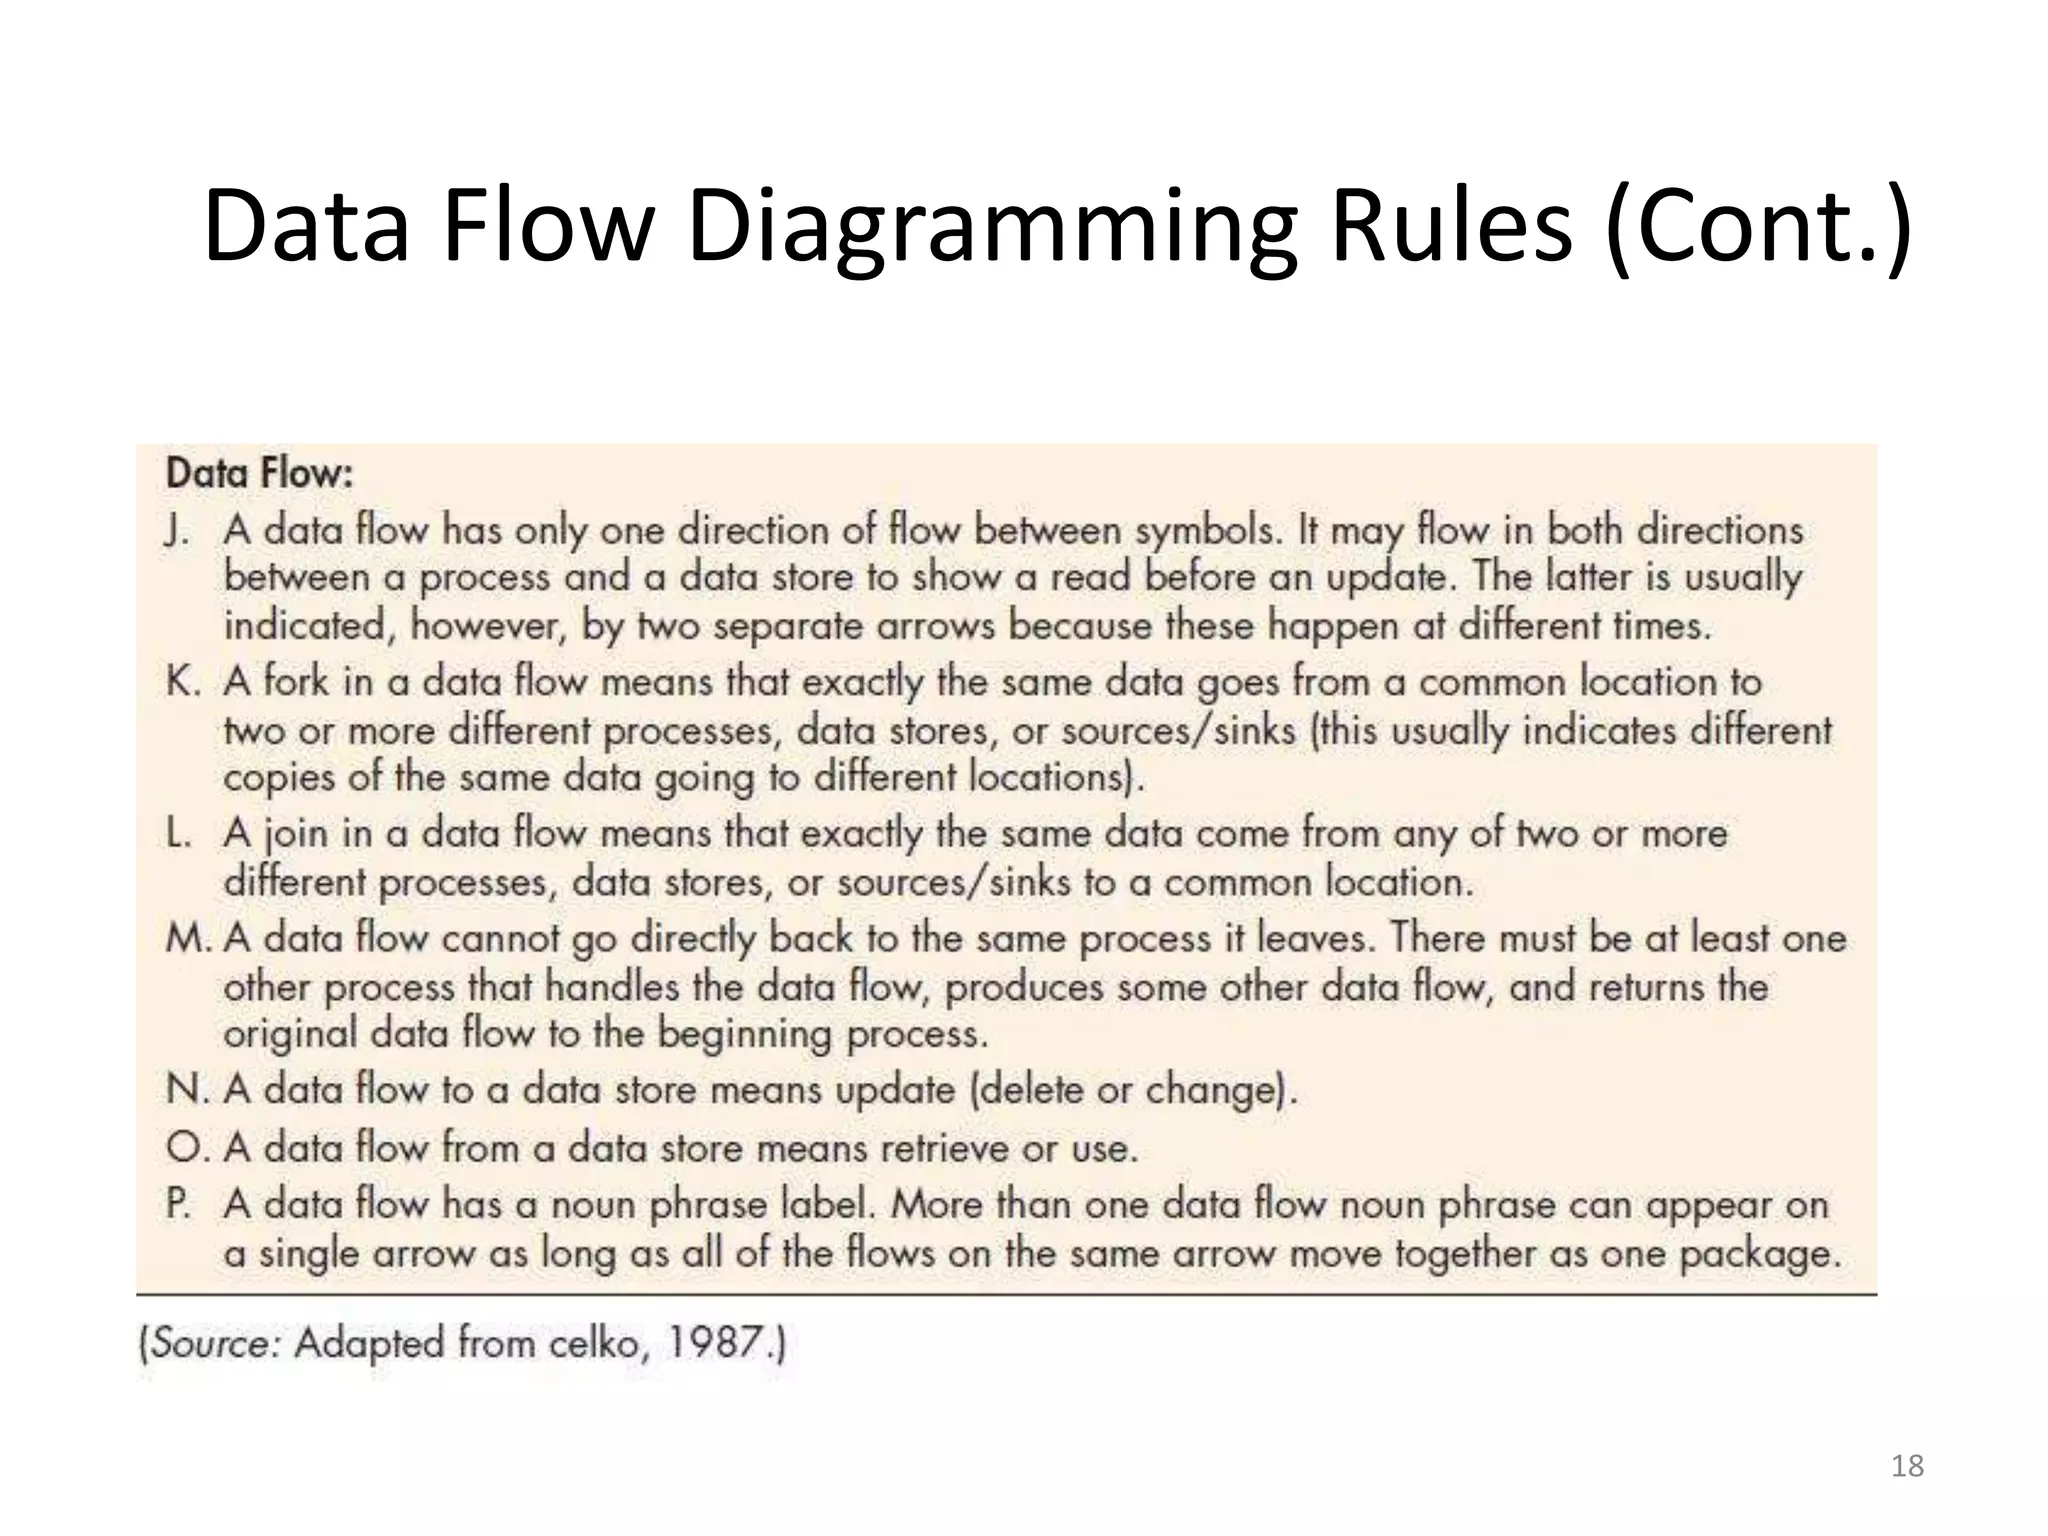
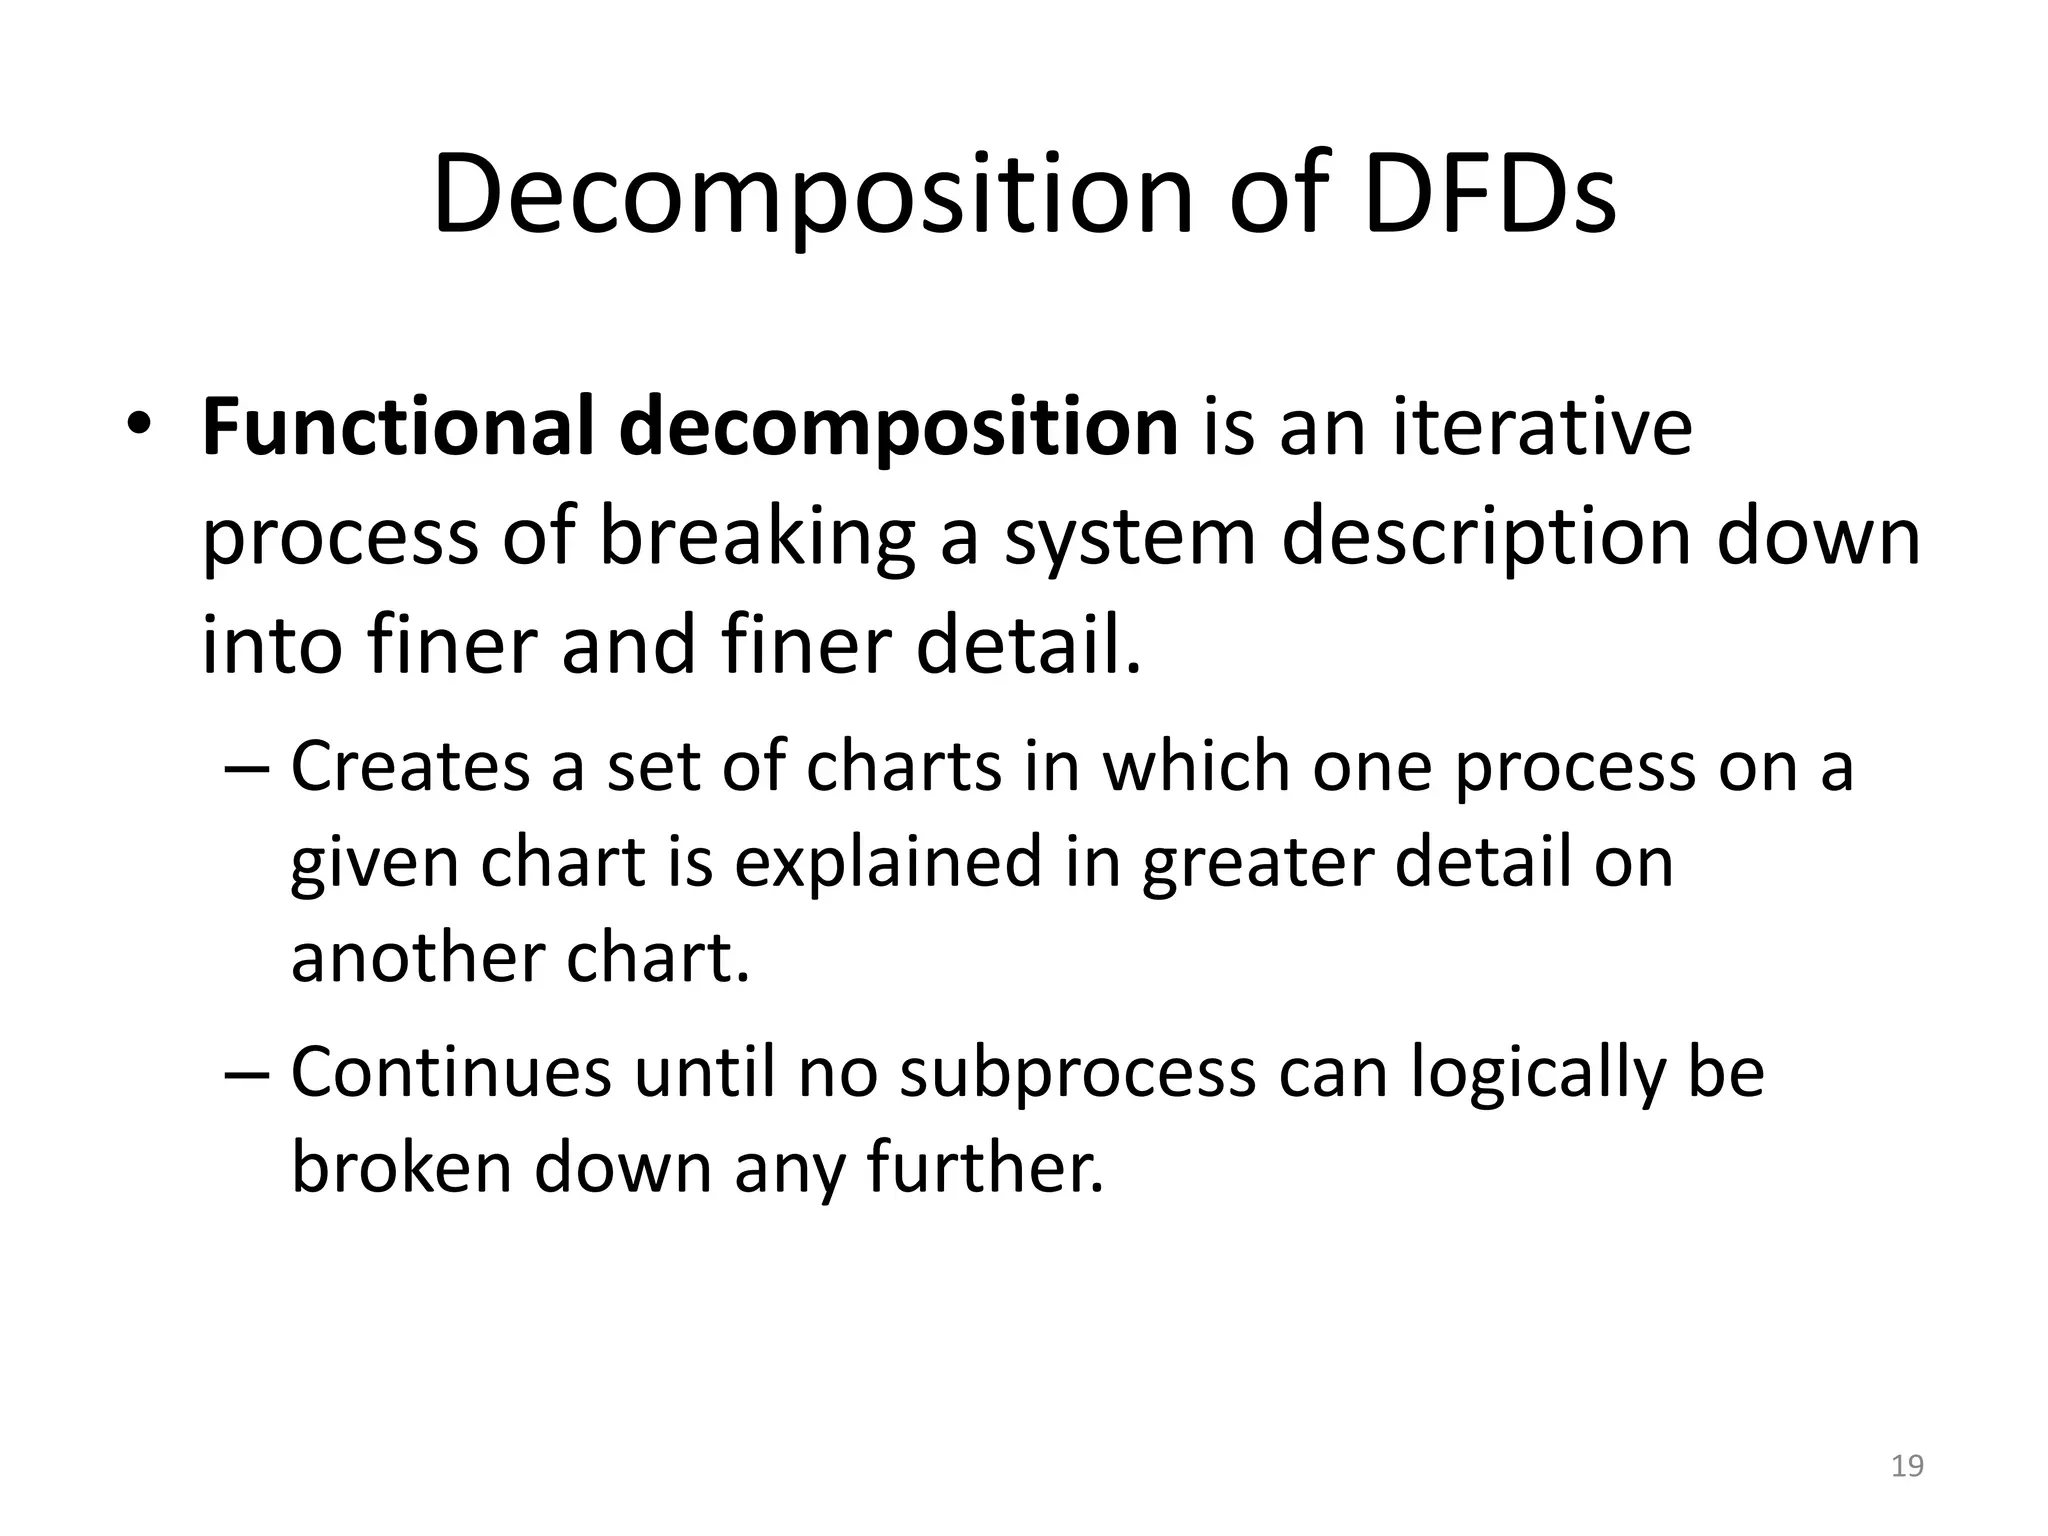
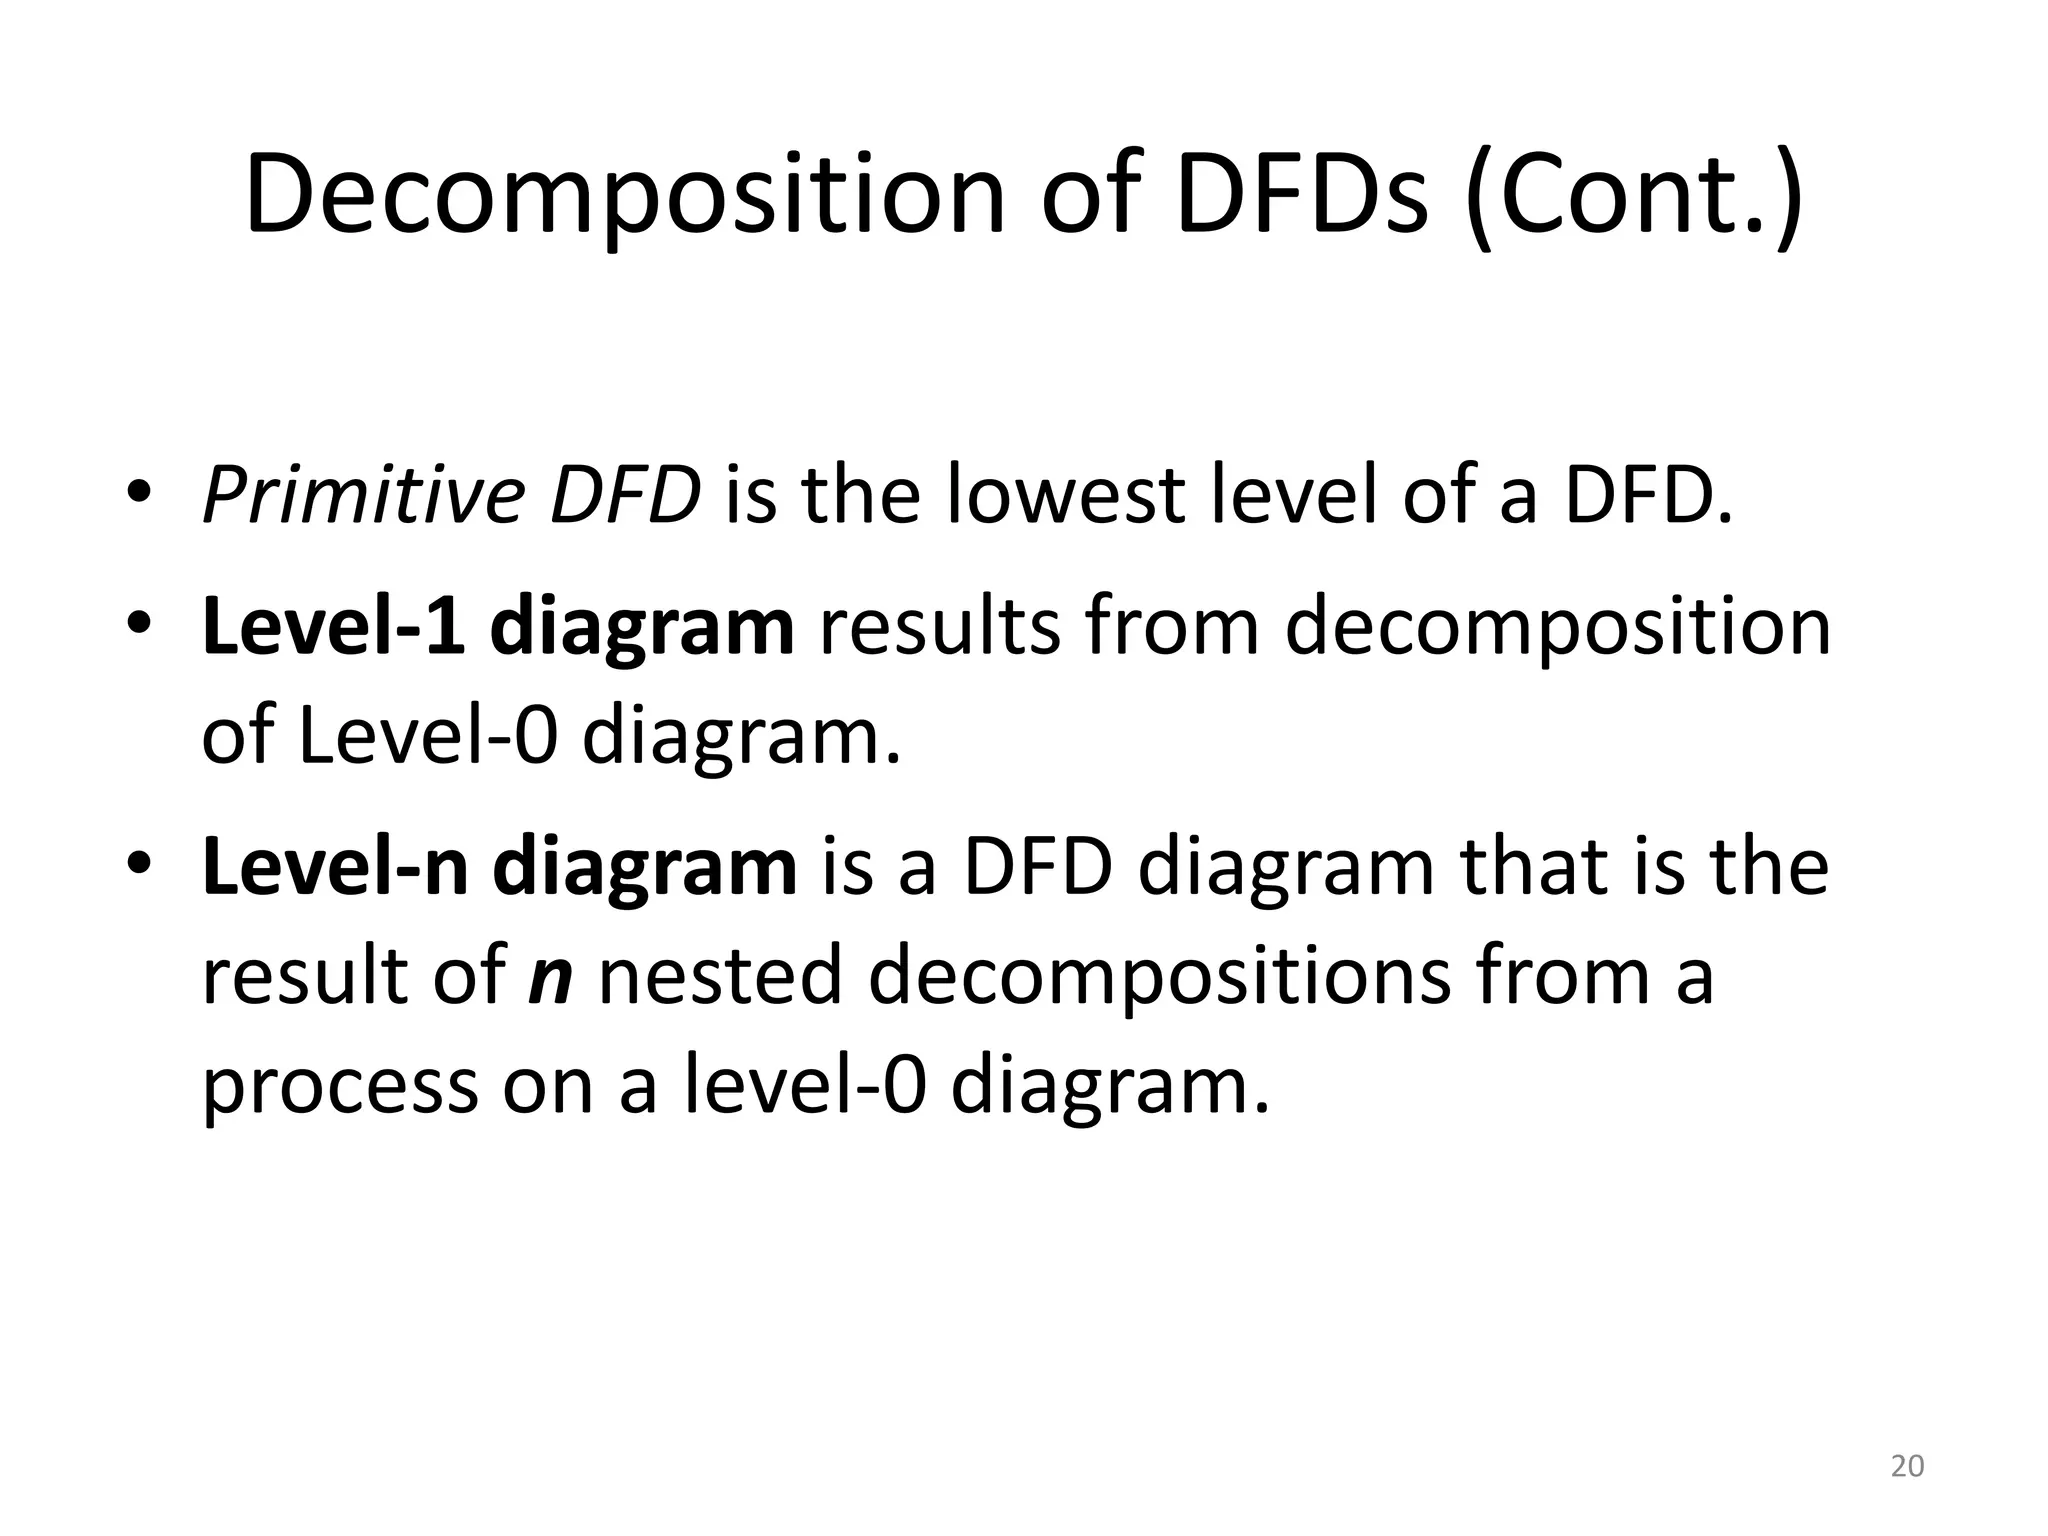
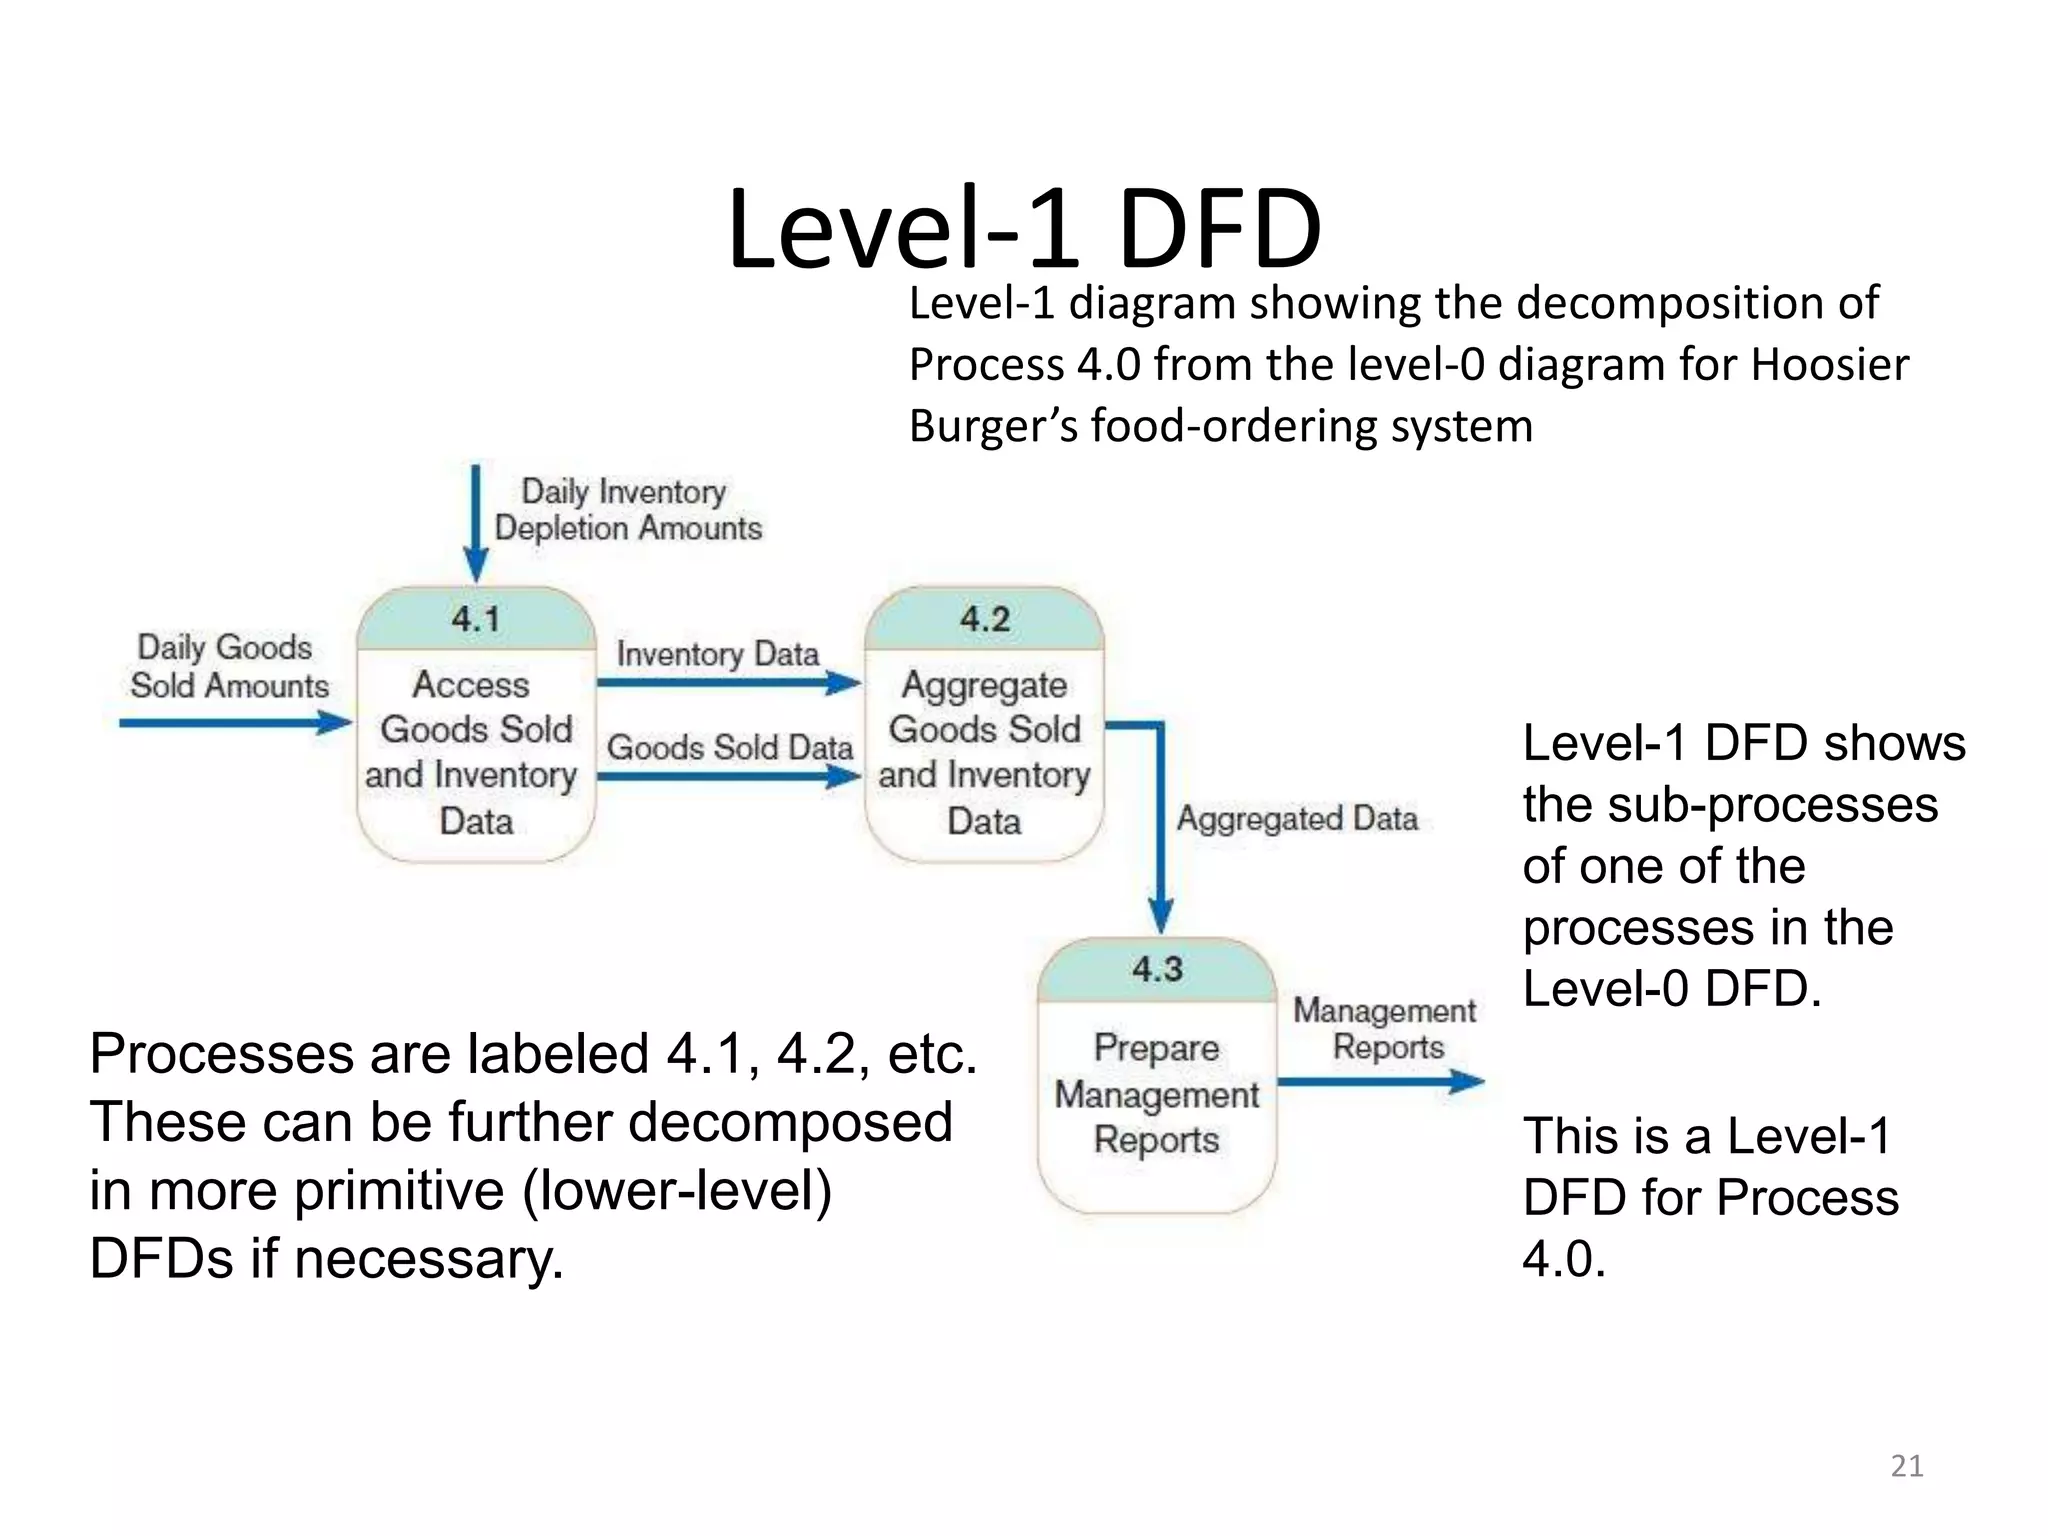
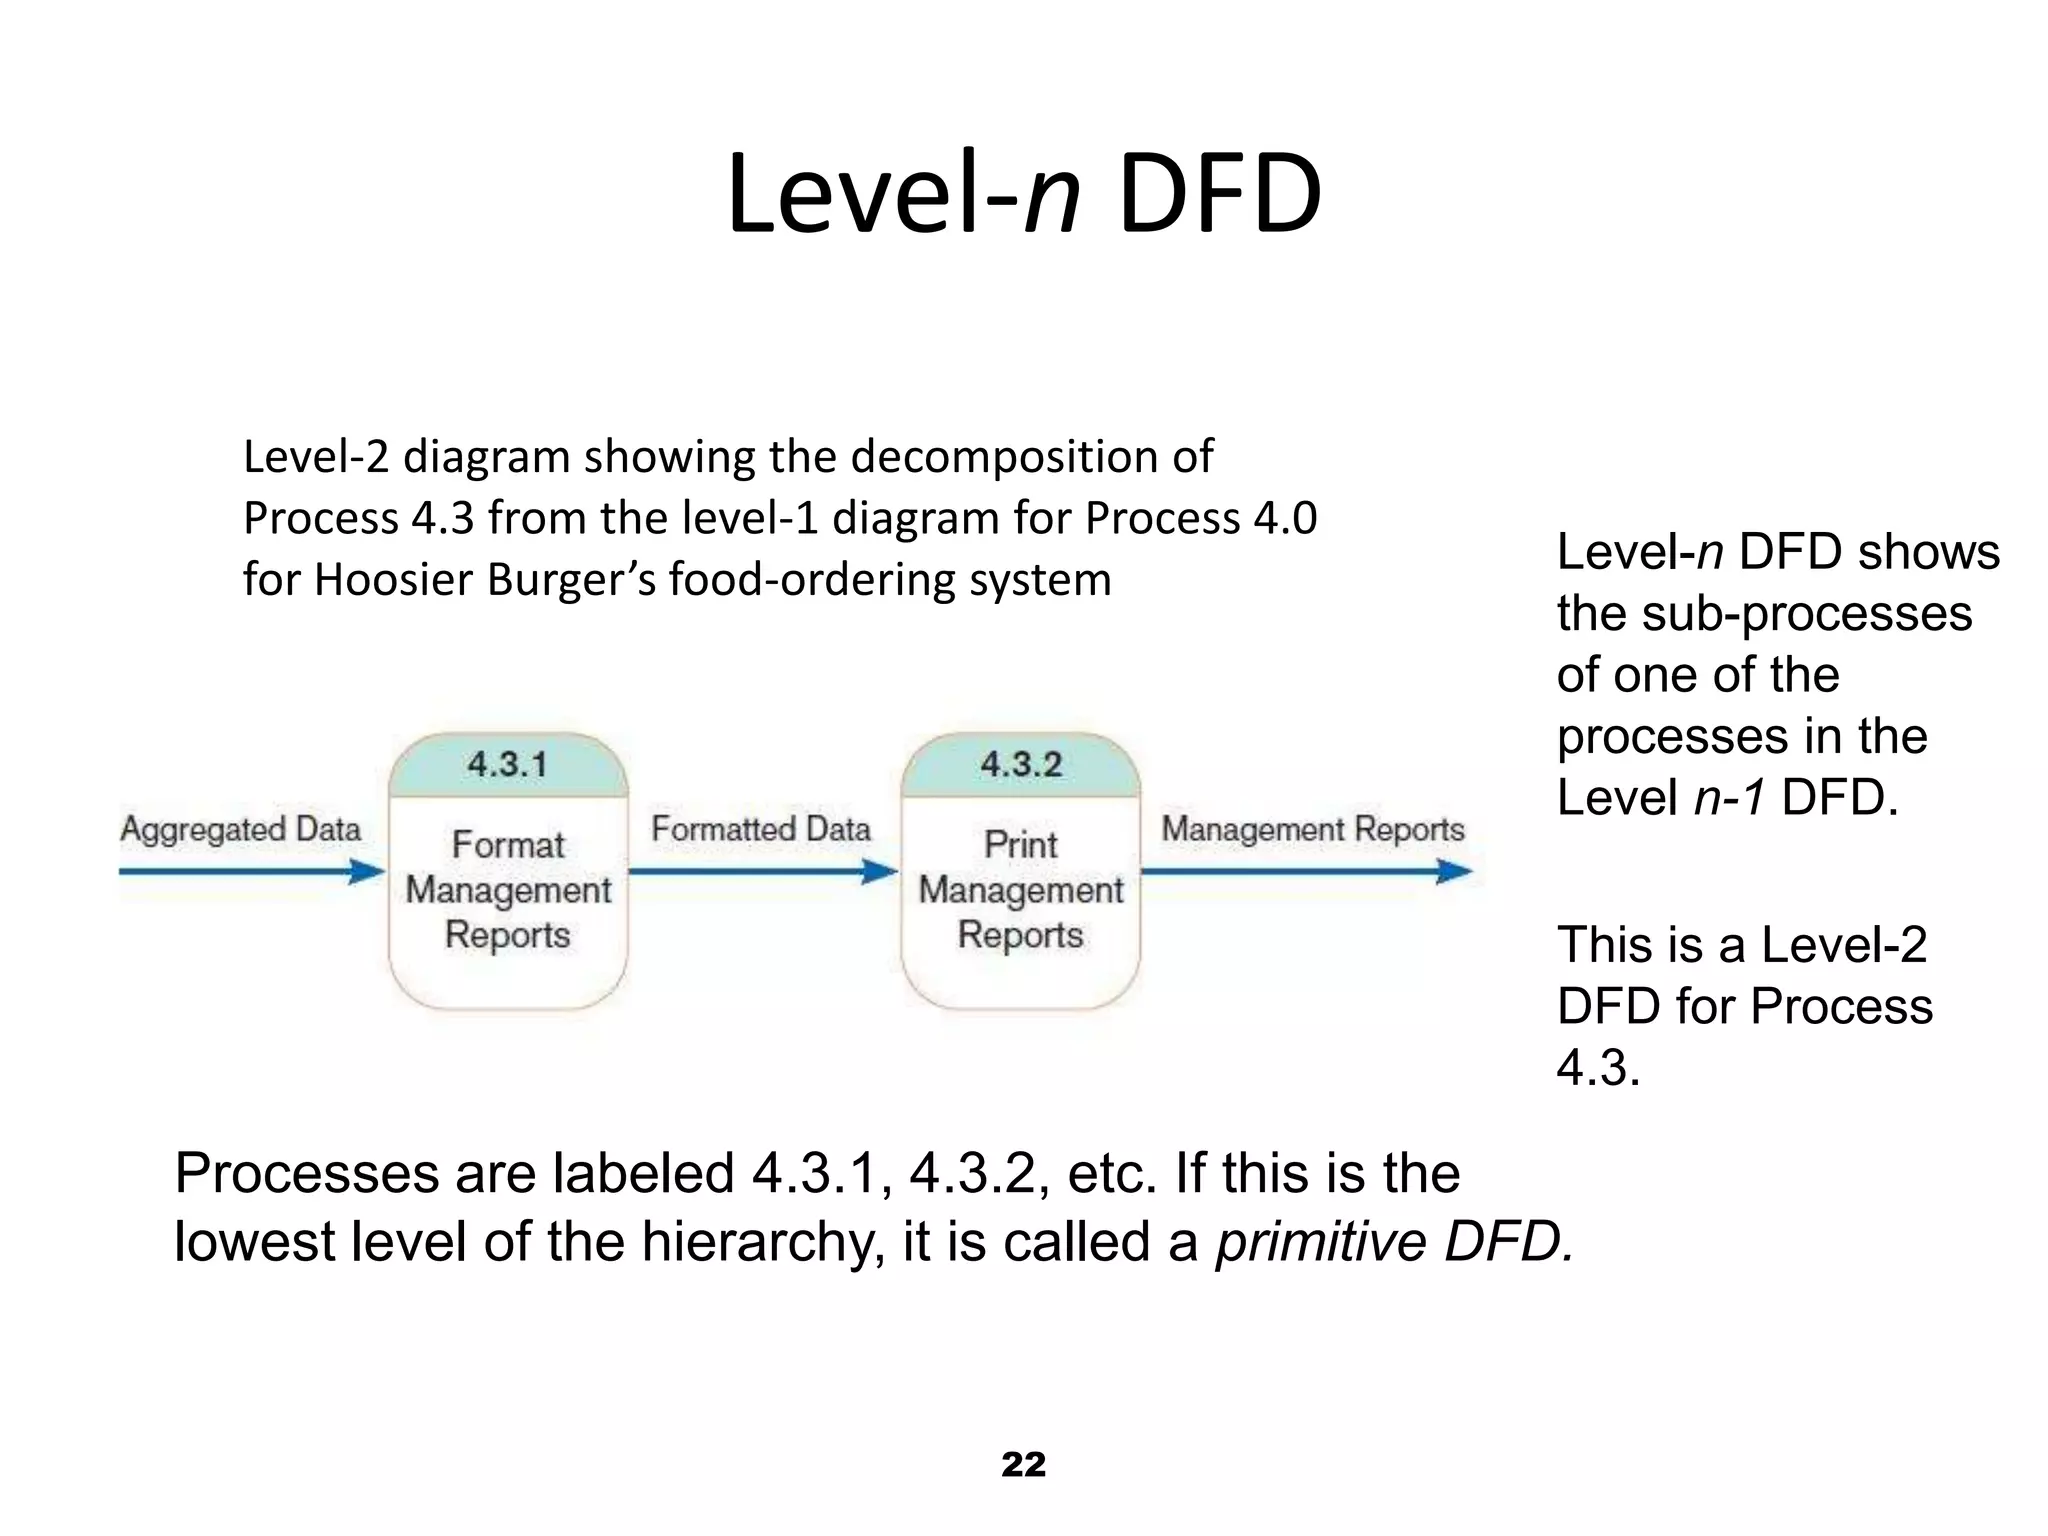
Details the SAD phase, covering system requirements, database design and data flow diagrams. Explains DFDs, types of DFDs, diagram rules, and the decomposition process in software development.
Explains DFDs, types of DFDs, diagram rules, and the decomposition process in software development.
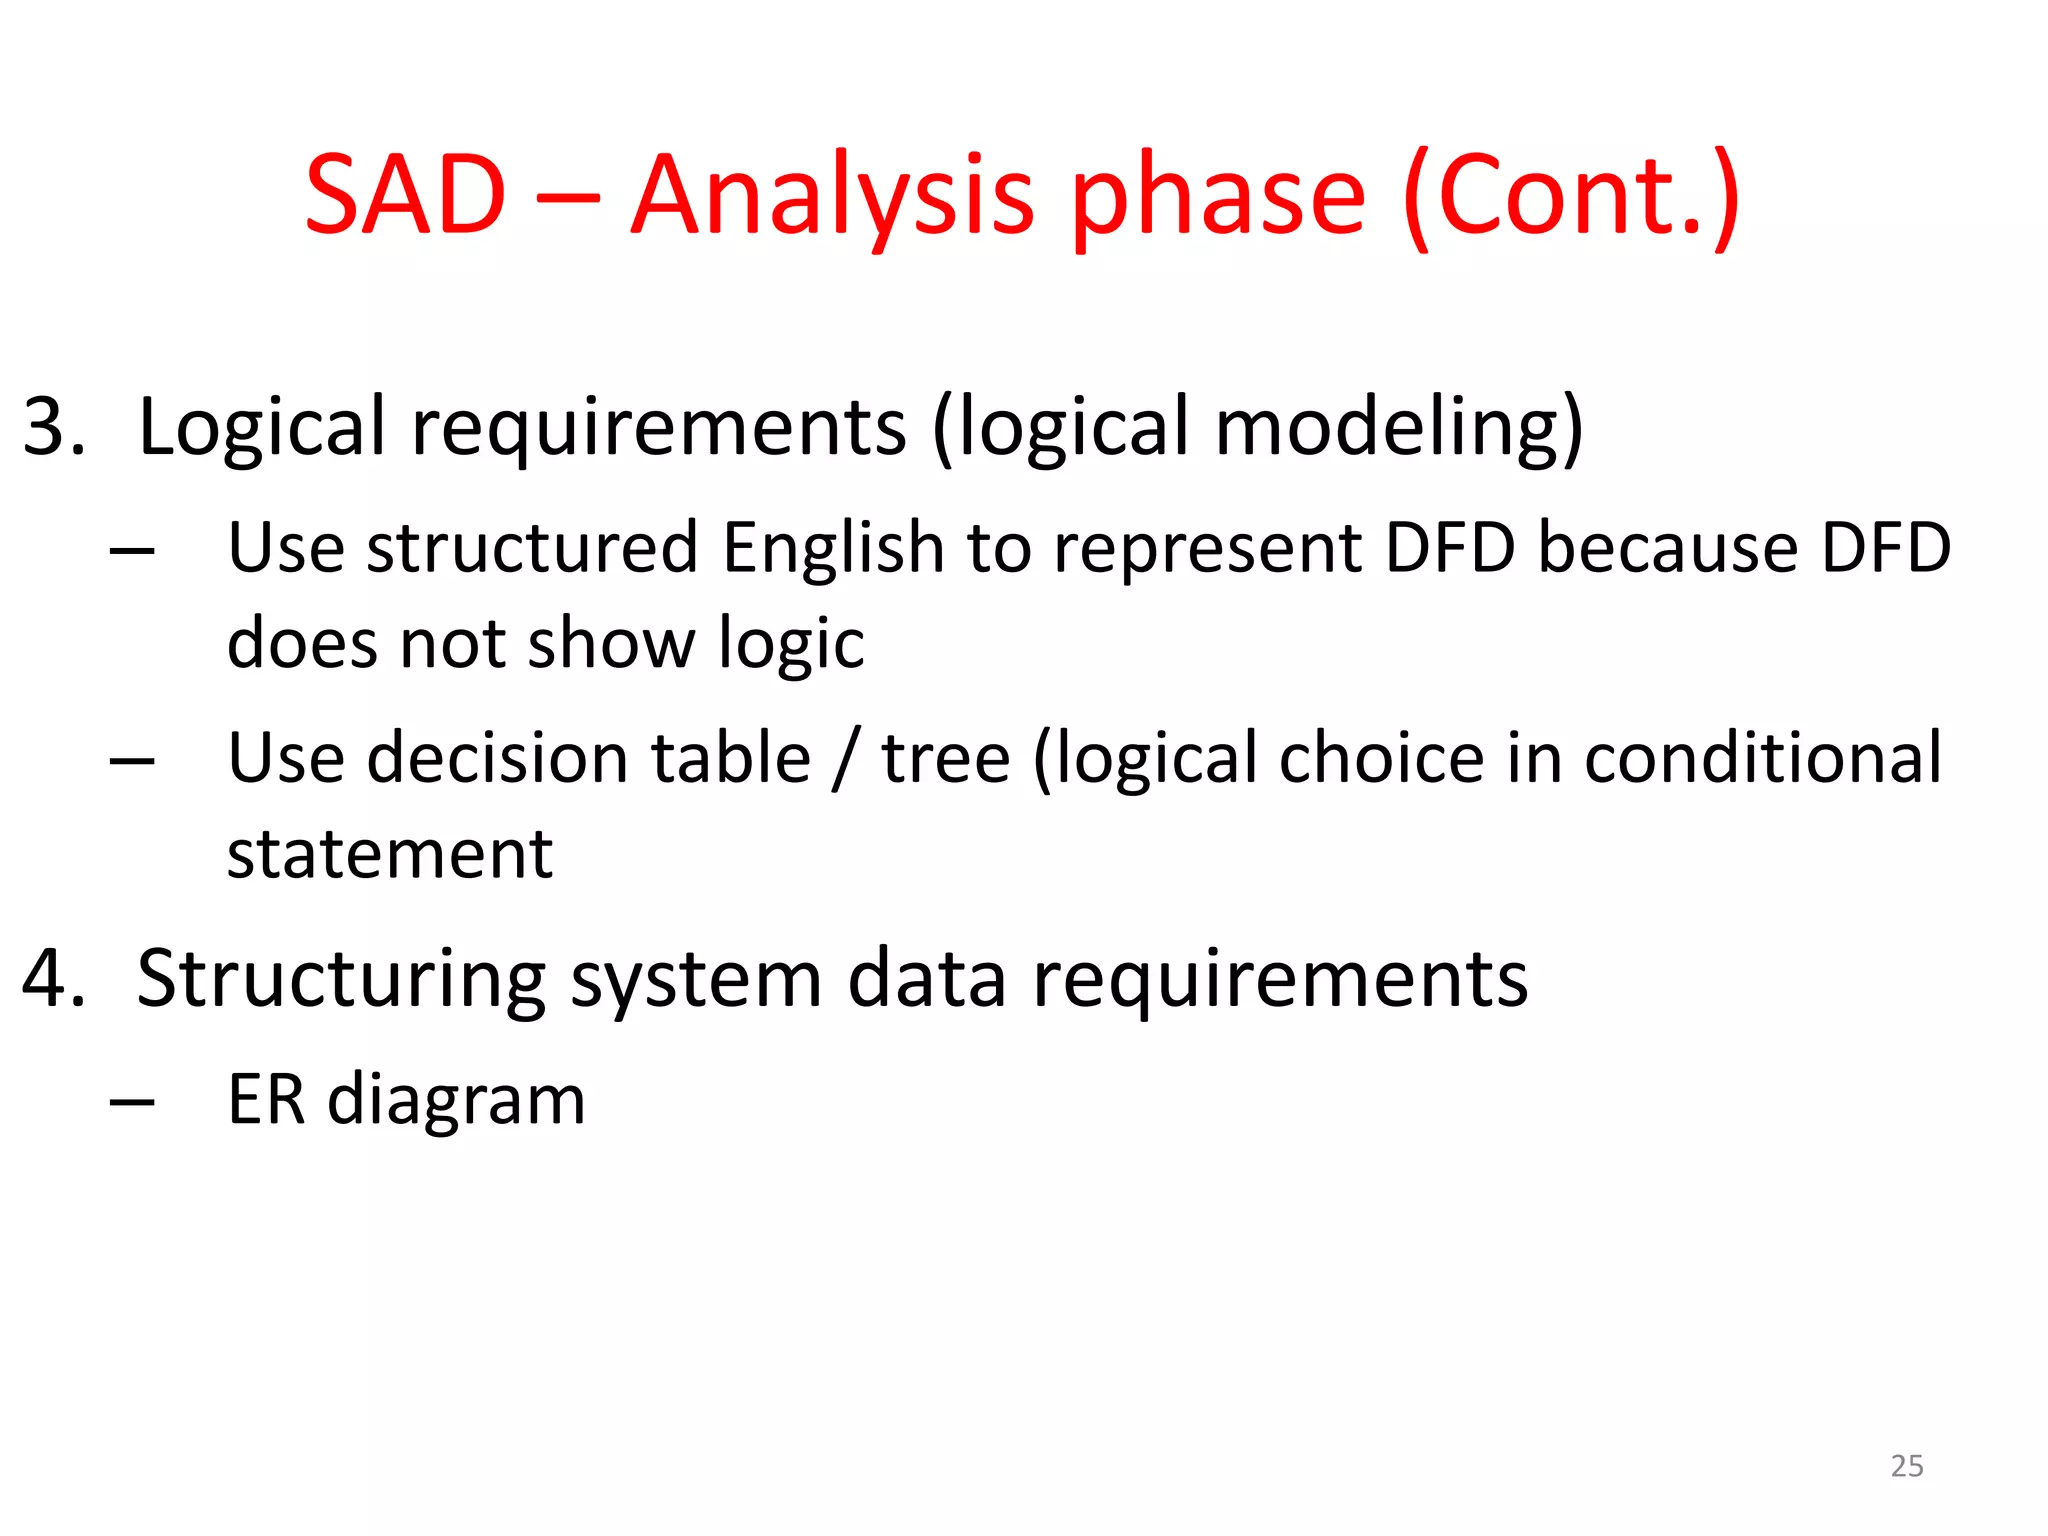
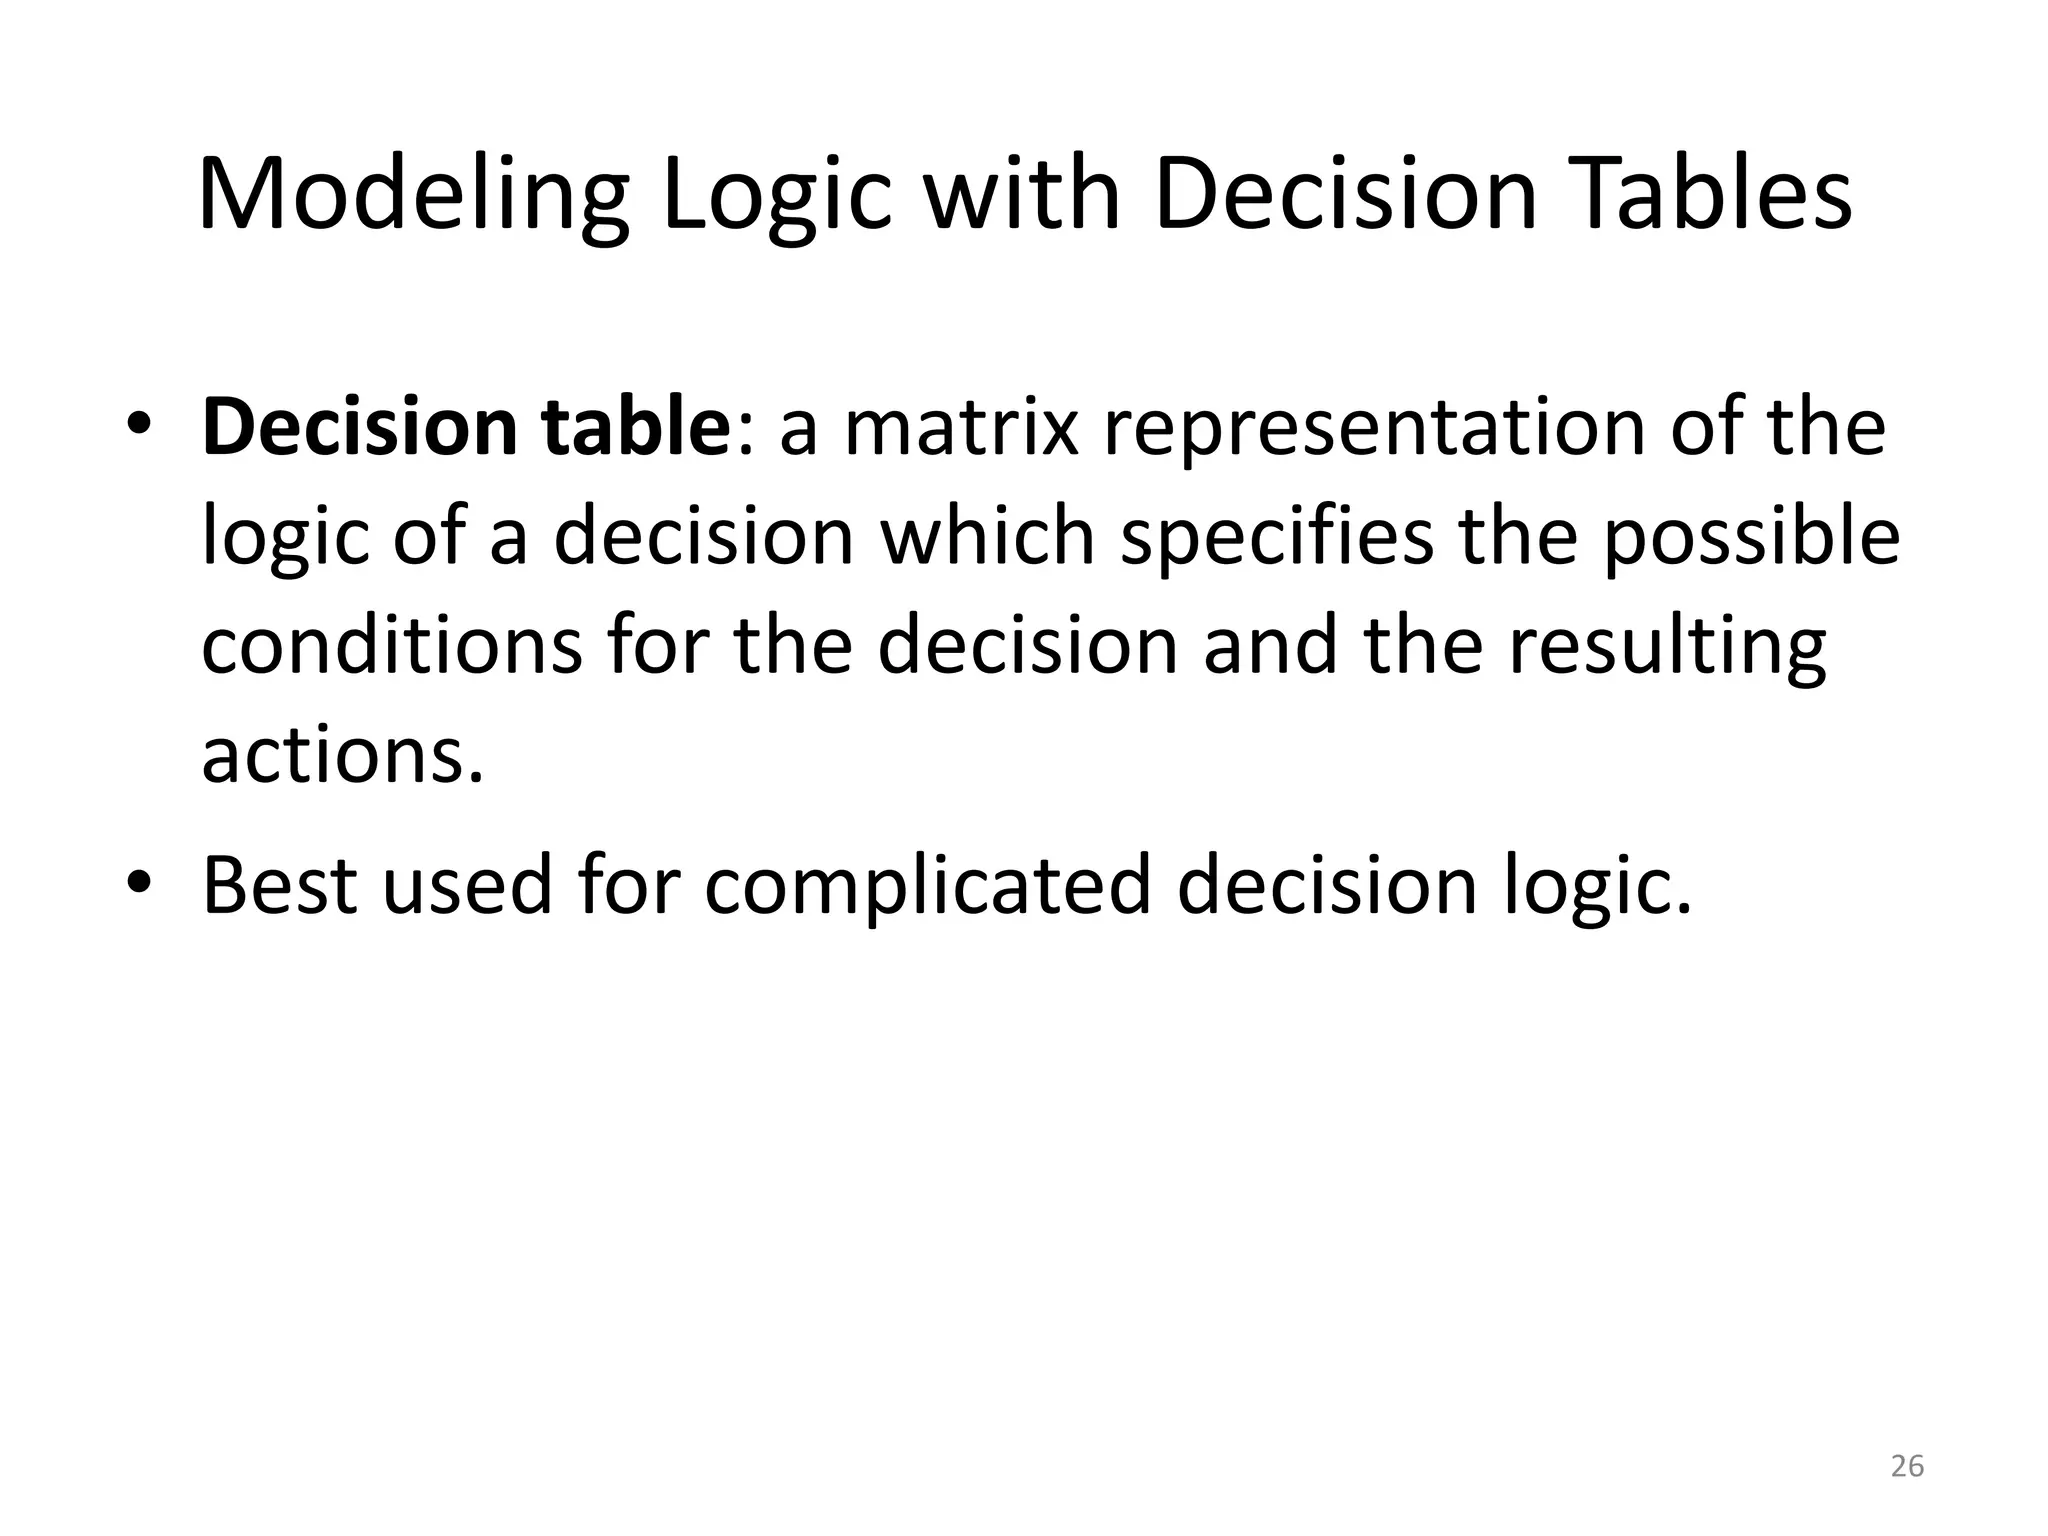
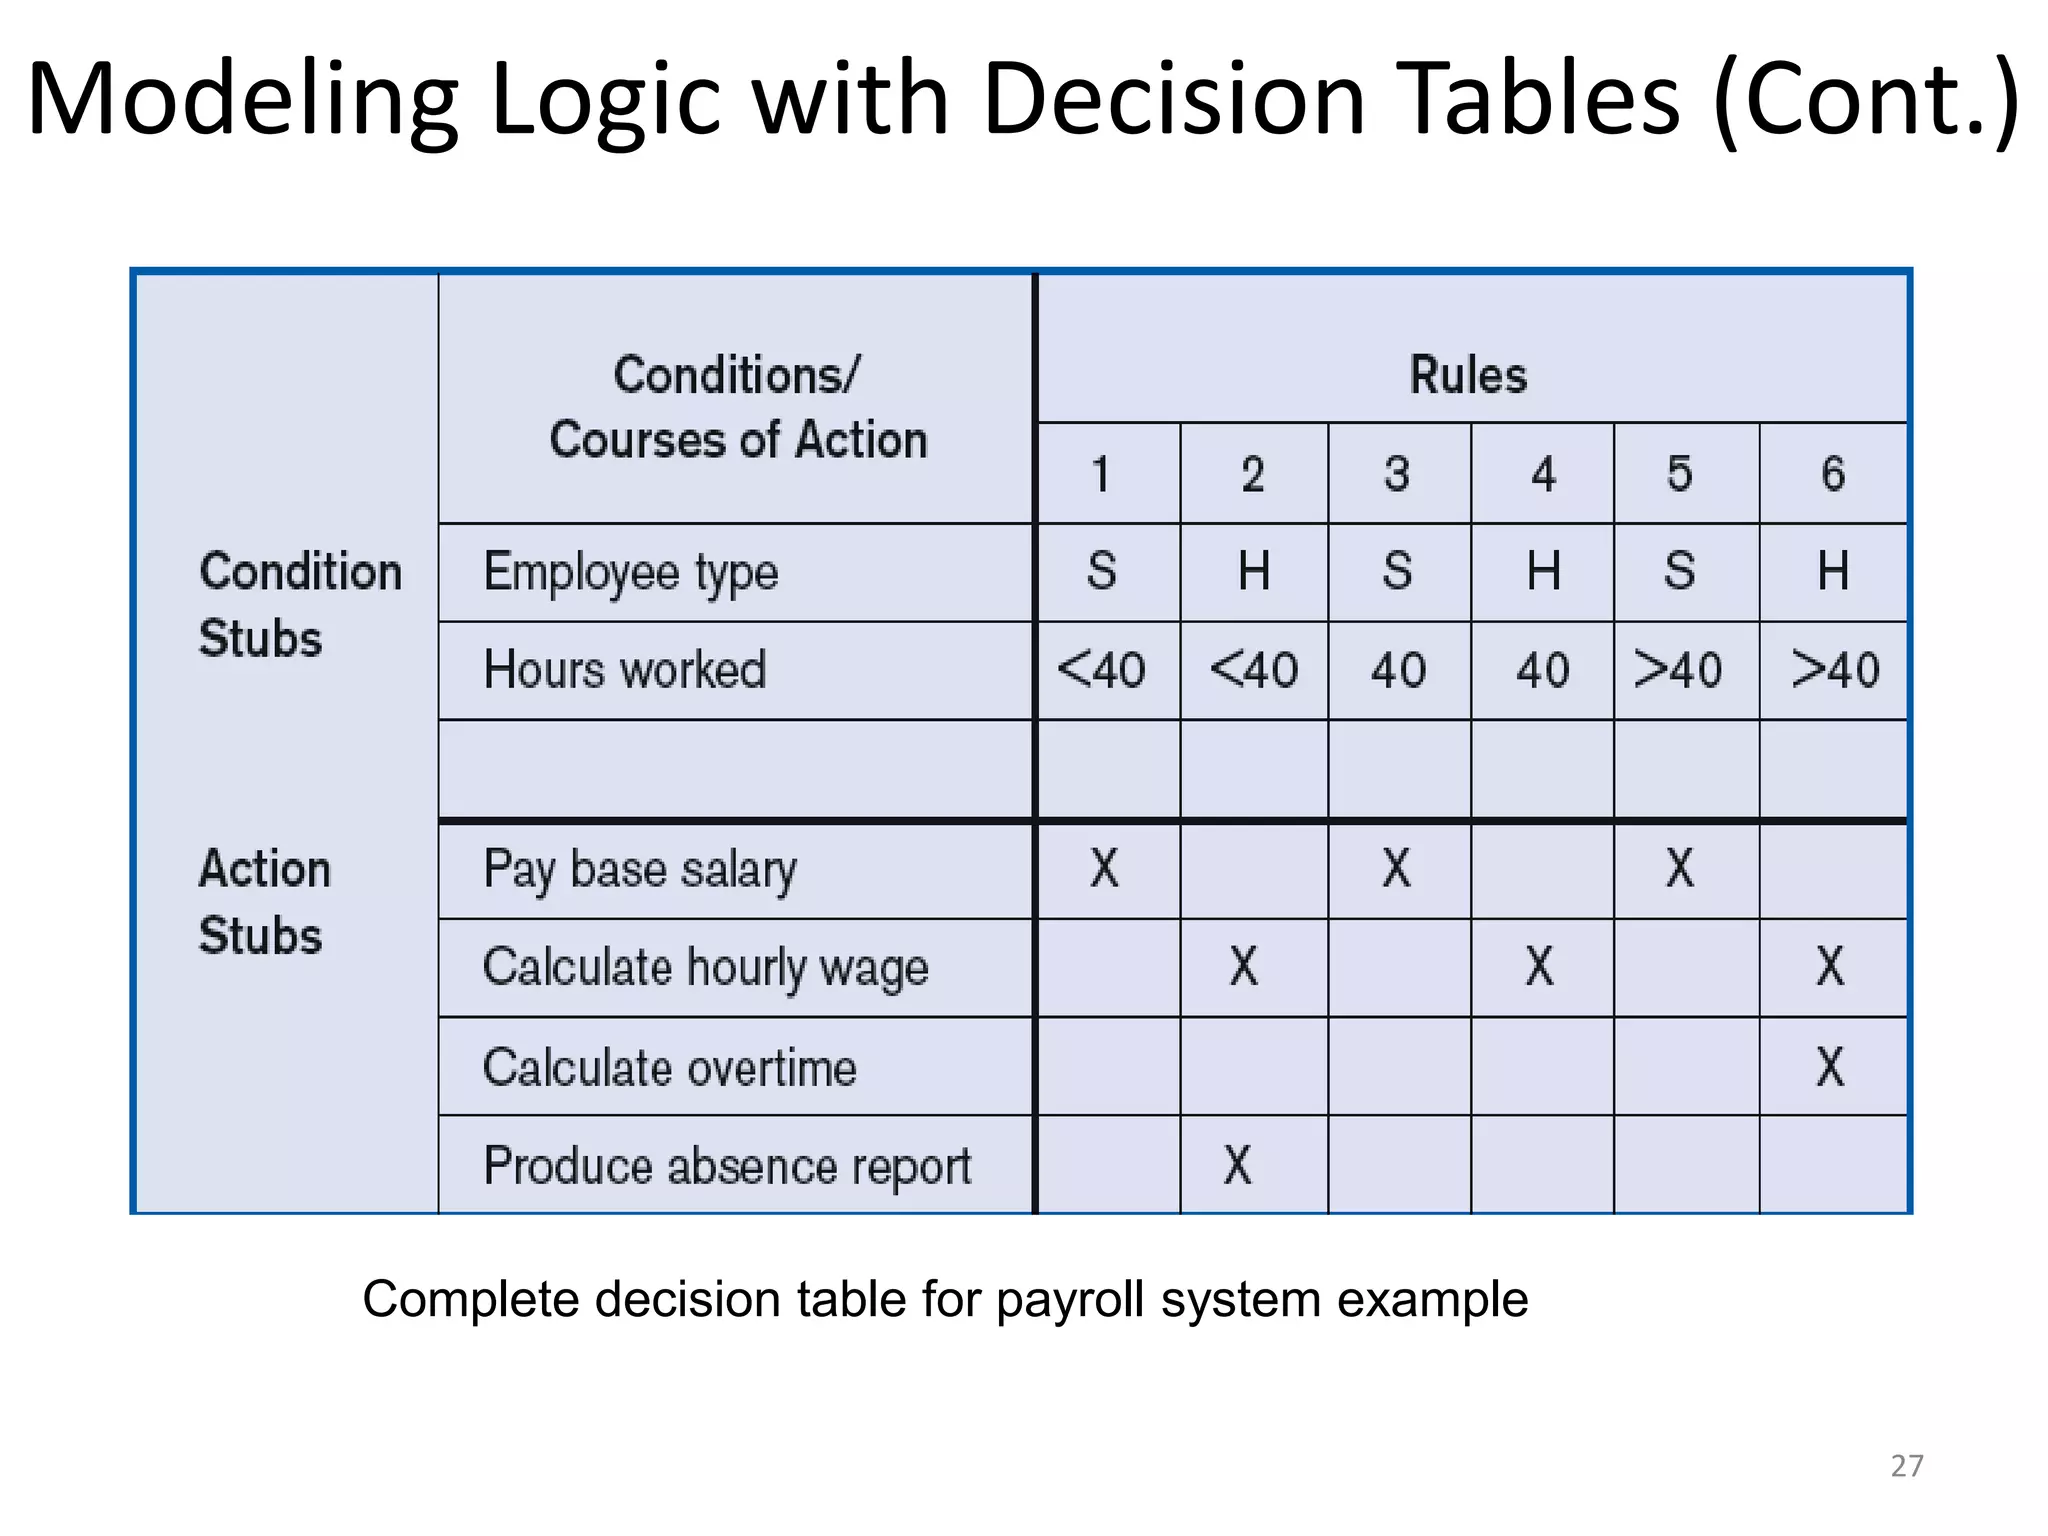
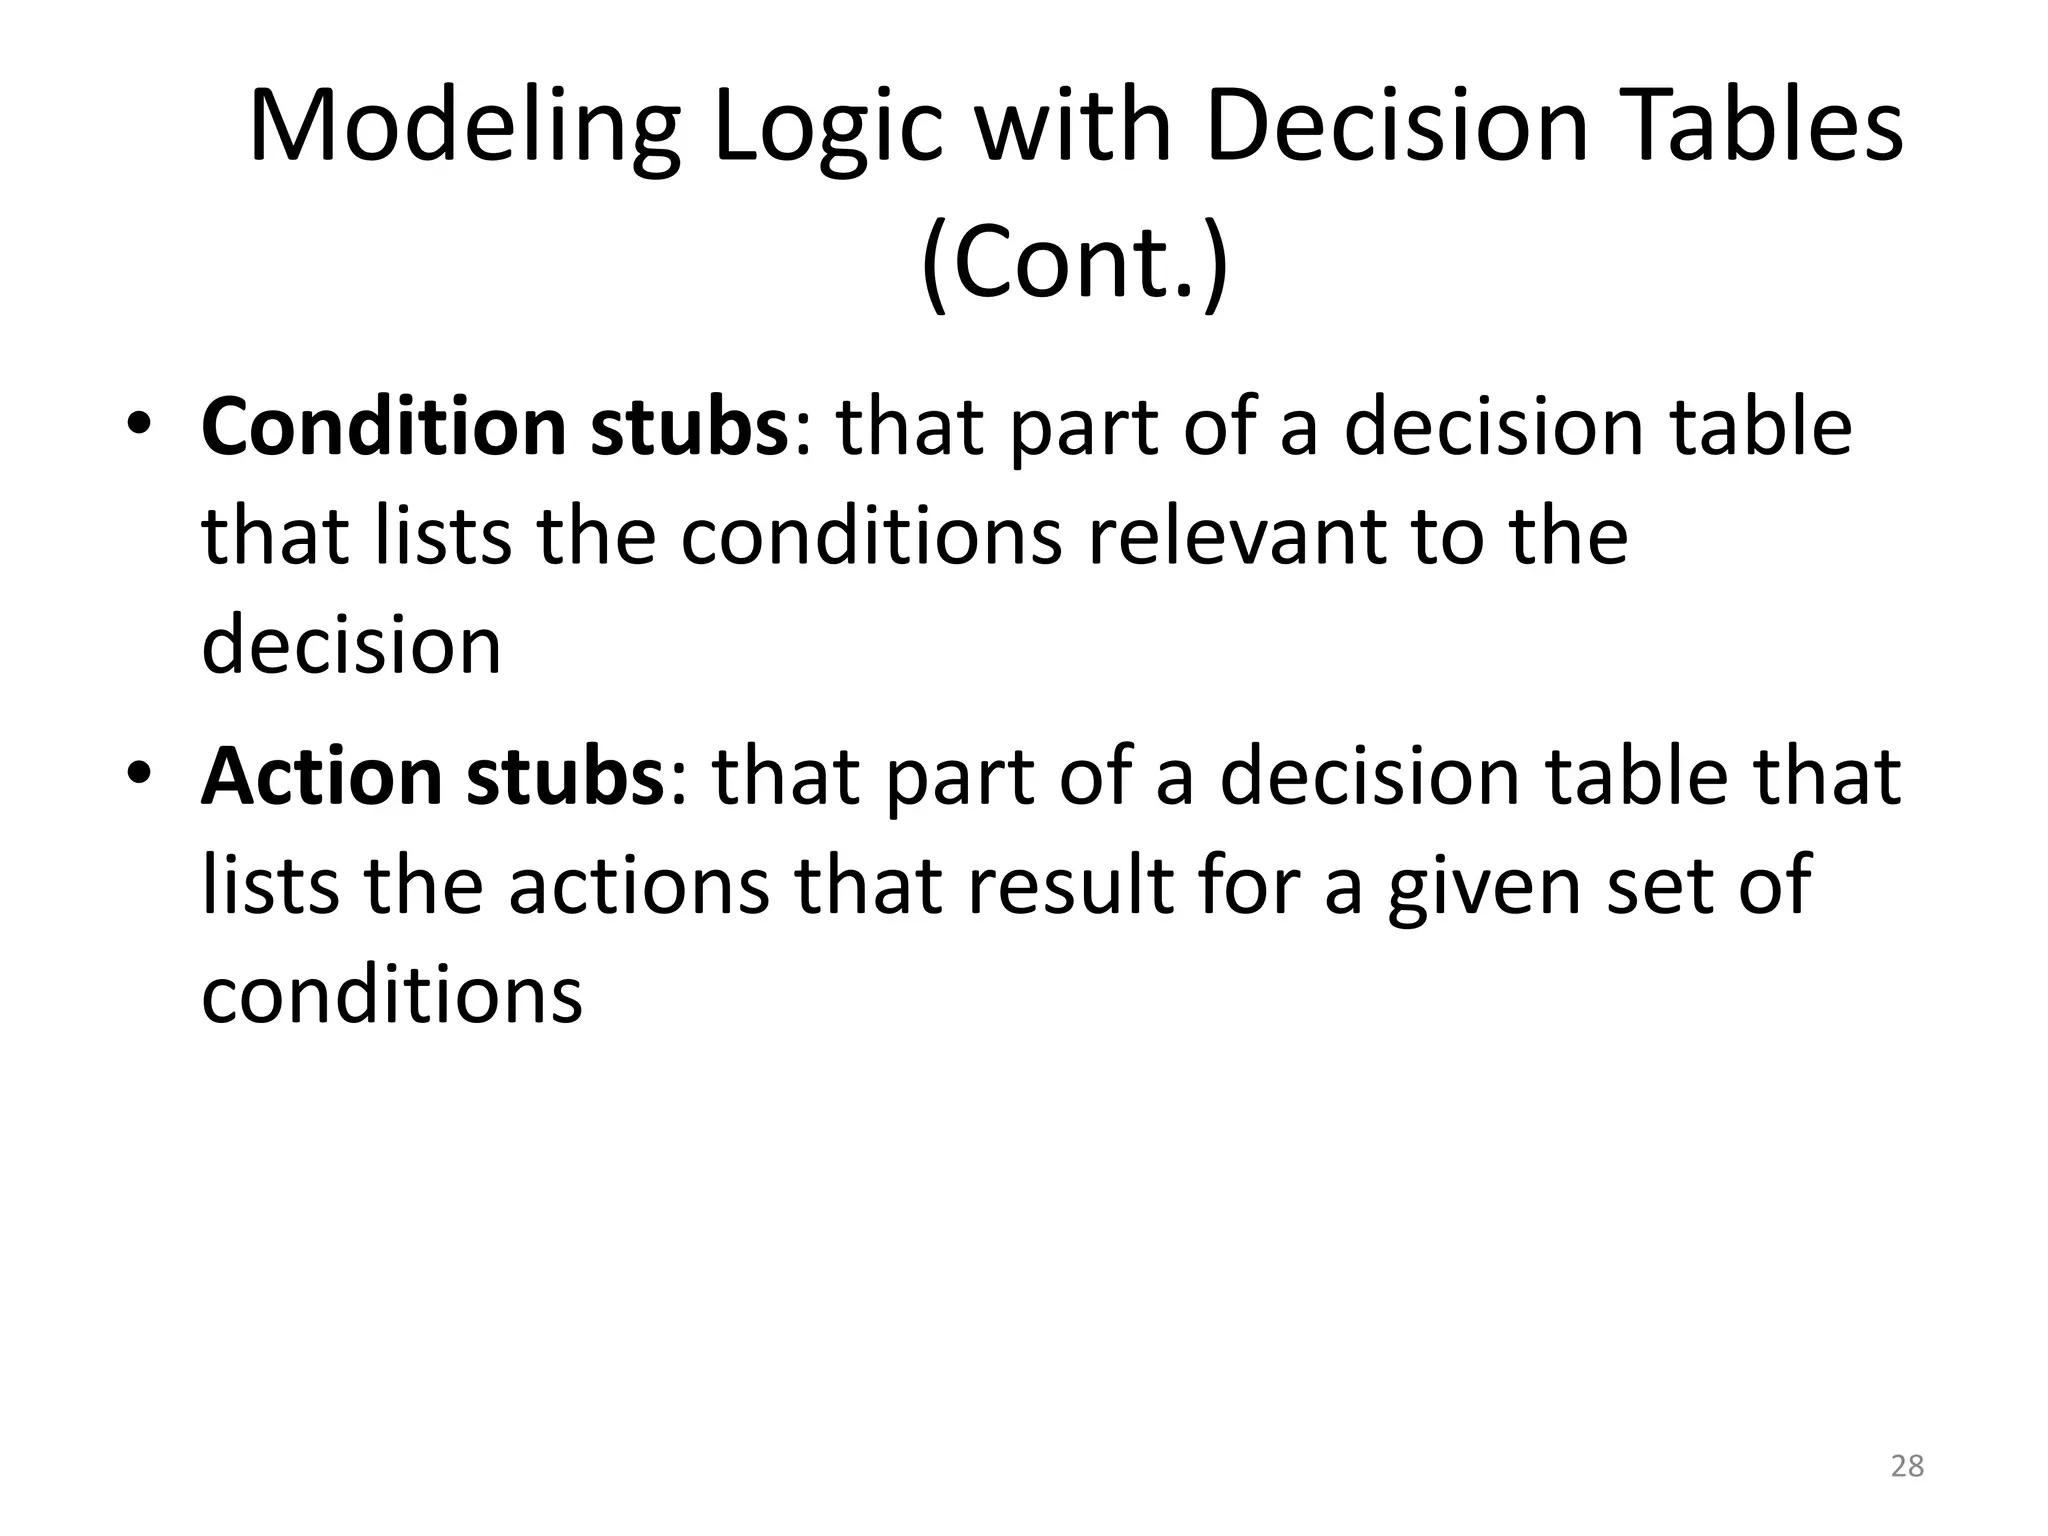
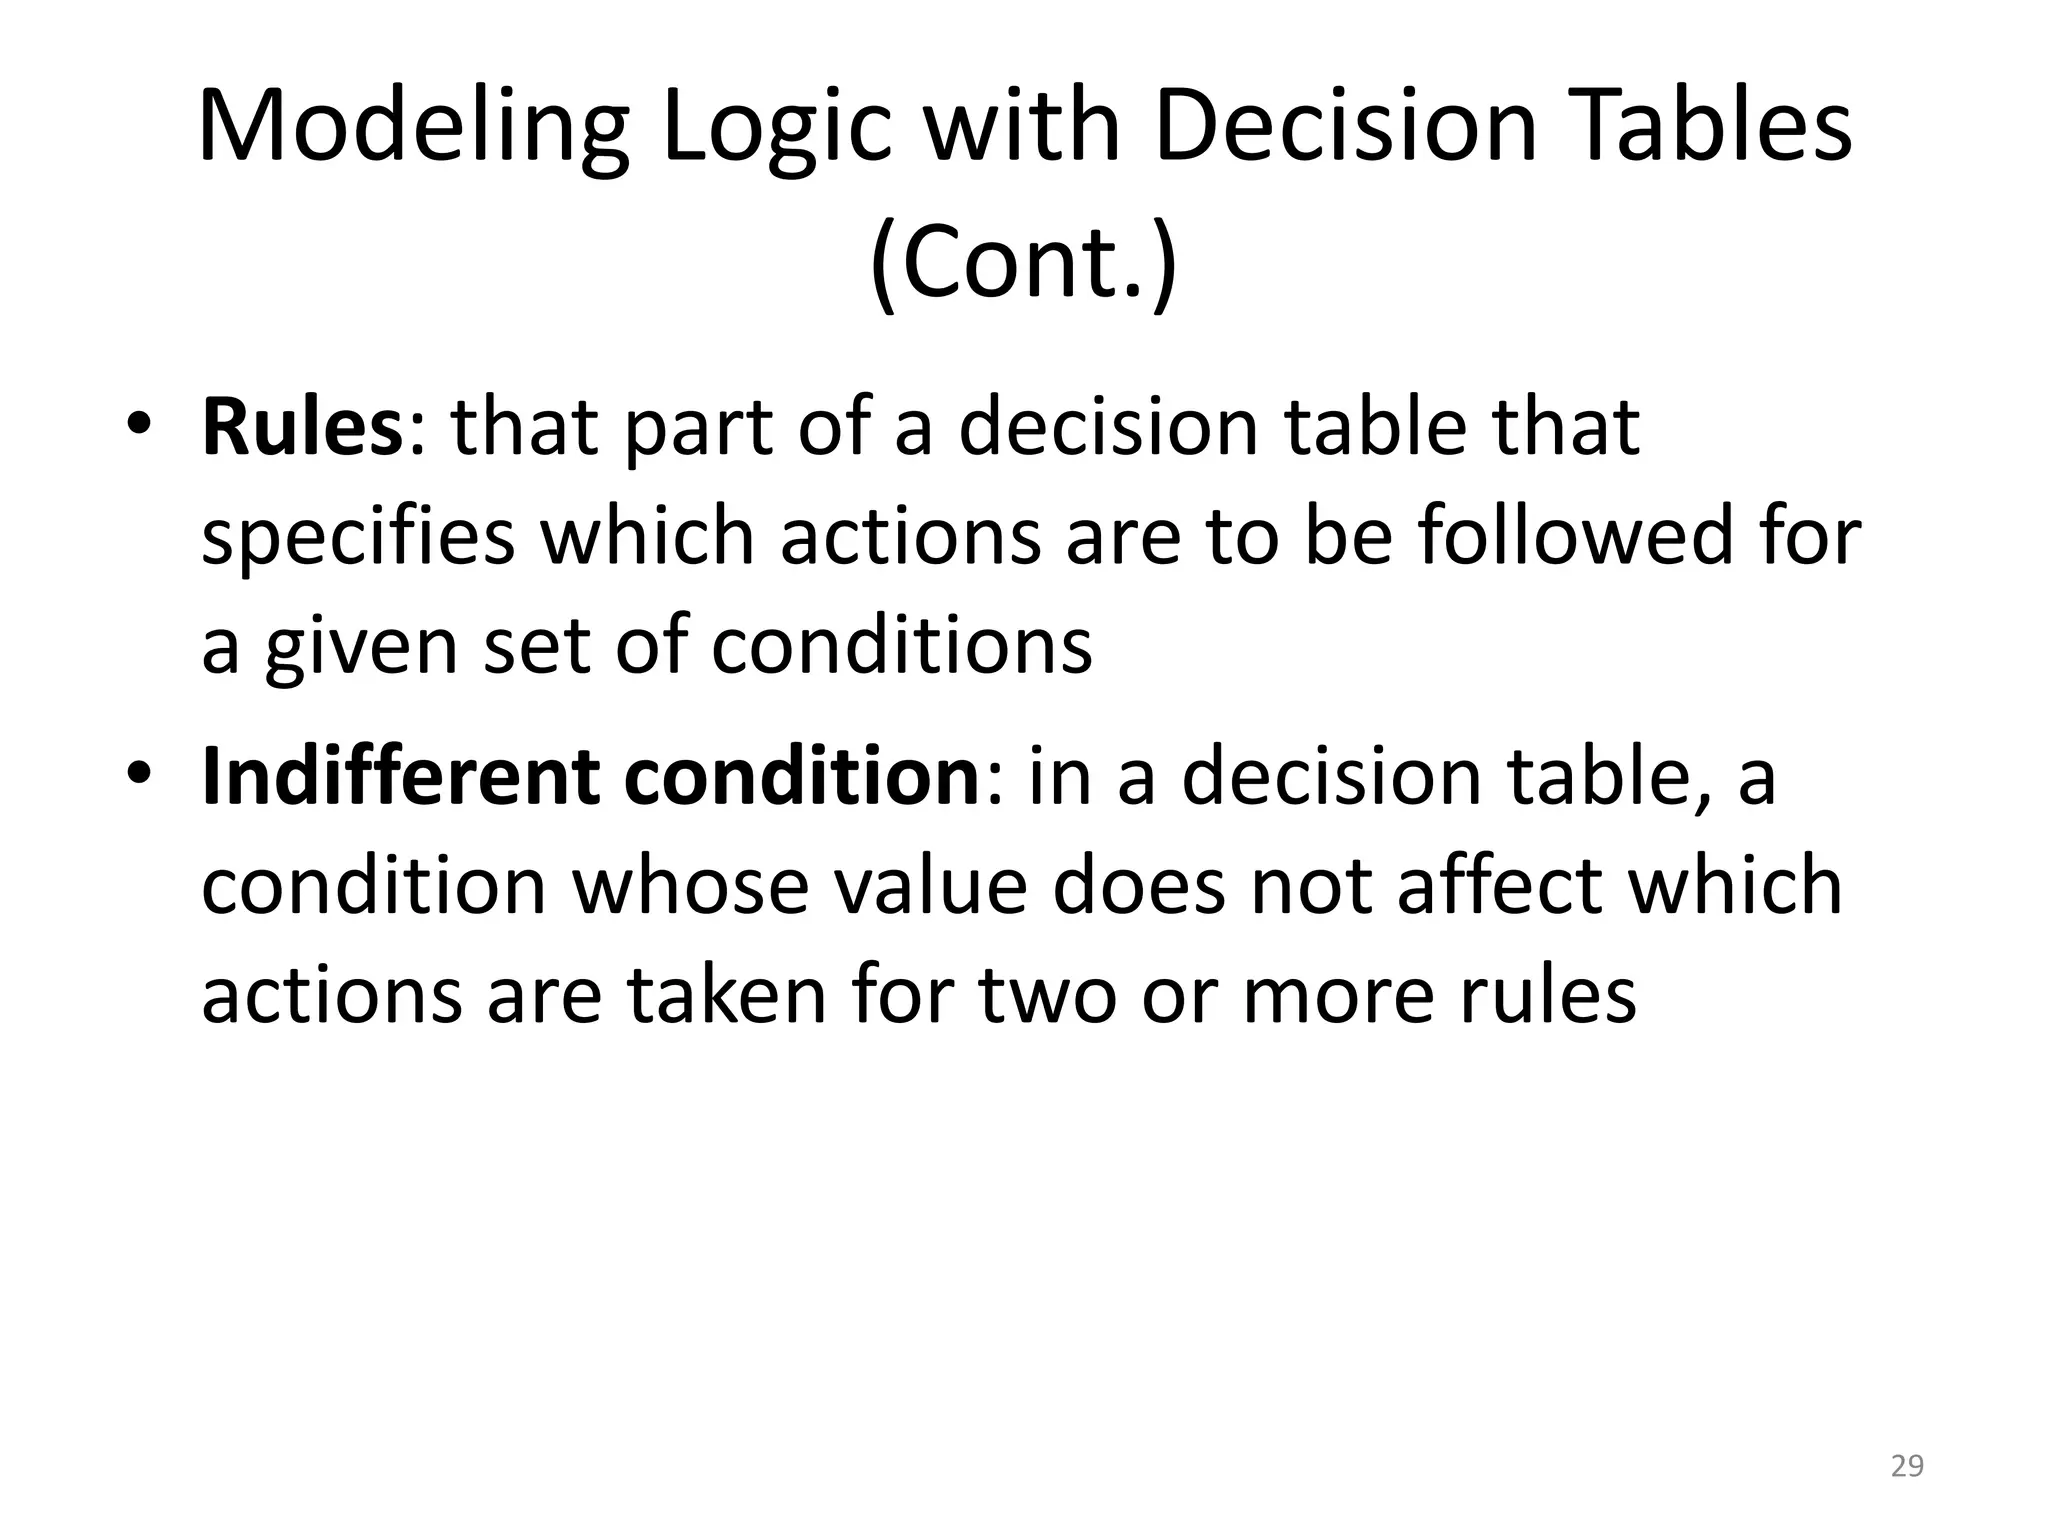
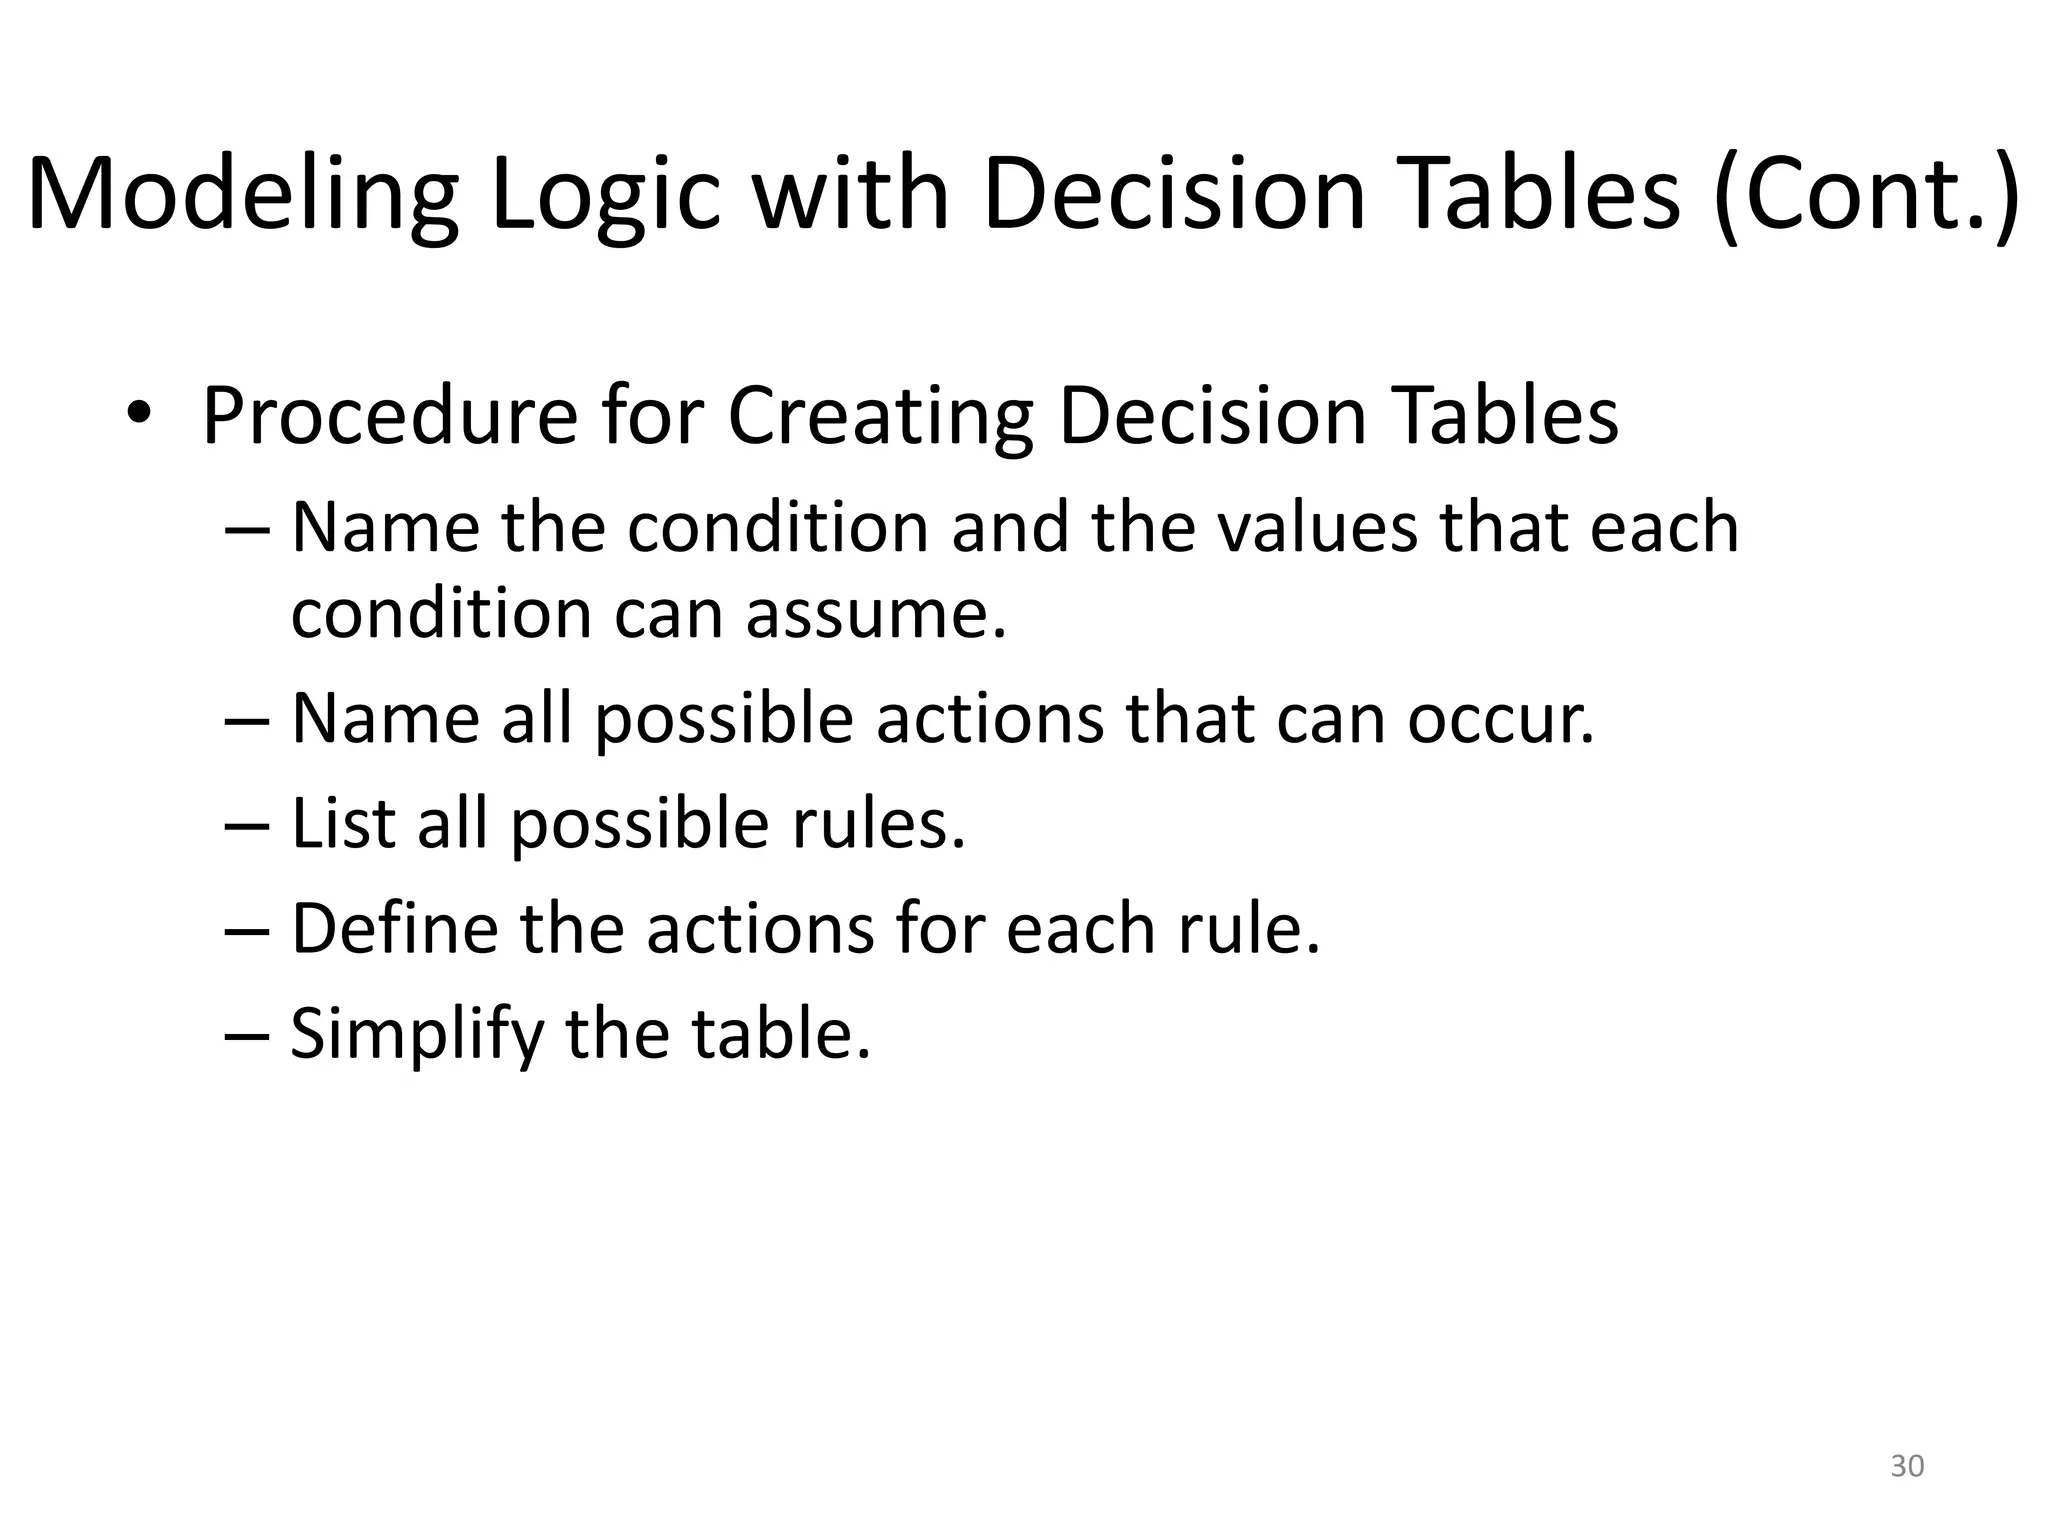
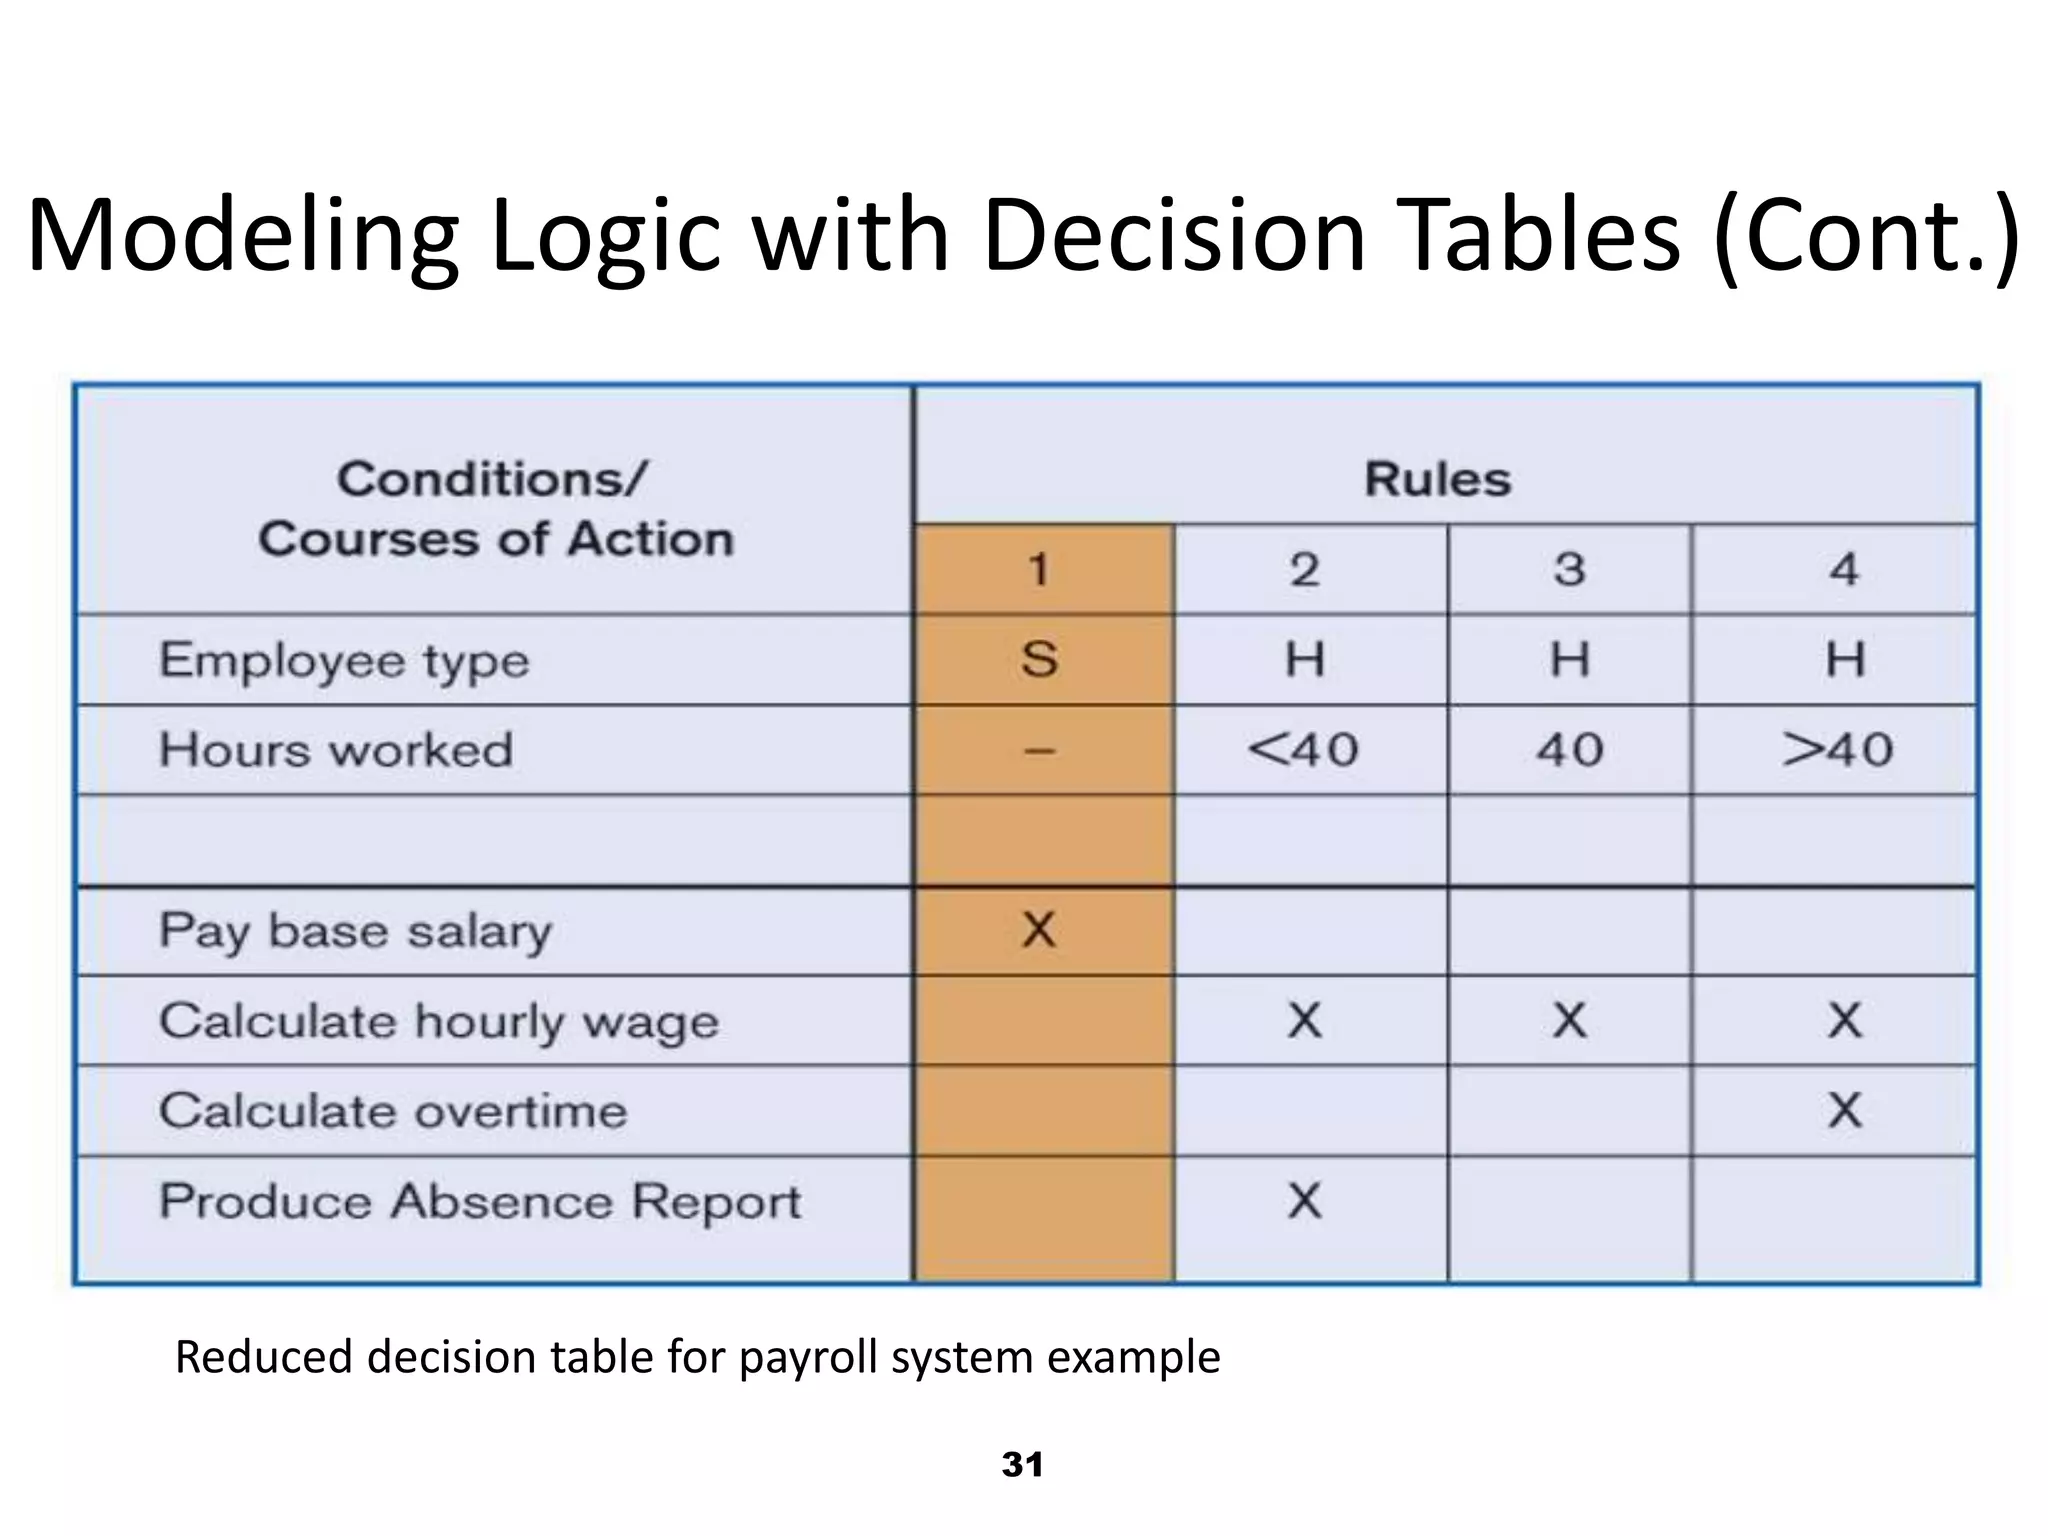
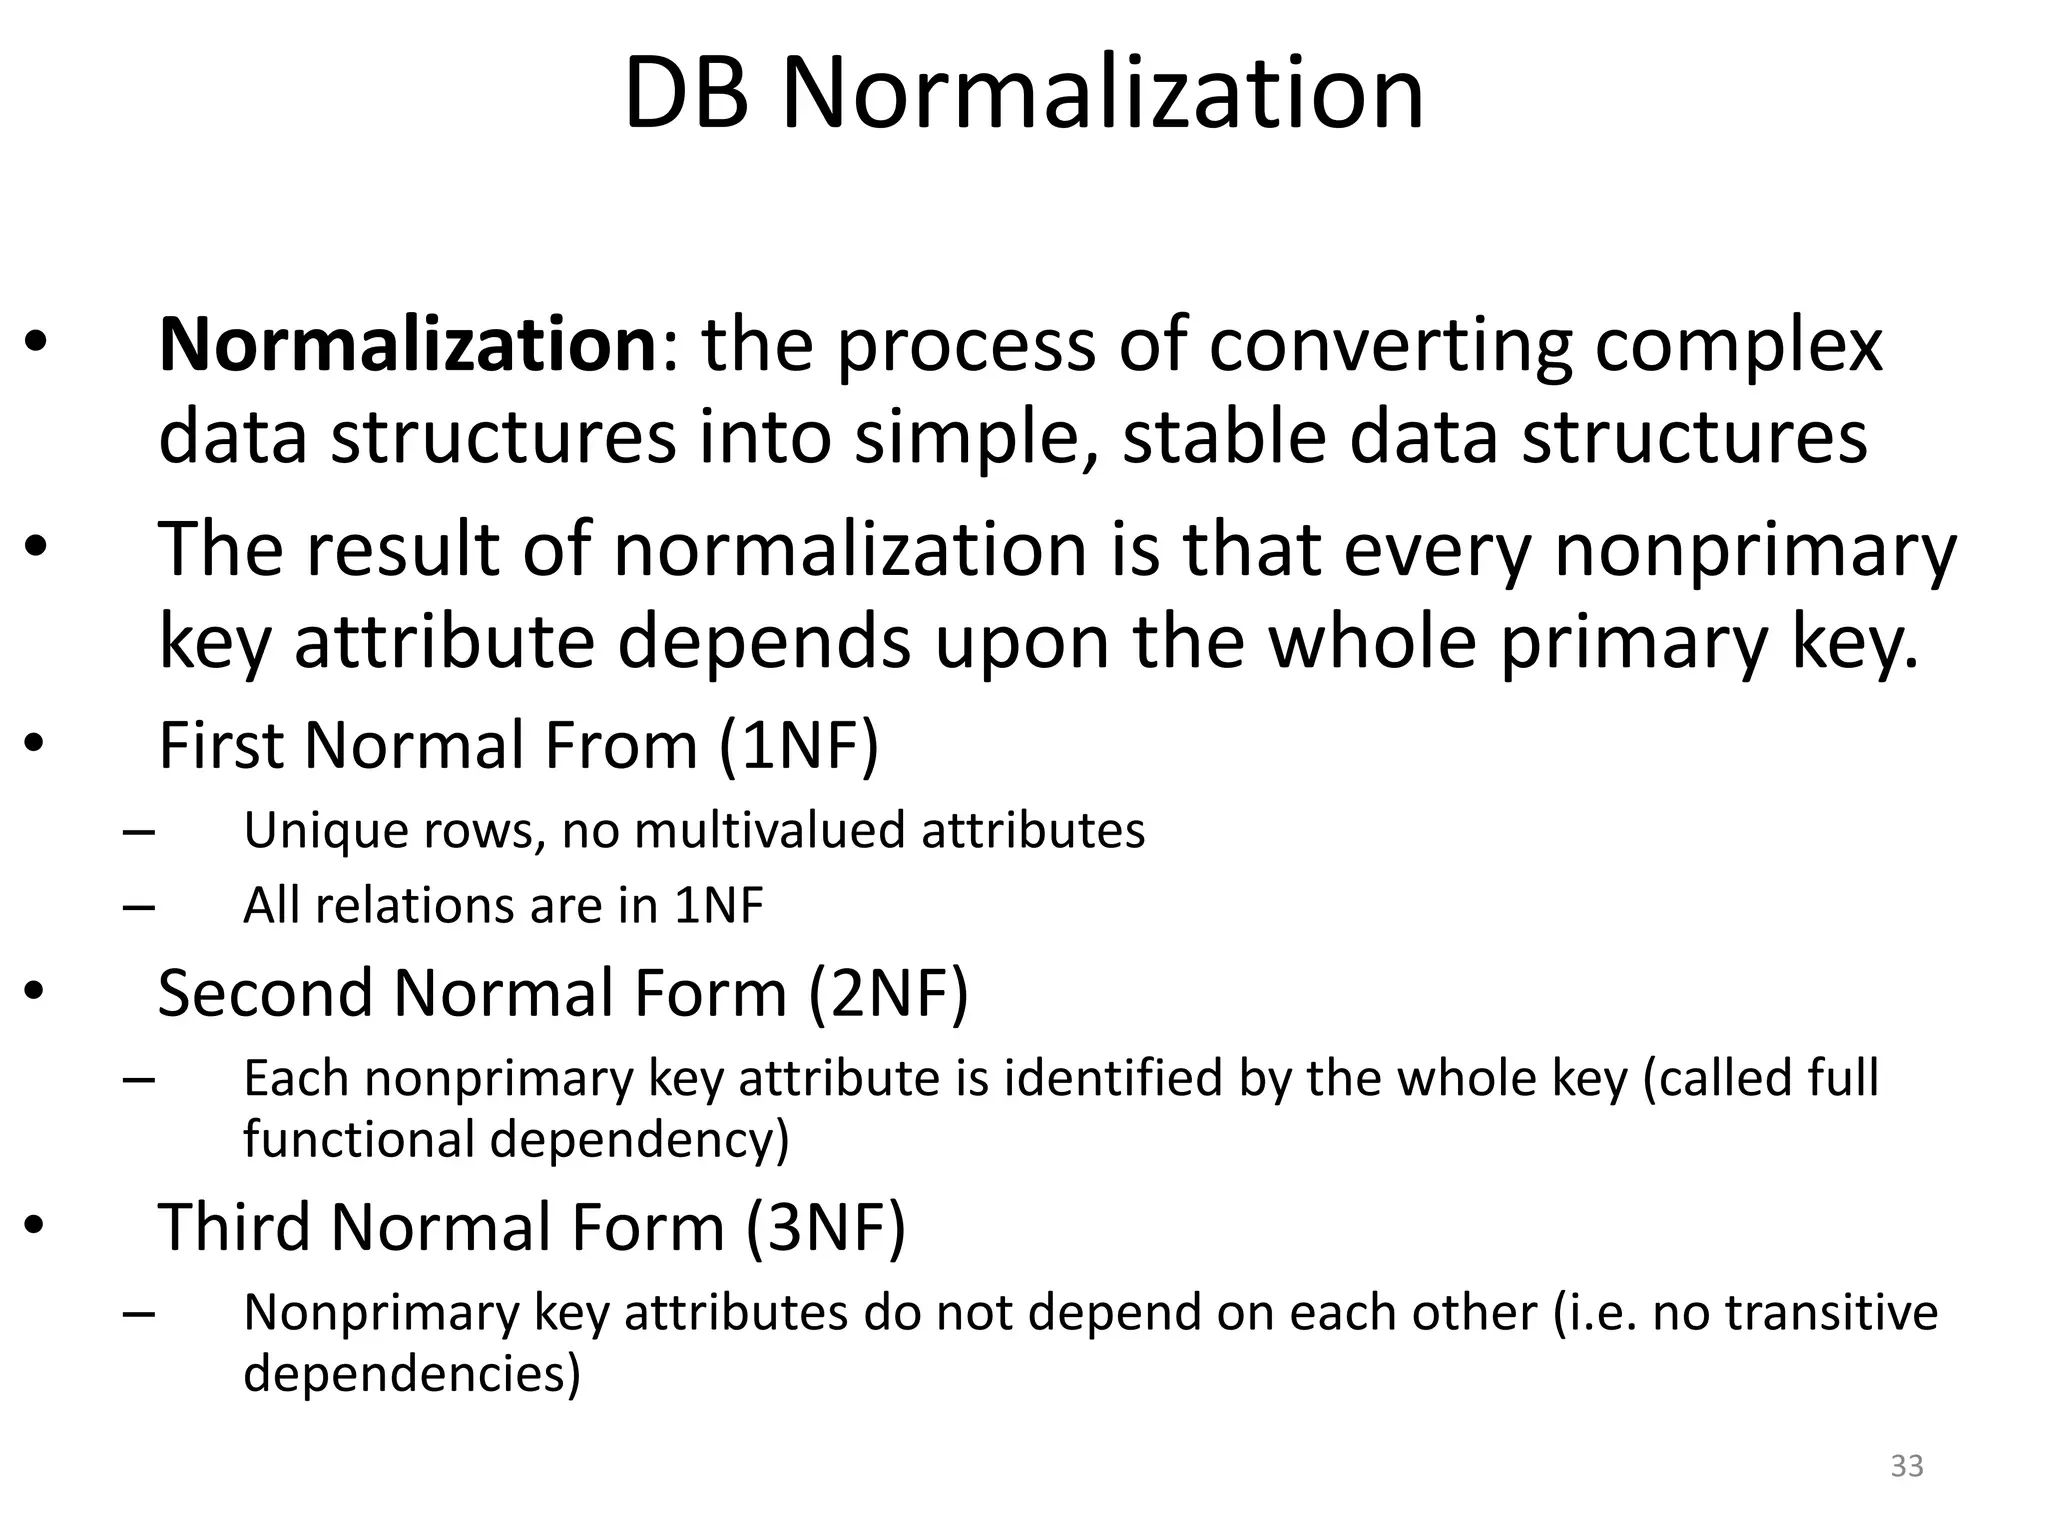
Details the SAD phase, covering system requirements, database design and data flow diagrams. Introduces decision tables for modeling logic during the SAD design phase, emphasizing DB design.
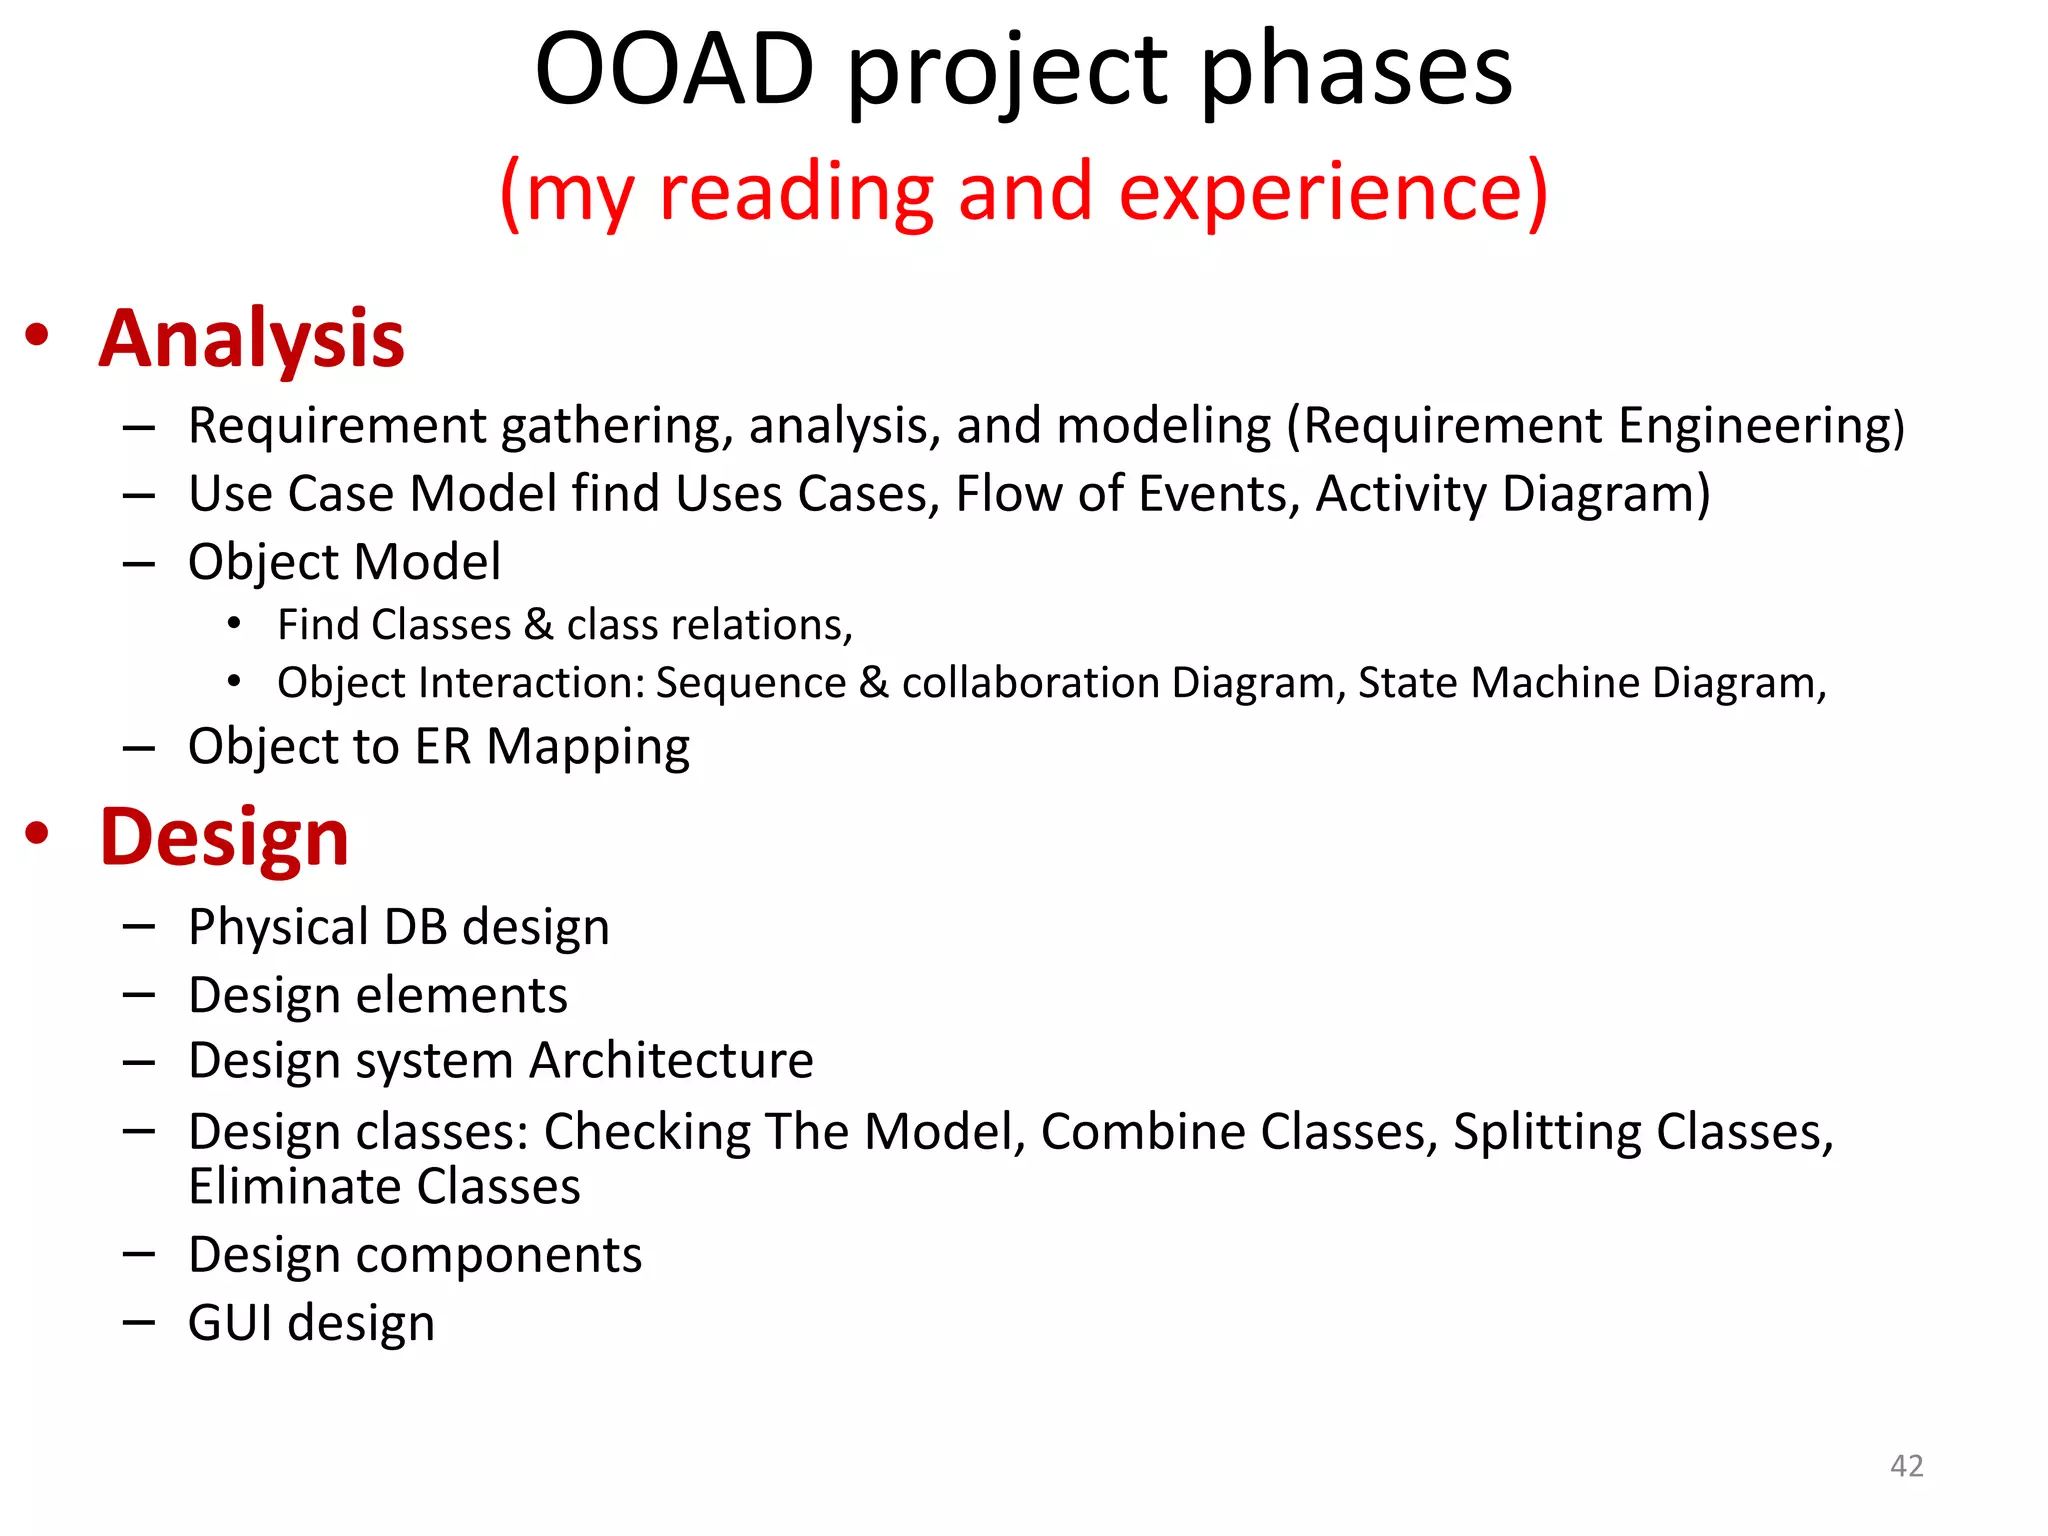
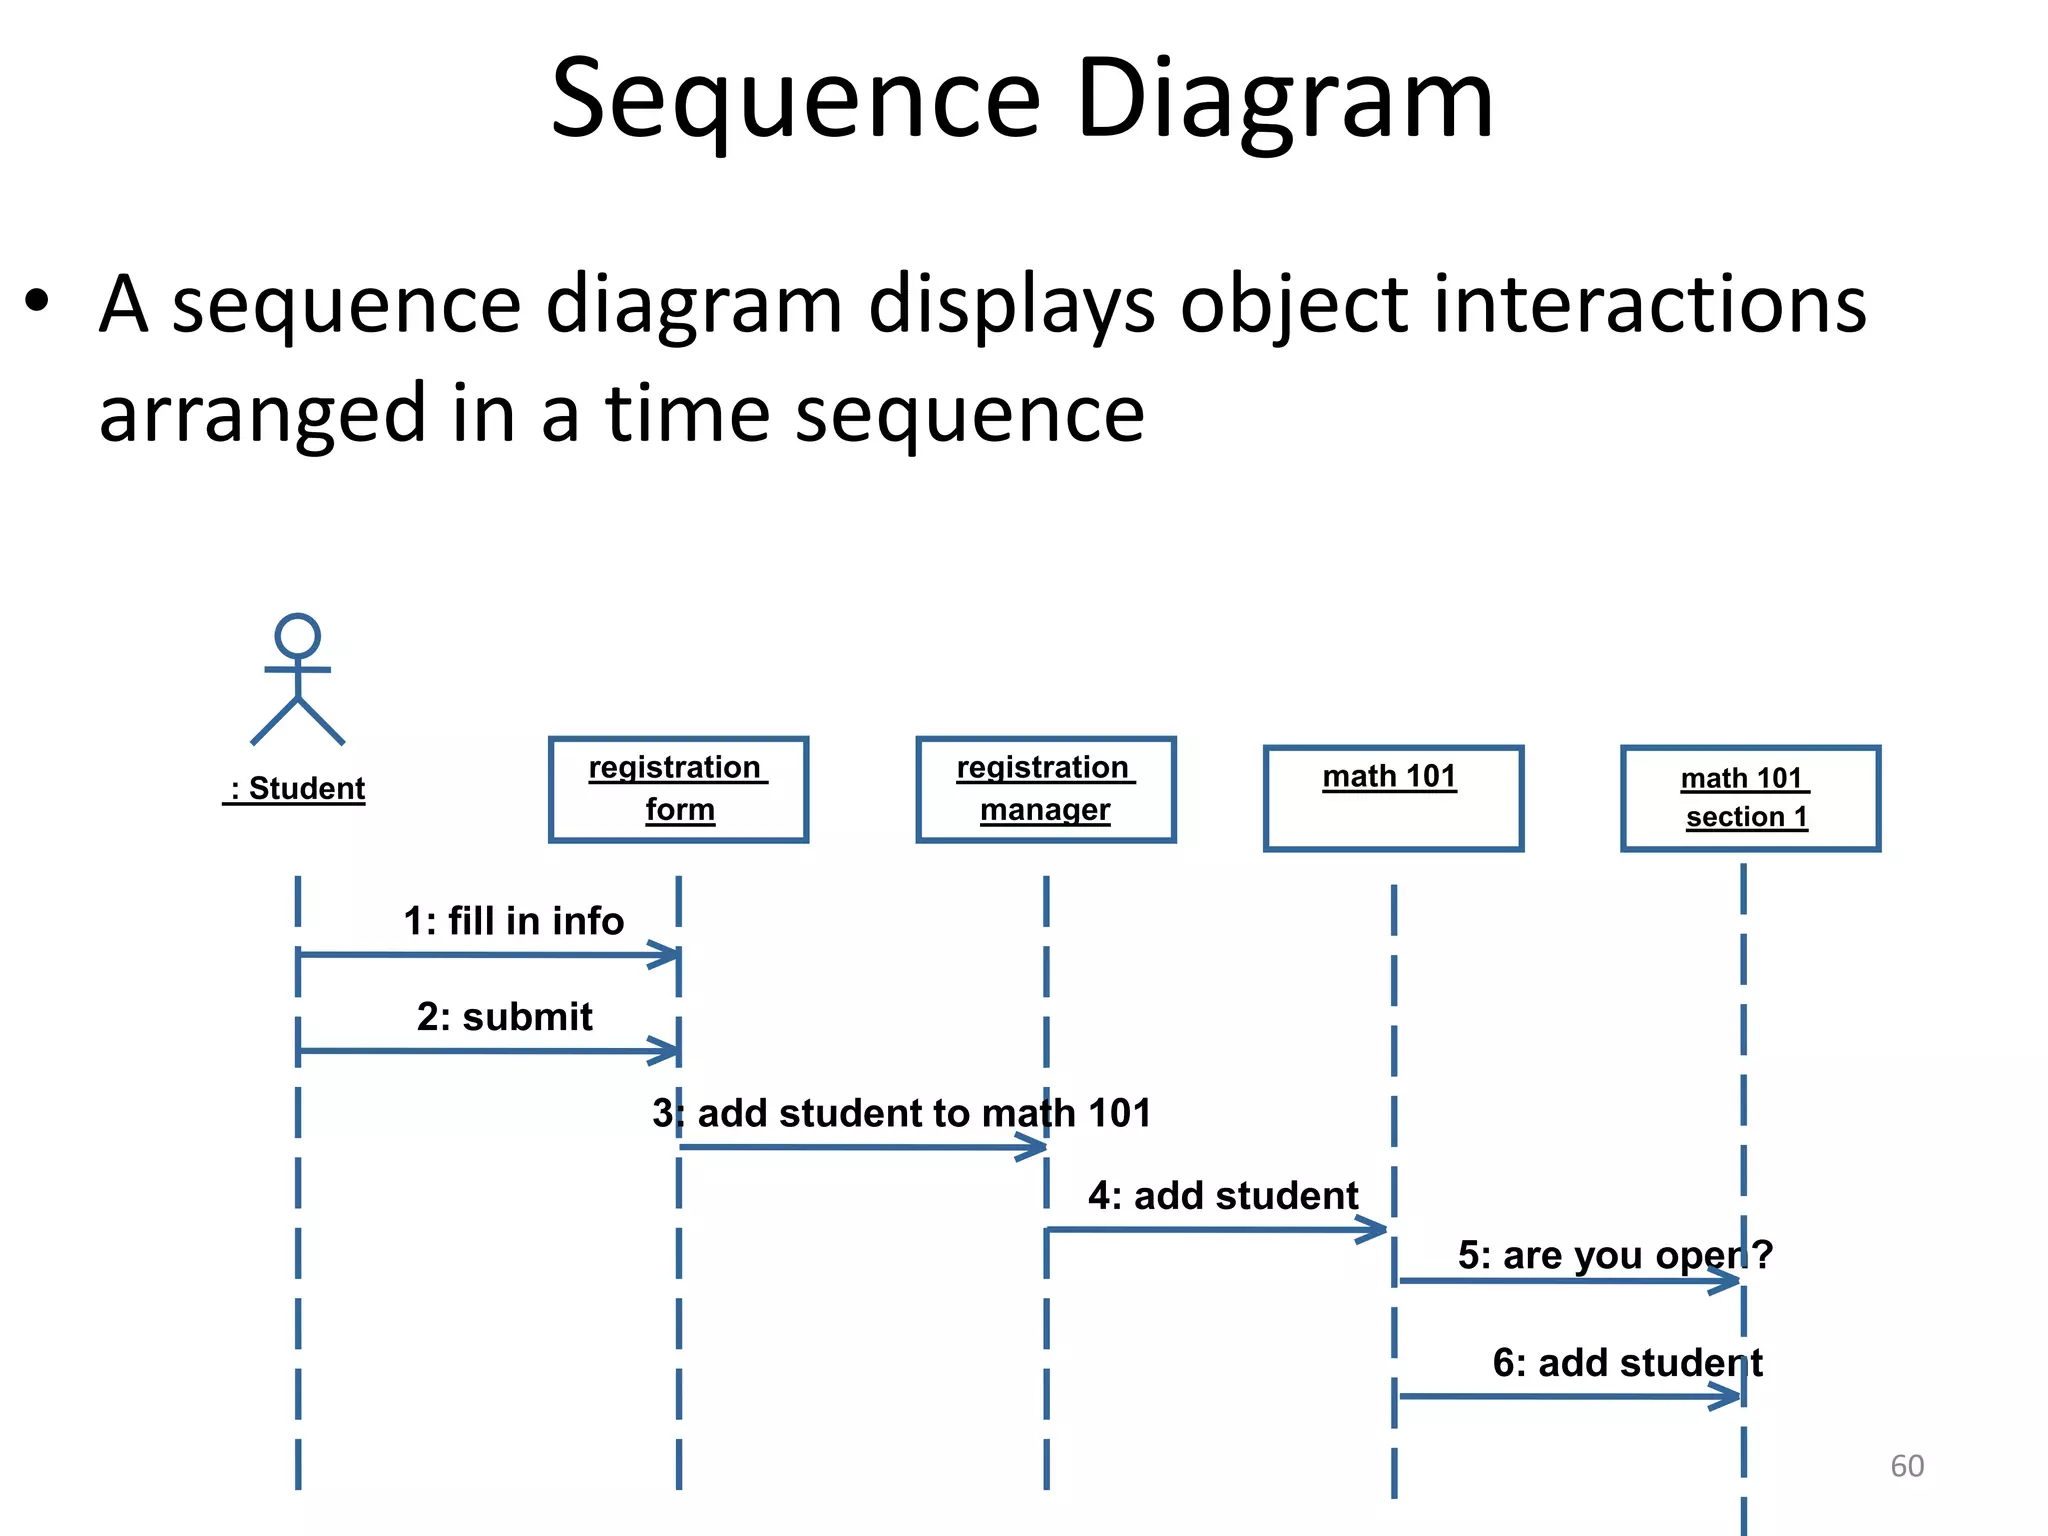
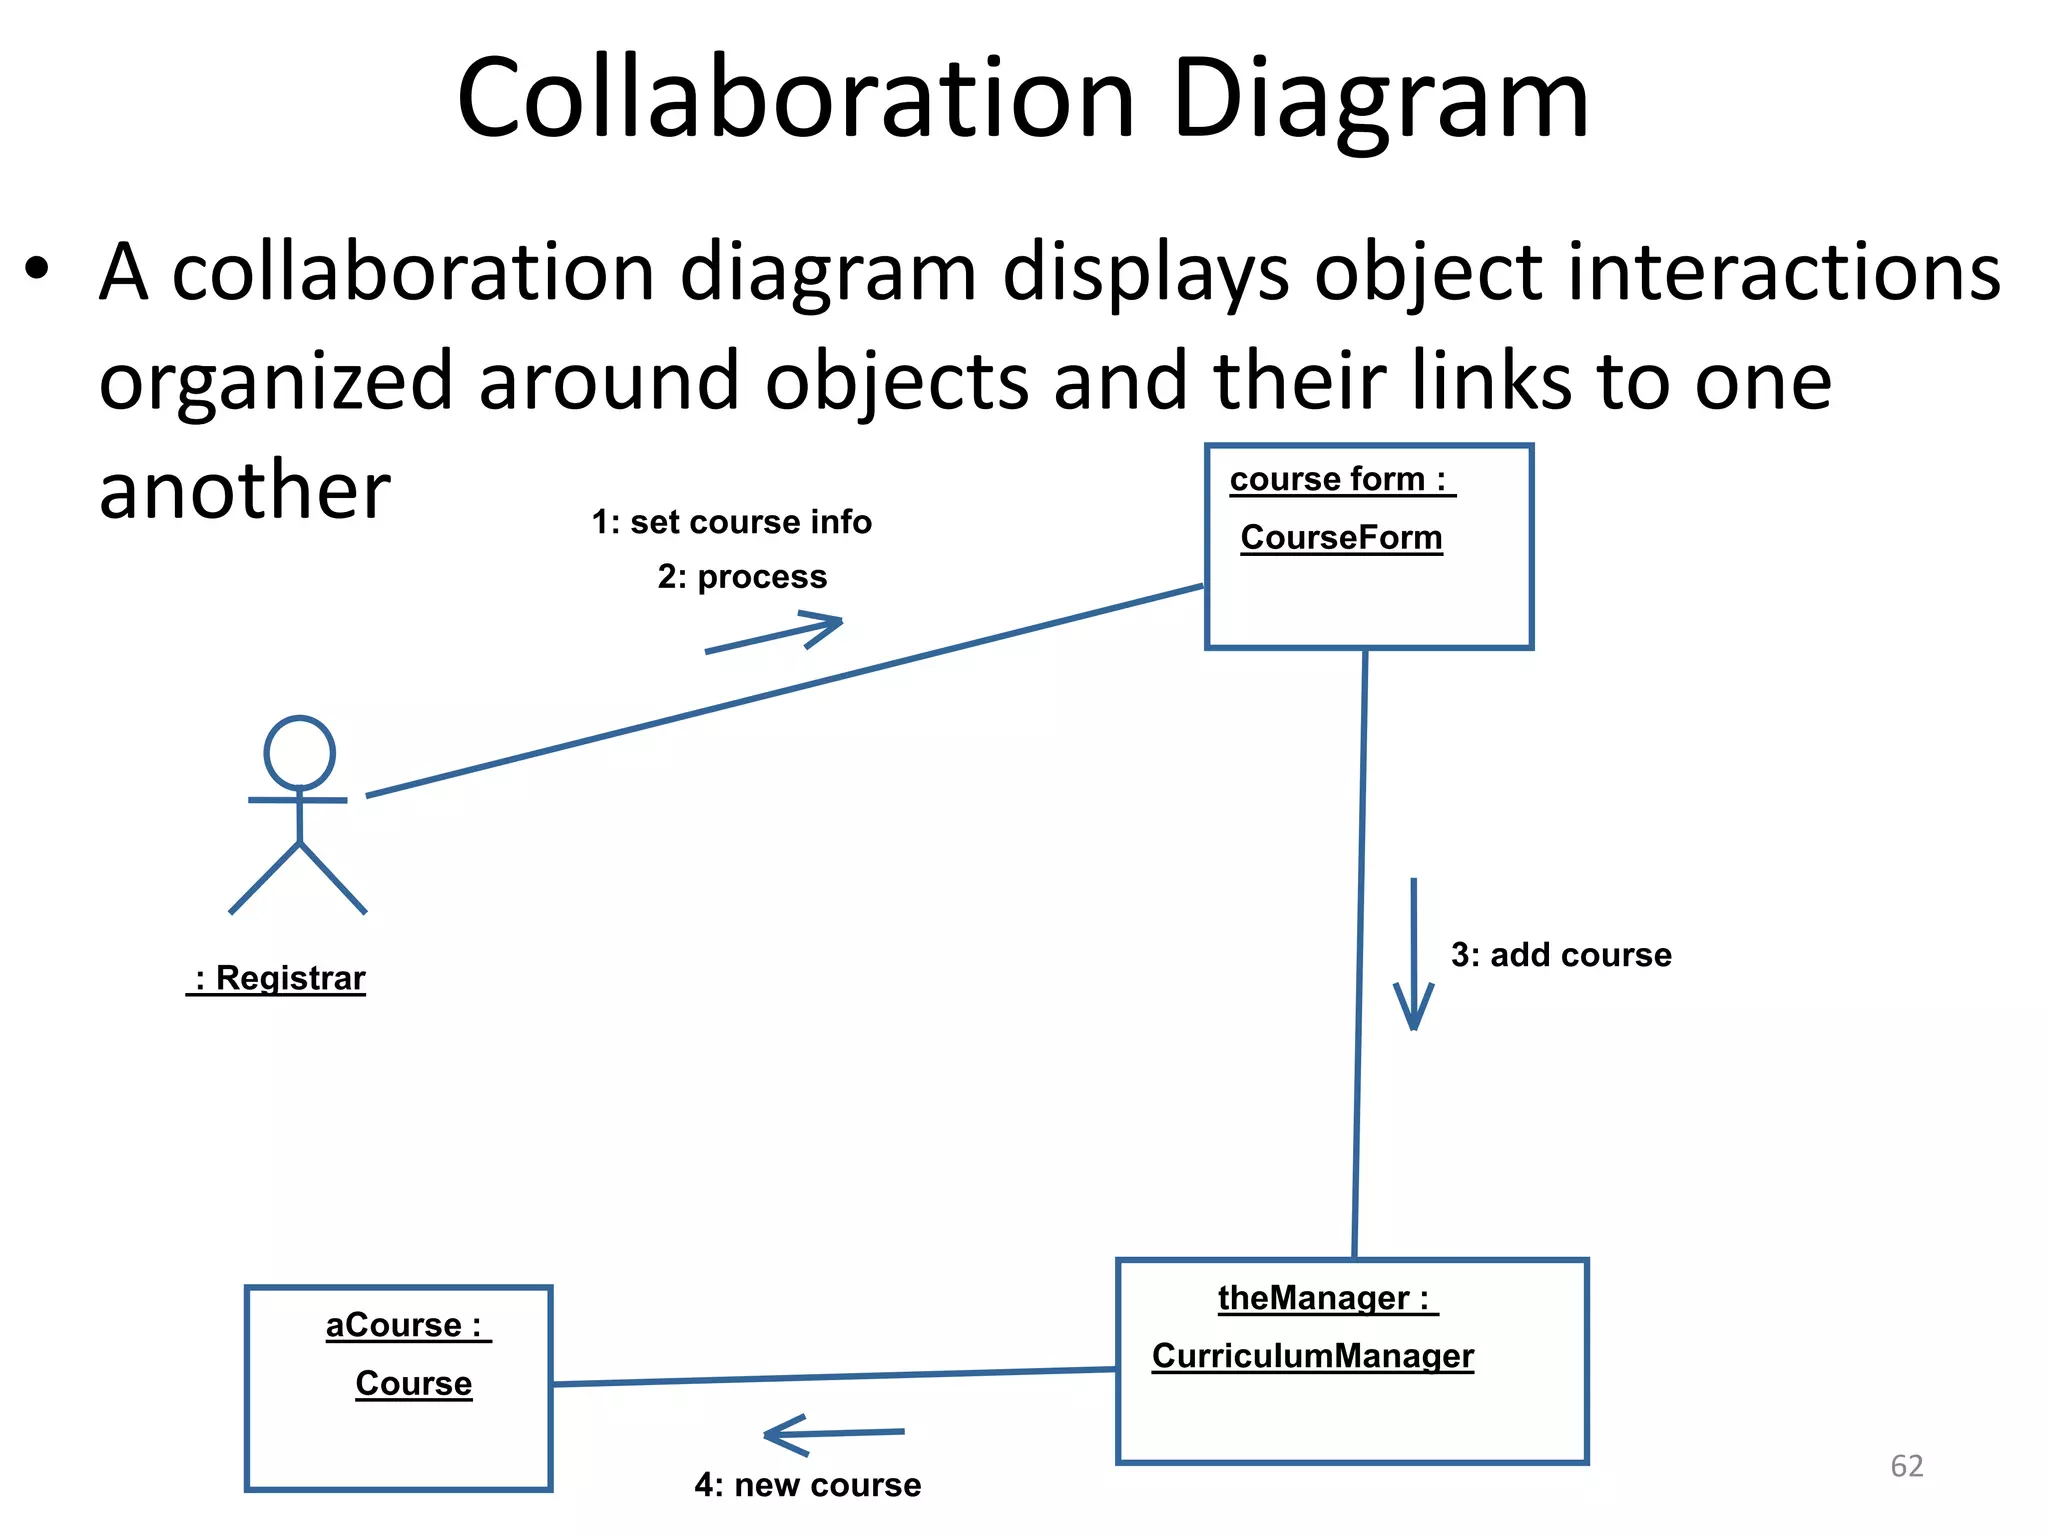
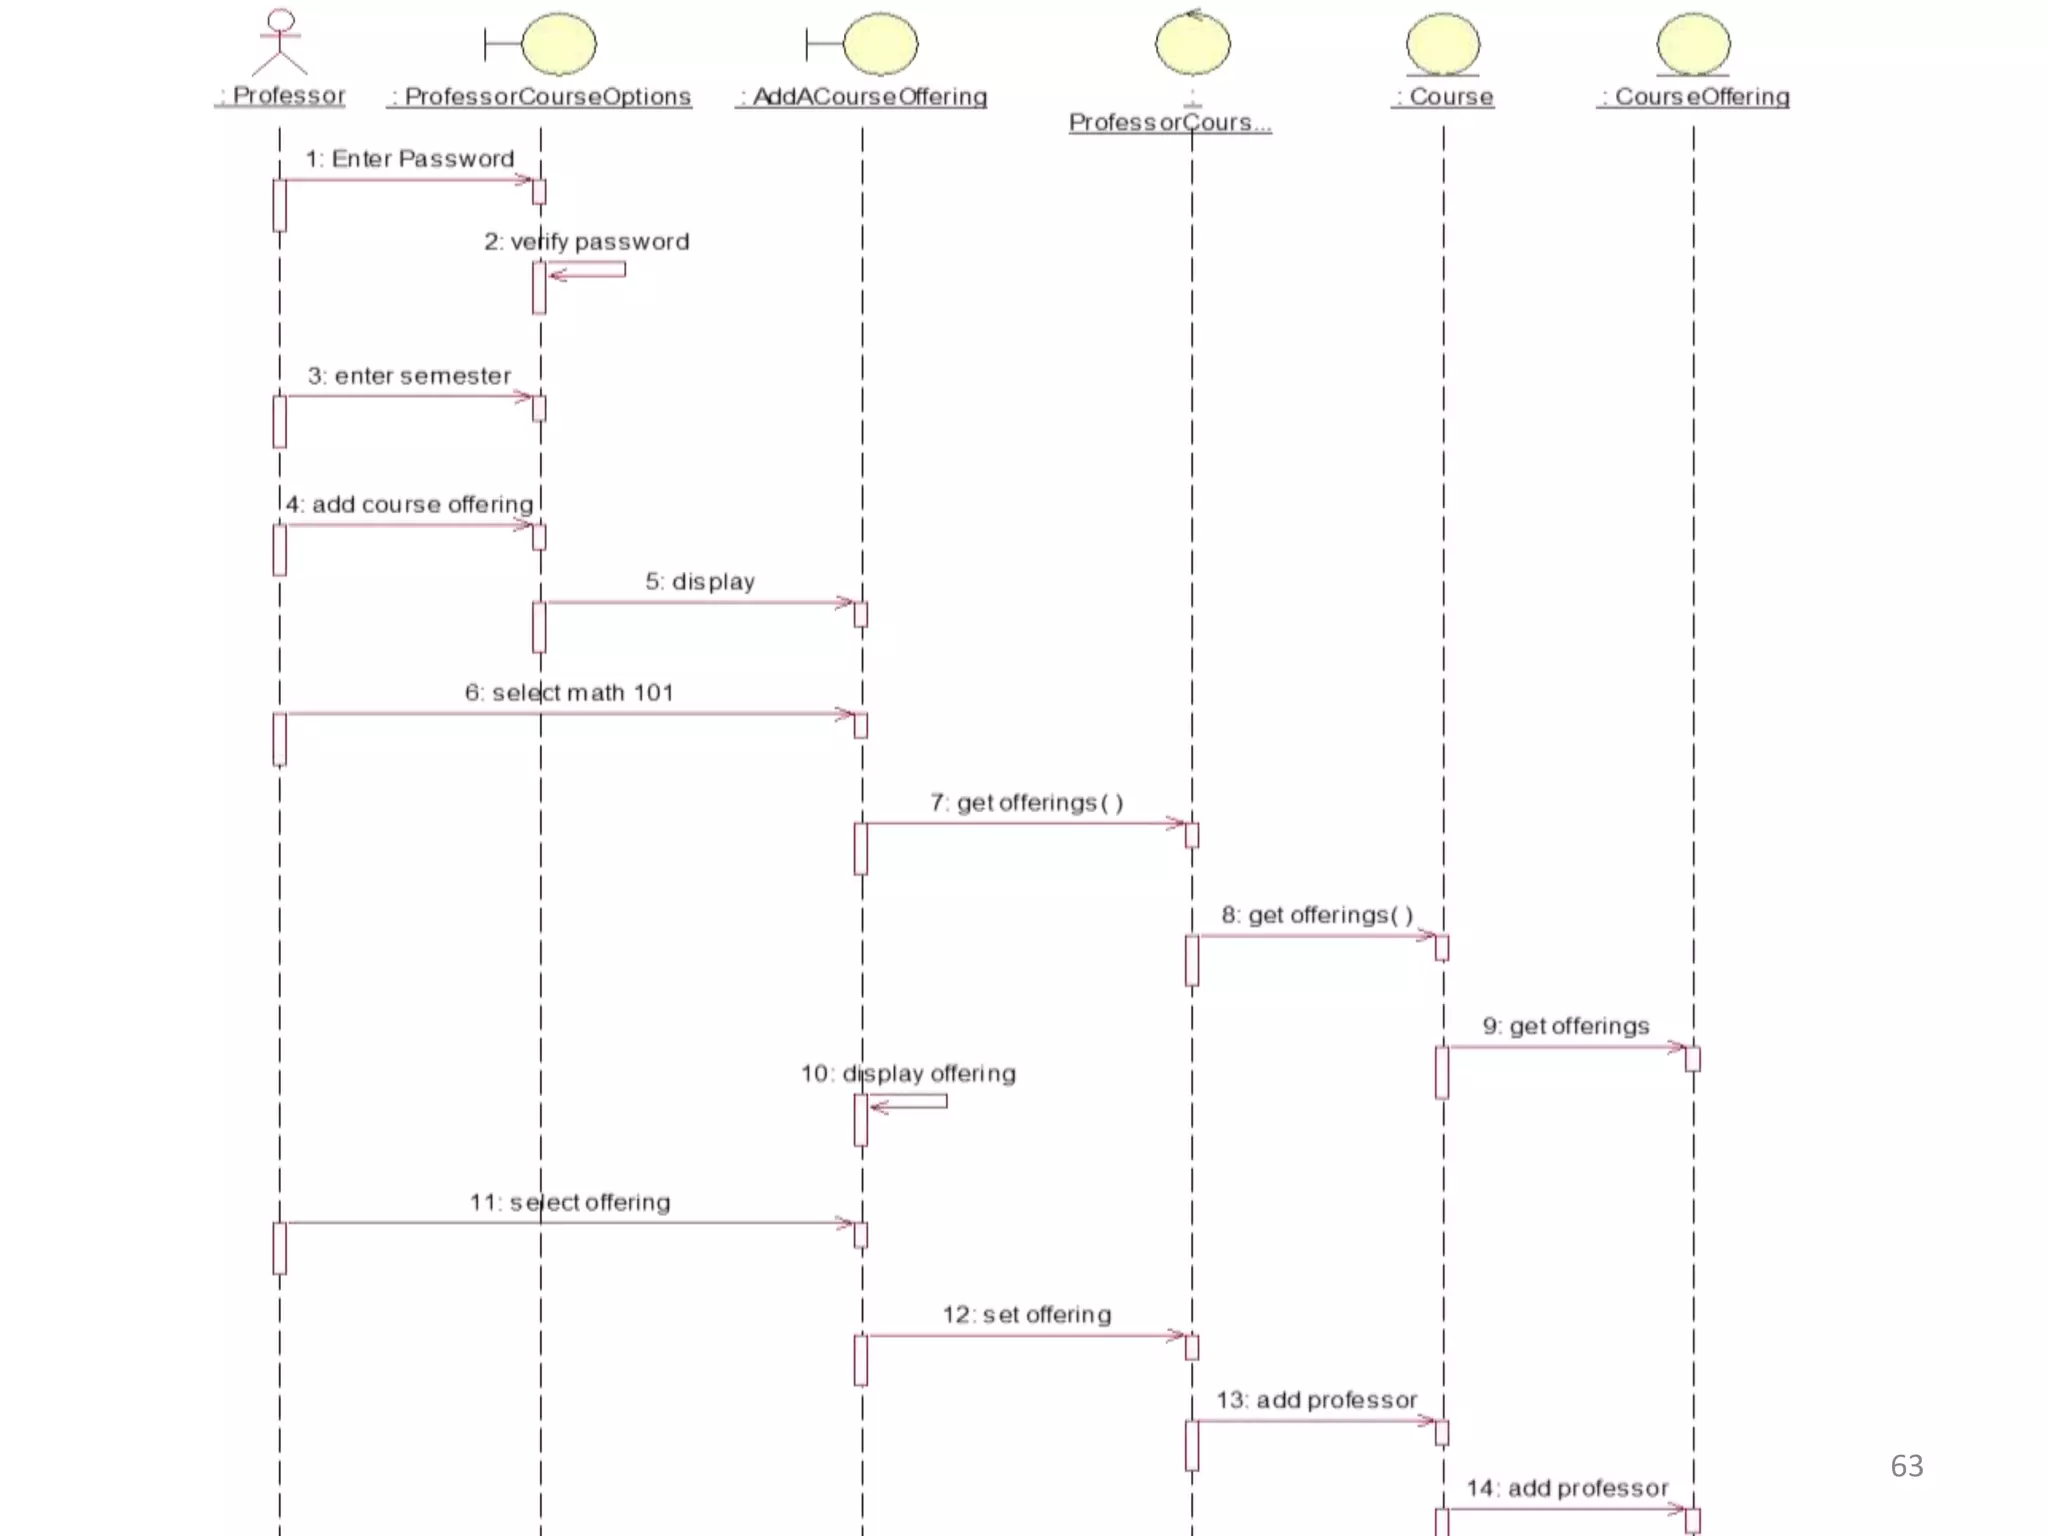
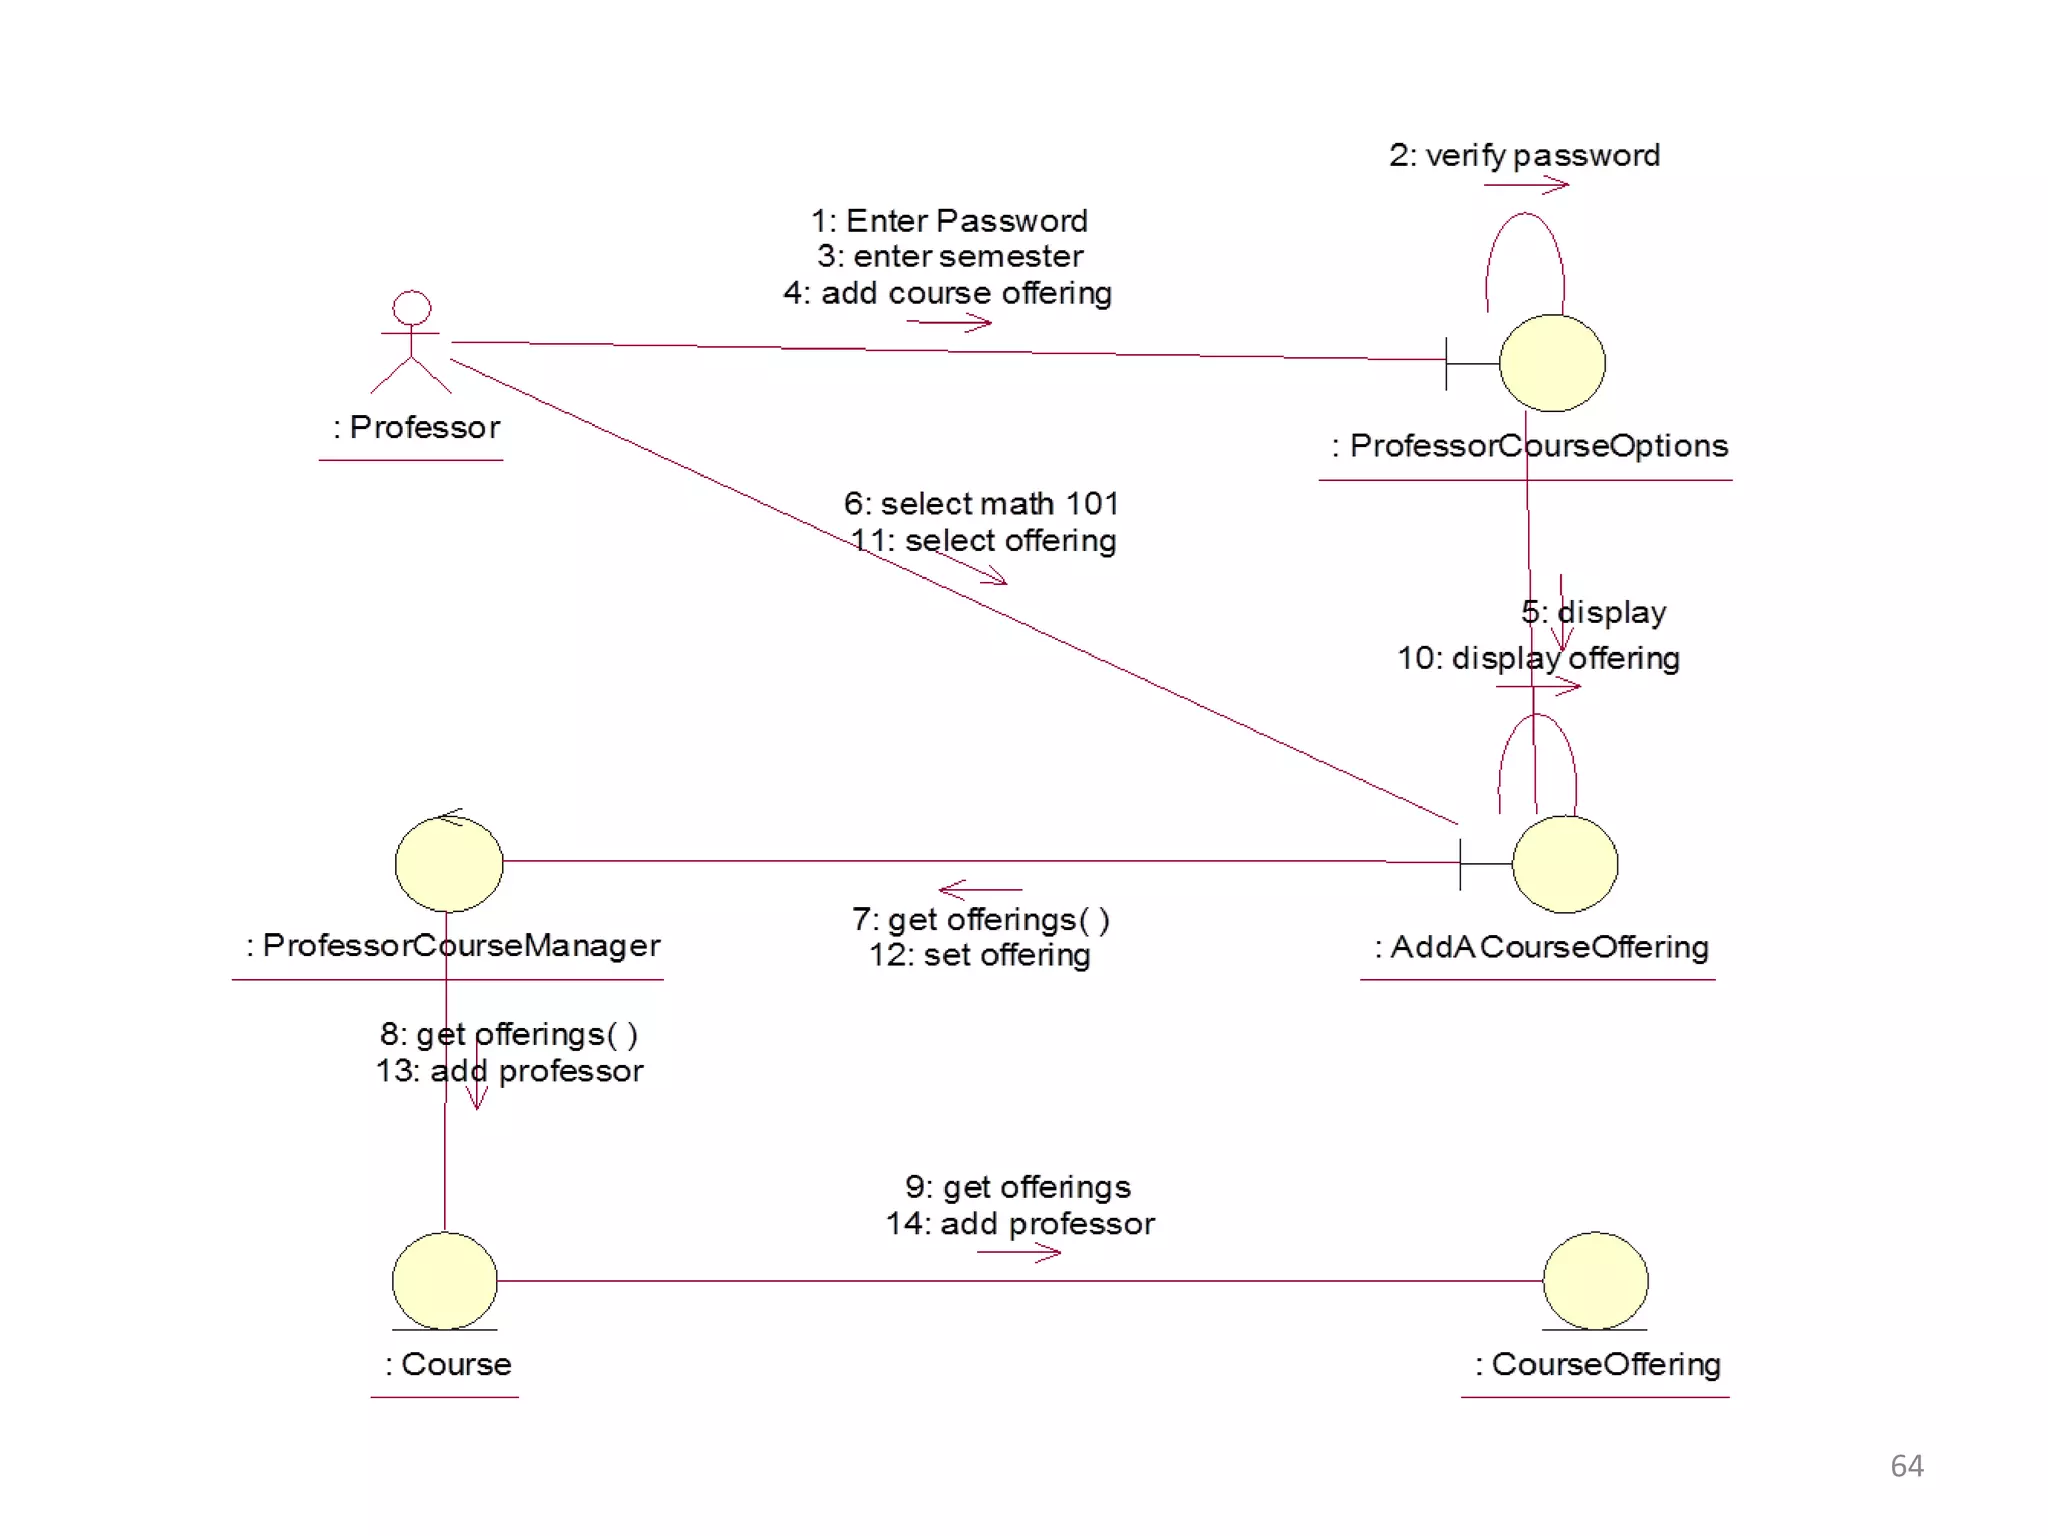
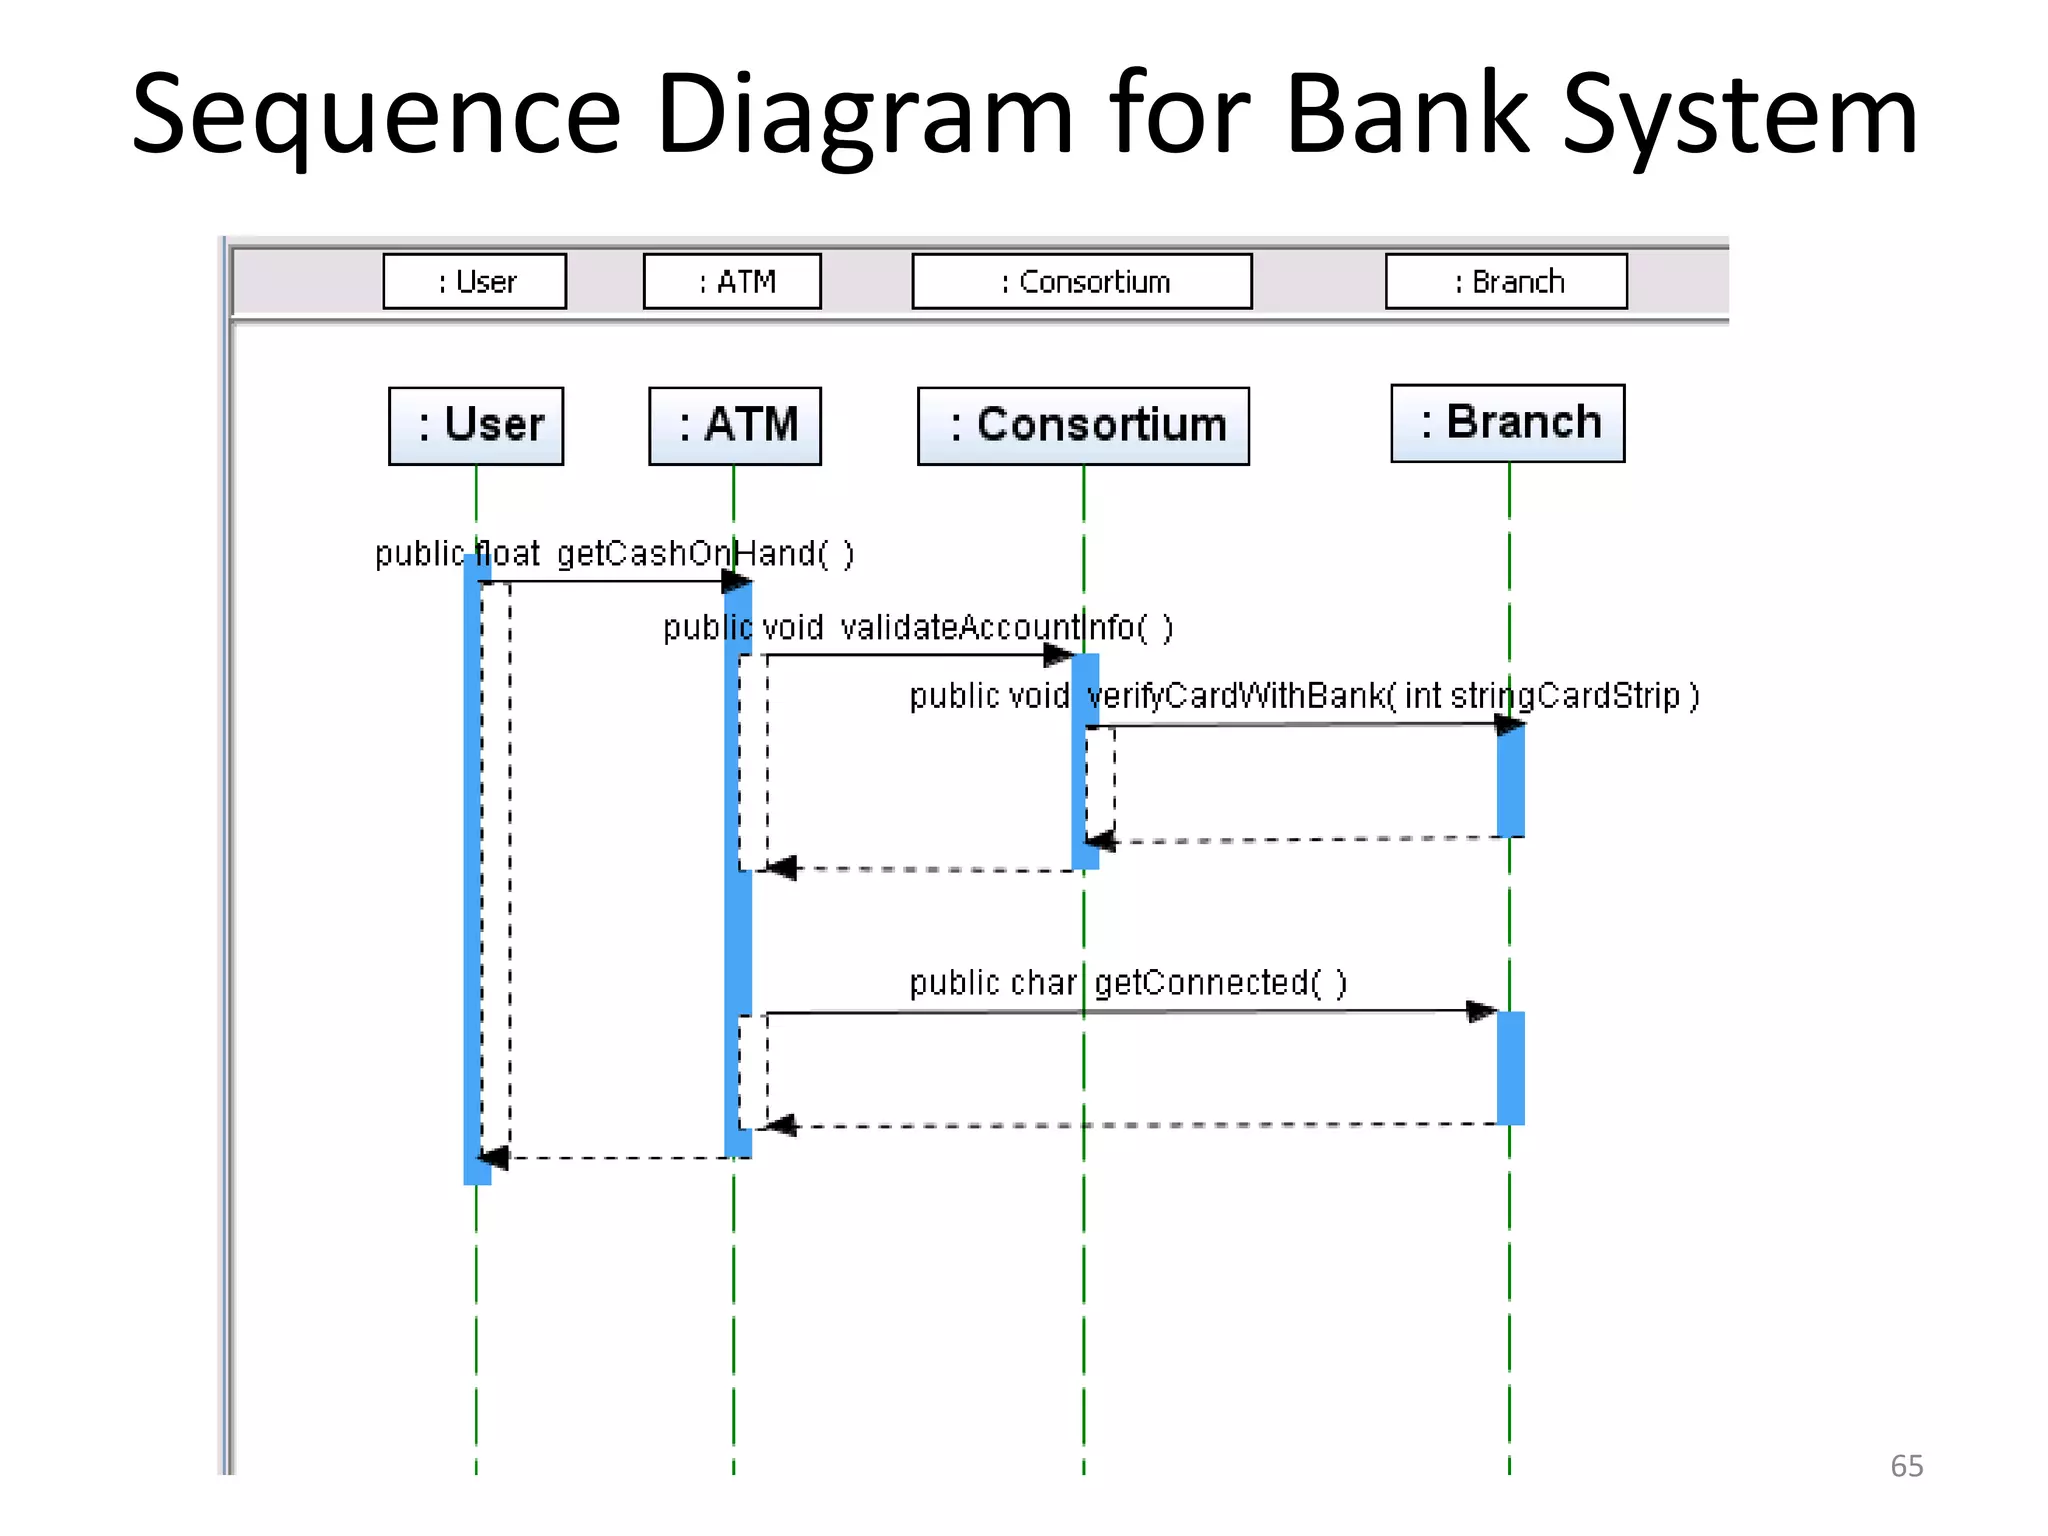
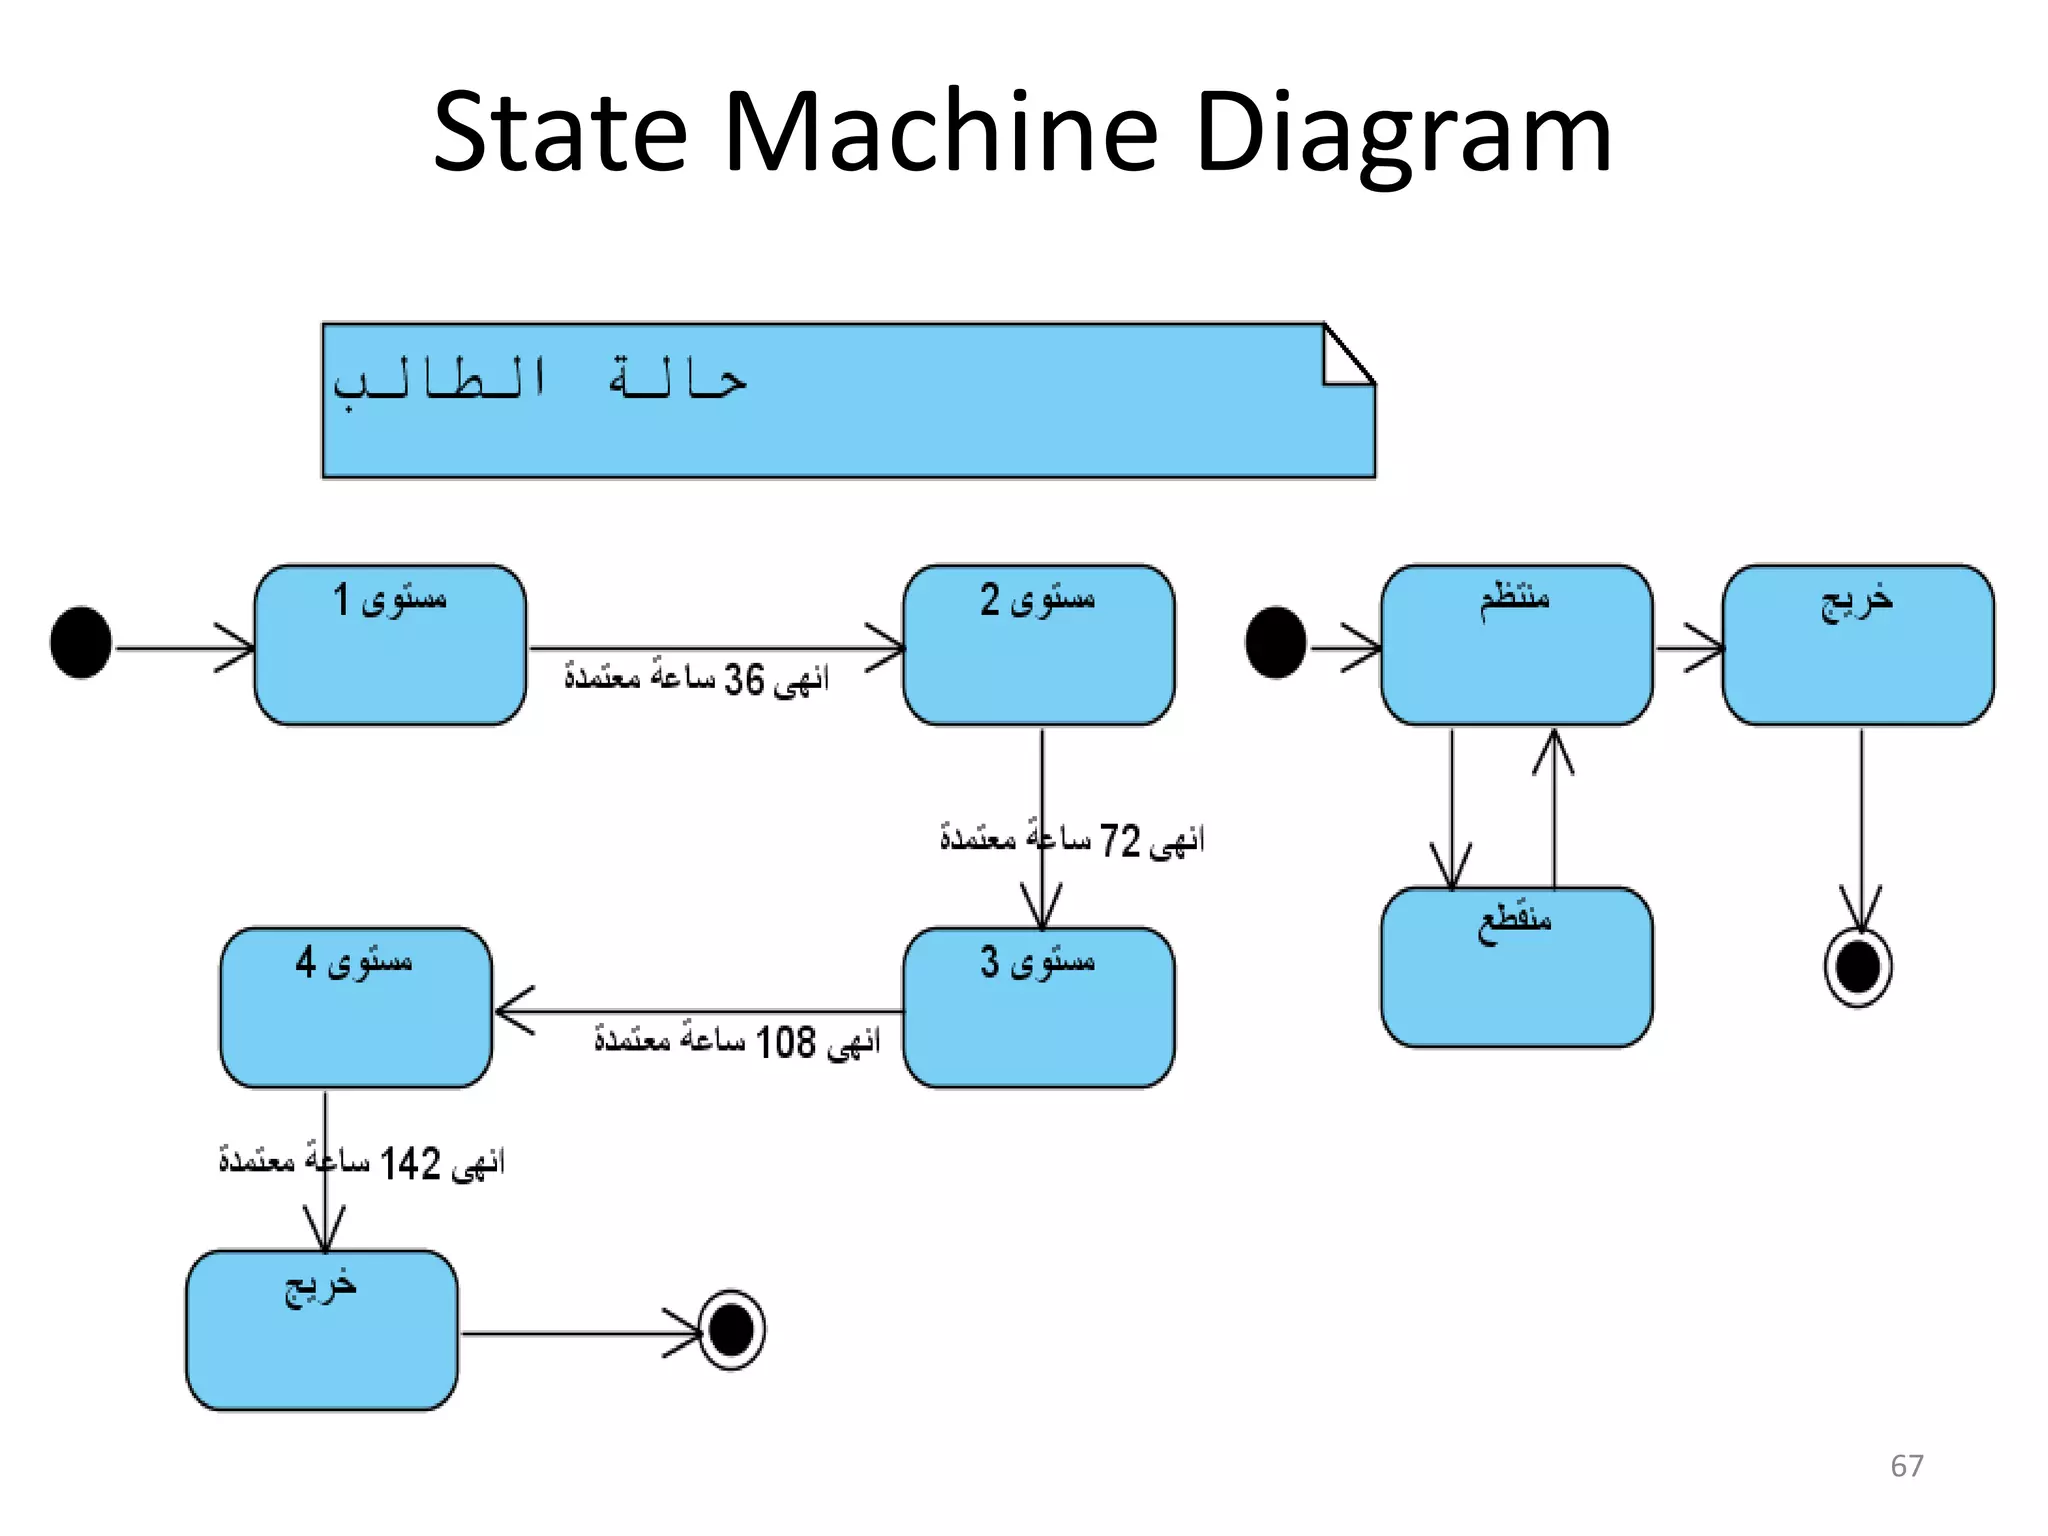
Details the SAD phase, covering system requirements, database design and data flow diagrams. Introduces decision tables for modeling logic during the SAD design phase, emphasizing DB design. Introduces OOAD phases including requirements gathering, object interaction, and detailed design processes.
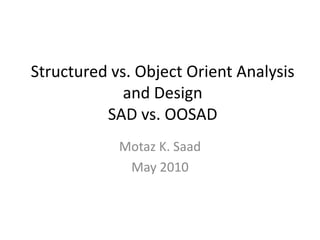
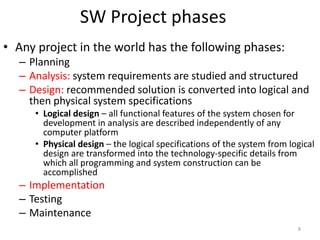
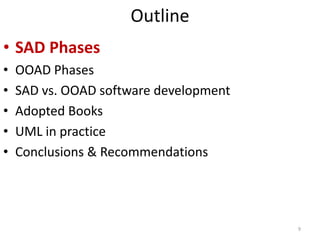
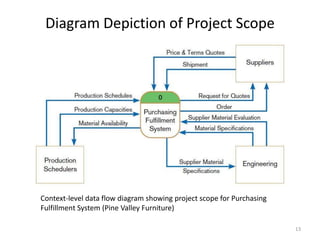
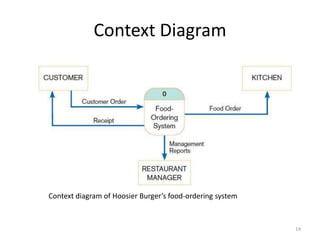
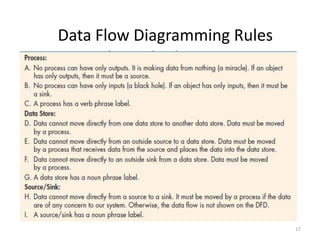
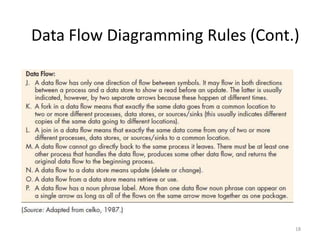
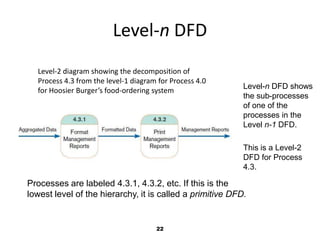
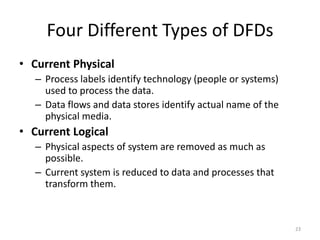
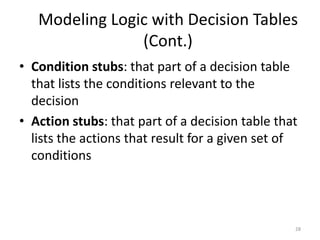
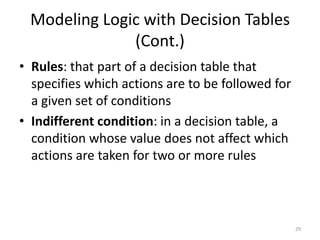
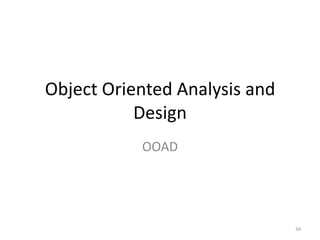
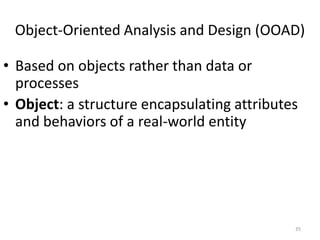
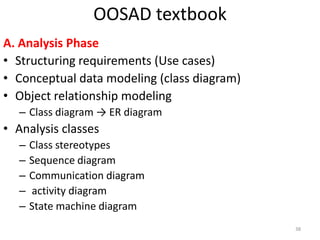
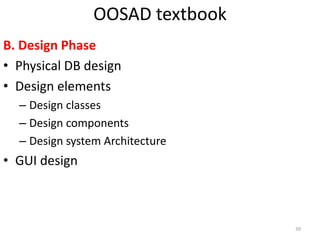
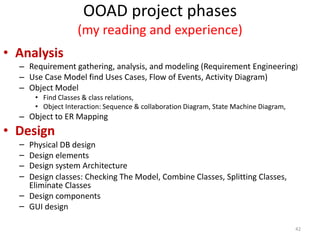
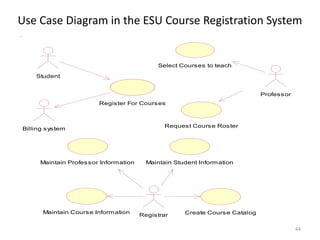
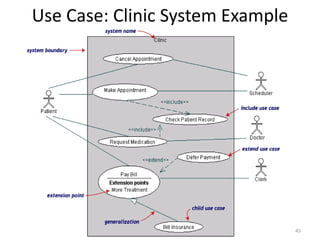
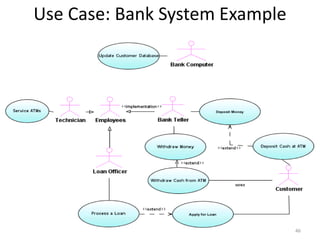
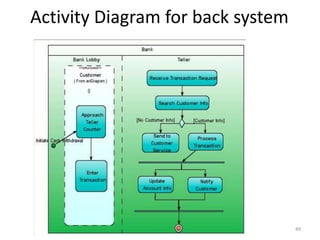
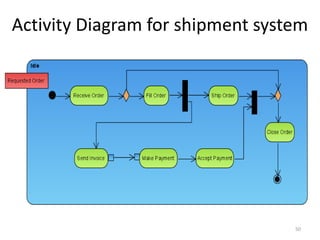
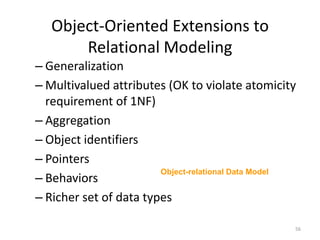
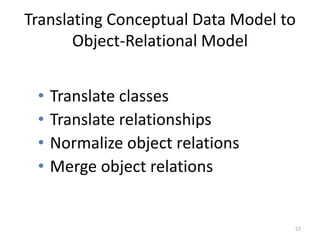
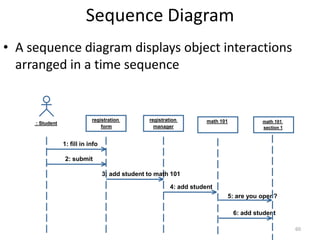
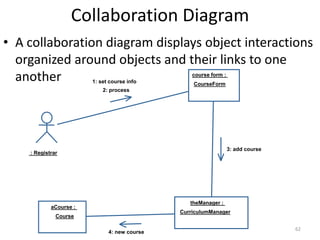
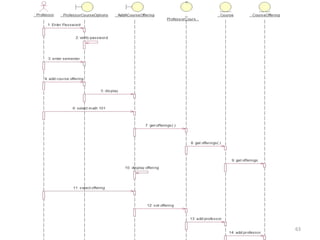
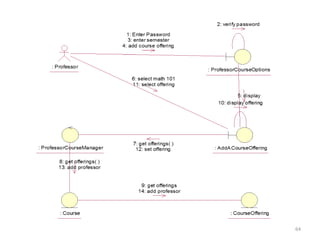
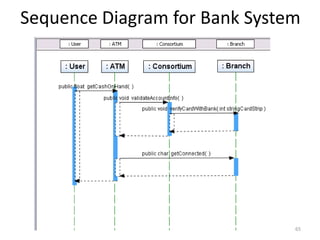
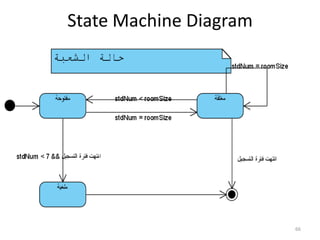
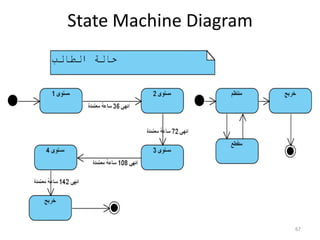
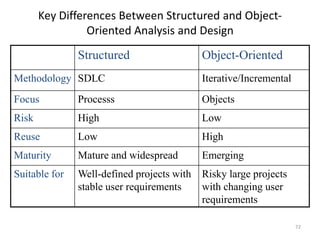
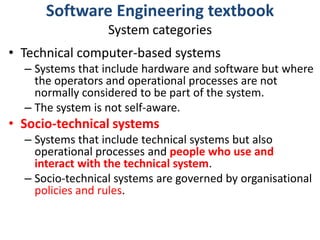
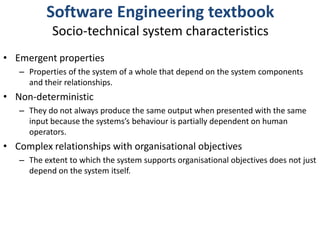
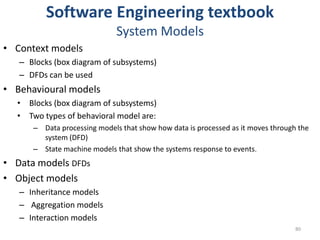
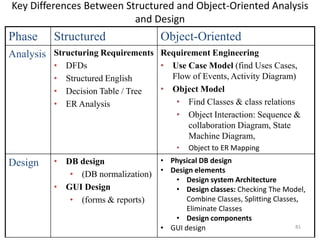
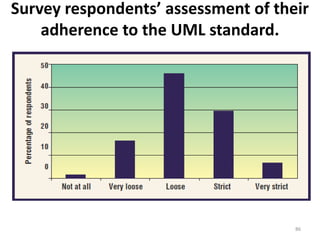
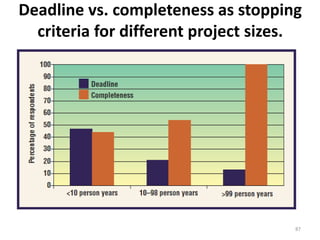
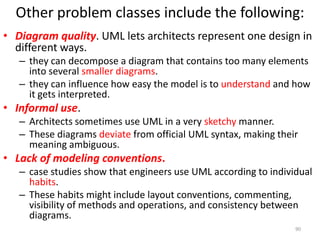
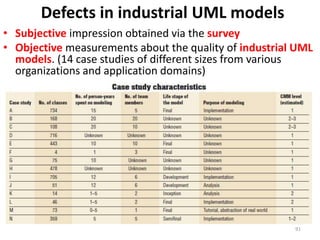
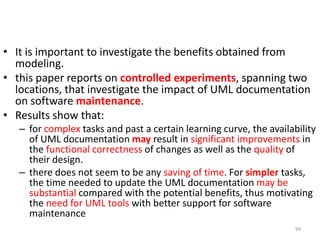
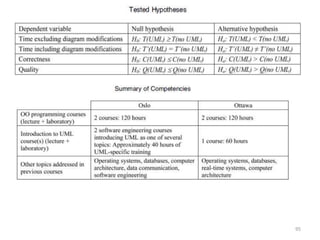
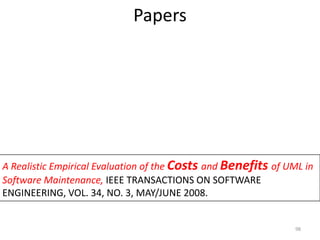
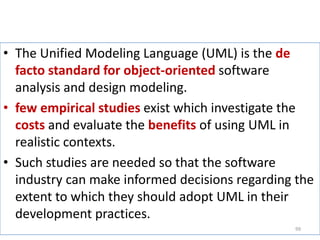
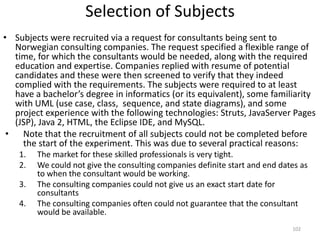
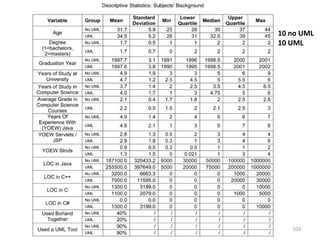
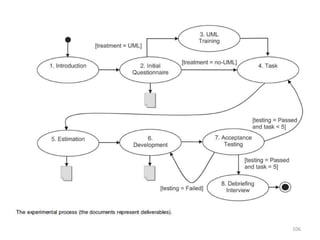
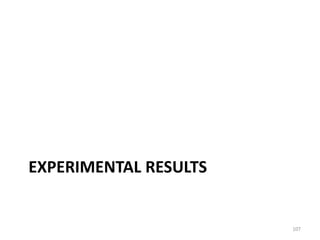
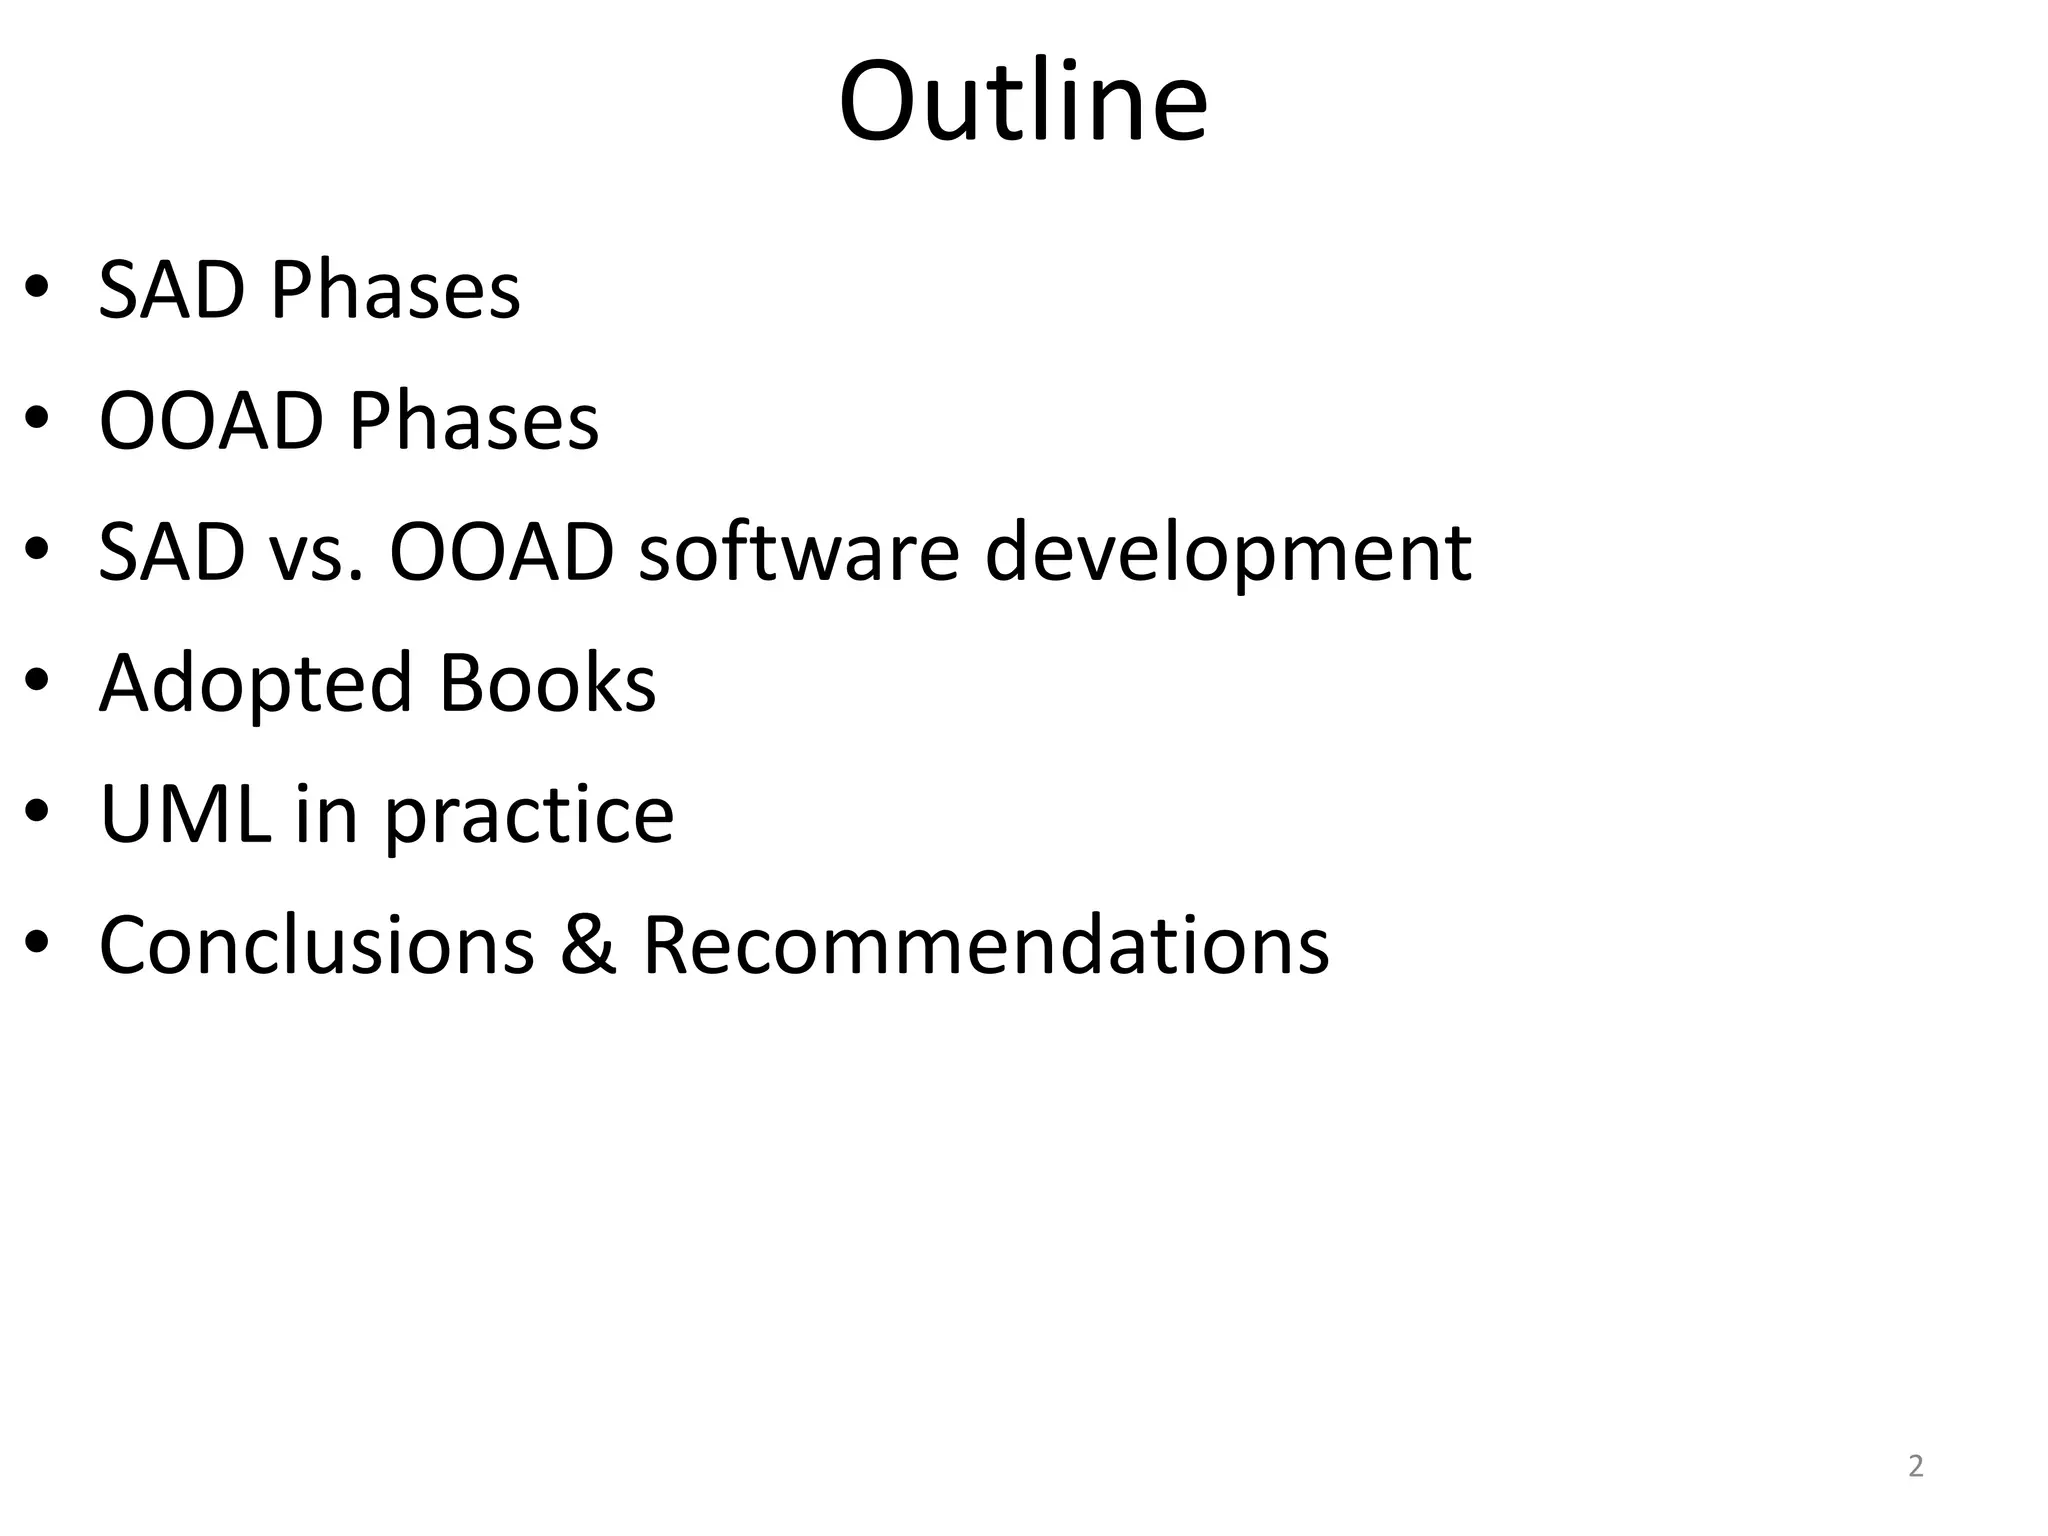
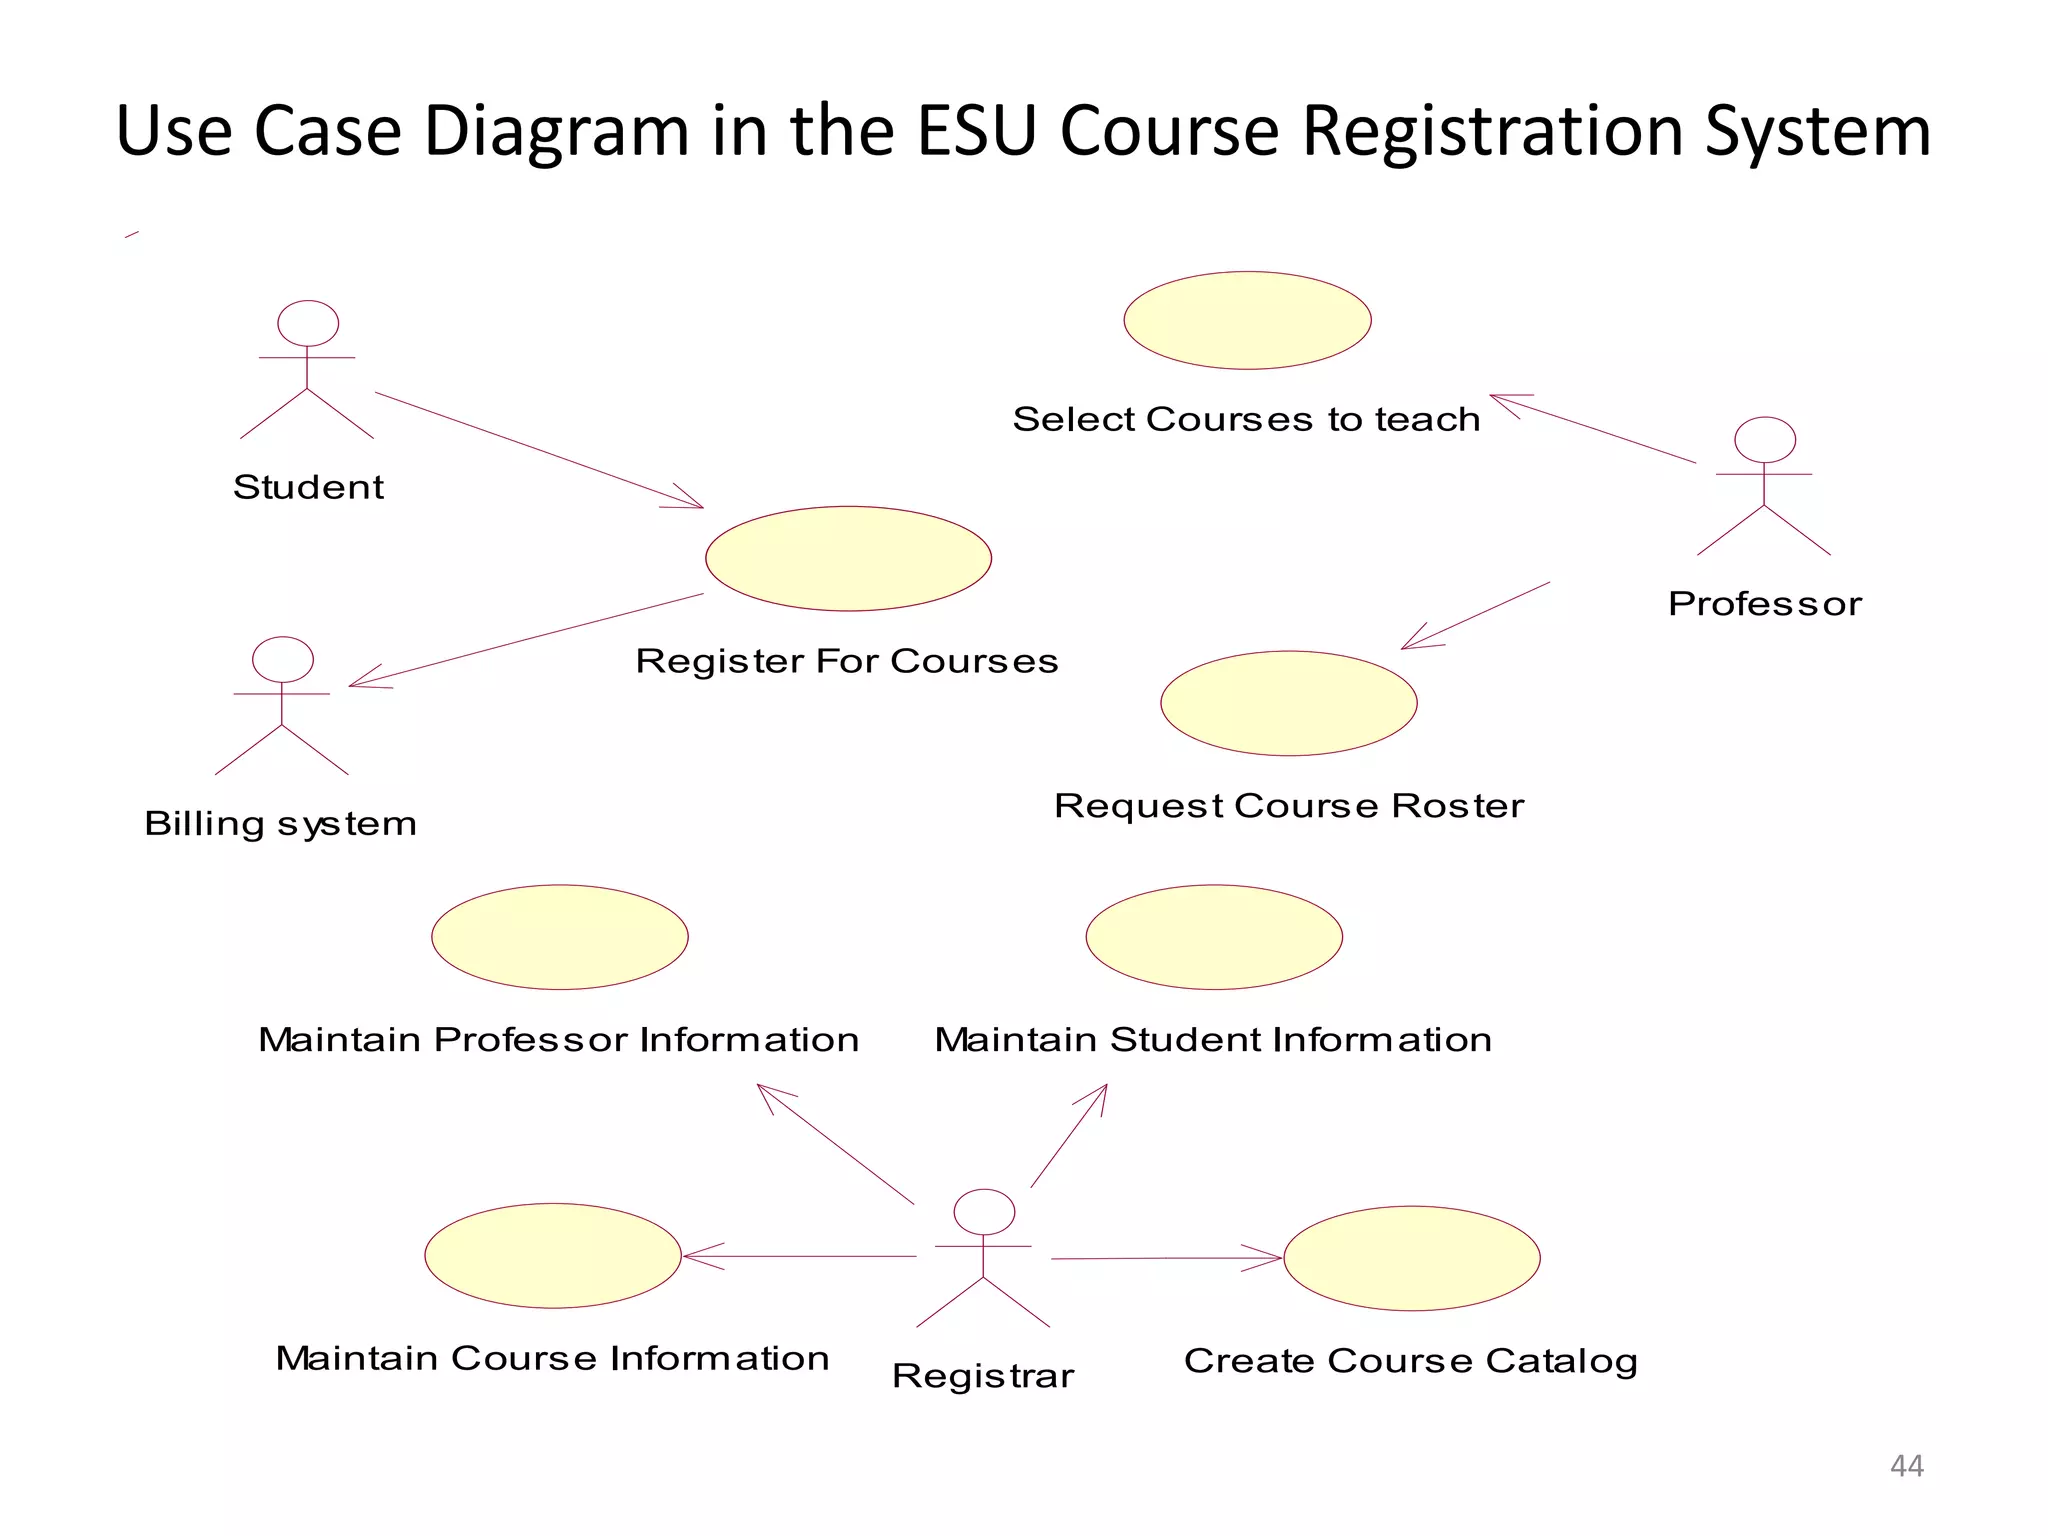
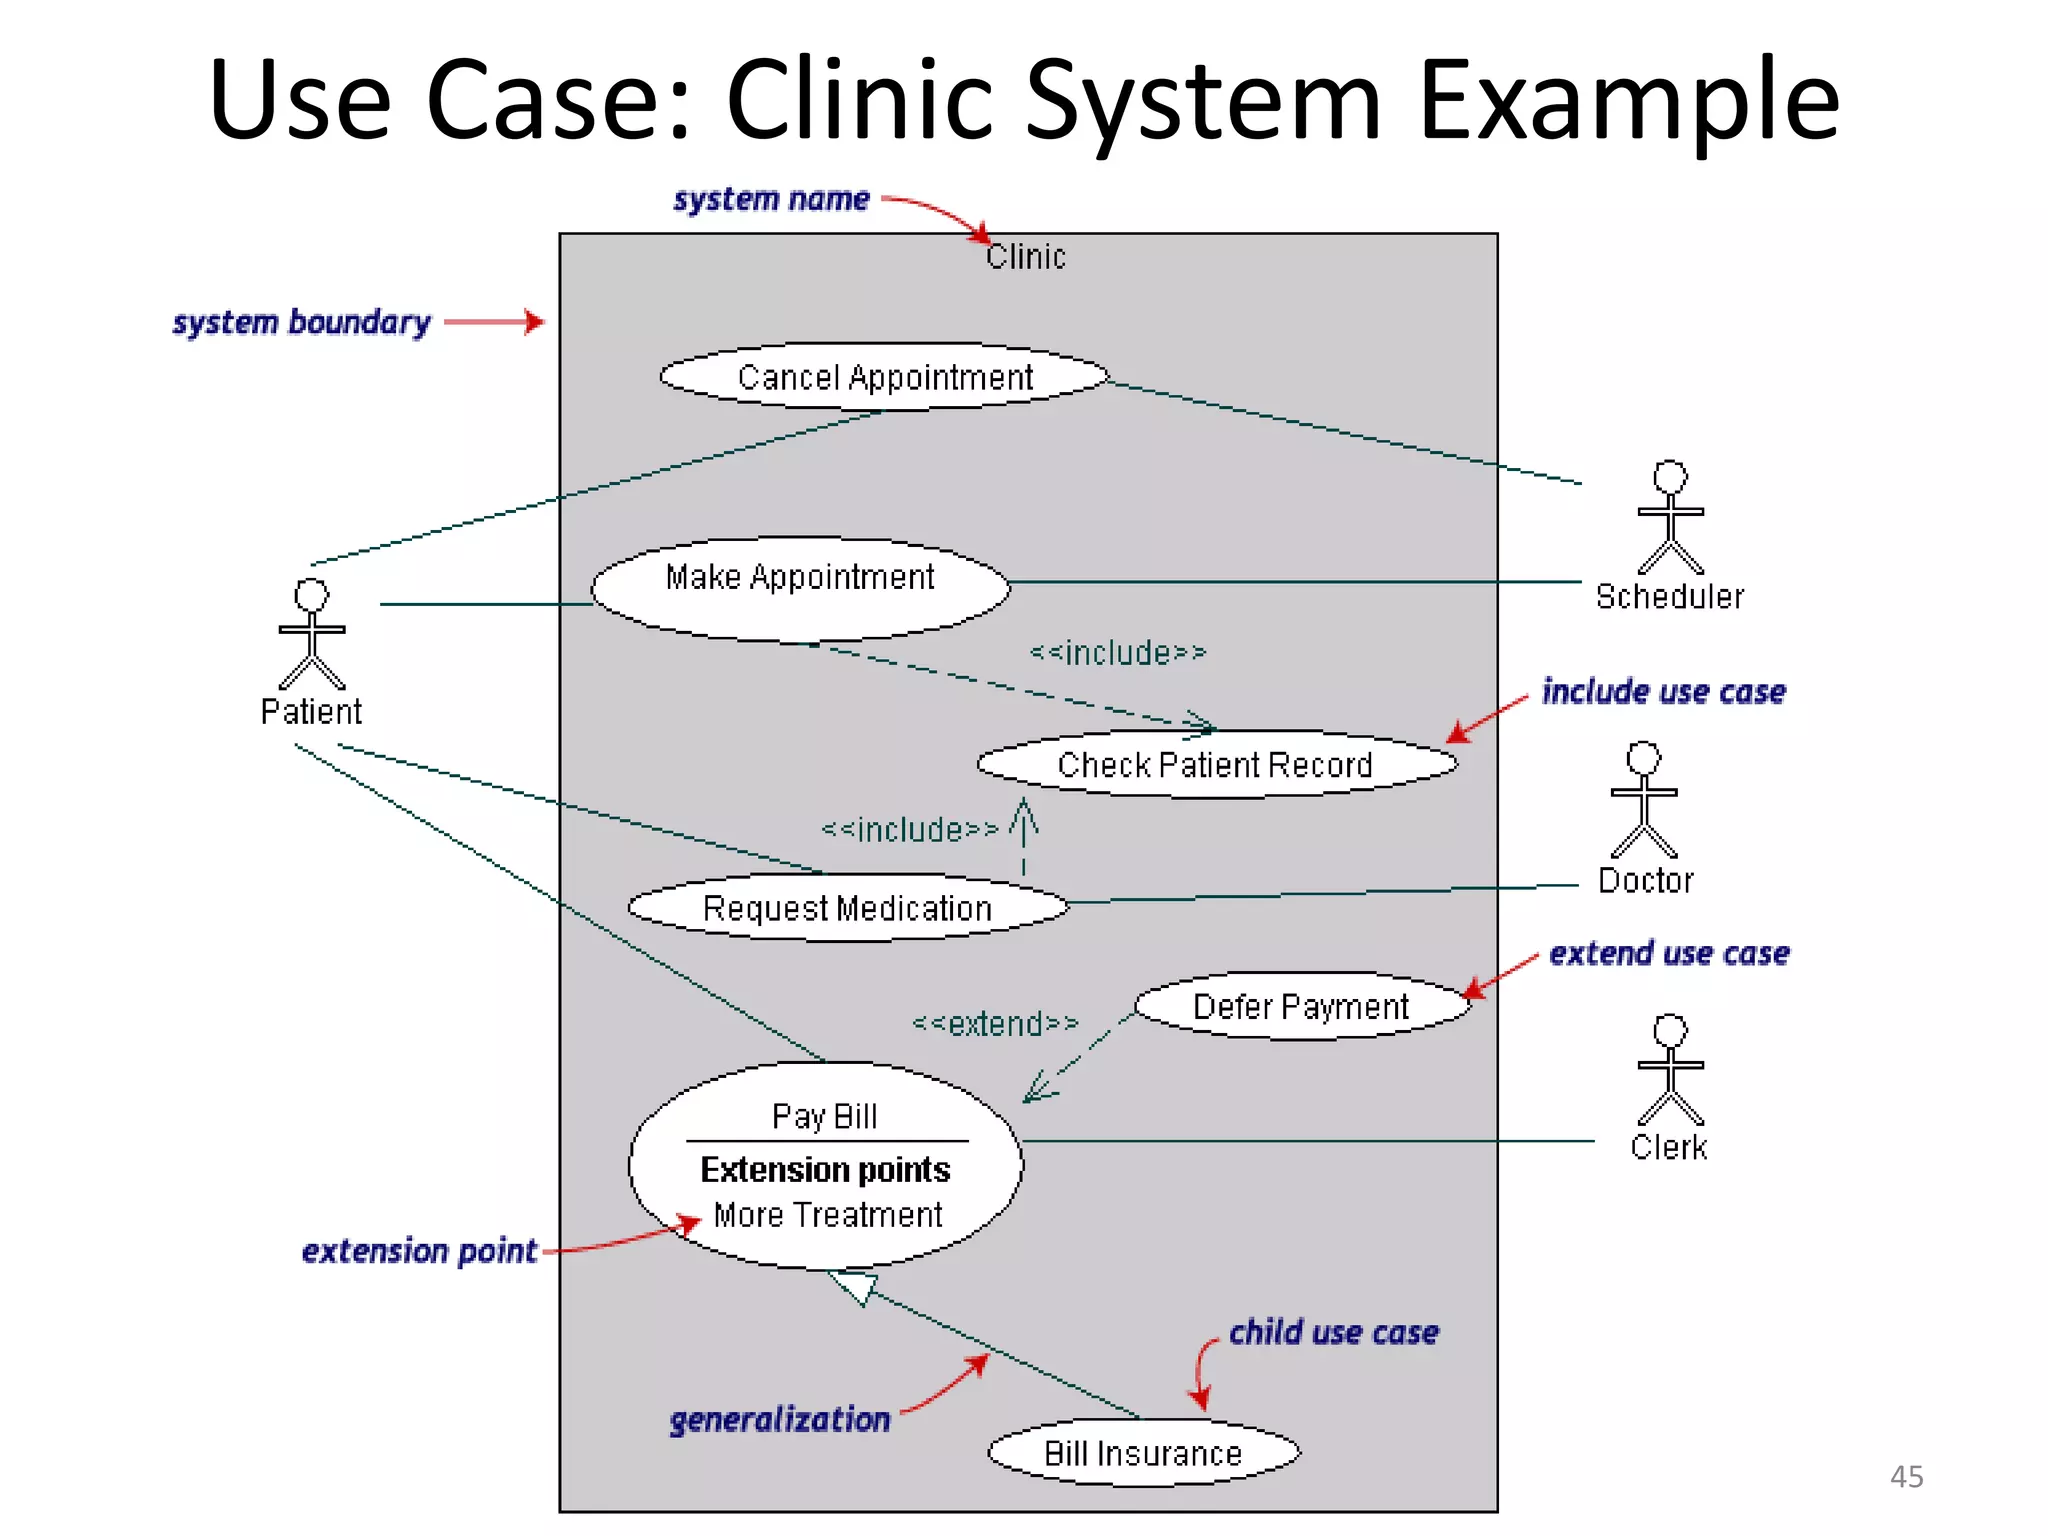
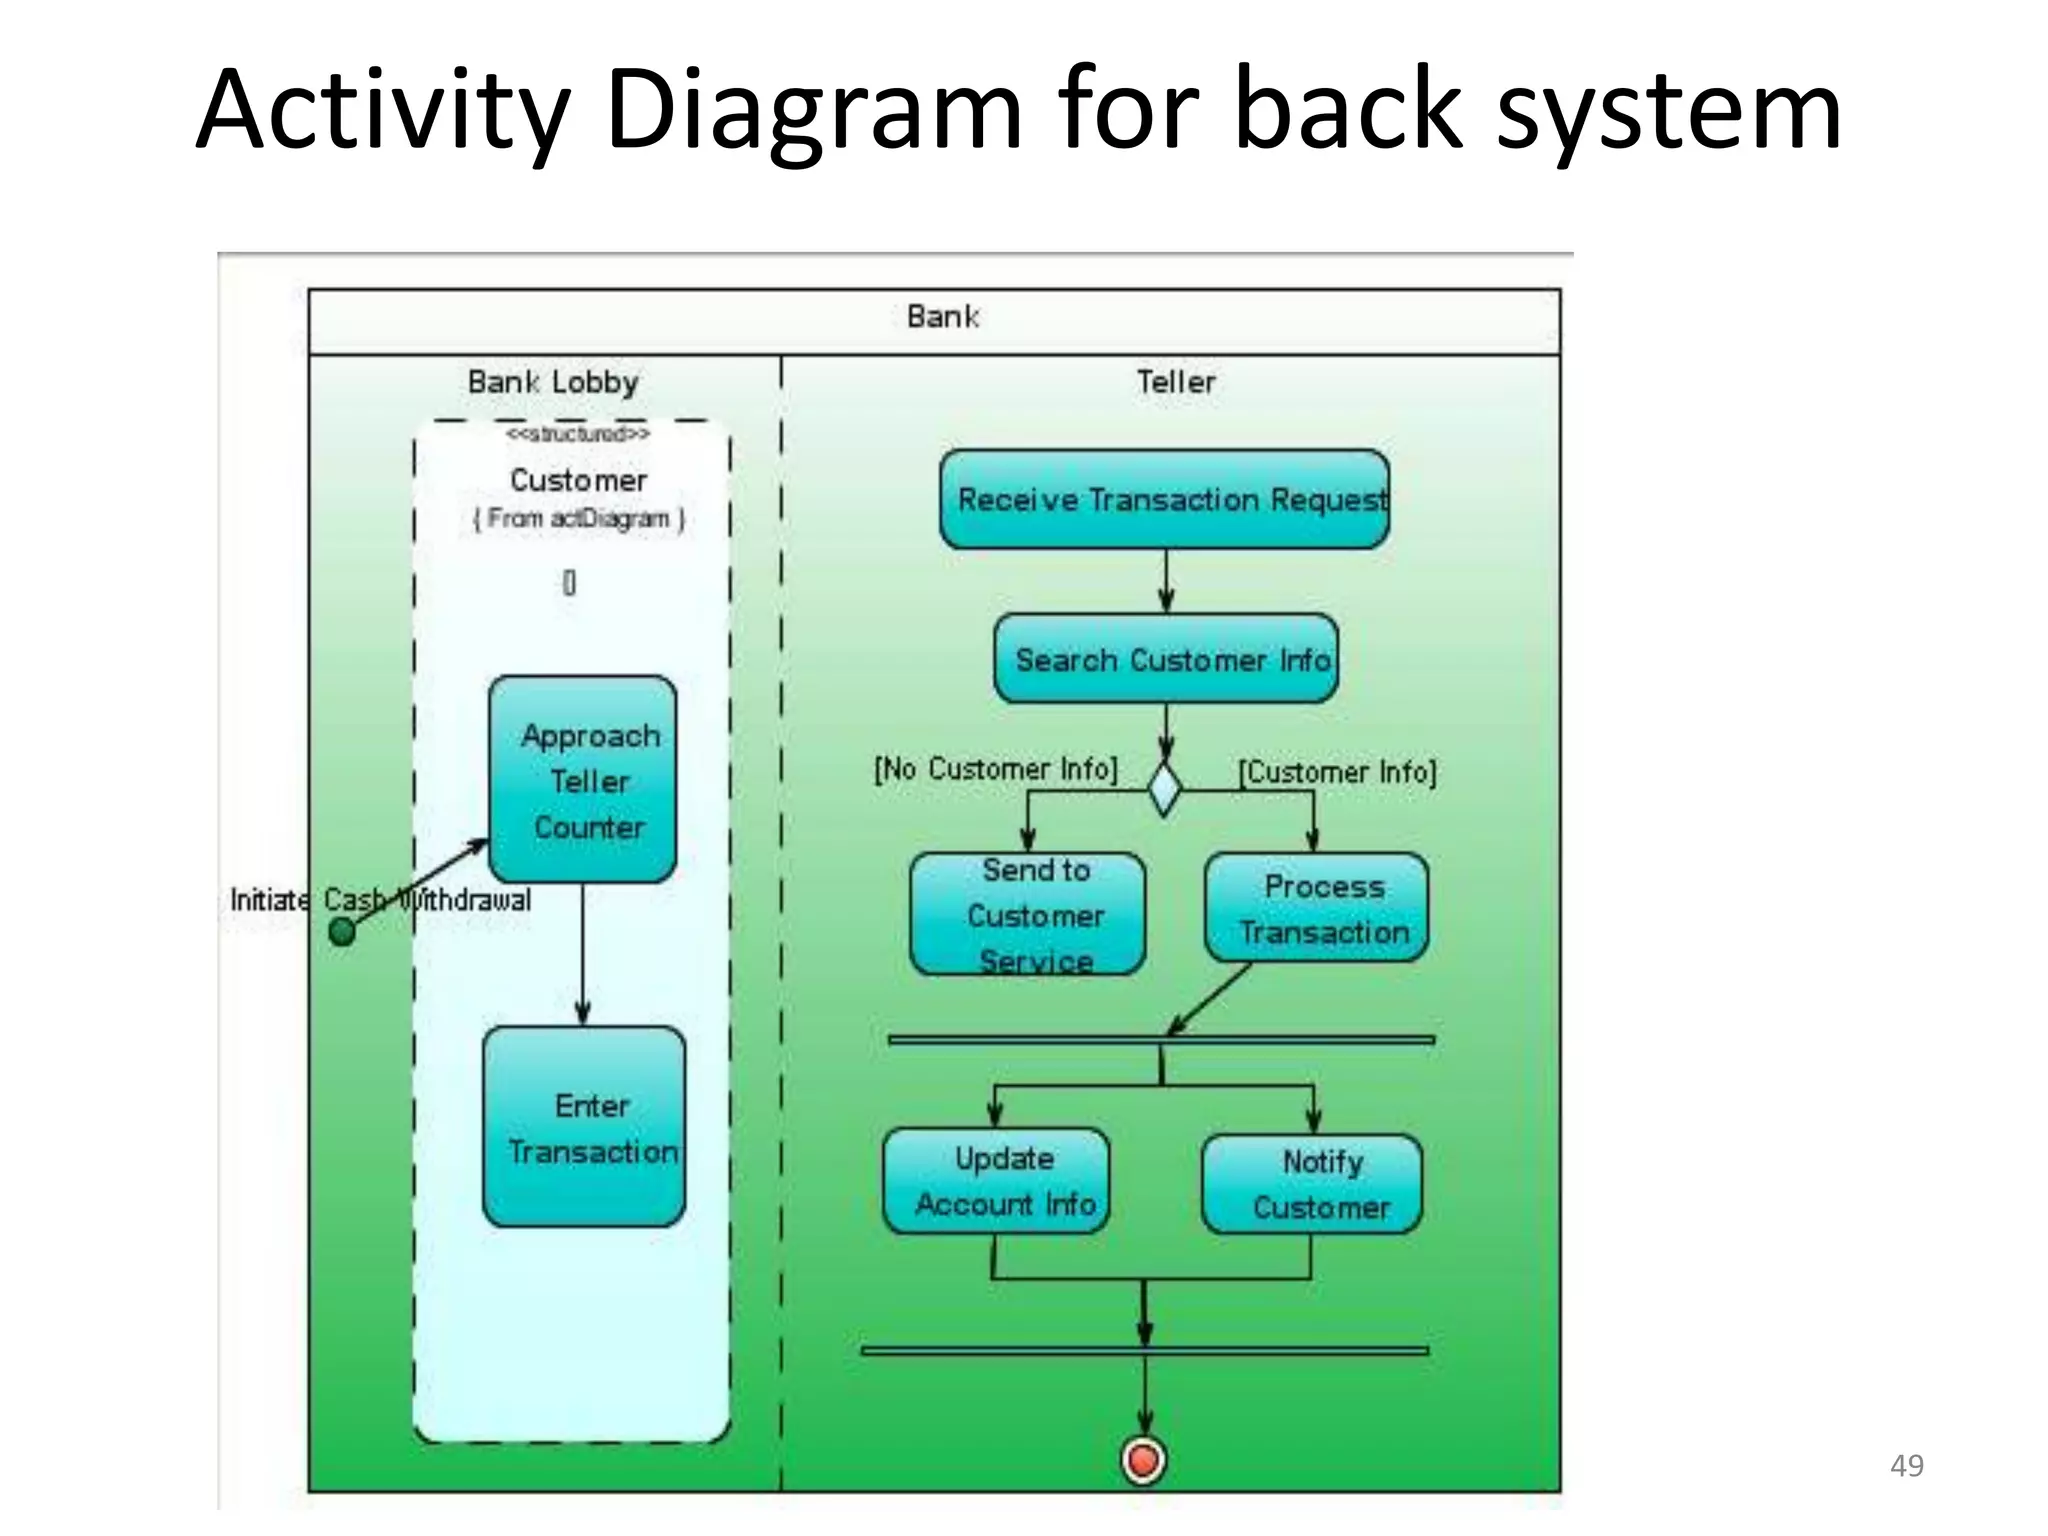
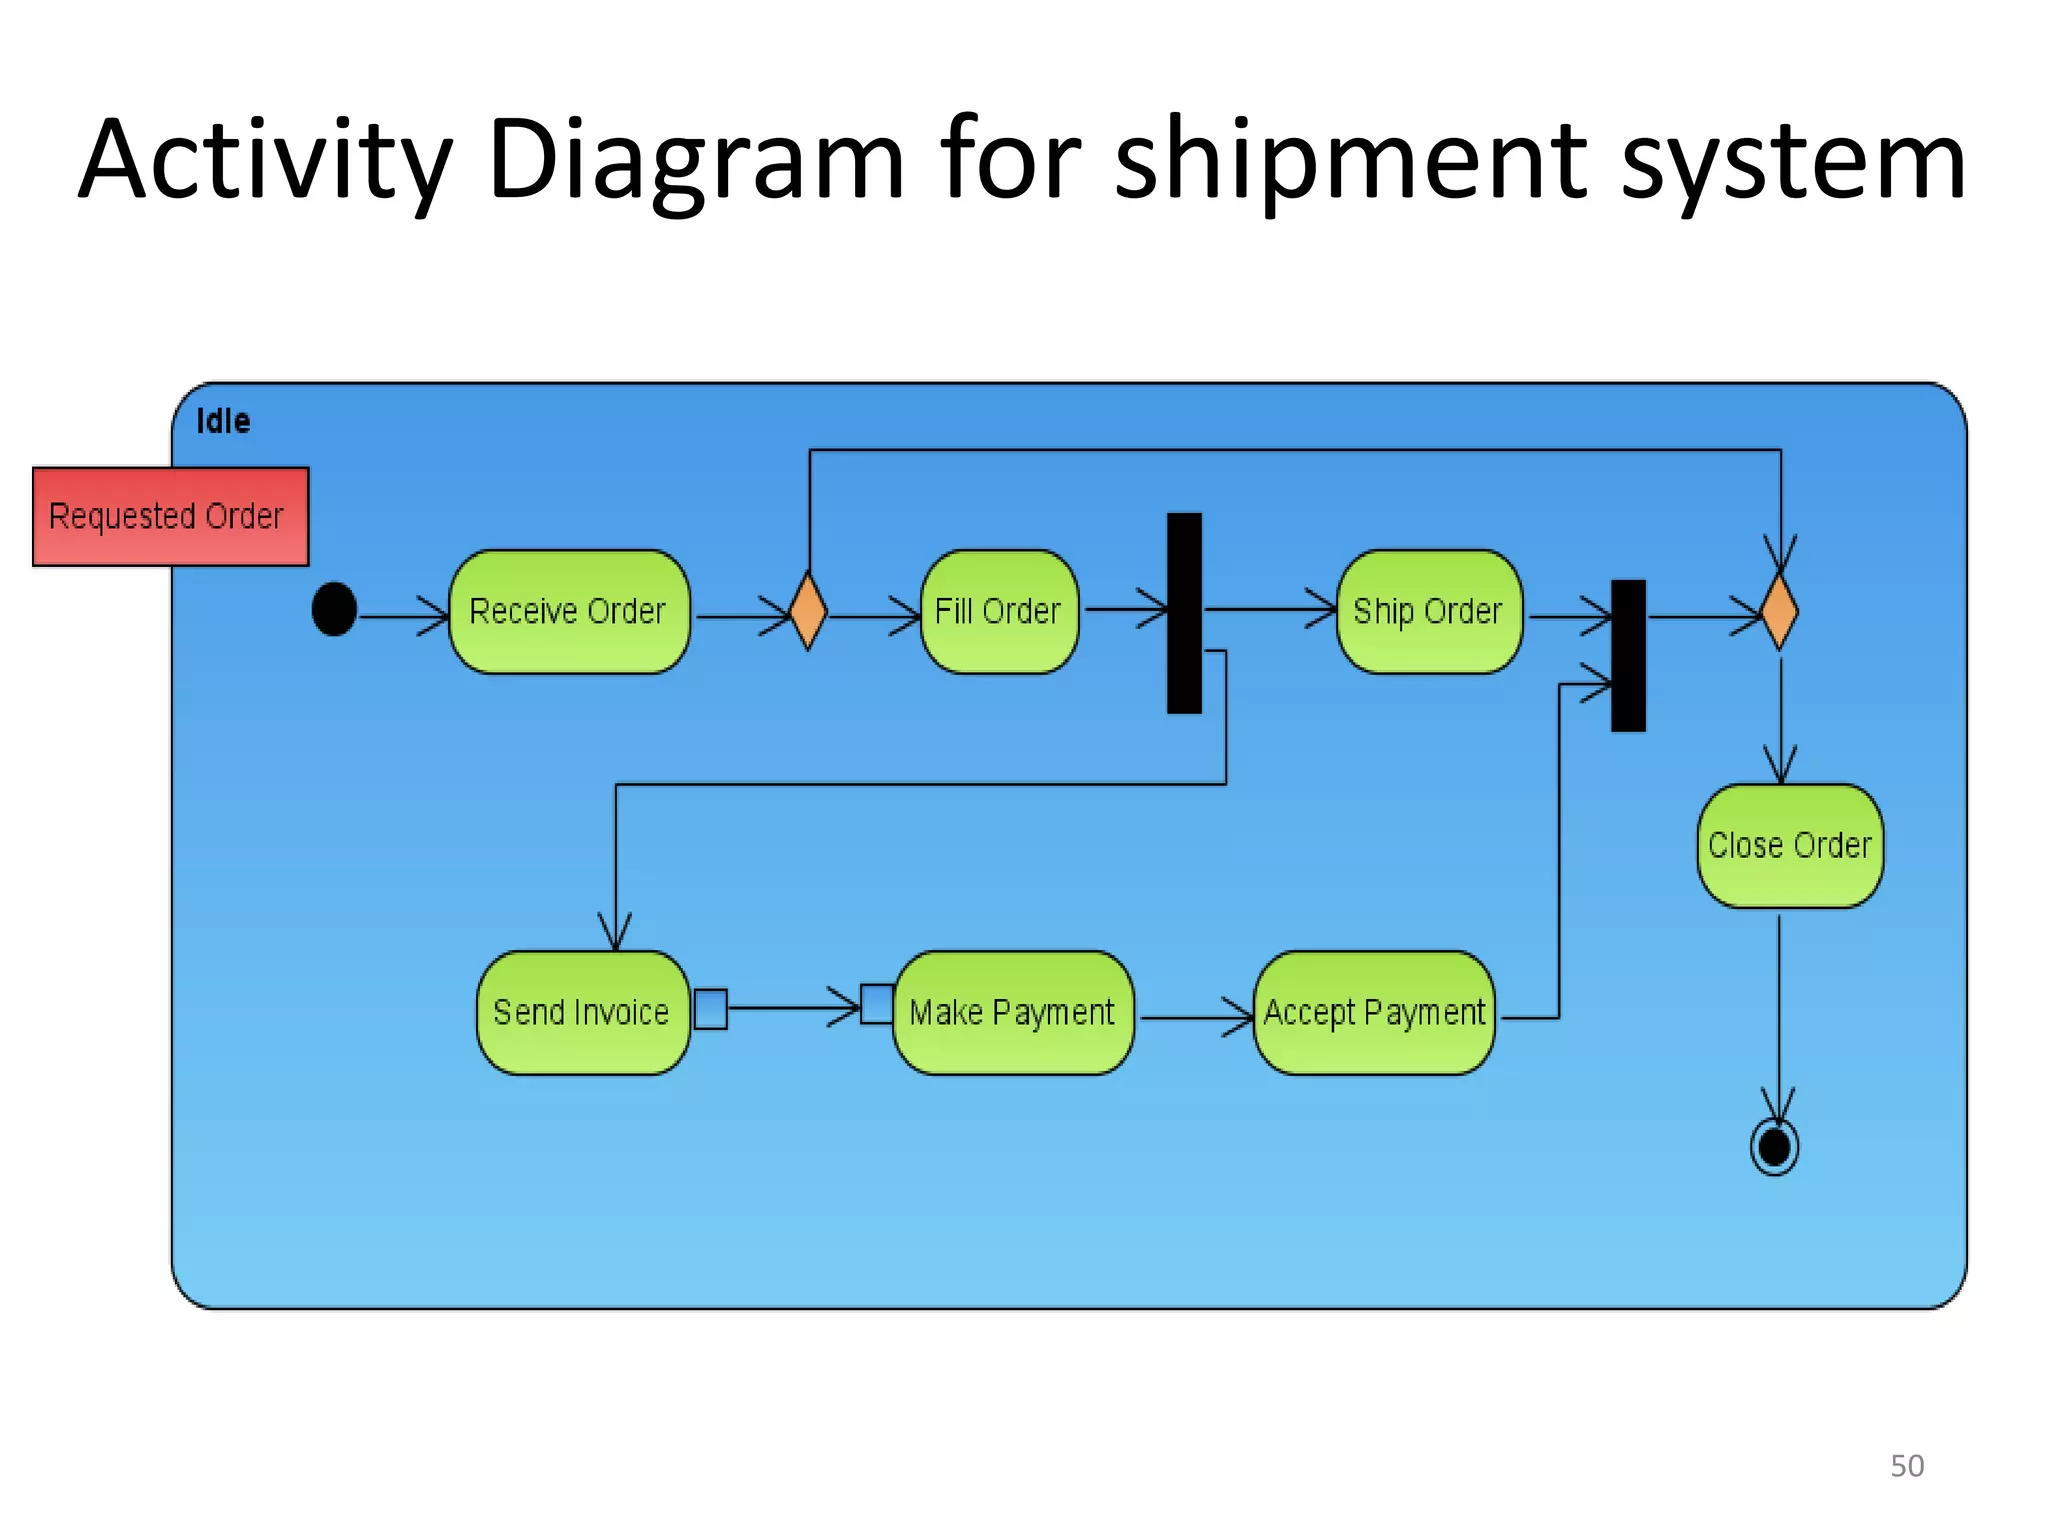
Presents practical examples of use cases and activity diagrams highlighting key processes in software systems.
Presents practical examples of use cases and activity diagrams highlighting key processes in software systems.
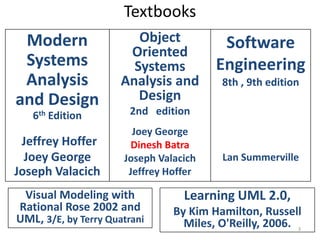
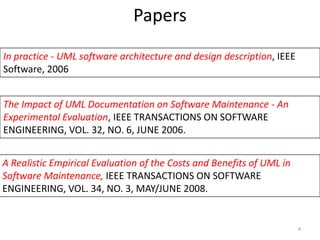
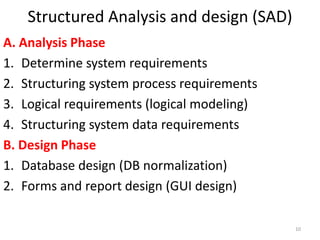
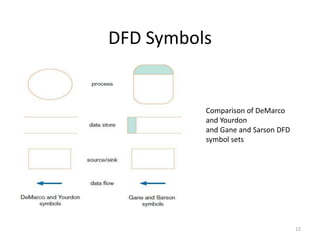
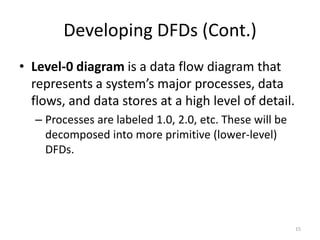
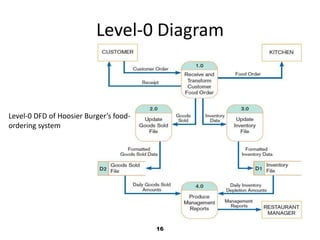
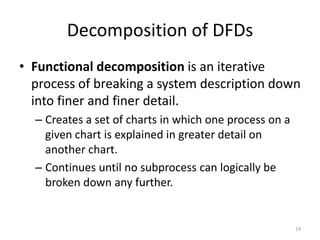
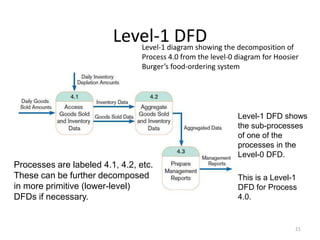
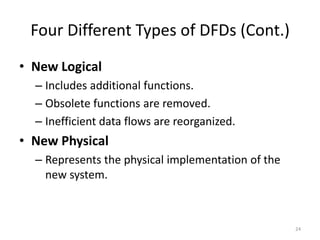
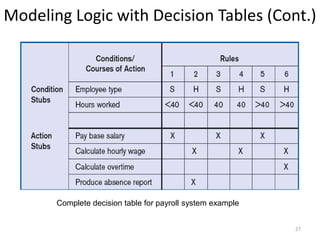
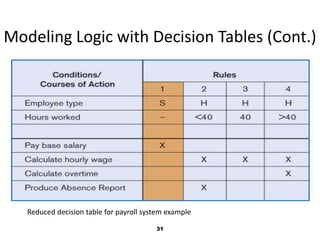
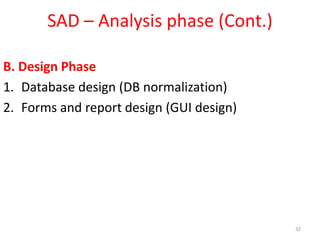
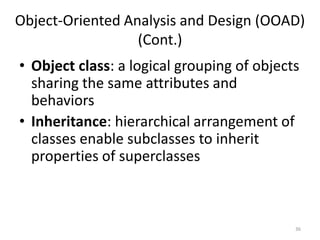
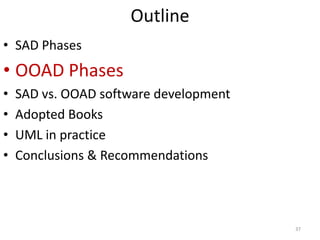
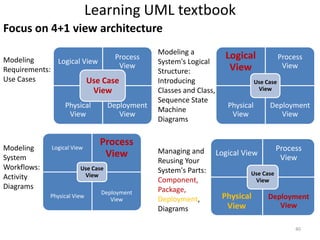
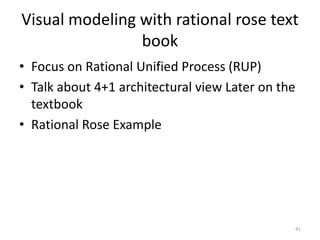
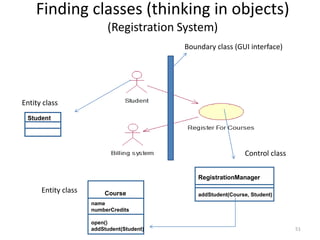
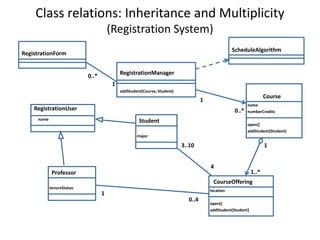
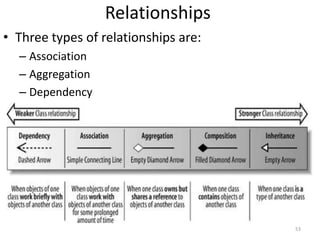
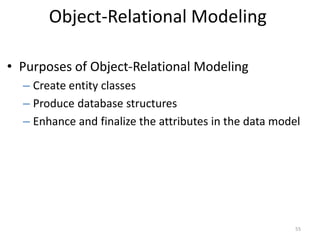
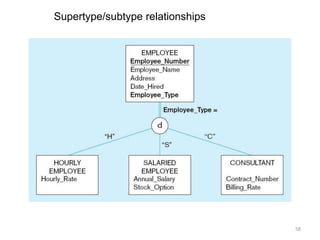
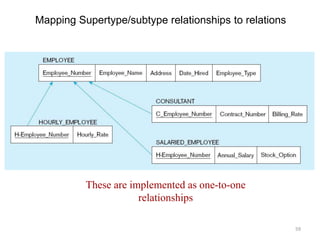
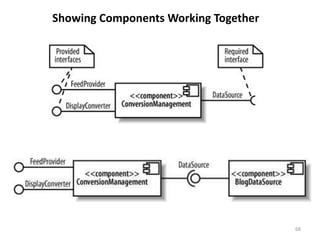
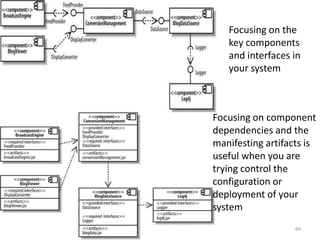
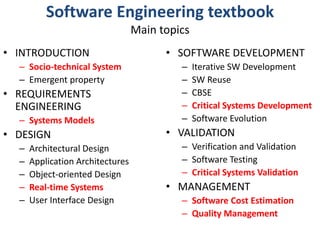
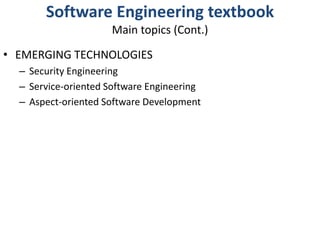
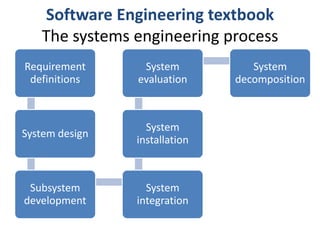
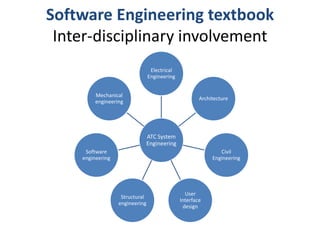
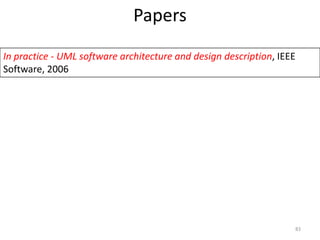
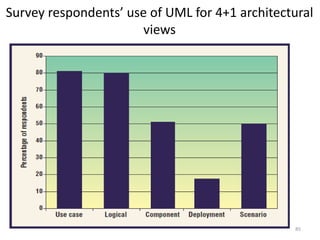
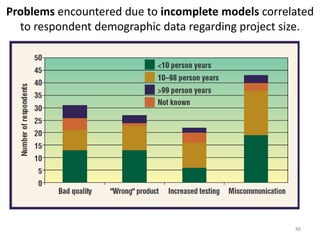
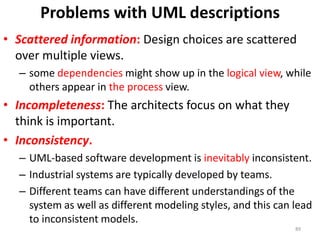
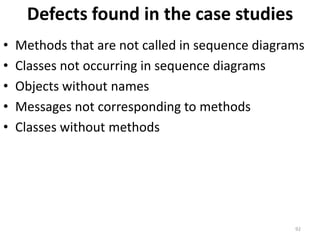
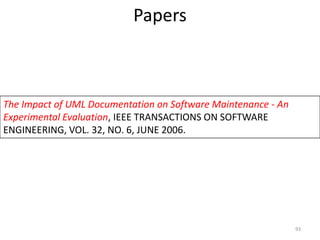
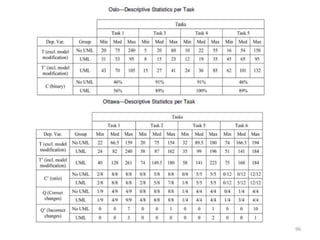
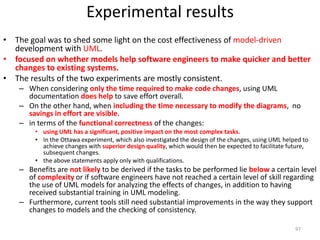
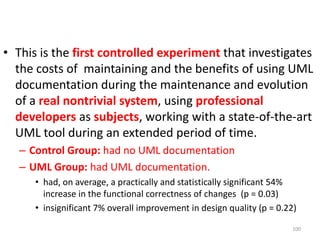
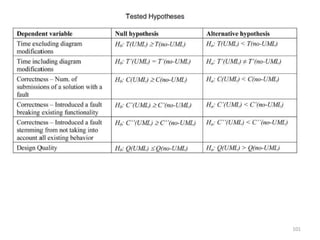
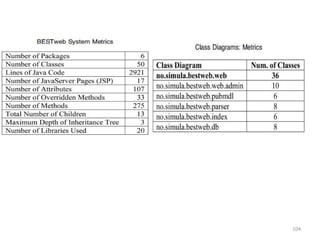
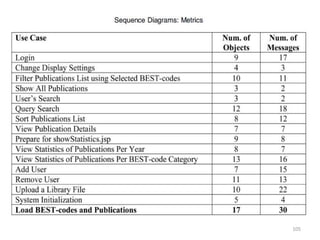
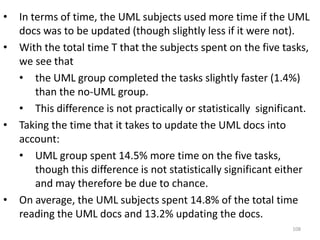
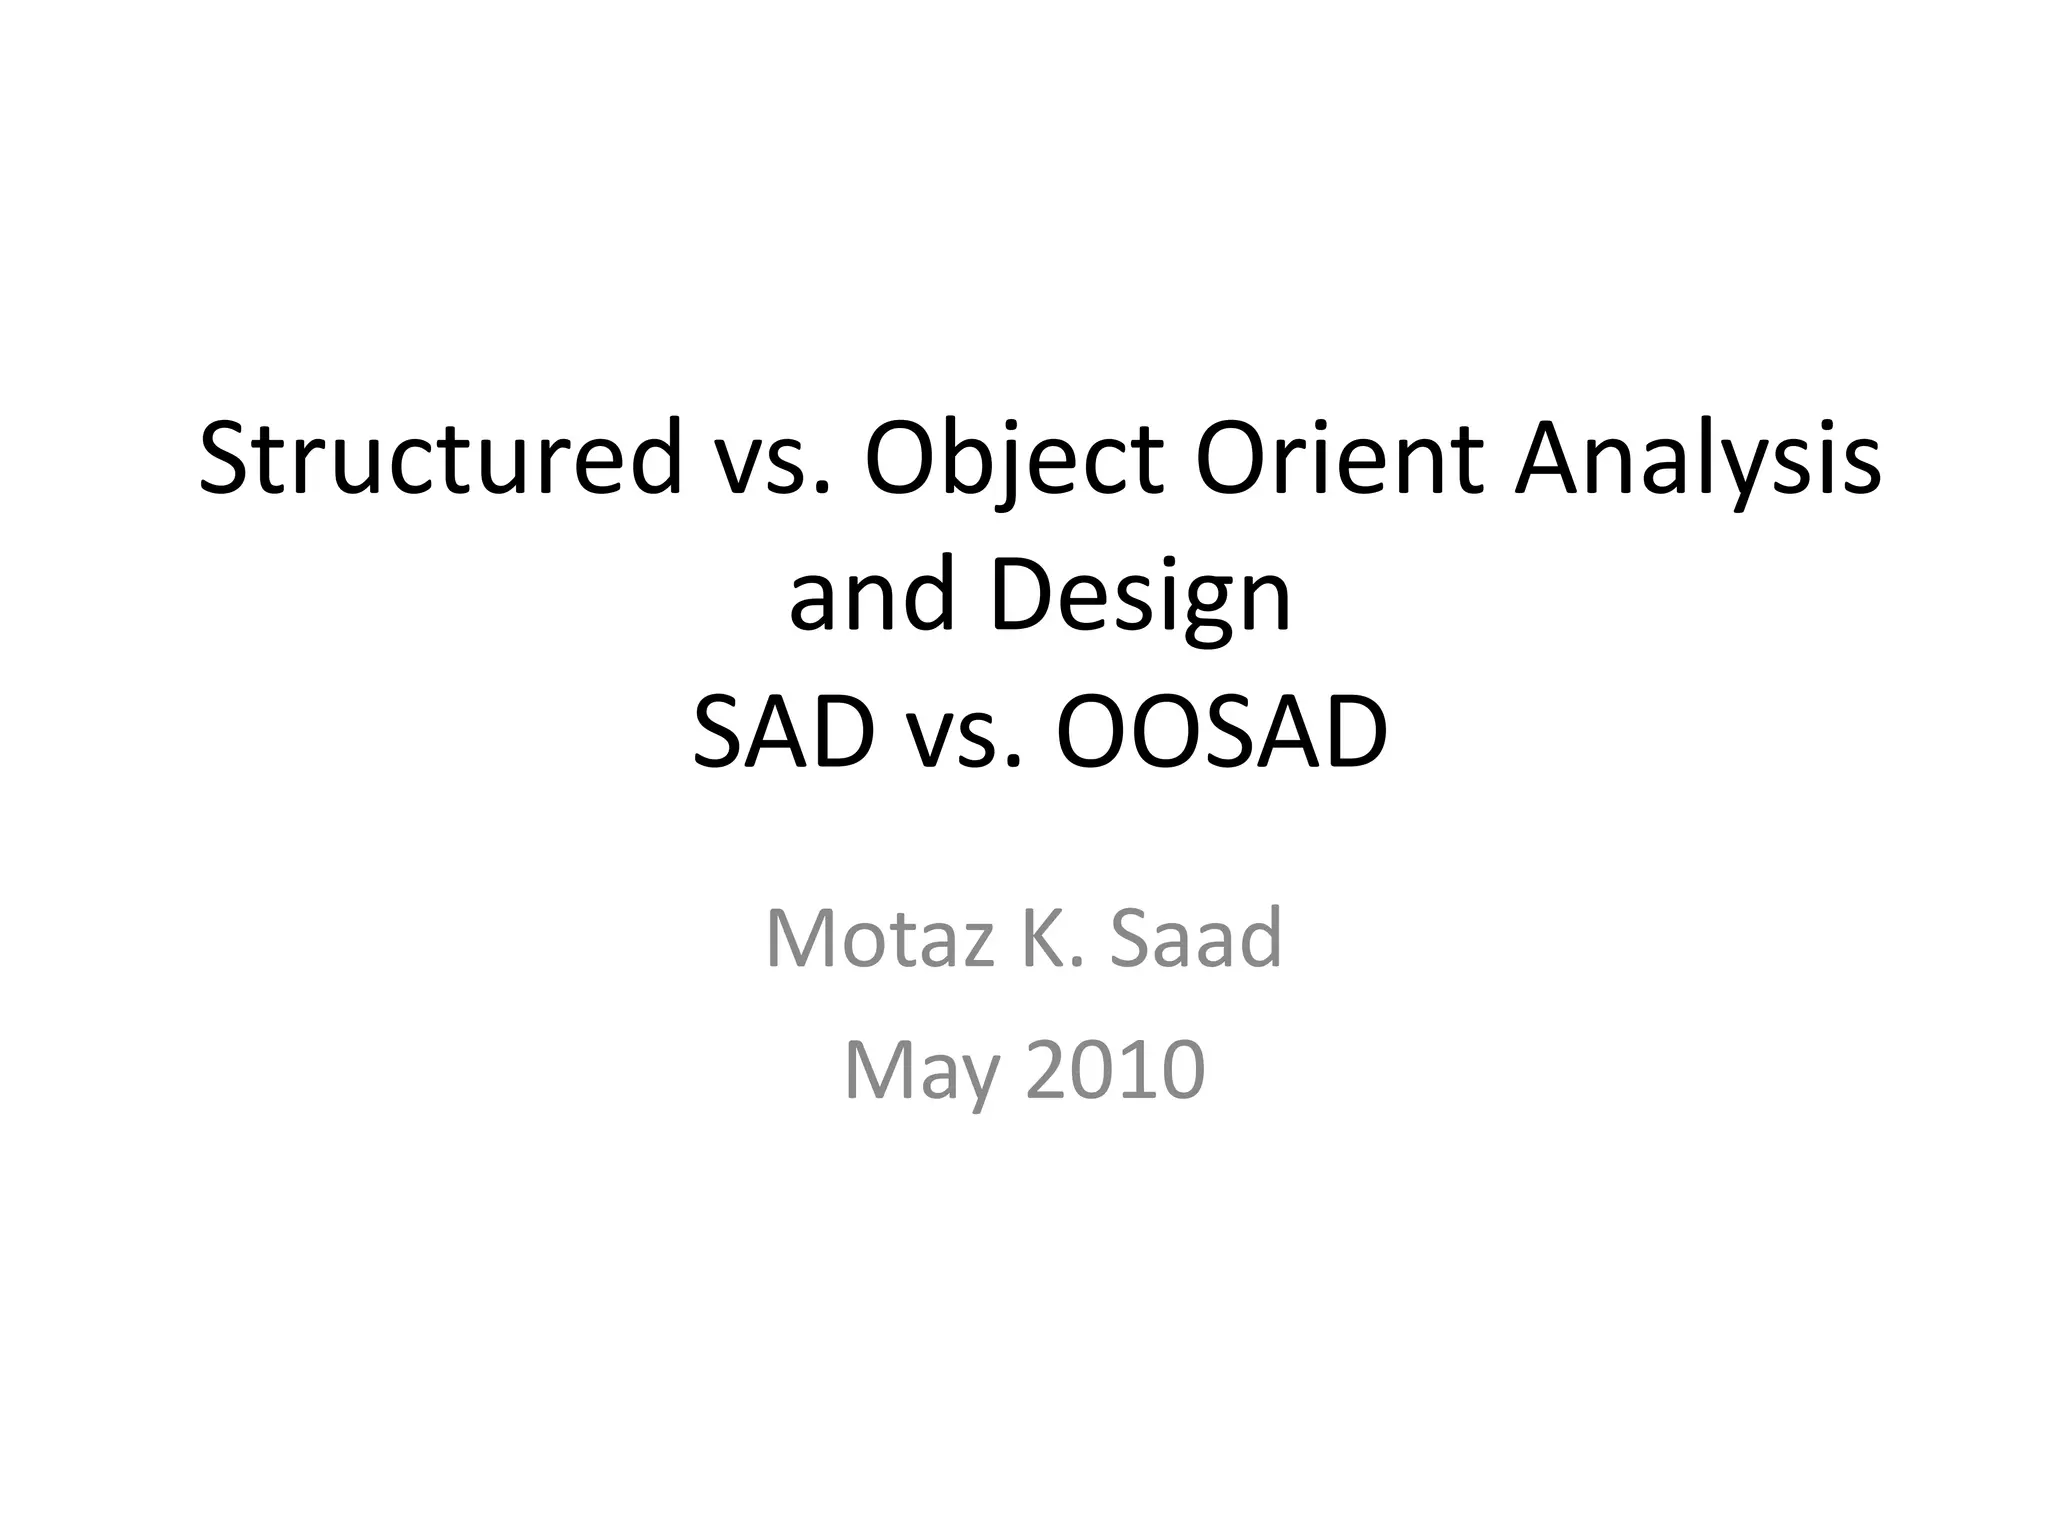
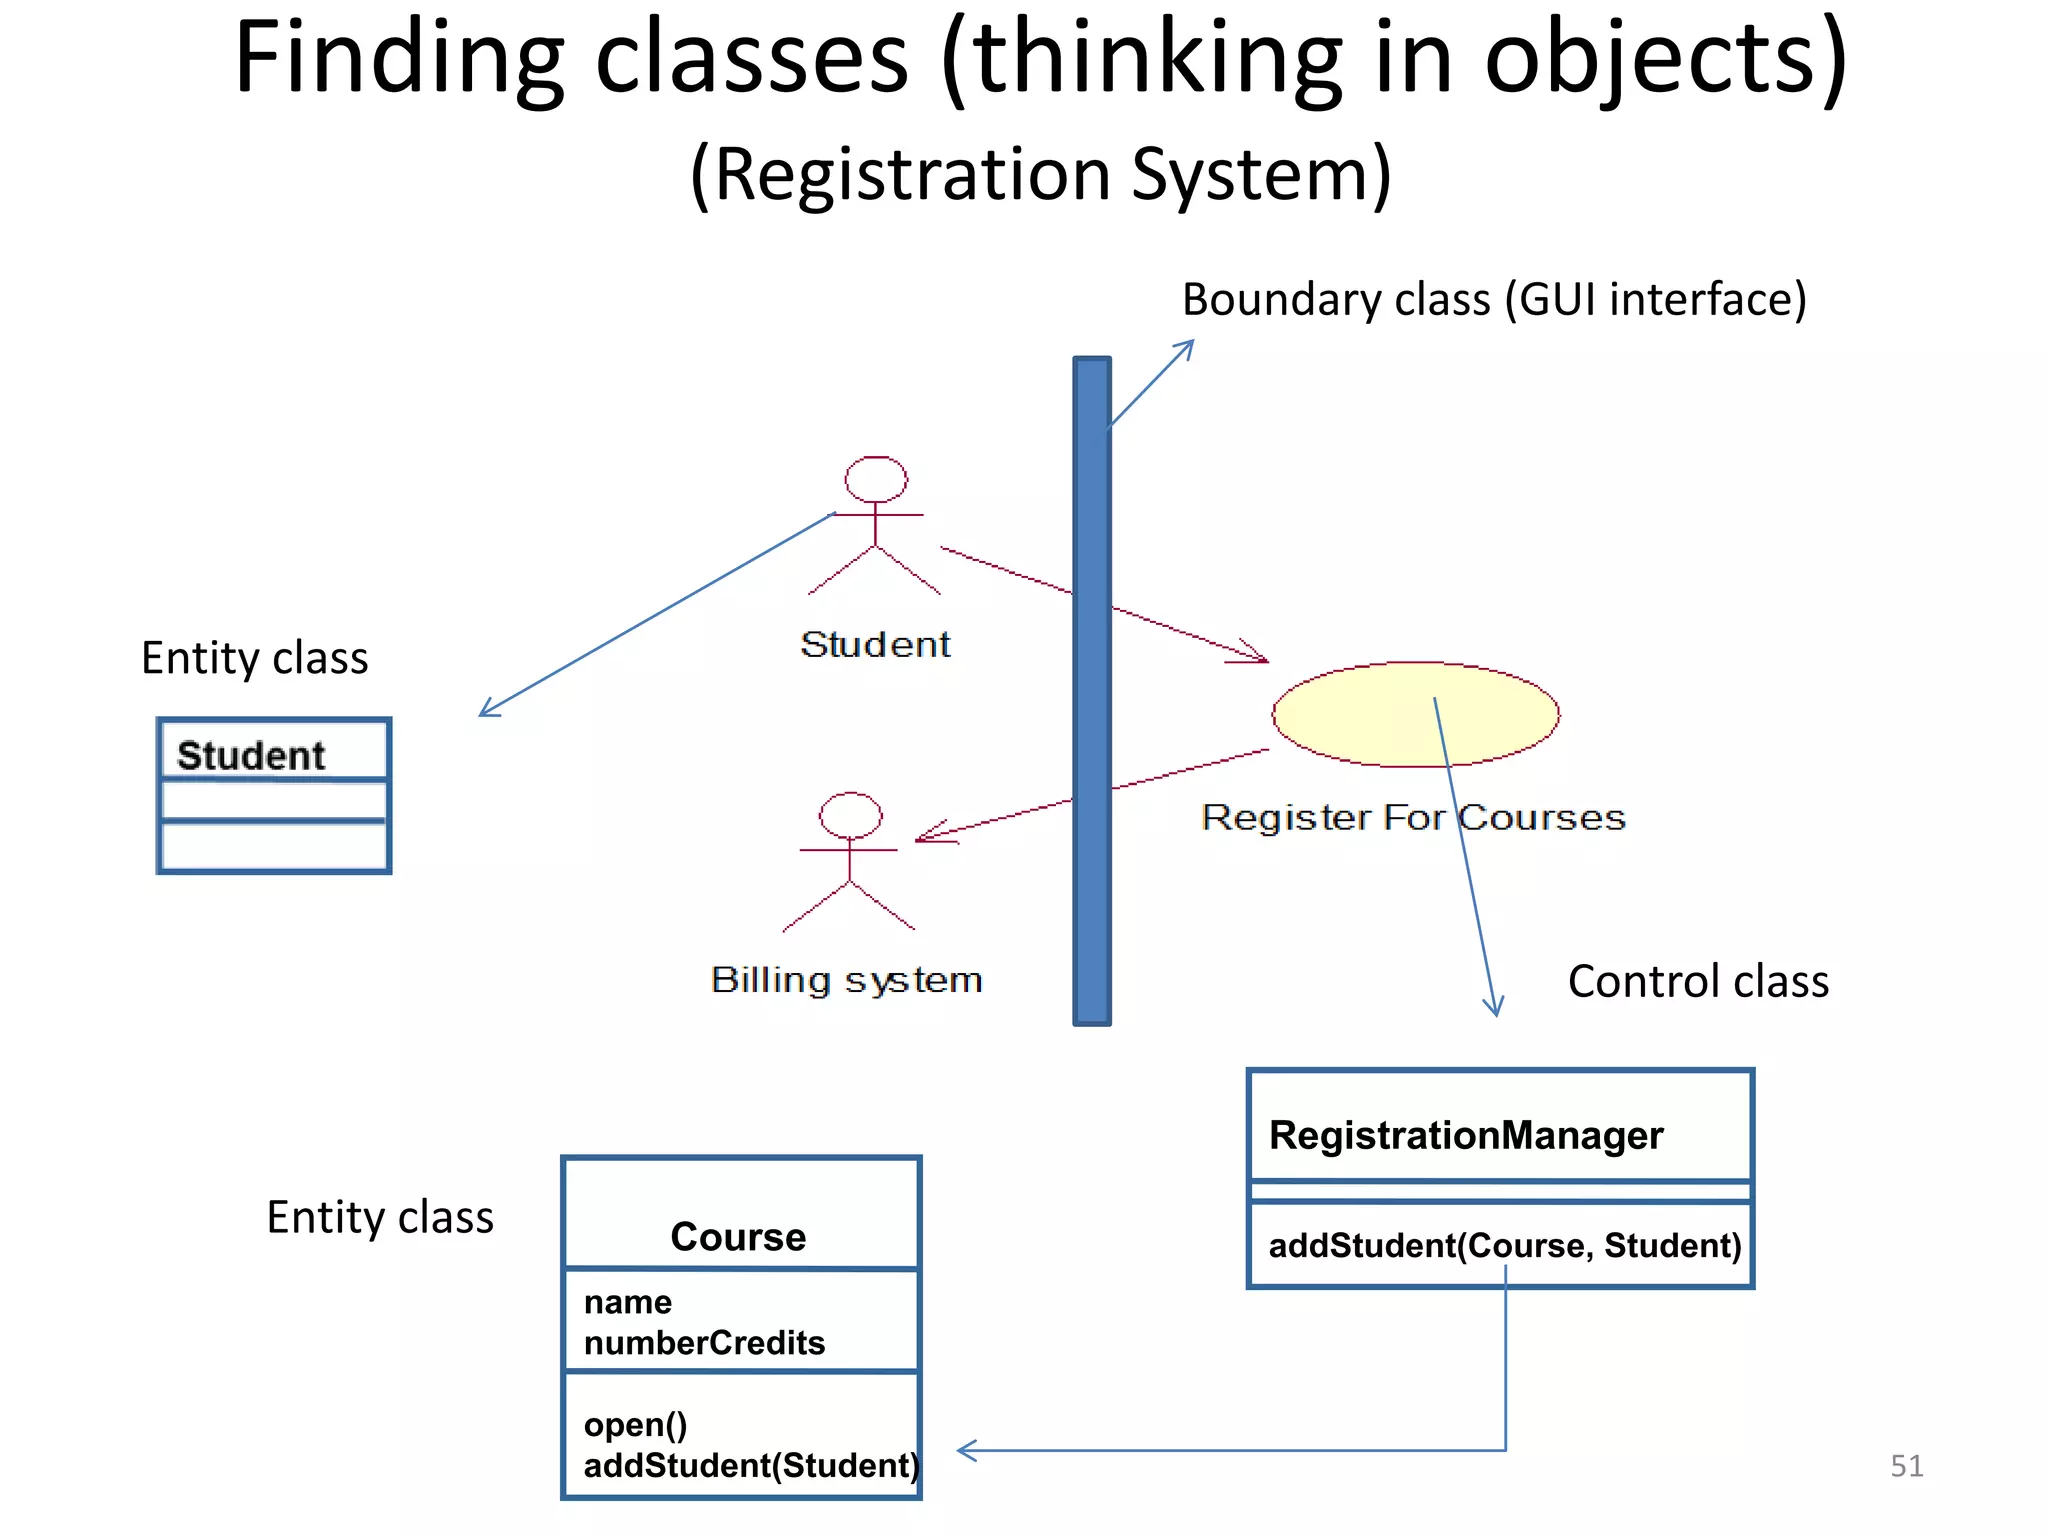
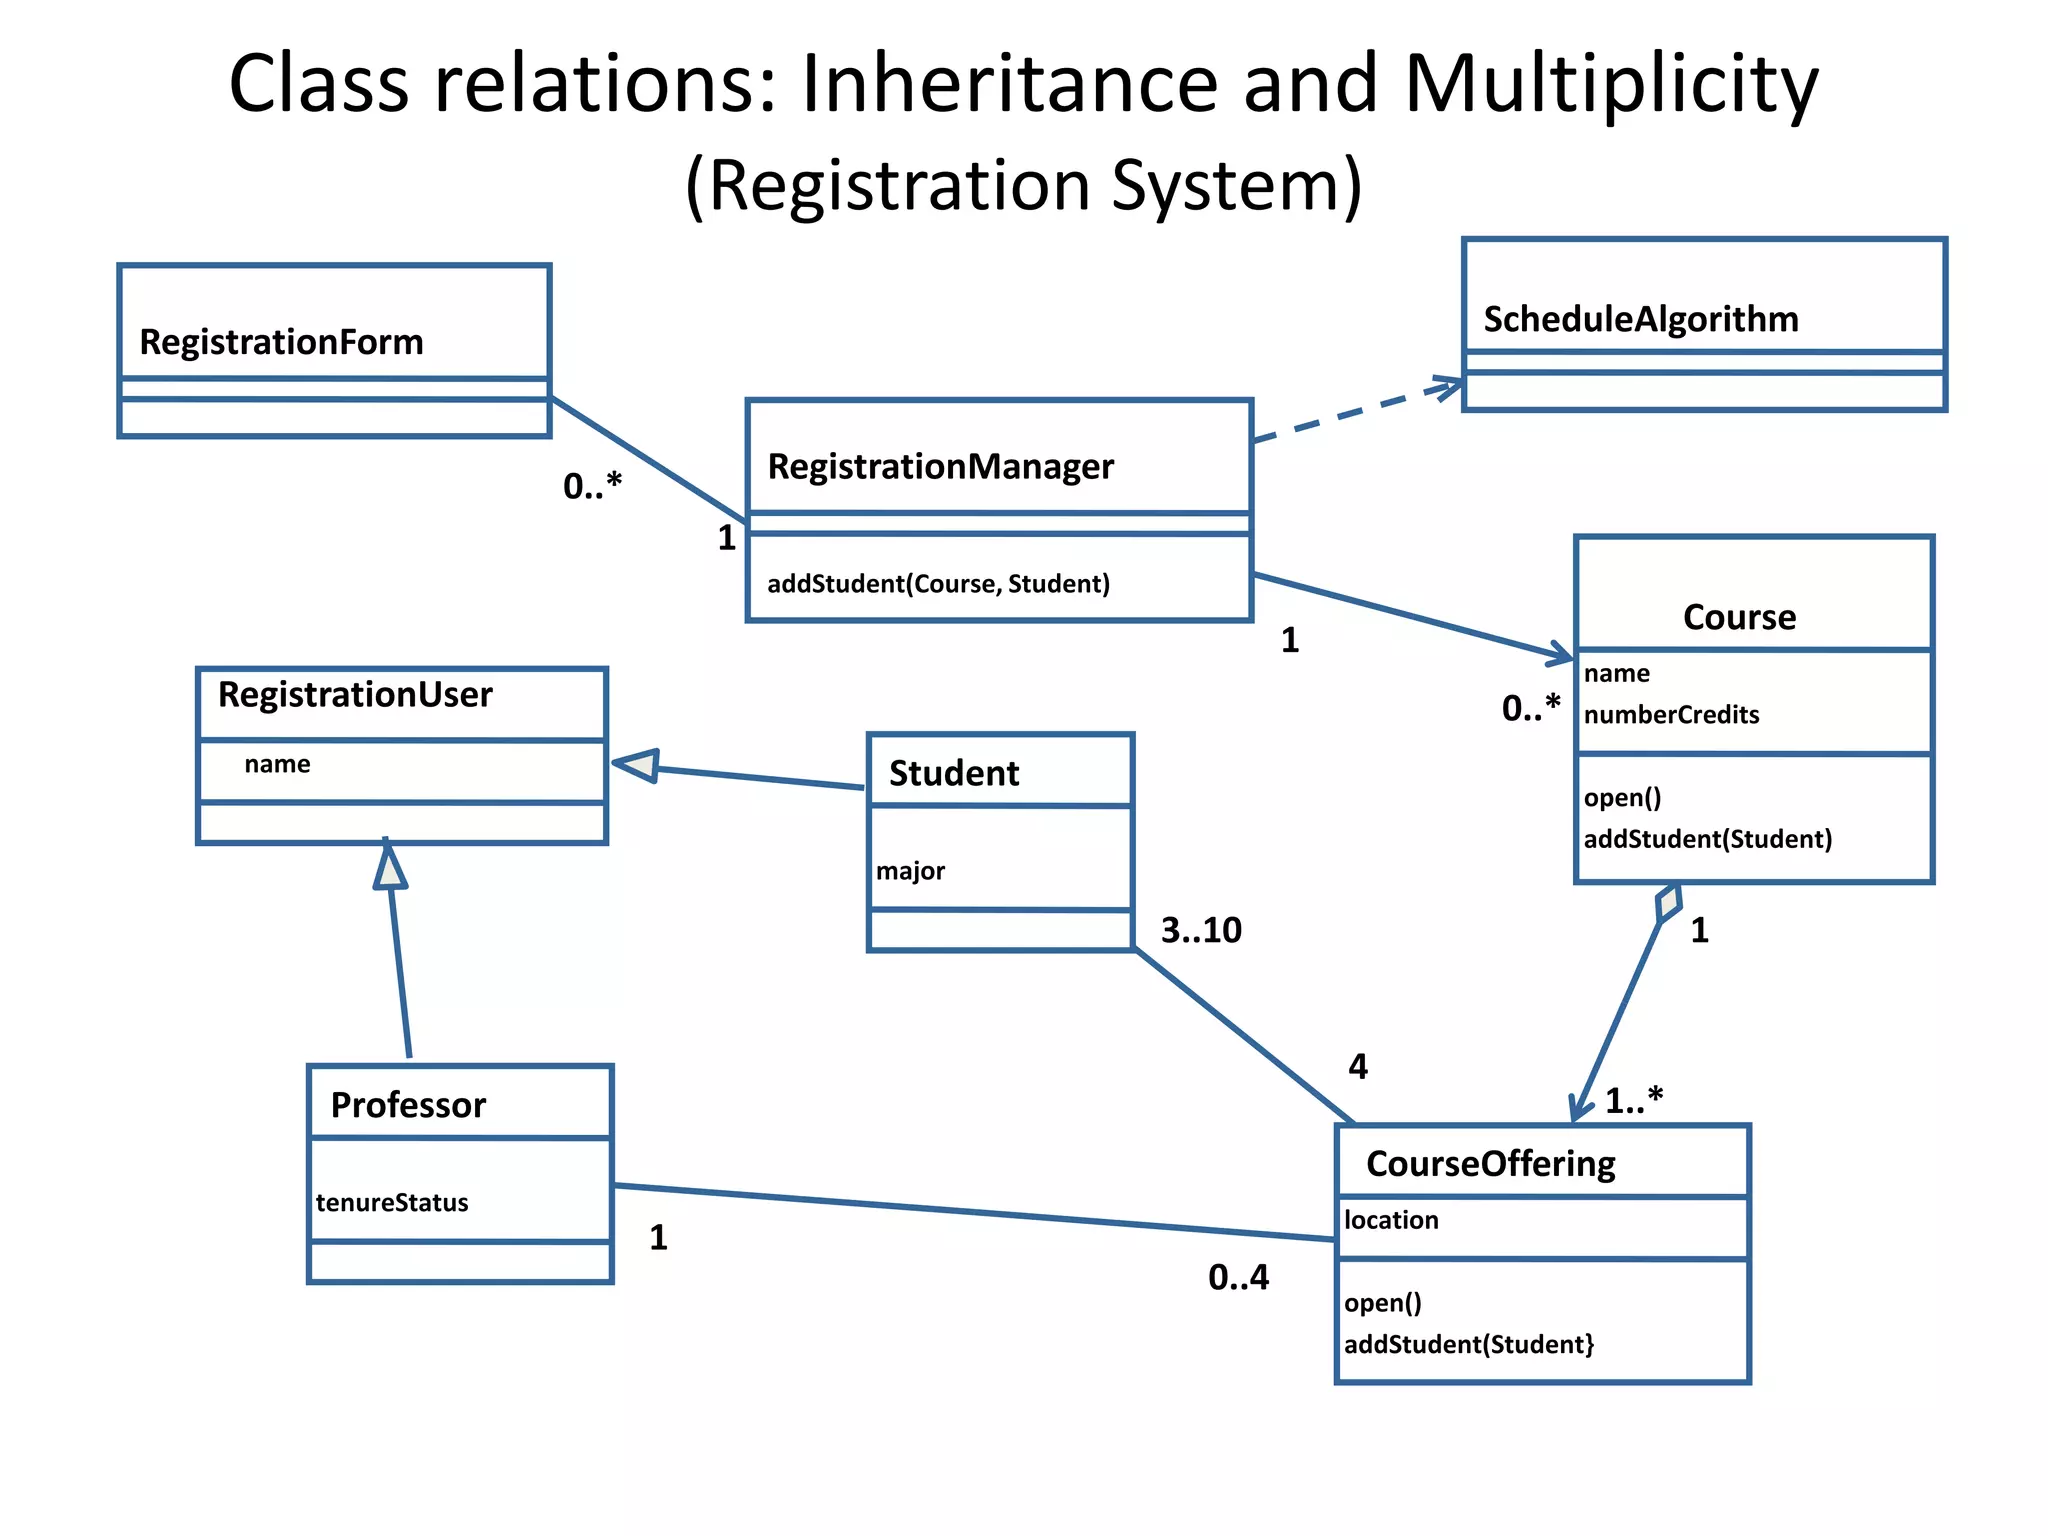
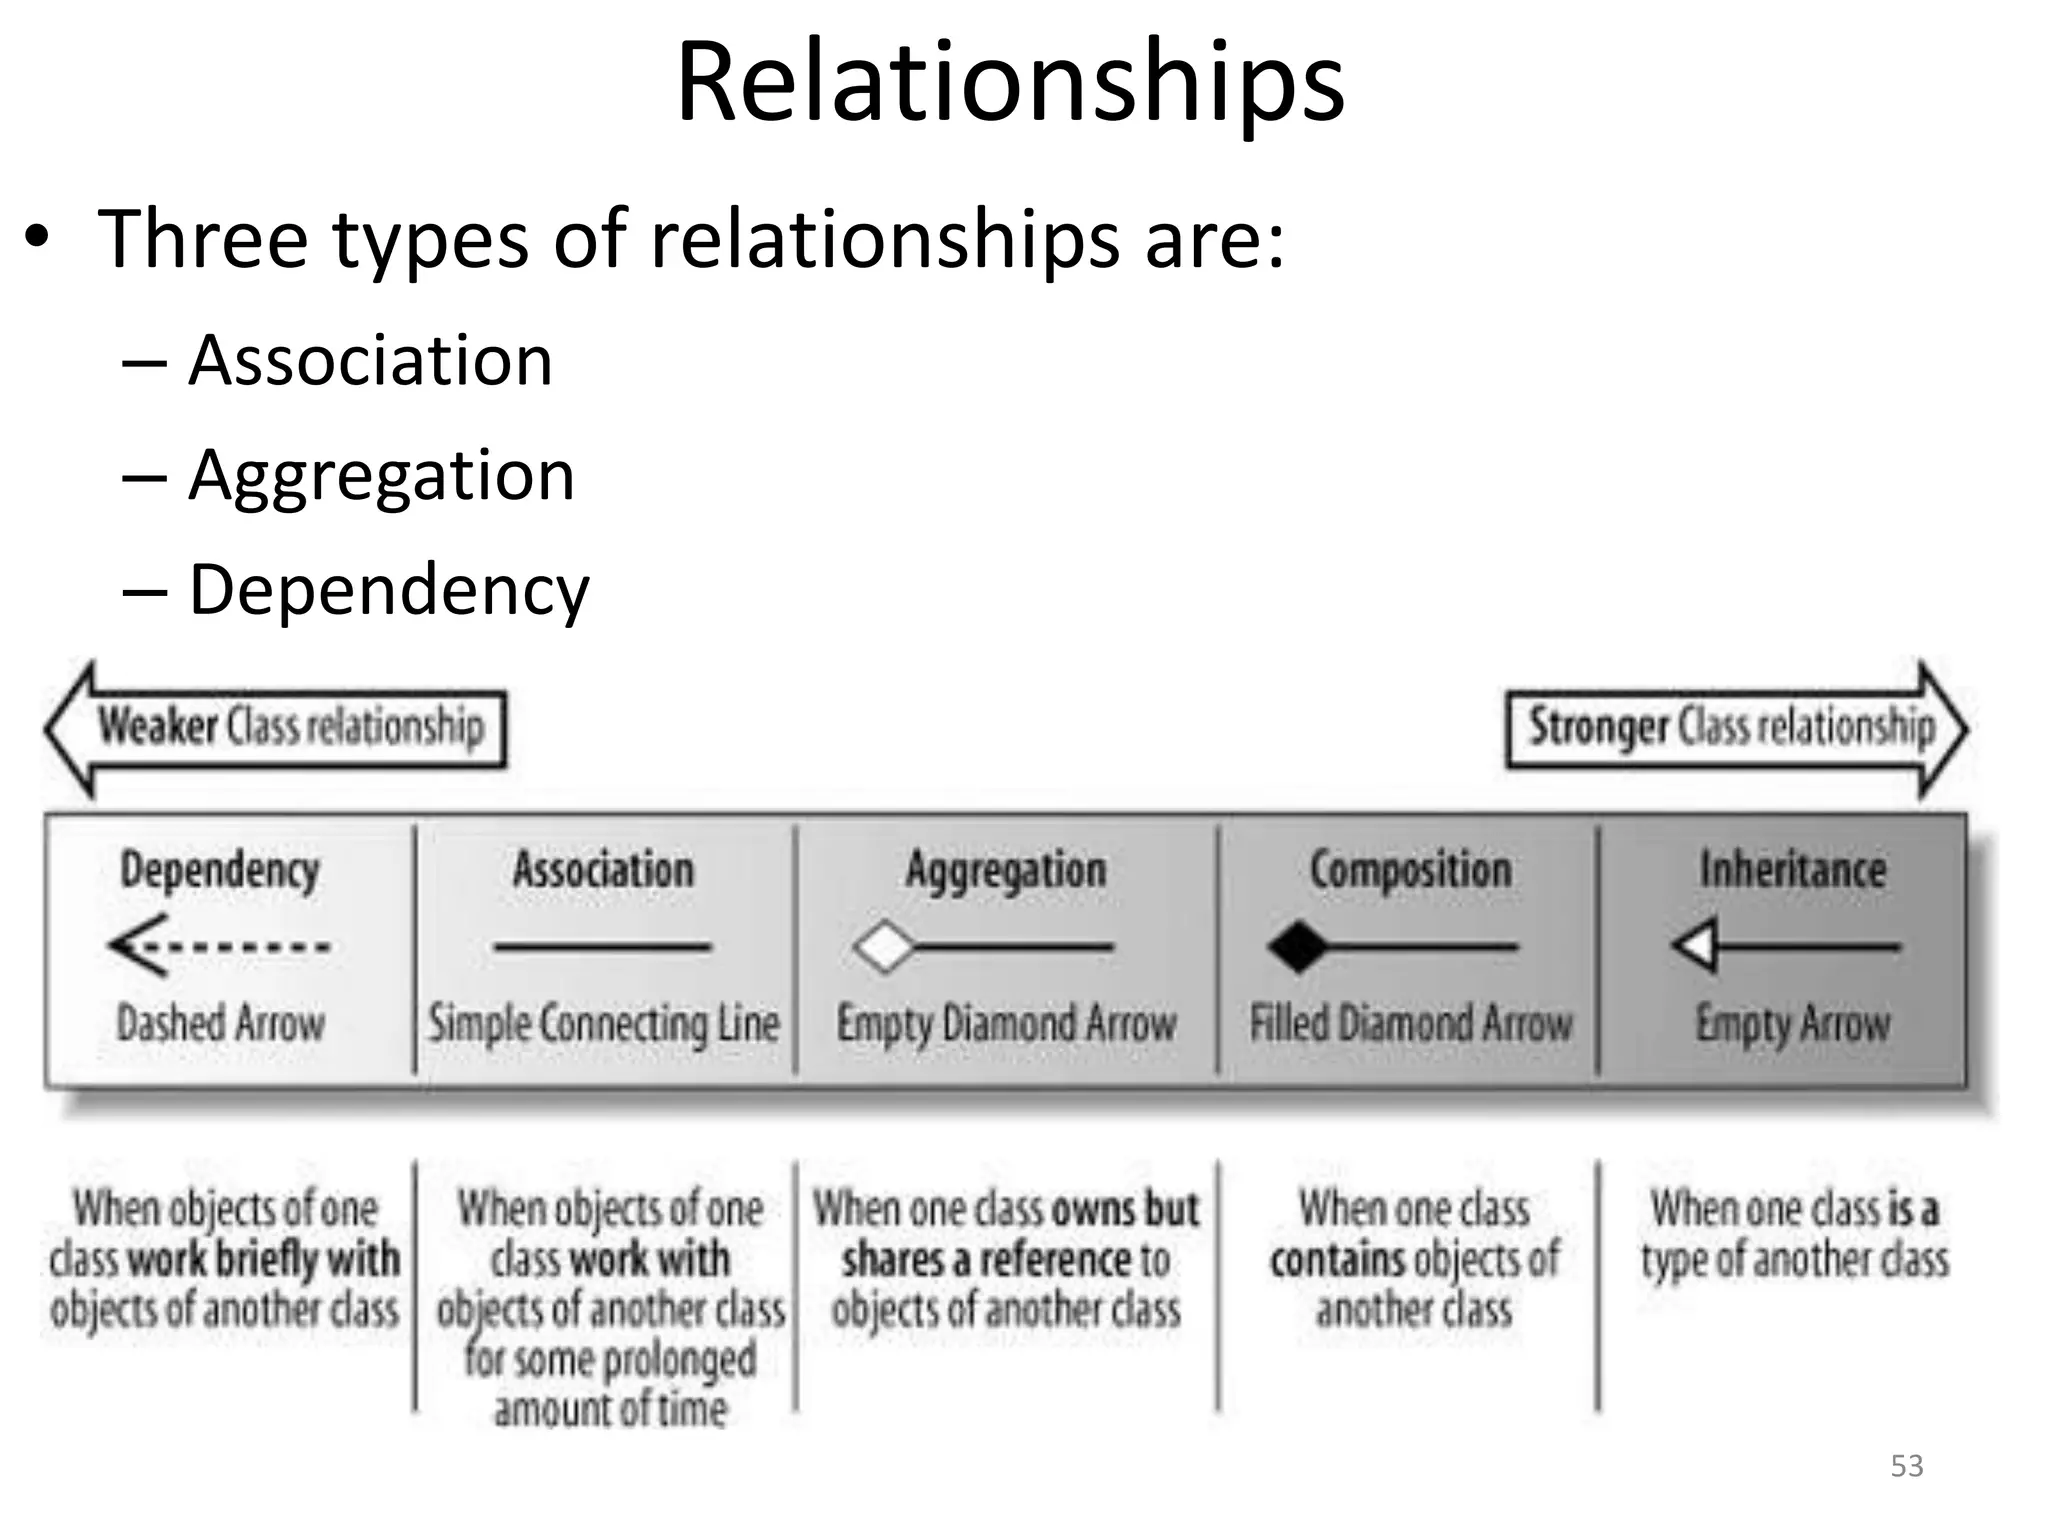
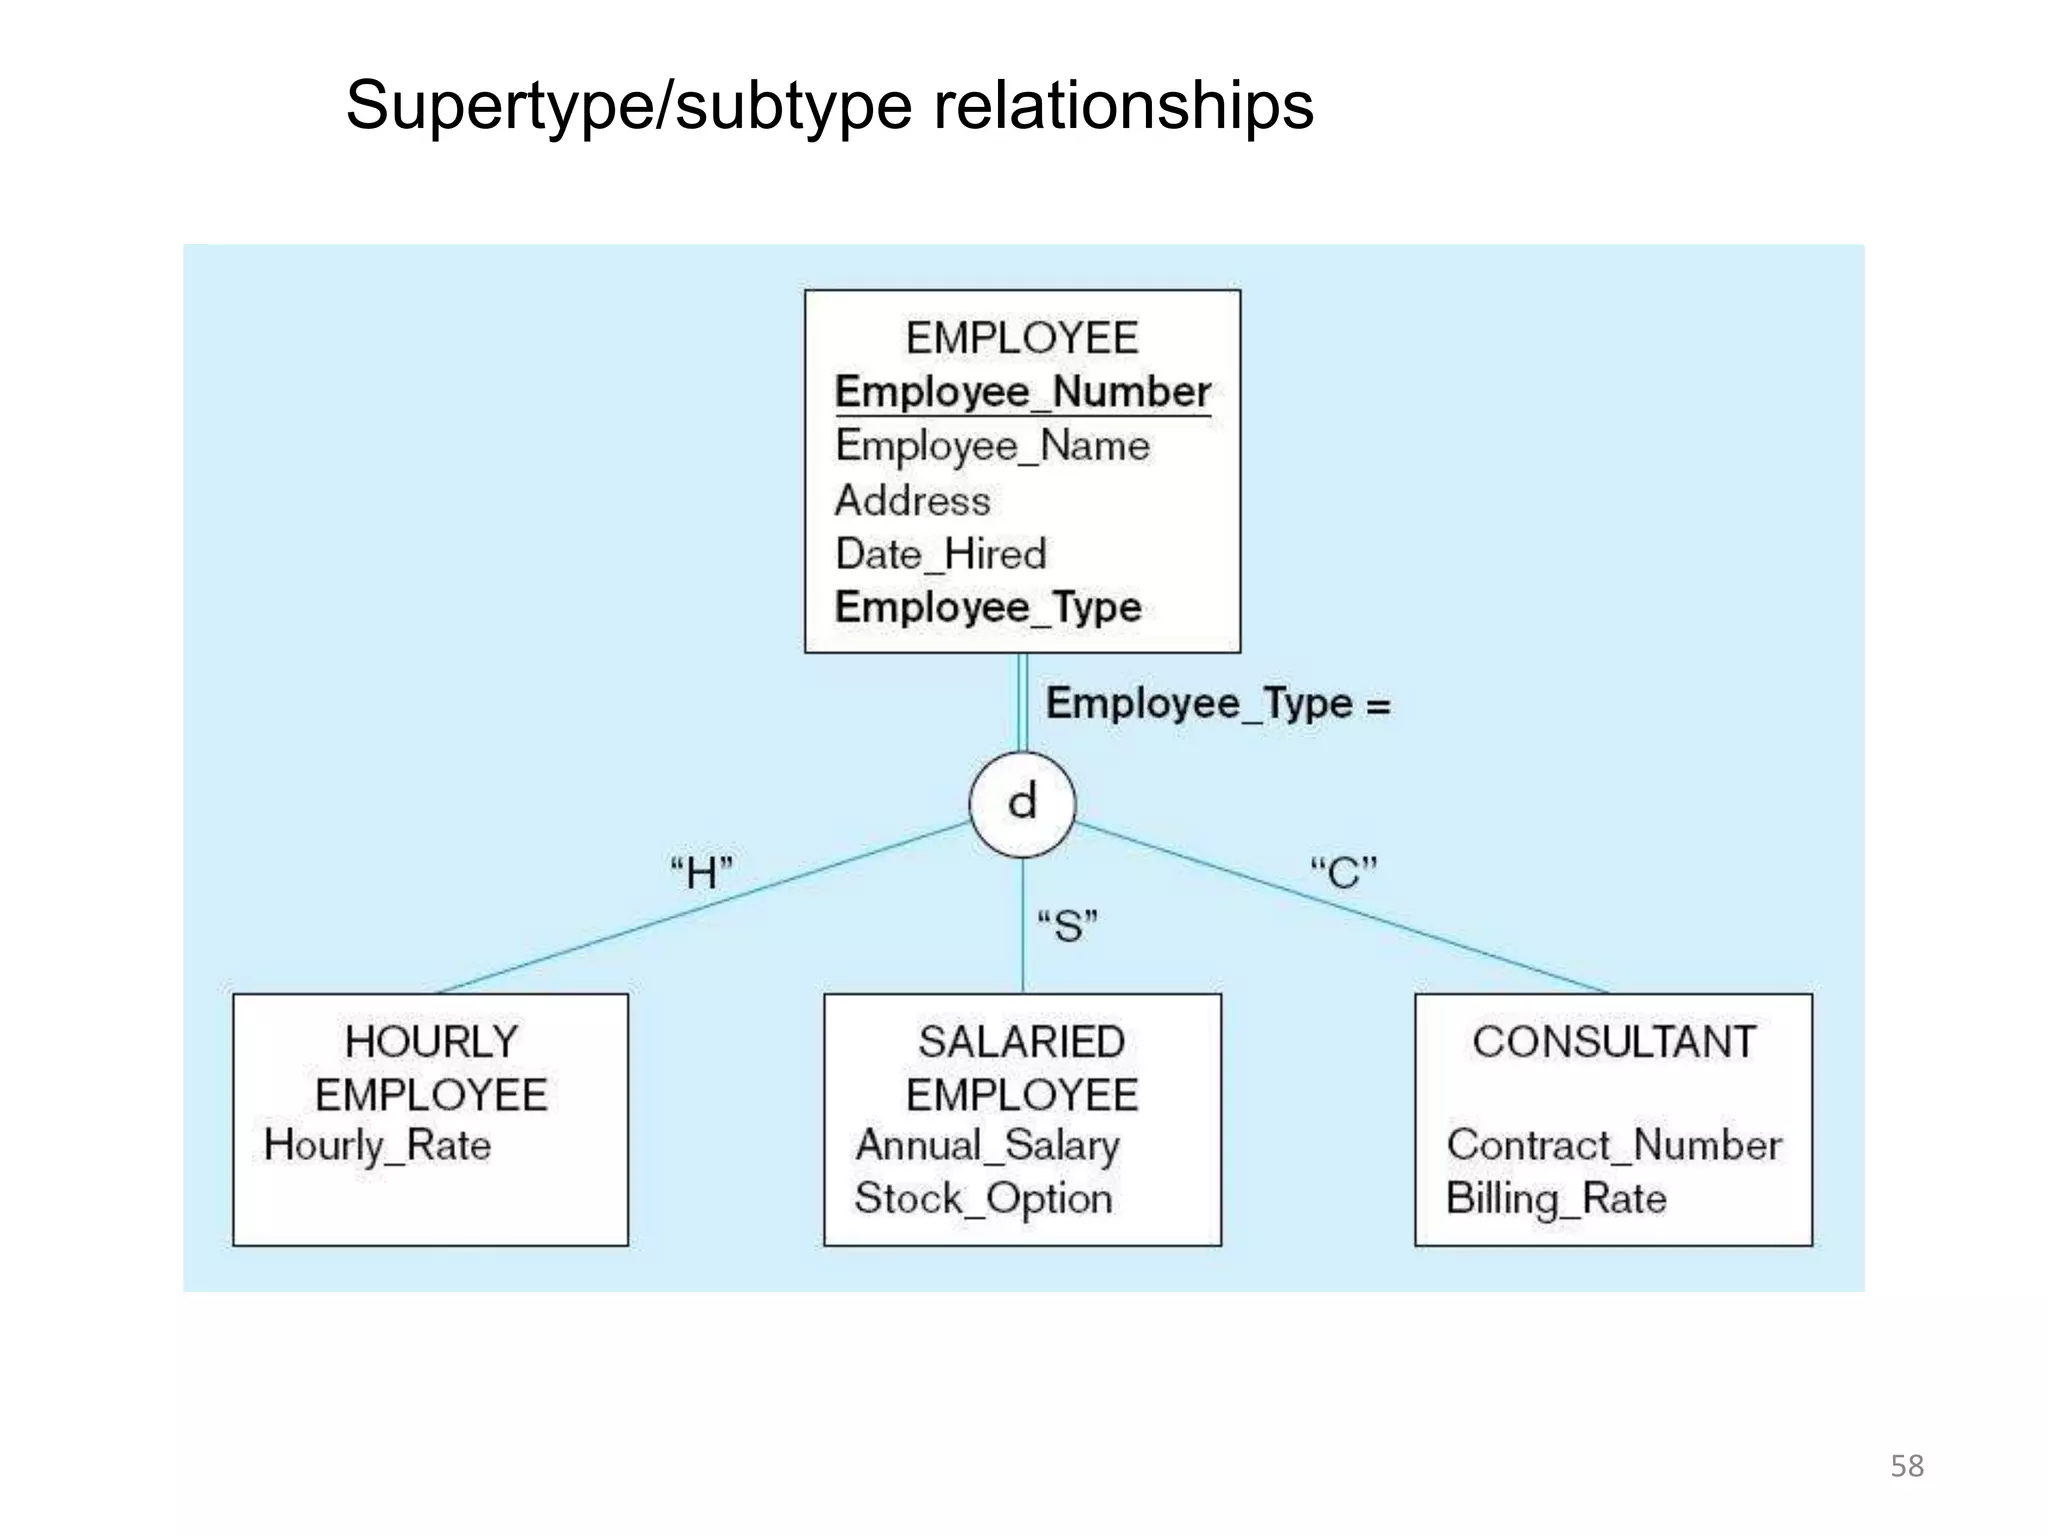
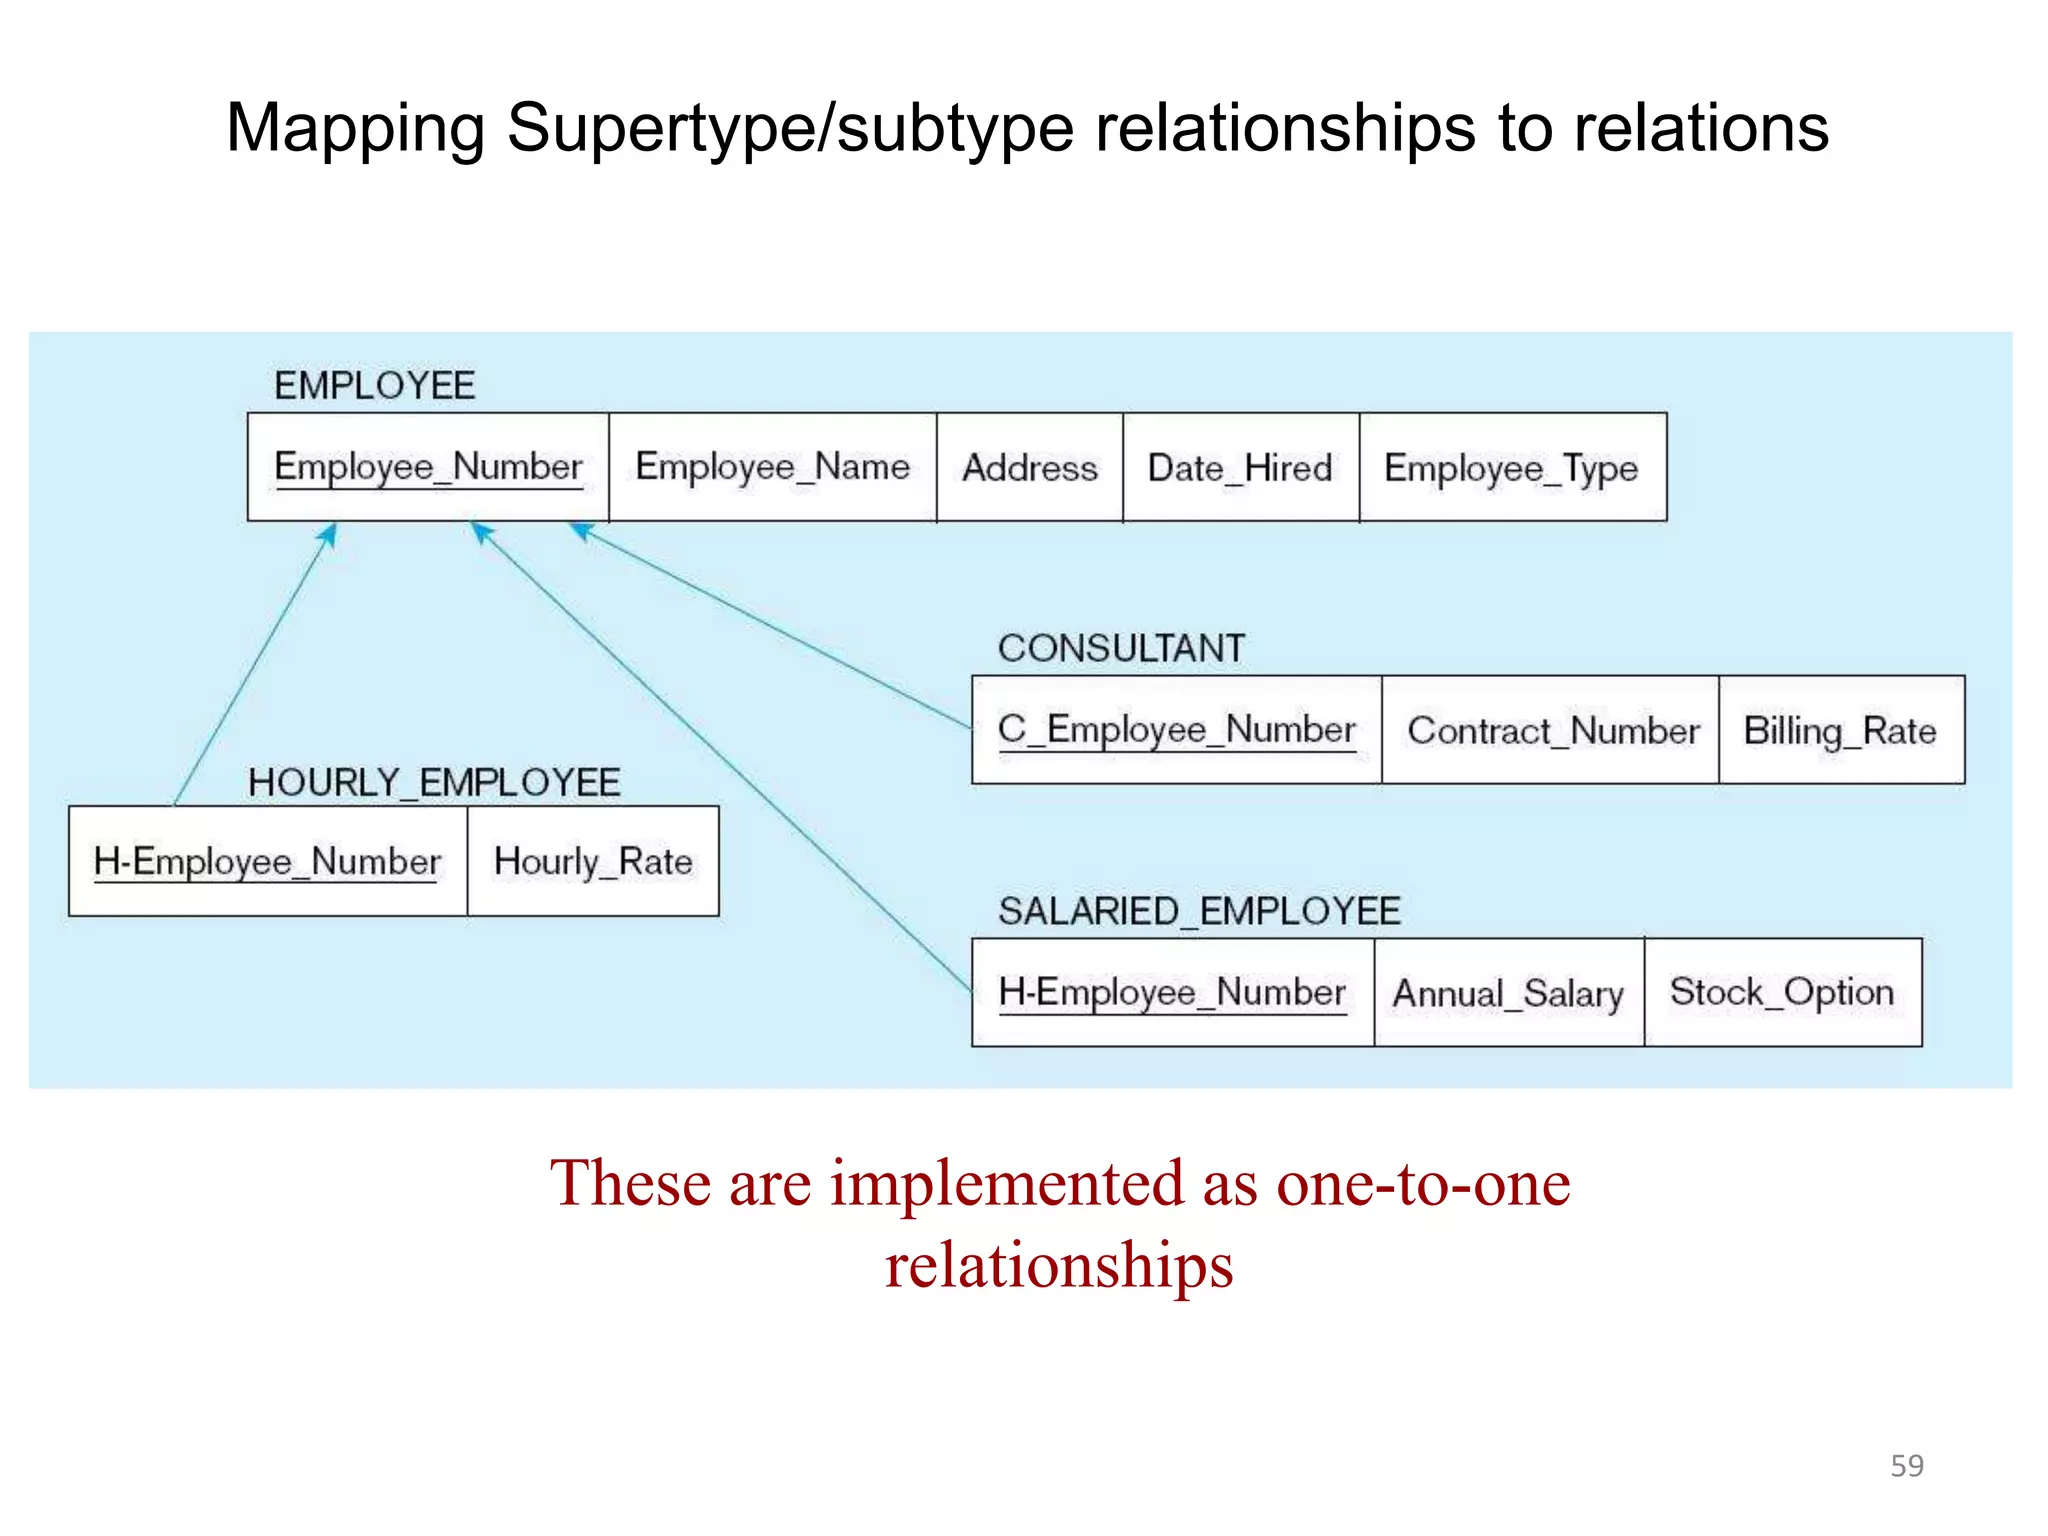
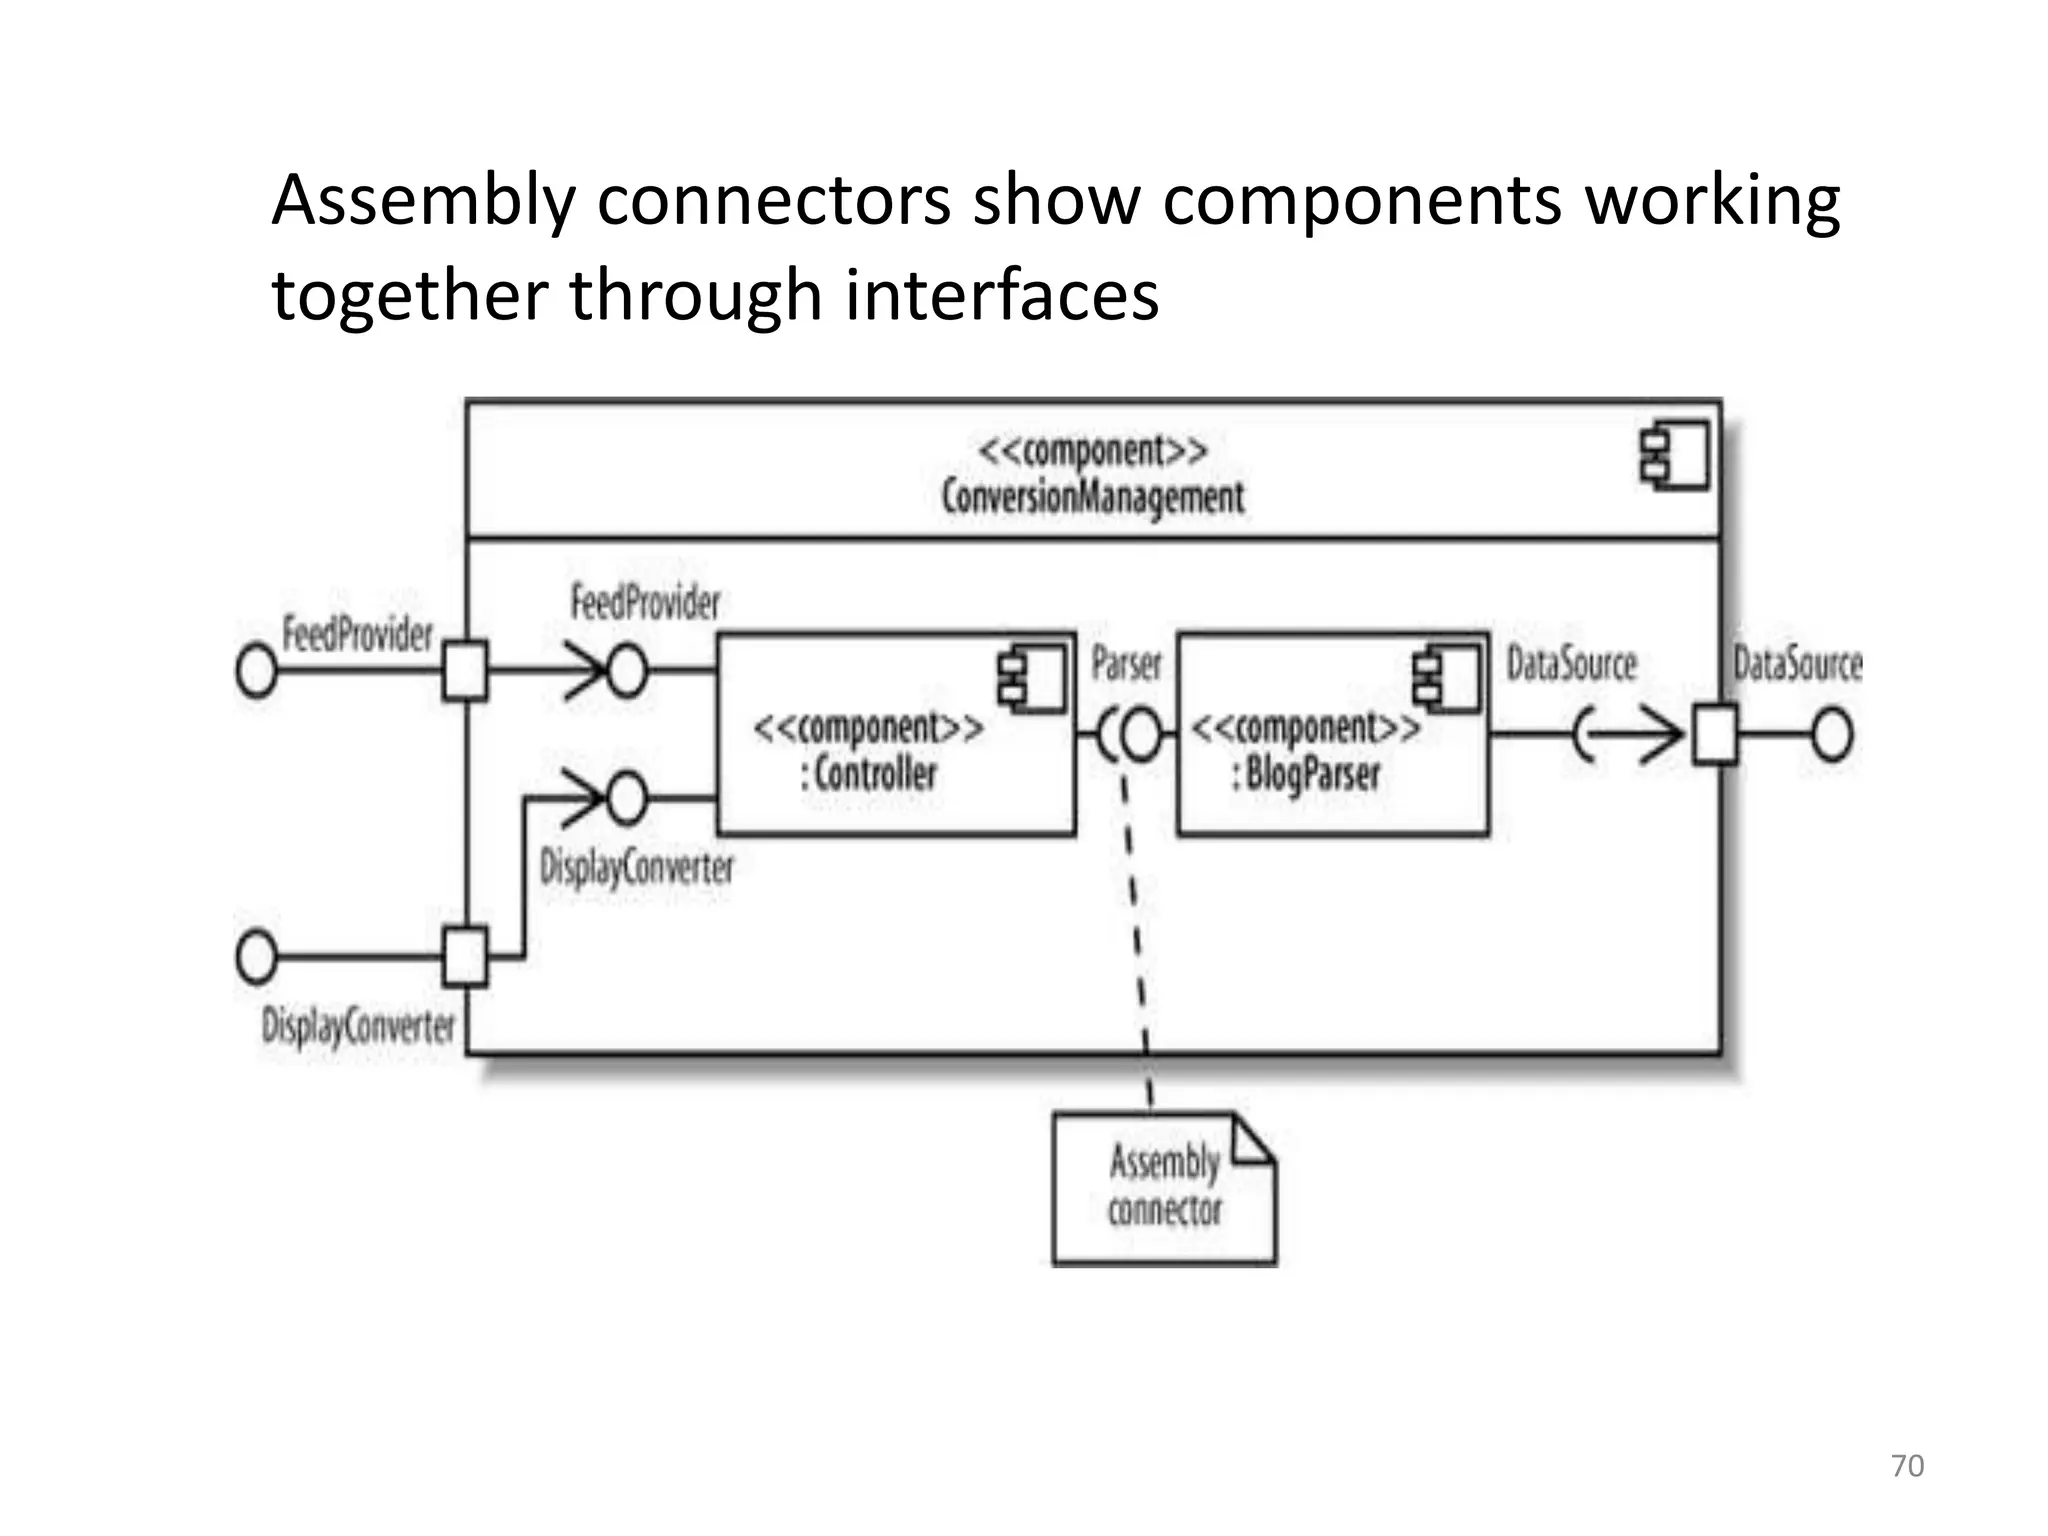
Describes various class structures and relationships including inheritance, aggregation, and dependency.
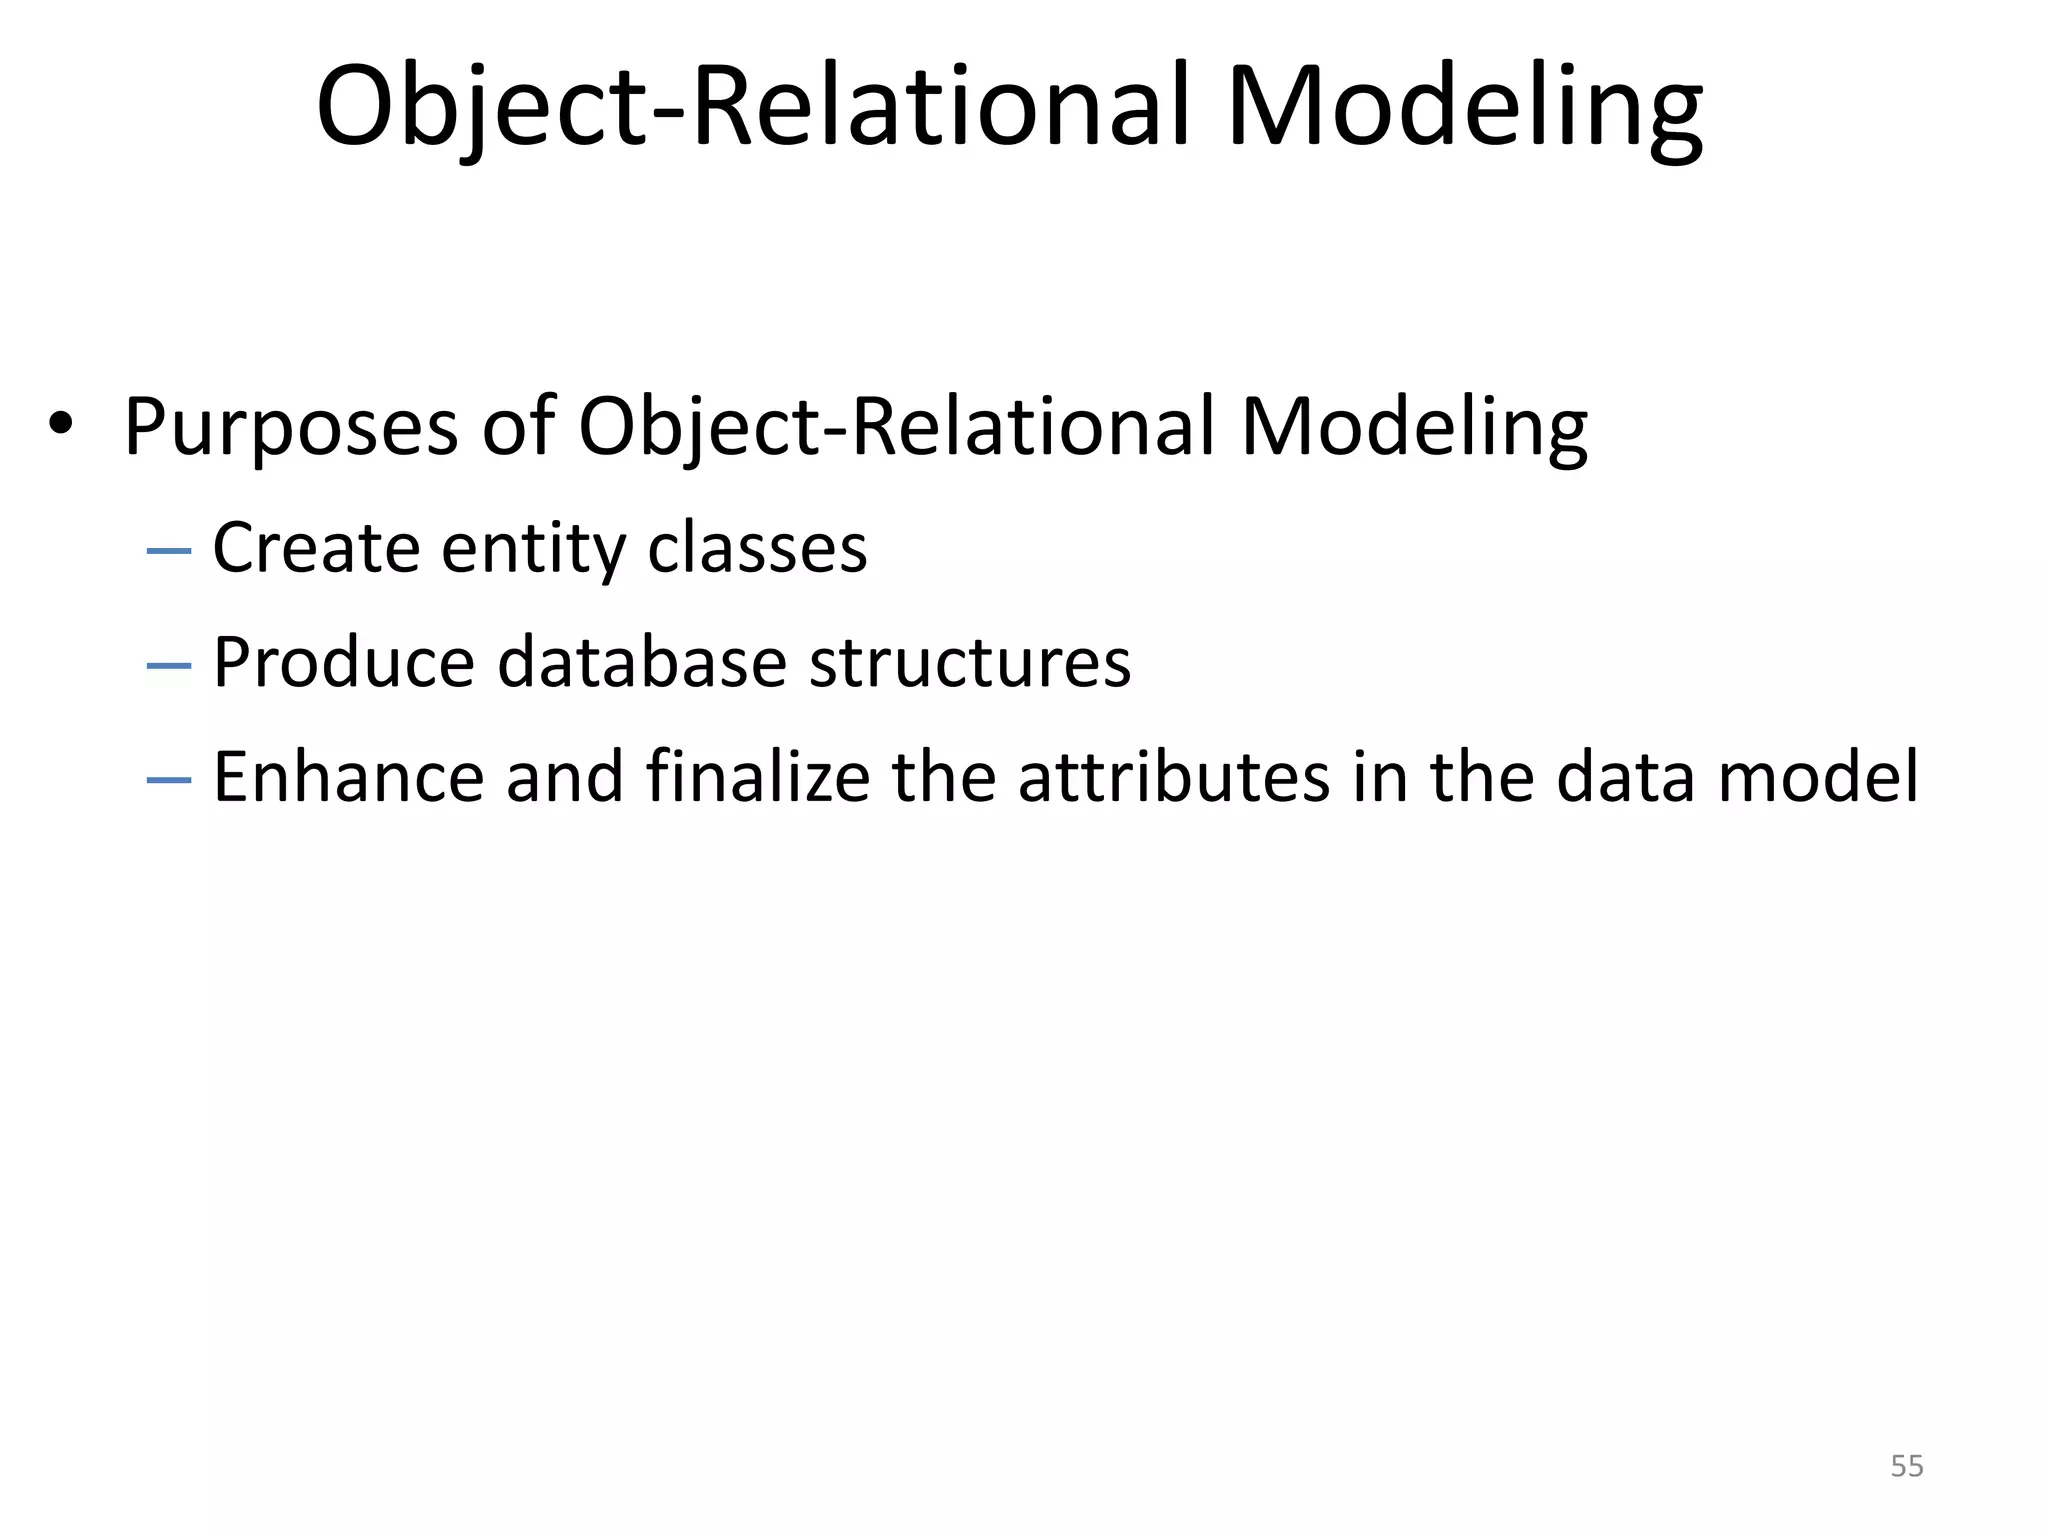
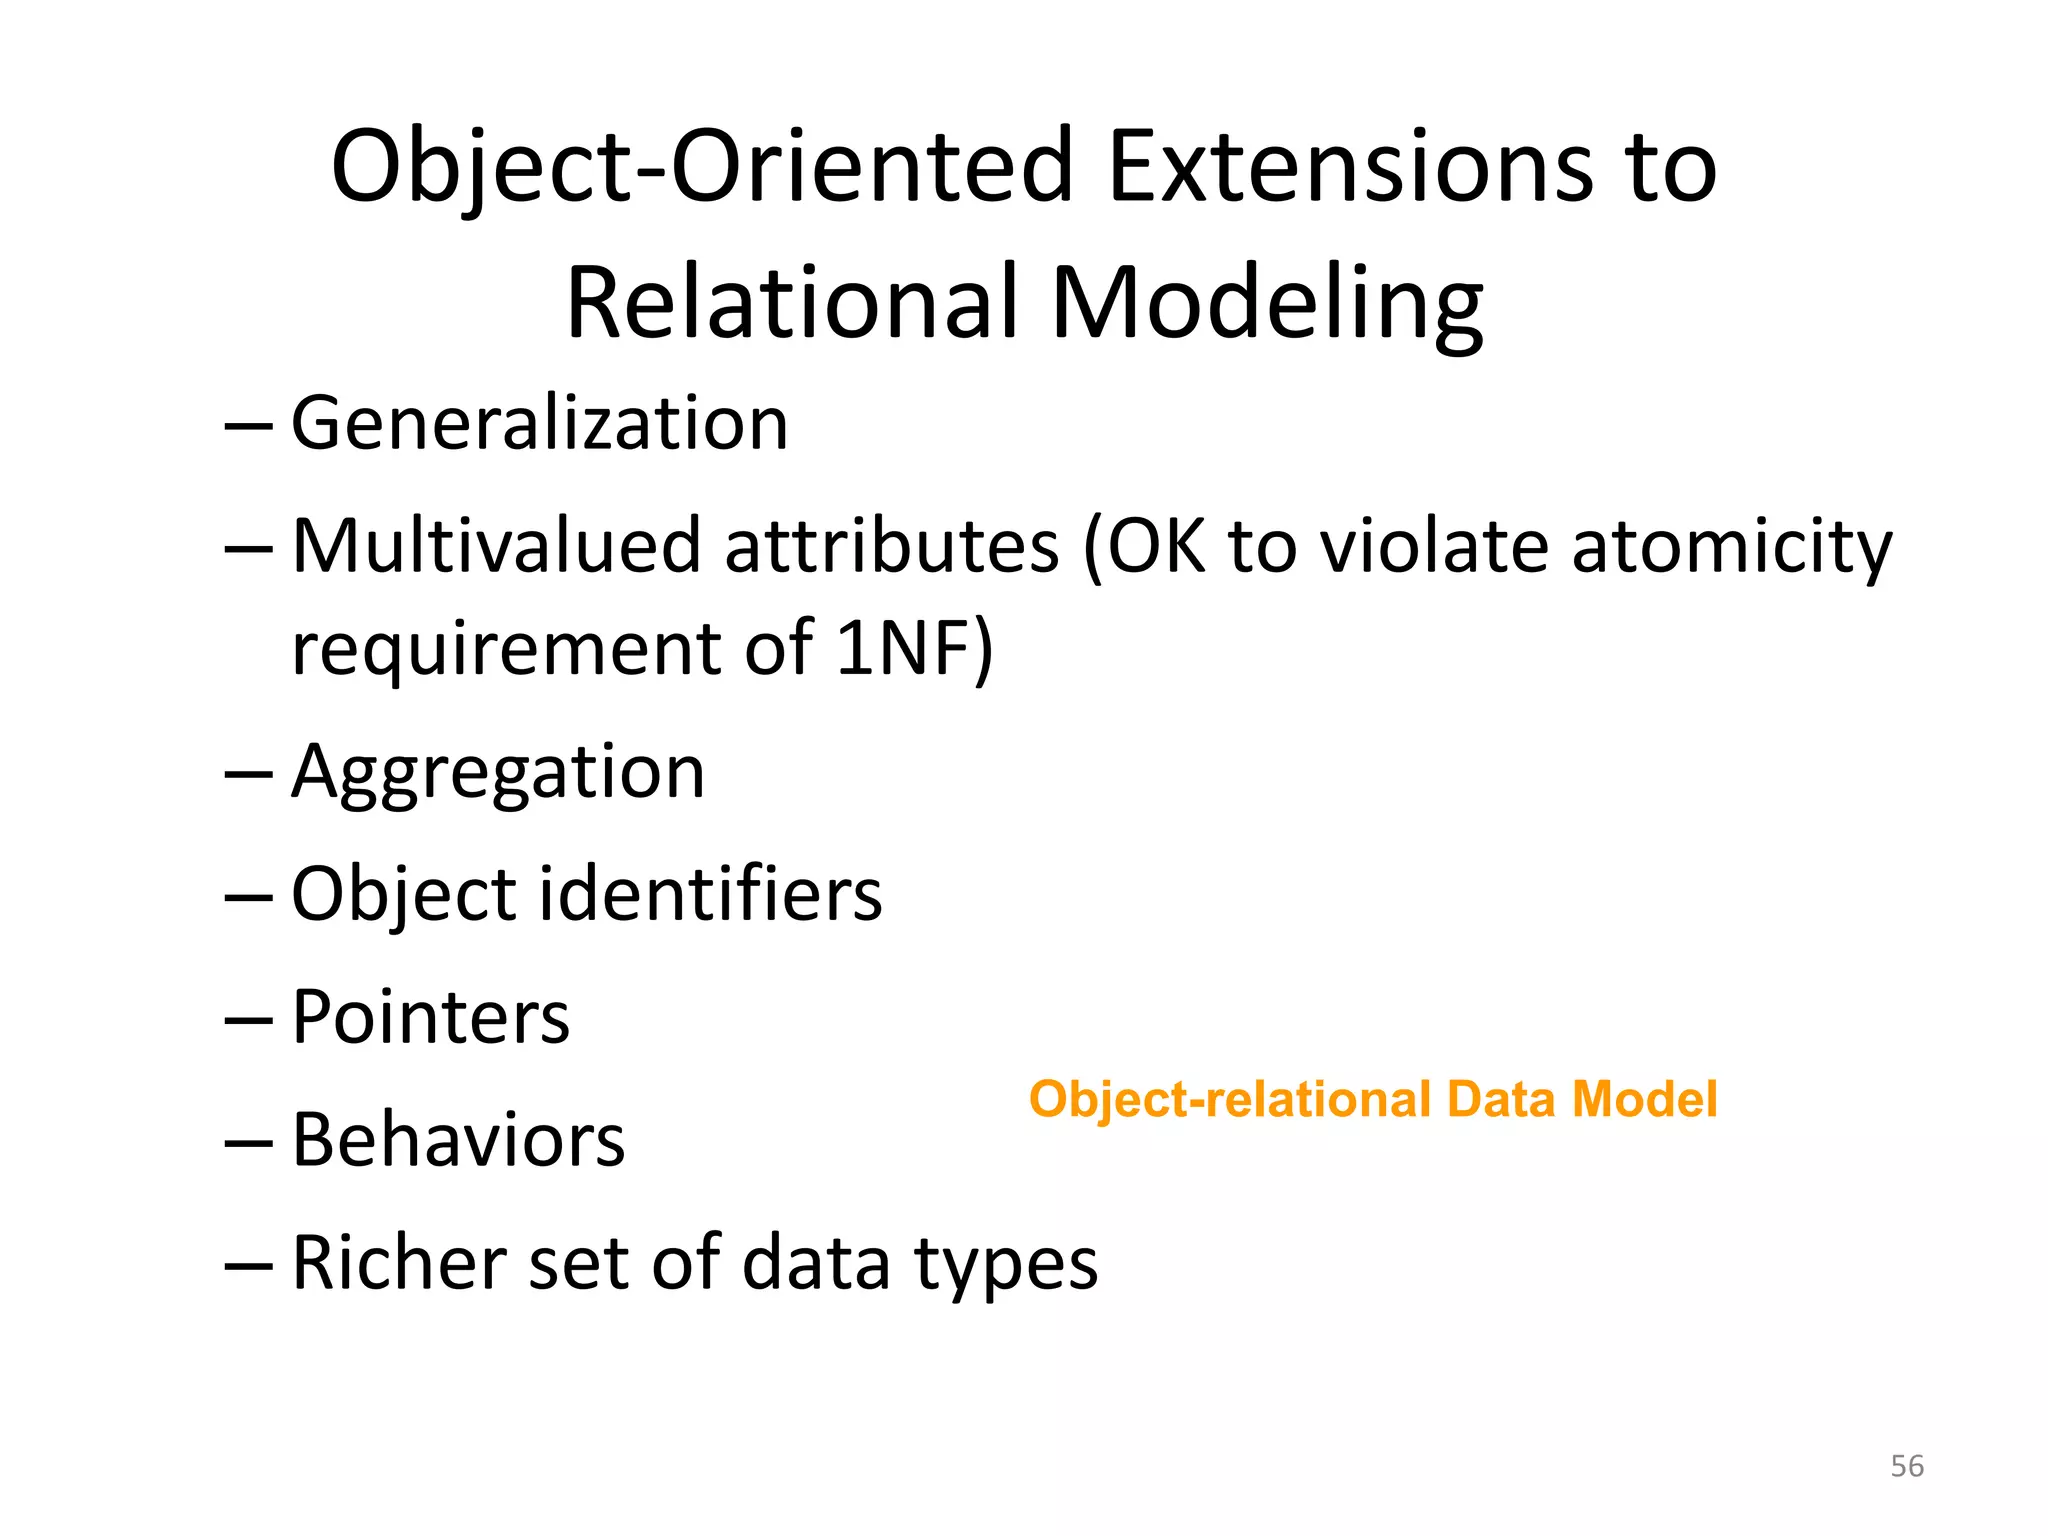
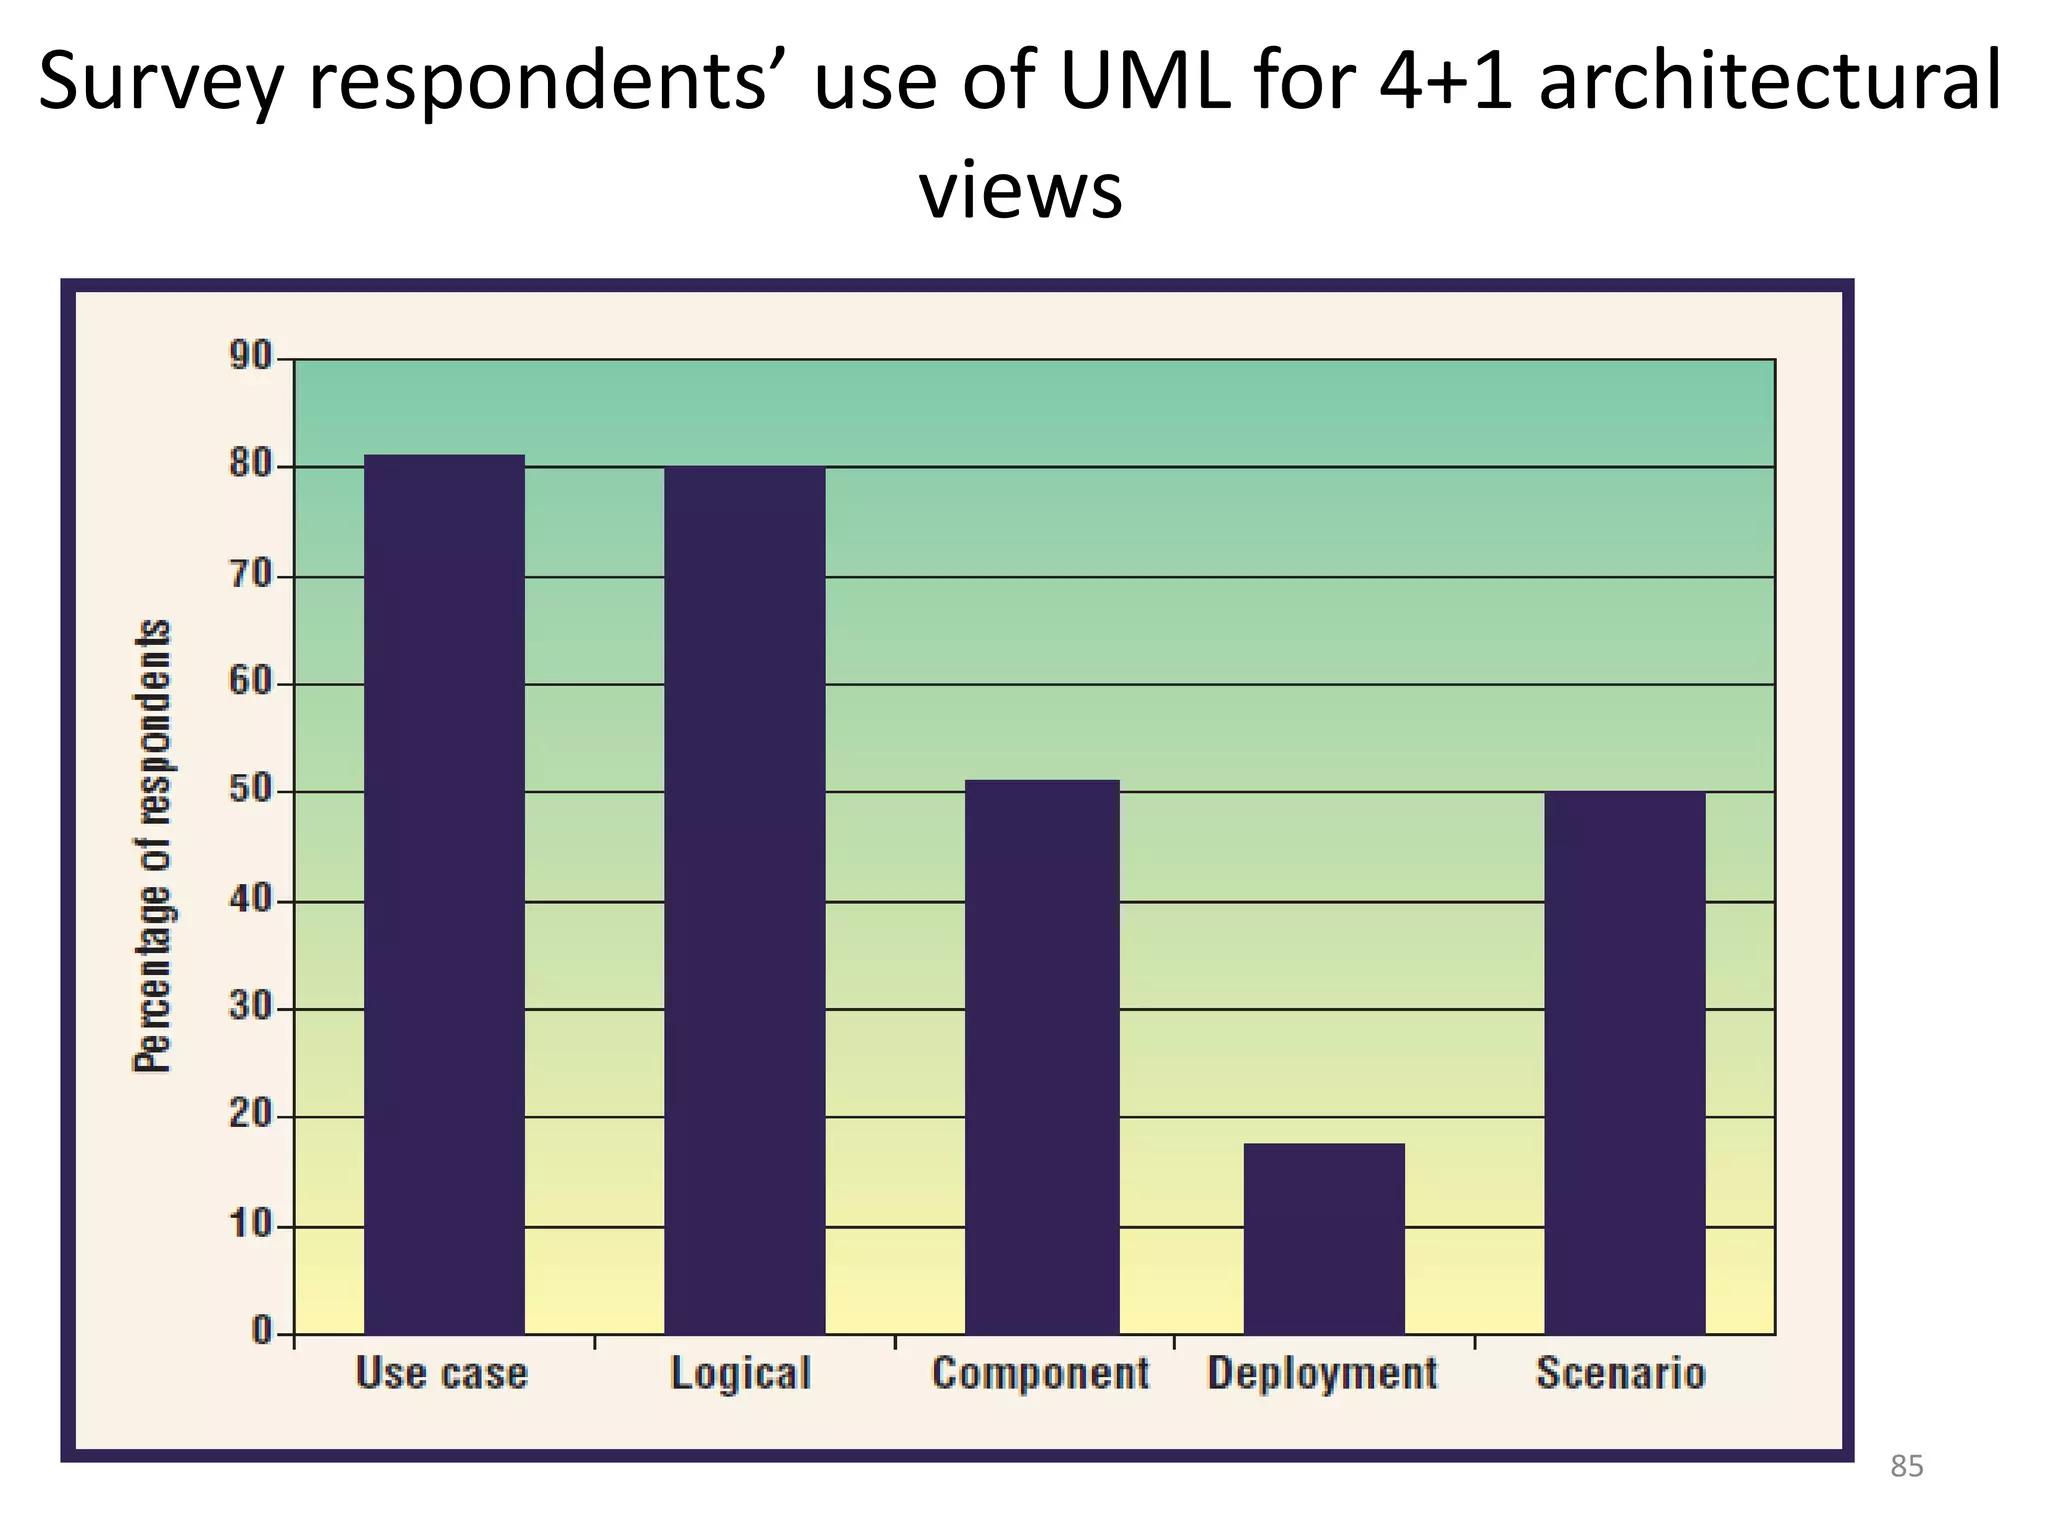
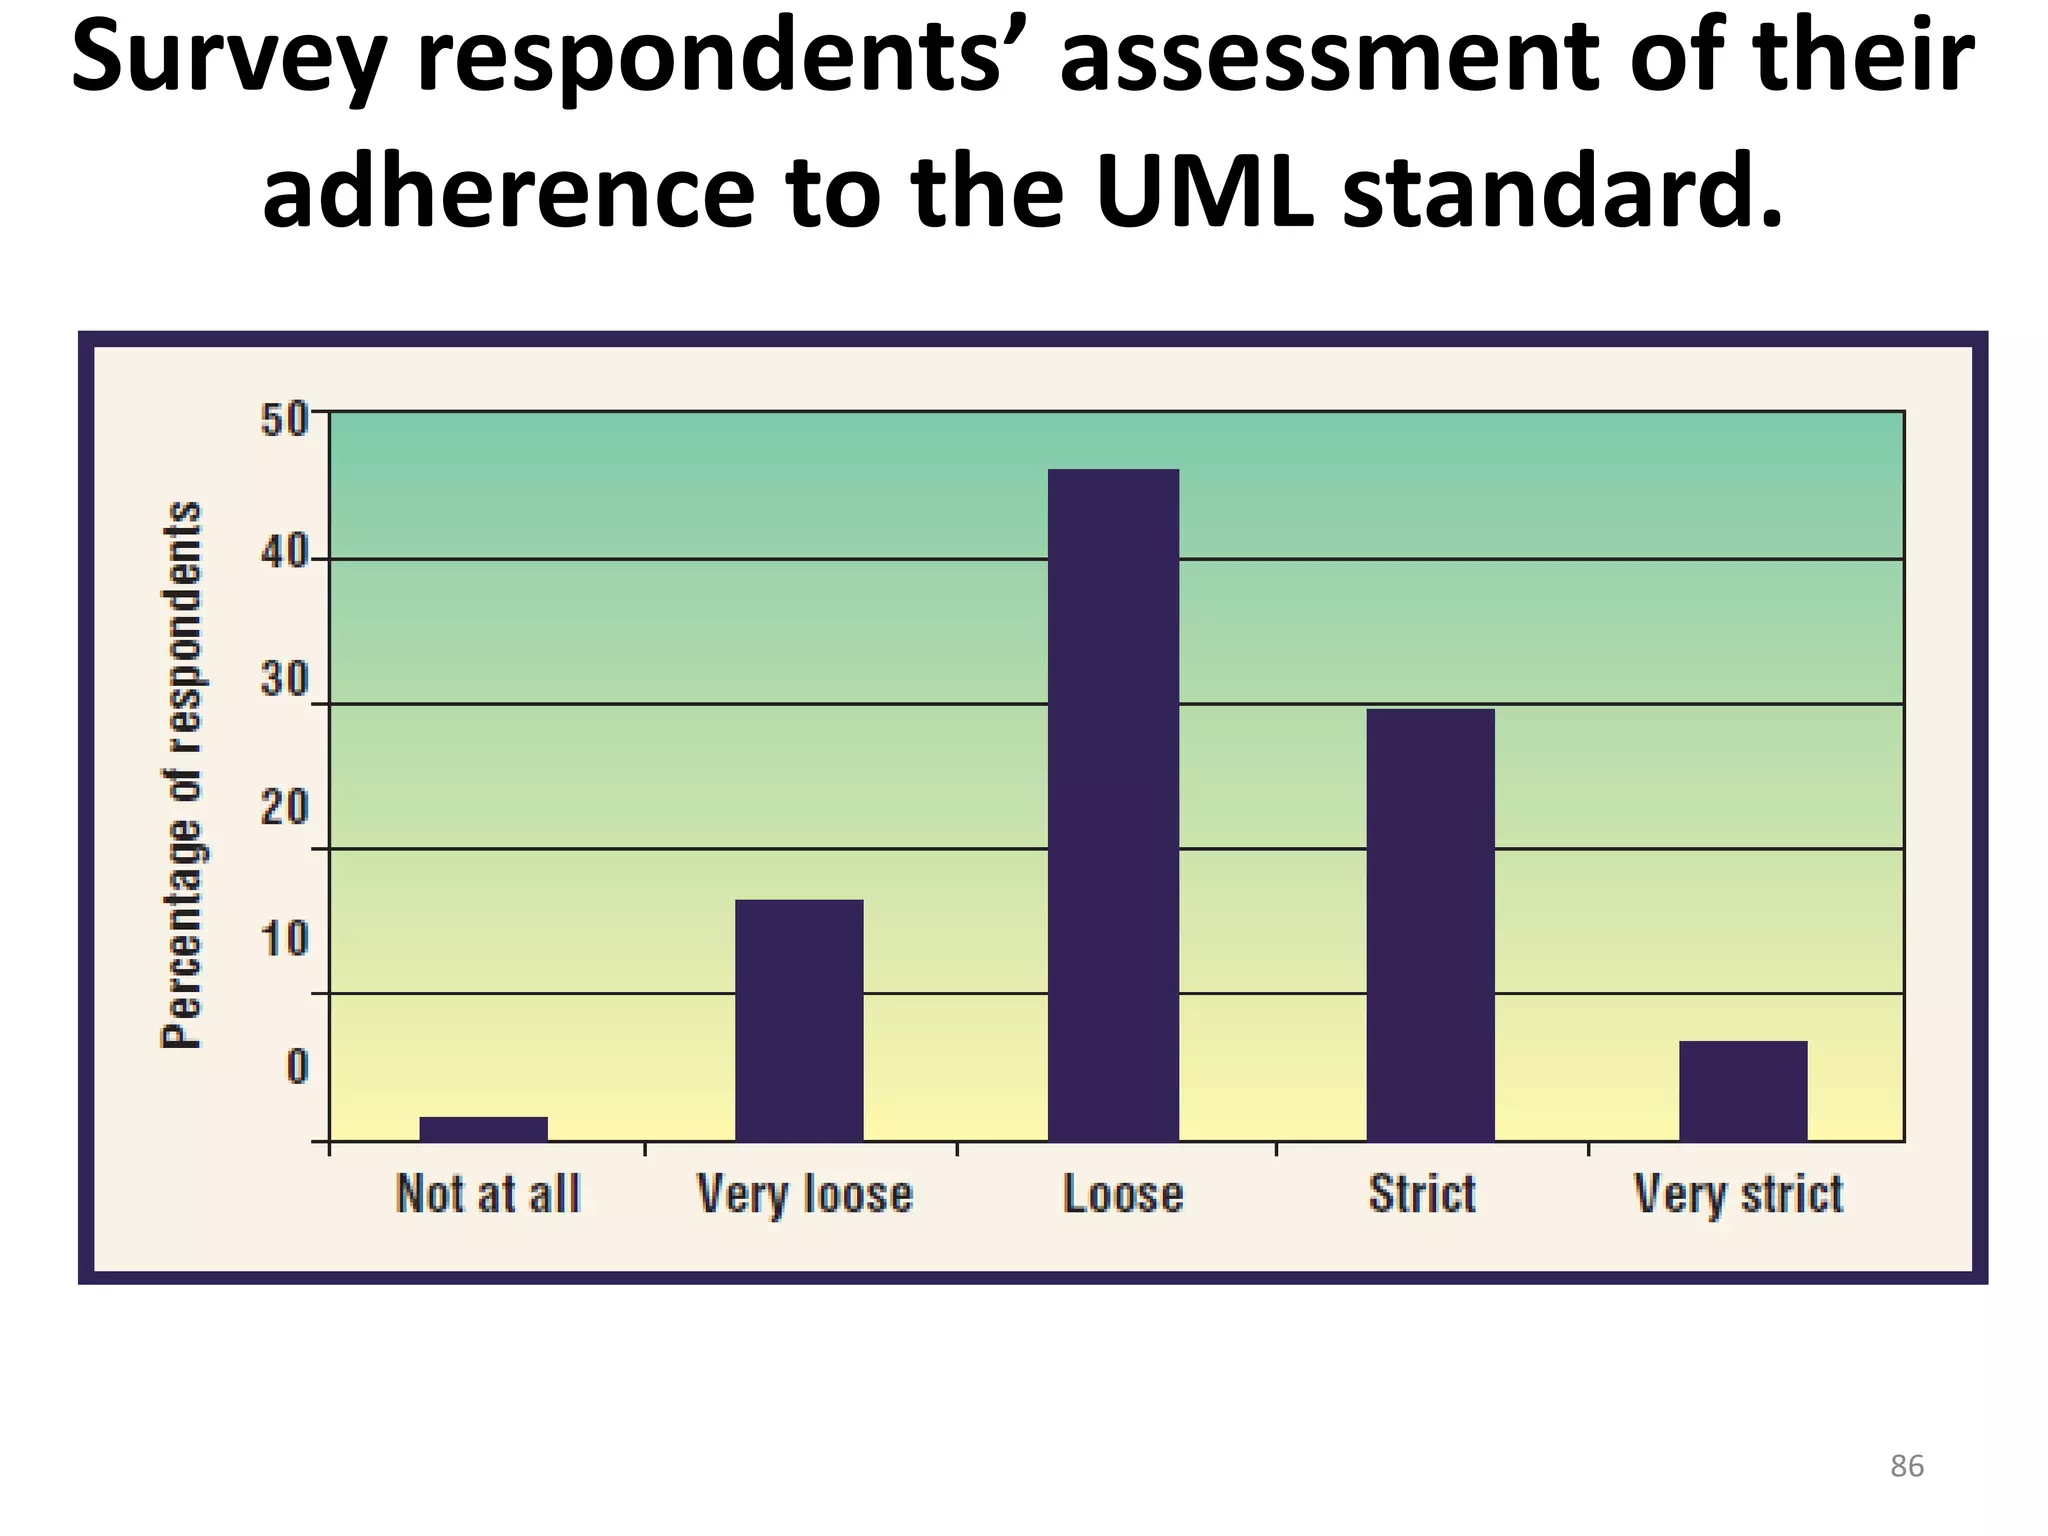
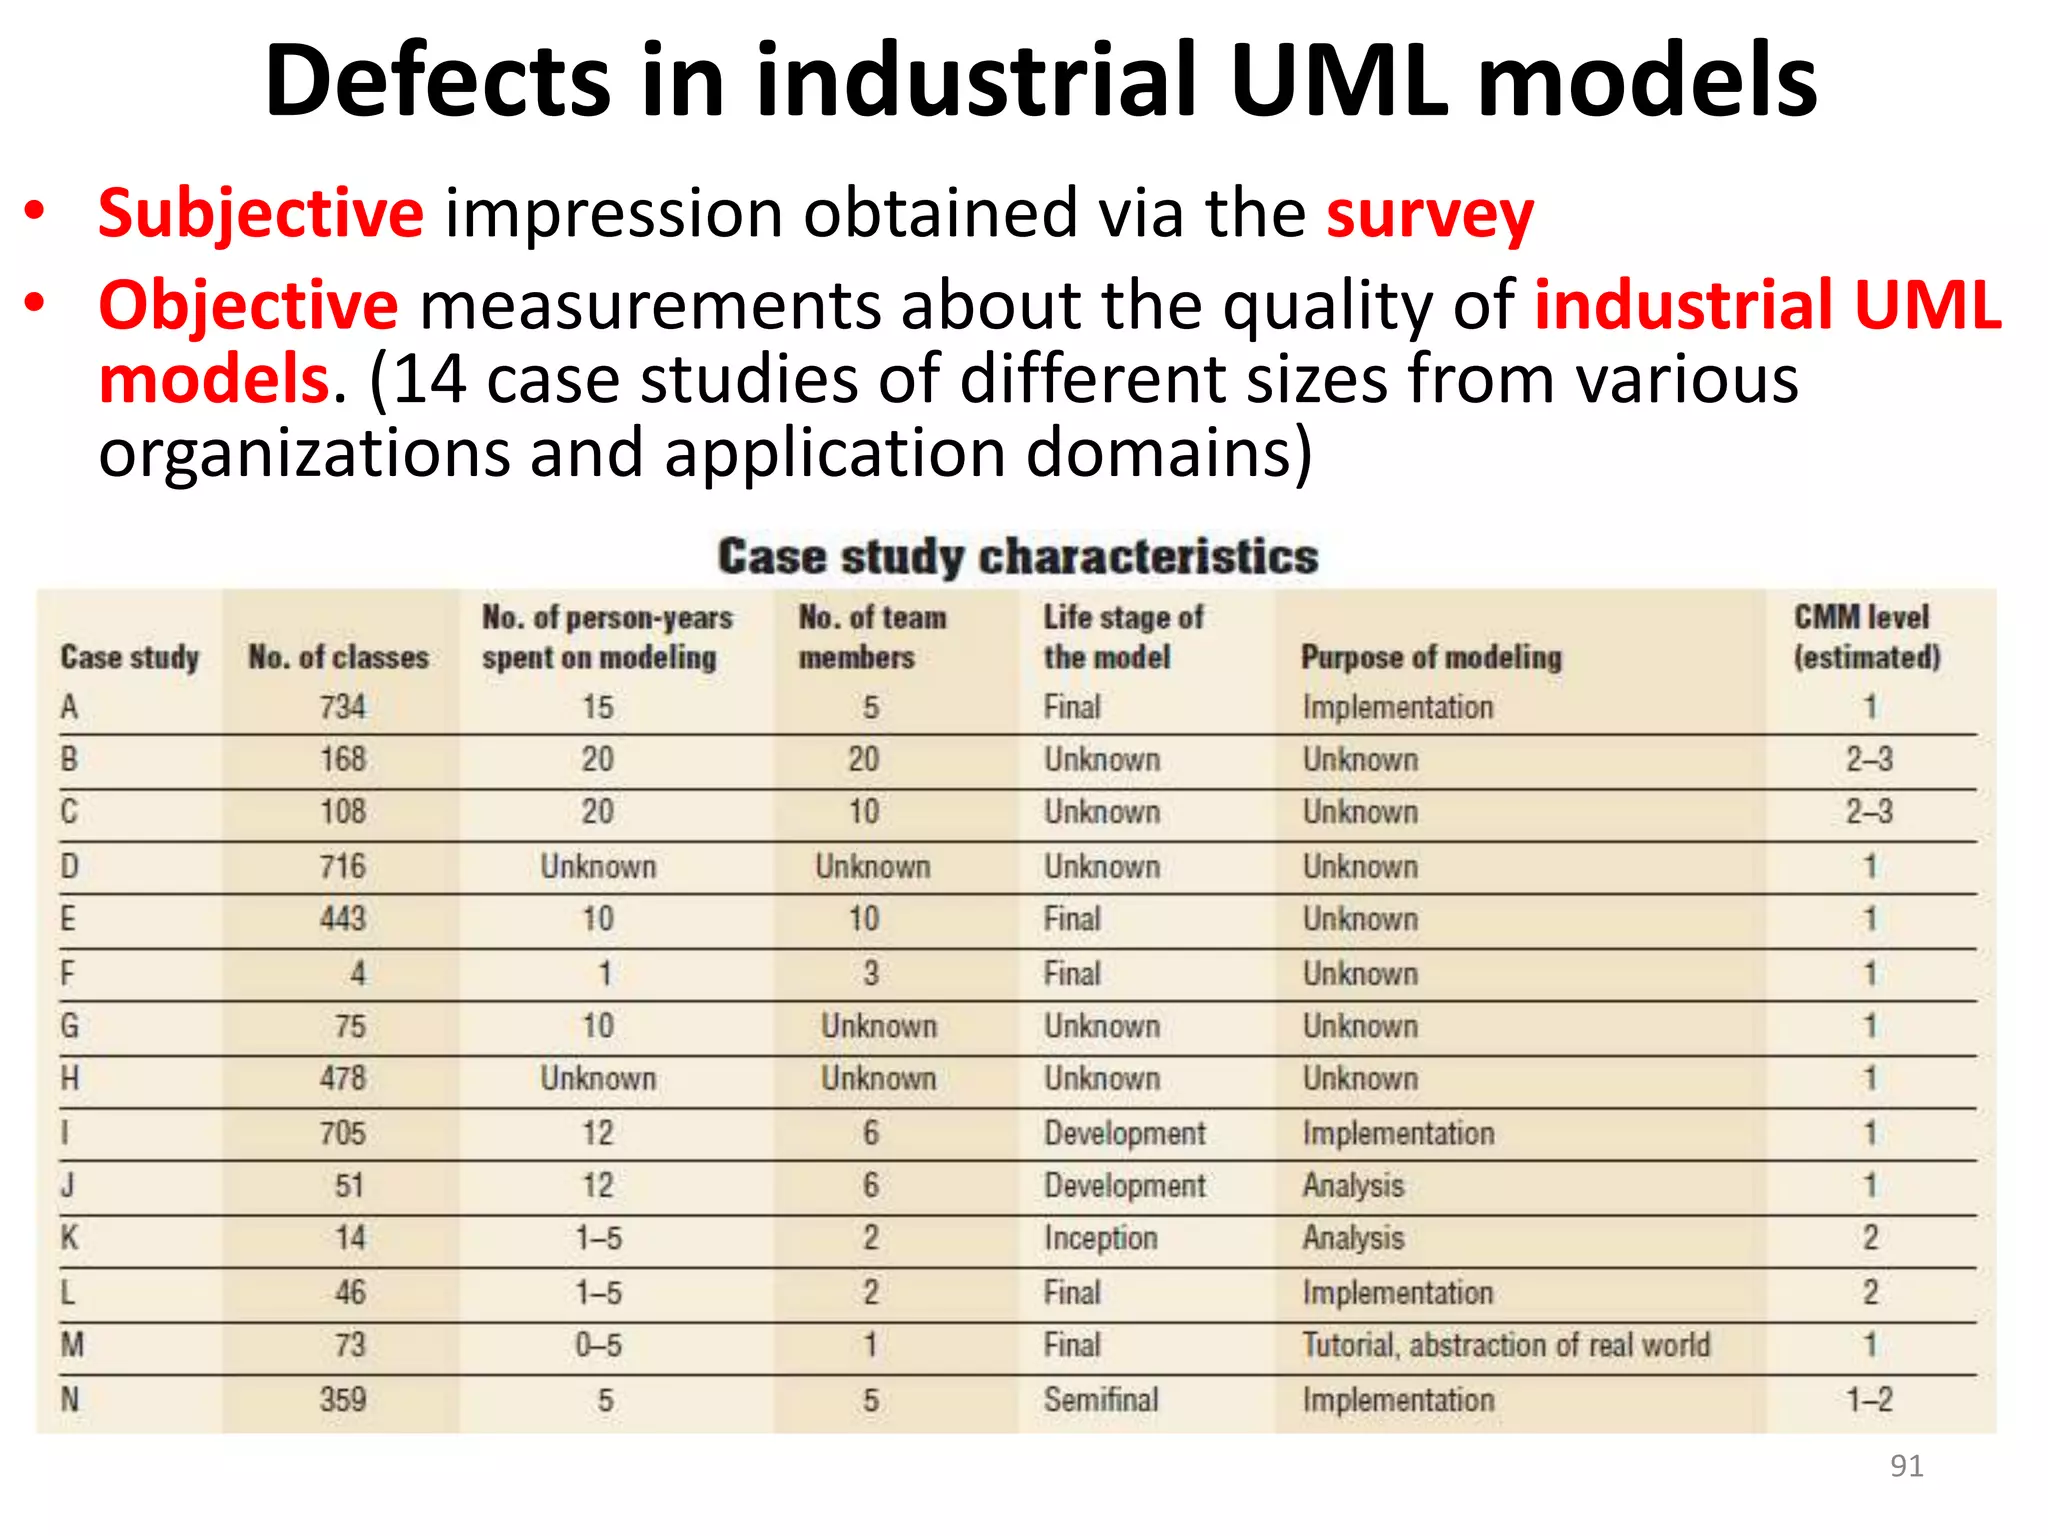
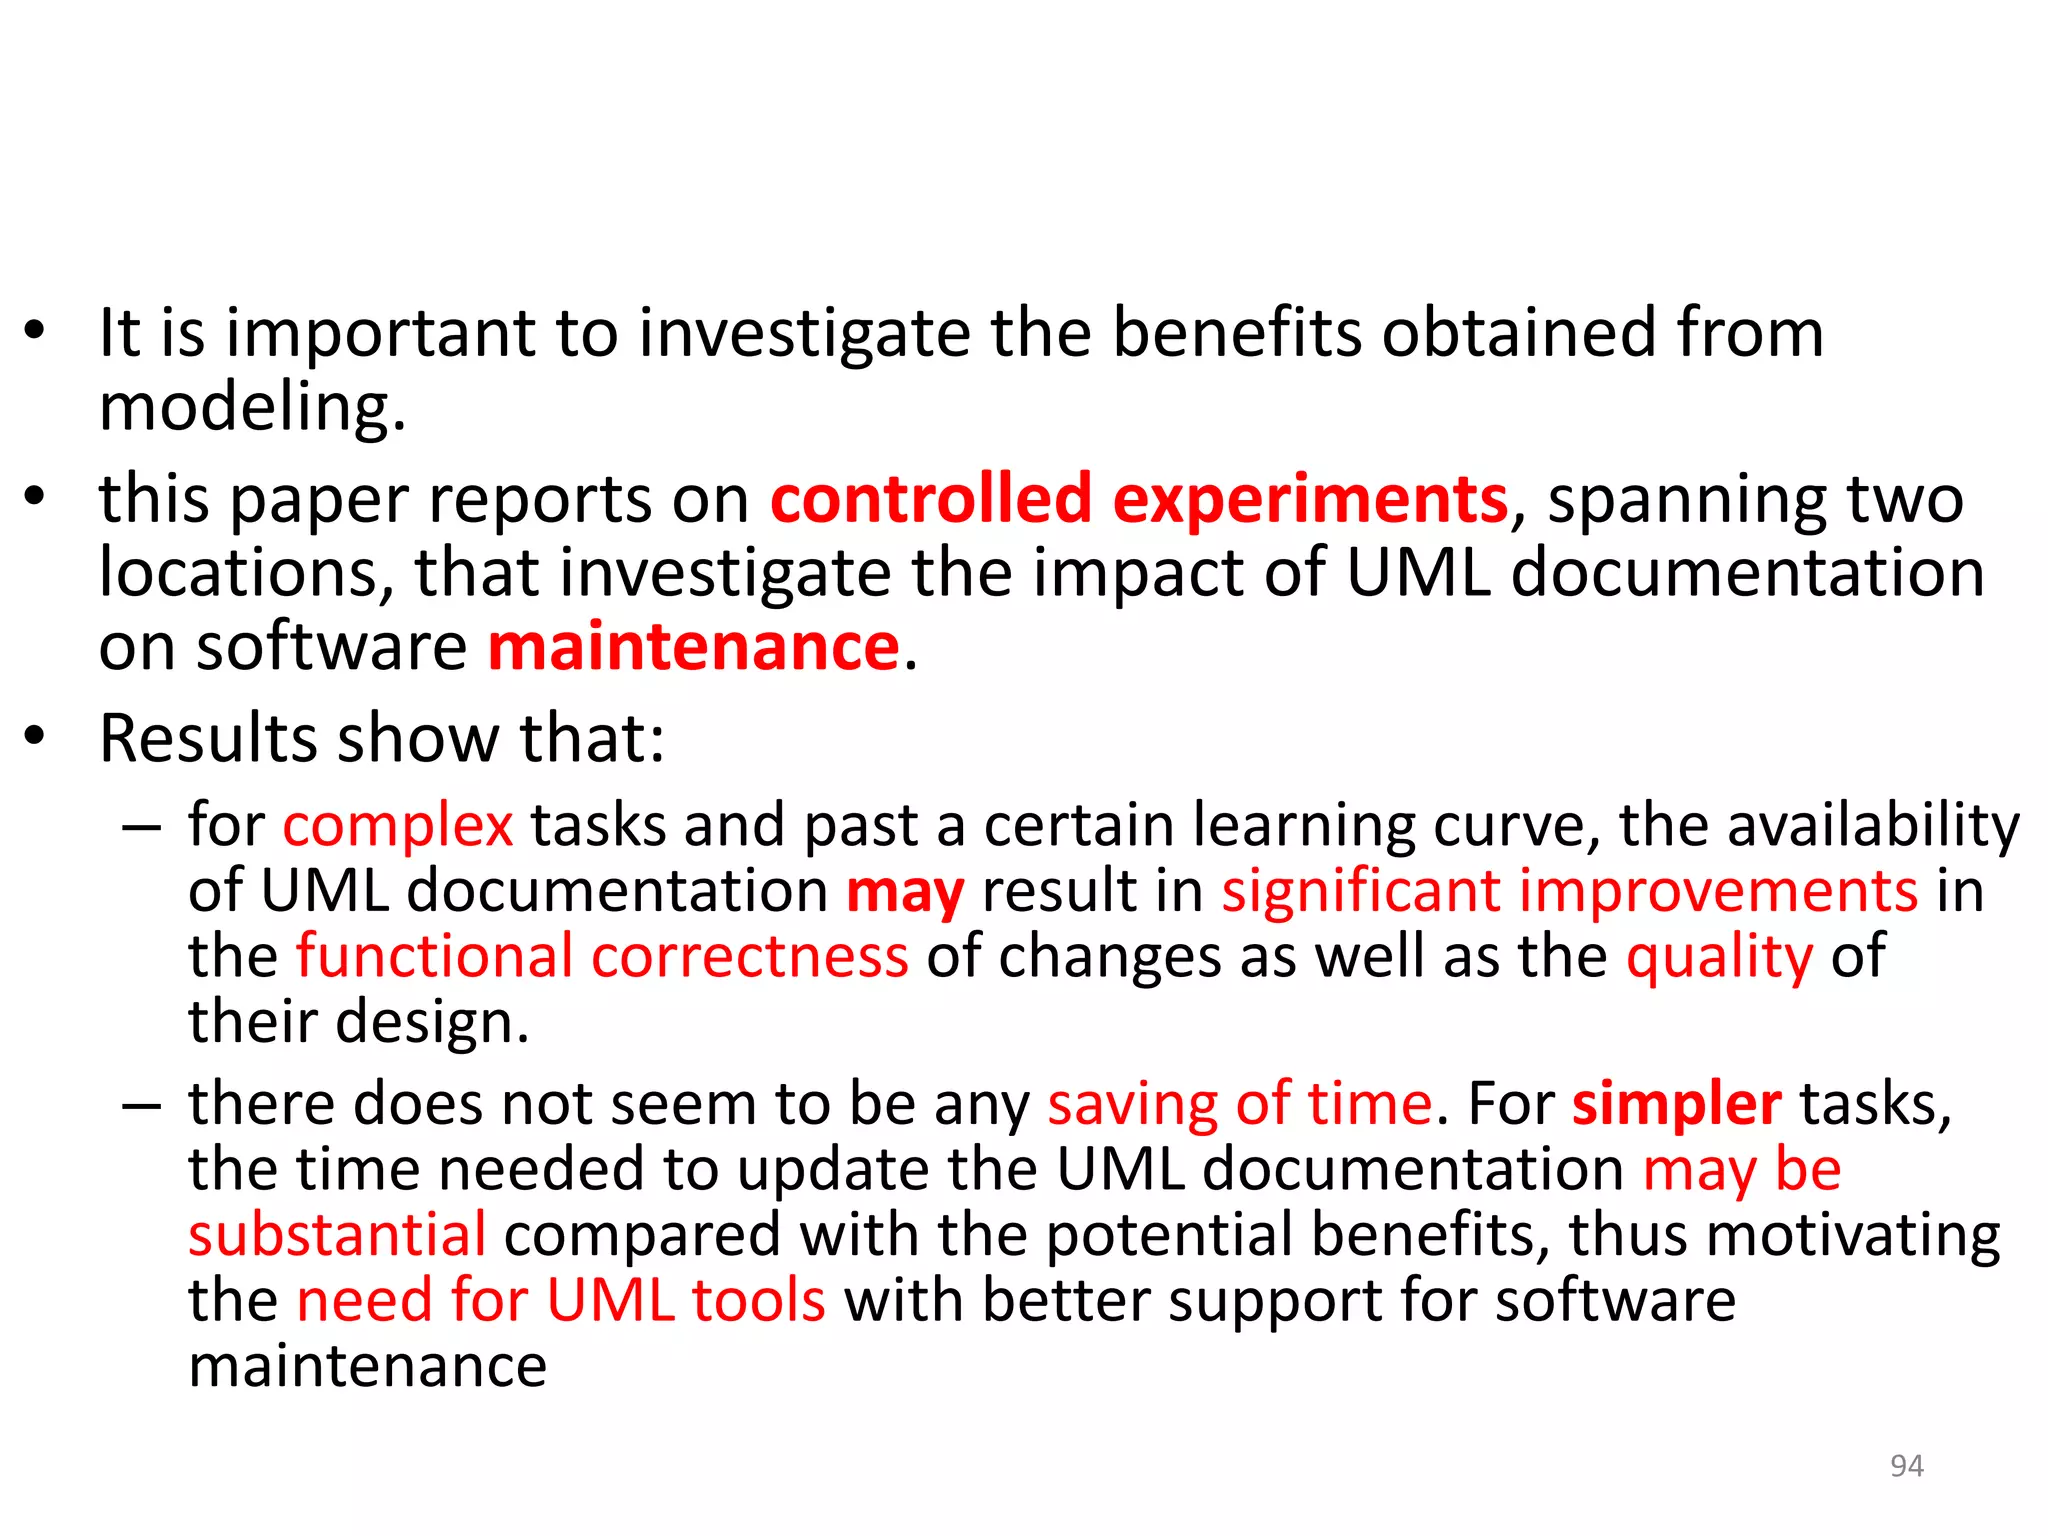
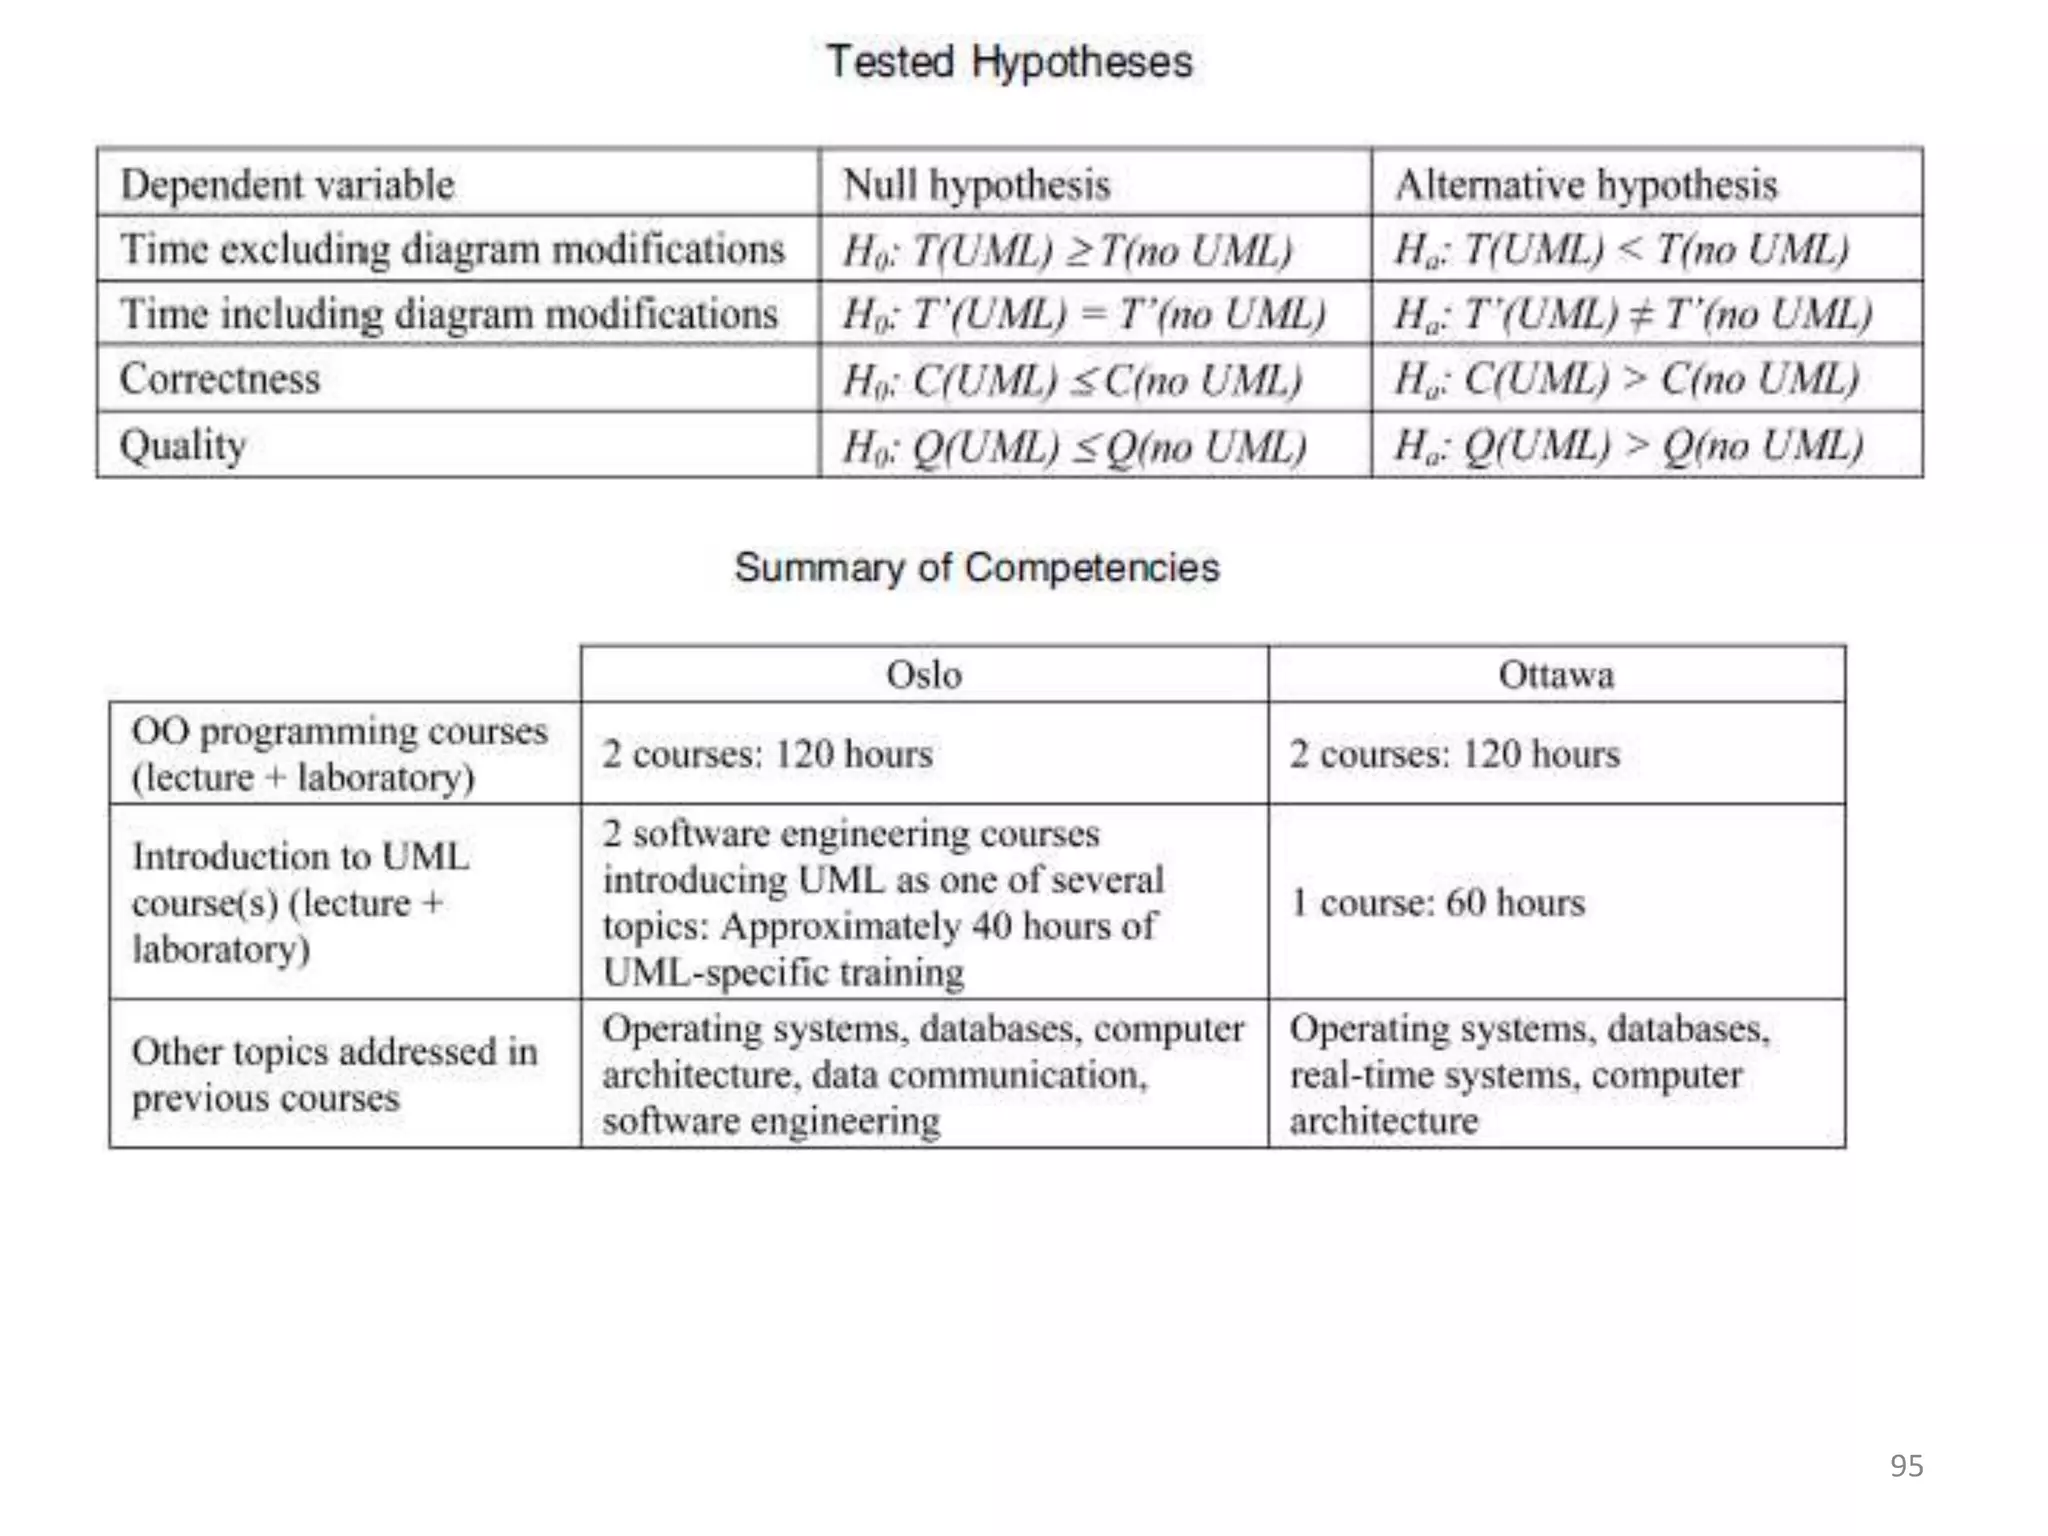
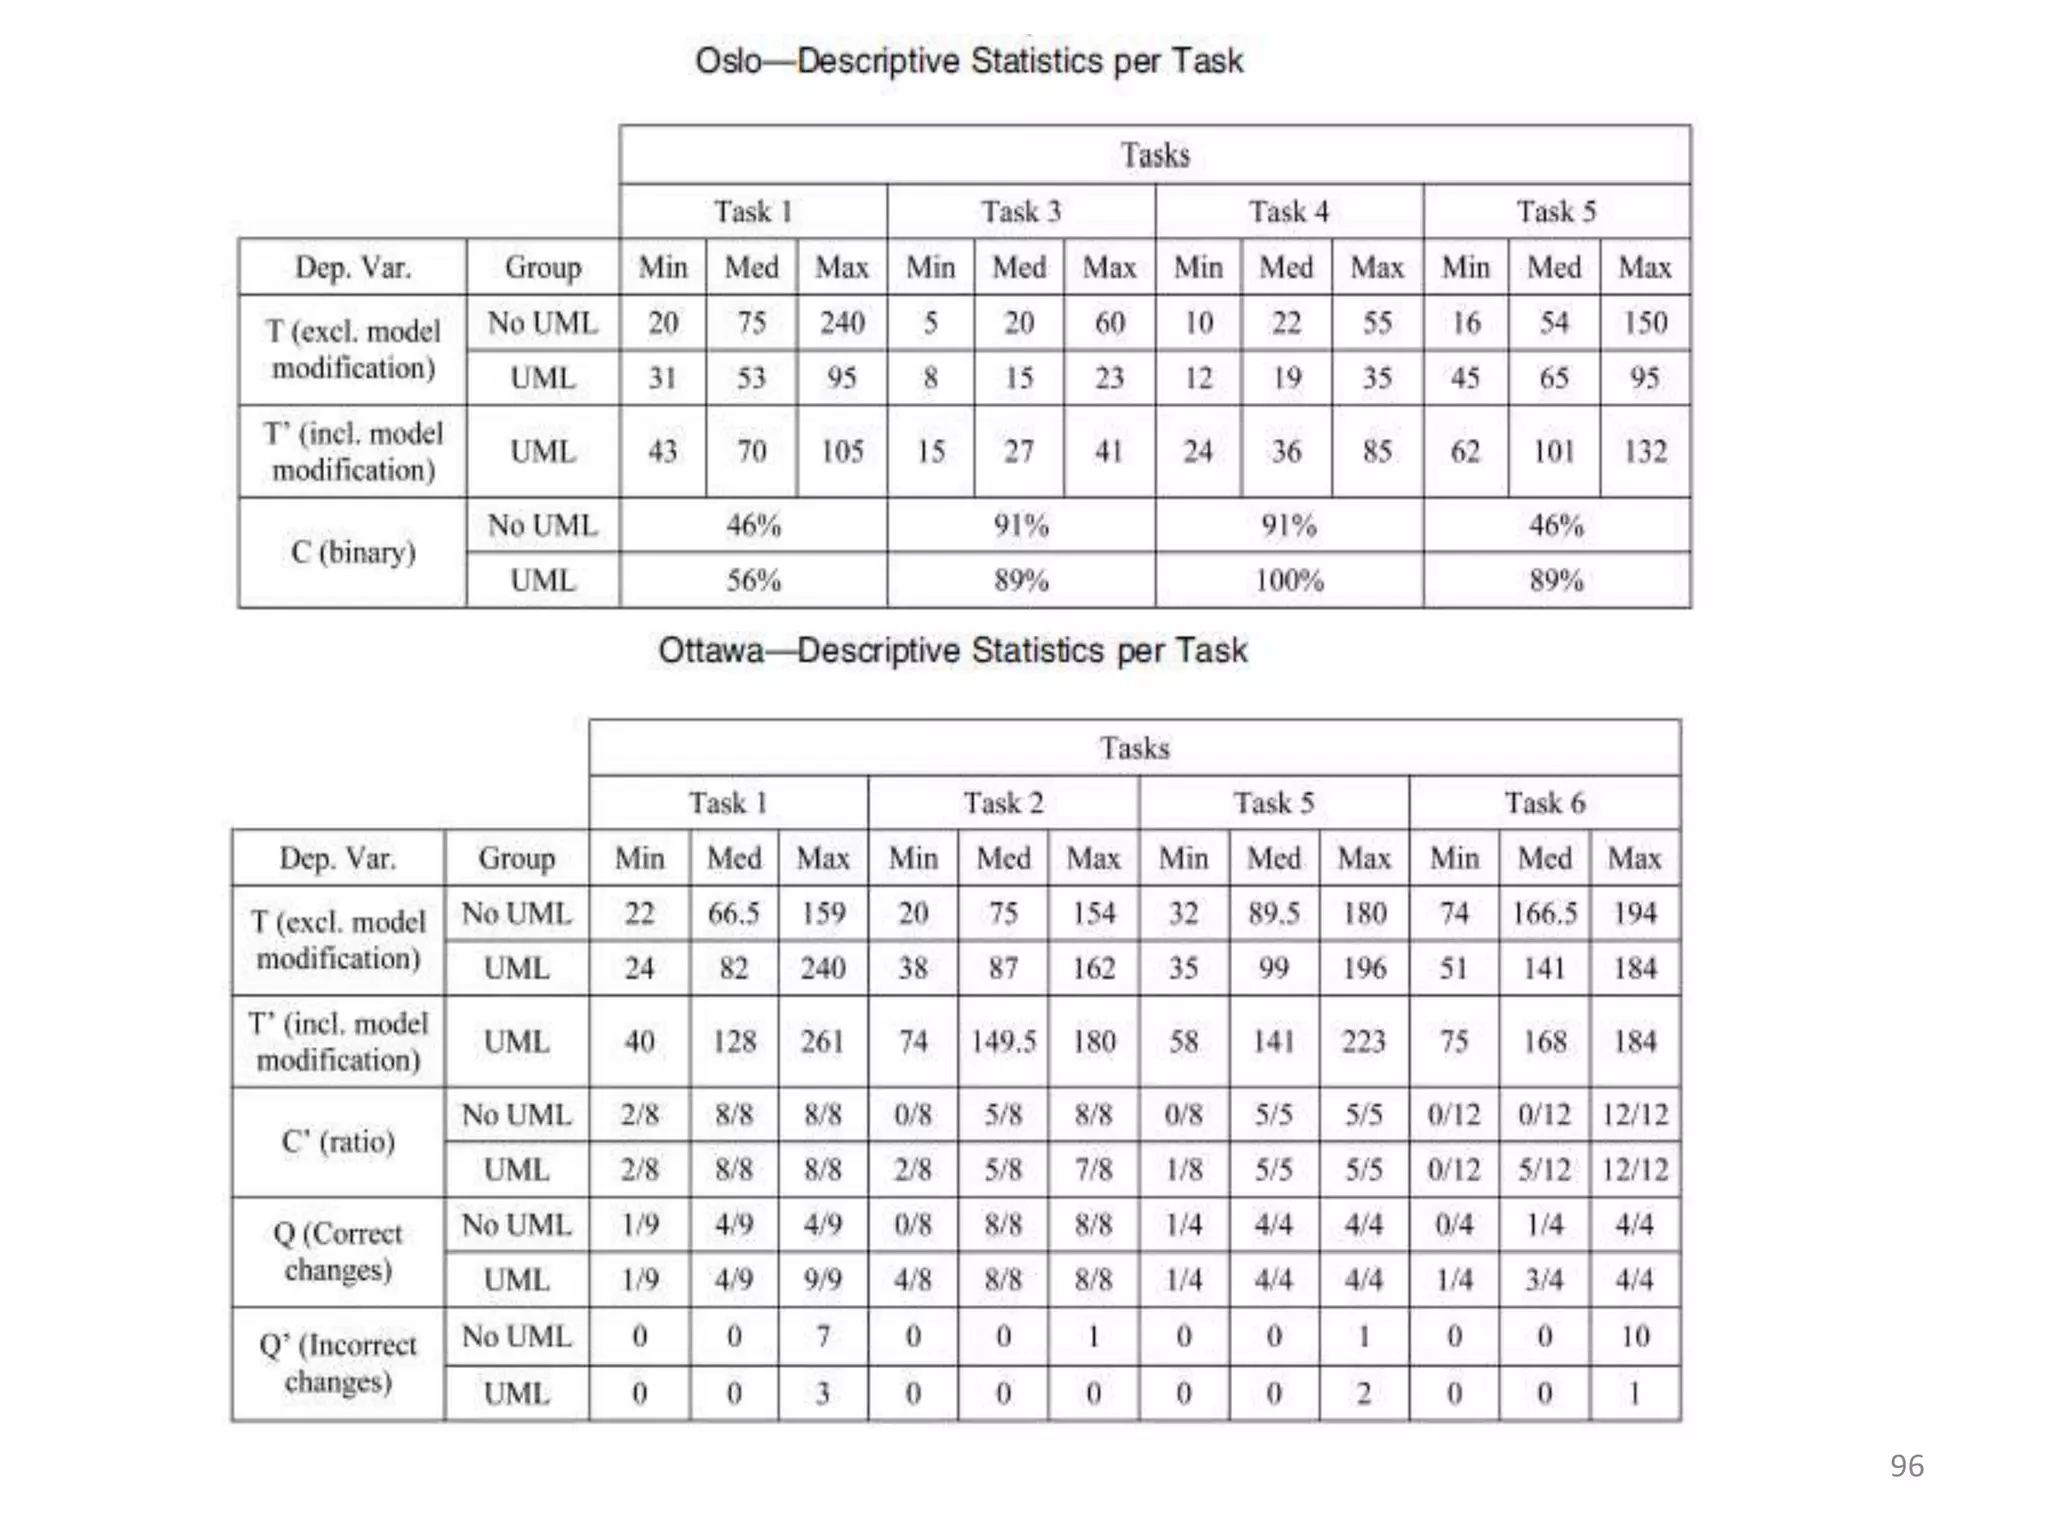
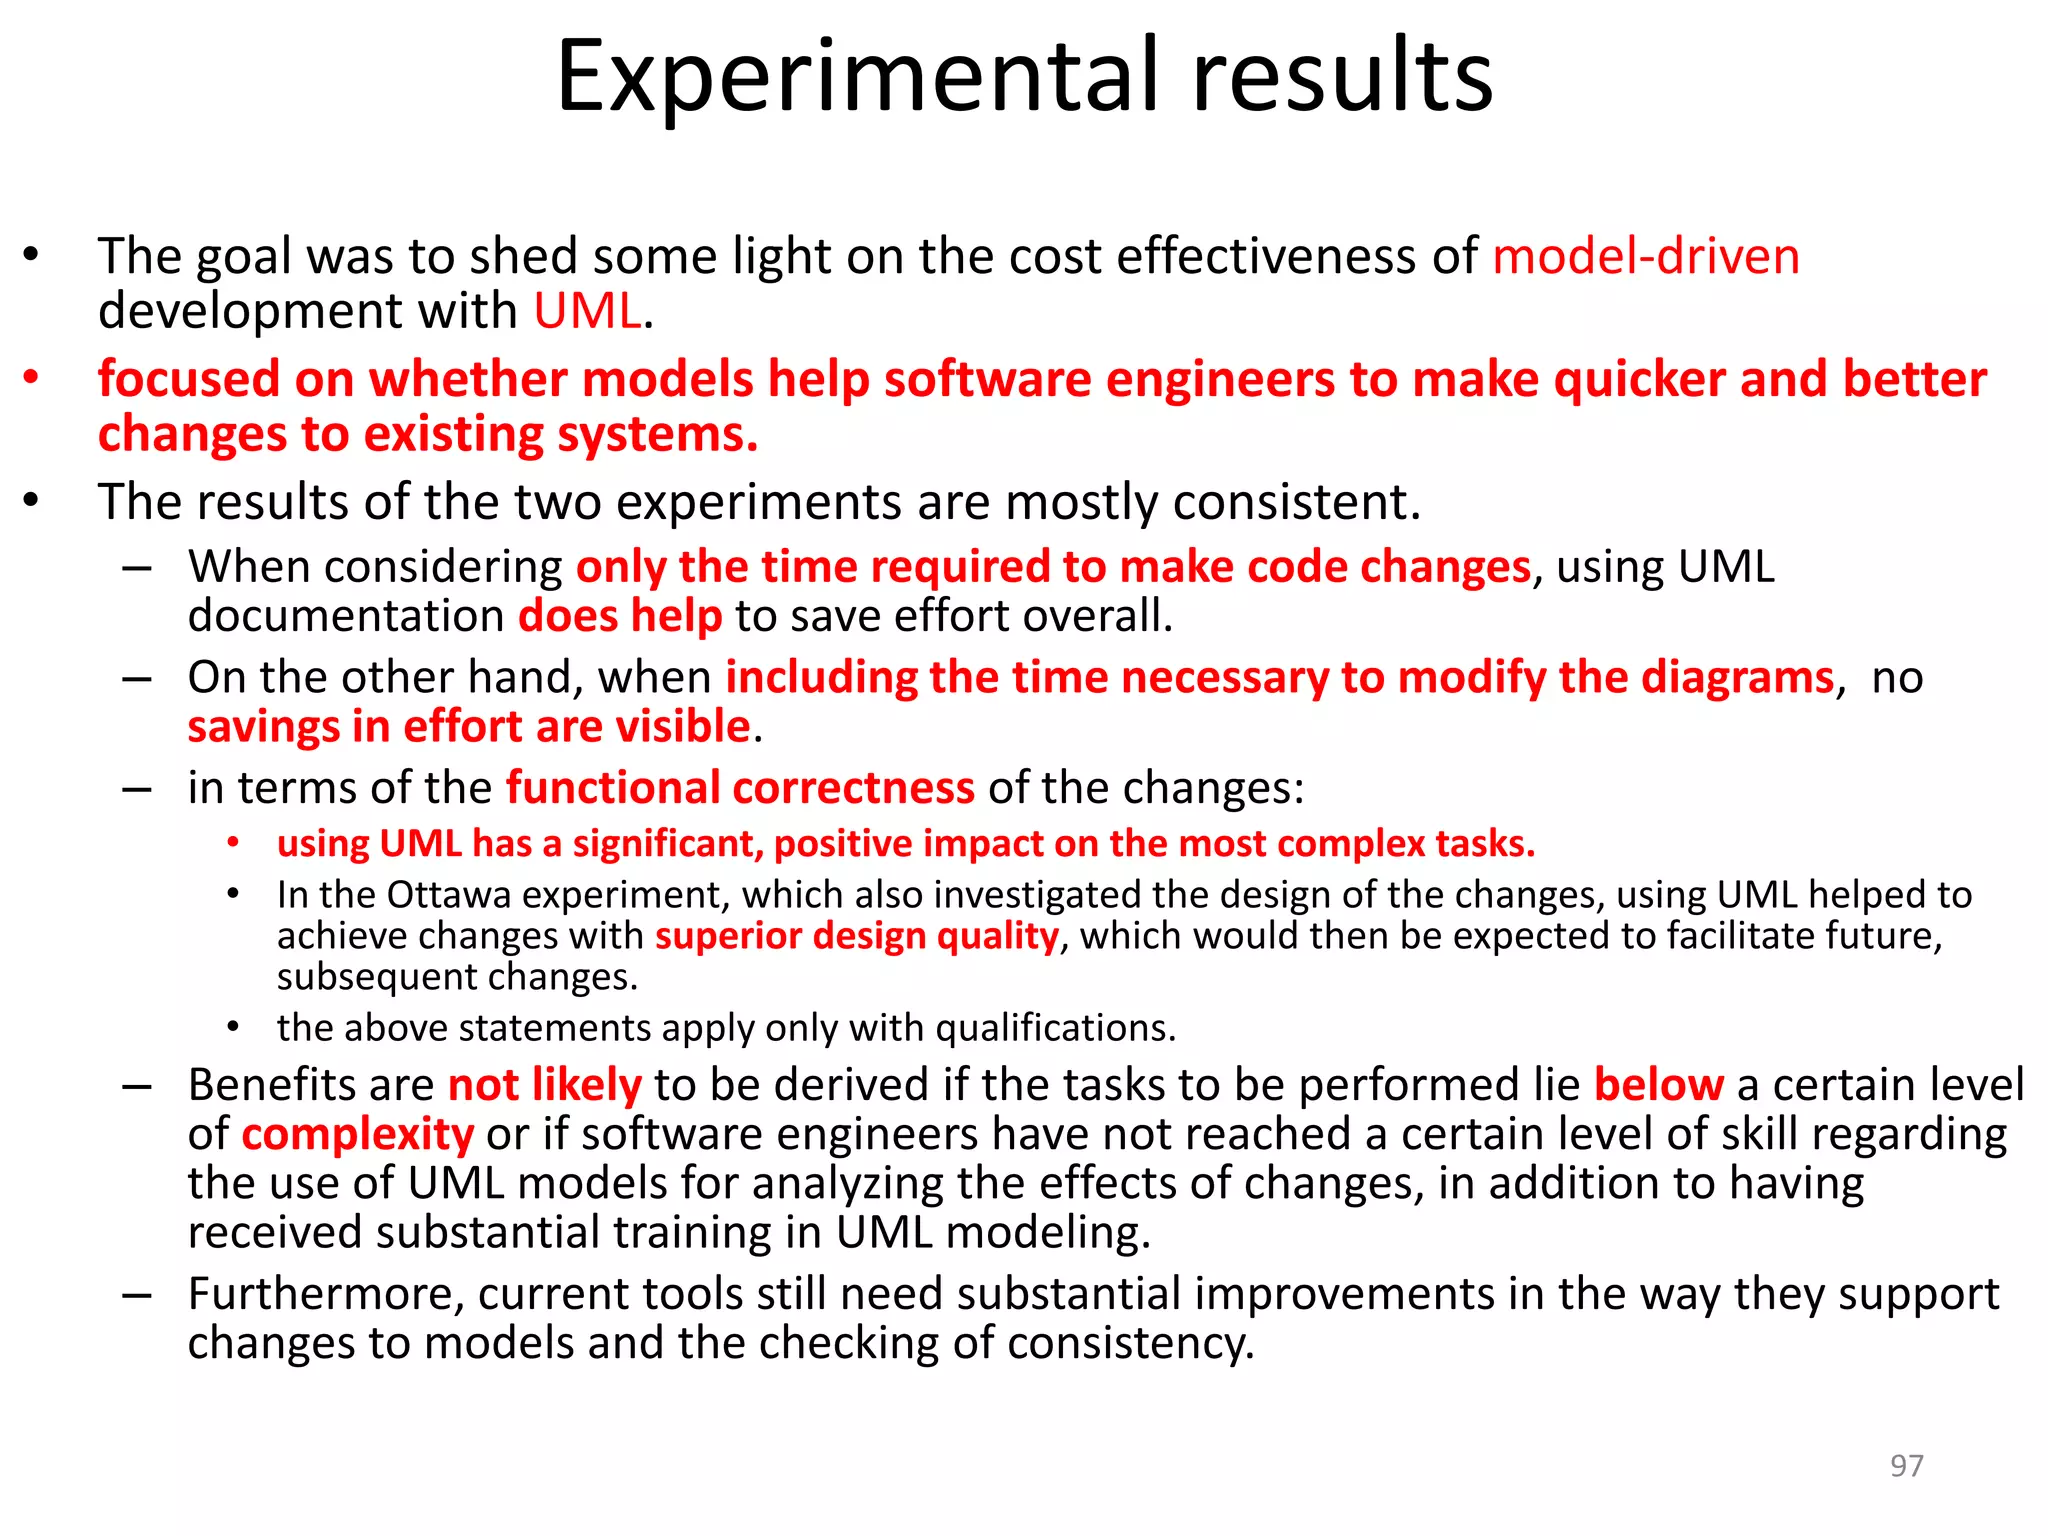
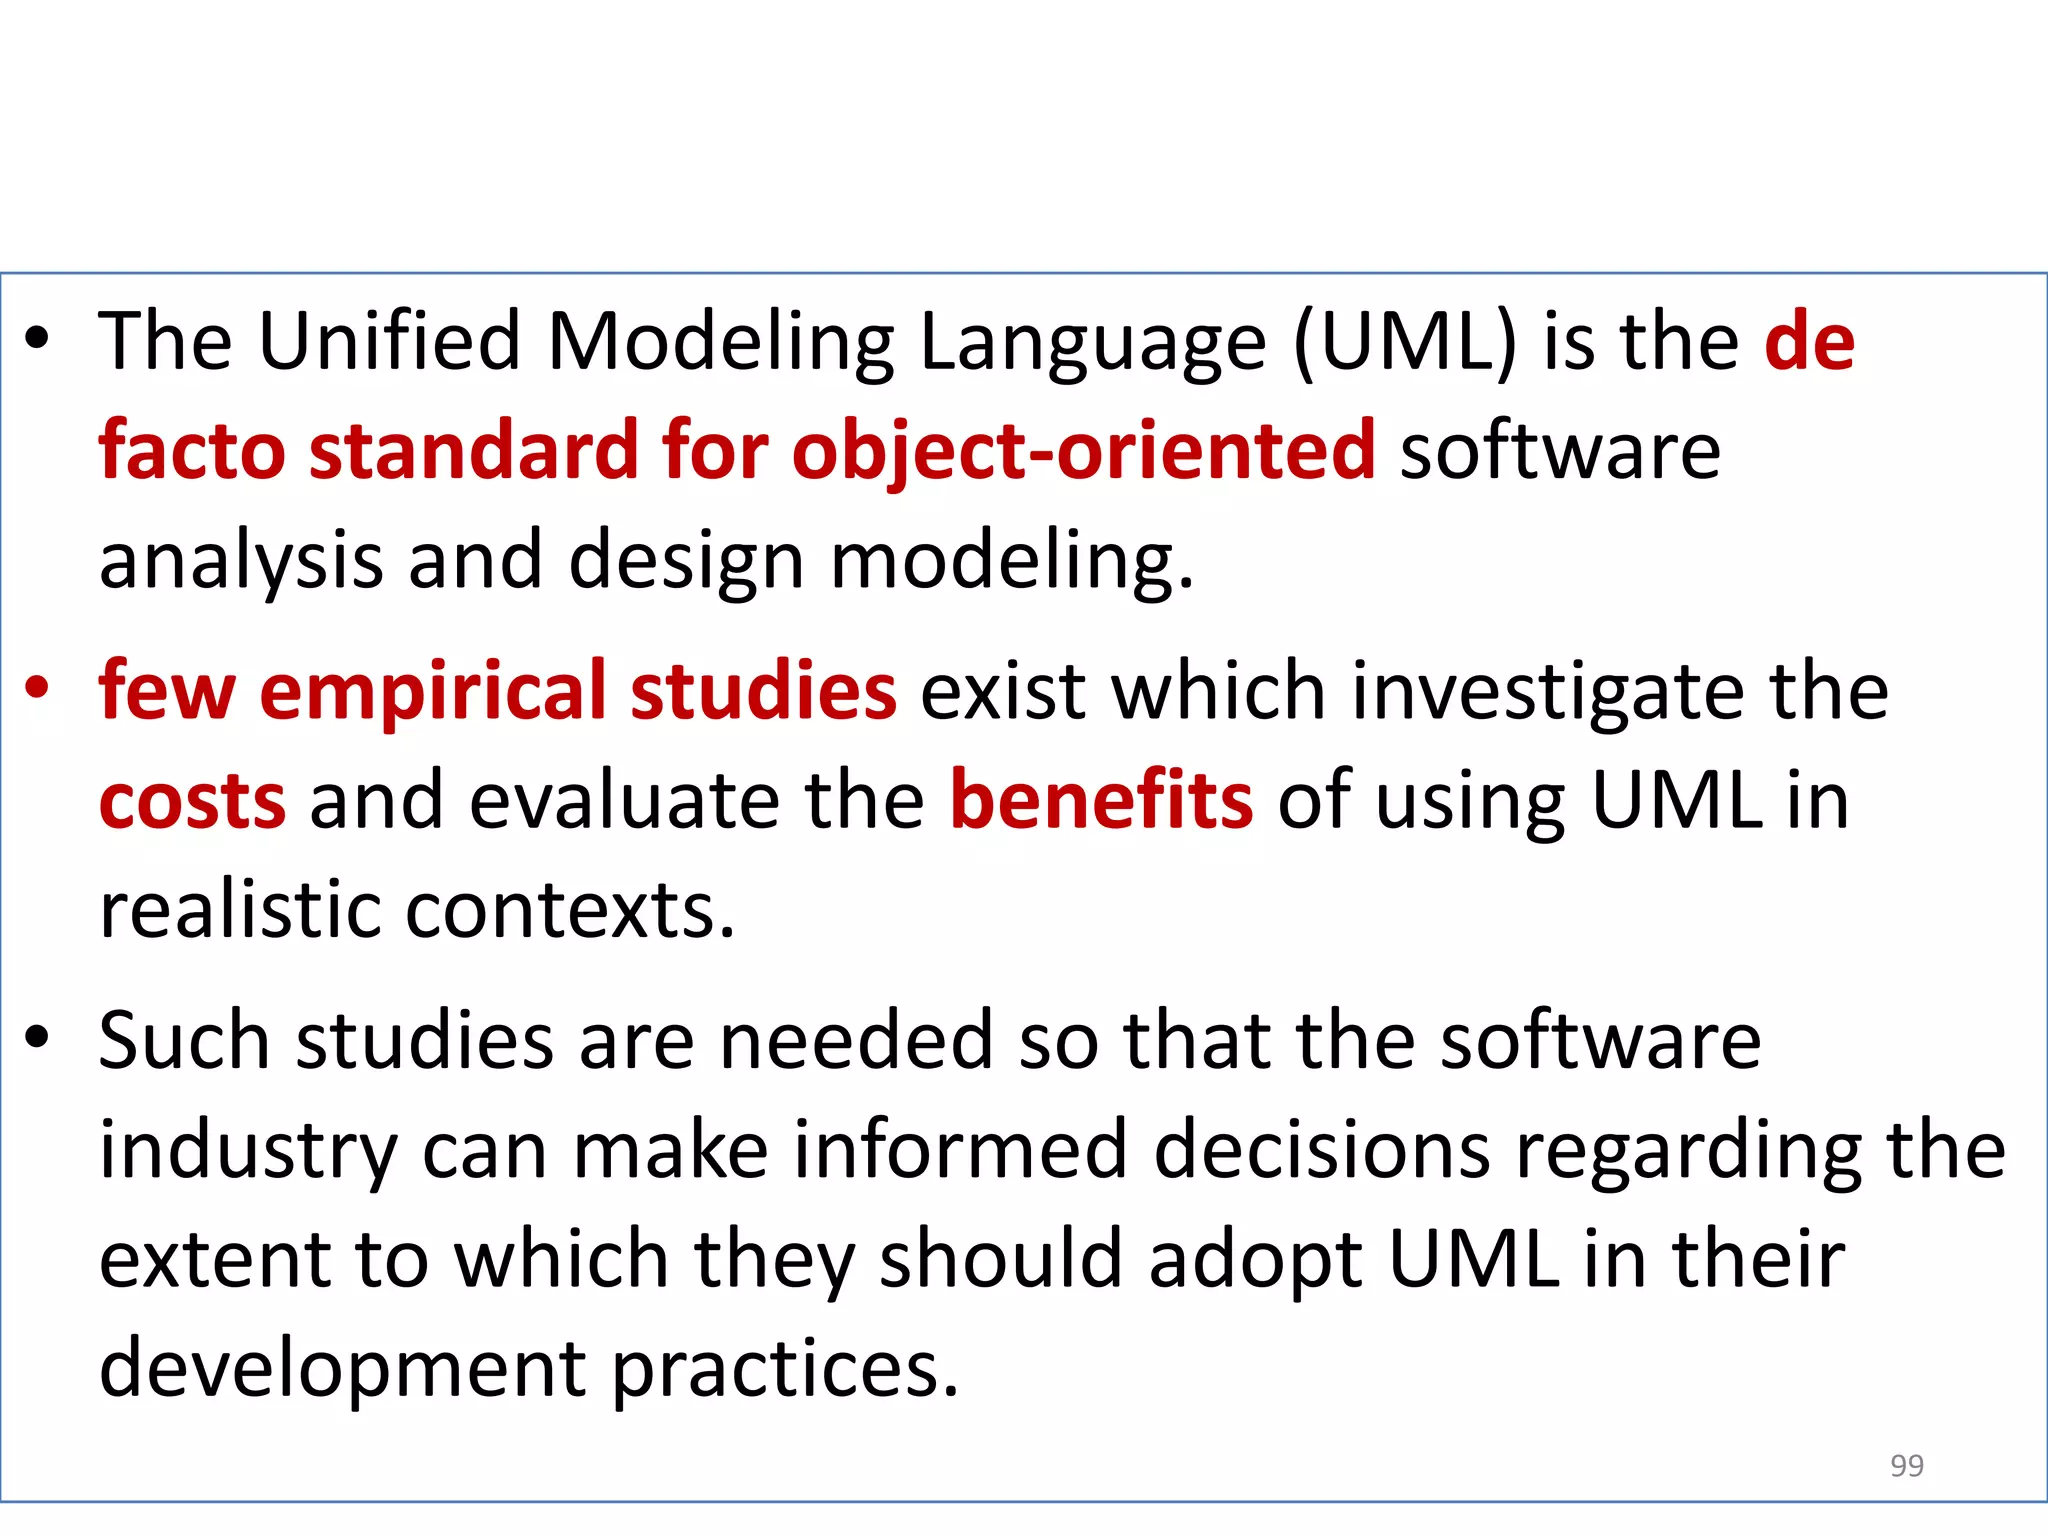
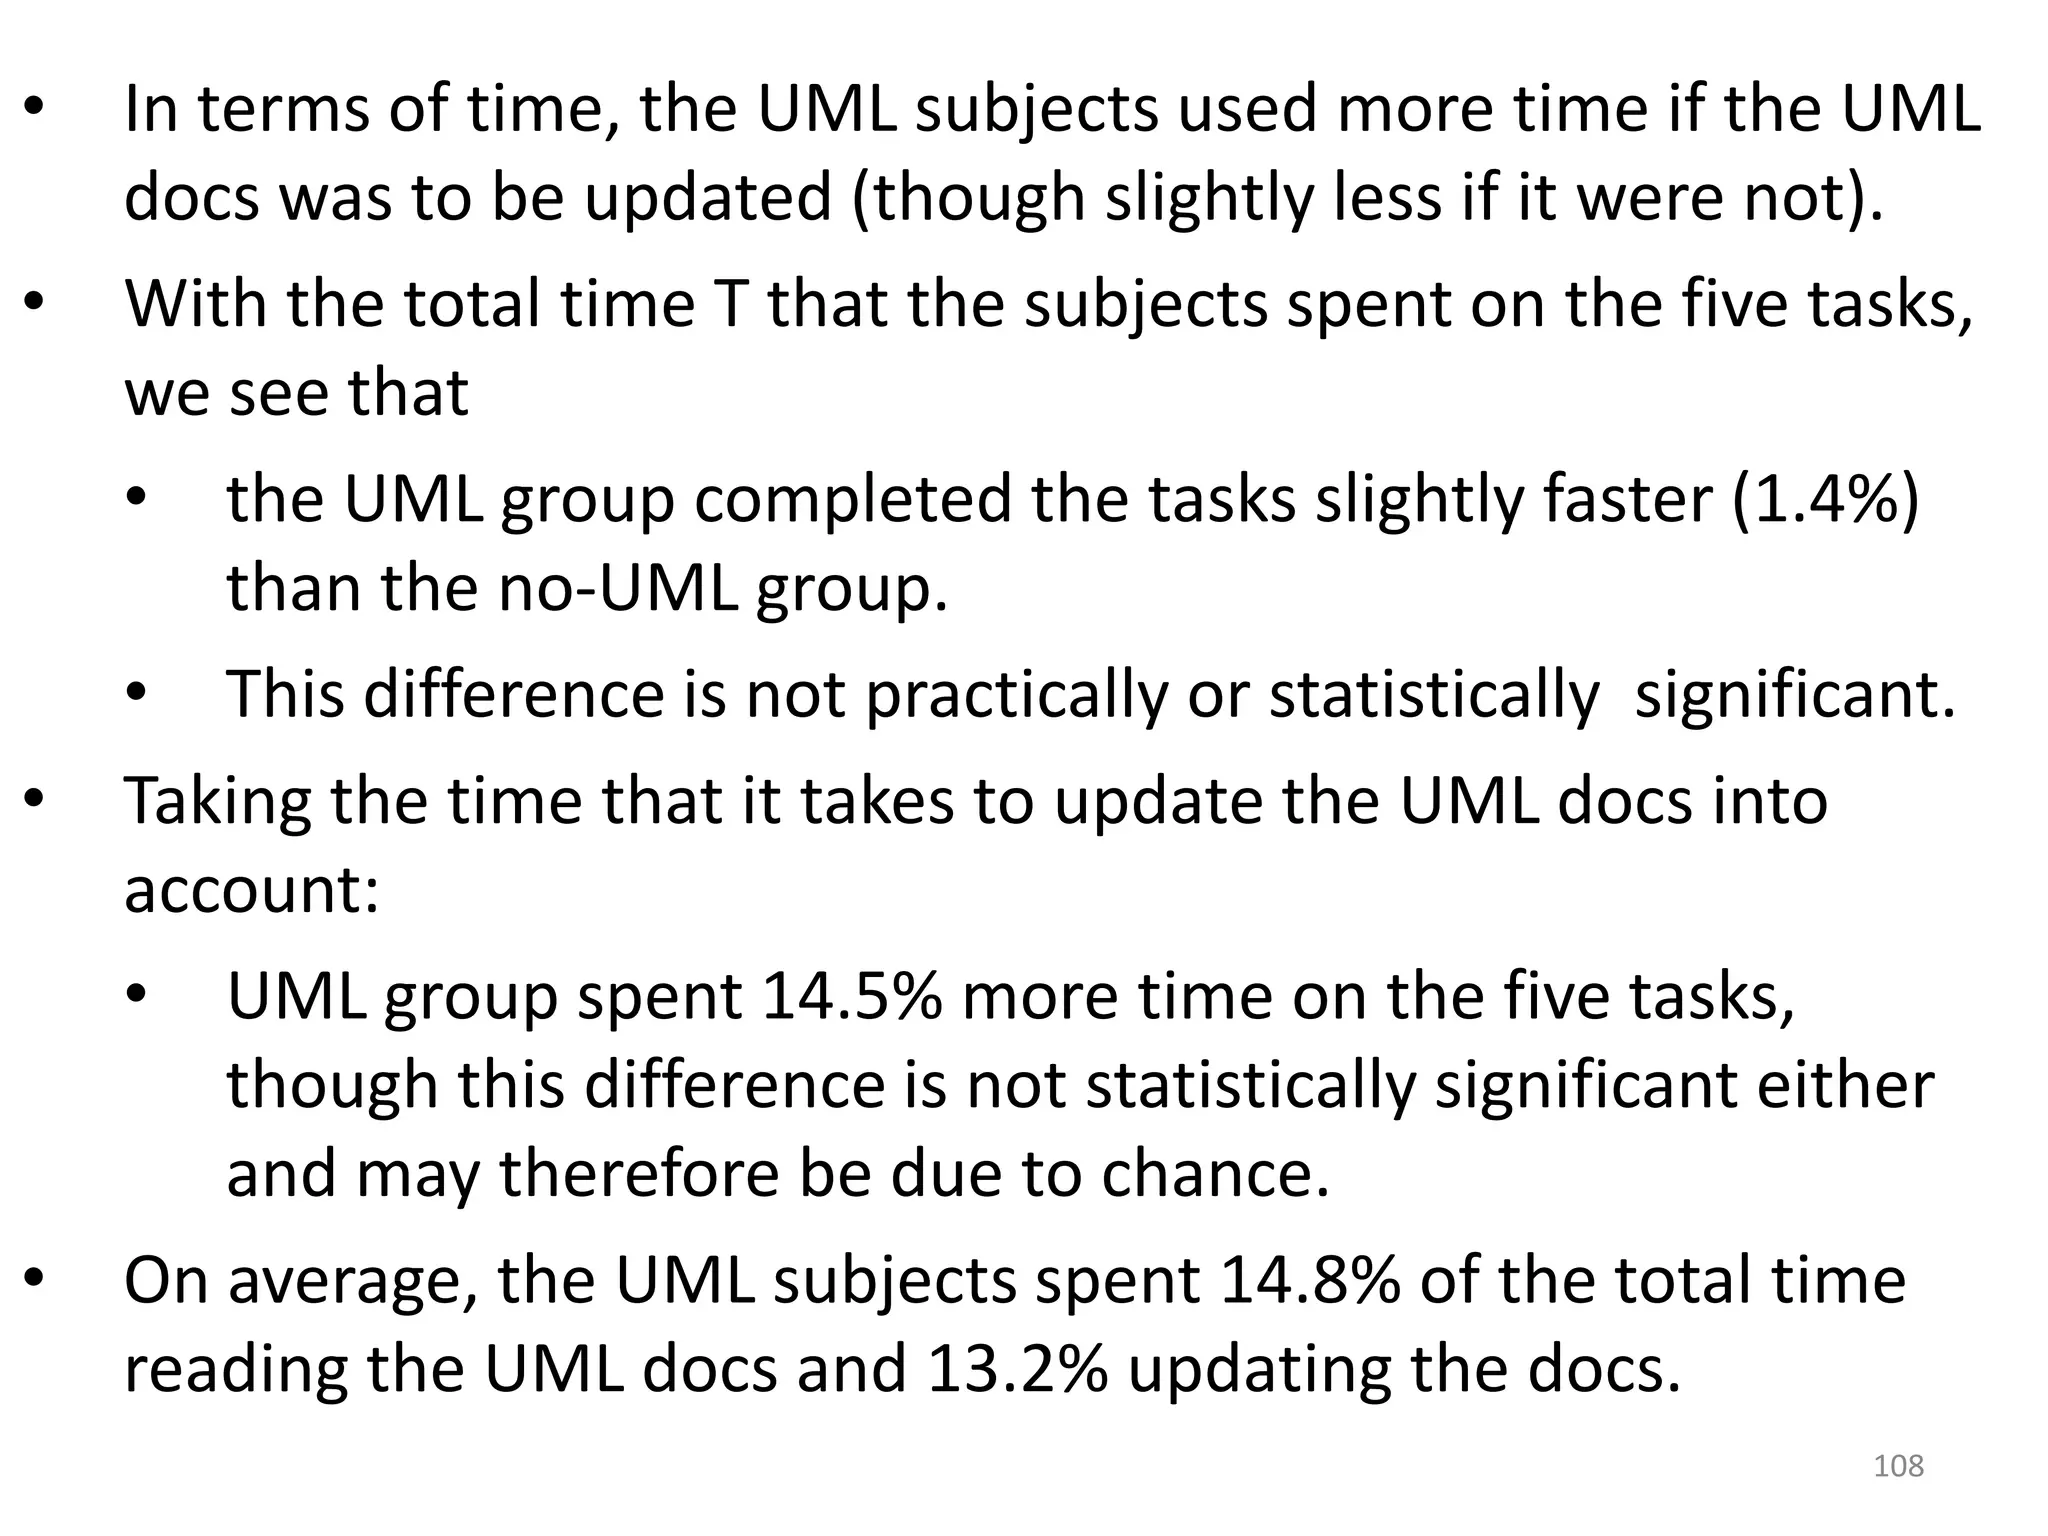
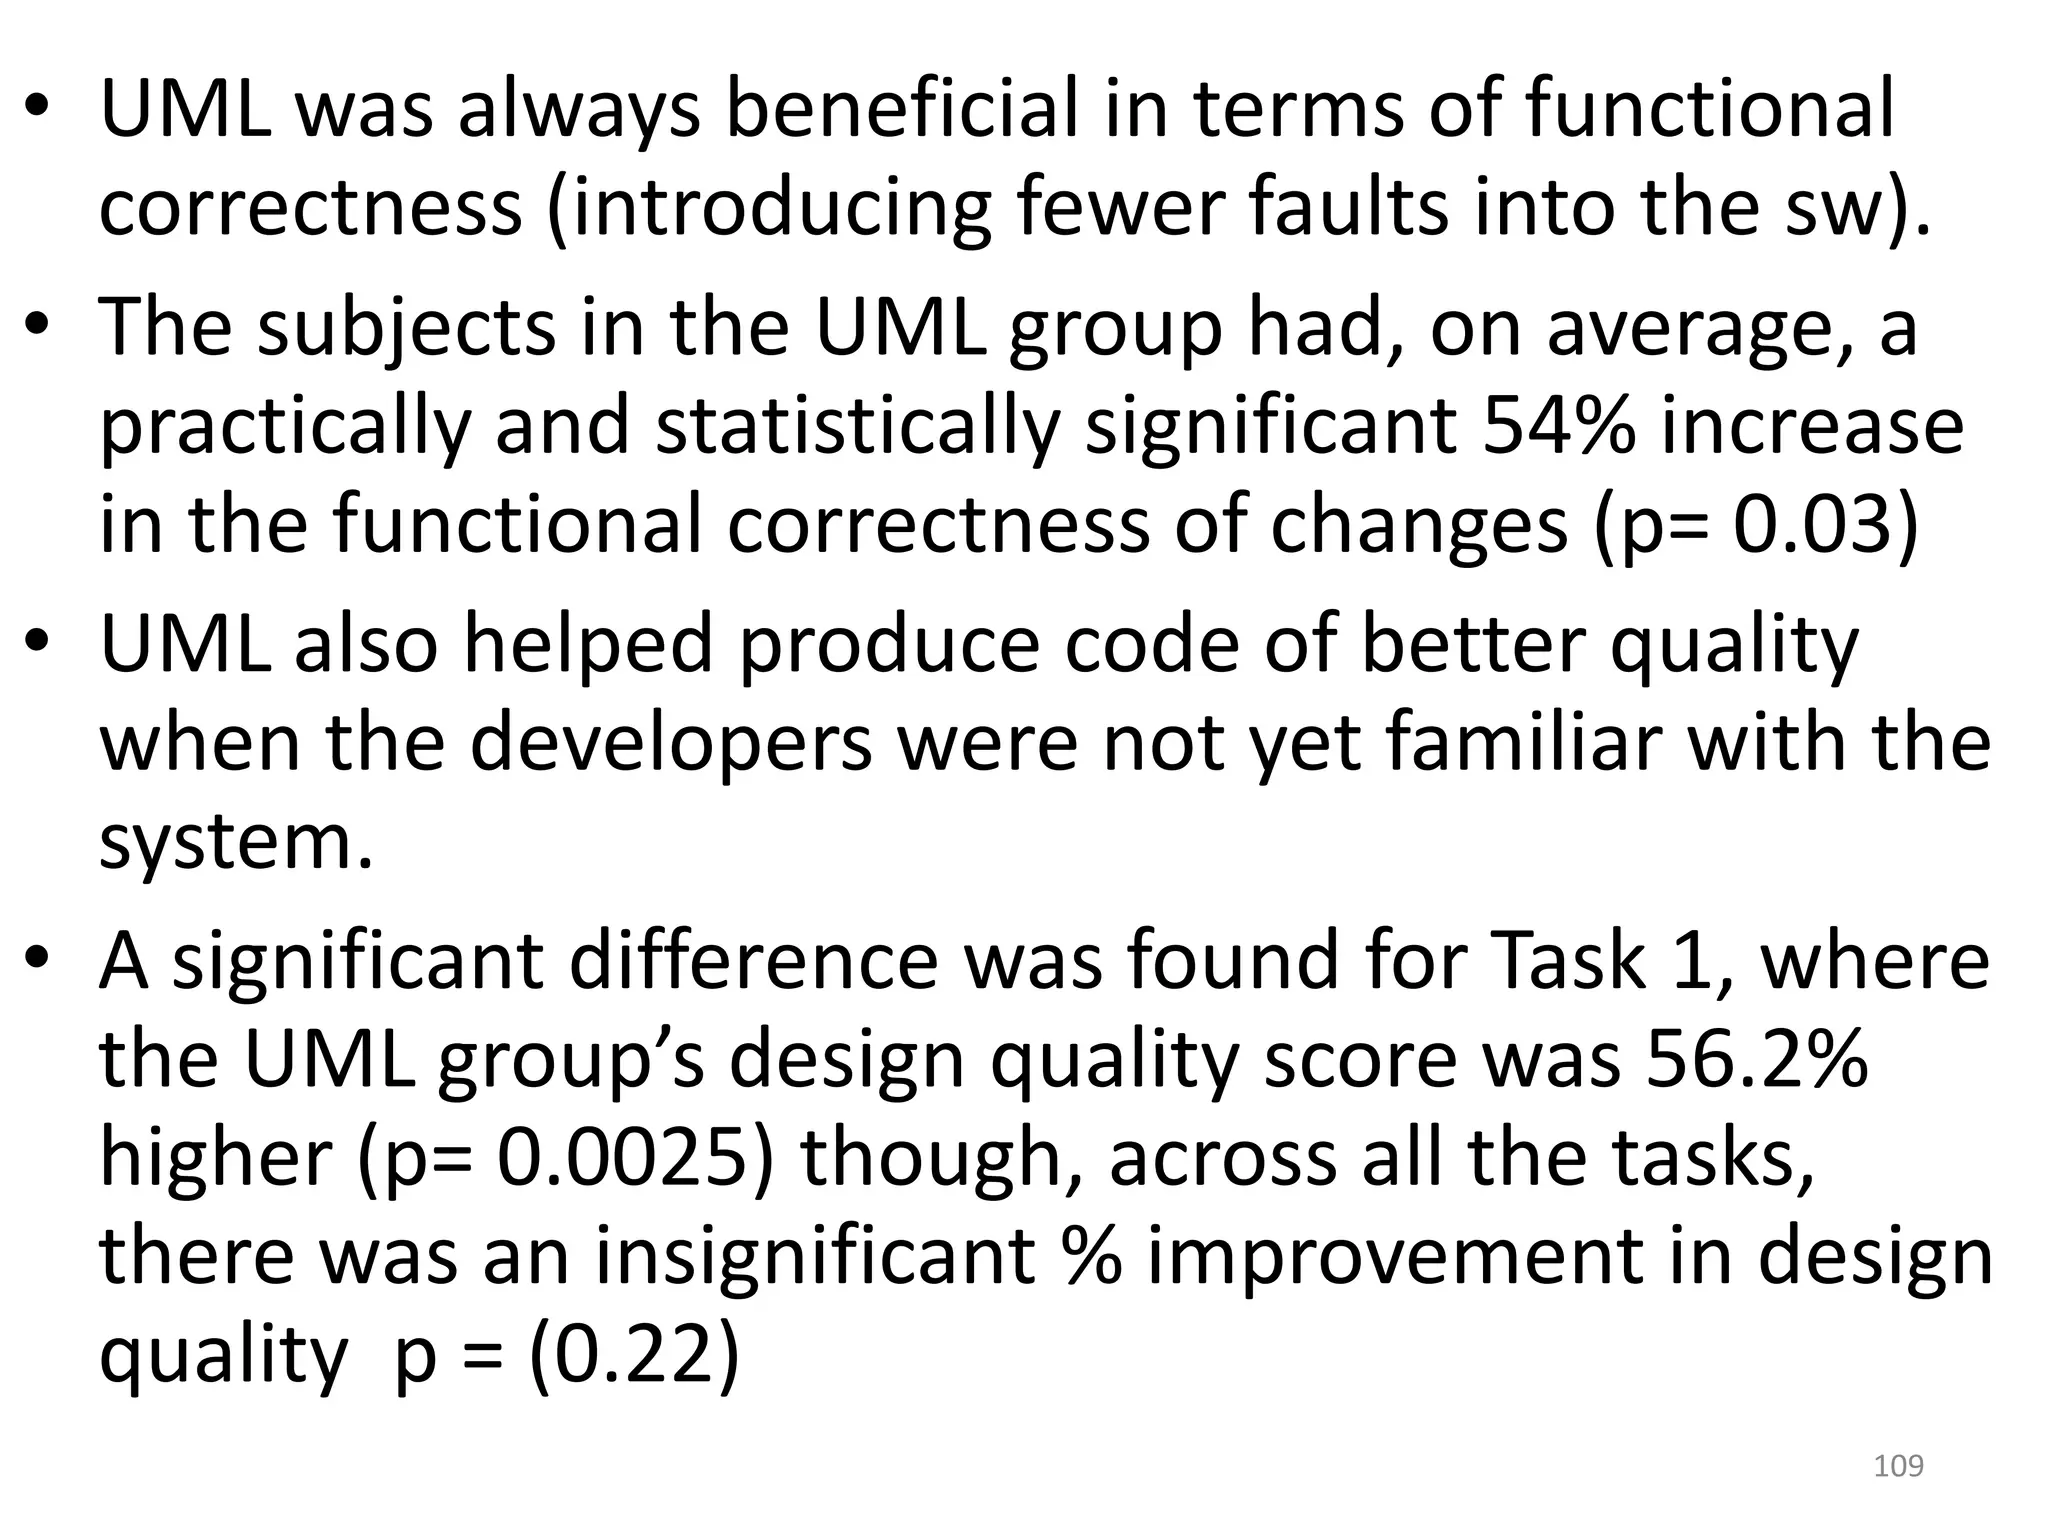
Discusses object-relational modeling challenges and the effectiveness of UML in aiding software documentation.
Describes key differences between structured (SAD) and object-oriented analysis and design (OOAD) methodologies.
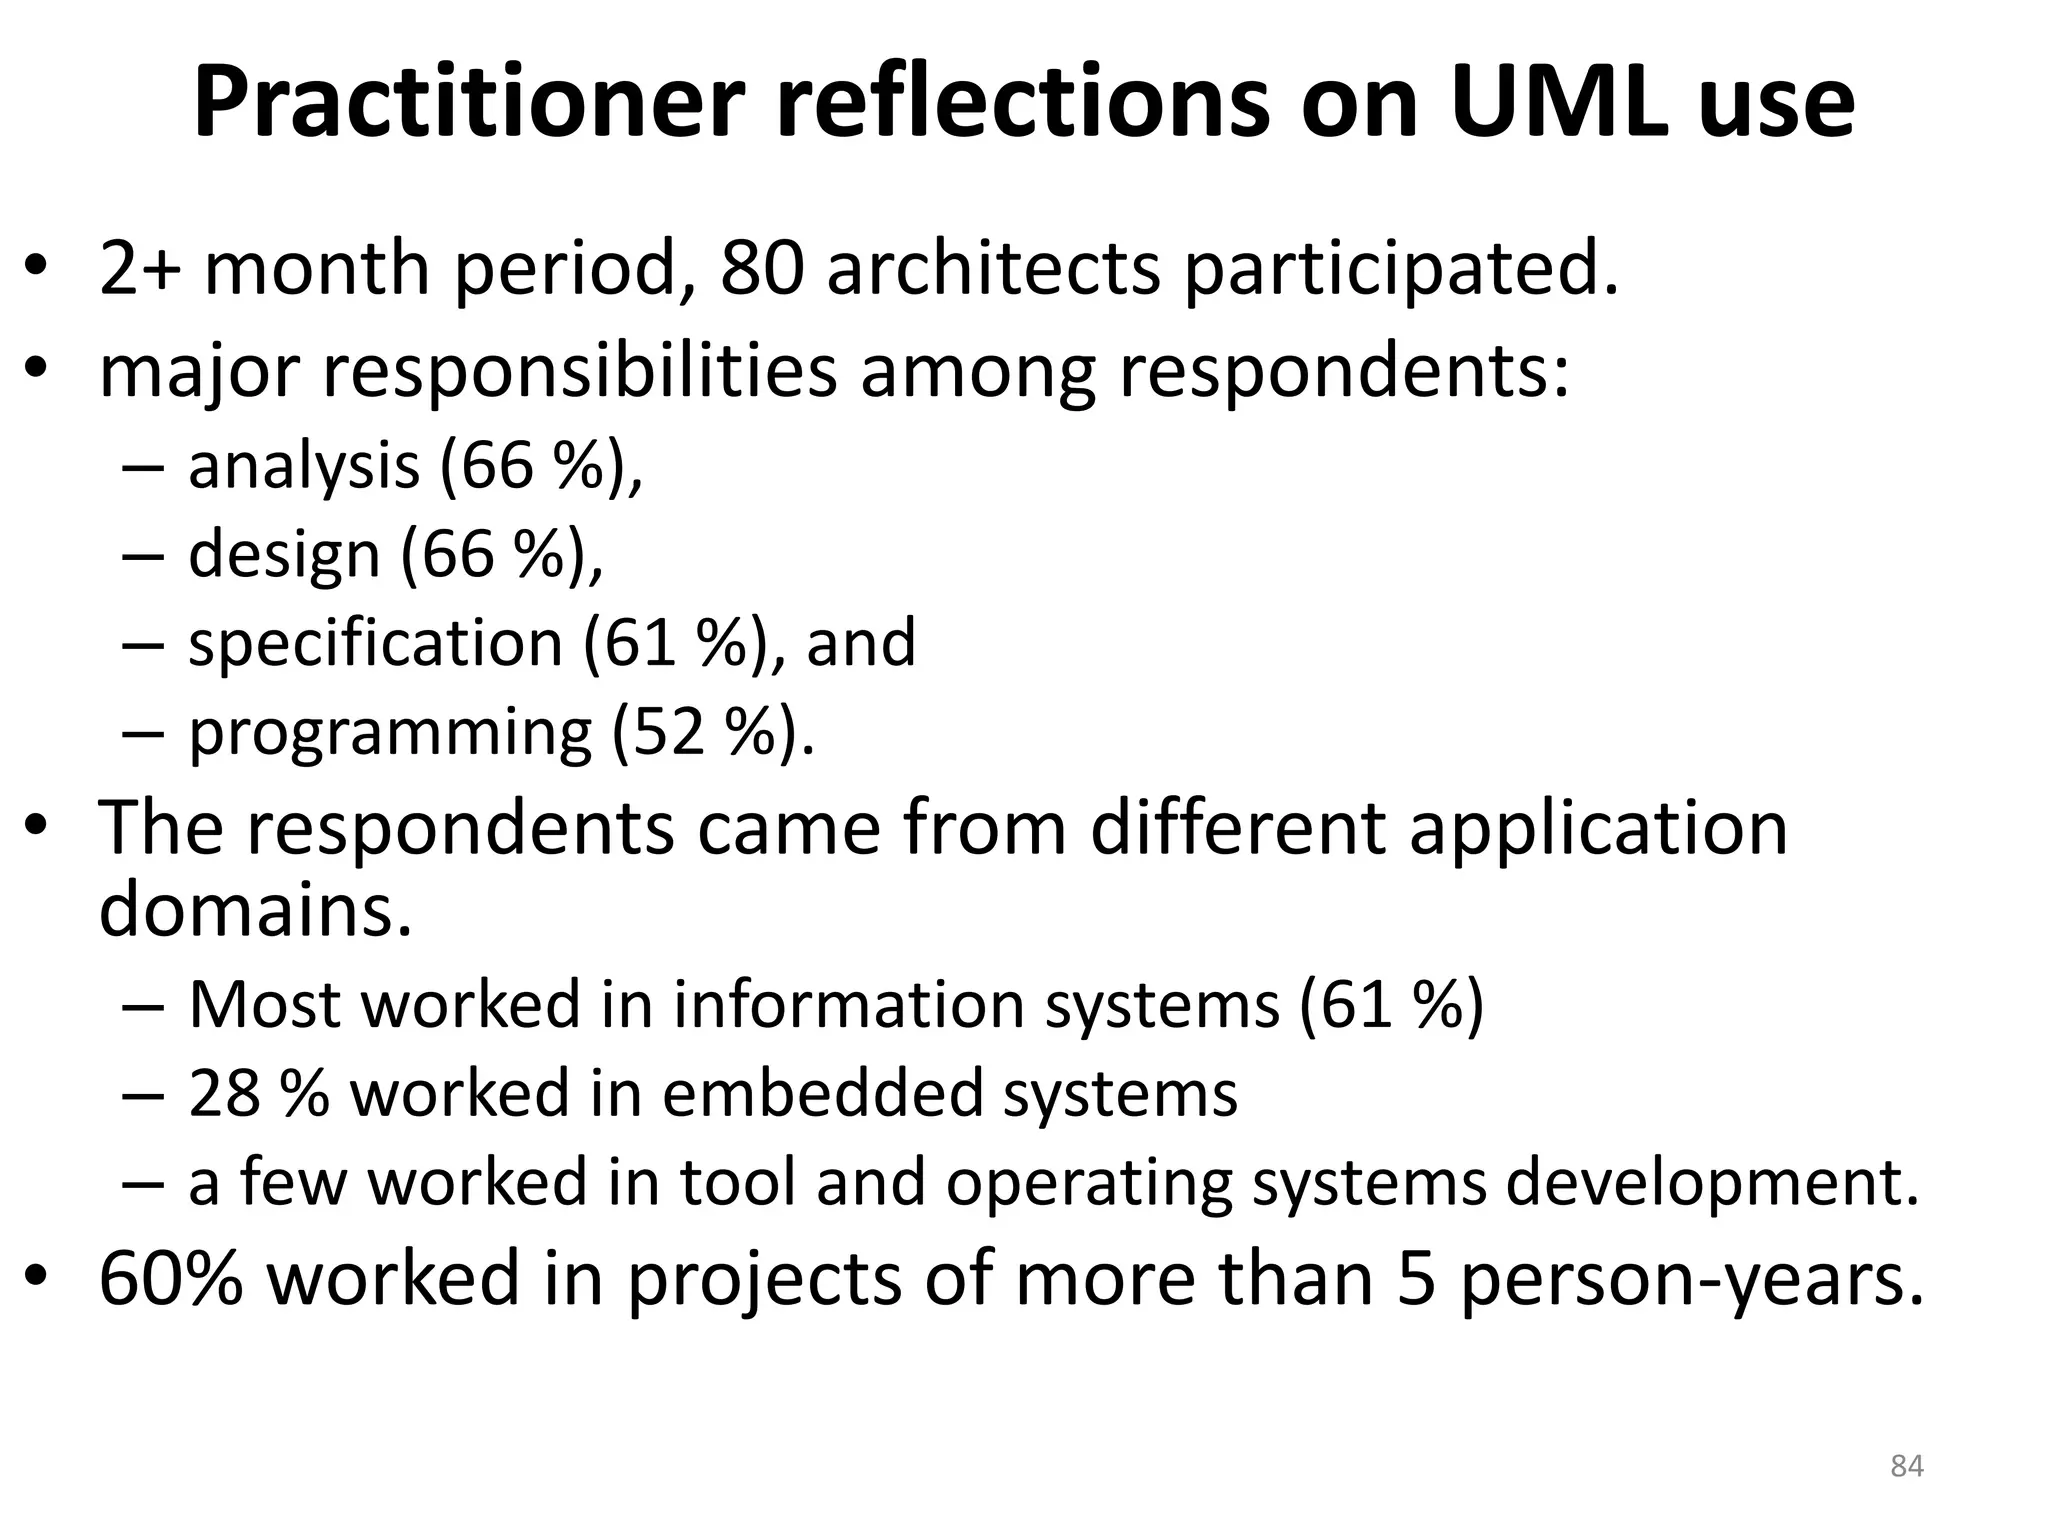
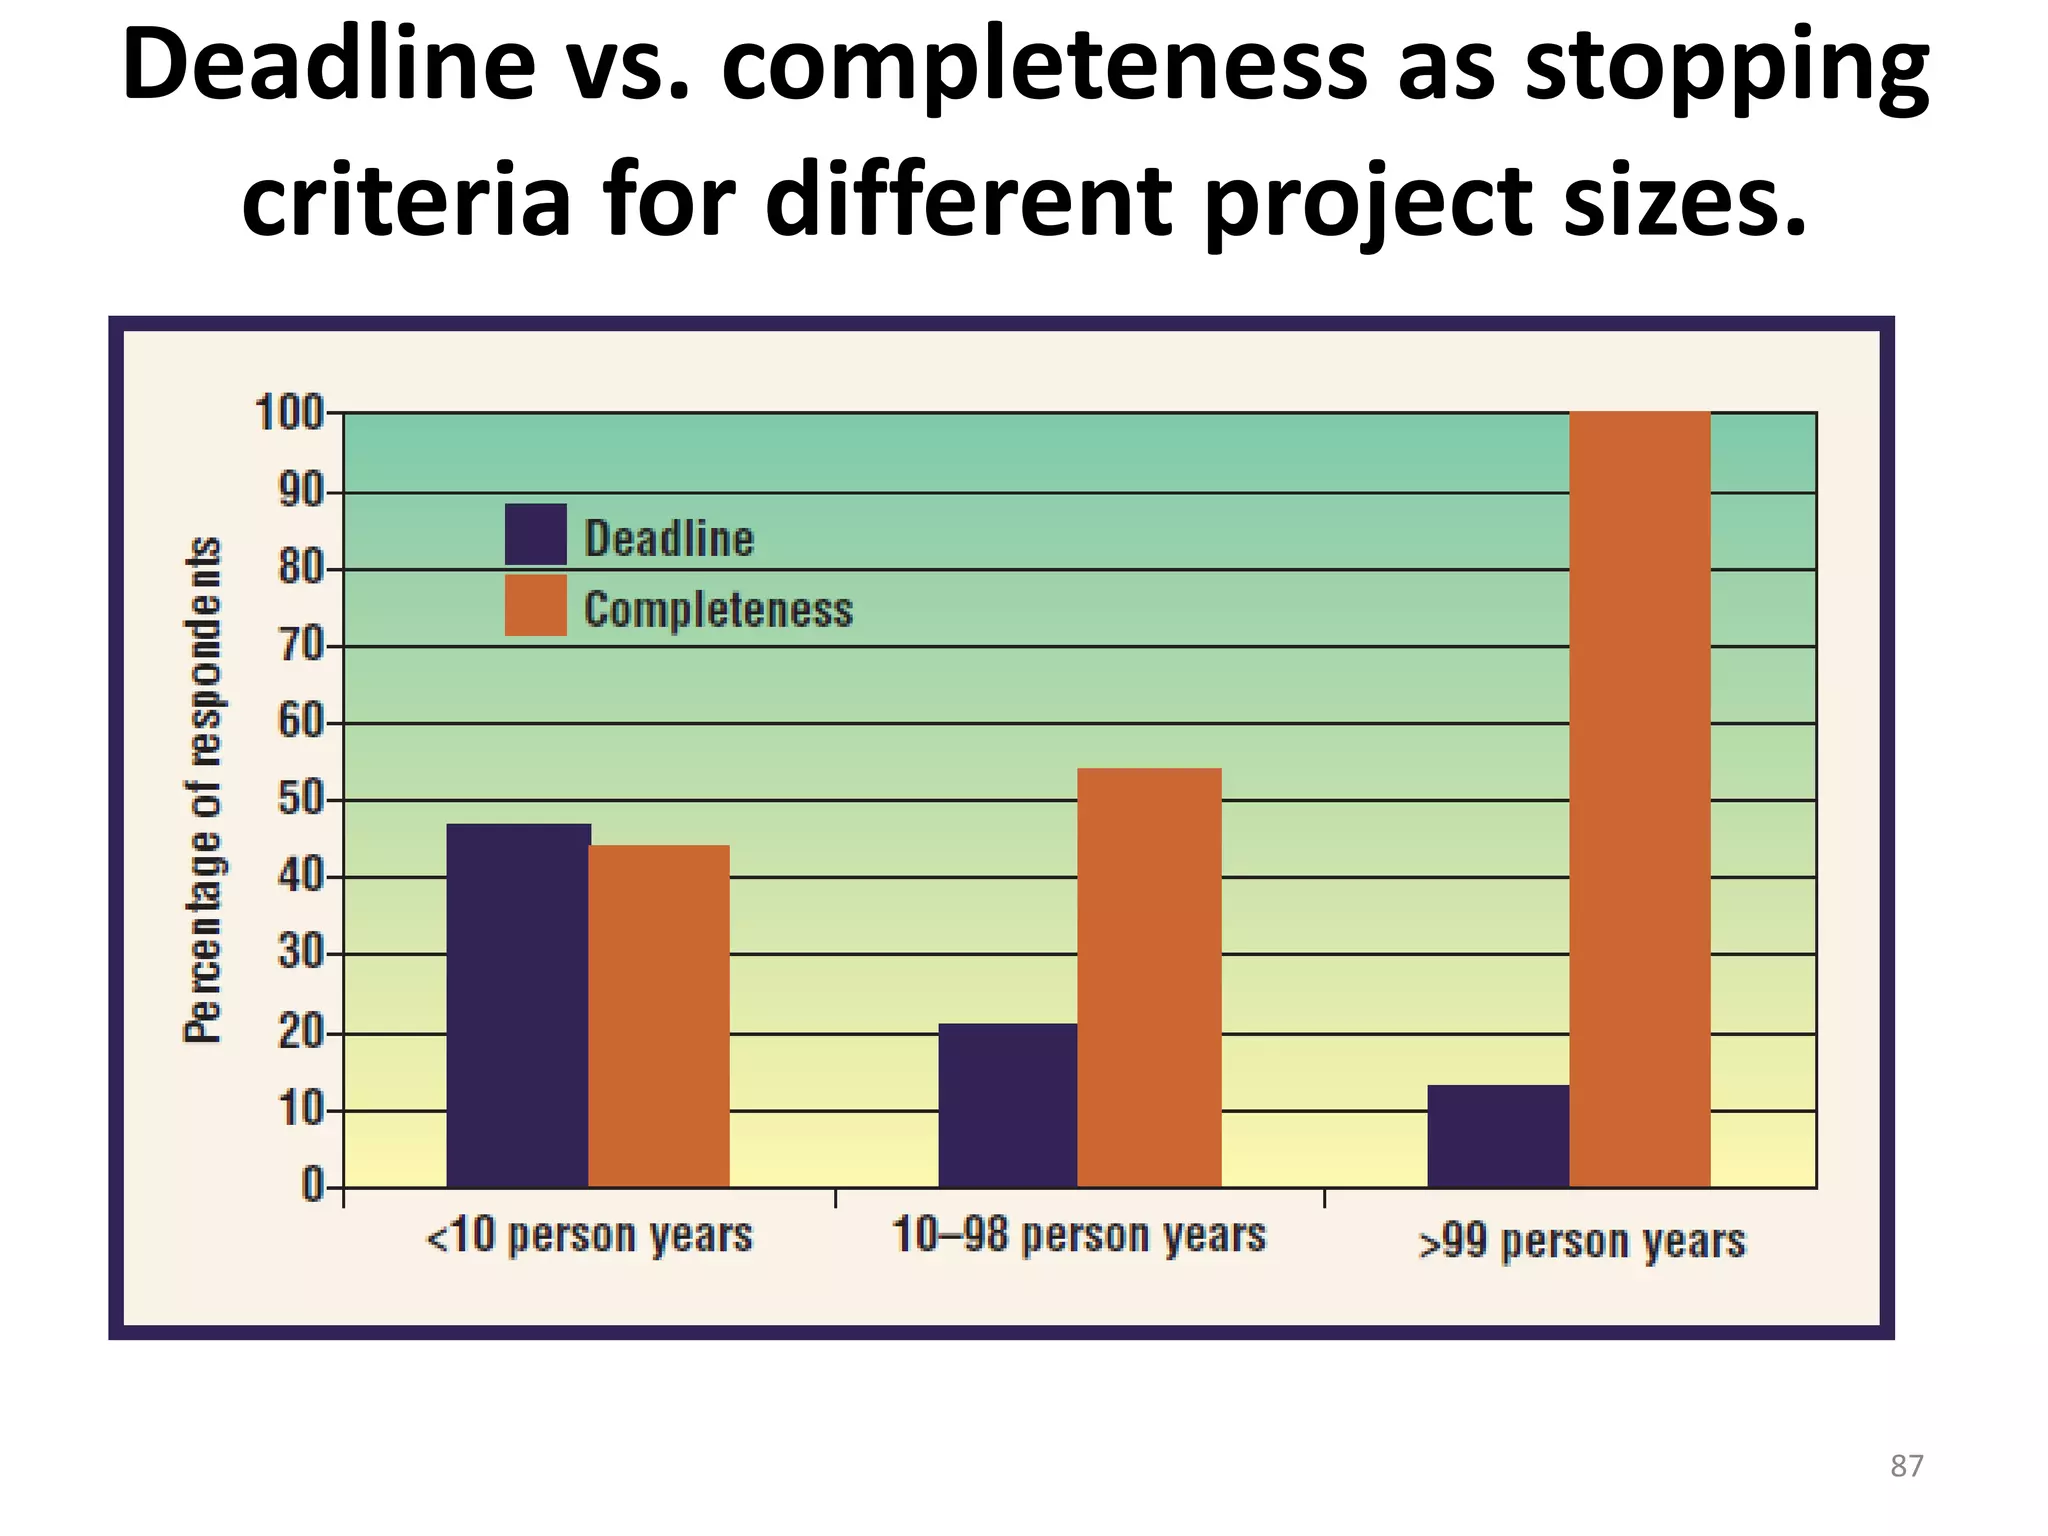
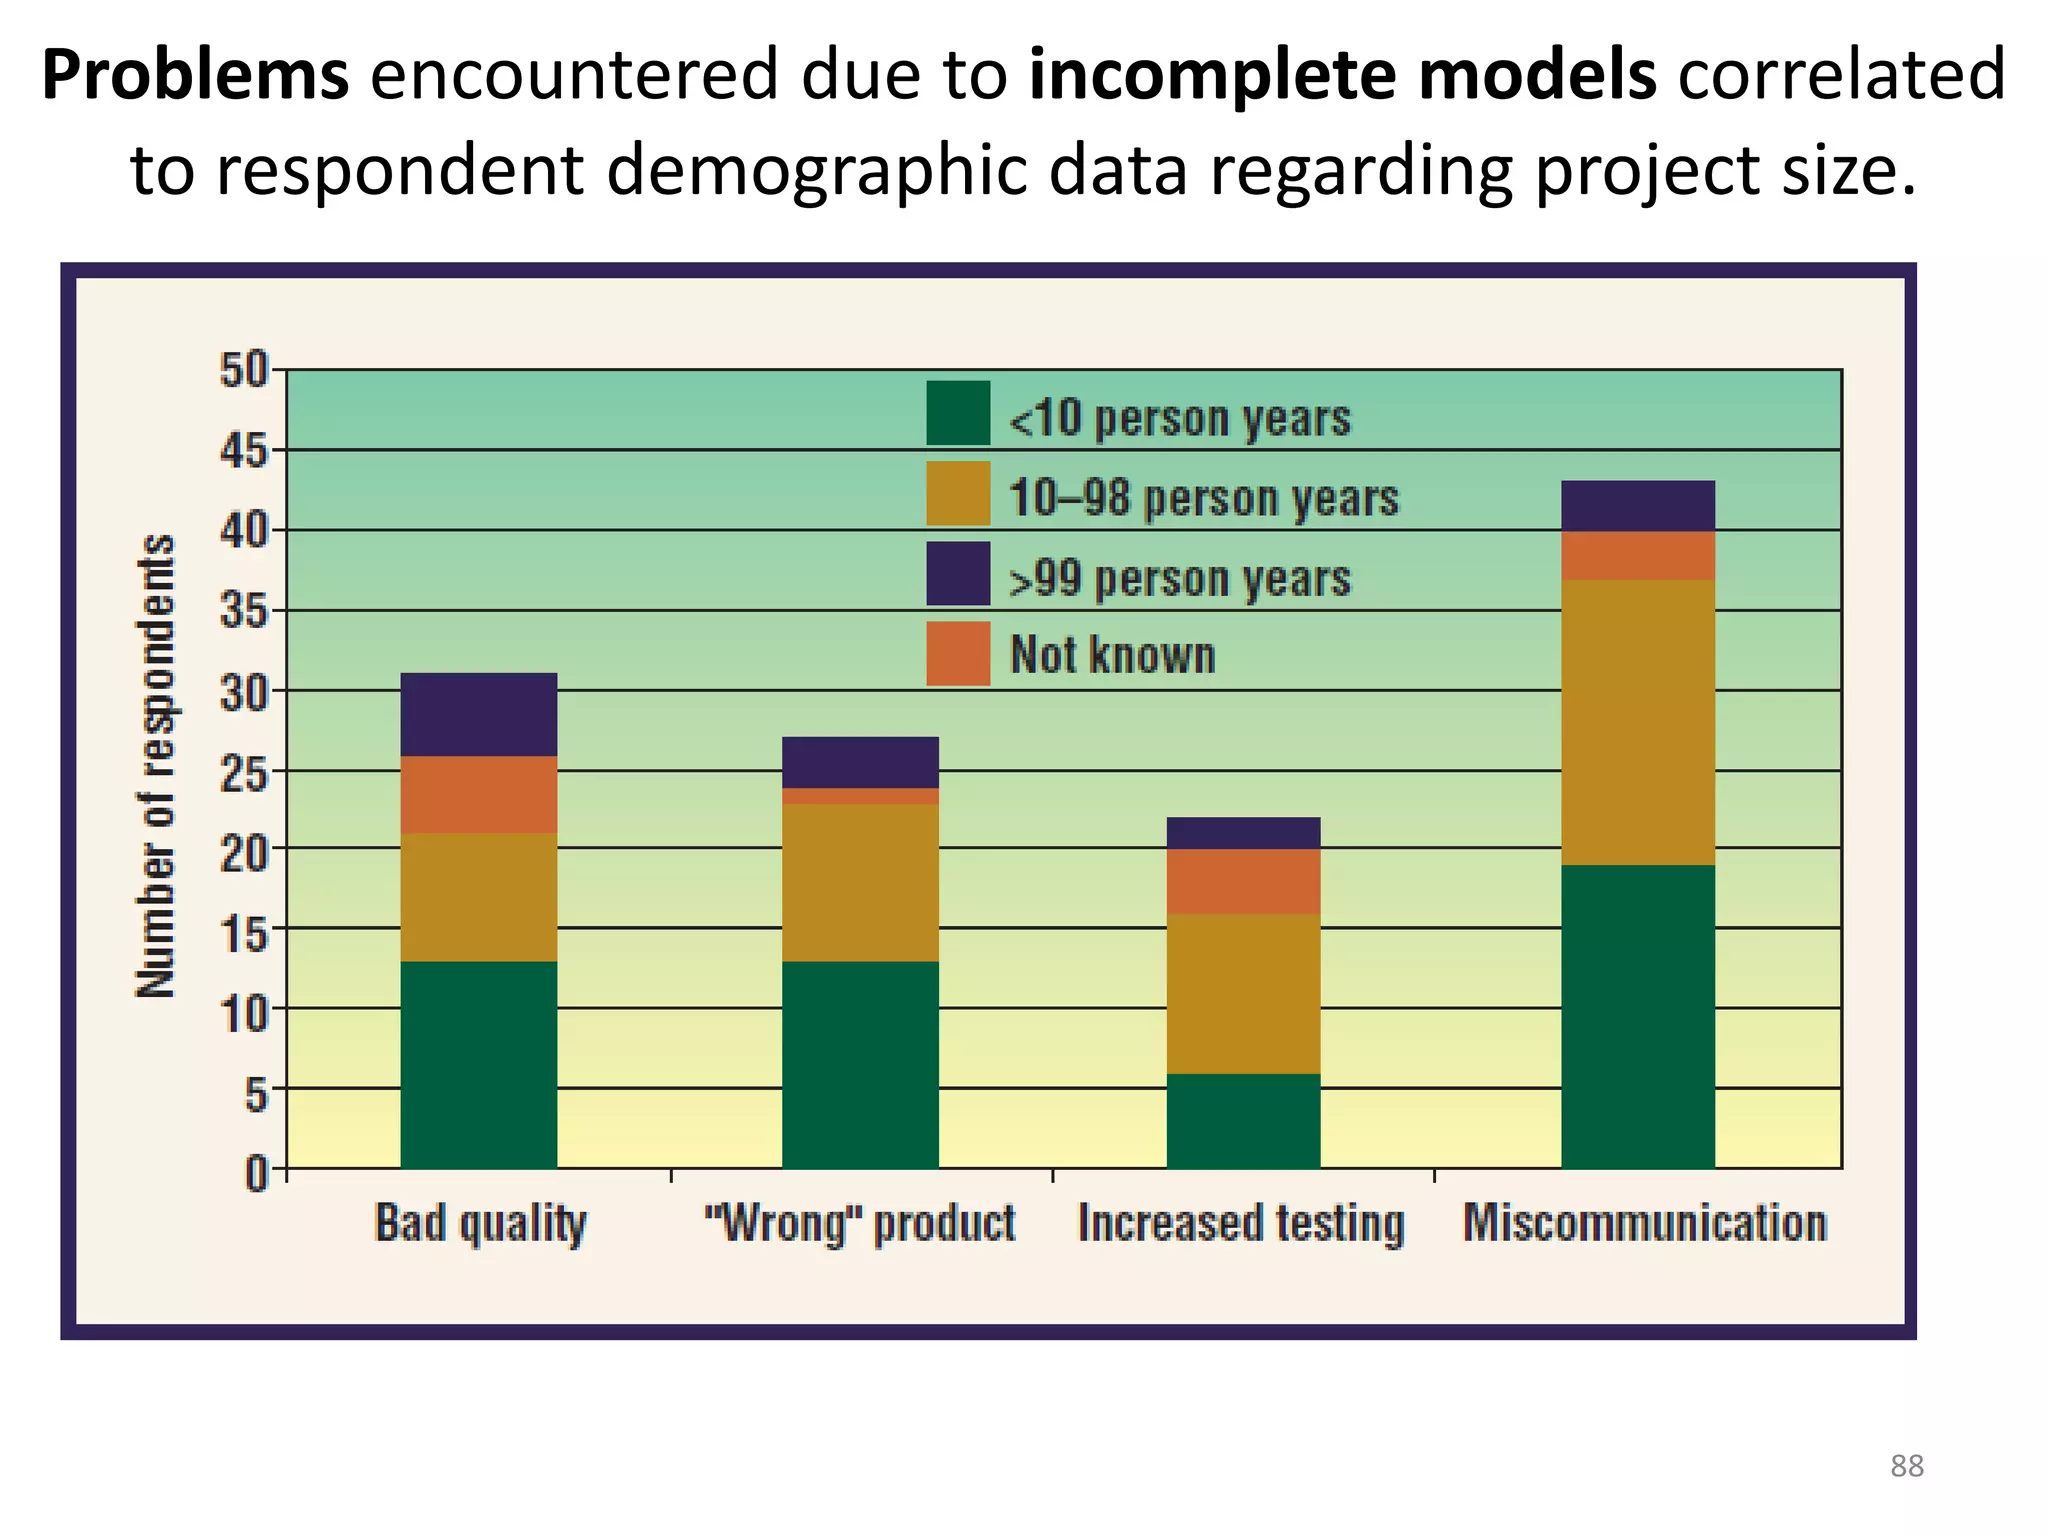
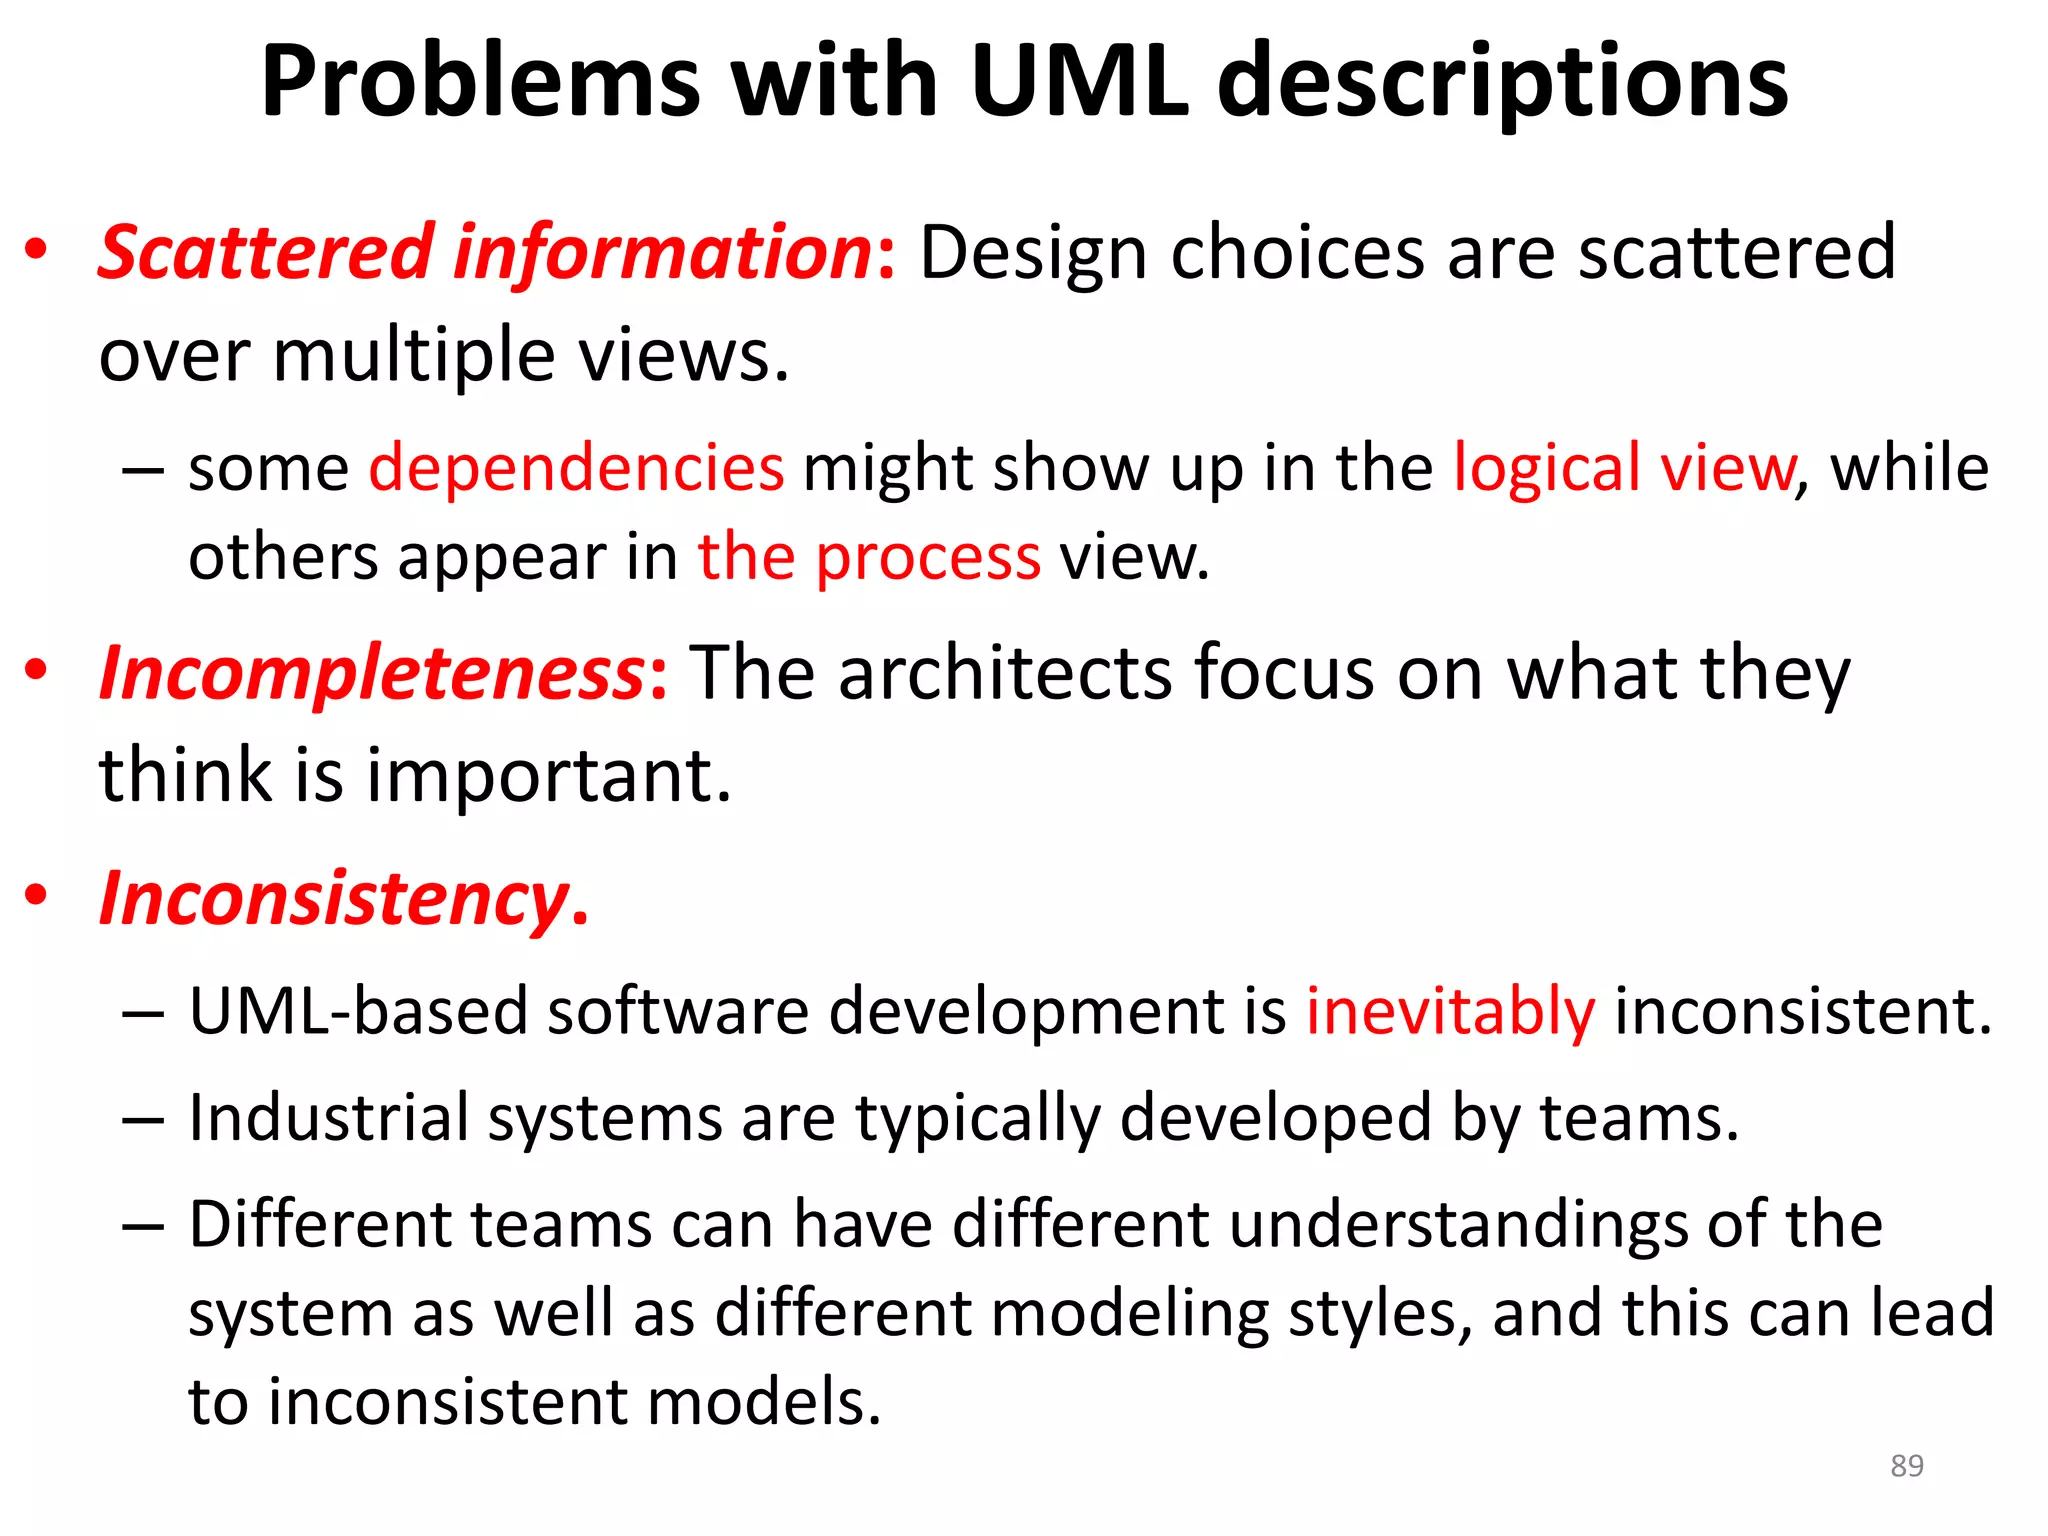
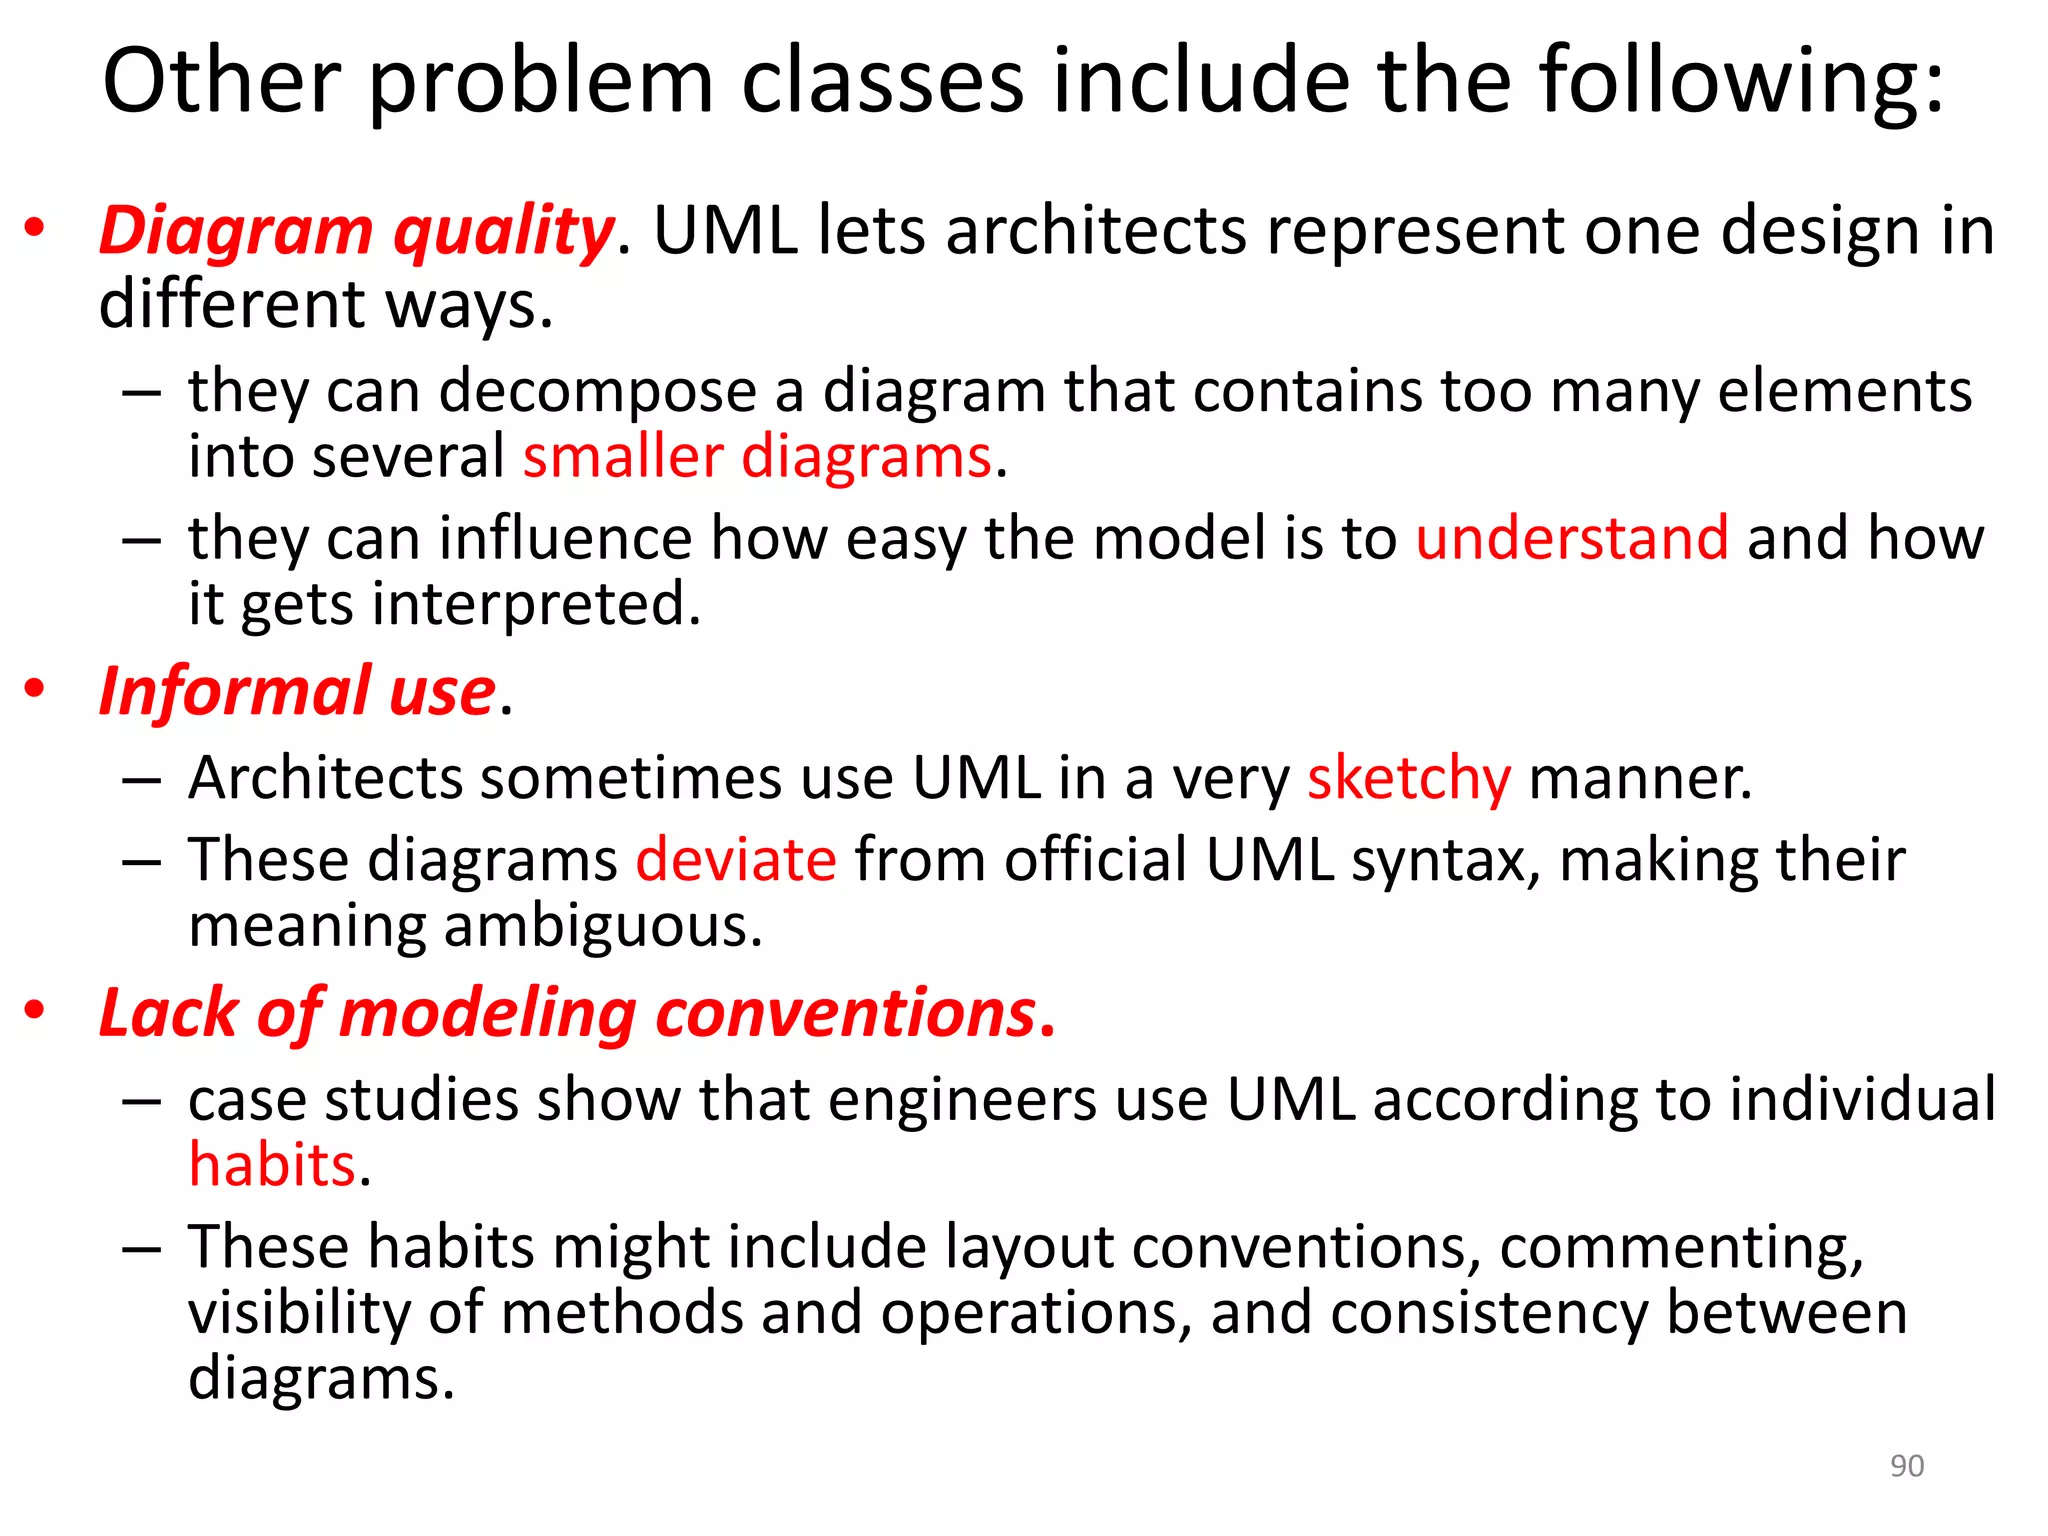
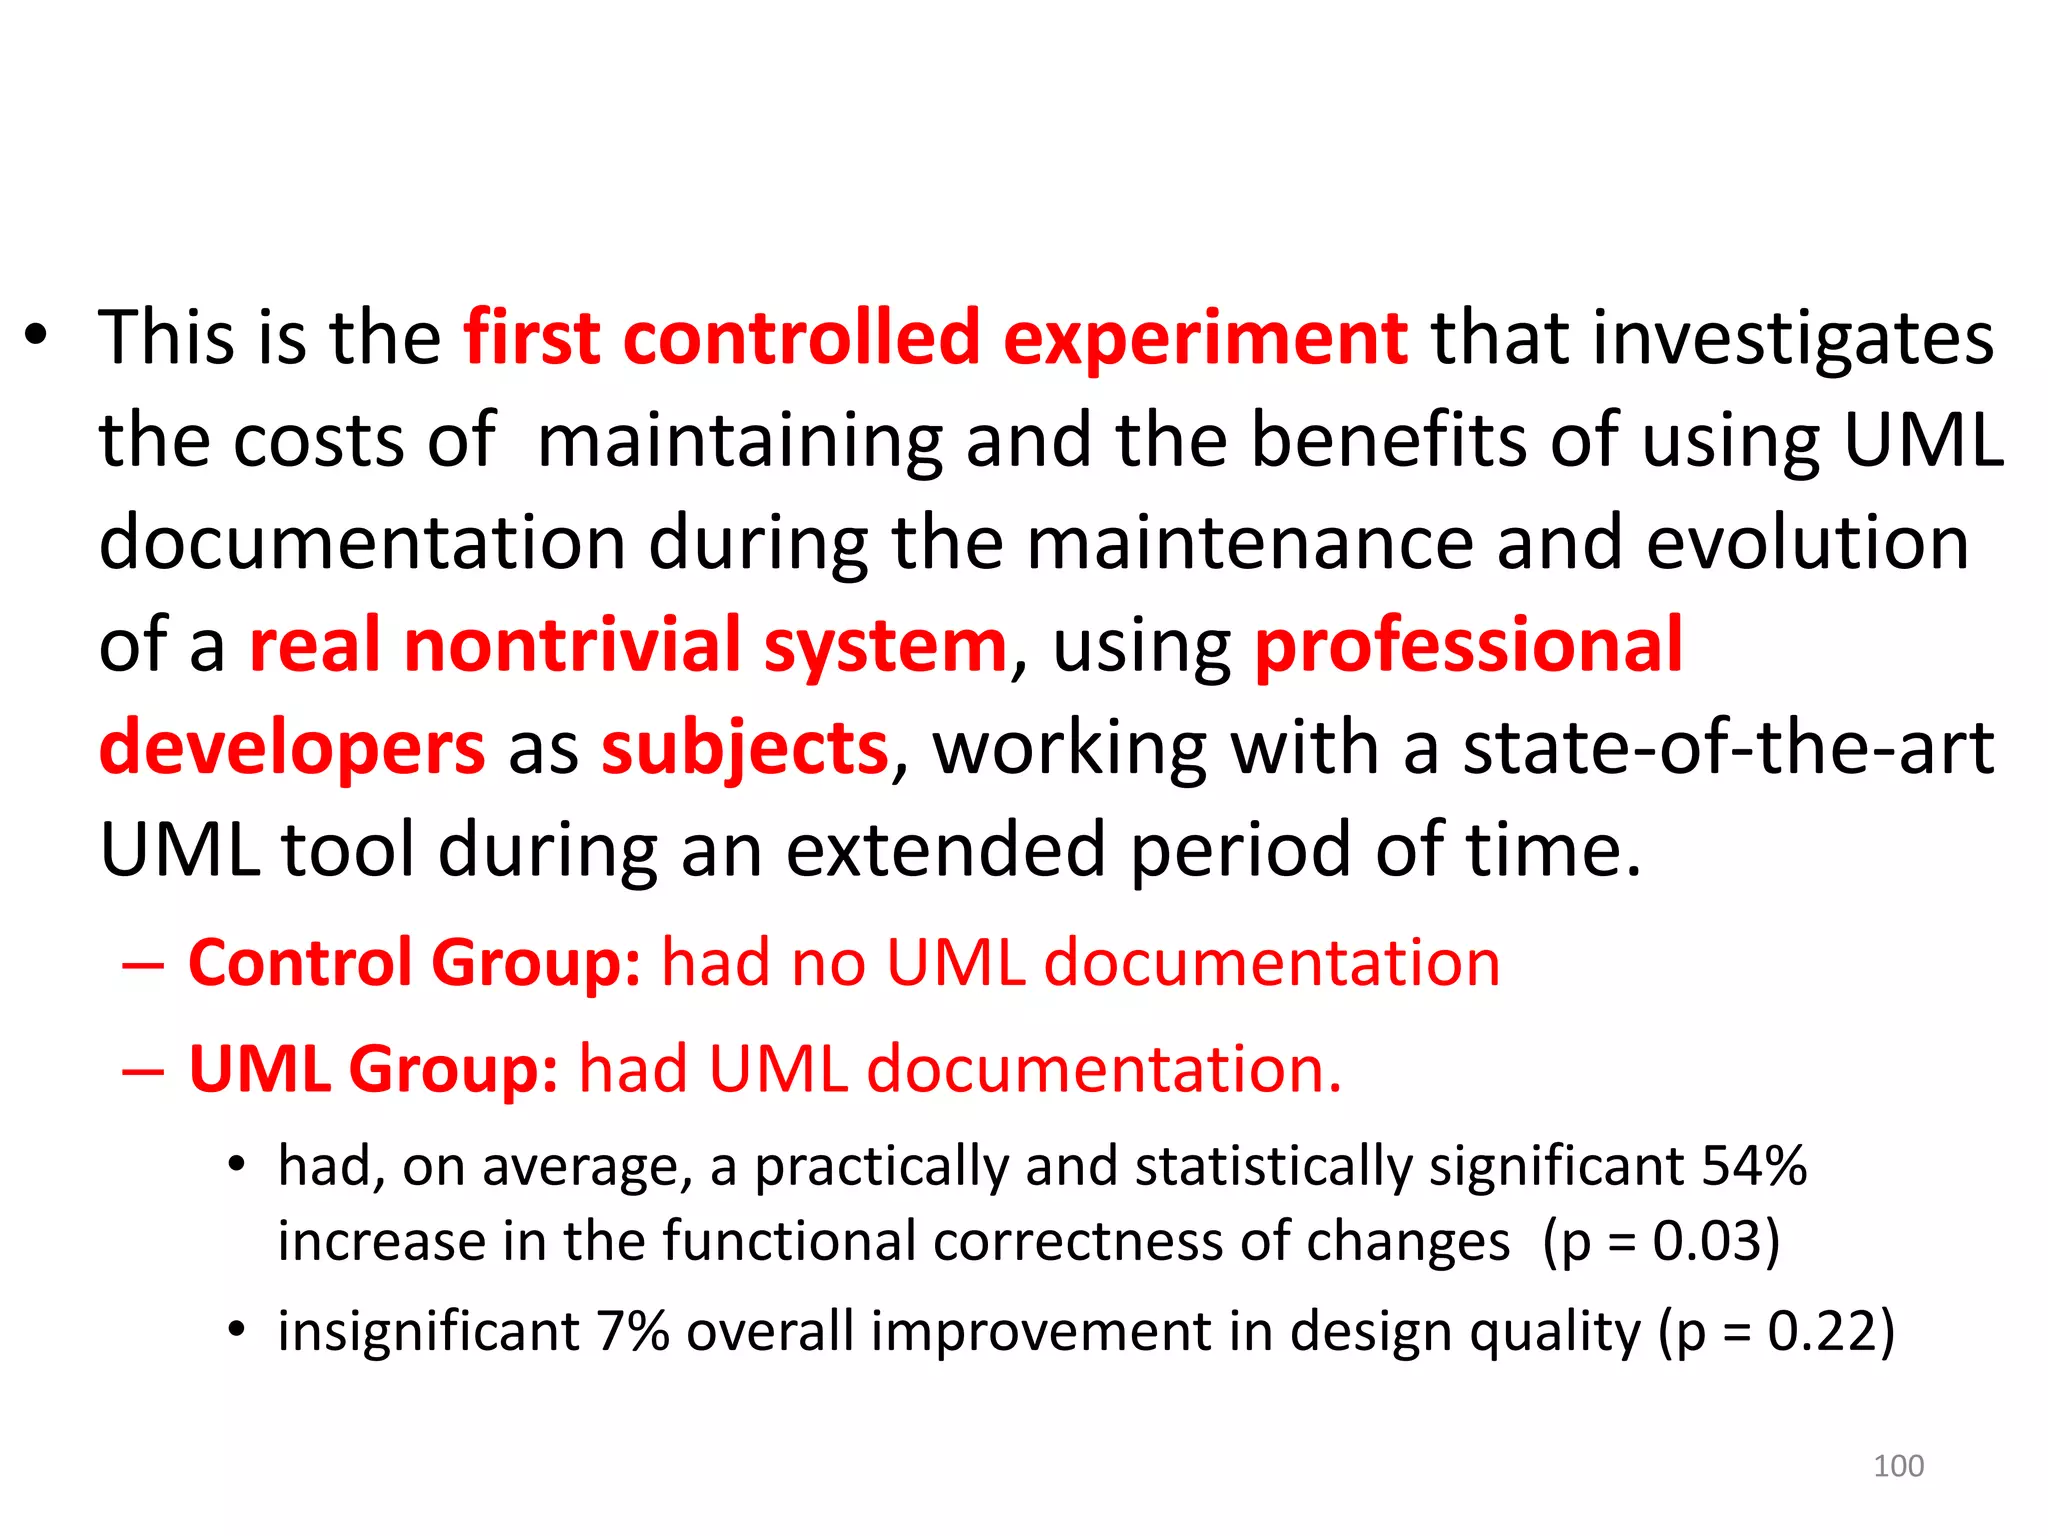
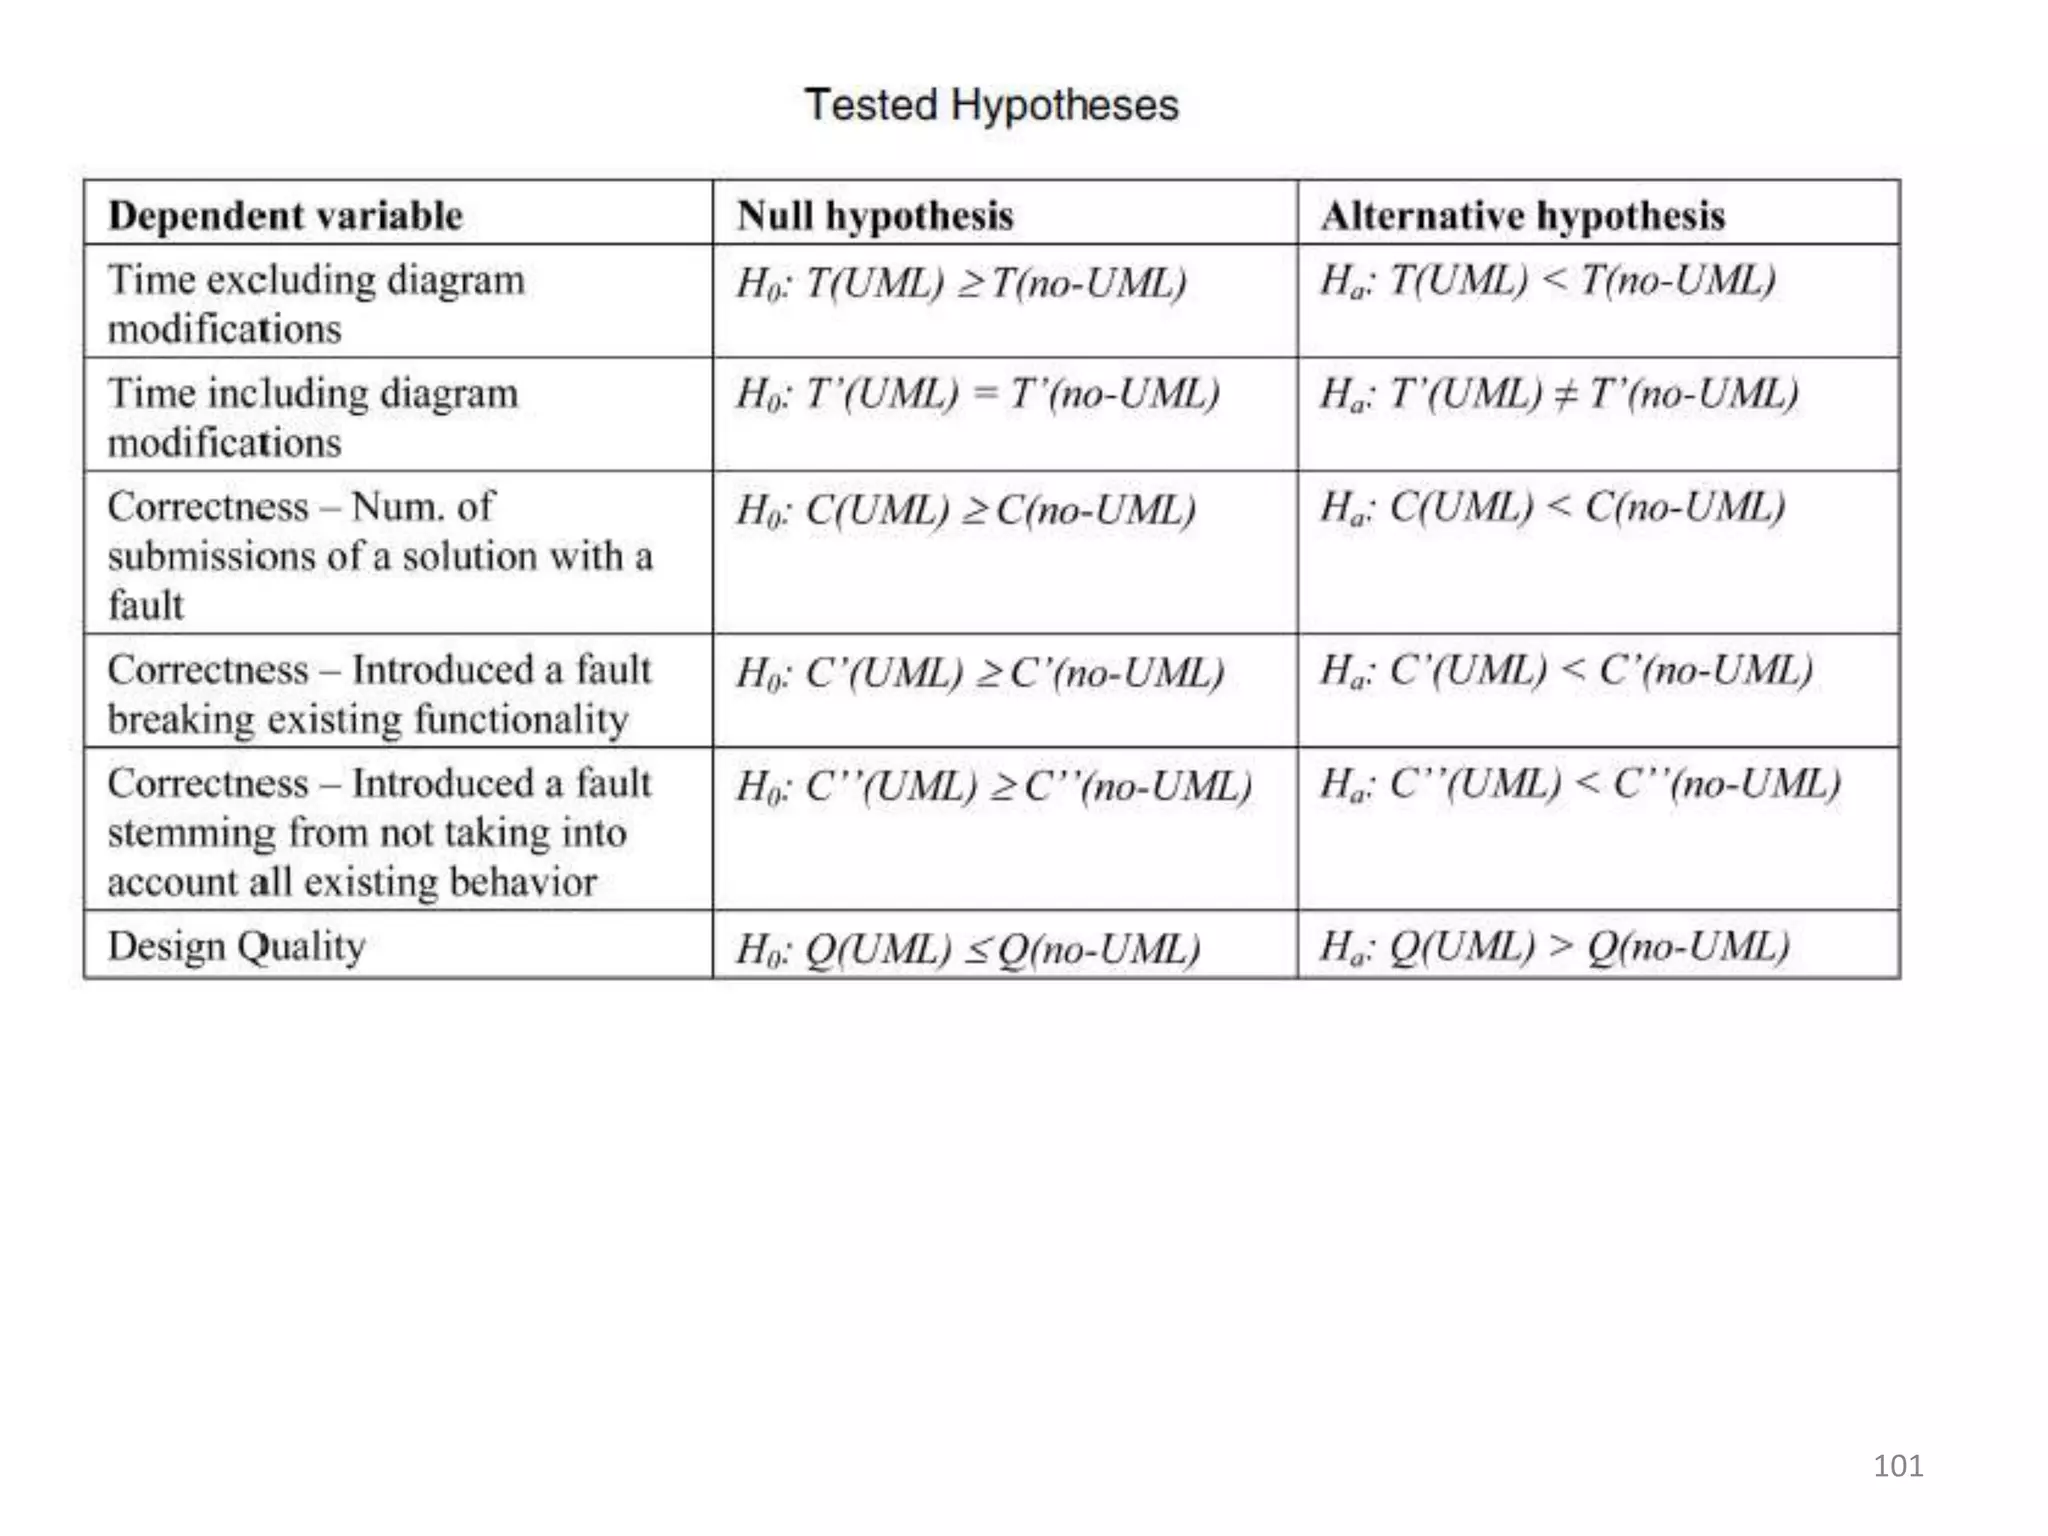
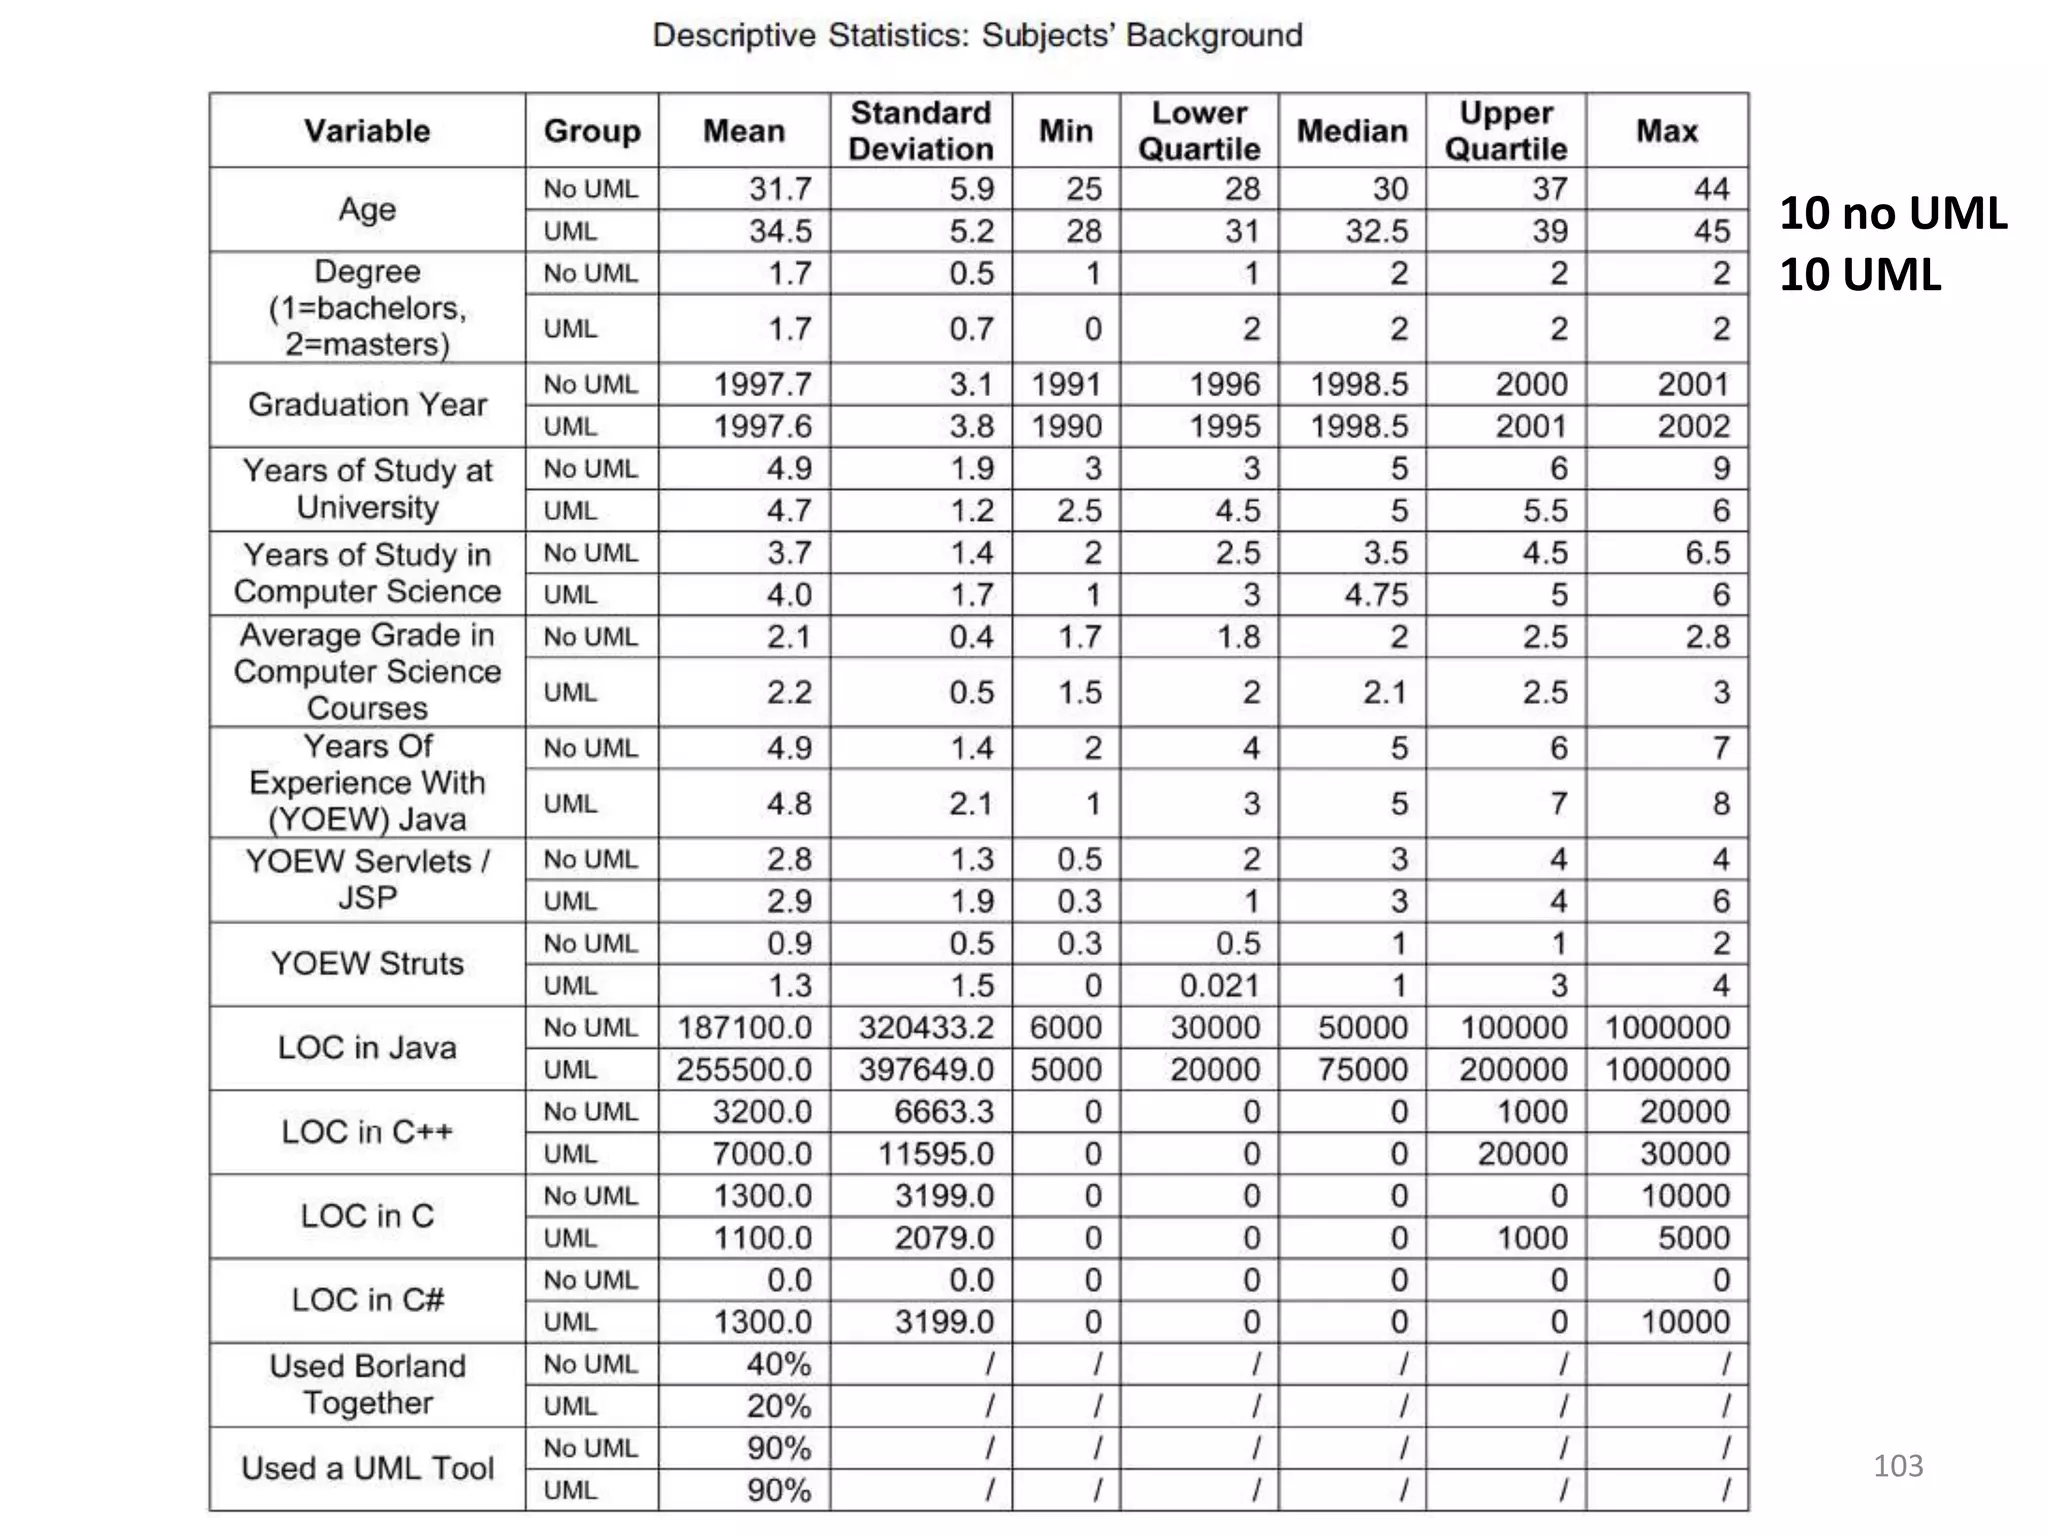
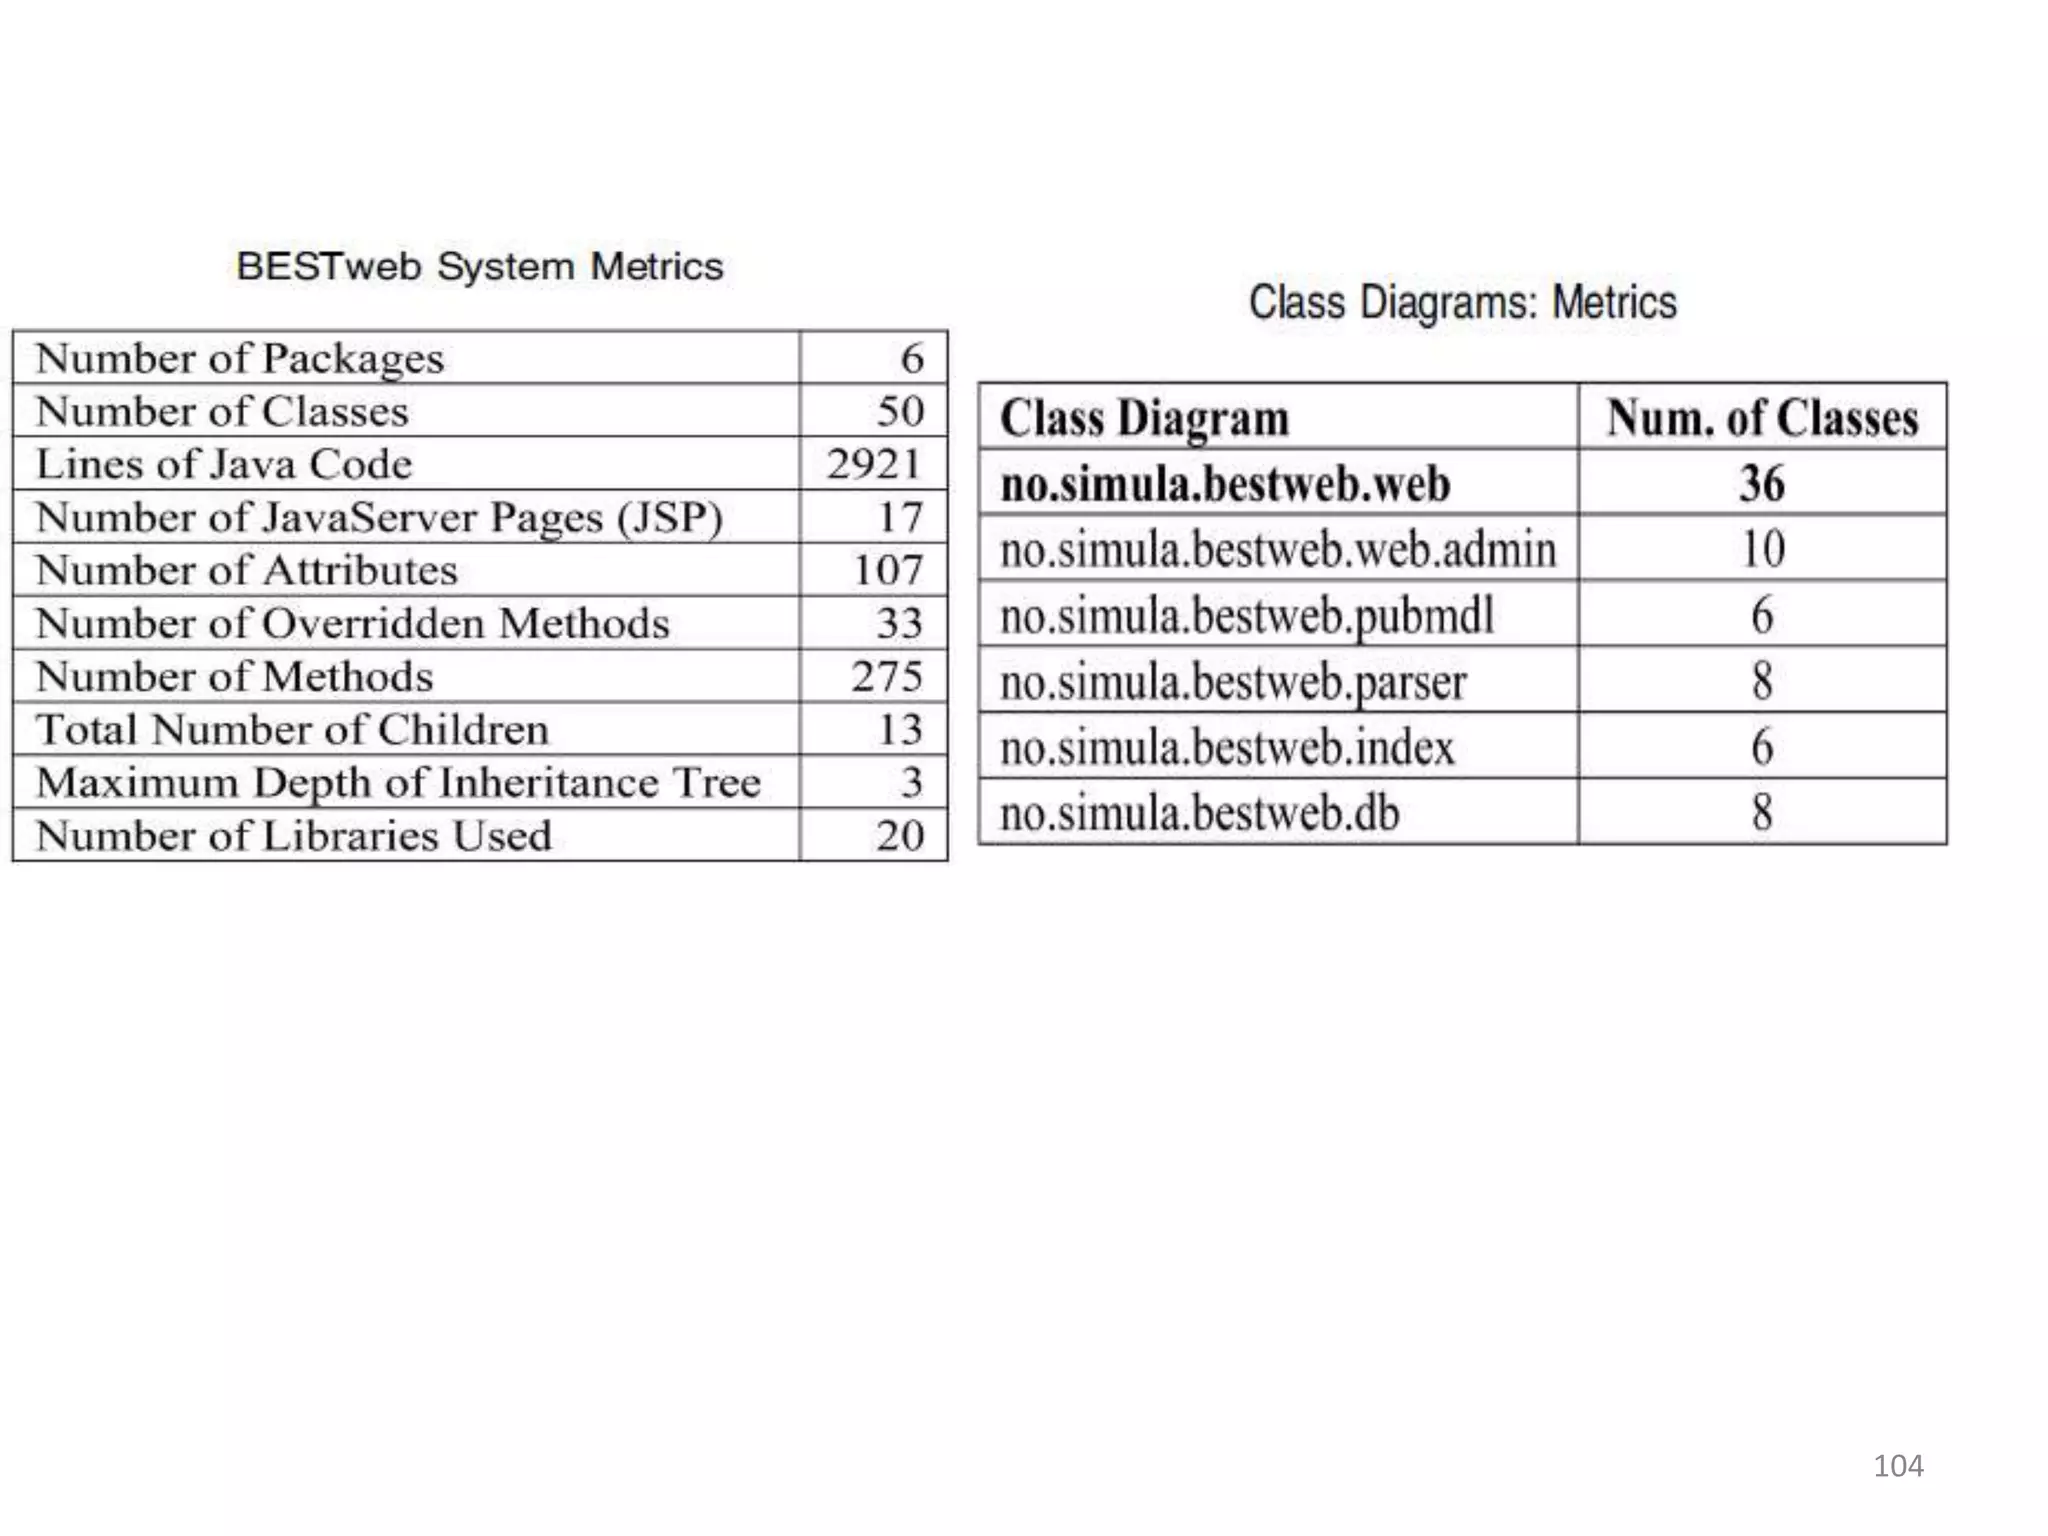
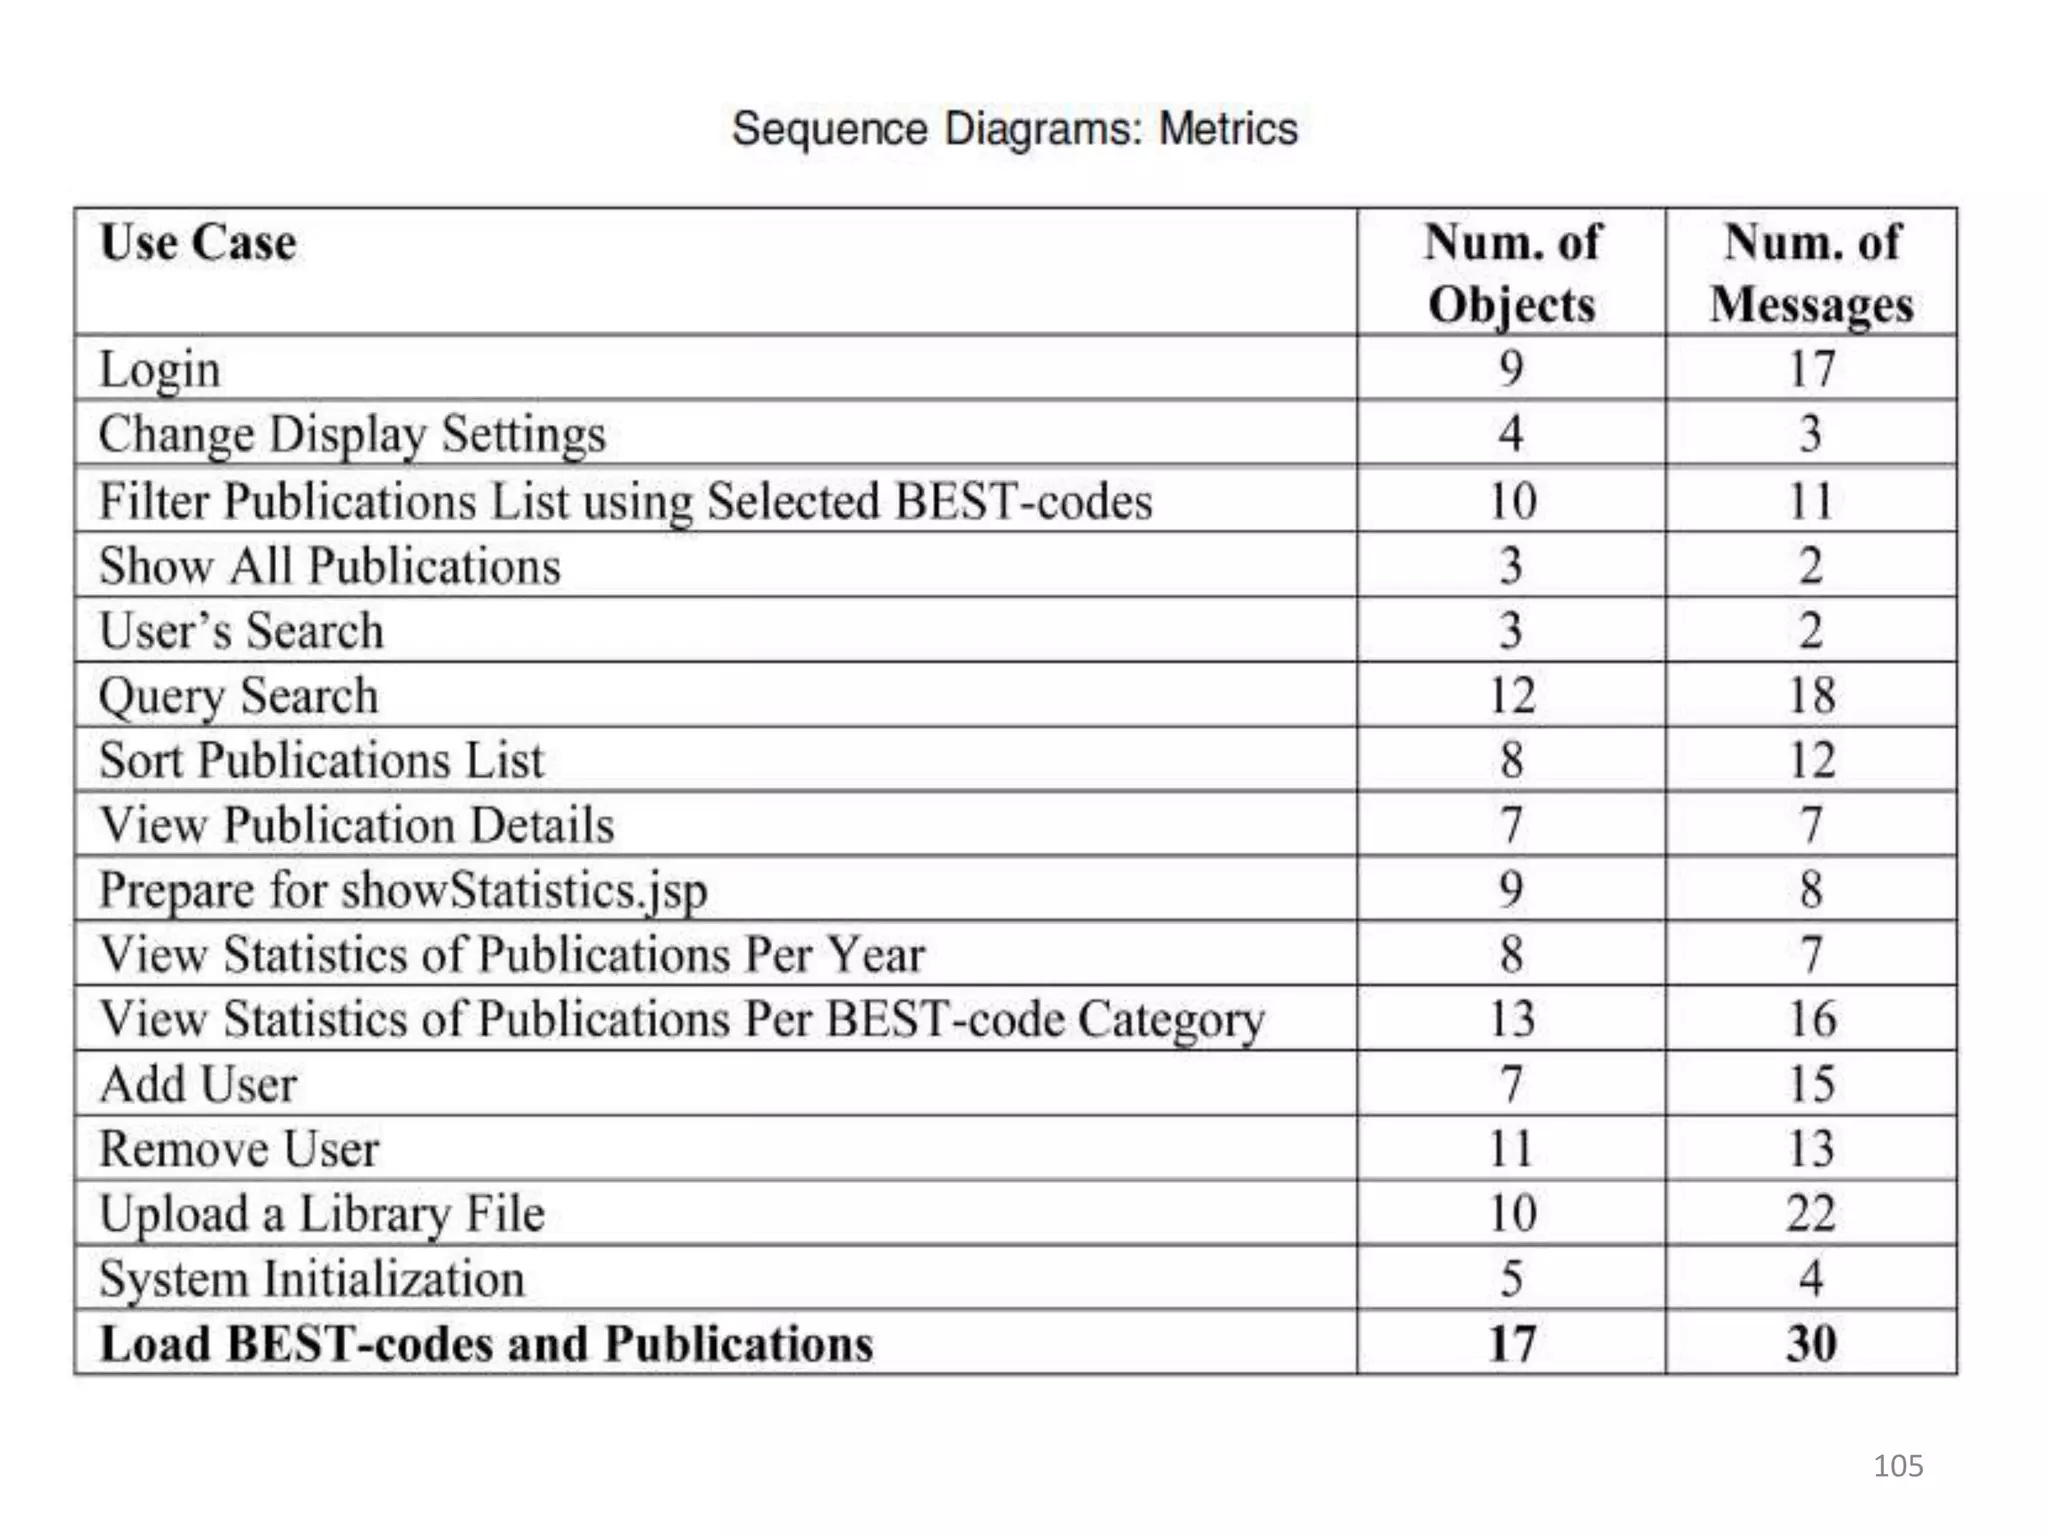
Explores critical evaluations and issues faced in UML documentation, emphasizing project experiences.
Explores critical evaluations and issues faced in UML documentation, emphasizing project experiences.
Discusses object-relational modeling challenges and the effectiveness of UML in aiding software documentation.
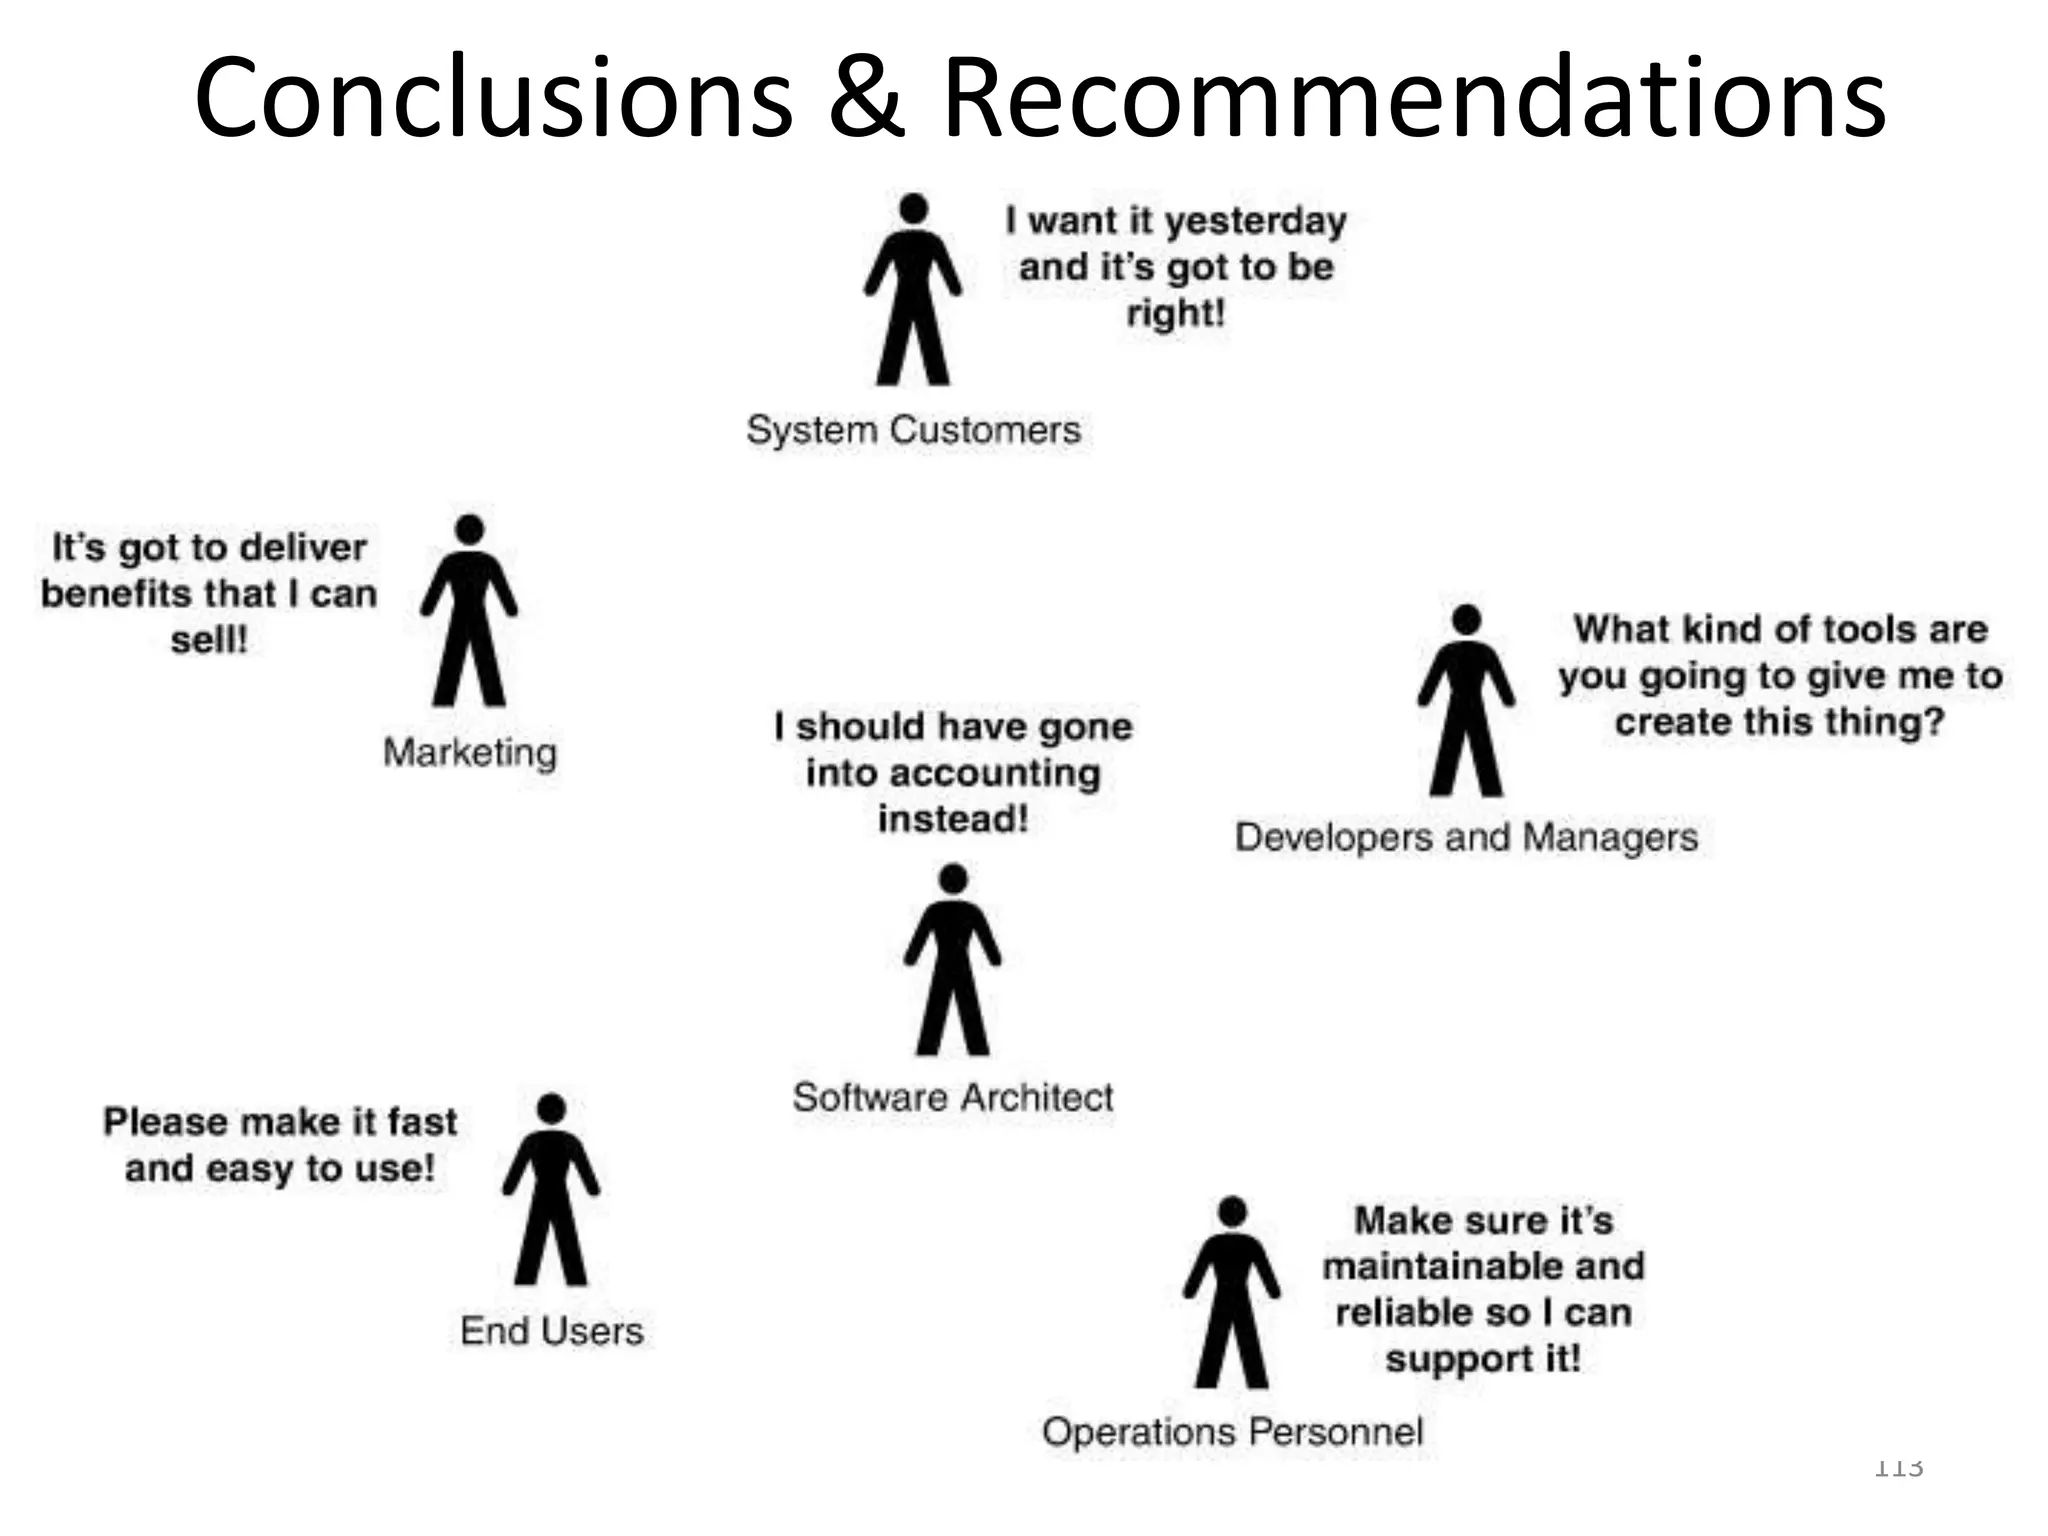
Wraps up the findings and offers recommendations about the use of diagrams and structured approaches in software development.


