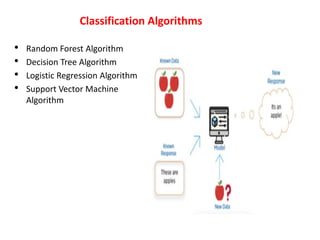
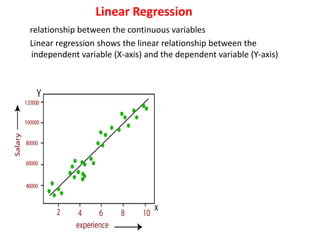
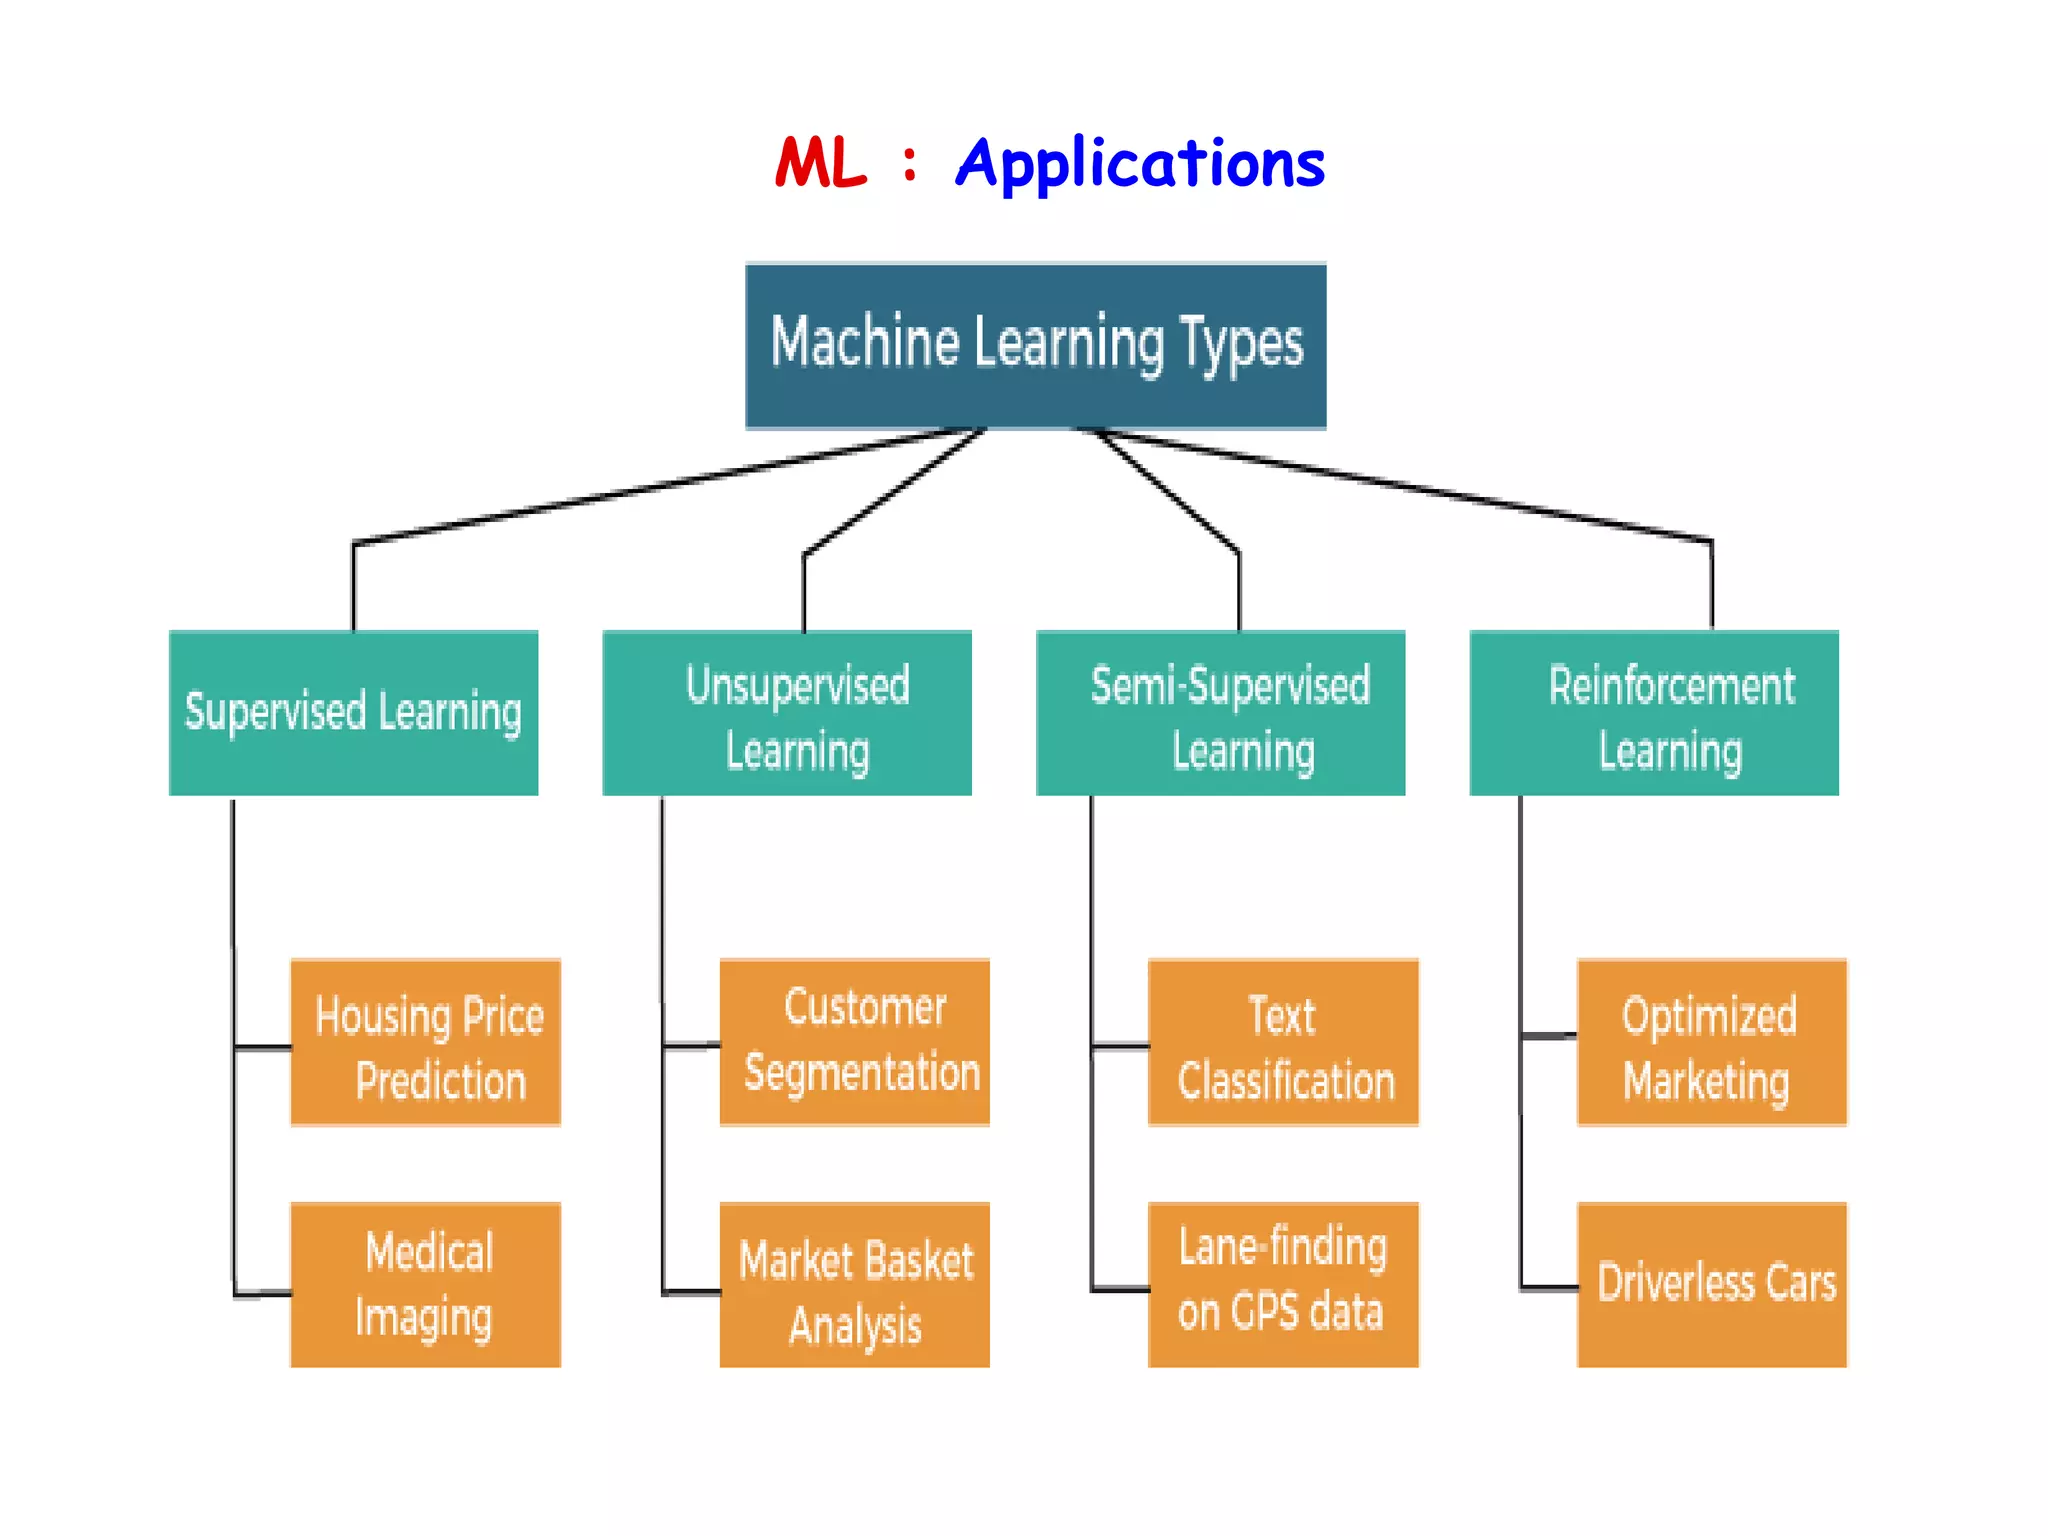
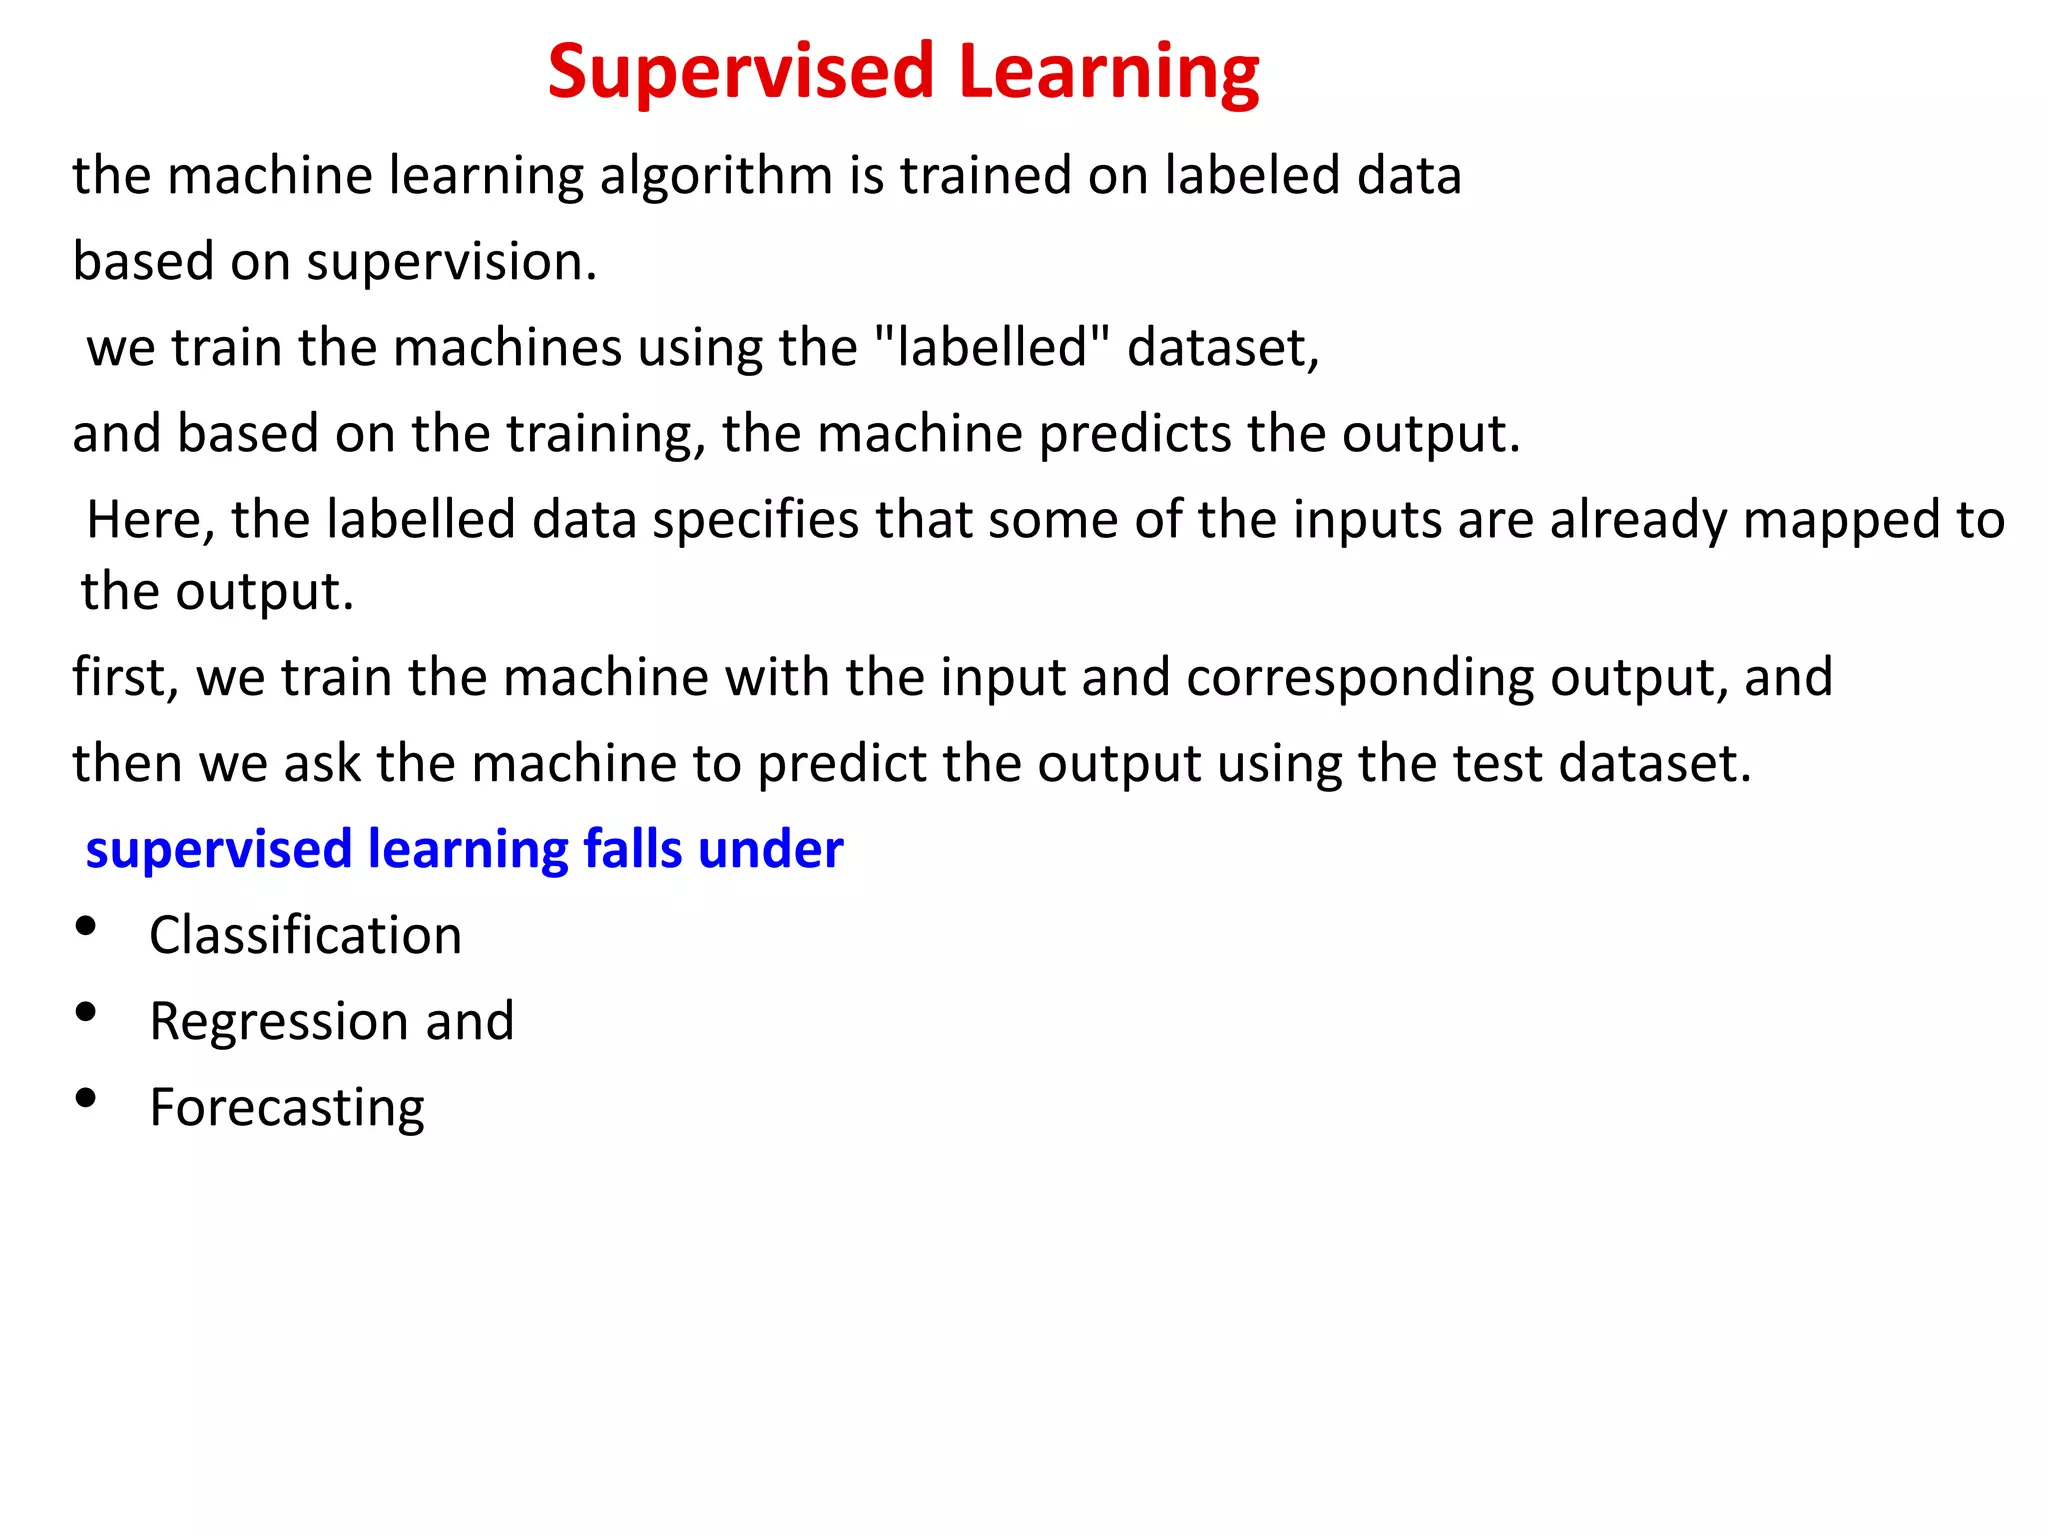
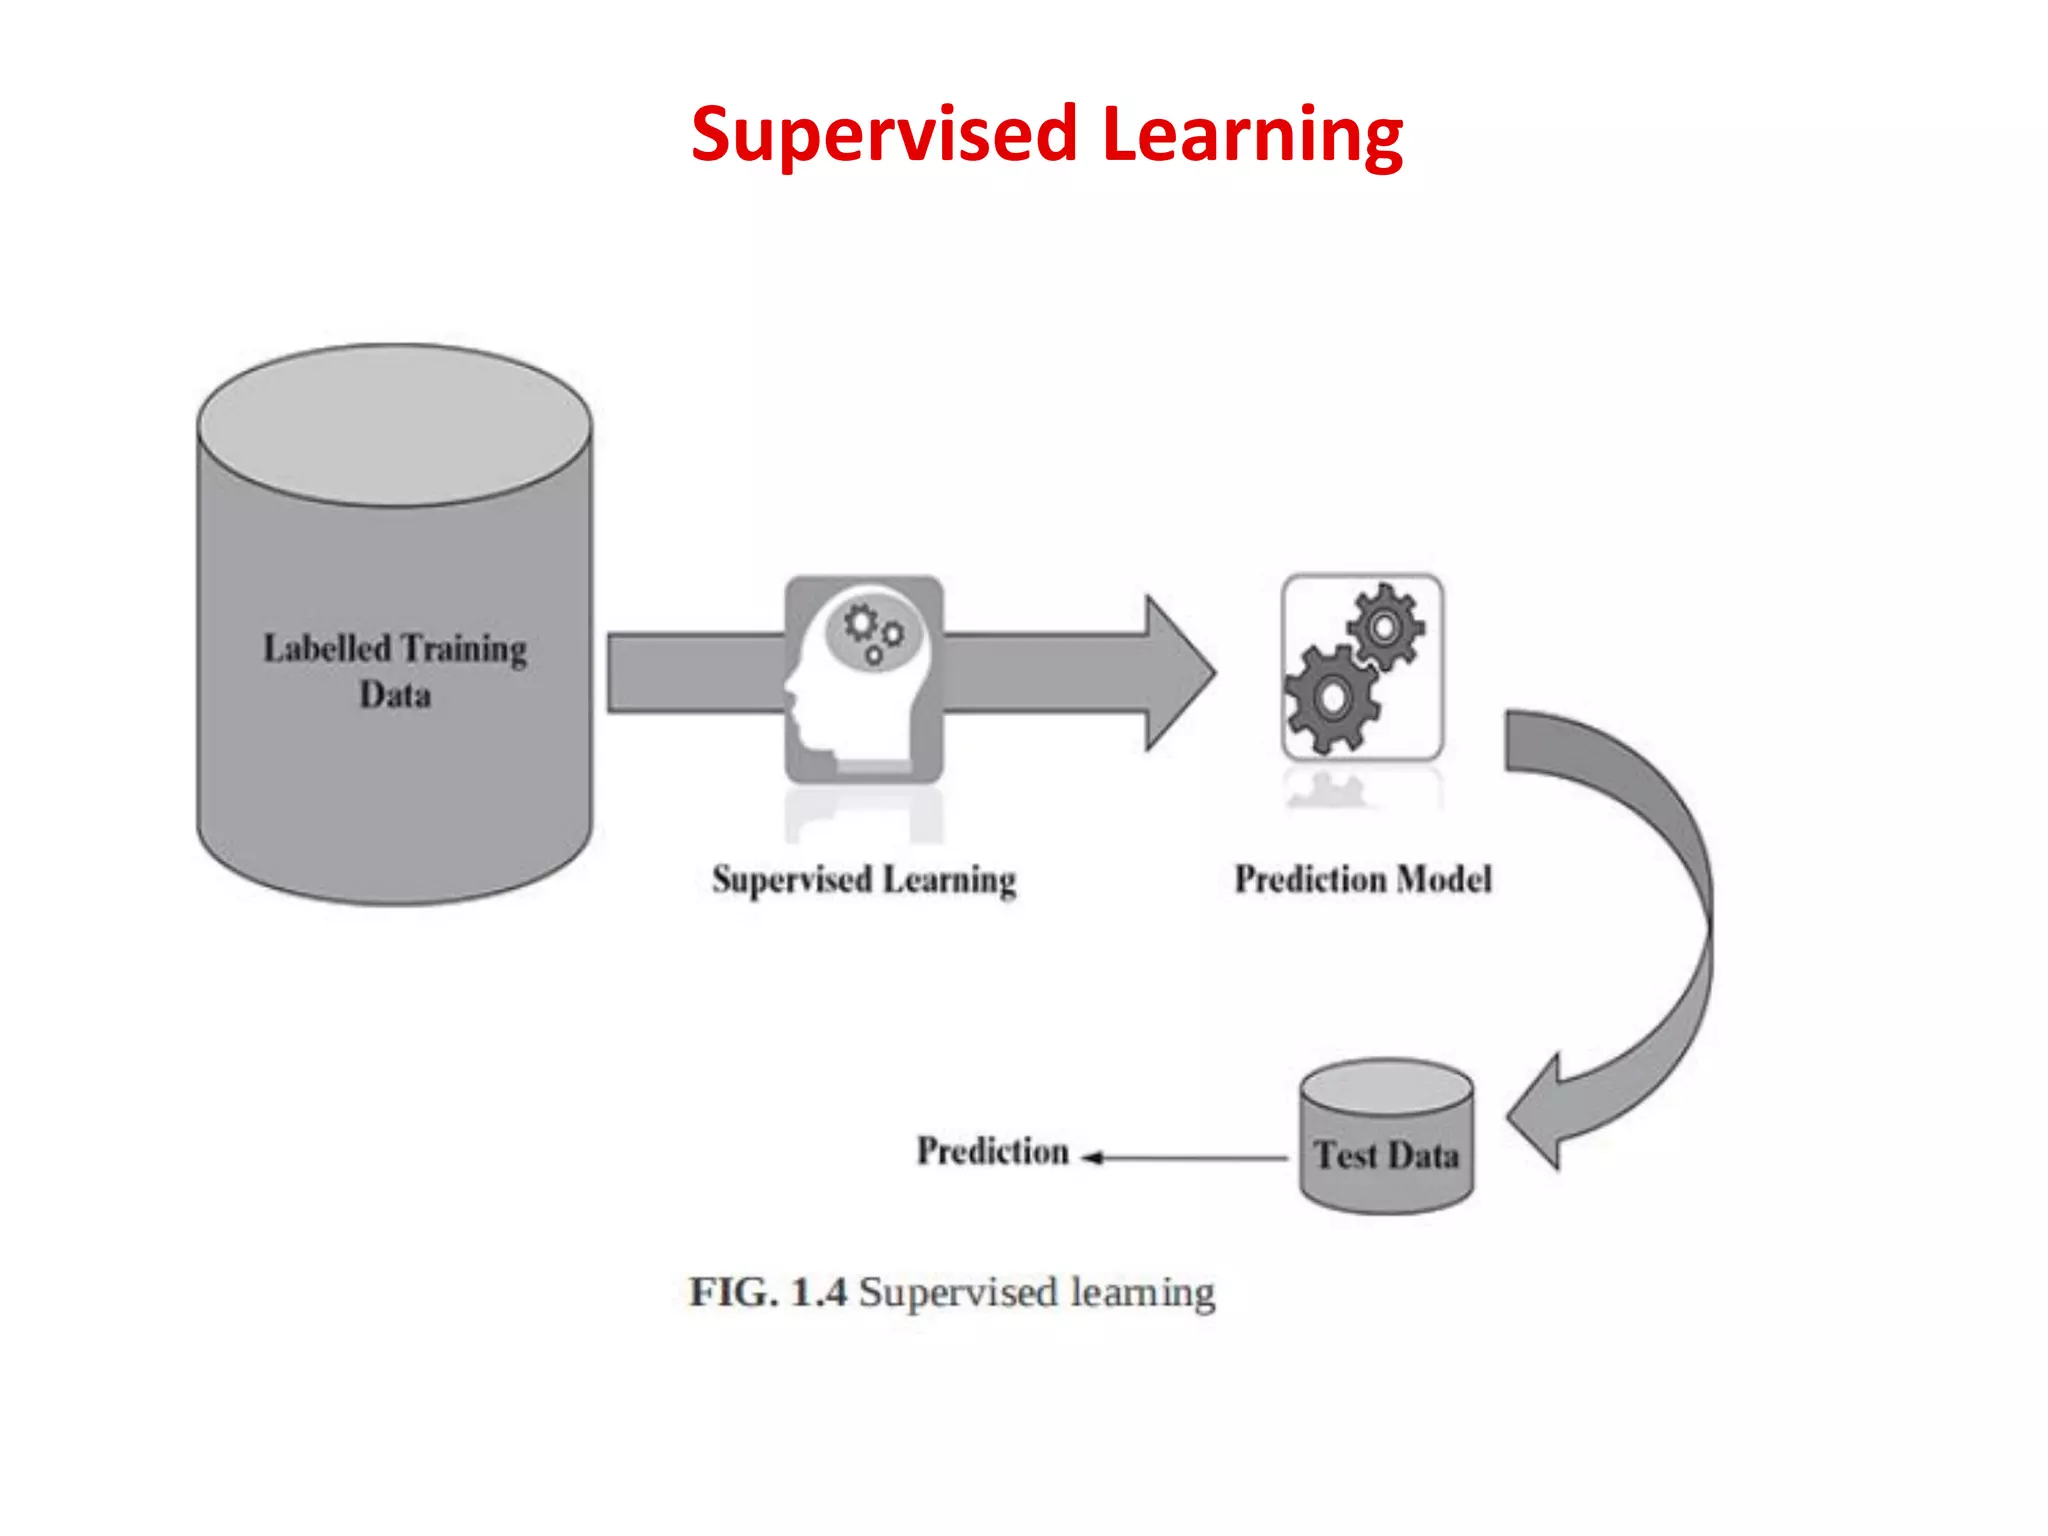
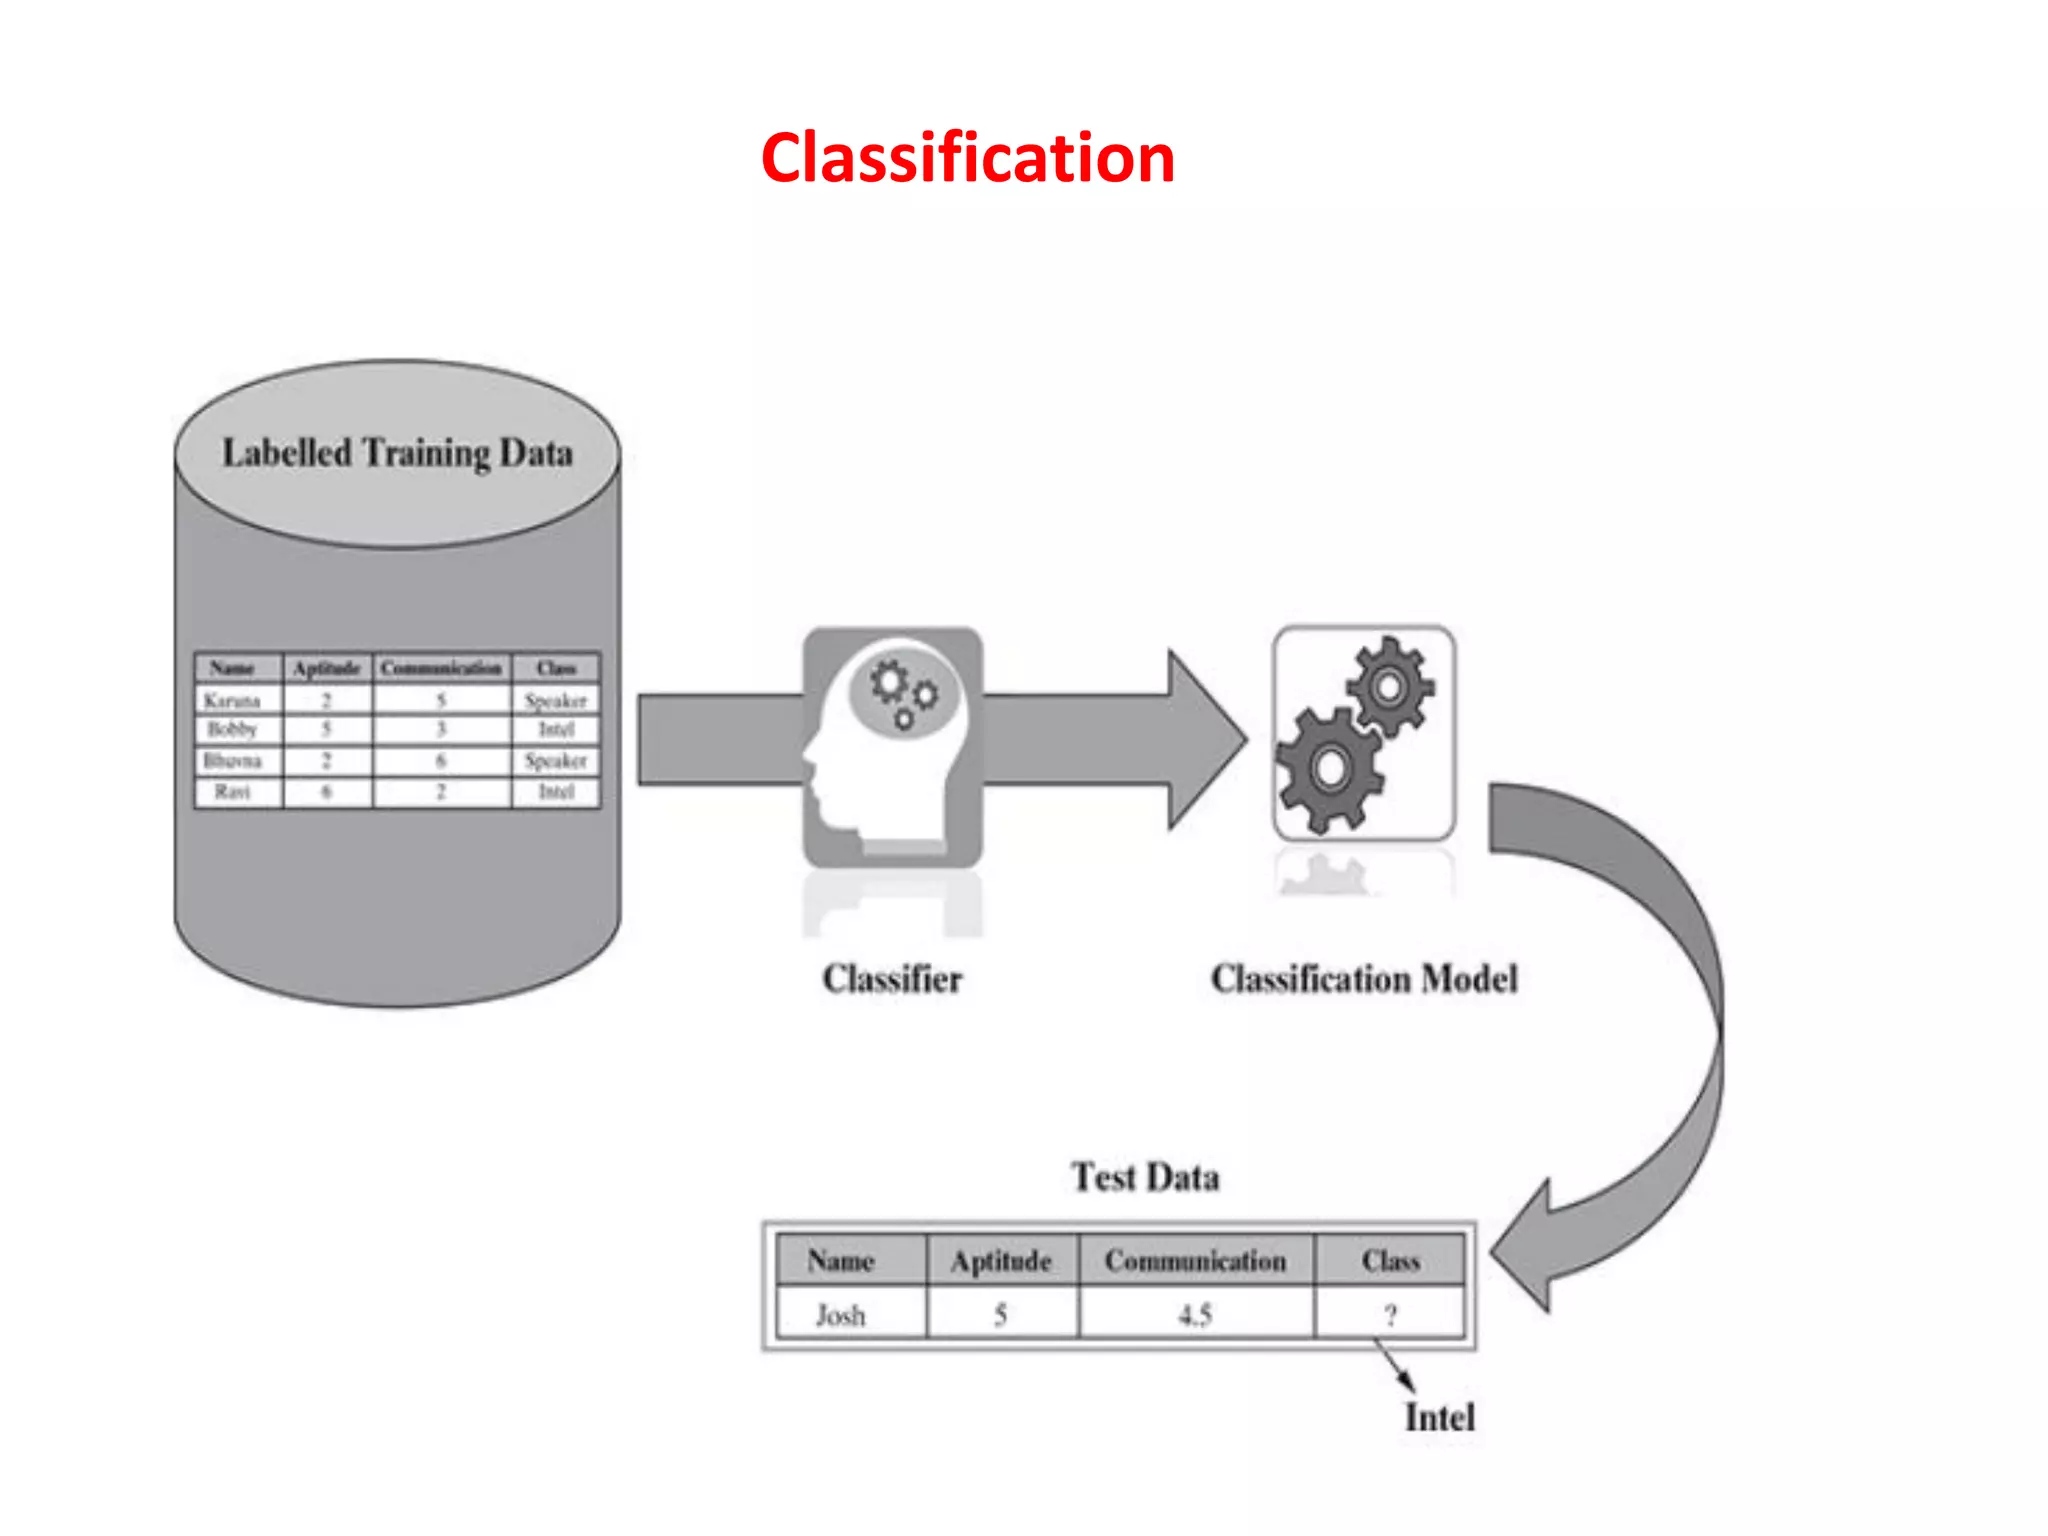
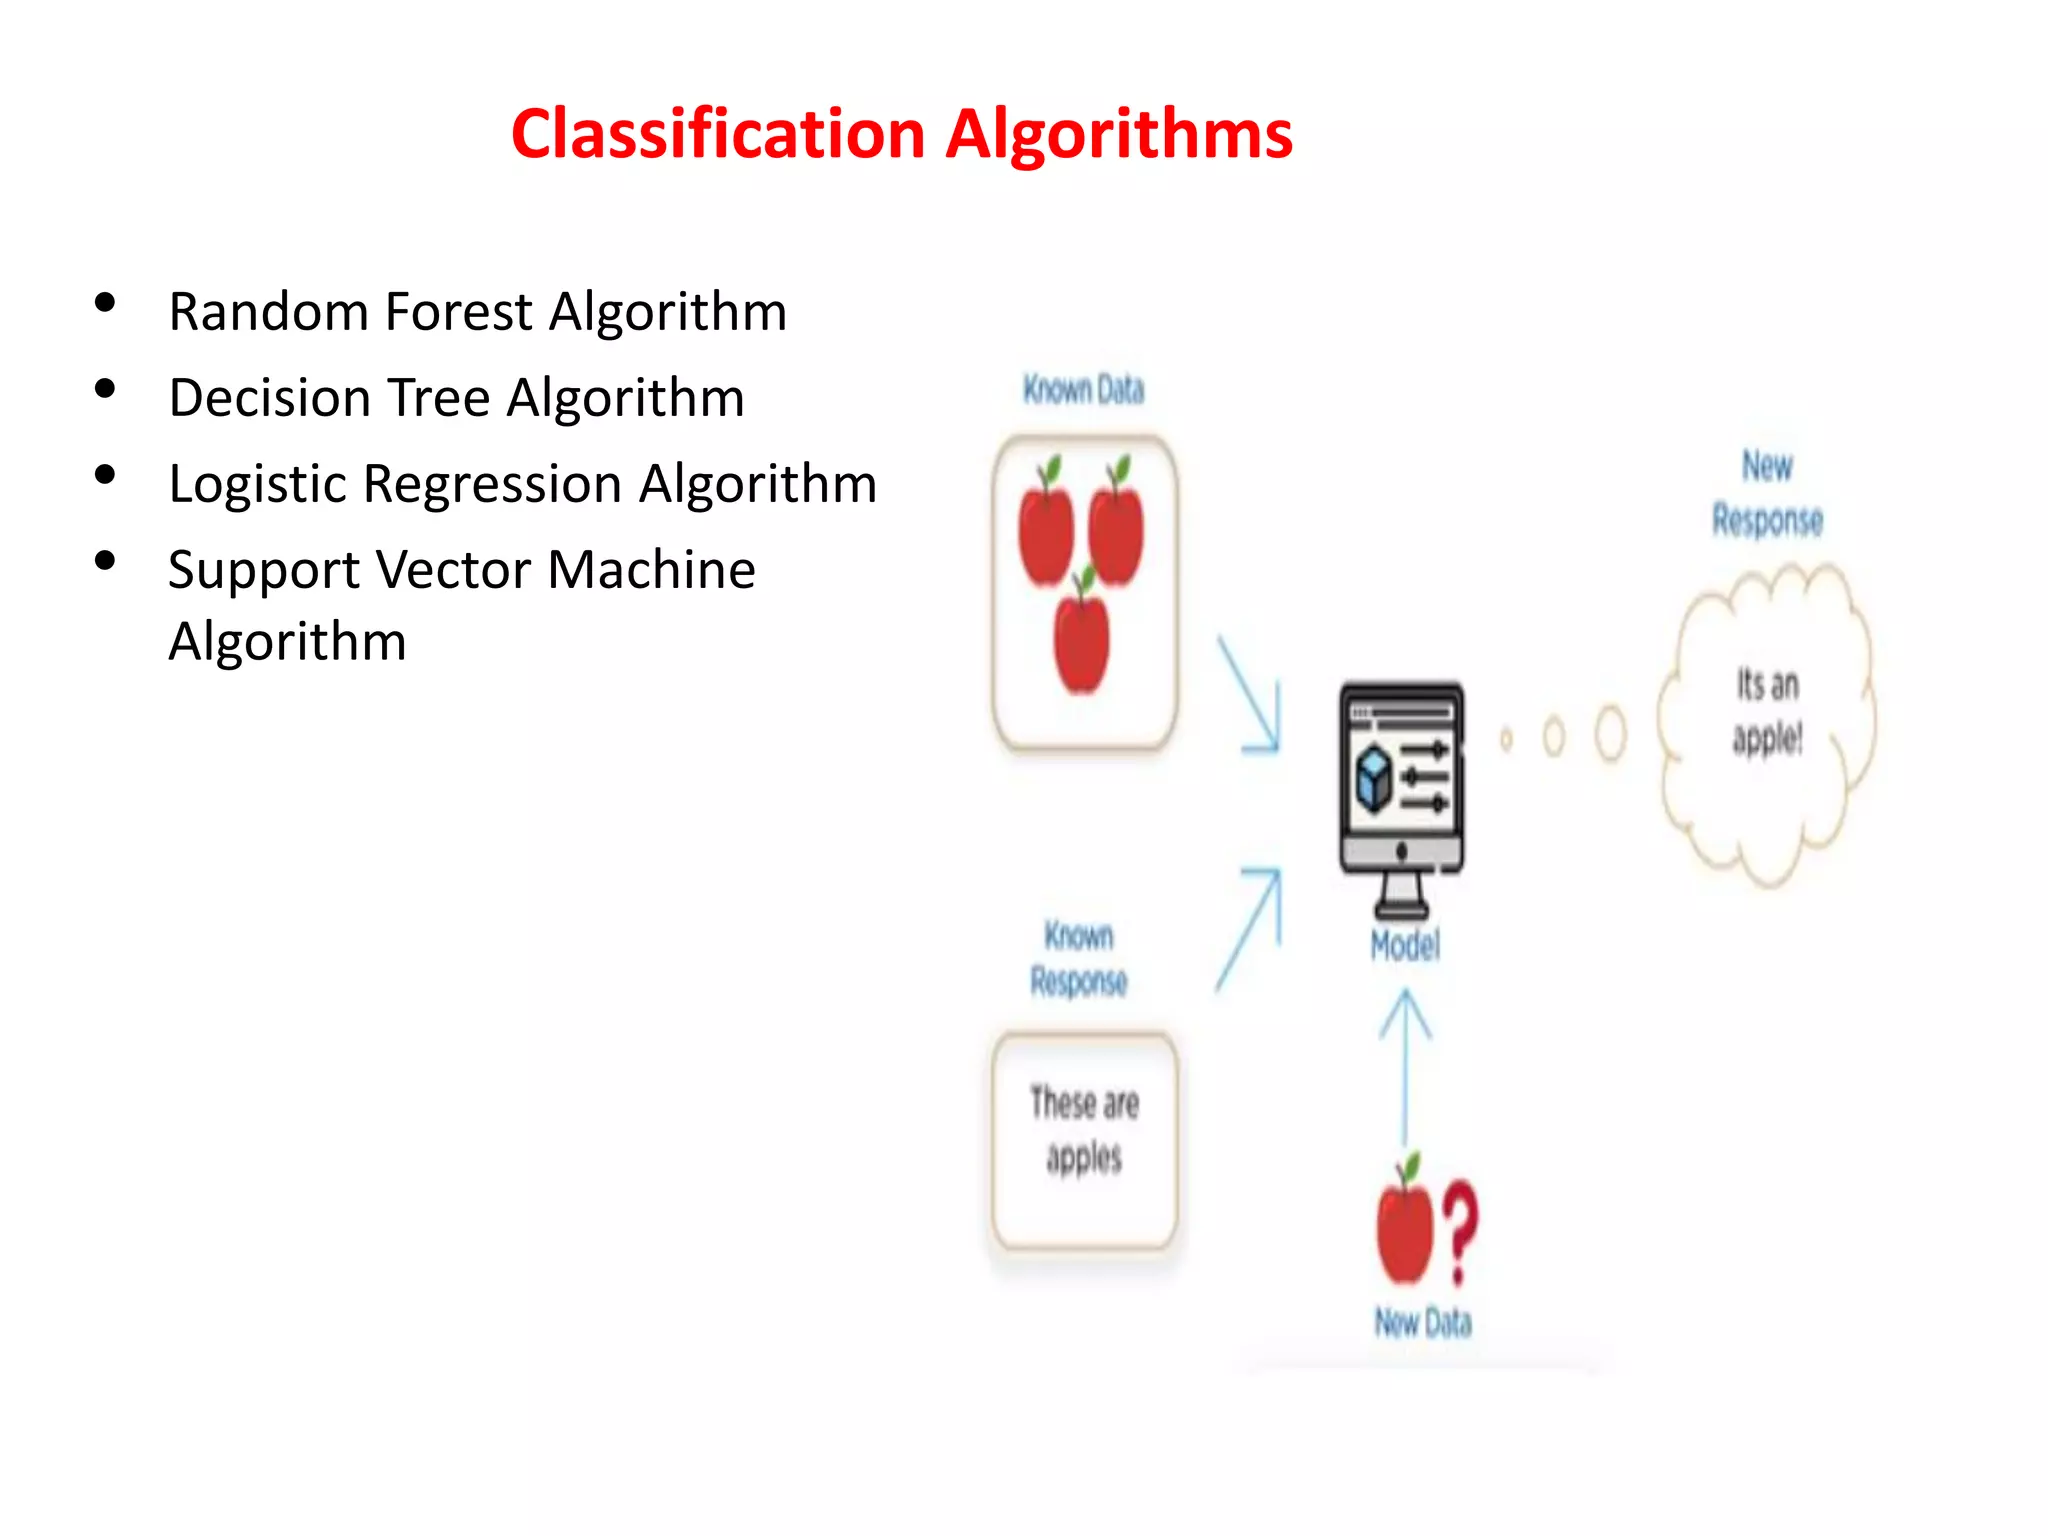
KEMBAR78
Supervised Machine Learning Algorithm | PDF
Machine Learning : Supervised
Learning Algorithm
Dr.M.Pyingkodi
Dept of MCA
Kongu Engineering College
Erode, Tamilnadu,India
ML : Applications
Supervised Learning
the machine learning algorithm is trained on labeled data
based on supervision.
we train the machines using the "labelled" dataset,
and based on the training, the machine predicts the output.
Here, the labelled data specifies that some of the inputs are already mapped to
the output.
first, we train the machine with the input and corresponding output, and
then we ask the machine to predict the output using the test dataset.
supervised learning falls under
• Classification
• Regression and
• Forecasting
Supervised Learning
How Supervised Algorithm Work?
Suppose we have an input dataset of cats and dog images.
first, we will provide the training to the machine to understand the images,
such as the shape & size of the tail of cat and dog, Shape of eyes, colour, height
(dogs are taller, cats are smaller), etc.
After completion of training, we input the picture of a cat and ask the machine
to identify the object and predict the output.
Now, the machine is well trained, so it will check all the features of the object,
such as height, shape, colour, eyes, ears, tail, etc., and
find that it's a cat. So, it will put it in the Cat category.
This is the process of how the machine identifies the objects in Supervised
Learning.
The supervised learning technique is to map the input variable(x) with the
output variable(y).
Examples of supervised learning
• Predicting the results of a game
• Predicting whether a tumour is malignant or benign
• Predicting the price of domains like real estate, stocks, etc.
• Classifying texts such as classifying a set of emails as spam or non-spam
• Risk Assessment
• Fraud Detection
• Spam filtering
Classification
To solve the classification problems in which the output variable is categorical,
such as "Yes" or No, Male or Female, Red or Blue, etc.
The classification algorithms predict the categories present in the dataset
The machine learning program must draw a conclusion from observed values
and determine to what category new observations belong.
To identify the category of a given dataset, and these algorithms are mainly used
to predict the output for the categorical data.
The algorithm which implements the classification on a dataset is known as a
classifier.
Binary Classifier: If the classification problem has only two possible outcomes,
Examples: YES or NO, MALE or FEMALE, SPAM or NOT SPAM, CAT or DOG, etc.
Multi-class Classifier: If a classification problem has more than two outcomes,
Example: Classifications of types of crops, Classification of types of music.
Classification
Examples of Classification
Image classification
Prediction of disease
Win–loss prediction of games
Prediction of natural calamity like earthquake, flood, etc.
Recognition of handwriting
Spam Detection
Email filtering
Classification Algorithms
• Random Forest Algorithm
• Decision Tree Algorithm
• Logistic Regression Algorithm
• Support Vector Machine
Algorithm
Regression
predict a continuous value
A technique for investigating the relationship between independent variables/
features and a dependent variable /outcome.
statistical method to model the relationship between a dependent (target) and
independent (predictor) variables with one or more independent variables.
Establishing a relationship among the variables by estimating how one variable
affects the other.
To understand how the value of the dependent variable is changing
corresponding to an independent variable when other independent variables
are held fixed.
It predicts continuous/real values such as temperature, age, salary, price, etc.
Predicting prices of a house given the features of house like size, price etc is one
of the common examples of Regression.
Examples
• Demand forecasting in retails
• Sales prediction for managers
• Price prediction in real estate
• Weather forecast
• Skill demand forecast in job market
• Prediction of rain using temperature and other factors
• Determining Market trends
• Prediction of road accidents due to rash driving
• Predicting whether stock price of a company will increase tomorrow
Why Regression analysis?
• Regression estimates the relationship between the target and the
independent variable.
• It is used to find the trends in data.
• It helps to predict real/continuous values.
• Confidently determine the most important factor, the least important factor,
and how each factor is affecting the other factors.
Linear Regression
relationship between the continuous variables
Linear regression shows the linear relationship between the
independent variable (X-axis) and the dependent variable (Y-axis)
Linear Regression: Equation
Y= aX+b or
Y = dependent variables (target variables),
X= Independent variables (predictor variables),
a and b are the linear coefficients
coefficients: the values that multiply the predictor values
y = 3X + 5. In this equation, +3 is the coefficient, X is the predictor, and +5 is the
constant.
The sign of each coefficient indicates the direction of the relationship between a
predictor variable and the response variable.
A positive sign indicates that as the predictor variable increases, the response
variable also increases.
A negative sign indicates that as the predictor variable increases, the response
variable decreases.

Supervised Machine Learning Algorithm

  • 1.
    Machine Learning :Supervised Learning Algorithm Dr.M.Pyingkodi Dept of MCA Kongu Engineering College Erode, Tamilnadu,India
  • 2.
  • 3.
    Supervised Learning the machinelearning algorithm is trained on labeled data based on supervision. we train the machines using the "labelled" dataset, and based on the training, the machine predicts the output. Here, the labelled data specifies that some of the inputs are already mapped to the output. first, we train the machine with the input and corresponding output, and then we ask the machine to predict the output using the test dataset. supervised learning falls under • Classification • Regression and • Forecasting
  • 4.
  • 5.
    How Supervised AlgorithmWork? Suppose we have an input dataset of cats and dog images. first, we will provide the training to the machine to understand the images, such as the shape & size of the tail of cat and dog, Shape of eyes, colour, height (dogs are taller, cats are smaller), etc. After completion of training, we input the picture of a cat and ask the machine to identify the object and predict the output. Now, the machine is well trained, so it will check all the features of the object, such as height, shape, colour, eyes, ears, tail, etc., and find that it's a cat. So, it will put it in the Cat category. This is the process of how the machine identifies the objects in Supervised Learning. The supervised learning technique is to map the input variable(x) with the output variable(y).
  • 6.
    Examples of supervisedlearning • Predicting the results of a game • Predicting whether a tumour is malignant or benign • Predicting the price of domains like real estate, stocks, etc. • Classifying texts such as classifying a set of emails as spam or non-spam • Risk Assessment • Fraud Detection • Spam filtering
  • 7.
    Classification To solve theclassification problems in which the output variable is categorical, such as "Yes" or No, Male or Female, Red or Blue, etc. The classification algorithms predict the categories present in the dataset The machine learning program must draw a conclusion from observed values and determine to what category new observations belong. To identify the category of a given dataset, and these algorithms are mainly used to predict the output for the categorical data. The algorithm which implements the classification on a dataset is known as a classifier. Binary Classifier: If the classification problem has only two possible outcomes, Examples: YES or NO, MALE or FEMALE, SPAM or NOT SPAM, CAT or DOG, etc. Multi-class Classifier: If a classification problem has more than two outcomes, Example: Classifications of types of crops, Classification of types of music.
  • 8.
  • 9.
    Examples of Classification Imageclassification Prediction of disease Win–loss prediction of games Prediction of natural calamity like earthquake, flood, etc. Recognition of handwriting Spam Detection Email filtering
  • 10.
    Classification Algorithms • RandomForest Algorithm • Decision Tree Algorithm • Logistic Regression Algorithm • Support Vector Machine Algorithm
  • 11.
    Regression predict a continuousvalue A technique for investigating the relationship between independent variables/ features and a dependent variable /outcome. statistical method to model the relationship between a dependent (target) and independent (predictor) variables with one or more independent variables. Establishing a relationship among the variables by estimating how one variable affects the other. To understand how the value of the dependent variable is changing corresponding to an independent variable when other independent variables are held fixed. It predicts continuous/real values such as temperature, age, salary, price, etc. Predicting prices of a house given the features of house like size, price etc is one of the common examples of Regression.
  • 12.
    Examples • Demand forecastingin retails • Sales prediction for managers • Price prediction in real estate • Weather forecast • Skill demand forecast in job market • Prediction of rain using temperature and other factors • Determining Market trends • Prediction of road accidents due to rash driving • Predicting whether stock price of a company will increase tomorrow
  • 13.
    Why Regression analysis? •Regression estimates the relationship between the target and the independent variable. • It is used to find the trends in data. • It helps to predict real/continuous values. • Confidently determine the most important factor, the least important factor, and how each factor is affecting the other factors.
  • 14.
    Linear Regression relationship betweenthe continuous variables Linear regression shows the linear relationship between the independent variable (X-axis) and the dependent variable (Y-axis)
  • 15.
    Linear Regression: Equation Y=aX+b or Y = dependent variables (target variables), X= Independent variables (predictor variables), a and b are the linear coefficients coefficients: the values that multiply the predictor values y = 3X + 5. In this equation, +3 is the coefficient, X is the predictor, and +5 is the constant. The sign of each coefficient indicates the direction of the relationship between a predictor variable and the response variable. A positive sign indicates that as the predictor variable increases, the response variable also increases. A negative sign indicates that as the predictor variable increases, the response variable decreases.