Download to read offline


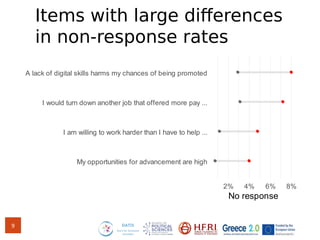


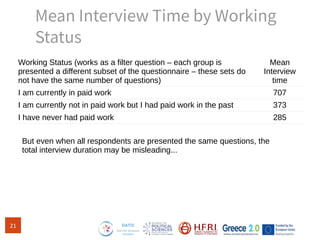

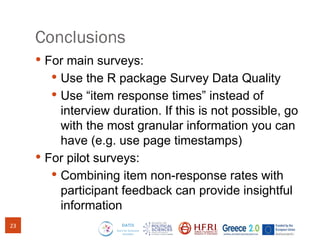


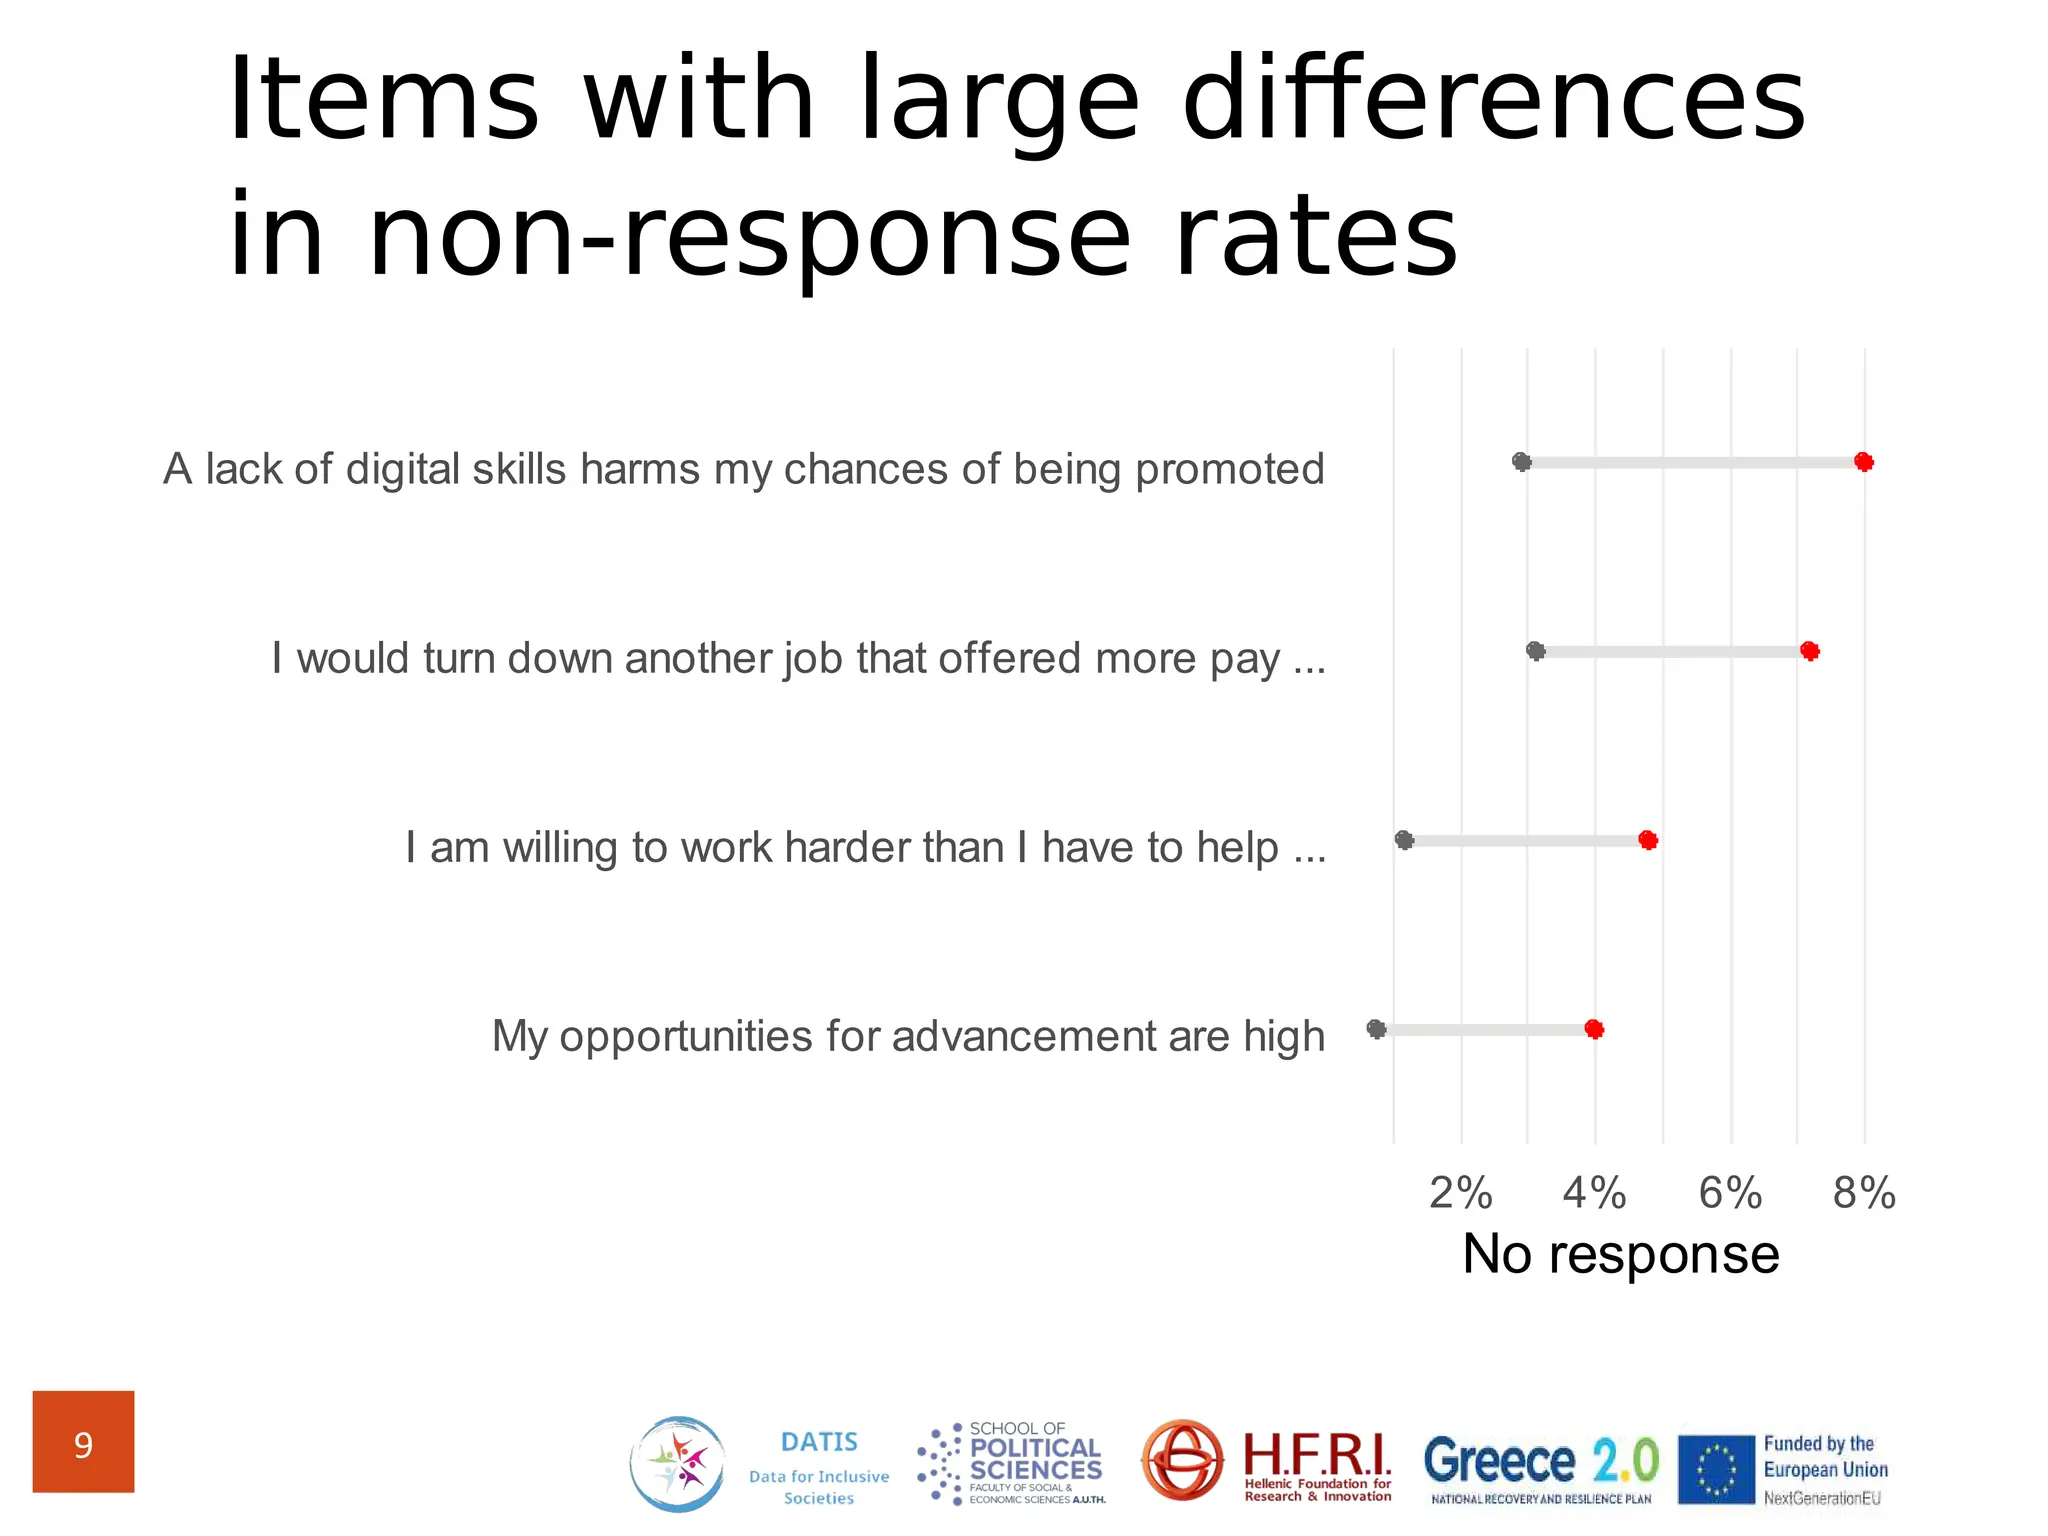
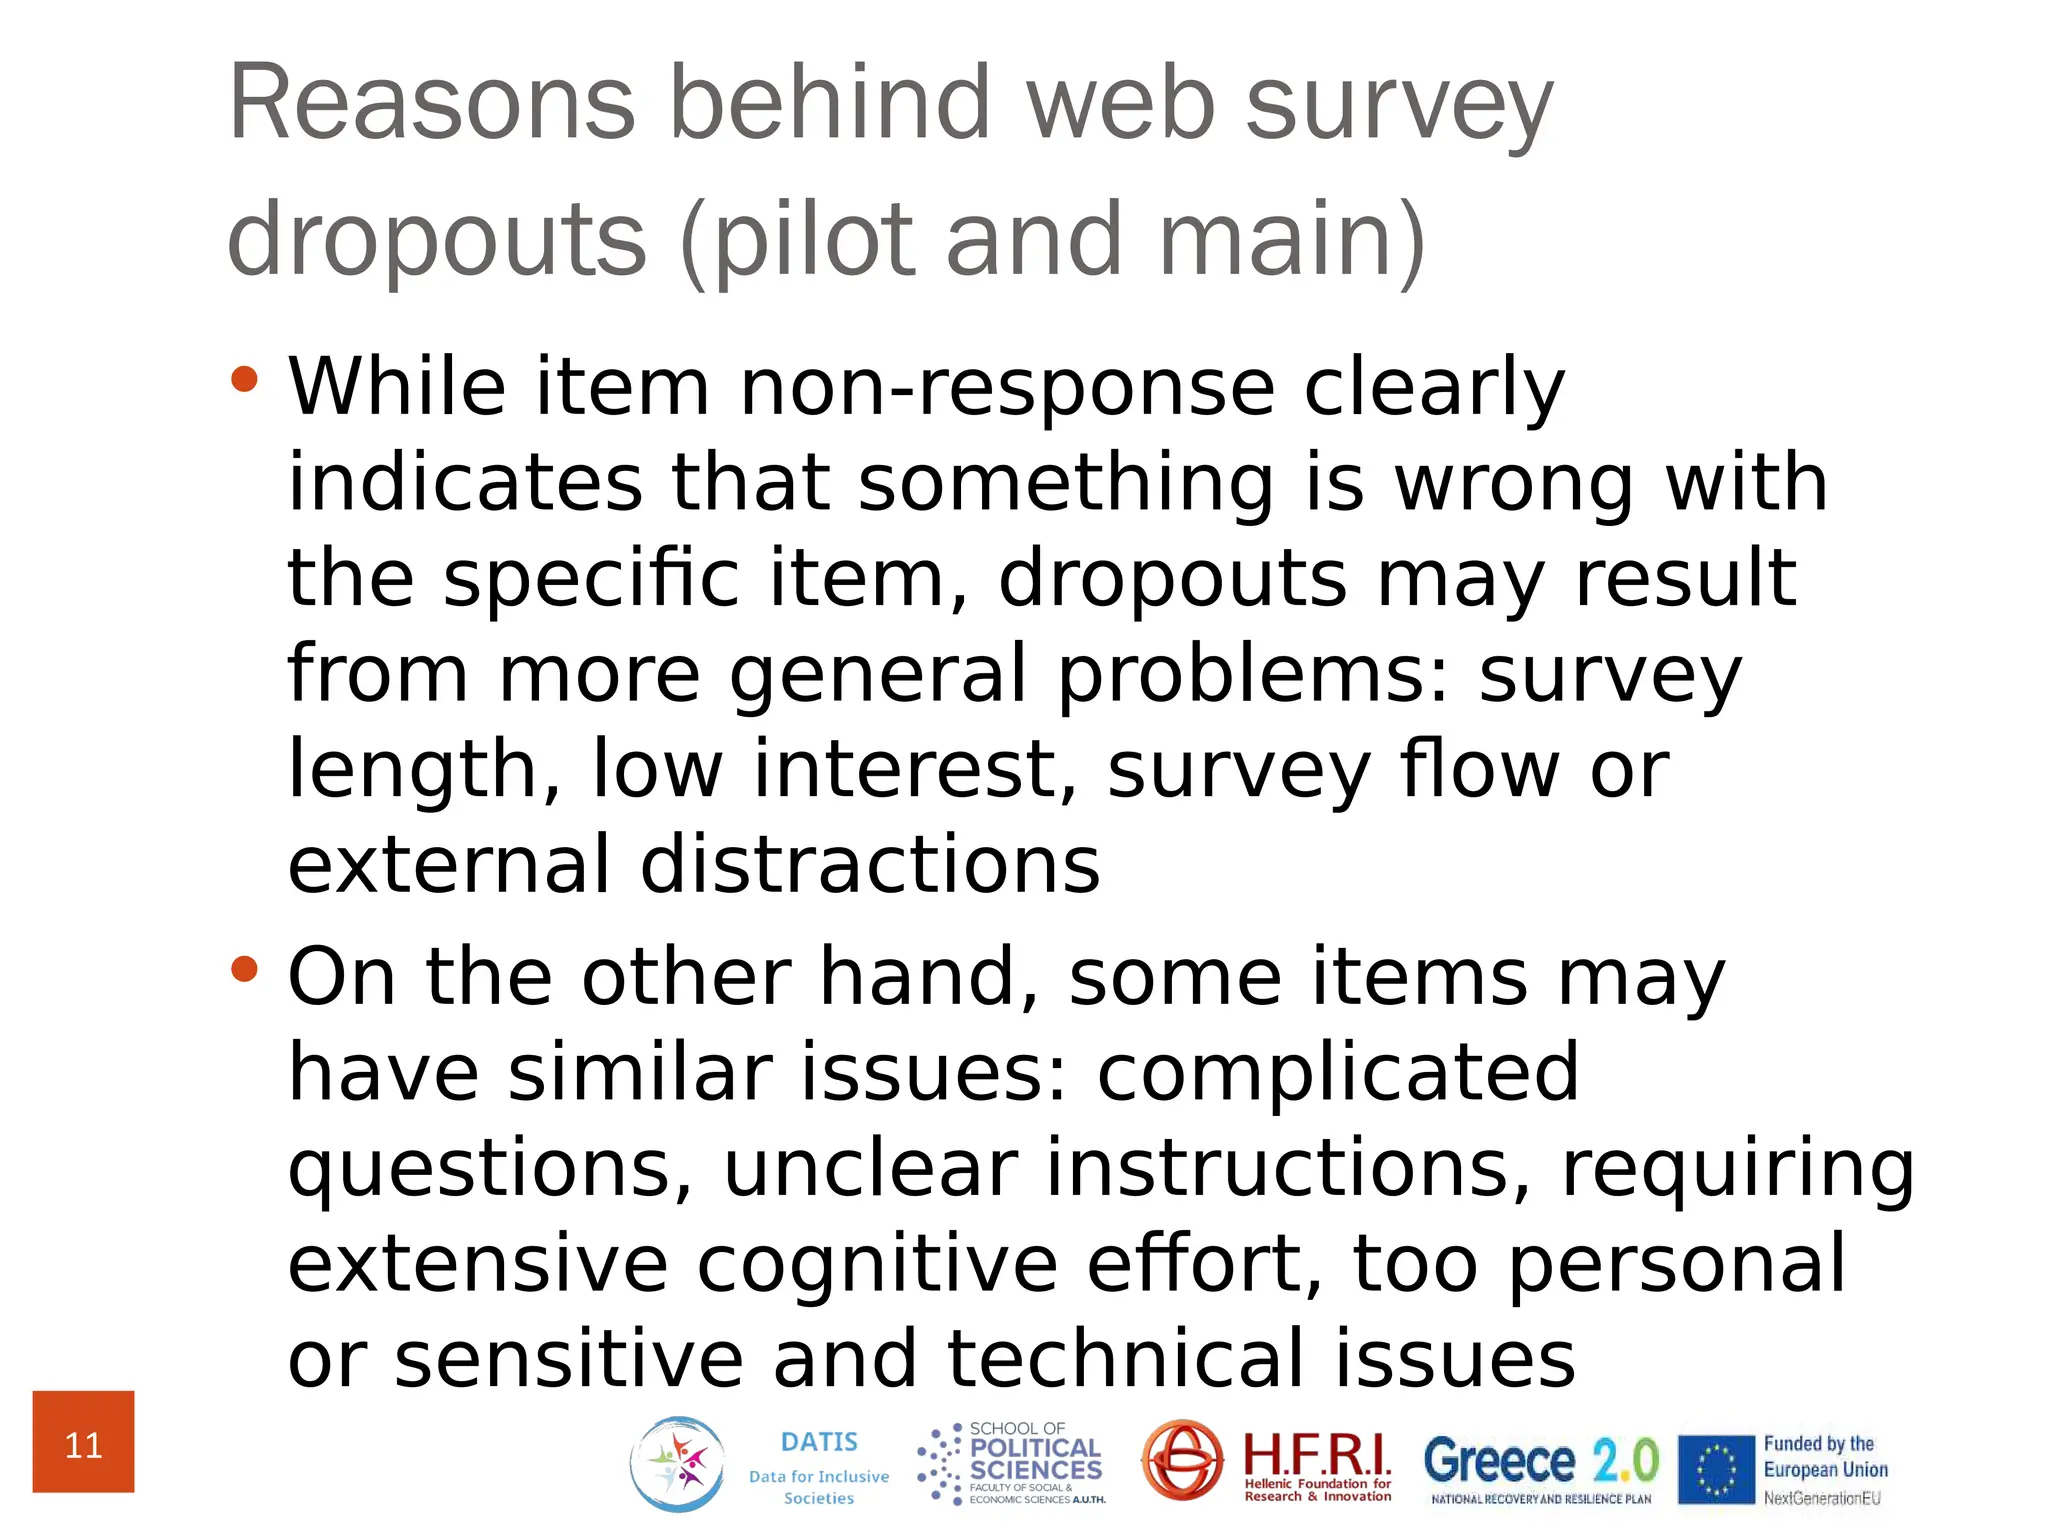
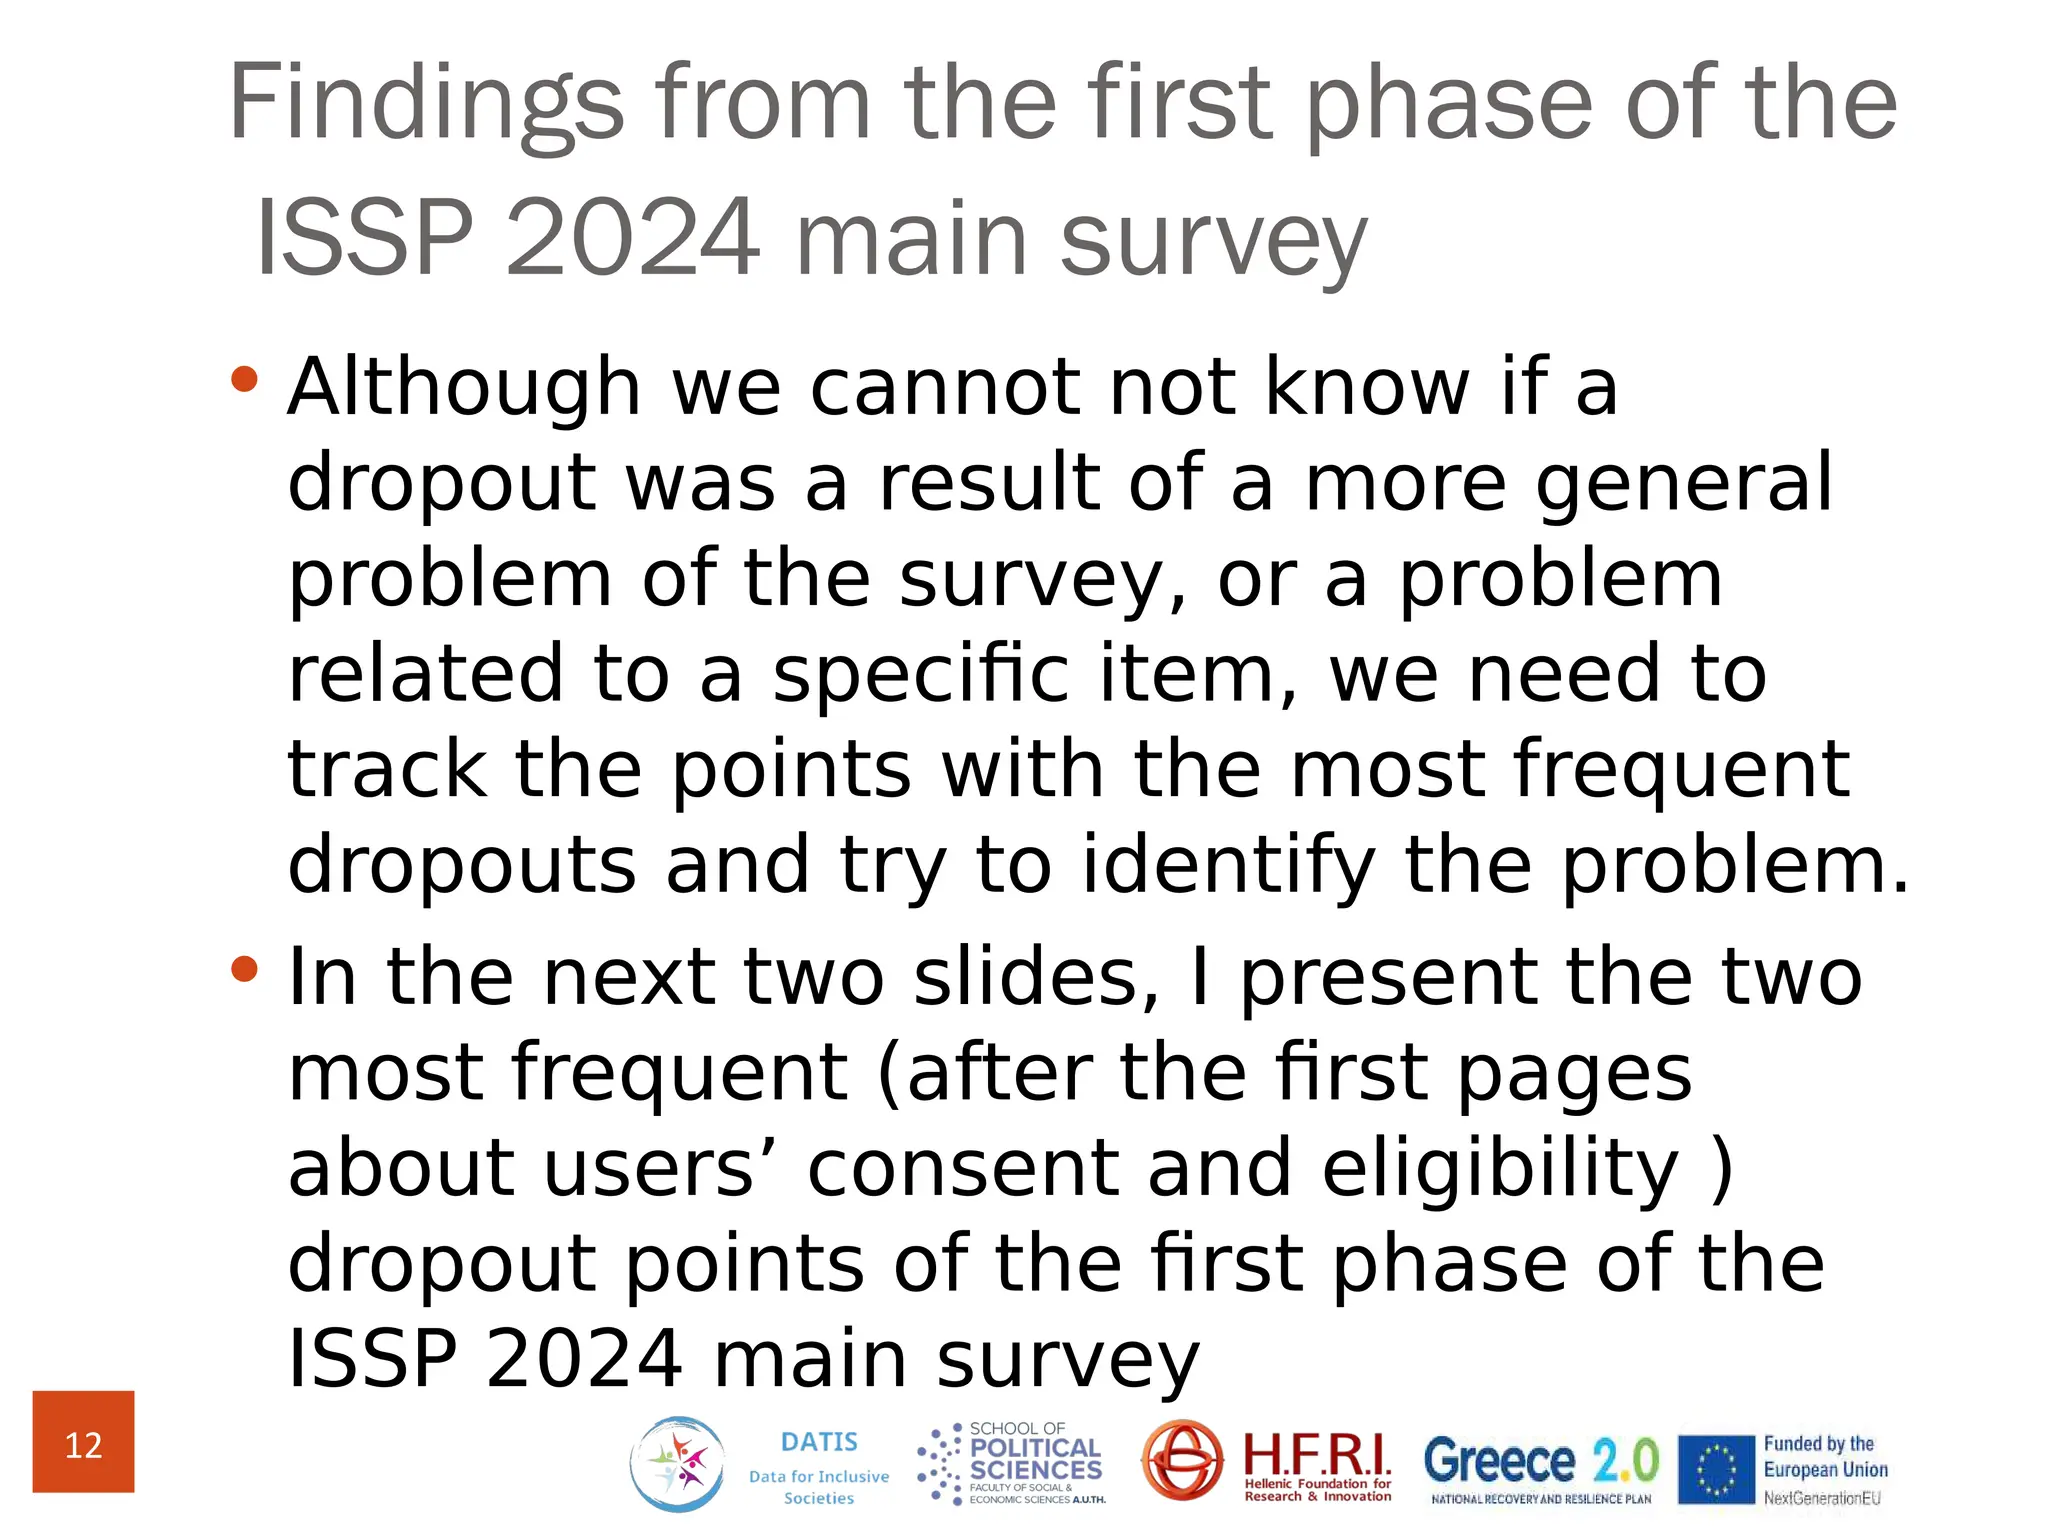
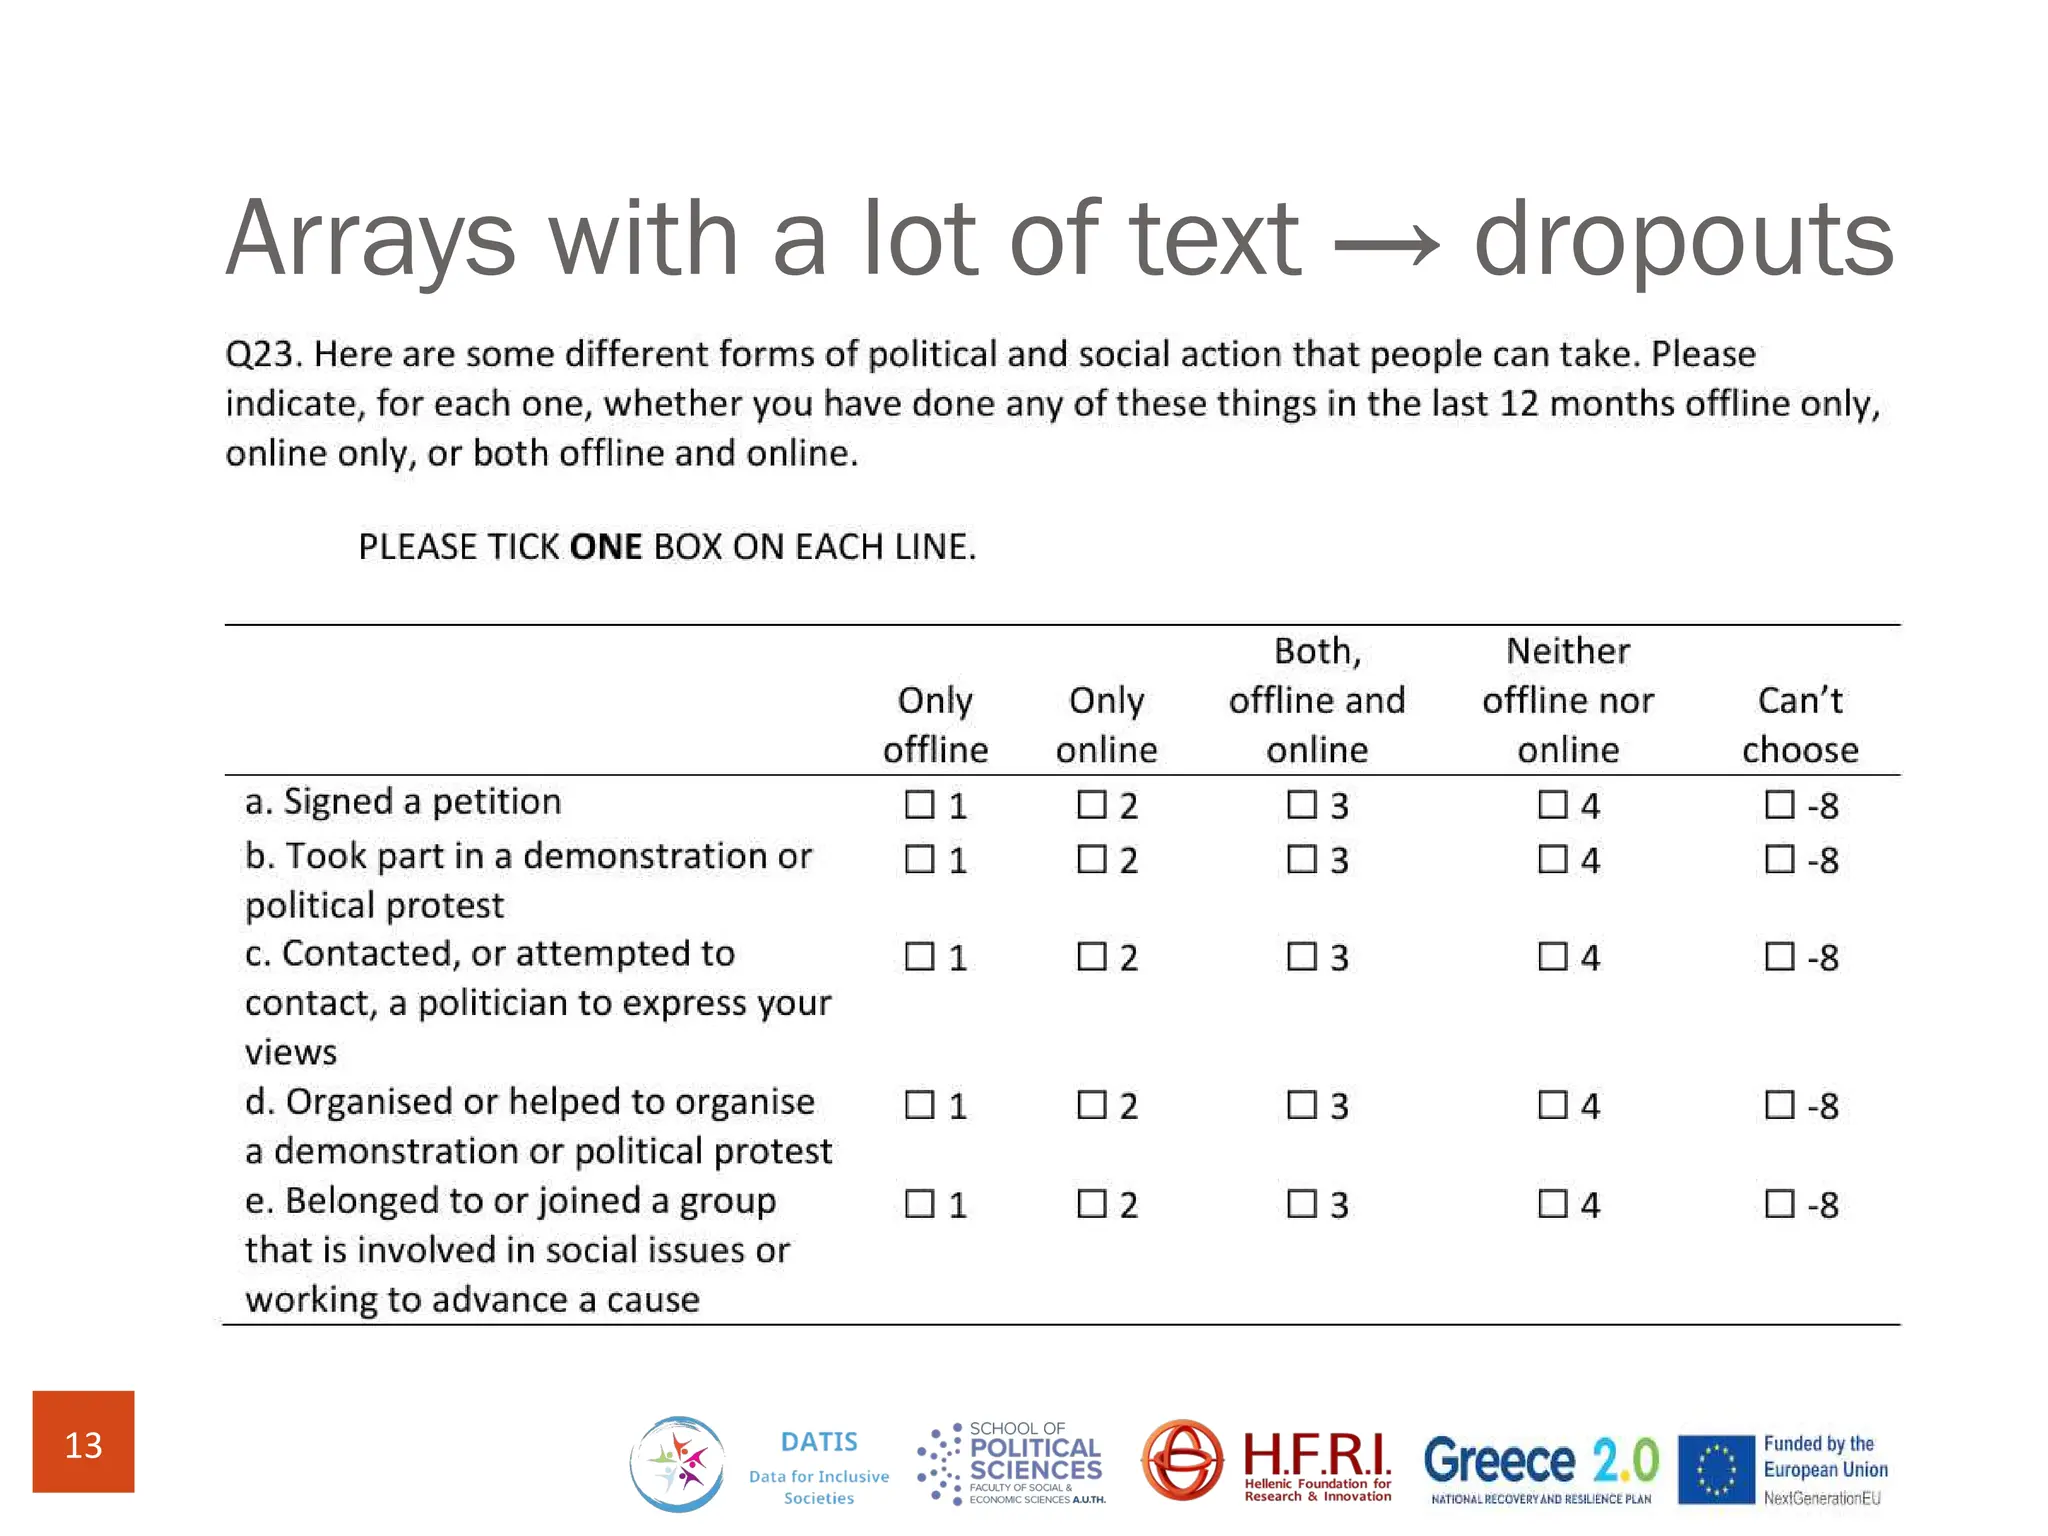
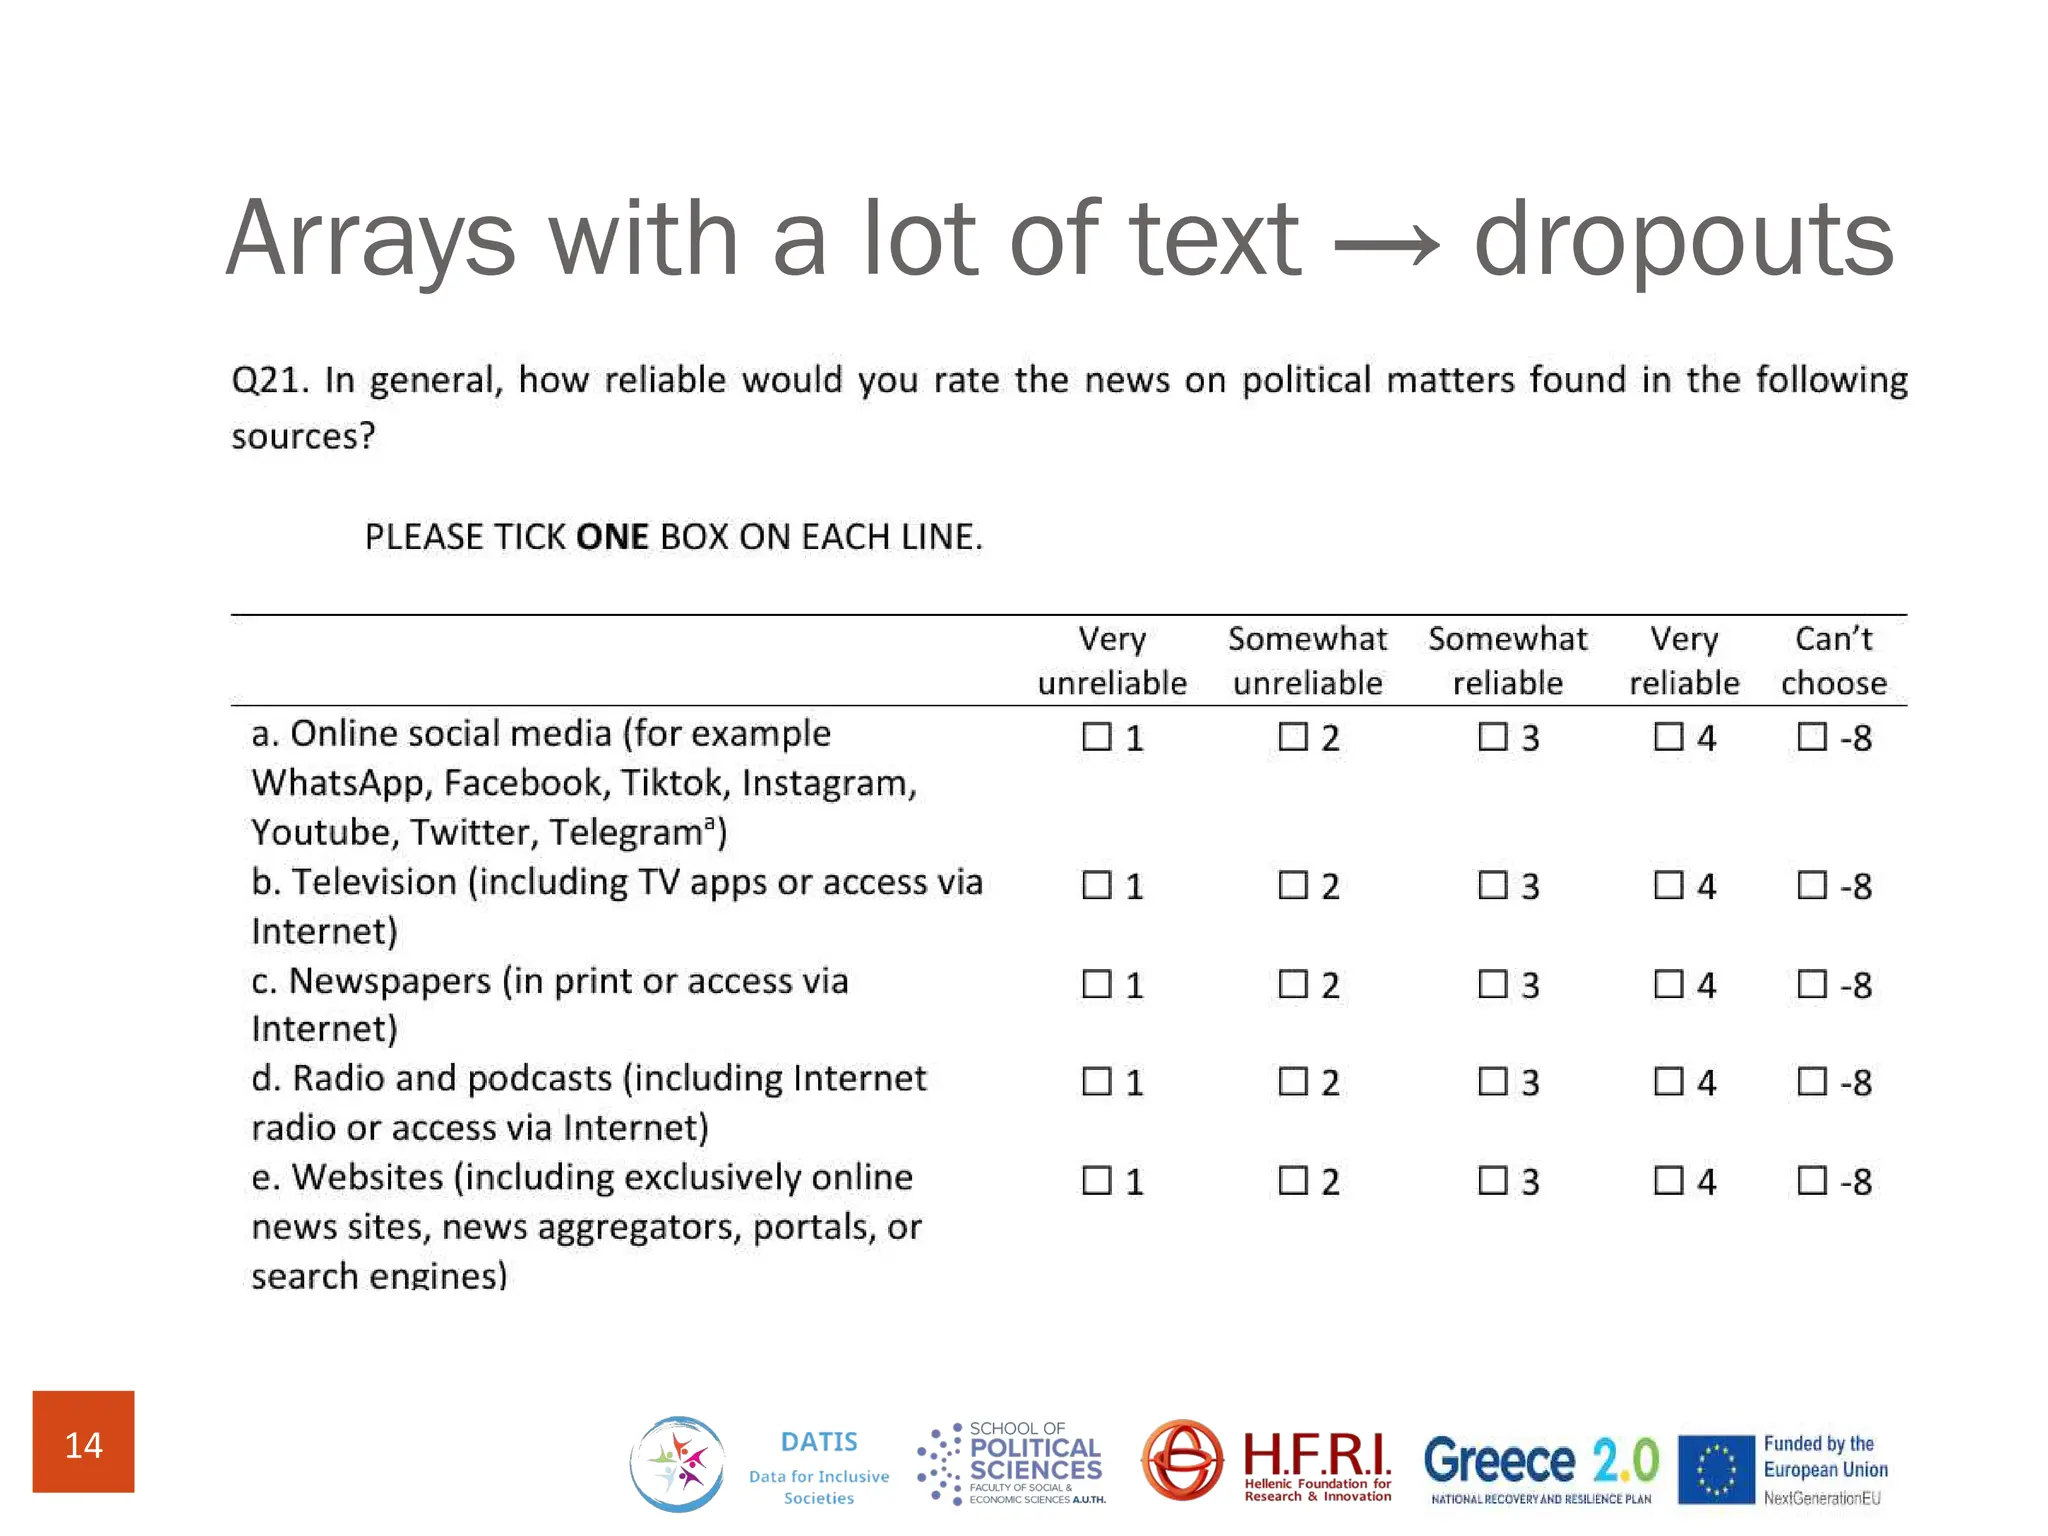

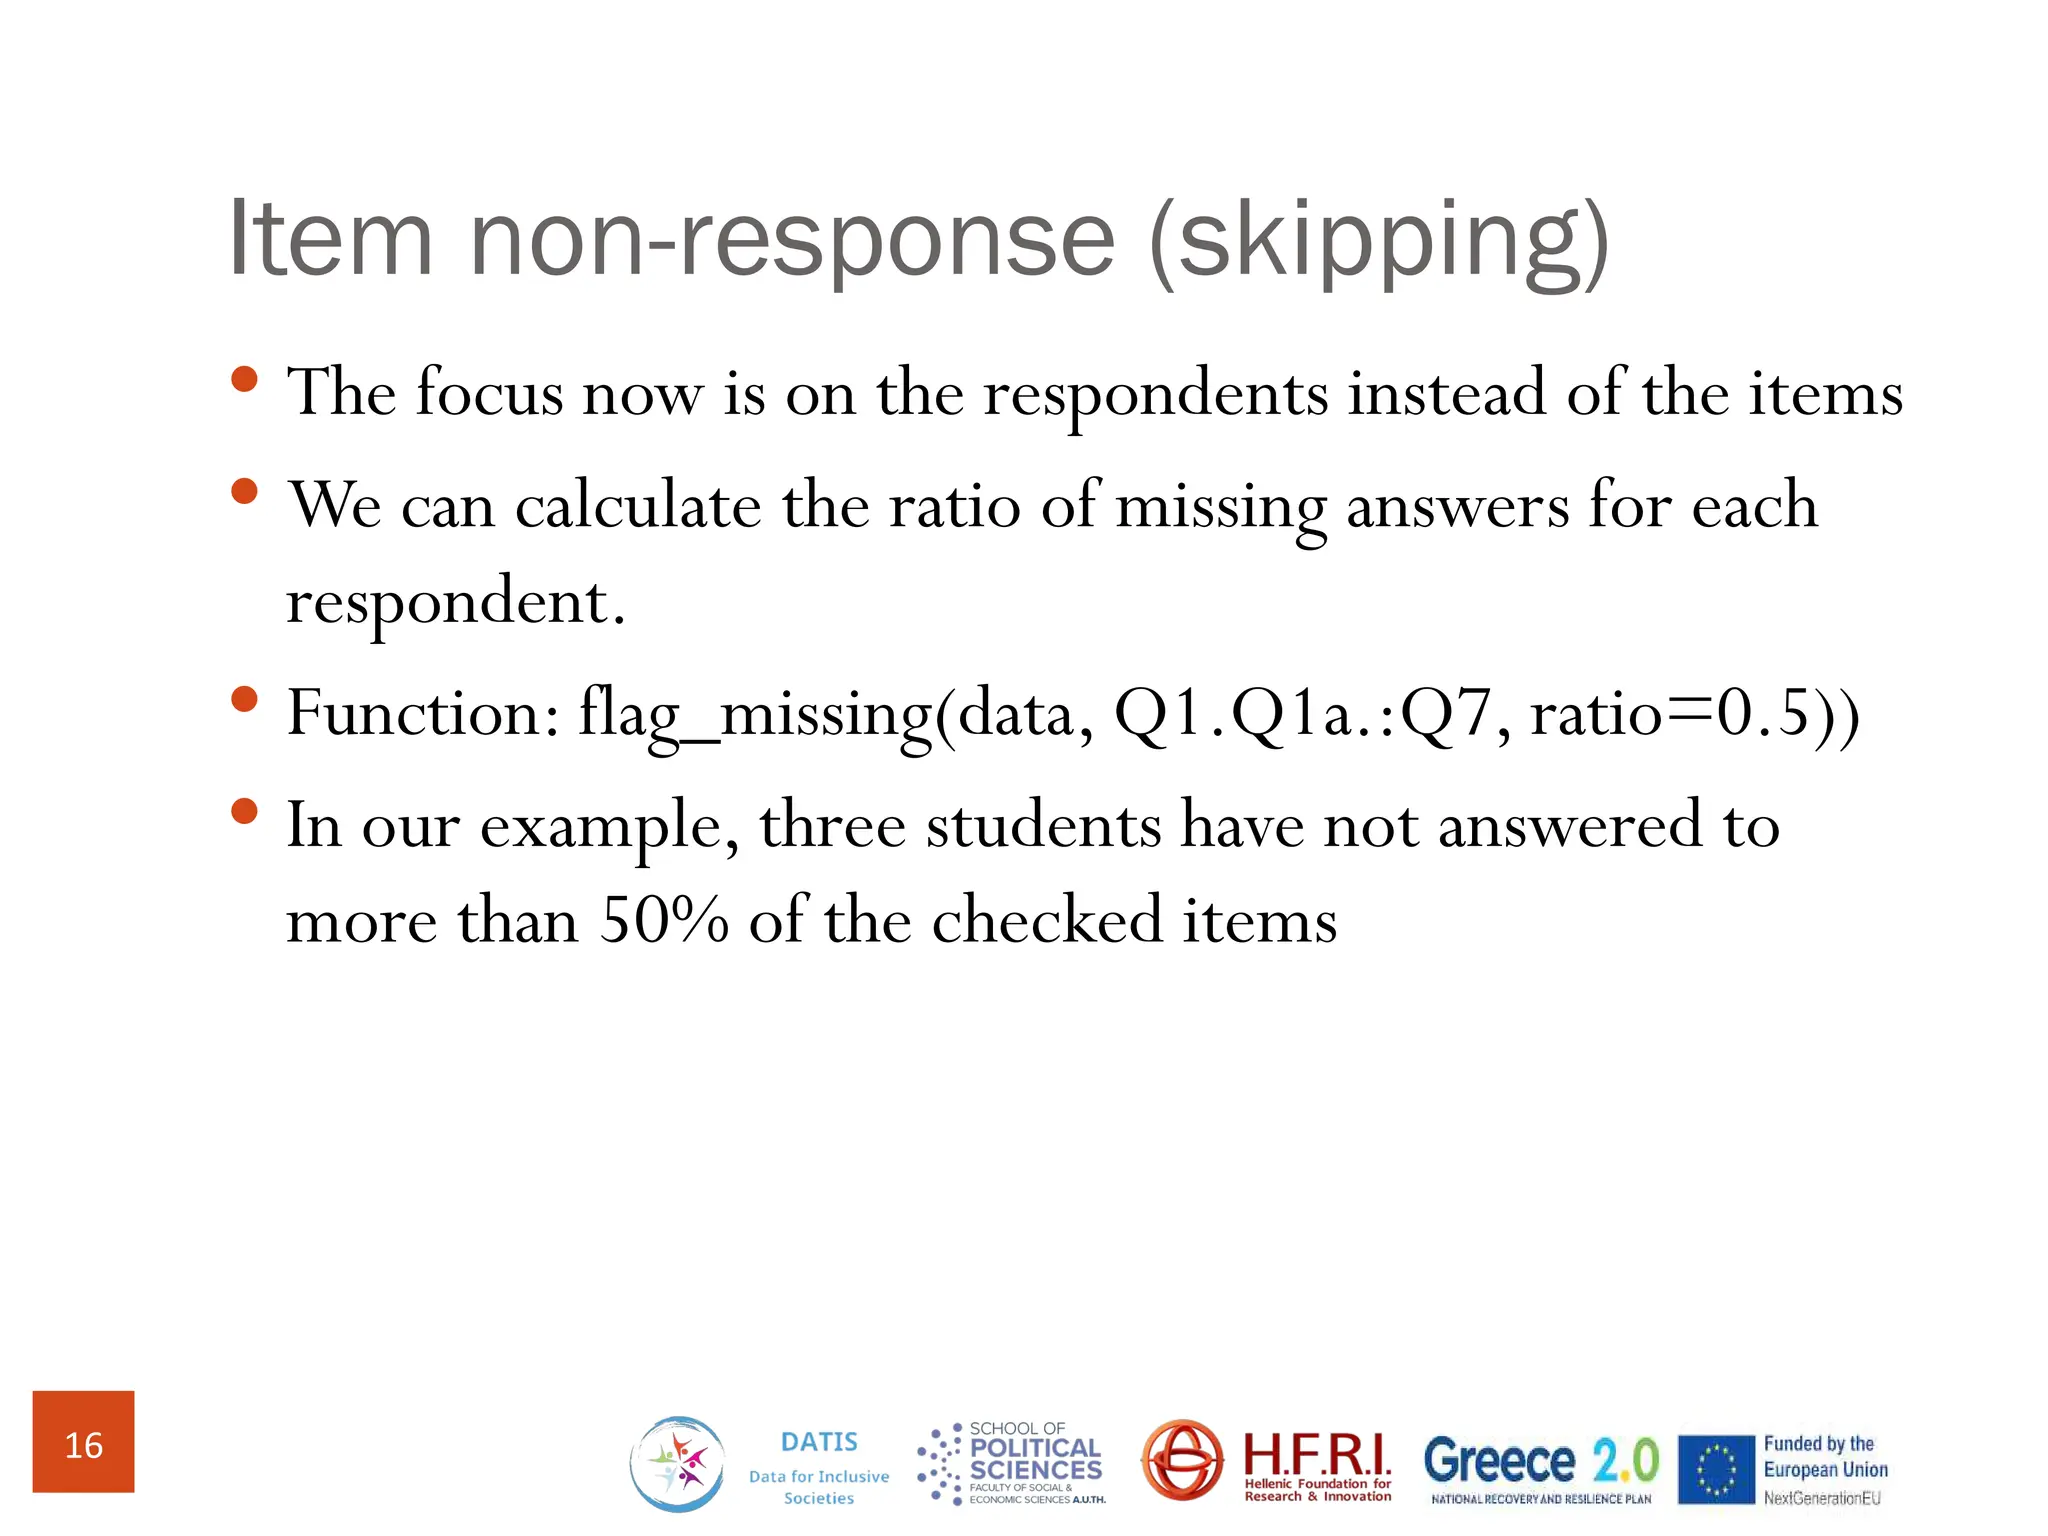
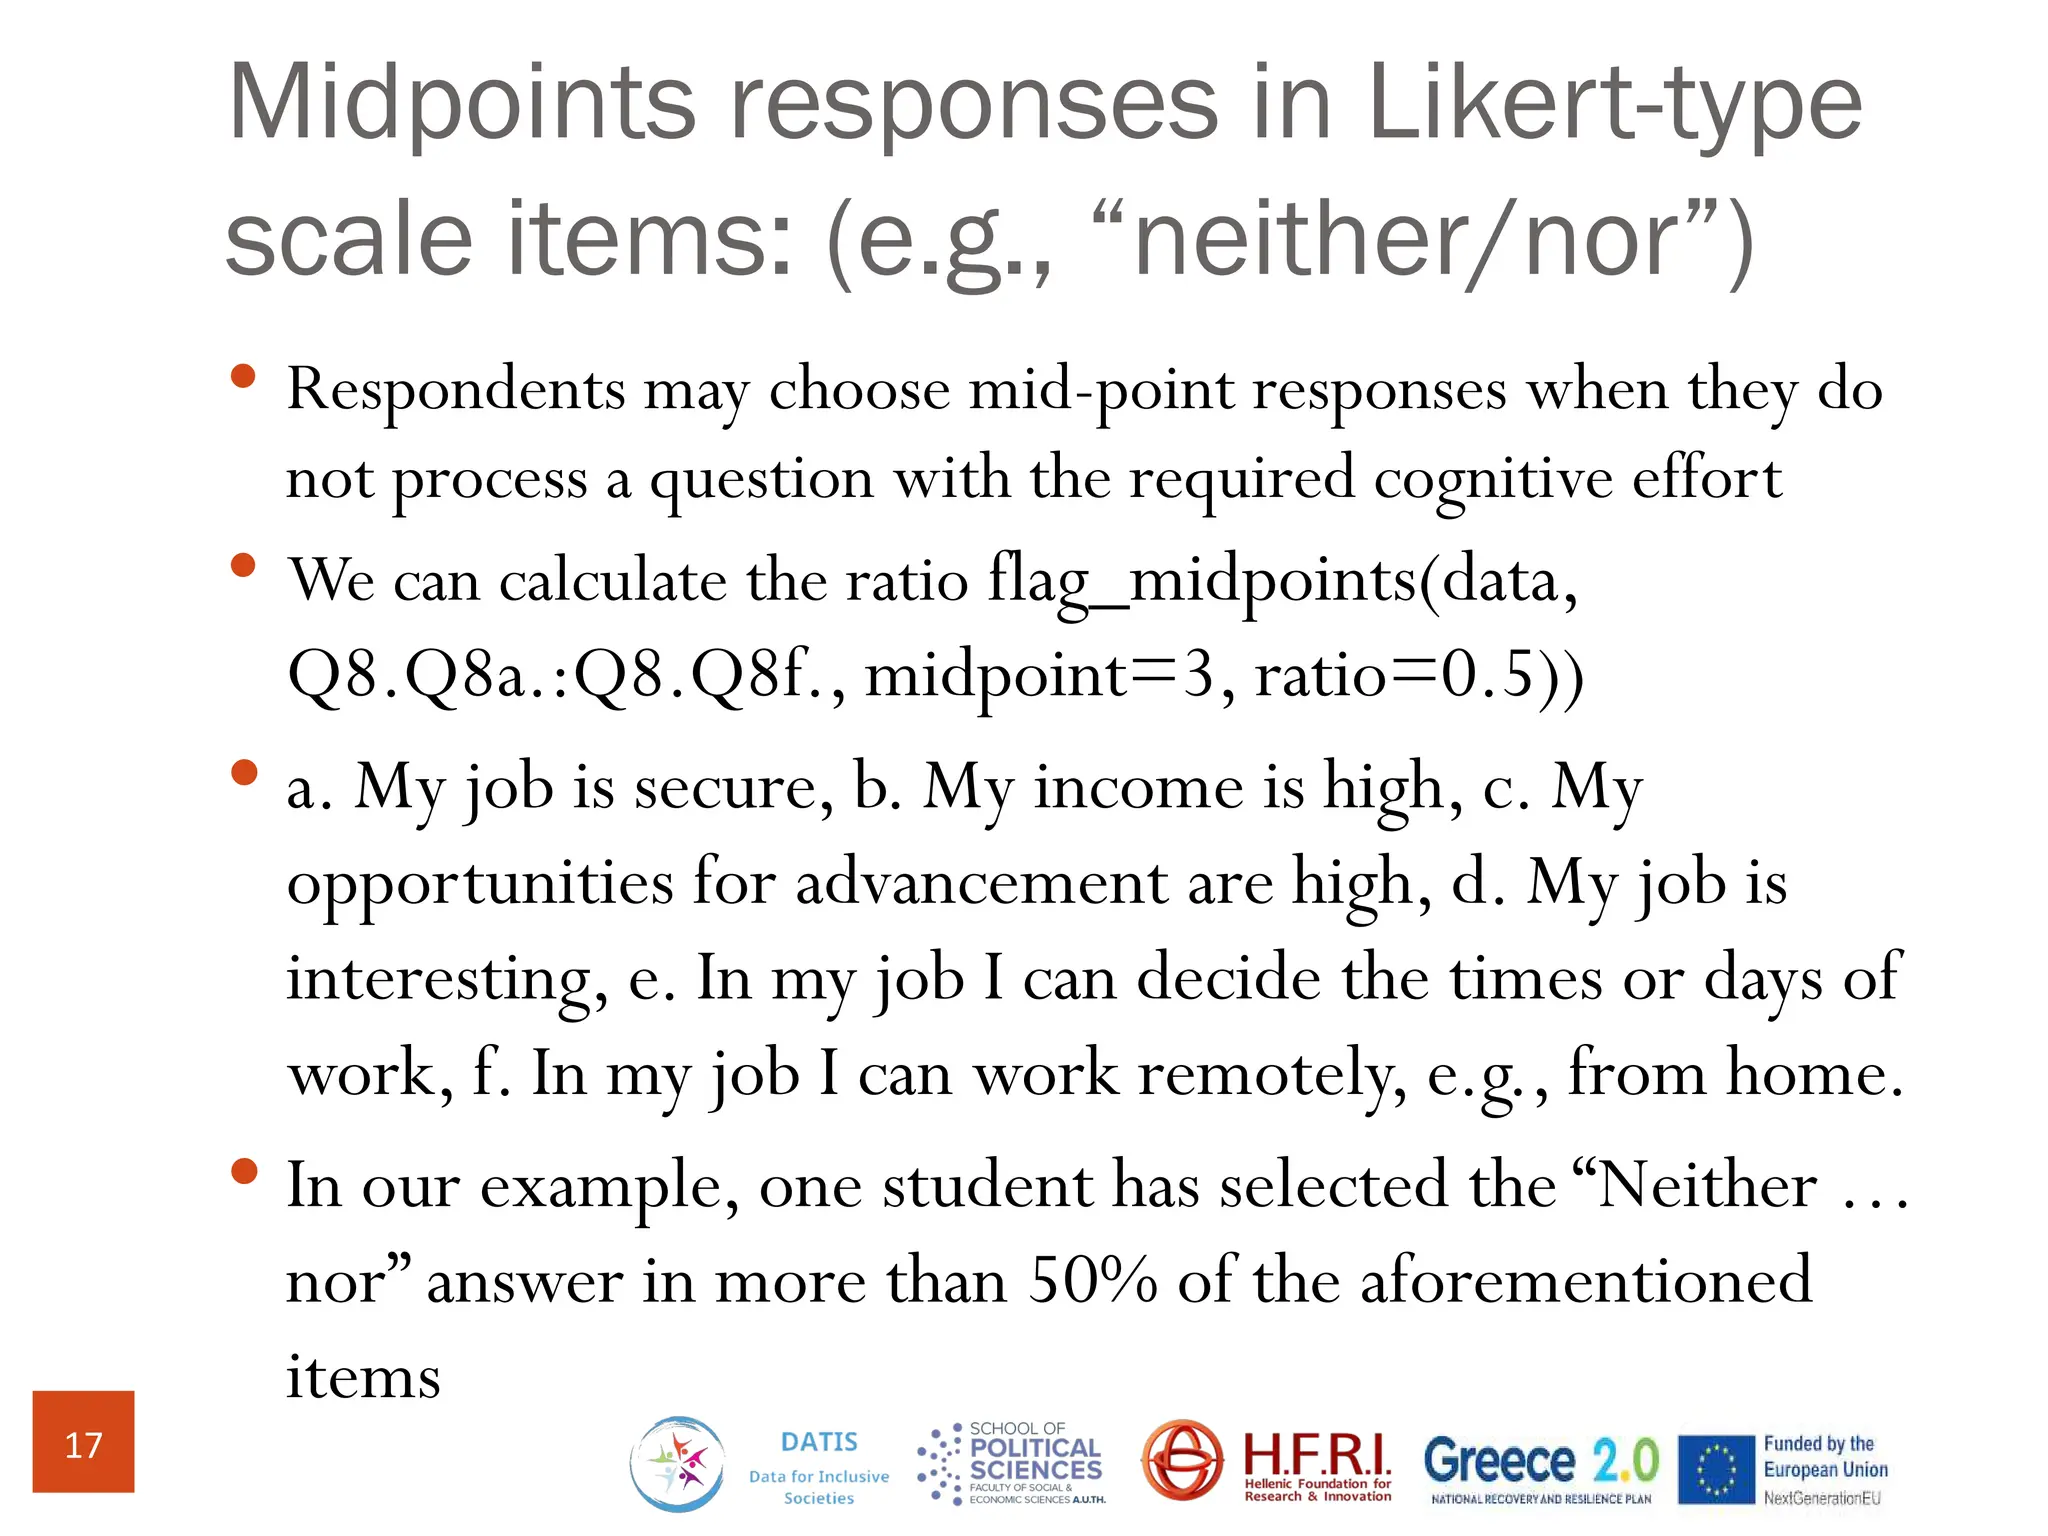
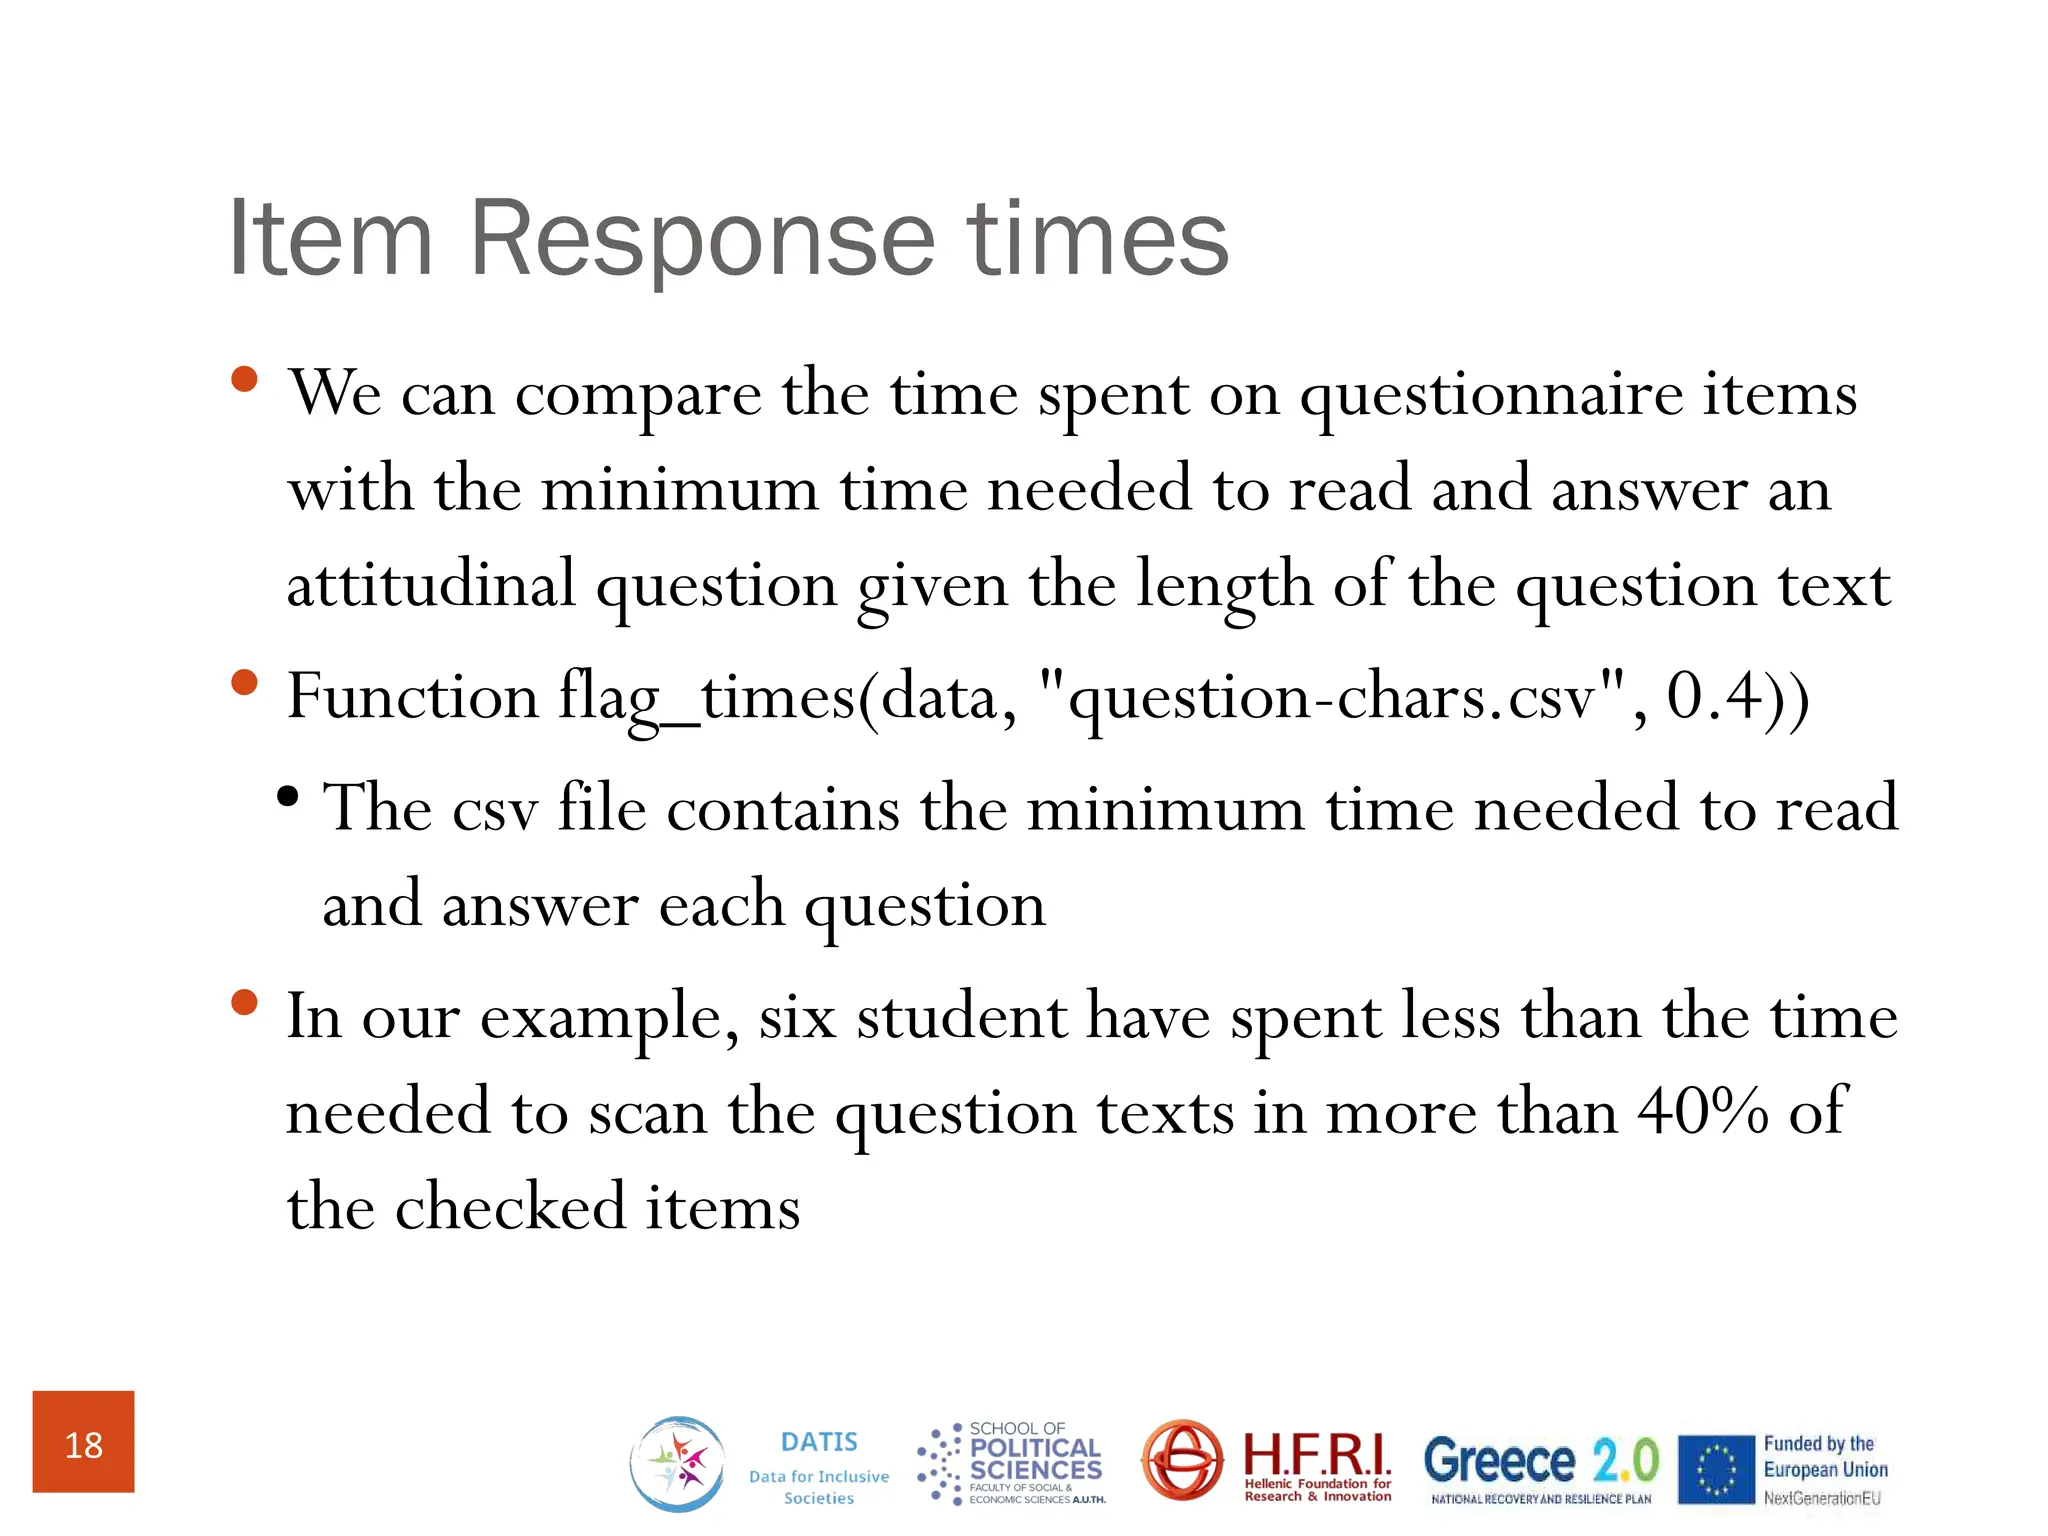
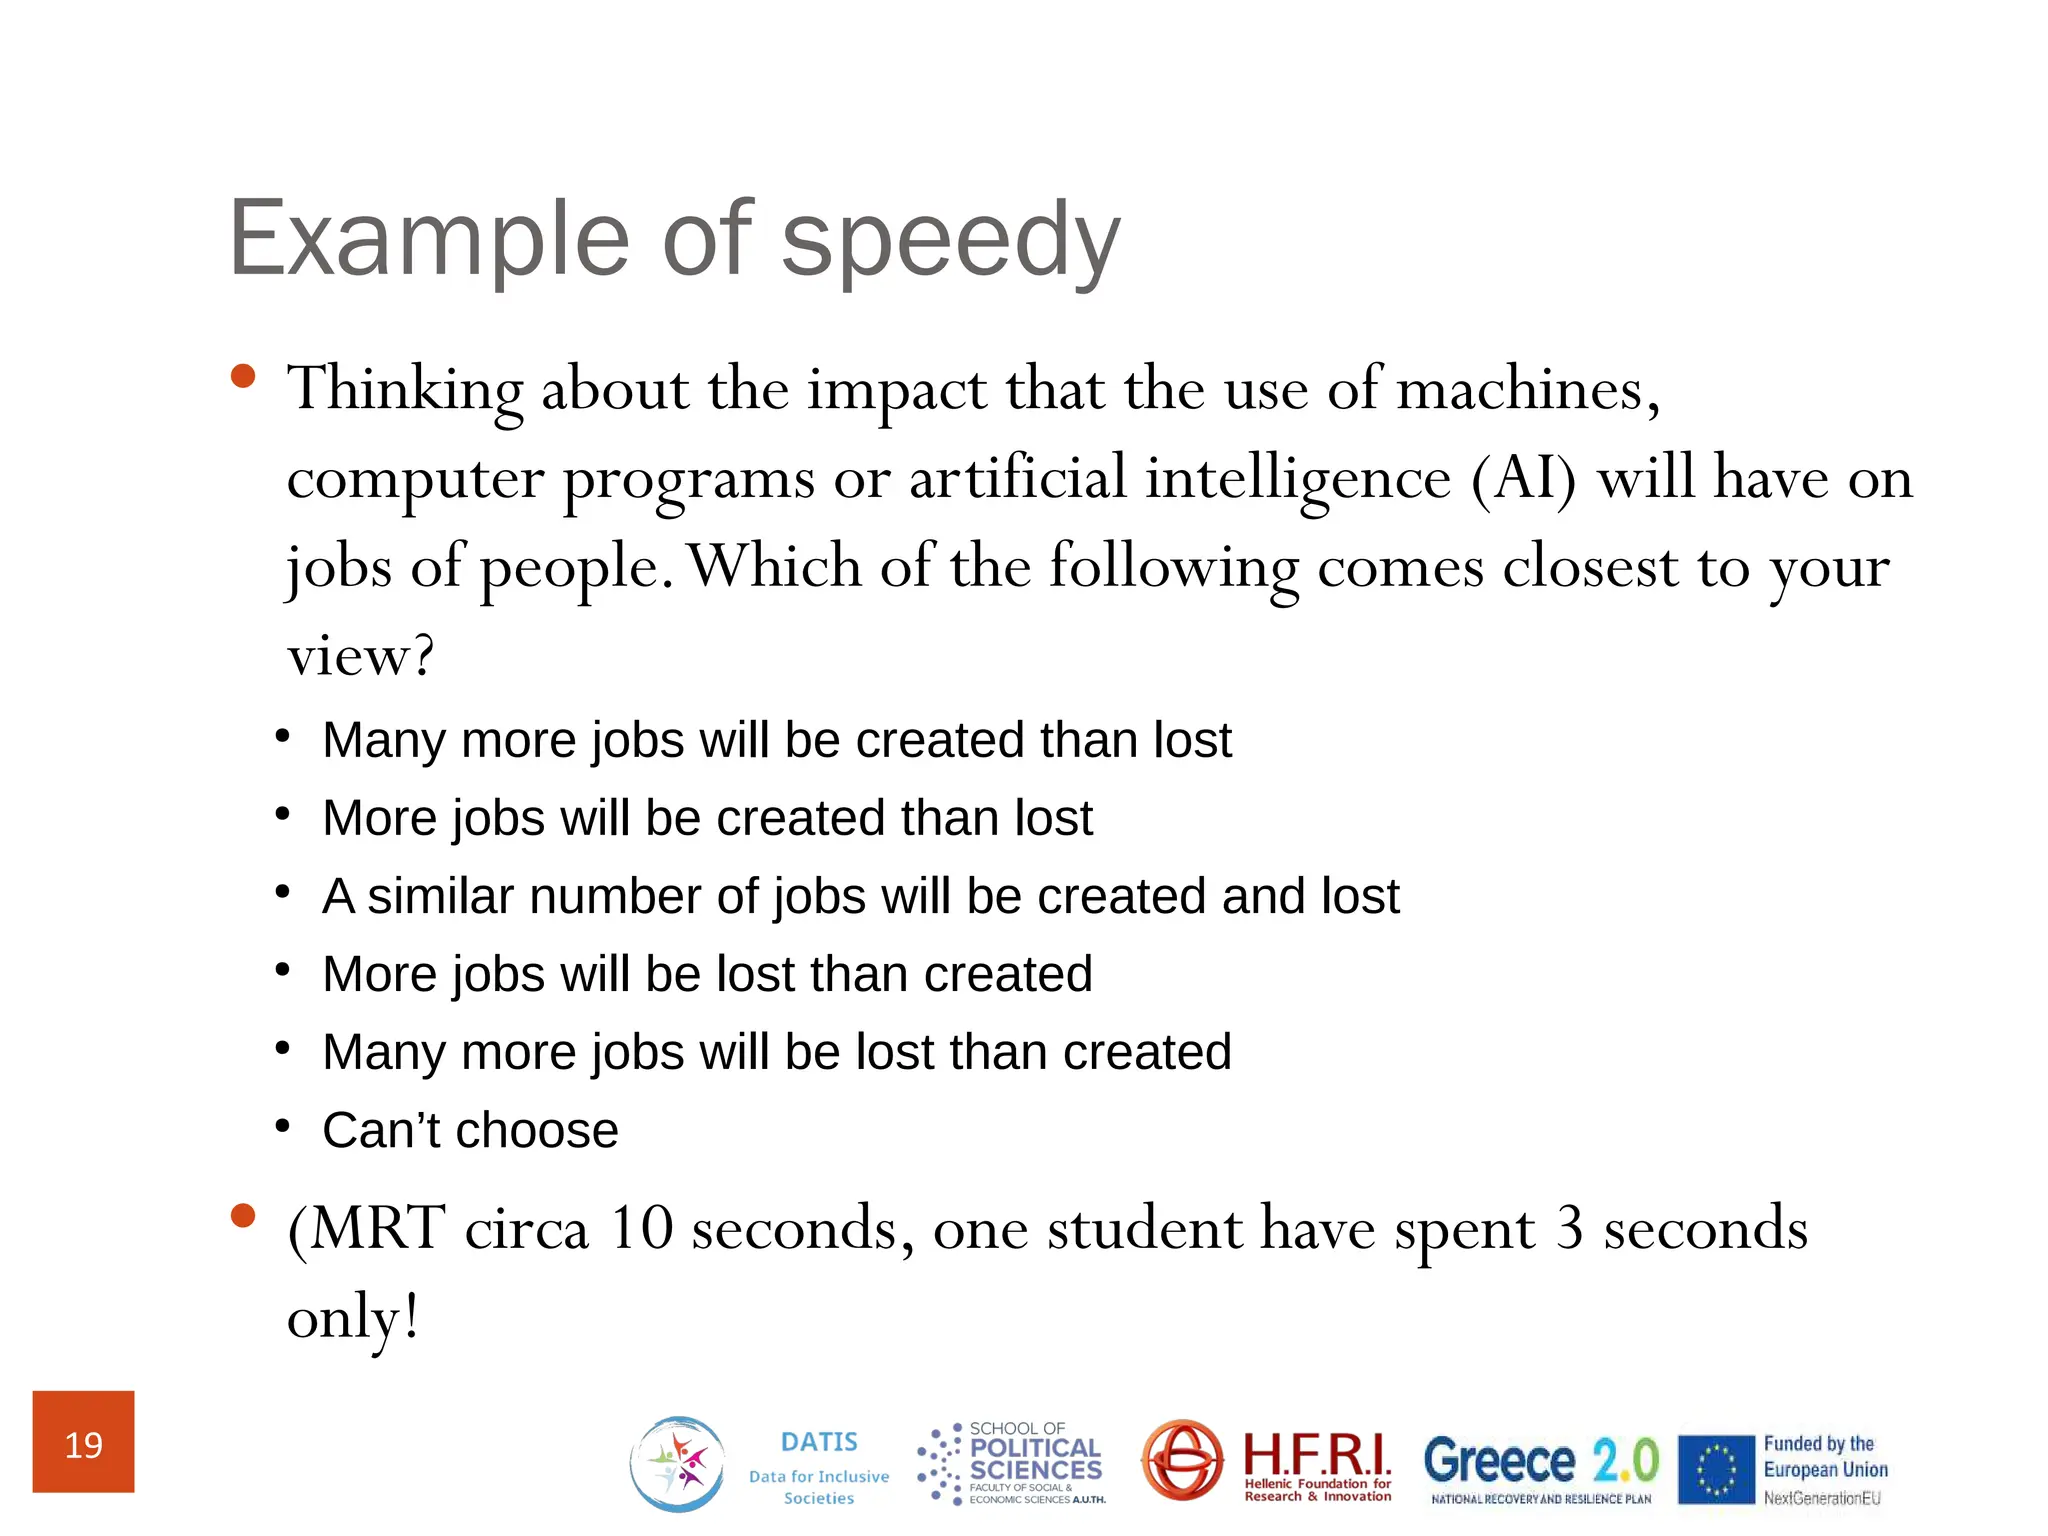
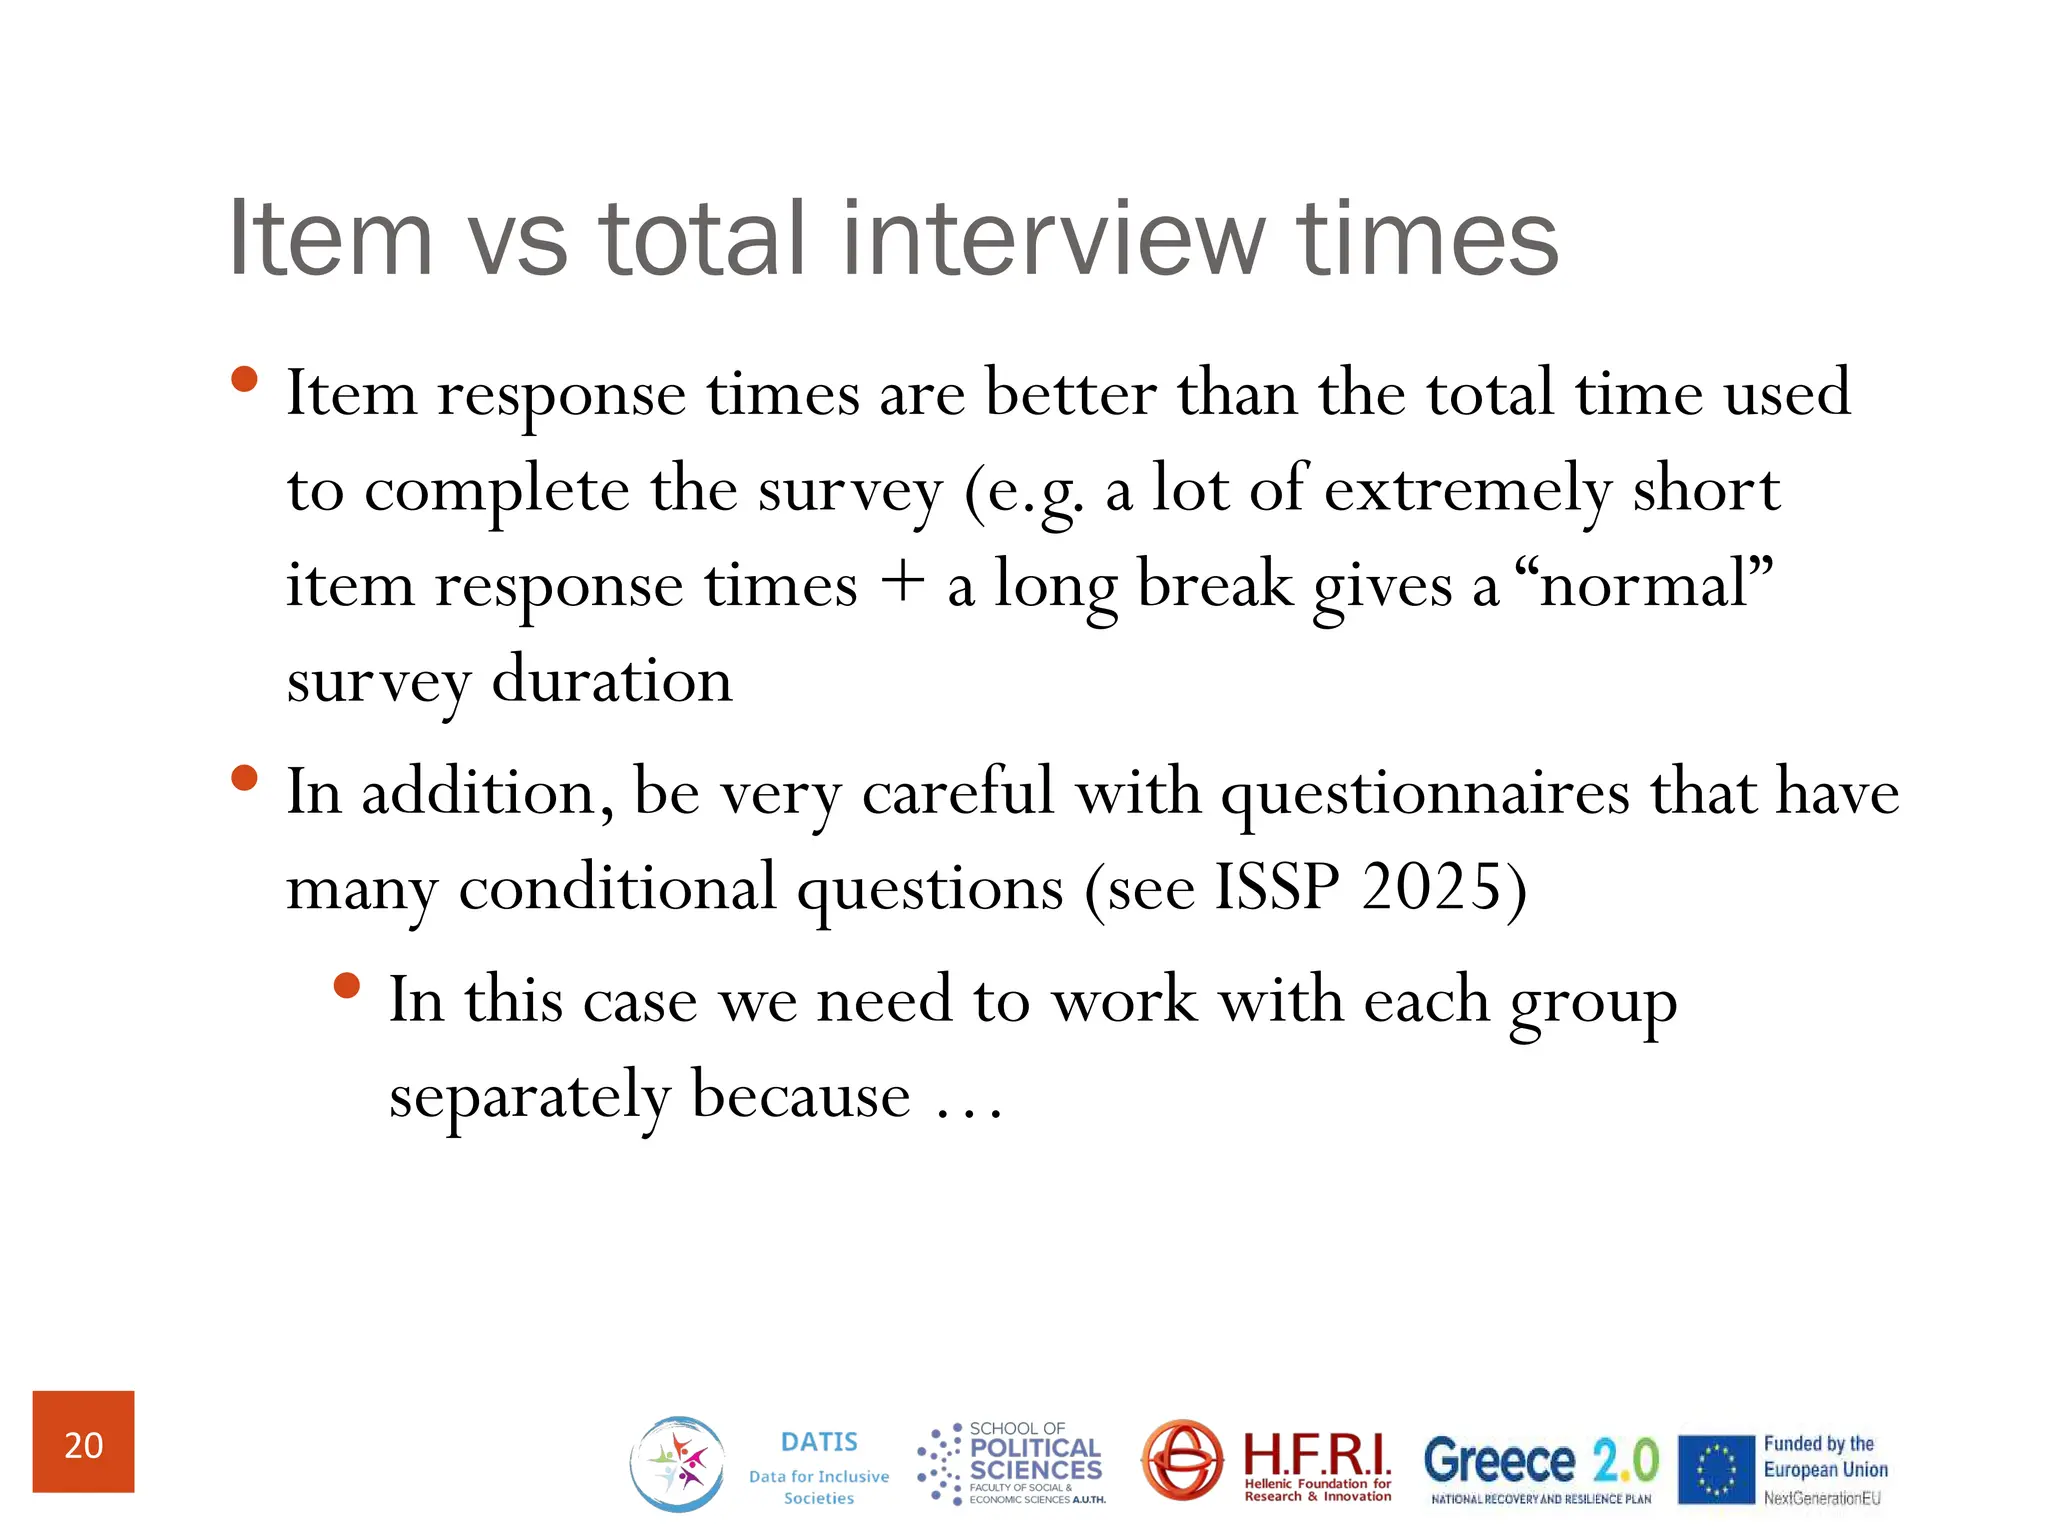


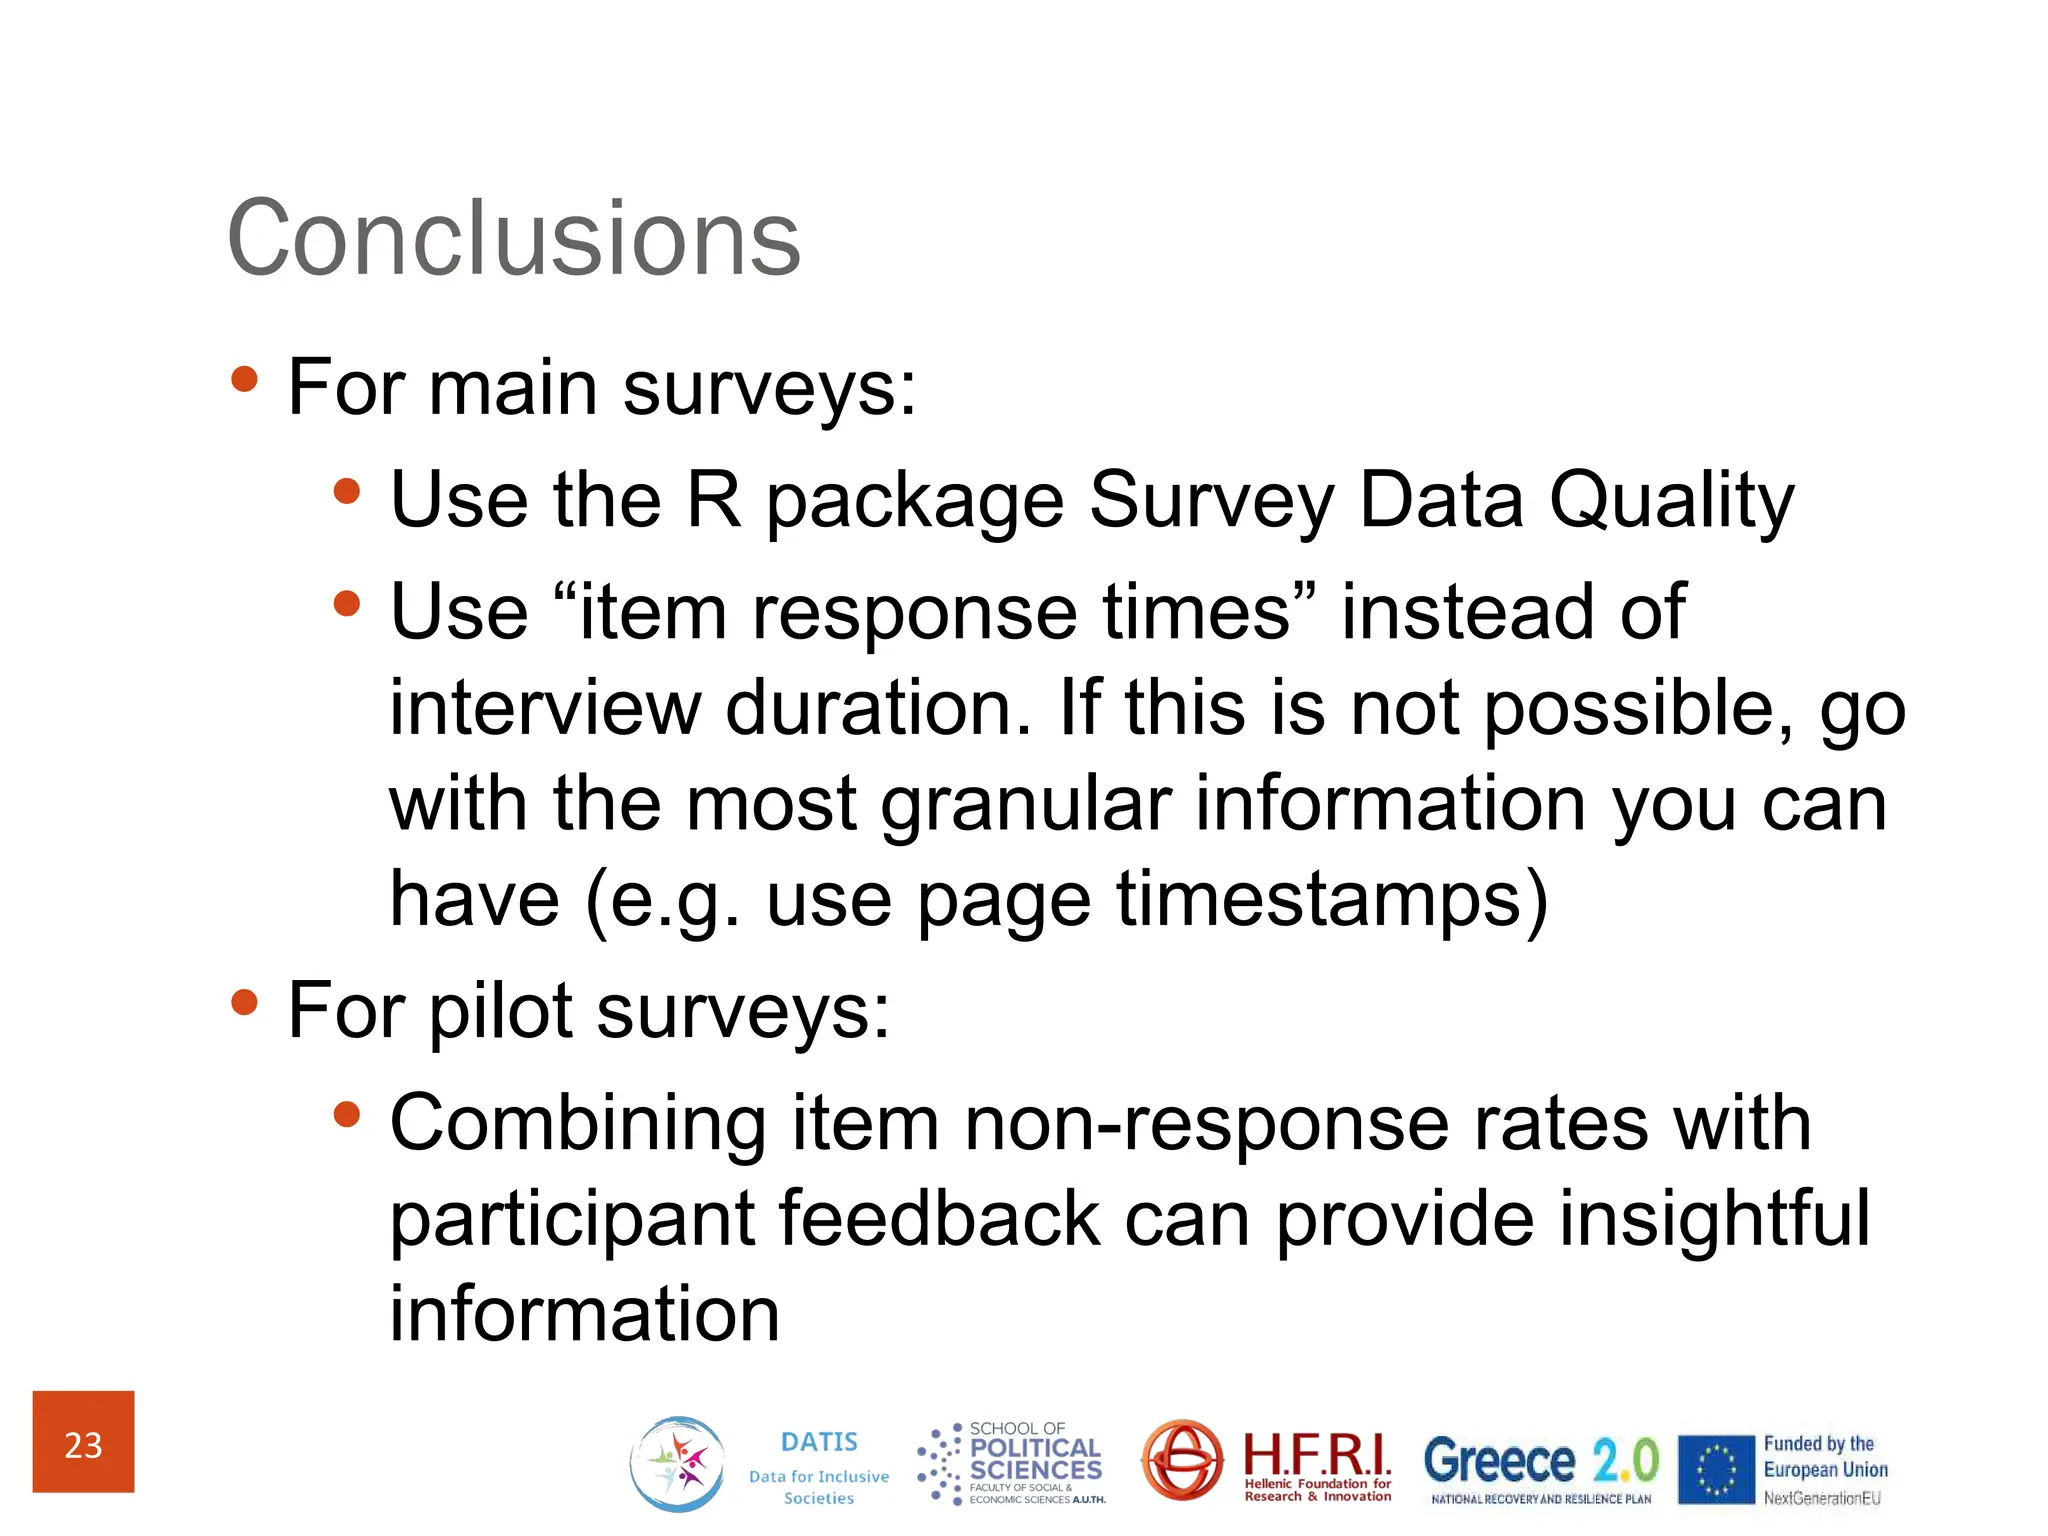


The document discusses methods for assessing survey data quality in two surveys conducted in Greece, focusing on the ISSP 2025 pilot survey and the ISSP 2024 main survey. Key methods include analyzing item non-response rates, participant feedback, and dropout rates to identify potential issues in questionnaires. It also introduces an R package for addressing data quality and provides insights into the importance of tailoring survey questions to different respondent categories, such as self-employed individuals.


![Matrix and determinant URT [Autosaved].pptx](https://cdn.slidesharecdn.com/ss_thumbnails/matrixanddeterminanturtautosaved-251018190340-9e6a6deb-thumbnail.jpg?width=600ounds&width=560&fit=bounds)


![RTP_AR_Basic_Learners' Workbook_KS2 [FOR REPRODUCTION] (1).pdf](https://cdn.slidesharecdn.com/ss_thumbnails/rtparbasiclearnersworkbookks2forreproduction1-251016024943-e51a16ac-thumbnail.jpg?width=600ounds&width=560&fit=bounds)