Download to read offline

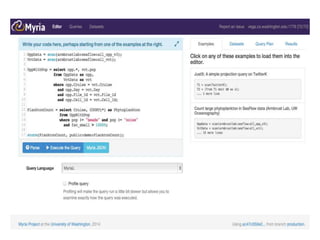
![“[This was hard] due to the large amount of data (e.g. data indexes for data retrieval,
dissection into data blocks and processing steps, order in which steps are performed
to match memory/time requirements, file formats required by software used).
In addition we actually spend quite some time in iterations fixing problems with
certain features (e.g. capping ENCODE data), testing features and feature products
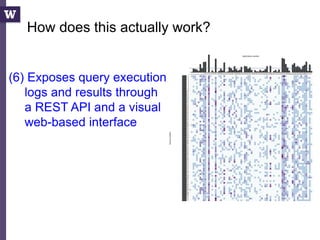
to include, identifying useful test data sets, adjusting the training data (e.g. 1000G vs
human-derived variants)
So roughly 50% of the project was testing and improving the model, 30% figuring out
how to do things (engineering) and 20% getting files and getting them into the right
format.
I guess in total [I spent] 6 months [on this project].”
At least 3 months on issues of
scale, file handling, and feature
extraction.
Martin Kircher,
Genome SciencesWhy?
3k NSF postdocs in 2010
$50k / postdoc
at least 50% overhead
maybe $75M annually
at NSF alone?
Where does the time go? (2)](https://image.slidesharecdn.com/2015highproductivity-151123223456-lva1-app6892/85/The-Other-HPC-High-Productivity-Computing-5-320.jpg)


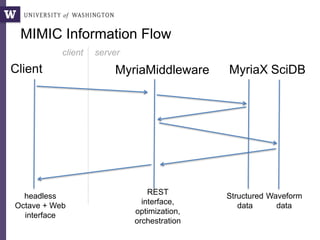


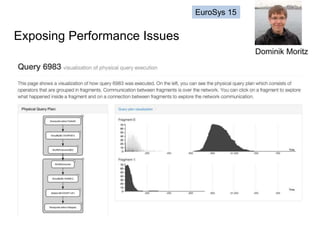
![38
CurGood = SCAN(public:adhoc:sc_points);
DO
mean = [FROM CurGood EMIT val=AVG(v)];
std = [FROM CurGood EMIT val=STDEV(v)];
NewBad = [FROM Good WHERE ABS(Good.v - mean) > 2 * std EMIT *];
CurGood = CurGood - NewBad;
continue = [FROM NewBad EMIT COUNT(NewBad.v) > 0];
WHILE continue;
DUMP(CurGood);
Sigma-clipping, V0](https://image.slidesharecdn.com/2015highproductivity-151123223456-lva1-app6892/85/The-Other-HPC-High-Productivity-Computing-35-320.jpg)
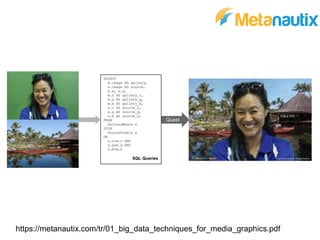
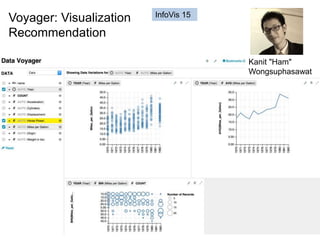
![39
CurGood = P
sum = [FROM CurGood EMIT SUM(val)];
sumsq = [FROM CurGood EMIT SUM(val*val)]
cnt = [FROM CurGood EMIT CNT(*)];
NewBad = []
DO
sum = sum – [FROM NewBad EMIT SUM(val)];
sumsq = sum – [FROM NewBad EMIT SUM(val*val)];
cnt = sum - [FROM NewBad EMIT CNT(*)];
mean = sum / cnt
std = sqrt(1/(cnt*(cnt-1)) * (cnt * sumsq - sum*sum))
NewBad = FILTER([ABS(val-mean)>std], CurGood)
CurGood = CurGood - NewBad
WHILE NewBad != {}
Sigma-clipping, V1: Incremental](https://image.slidesharecdn.com/2015highproductivity-151123223456-lva1-app6892/85/The-Other-HPC-High-Productivity-Computing-36-320.jpg)
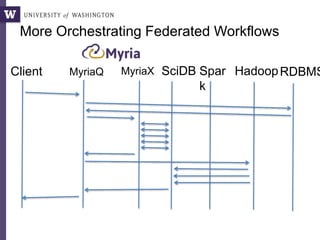
![40
Points = SCAN(public:adhoc:sc_points);
aggs = [FROM Points EMIT _sum=SUM(v), sumsq=SUM(v*v), cnt=COUNT(v)];
newBad = []
bounds = [FROM Points EMIT lower=MIN(v), upper=MAX(v)];
DO
new_aggs = [FROM newBad EMIT _sum=SUM(v), sumsq=SUM(v*v), cnt=COUNT(v)];
aggs = [FROM aggs, new_aggs EMIT _sum=aggs._sum - new_aggs._sum,
sumsq=aggs.sumsq - new_aggs.sumsq, cnt=aggs.cnt - new_aggs.cnt];
stats = [FROM aggs EMIT mean=_sum/cnt,
std=SQRT(1.0/(cnt*(cnt-1)) * (cnt * sumsq - _sum * _sum))];
newBounds = [FROM stats EMIT lower=mean - 2 * std, upper=mean + 2 * std];
tooLow = [FROM Points, bounds, newBounds WHERE newBounds.lower > v
AND v >= bounds.lower EMIT v=Points.v];
tooHigh = [FROM Points, bounds, newBounds WHERE newBounds.upper < v
AND v <= bounds.upper EMIT v=Points.v];
newBad = UNIONALL(tooLow, tooHigh);
bounds = newBounds;
continue = [FROM newBad EMIT COUNT(v) > 0];
WHILE continue;
output = [FROM Points, bounds WHERE Points.v > bounds.lower AND
Points.v < bounds.upper EMIT v=Points.v];
DUMP(output);
Sigma-clipping, V2](https://image.slidesharecdn.com/2015highproductivity-151123223456-lva1-app6892/85/The-Other-HPC-High-Productivity-Computing-37-320.jpg)


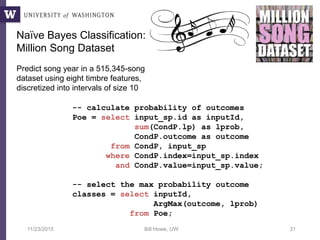
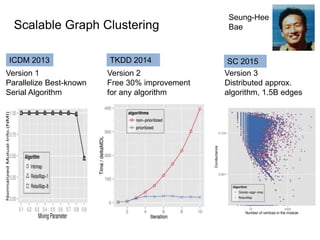
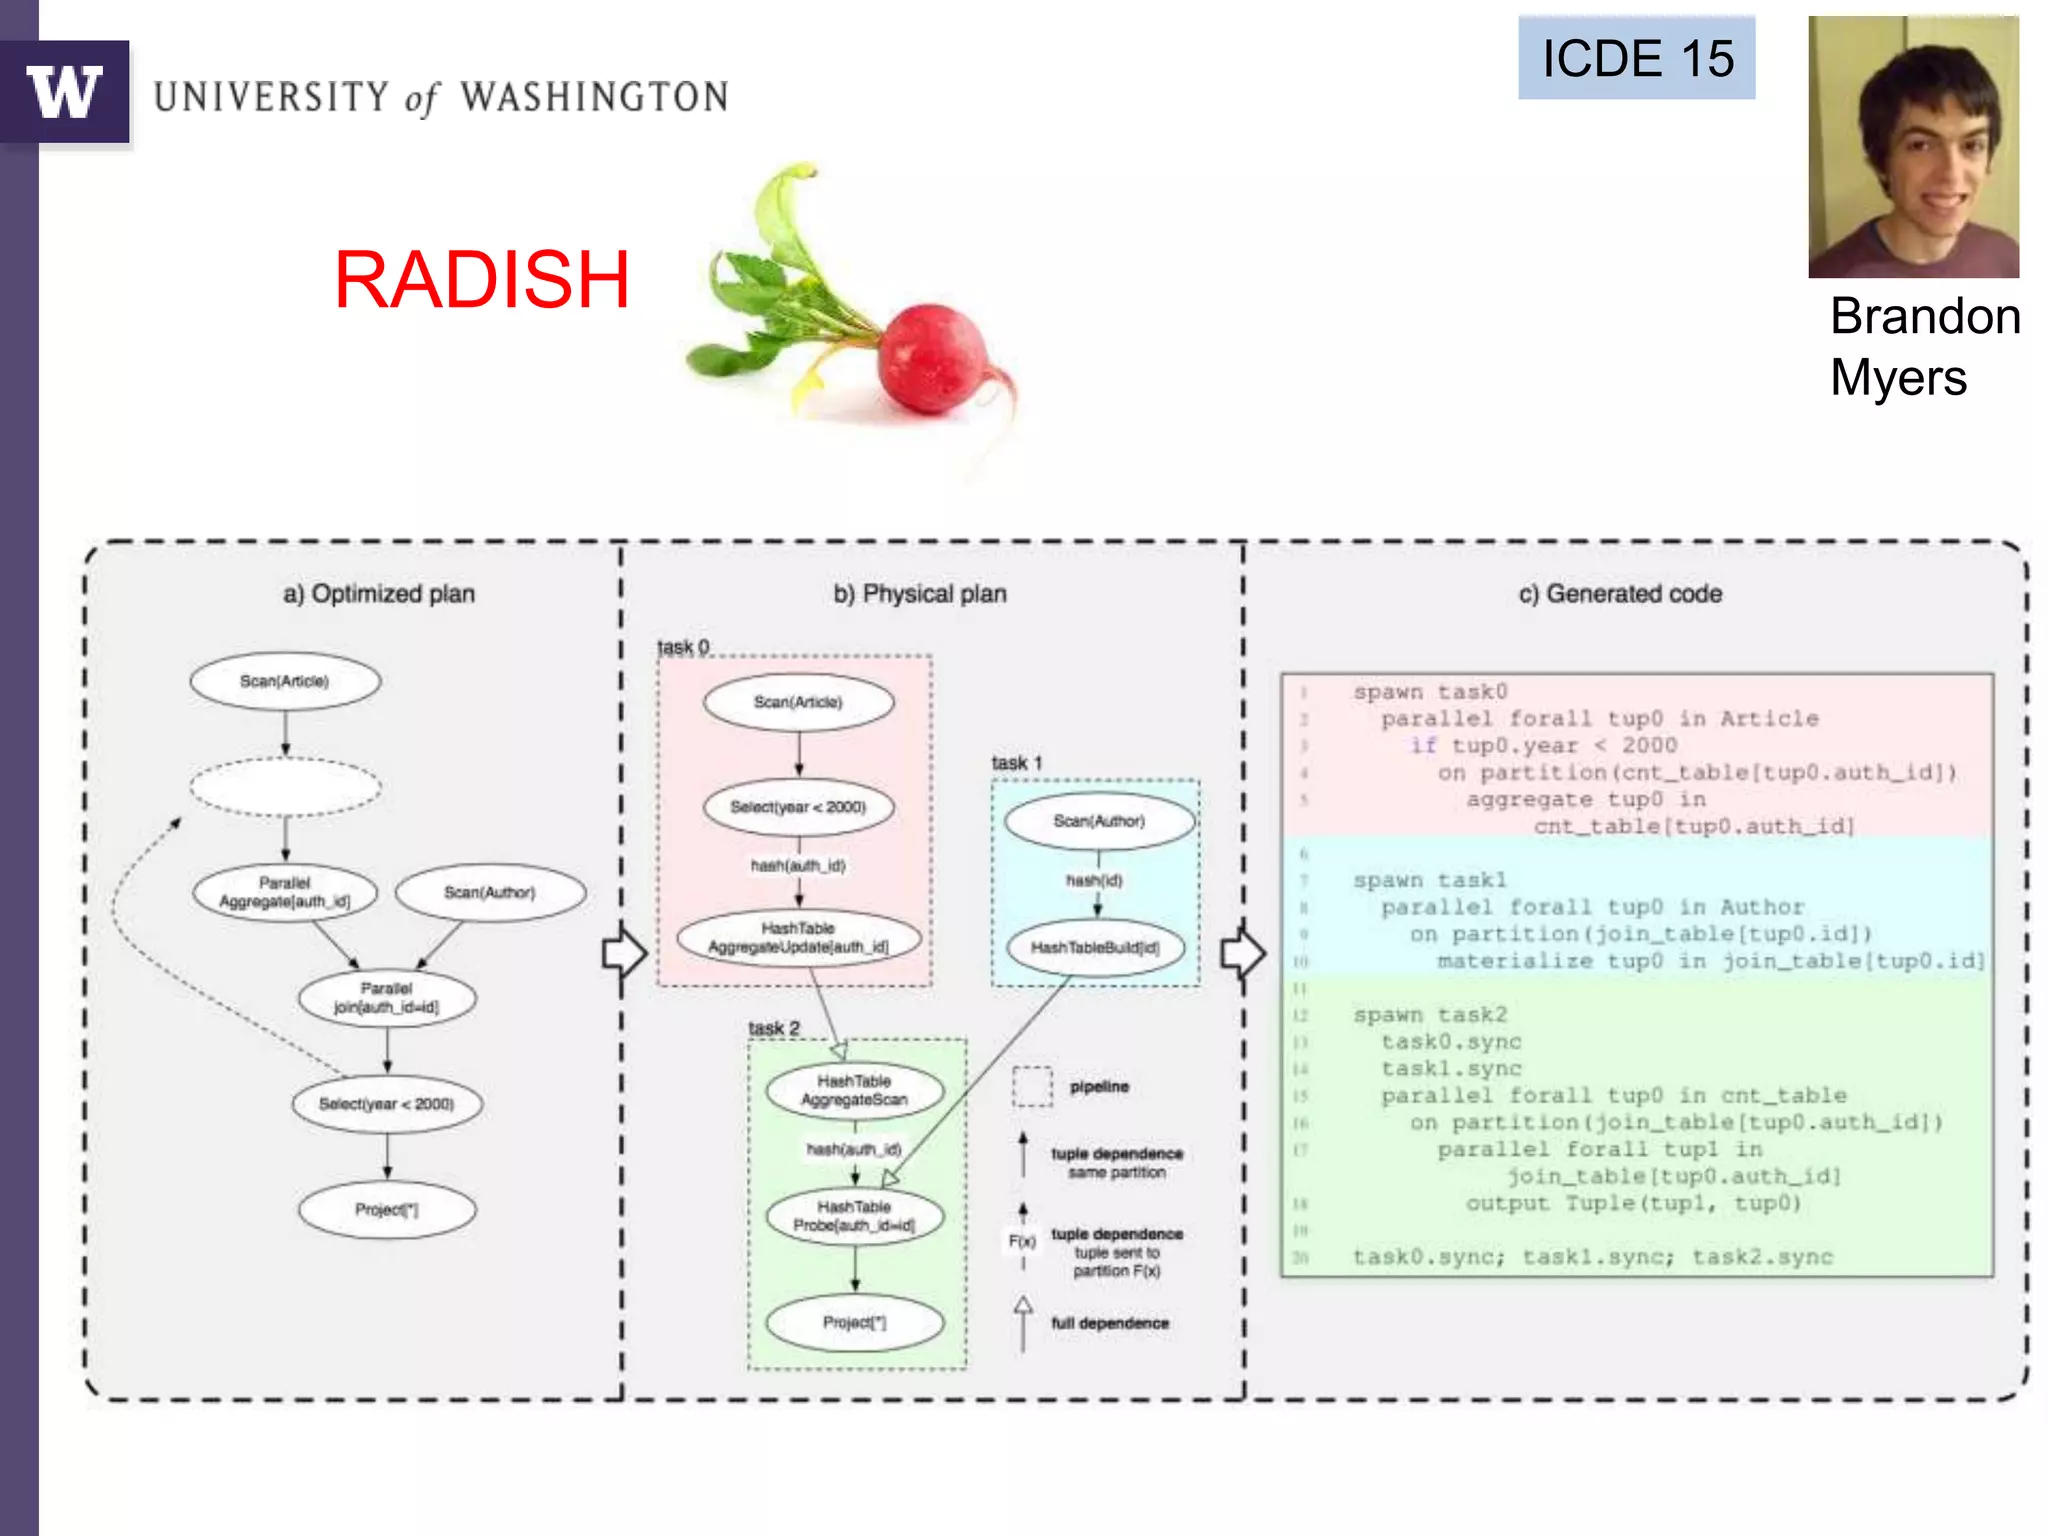
![Query compilation for distributed processing
pipeline
as
parallel
code
parallel compiler
machine
code
[Myers ’14]
pipeline
fragment
code
pipeline
fragment
code
sequential
compiler
machine
code
[Crotty ’14, Li ’14, Seo ’14, Murray ‘11]
sequential
compiler](https://image.slidesharecdn.com/2015highproductivity-151123223456-lva1-app6892/85/The-Other-HPC-High-Productivity-Computing-43-320.jpg)


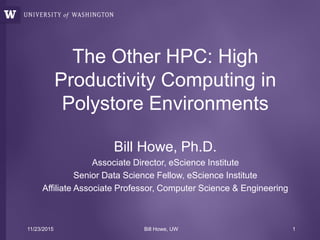
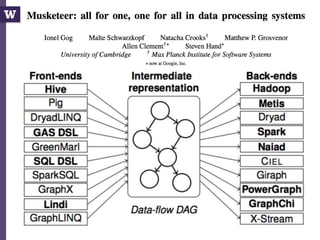
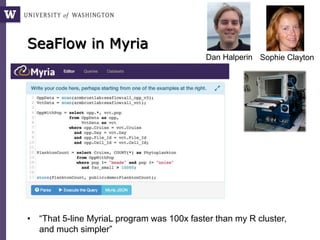
![“[This was hard] due to the large amount of data (e.g. data indexes for data retrieval,
dissection into data blocks and processing steps, order in which steps are performed
to match memory/time requirements, file formats required by software used).
In addition we actually spend quite some time in iterations fixing problems with
certain features (e.g. capping ENCODE data), testing features and feature products
to include, identifying useful test data sets, adjusting the training data (e.g. 1000G vs
human-derived variants)
So roughly 50% of the project was testing and improving the model, 30% figuring out
how to do things (engineering) and 20% getting files and getting them into the right
format.
I guess in total [I spent] 6 months [on this project].”
At least 3 months on issues of
scale, file handling, and feature
extraction.
Martin Kircher,
Genome SciencesWhy?
3k NSF postdocs in 2010
$50k / postdoc
at least 50% overhead
maybe $75M annually
at NSF alone?
Where does the time go? (2)](https://image.slidesharecdn.com/2015highproductivity-151123223456-lva1-app6892/75/The-Other-HPC-High-Productivity-Computing-5-2048.jpg)


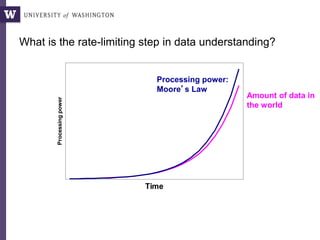
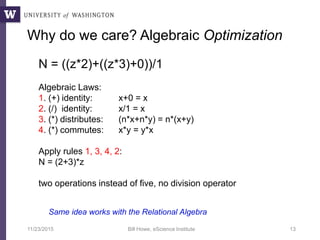
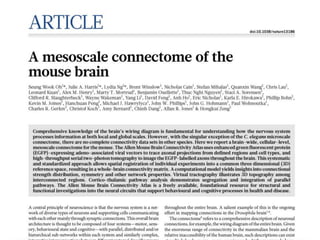
![38
CurGood = SCAN(public:adhoc:sc_points);
DO
mean = [FROM CurGood EMIT val=AVG(v)];
std = [FROM CurGood EMIT val=STDEV(v)];
NewBad = [FROM Good WHERE ABS(Good.v - mean) > 2 * std EMIT *];
CurGood = CurGood - NewBad;
continue = [FROM NewBad EMIT COUNT(NewBad.v) > 0];
WHILE continue;
DUMP(CurGood);
Sigma-clipping, V0](https://image.slidesharecdn.com/2015highproductivity-151123223456-lva1-app6892/75/The-Other-HPC-High-Productivity-Computing-35-2048.jpg)
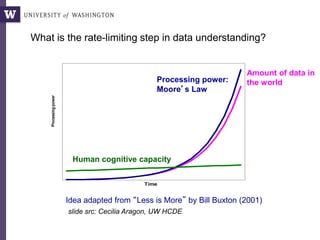
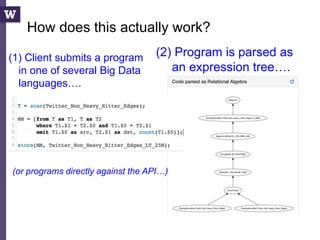
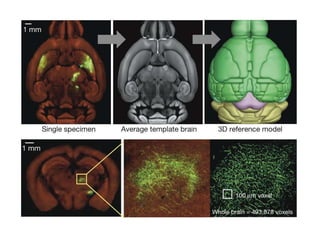
![39
CurGood = P
sum = [FROM CurGood EMIT SUM(val)];
sumsq = [FROM CurGood EMIT SUM(val*val)]
cnt = [FROM CurGood EMIT CNT(*)];
NewBad = []
DO
sum = sum – [FROM NewBad EMIT SUM(val)];
sumsq = sum – [FROM NewBad EMIT SUM(val*val)];
cnt = sum - [FROM NewBad EMIT CNT(*)];
mean = sum / cnt
std = sqrt(1/(cnt*(cnt-1)) * (cnt * sumsq - sum*sum))
NewBad = FILTER([ABS(val-mean)>std], CurGood)
CurGood = CurGood - NewBad
WHILE NewBad != {}
Sigma-clipping, V1: Incremental](https://image.slidesharecdn.com/2015highproductivity-151123223456-lva1-app6892/75/The-Other-HPC-High-Productivity-Computing-36-2048.jpg)
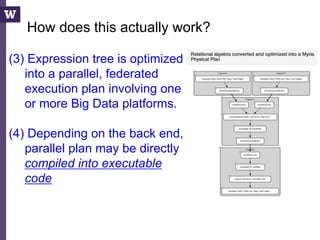
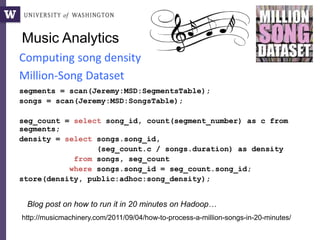
![40
Points = SCAN(public:adhoc:sc_points);
aggs = [FROM Points EMIT _sum=SUM(v), sumsq=SUM(v*v), cnt=COUNT(v)];
newBad = []
bounds = [FROM Points EMIT lower=MIN(v), upper=MAX(v)];
DO
new_aggs = [FROM newBad EMIT _sum=SUM(v), sumsq=SUM(v*v), cnt=COUNT(v)];
aggs = [FROM aggs, new_aggs EMIT _sum=aggs._sum - new_aggs._sum,
sumsq=aggs.sumsq - new_aggs.sumsq, cnt=aggs.cnt - new_aggs.cnt];
stats = [FROM aggs EMIT mean=_sum/cnt,
std=SQRT(1.0/(cnt*(cnt-1)) * (cnt * sumsq - _sum * _sum))];
newBounds = [FROM stats EMIT lower=mean - 2 * std, upper=mean + 2 * std];
tooLow = [FROM Points, bounds, newBounds WHERE newBounds.lower > v
AND v >= bounds.lower EMIT v=Points.v];
tooHigh = [FROM Points, bounds, newBounds WHERE newBounds.upper < v
AND v <= bounds.upper EMIT v=Points.v];
newBad = UNIONALL(tooLow, tooHigh);
bounds = newBounds;
continue = [FROM newBad EMIT COUNT(v) > 0];
WHILE continue;
output = [FROM Points, bounds WHERE Points.v > bounds.lower AND
Points.v < bounds.upper EMIT v=Points.v];
DUMP(output);
Sigma-clipping, V2](https://image.slidesharecdn.com/2015highproductivity-151123223456-lva1-app6892/75/The-Other-HPC-High-Productivity-Computing-37-2048.jpg)


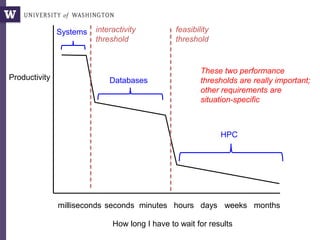
![Query compilation for distributed processing
pipeline
as
parallel
code
parallel compiler
machine
code
[Myers ’14]
pipeline
fragment
code
pipeline
fragment
code
sequential
compiler
machine
code
[Crotty ’14, Li ’14, Seo ’14, Murray ‘11]
sequential
compiler](https://image.slidesharecdn.com/2015highproductivity-151123223456-lva1-app6892/75/The-Other-HPC-High-Productivity-Computing-43-2048.jpg)

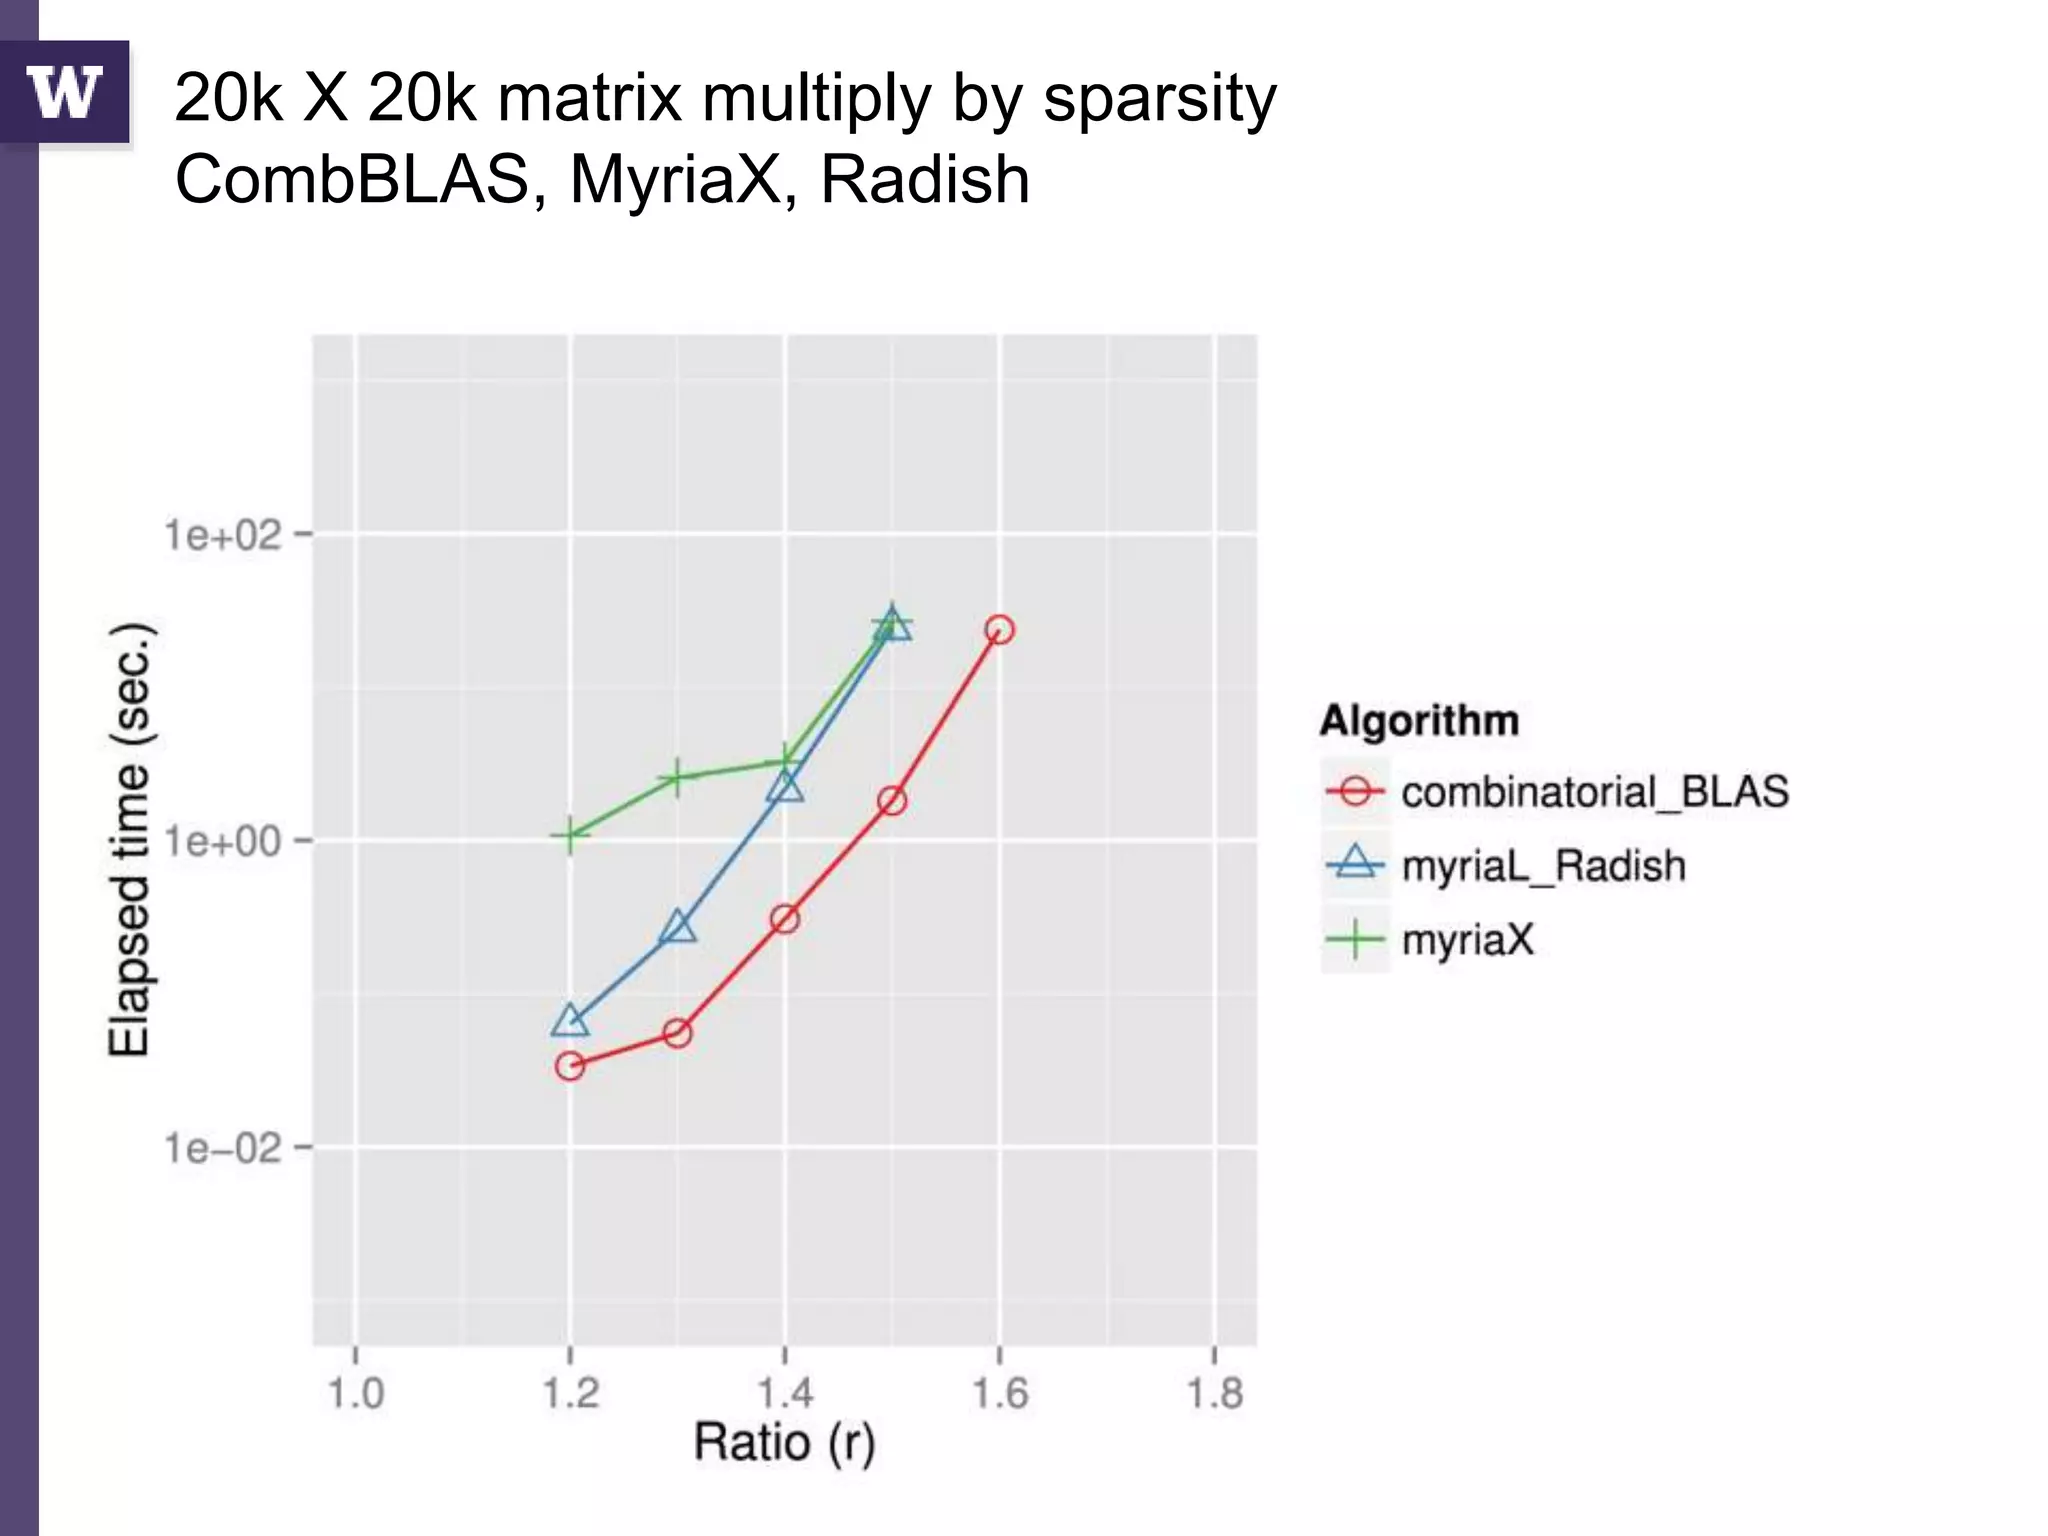
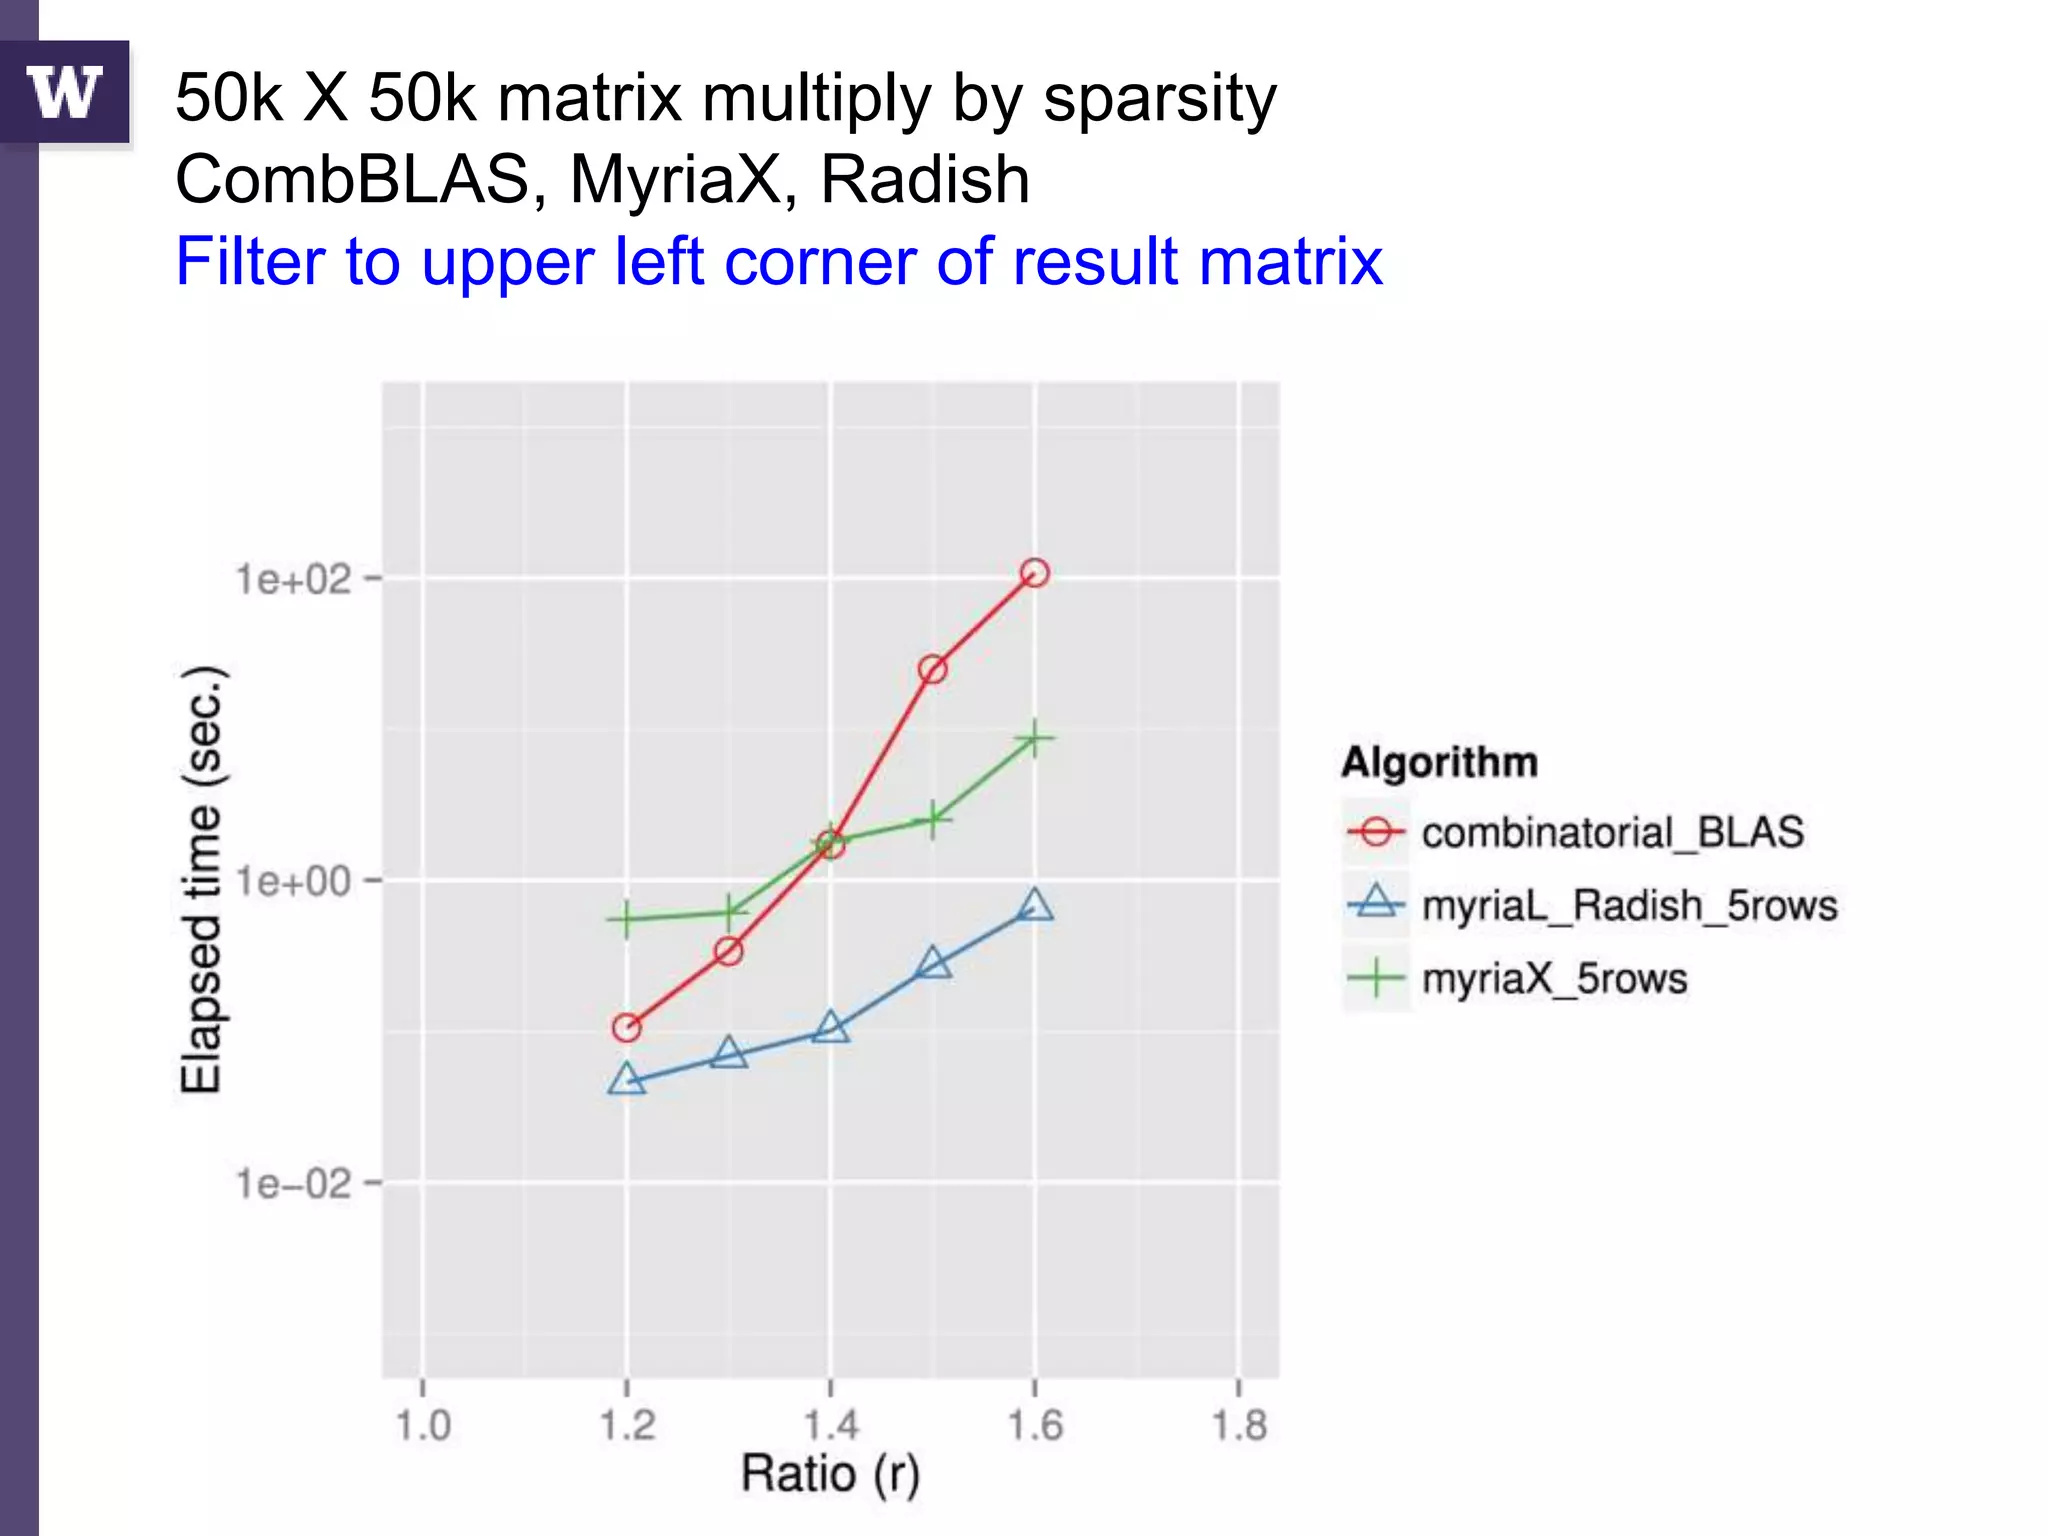


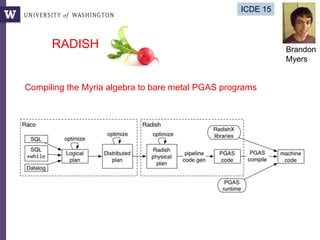
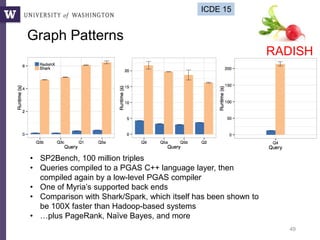
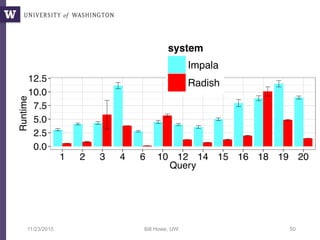
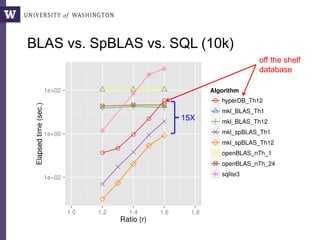
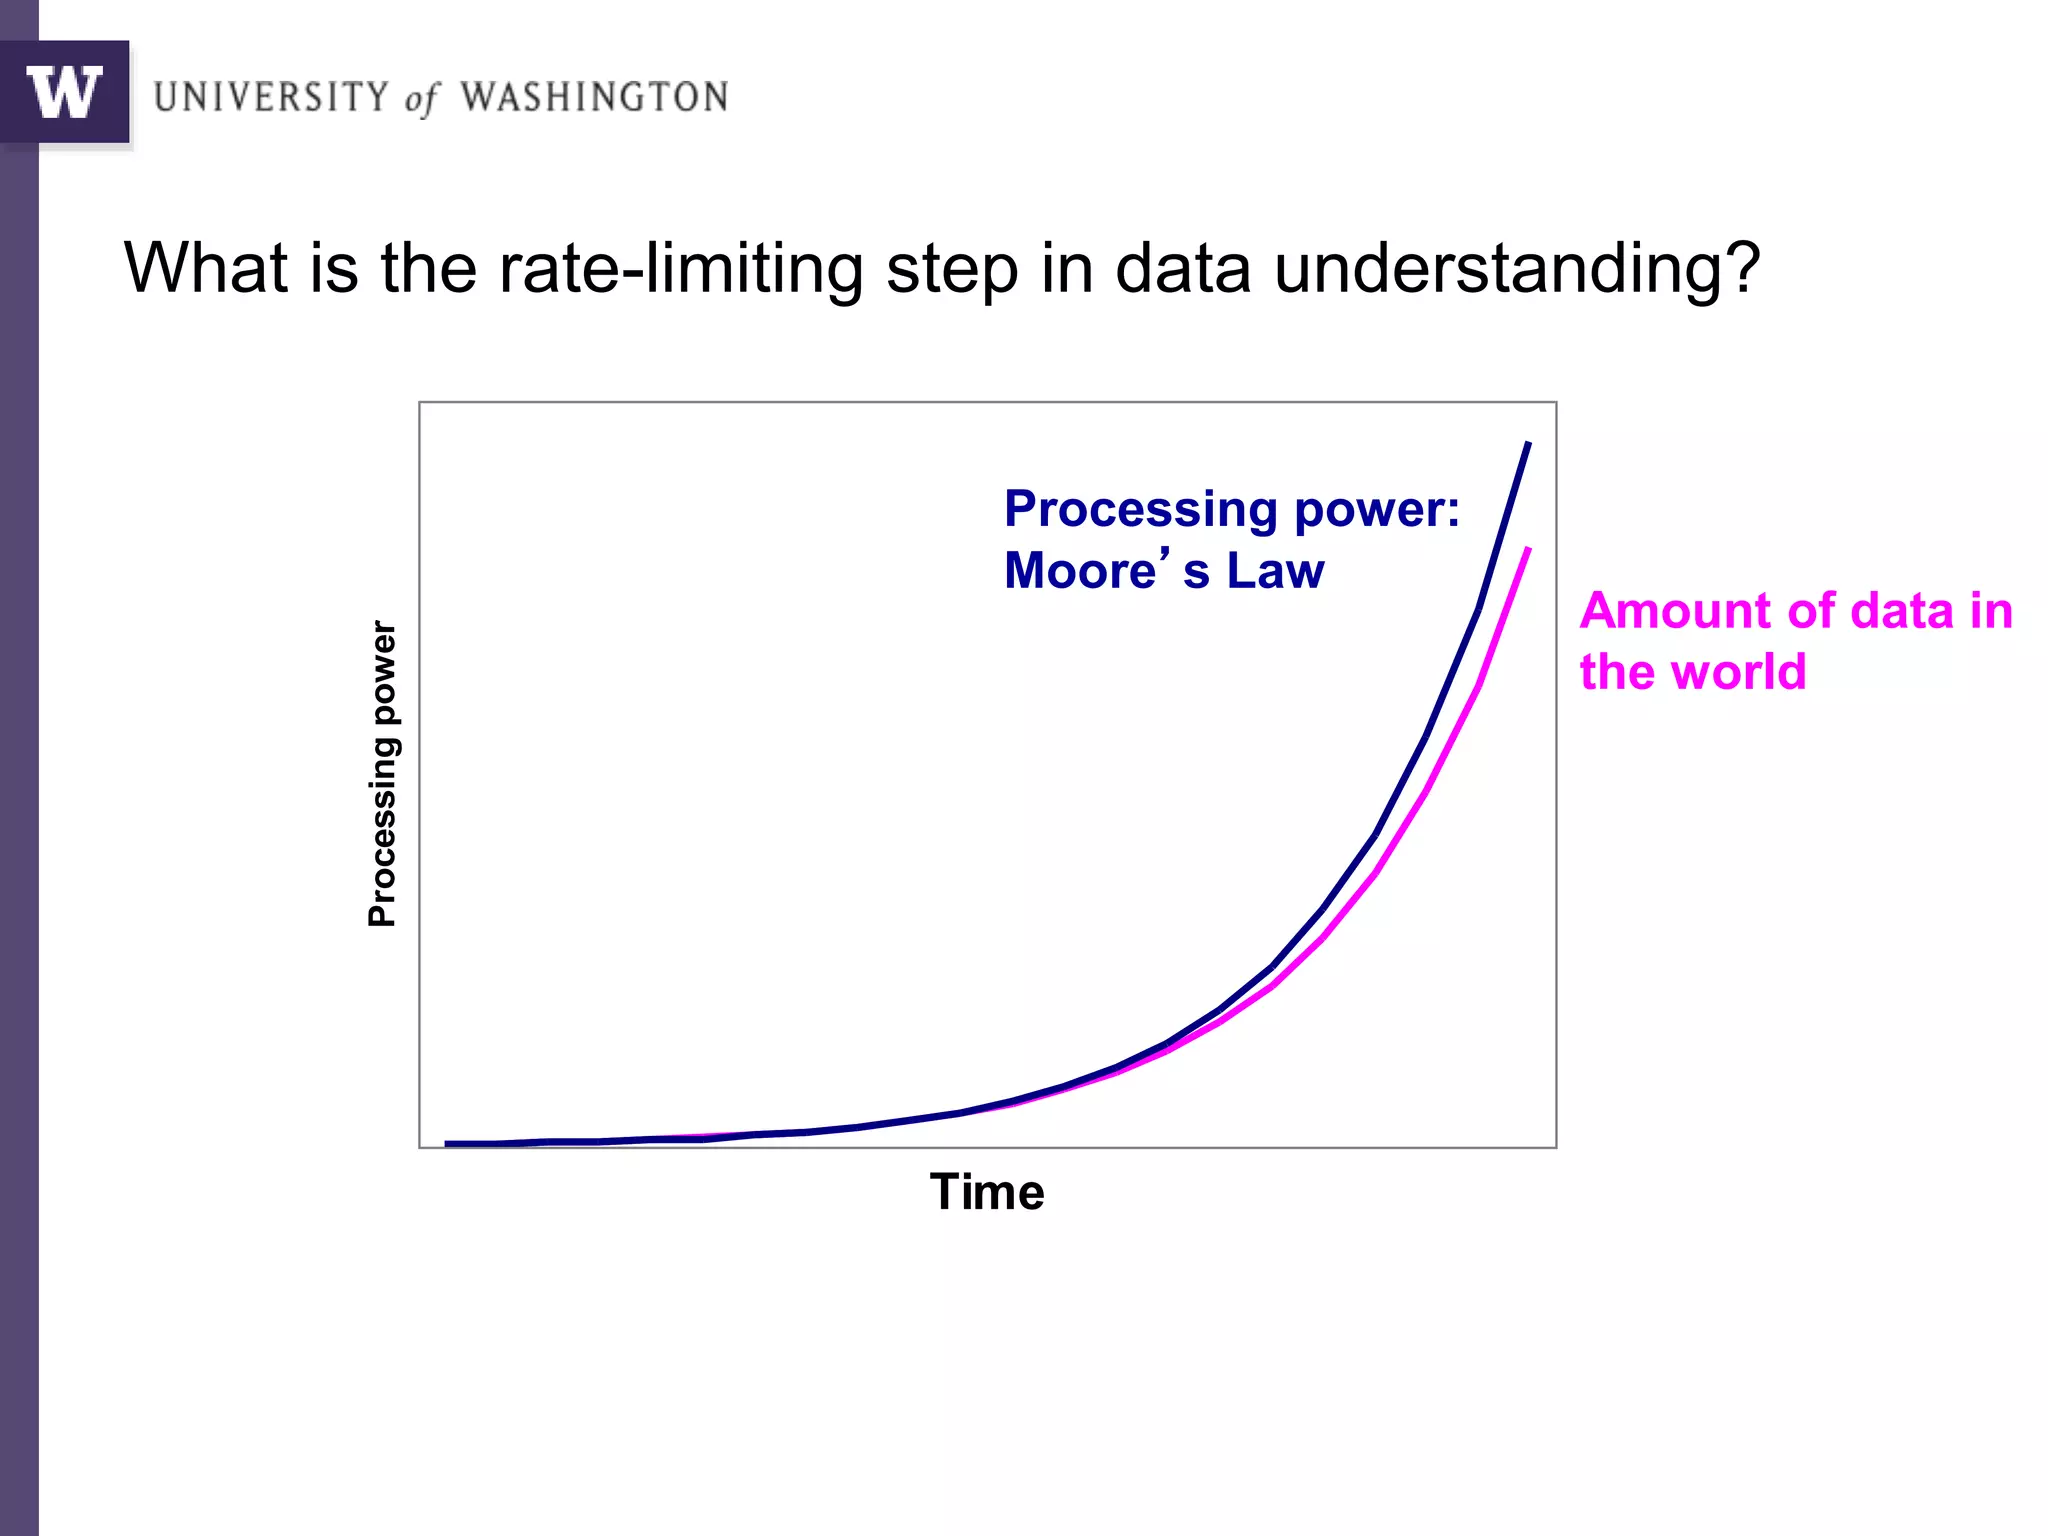
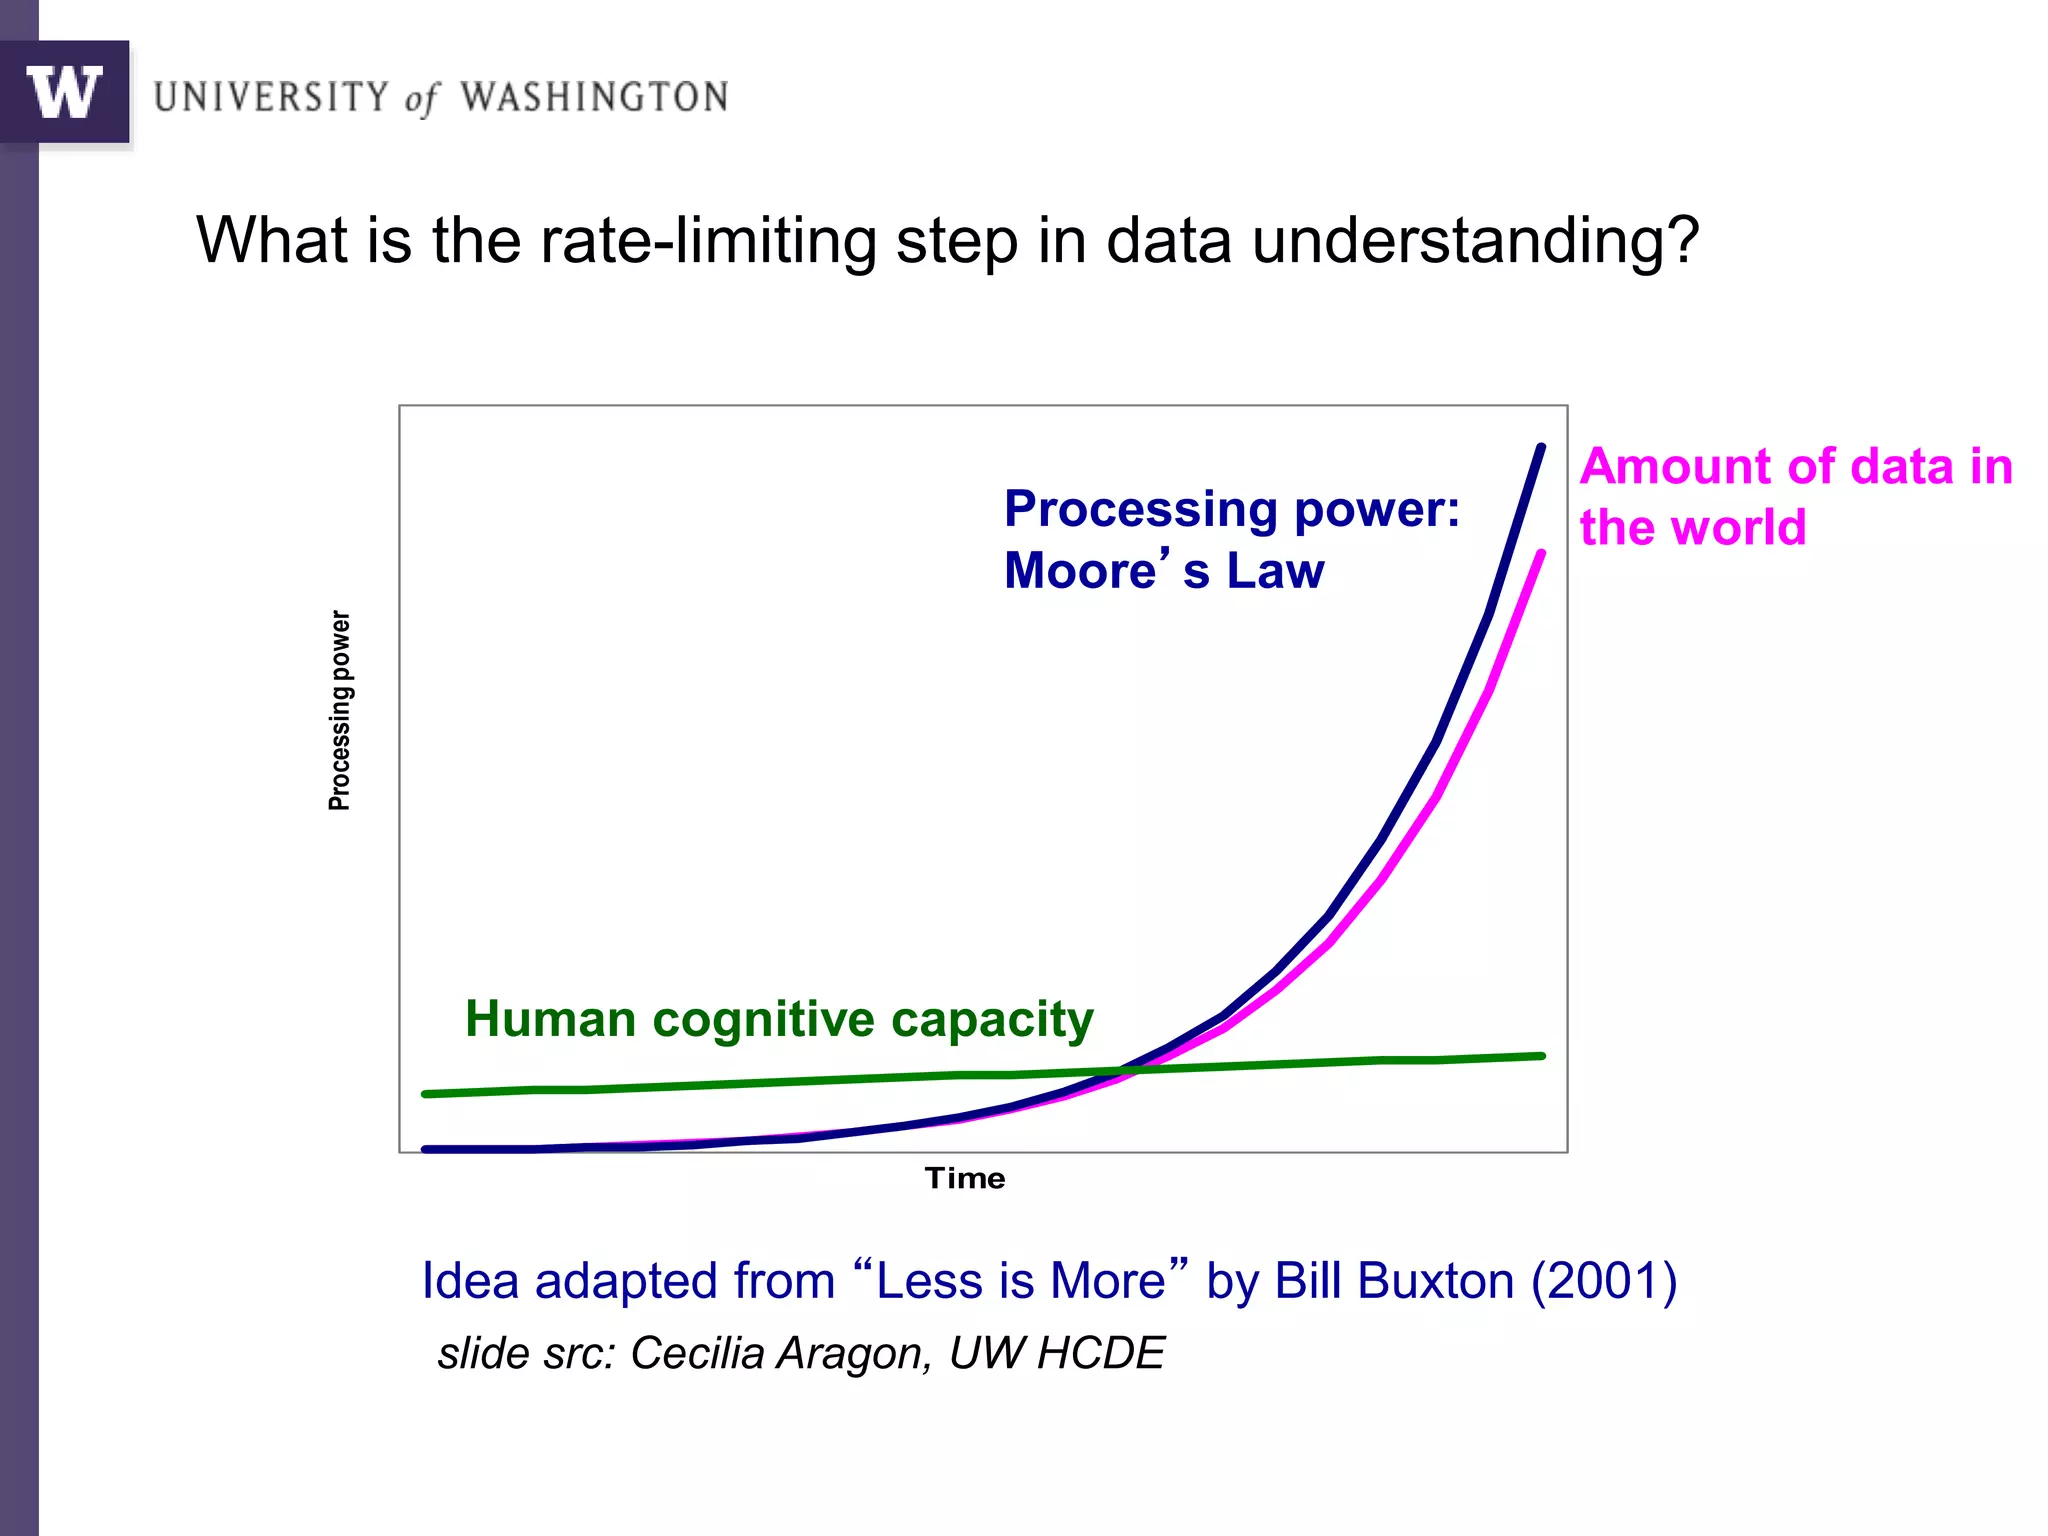
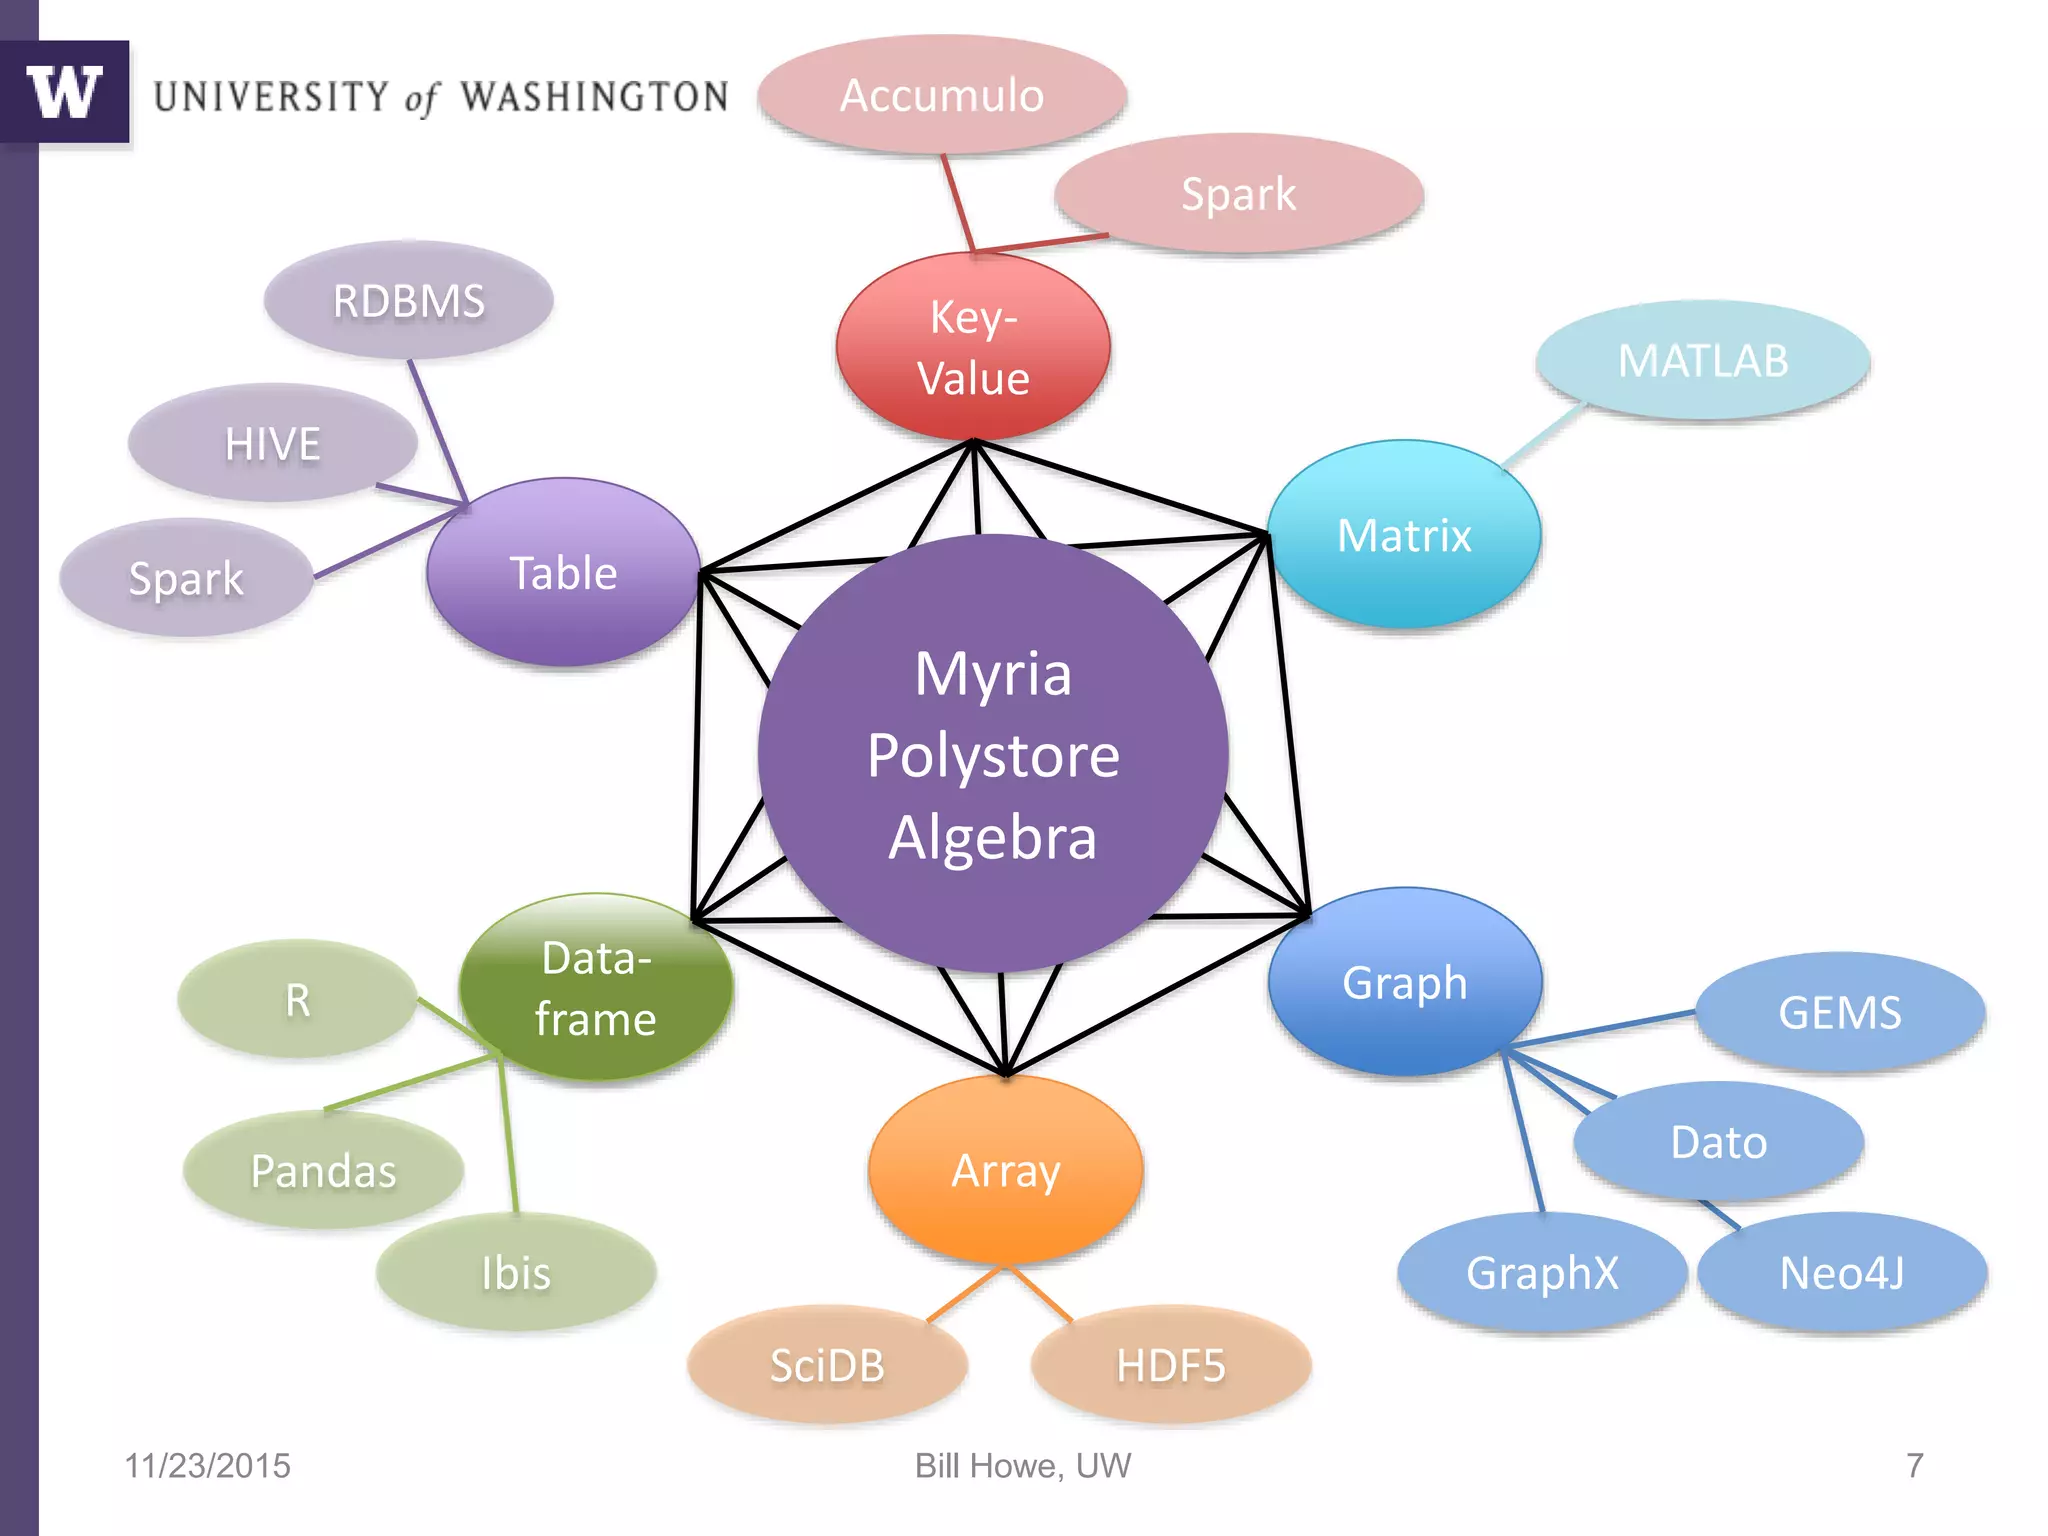
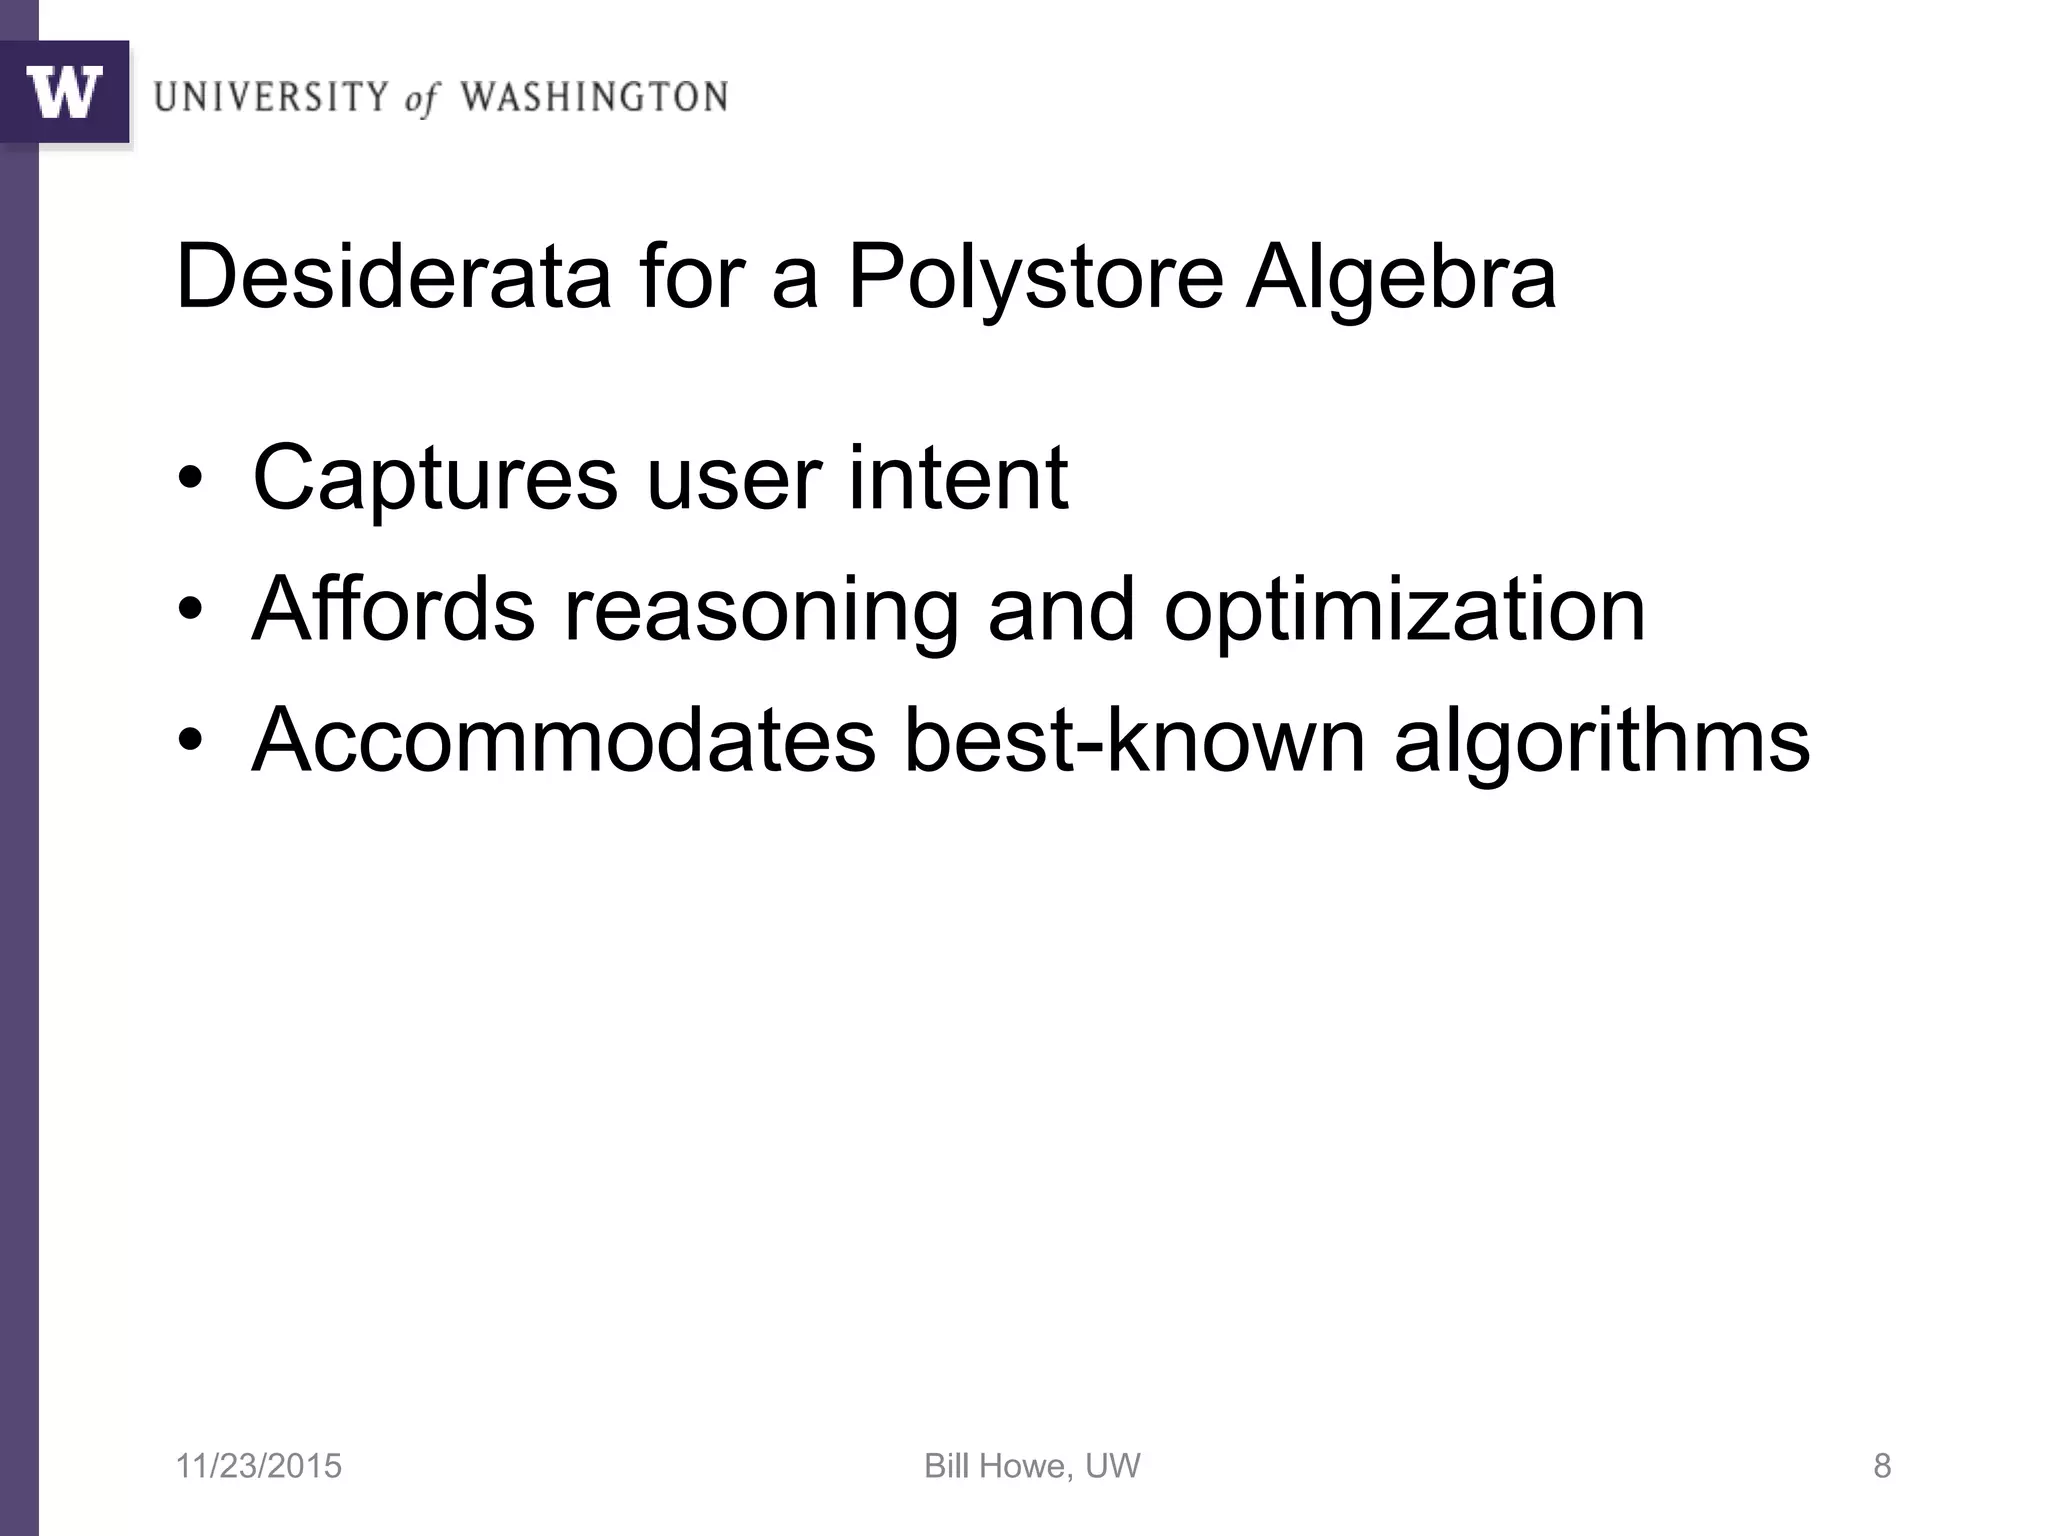
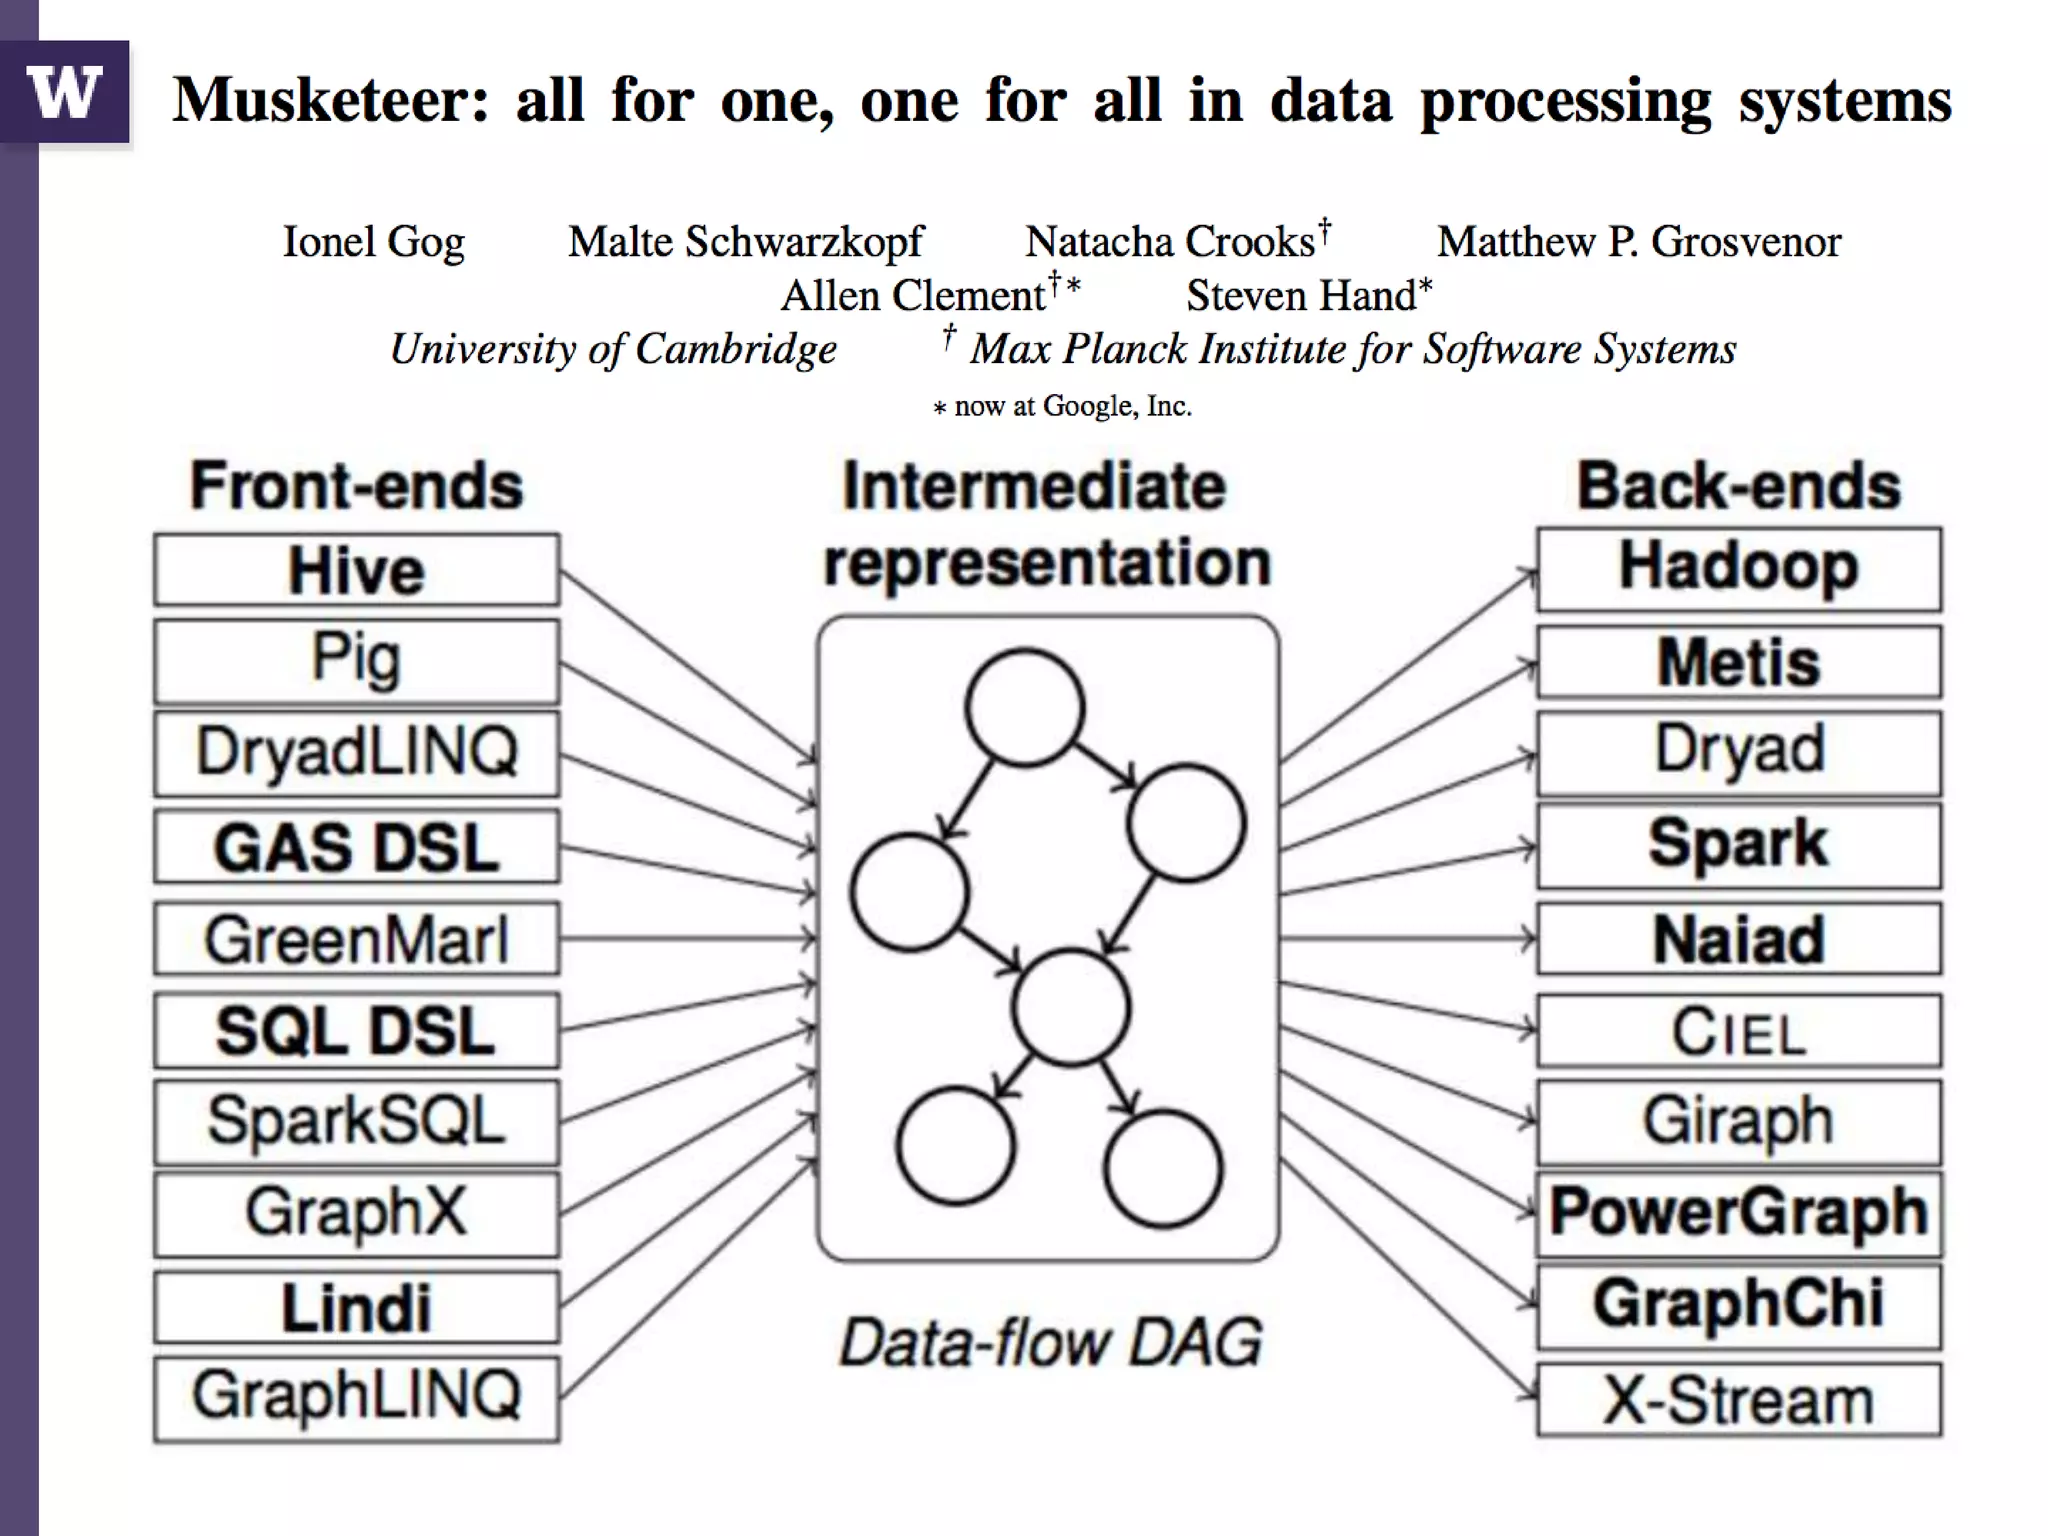
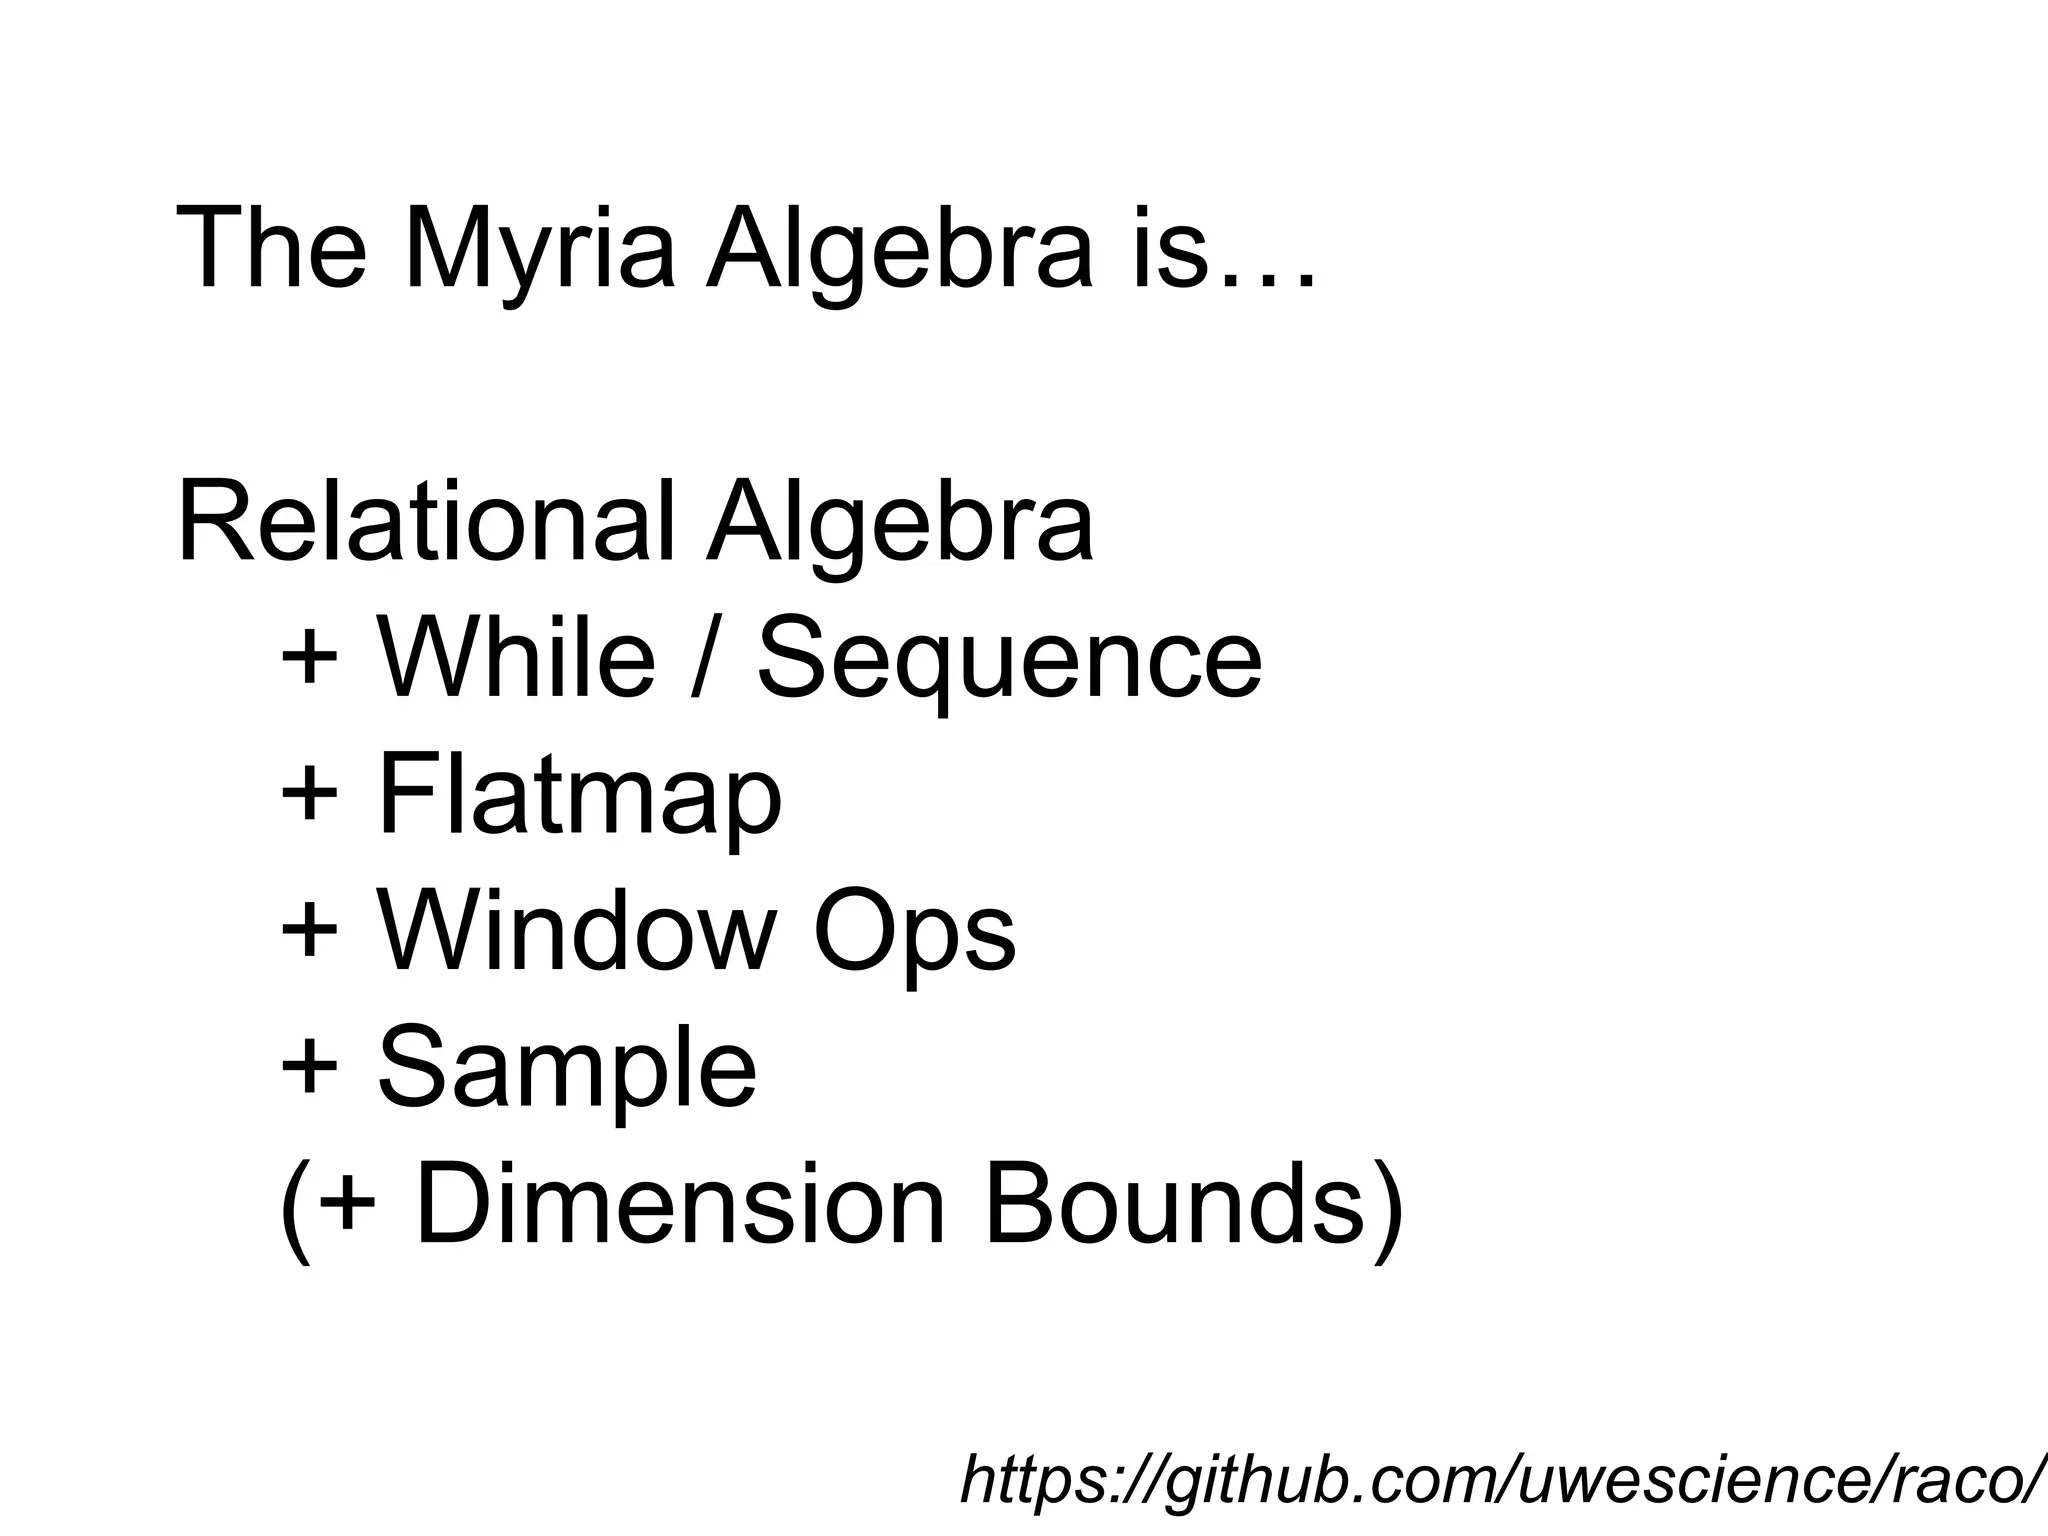
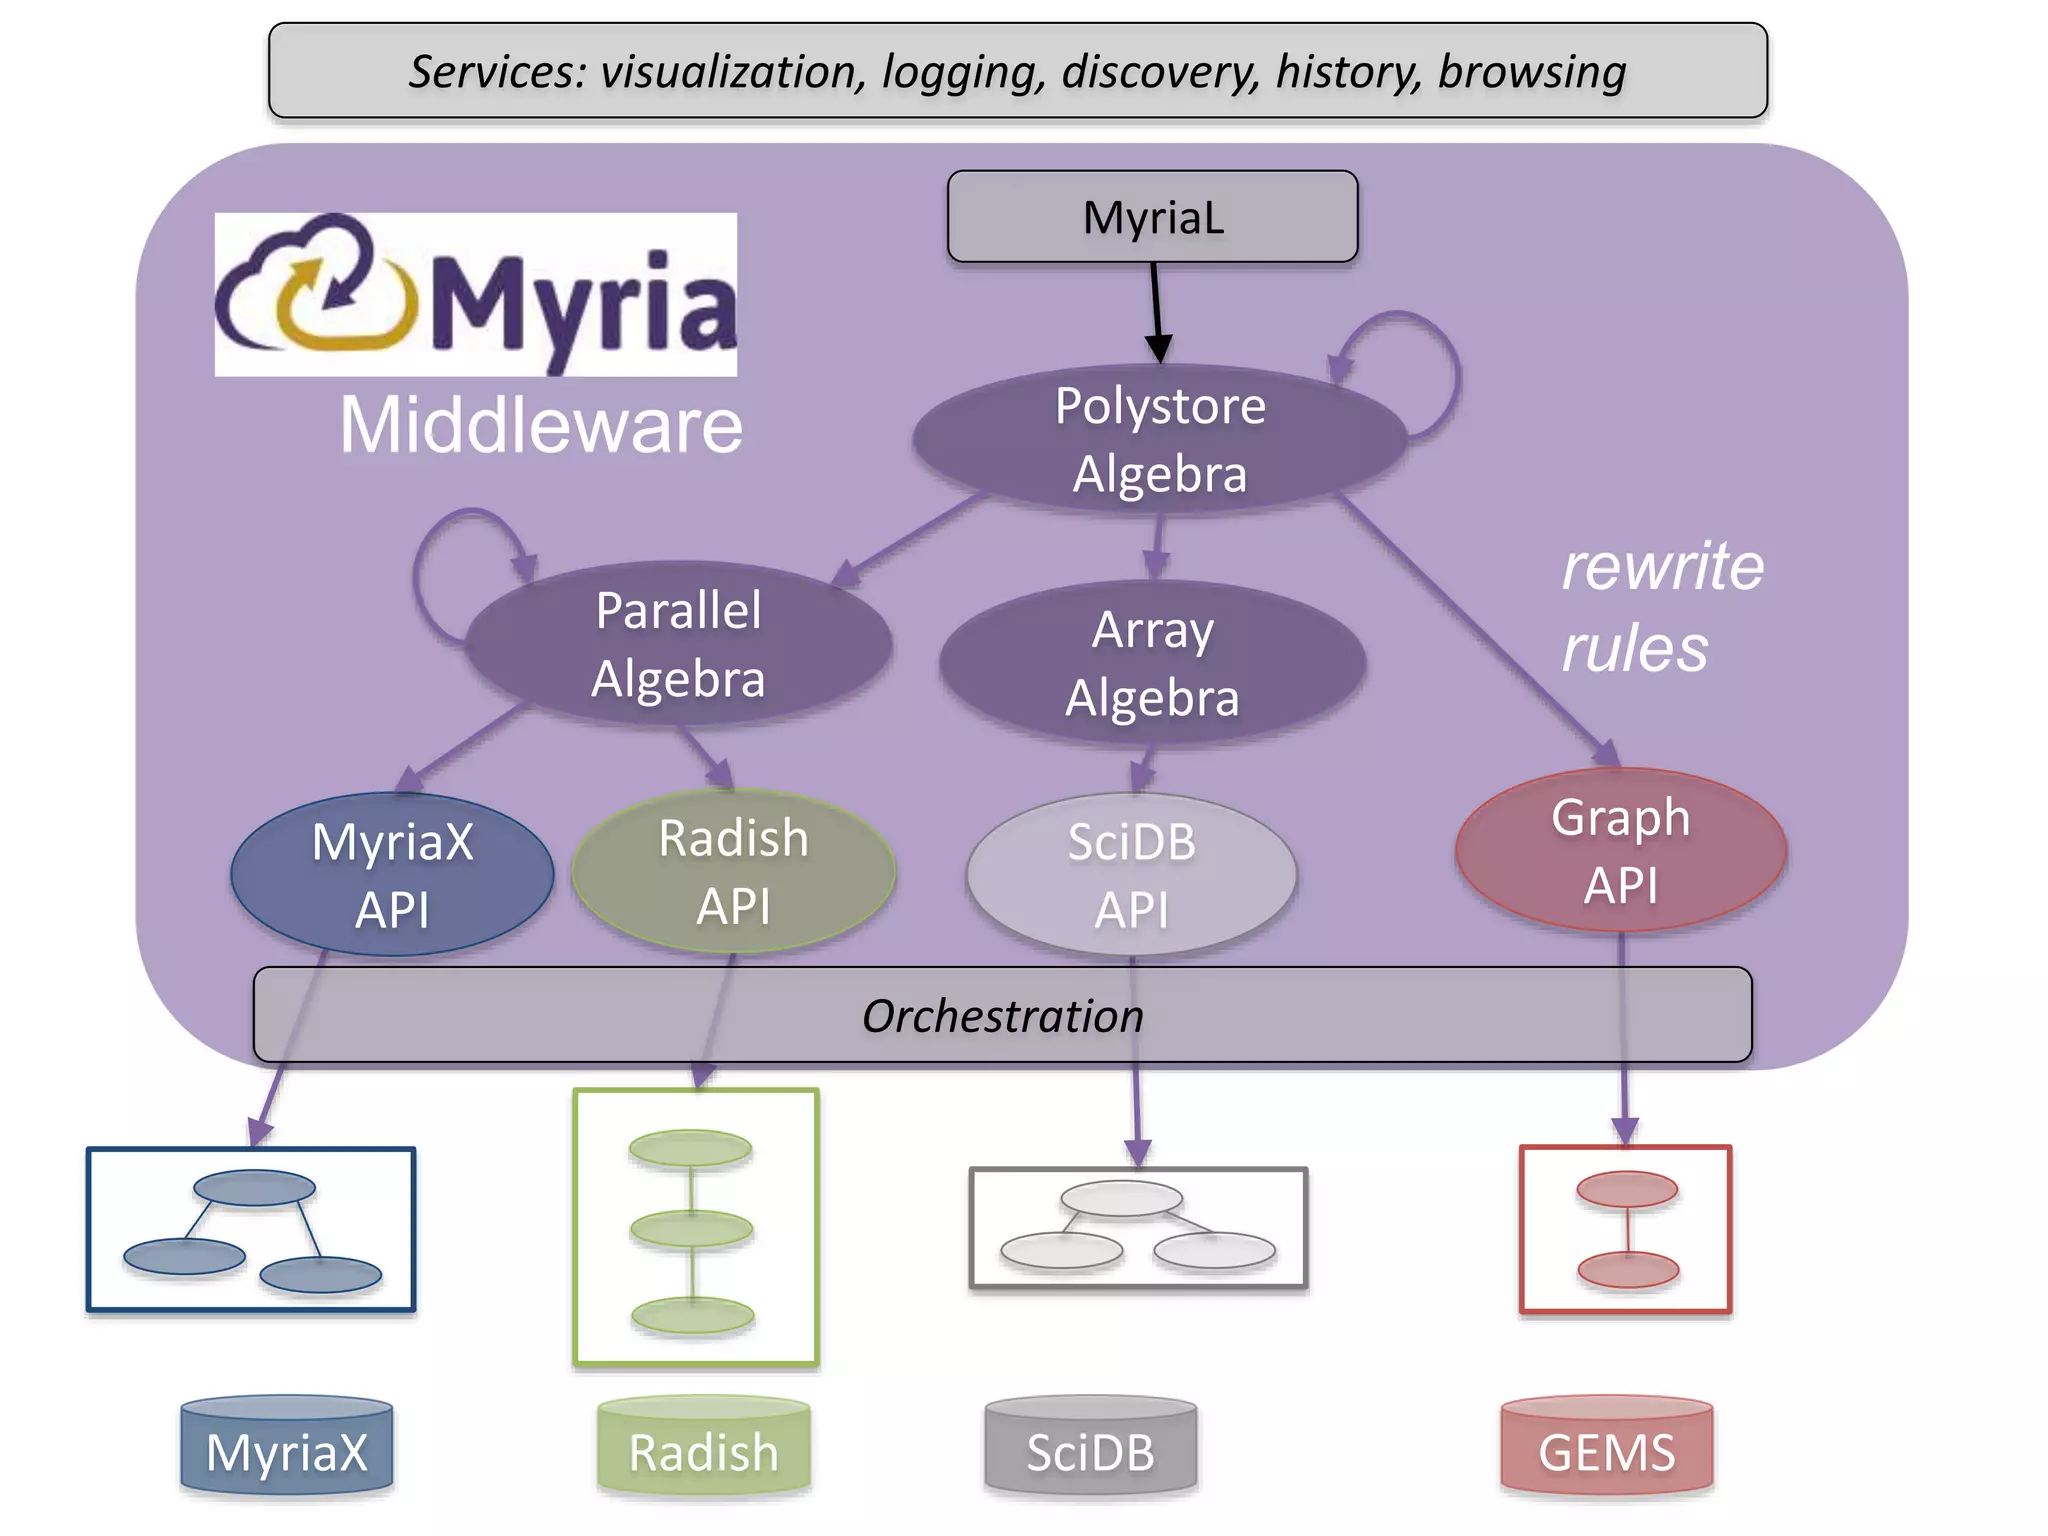
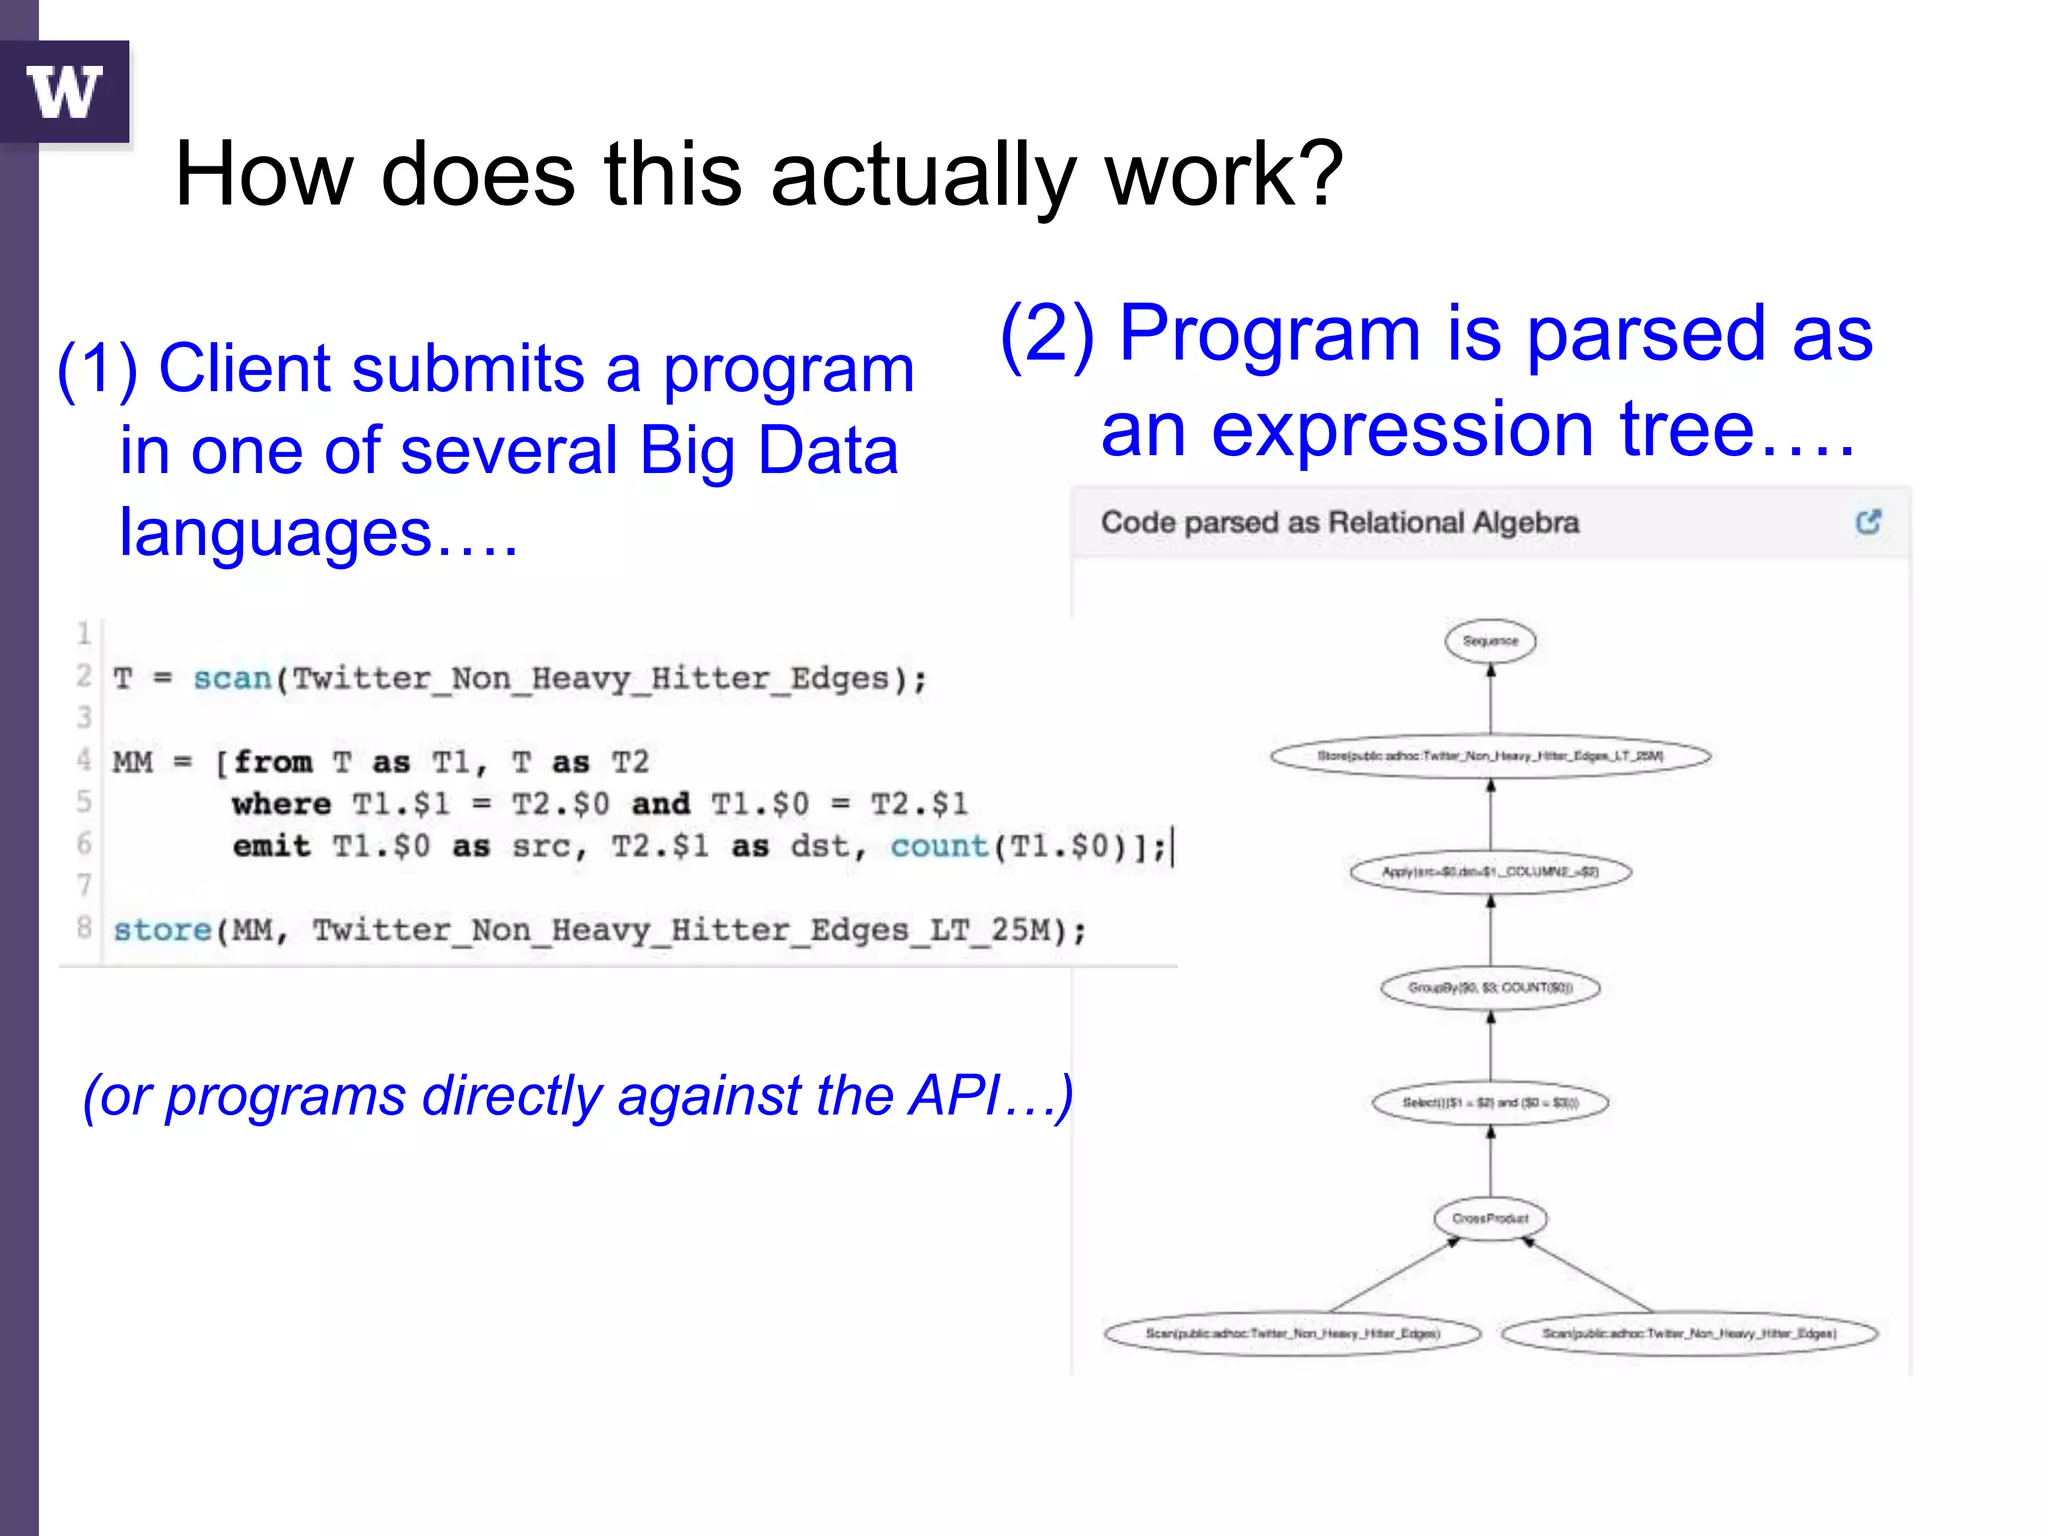
The document discusses high productivity computing in polystore environments, emphasizing the challenges and efficiencies in data handling and processing. It highlights the importance of optimizing data algebra and workflows across various systems for scientific research, detailing the implementation and advantages of polystore algebra. Additionally, the text presents various applications and performance comparisons of data processing techniques in big data environments.


![Matrix and determinant URT [Autosaved].pptx](https://cdn.slidesharecdn.com/ss_thumbnails/matrixanddeterminanturtautosaved-251018190340-9e6a6deb-thumbnail.jpg?width=600ounds&width=560&fit=bounds)


![RTP_AR_Basic_Learners' Workbook_KS2 [FOR REPRODUCTION] (1).pdf](https://cdn.slidesharecdn.com/ss_thumbnails/rtparbasiclearnersworkbookks2forreproduction1-251016024943-e51a16ac-thumbnail.jpg?width=600ounds&width=560&fit=bounds)


