Data Science
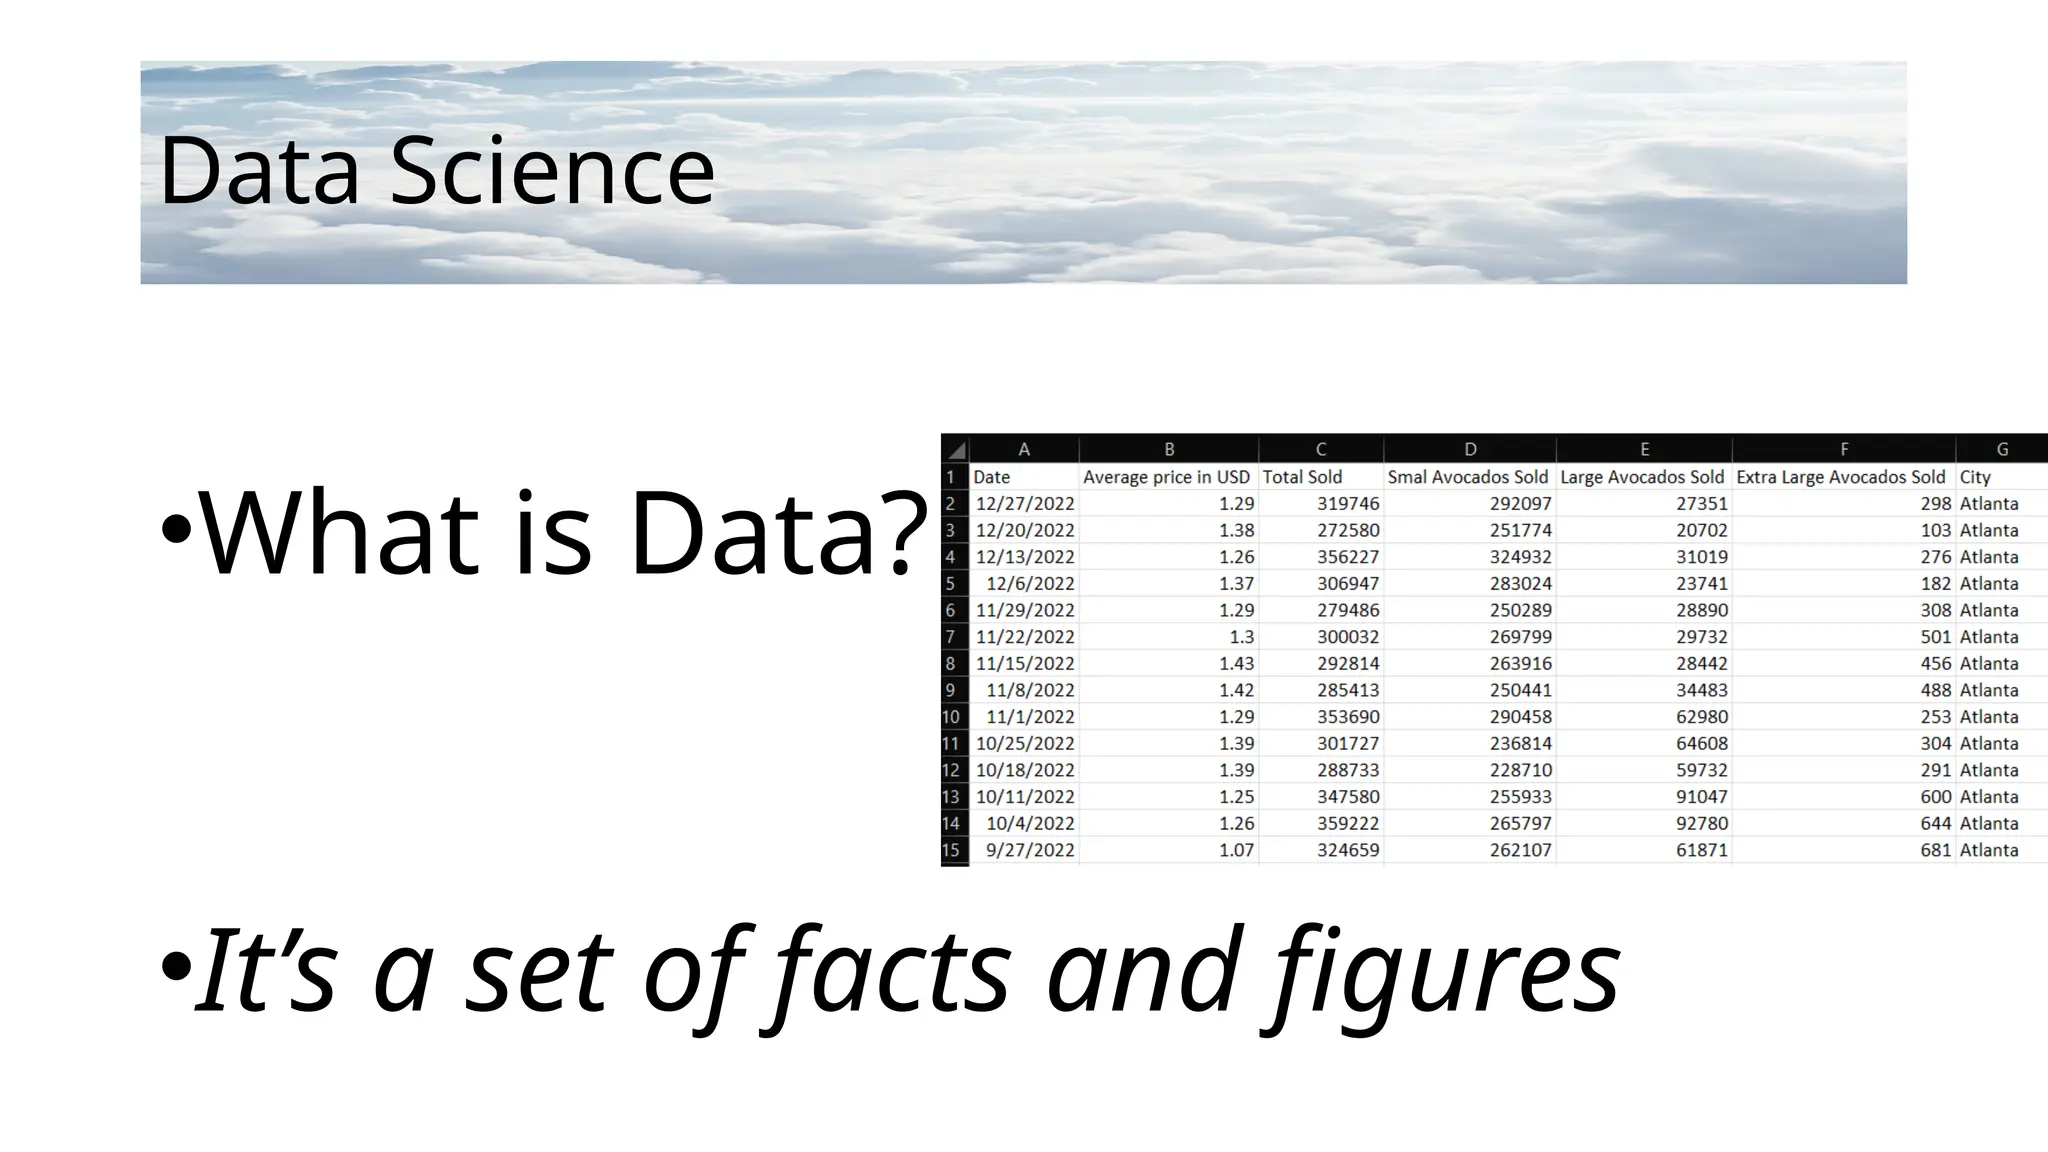
•Data scienceis…
•“the science of Data” (!)
• Cao, L. (2017) Data science: a comprehensive overview. ACM Computing
Surveys (CSUR), 50(3), pp.1-42.
Data Science
•OK, sowhat is Data Science?
•Extracting insight and information from
data sets to make better decisions.
• Kelleher, J.D., Tierney, B. (2018) Data Science. MIT press.
6.
Data Science
•There isa (possibly apocryphal) story that
is often used to illustrate data mining, and
it’s called the “Beers and Nappies” story.
7.
Data Science
•The storygoes that a large American
supermarket, usually it’s Walmart, was
exploring its sales data from their cash
registers. The data is stored one customer’s
purchase after another, but when the
supermarket mined the dataset, they looked
at each product to see if it is commonly
associated with any other products.
8.
Data Science
•They foundan unexpected pattern
between the purchase of beers and the
purchase of nappies. The supermarket
starting to place those two products right
beside each other on the supermarket
floor and they made lots of money.
9.
Data Science
•The explanationfor the association between
the products could not be deduced from the
dataset, but the cashiers explain that if a
couple with a baby have one partner at home
minding the baby, and one going to work; the
partner who is going to work will pop into the
supermarket after work to buy some nappies,
and will decide that they need to get
themselves some beers as well ;-)
10.
Data Science: Statistics
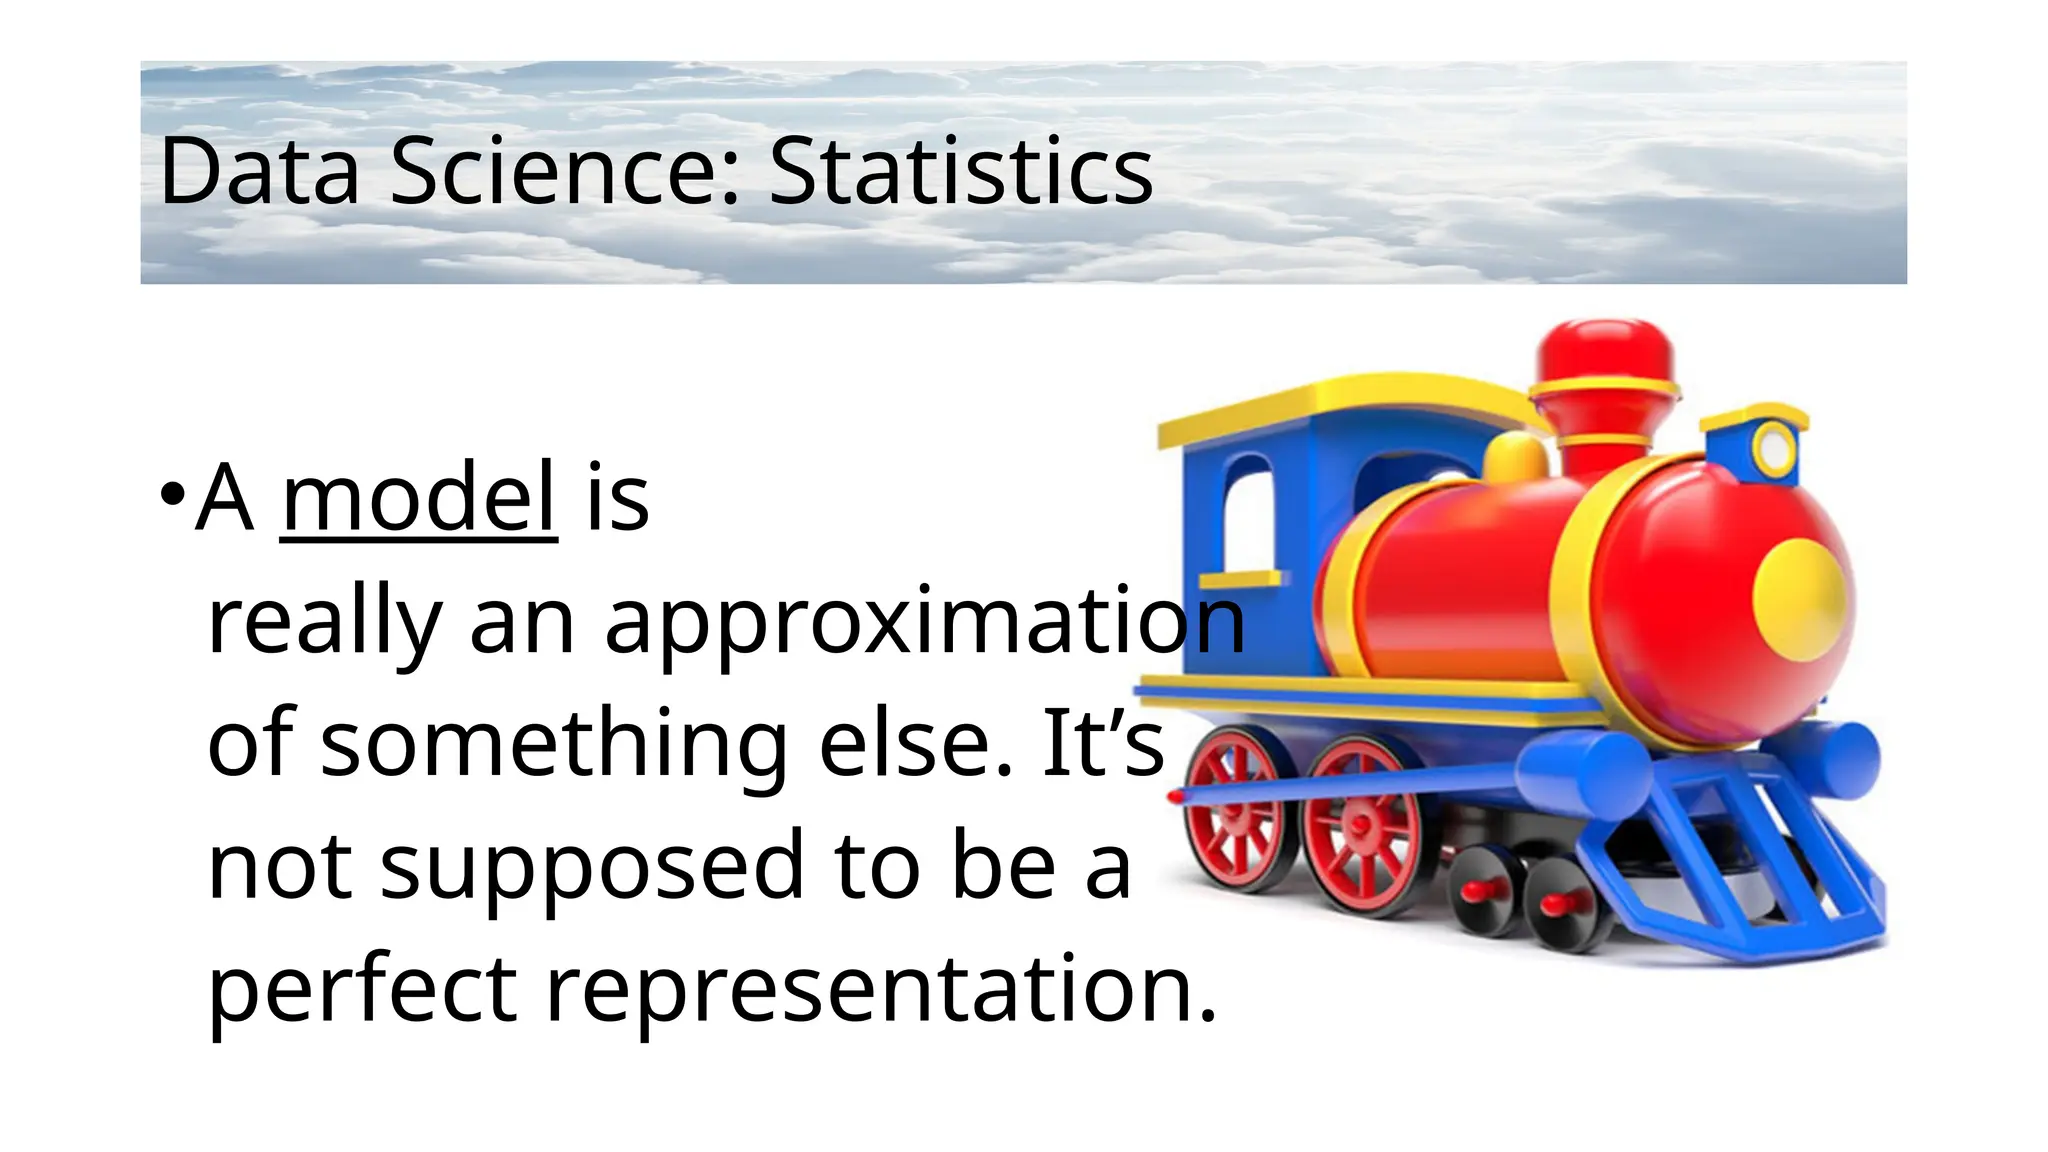
•Amodel is
really an approximation
of something else. It’s
not supposed to be a
perfect representation.
11.
Data Science: Statistics
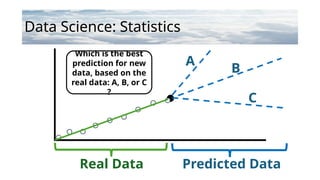
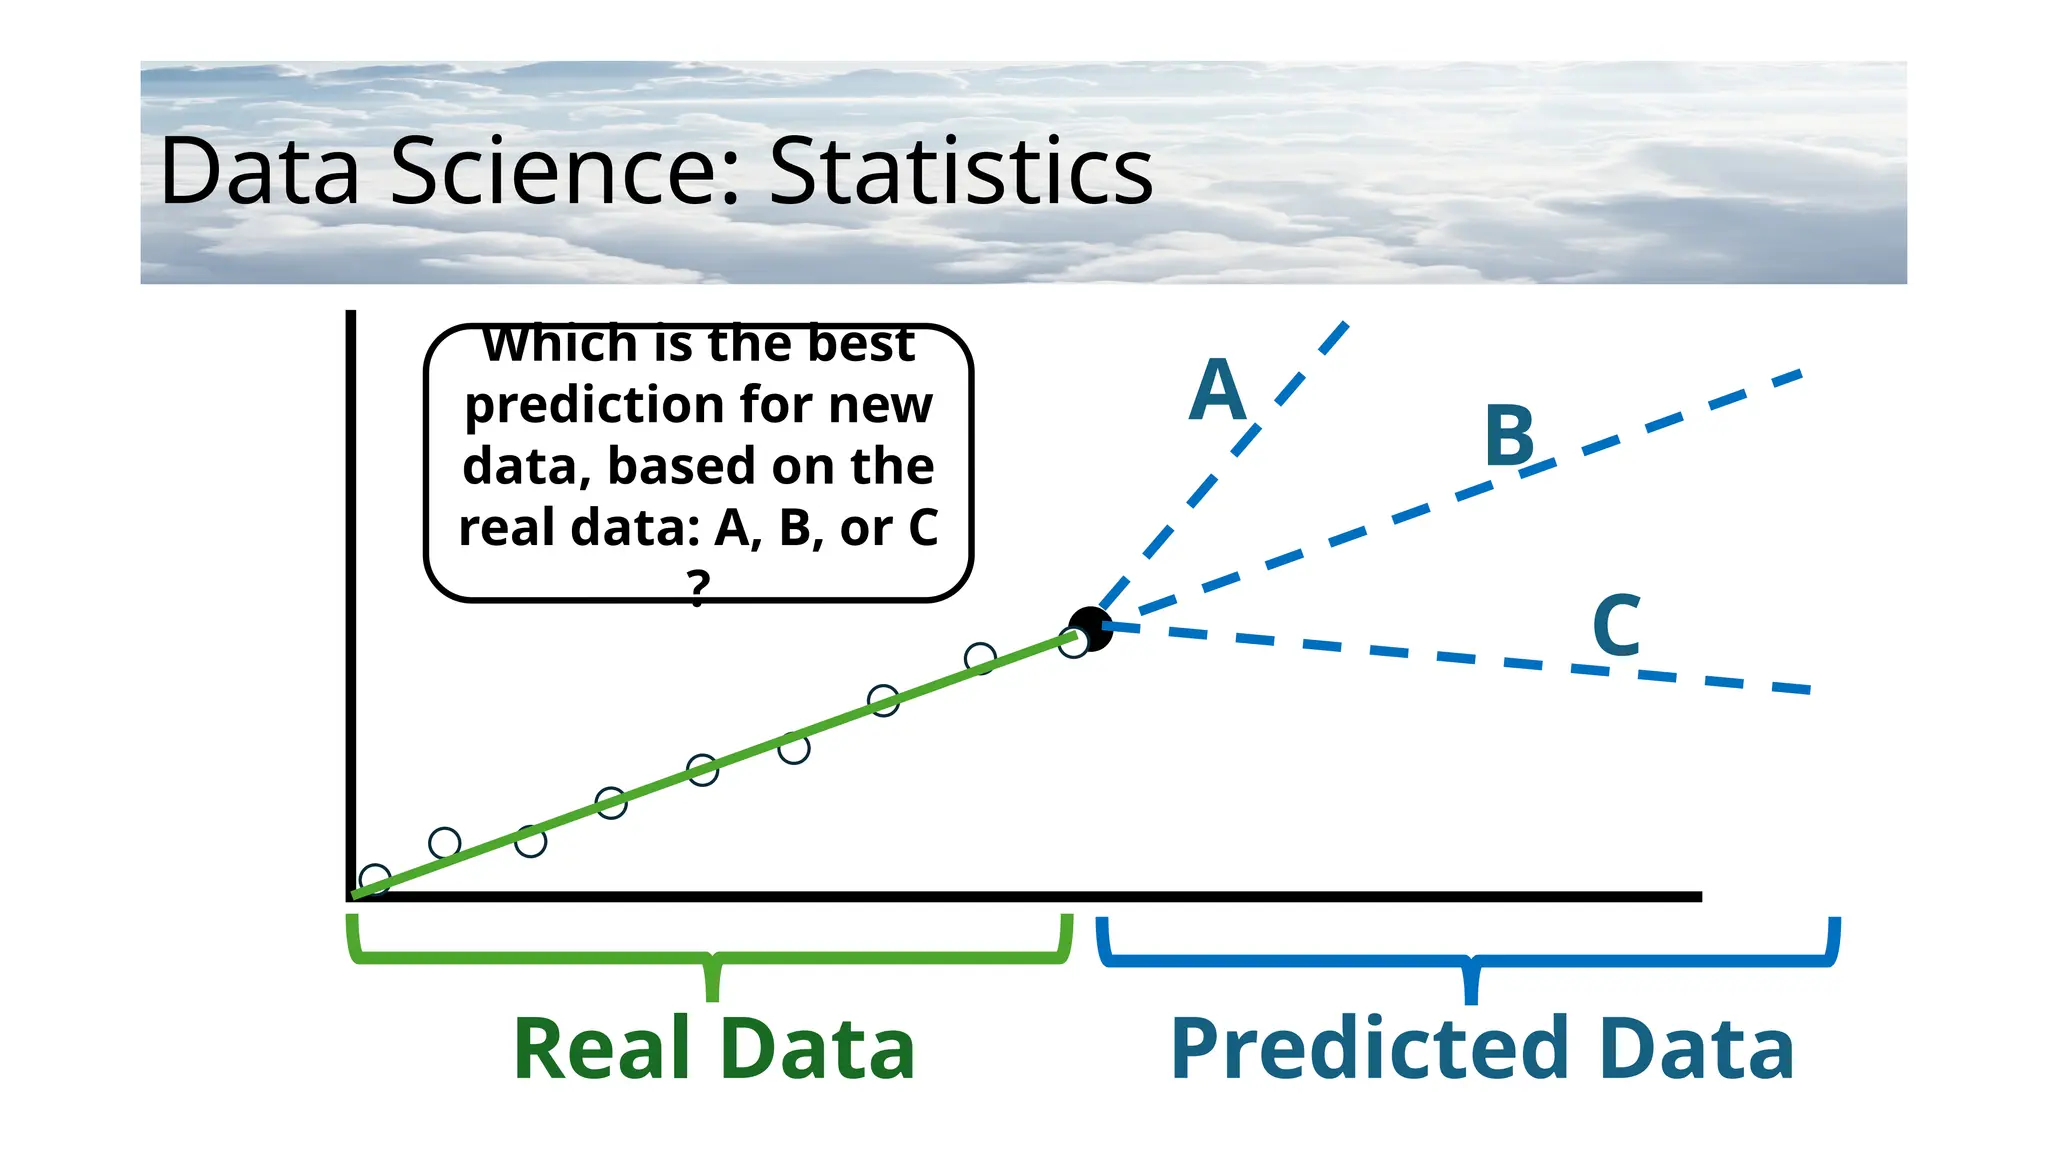
RealData Predicted Data
Which is the best
prediction for new
data, based on the
real data: A, B, or C
?
A
B
C
12.
Data Science: Statistics
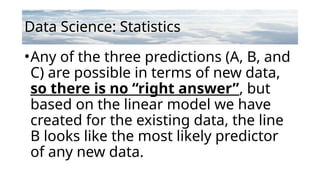
•Anyof the three predictions (A, B, and
C) are possible in terms of new data,
so there is no “right answer”, but
based on the linear model we have
created for the existing data, the line
B looks like the most likely predictor
of any new data.
13.
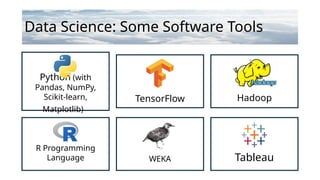
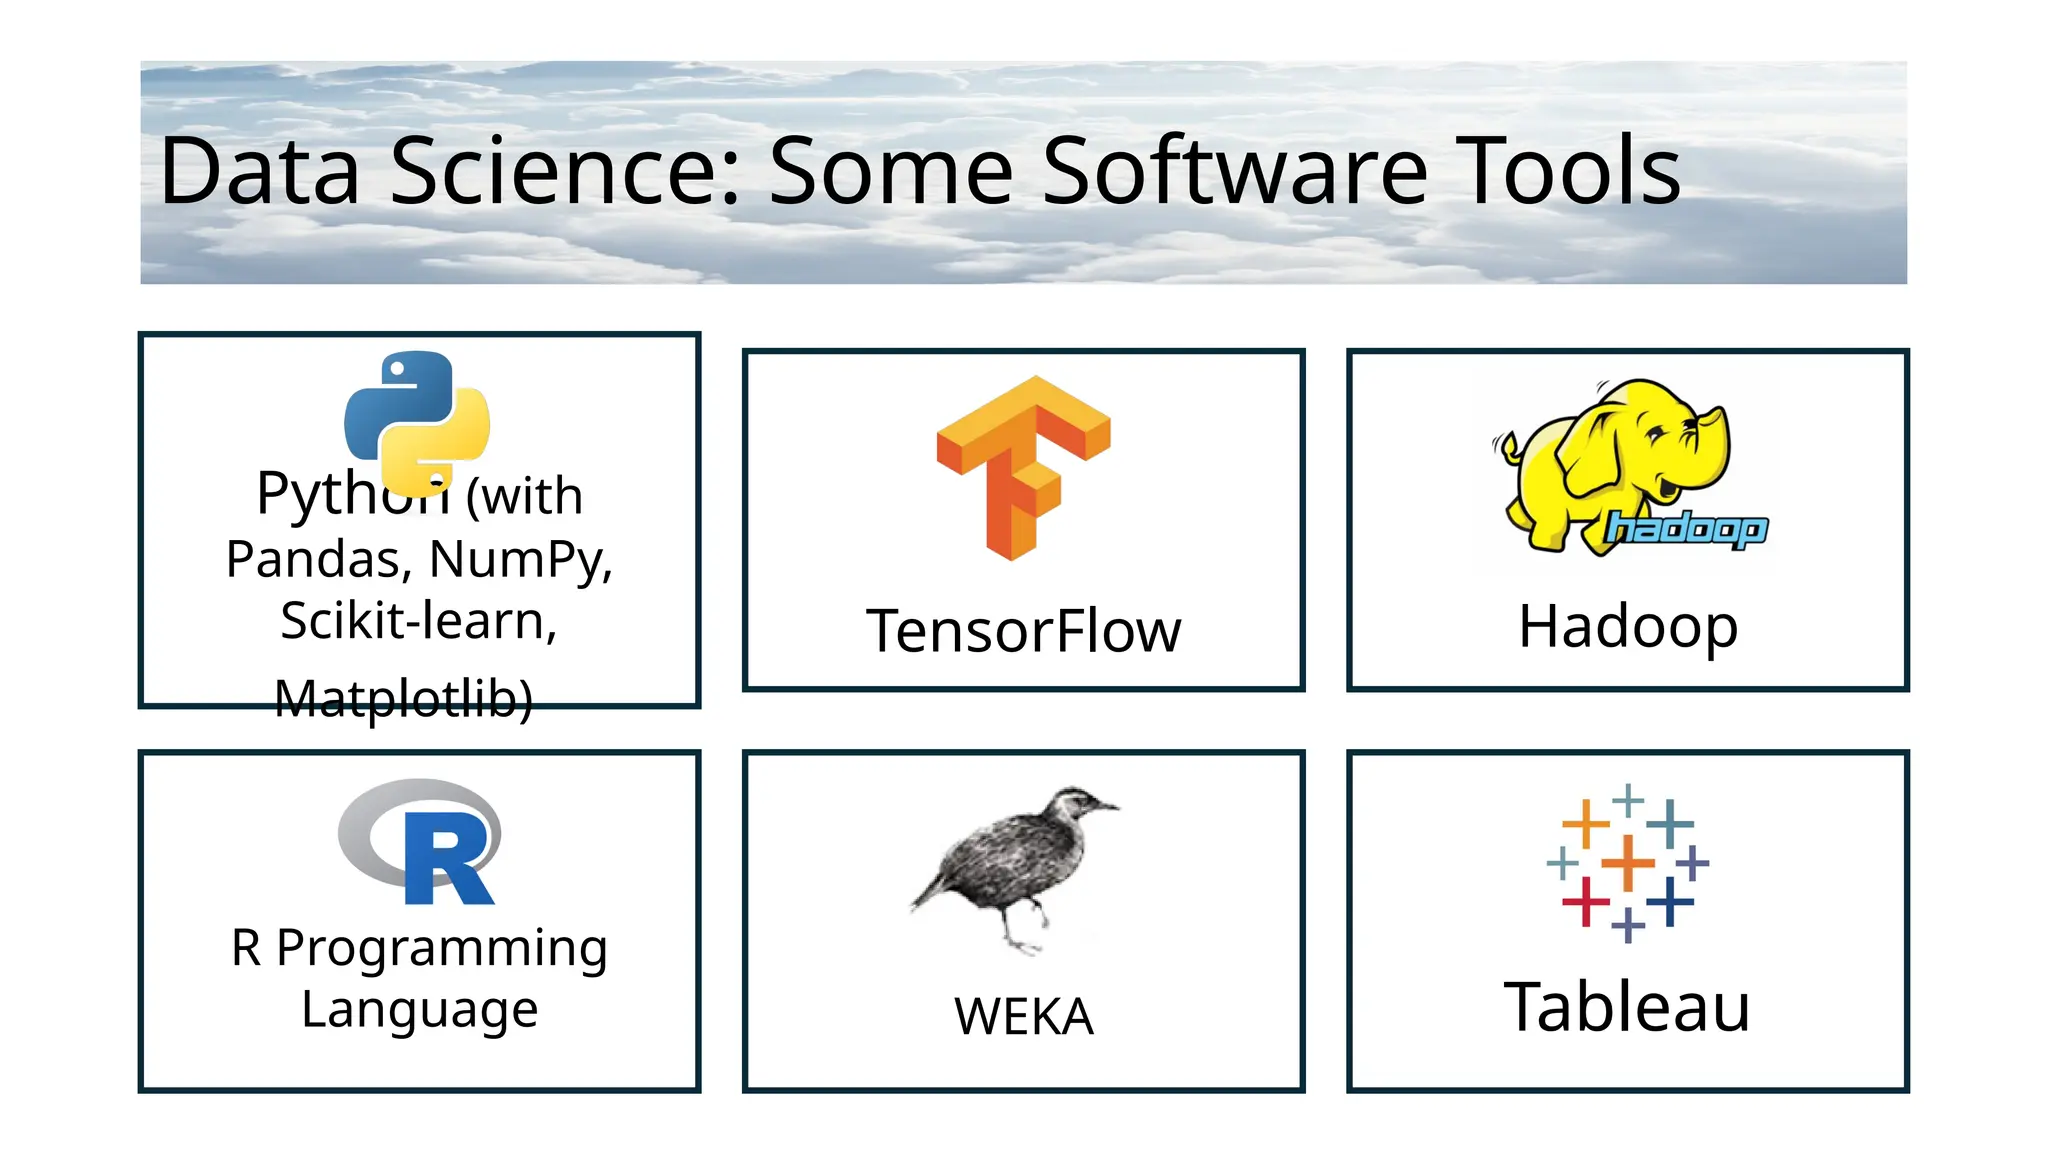
Data Science: SomeSoftware Tools
Python (with
Pandas, NumPy,
Scikit-learn,
Matplotlib)
TensorFlow Hadoop
R Programming
Language WEKA Tableau
14.
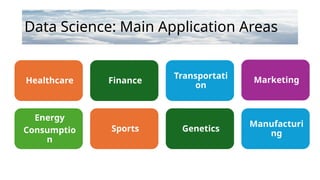
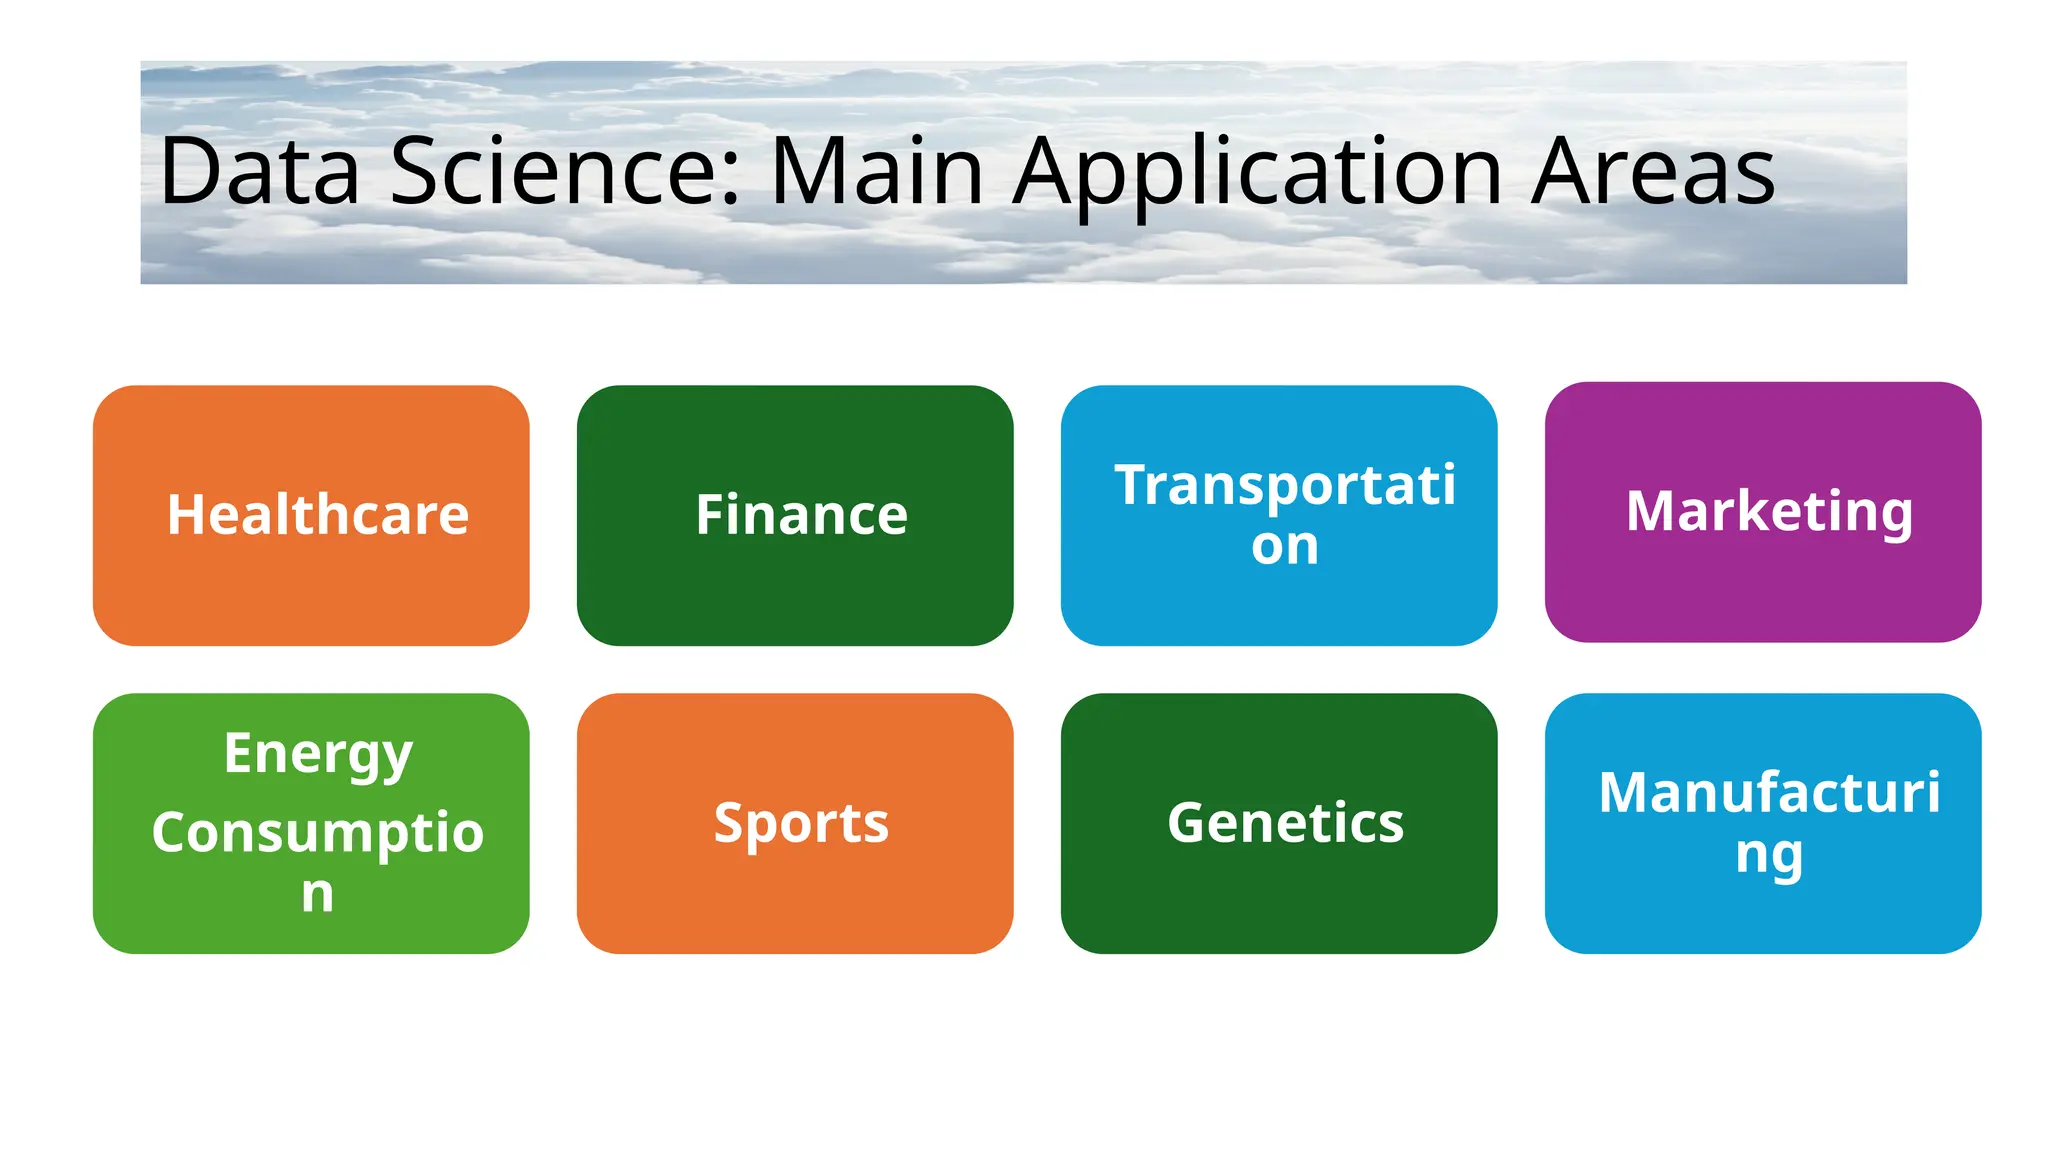
Data Science: MainApplication Areas
Healthcare Finance
Transportati
on
Marketing
Energy
Consumptio
n
Sports Genetics
Manufacturi
ng
15.
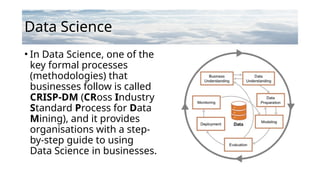
Data Science
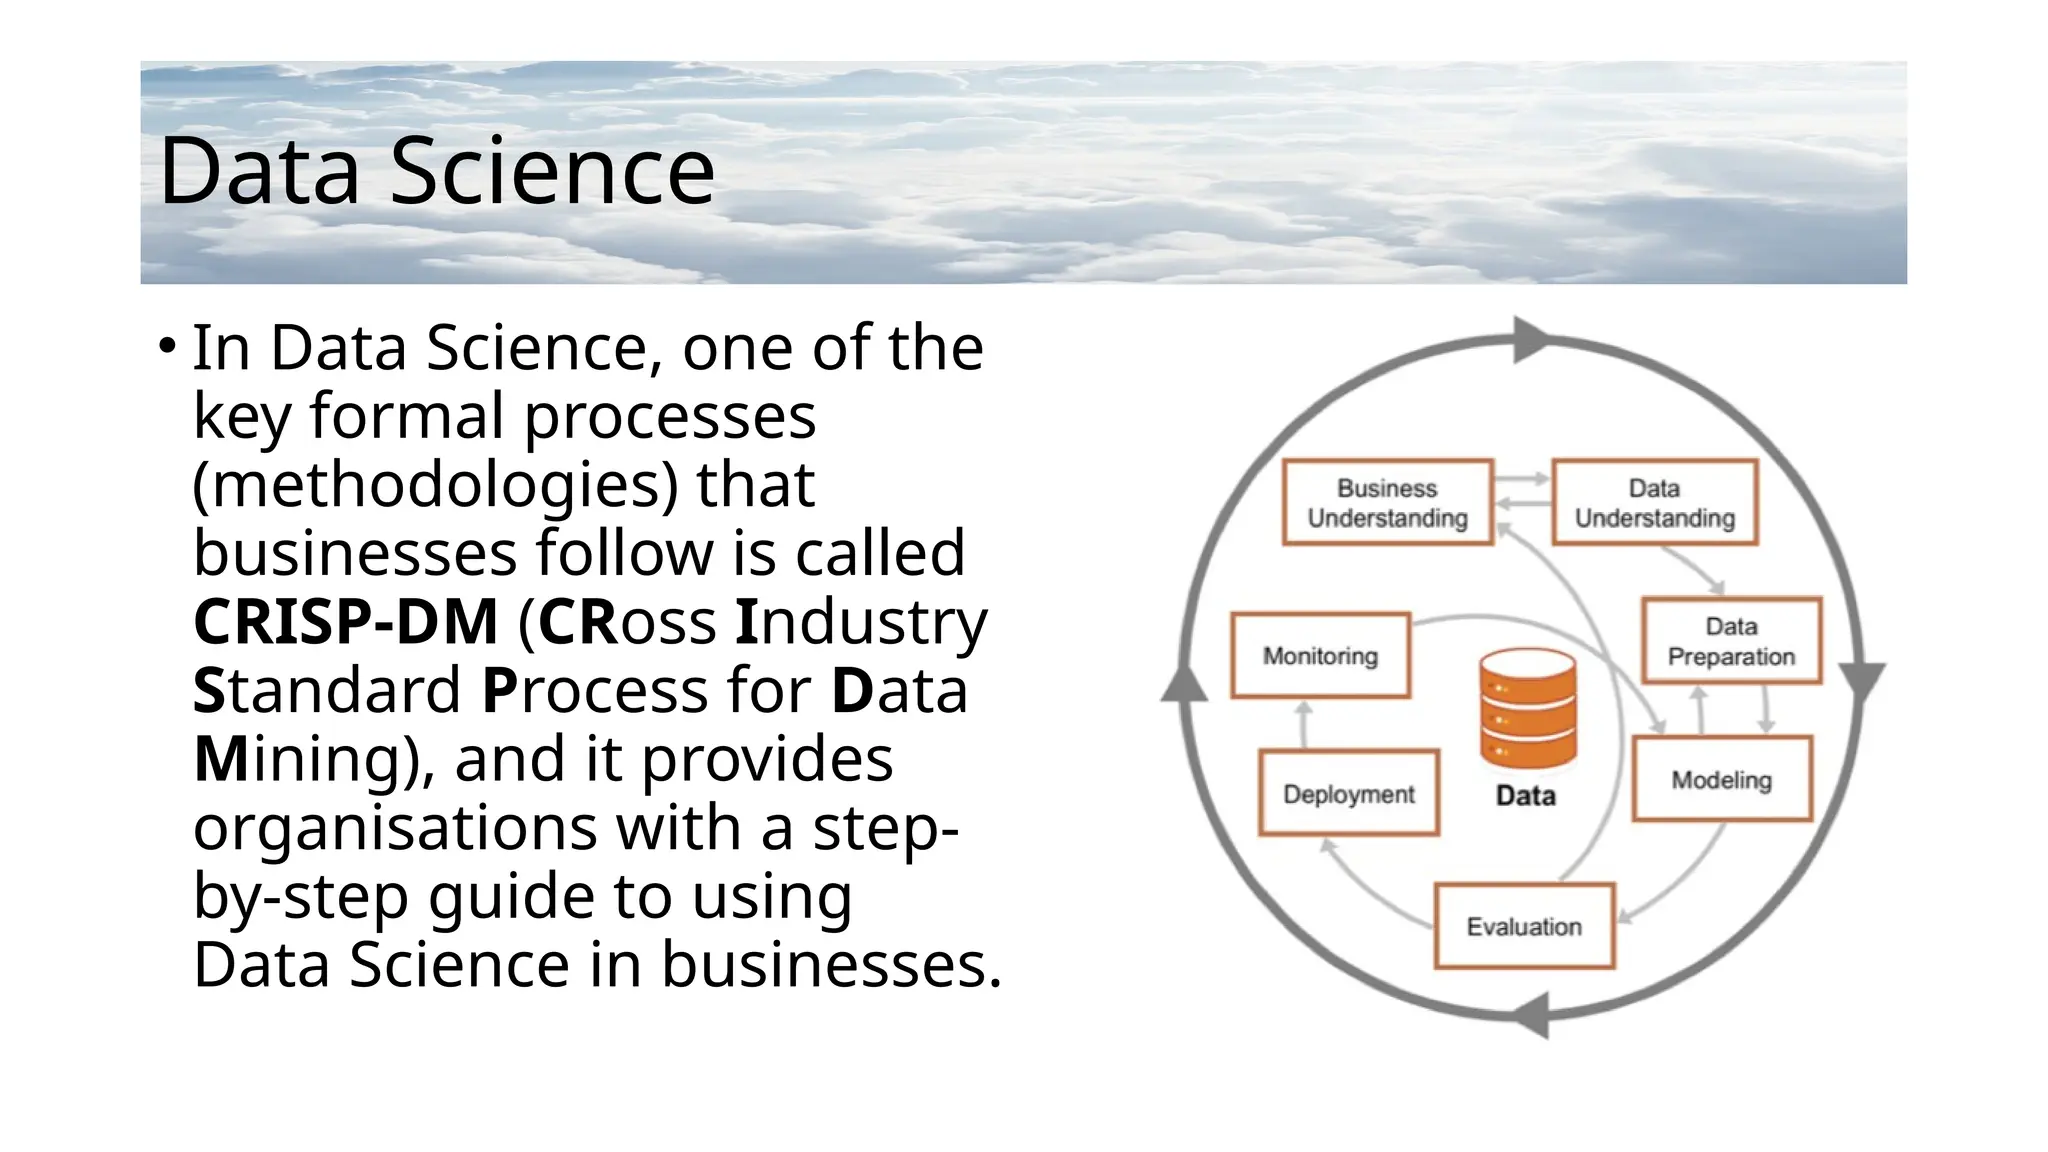
• InData Science, one of the
key formal processes
(methodologies) that
businesses follow is called
CRISP-DM (CRoss Industry
Standard Process for Data
Mining), and it provides
organisations with a step-
by-step guide to using
Data Science in businesses.
16.
Data Science: ComputerScience
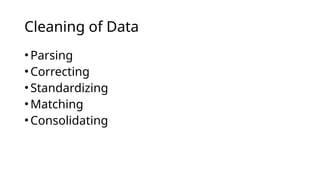
•DATA CLEANING (or Data Cleansing) is
fixing or removing data that is
incorrect (in some way) from the
dataset.
17.
Data Science: ComputerScience
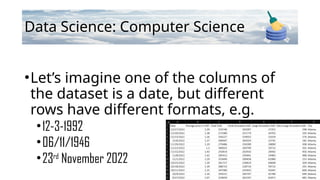
•Let’s imagine one of the columns of
the dataset is a date, but different
rows have different formats, e.g.
•12-3-1992
•06/11/1946
•23rd
November 2022
18.
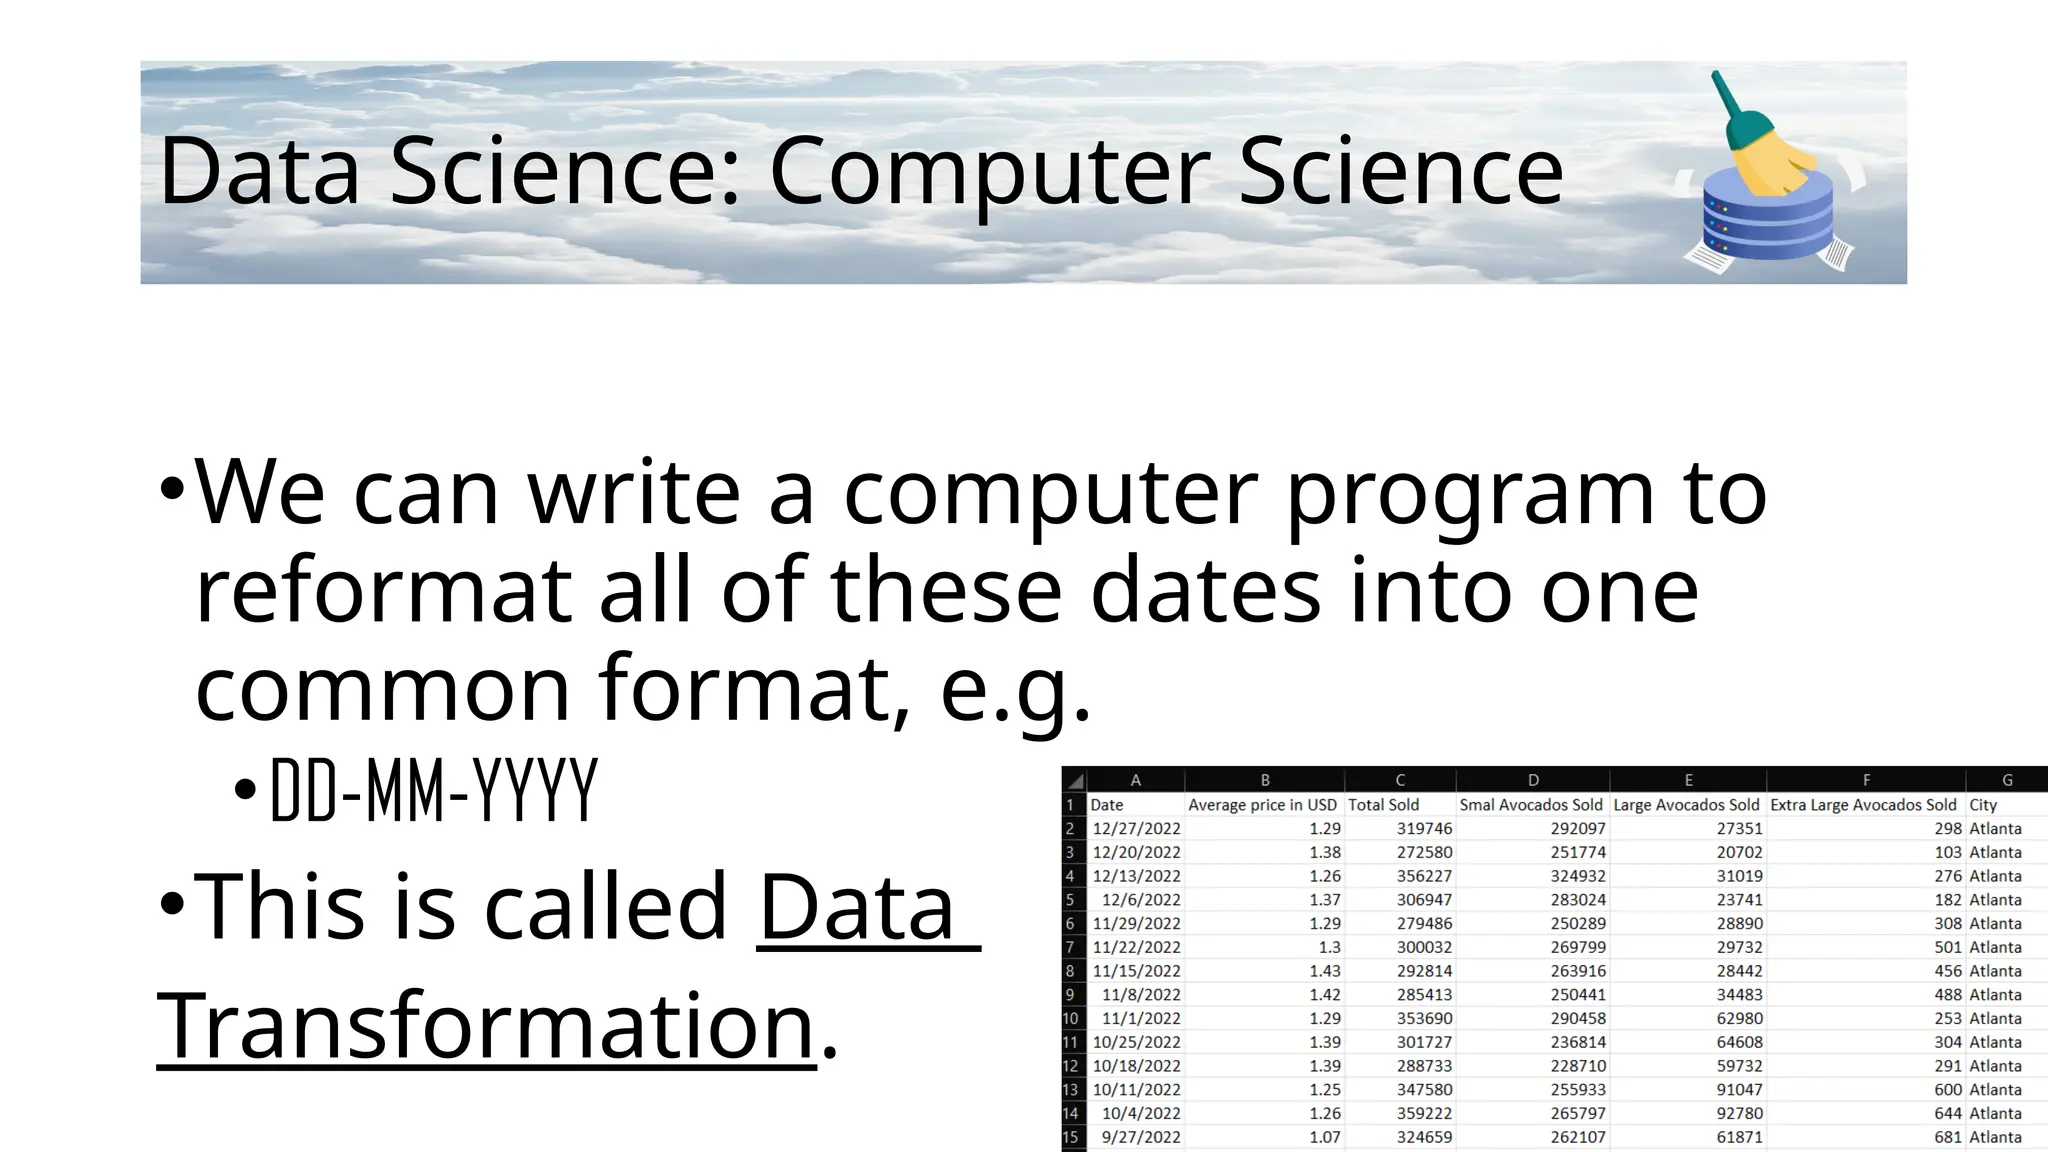
Data Science: ComputerScience
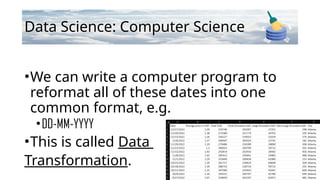
•We can write a computer program to
reformat all of these dates into one
common format, e.g.
•DD-MM-YYYY
•This is called Data
Transformation.
19.
Data Science: ComputerScience
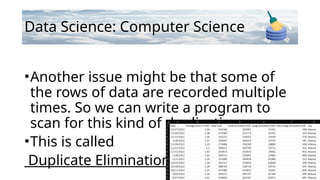
•Another issue might be that some of
the rows of data are recorded multiple
times. So we can write a program to
scan for this kind of duplication.
•This is called
Duplicate Elimination
20.
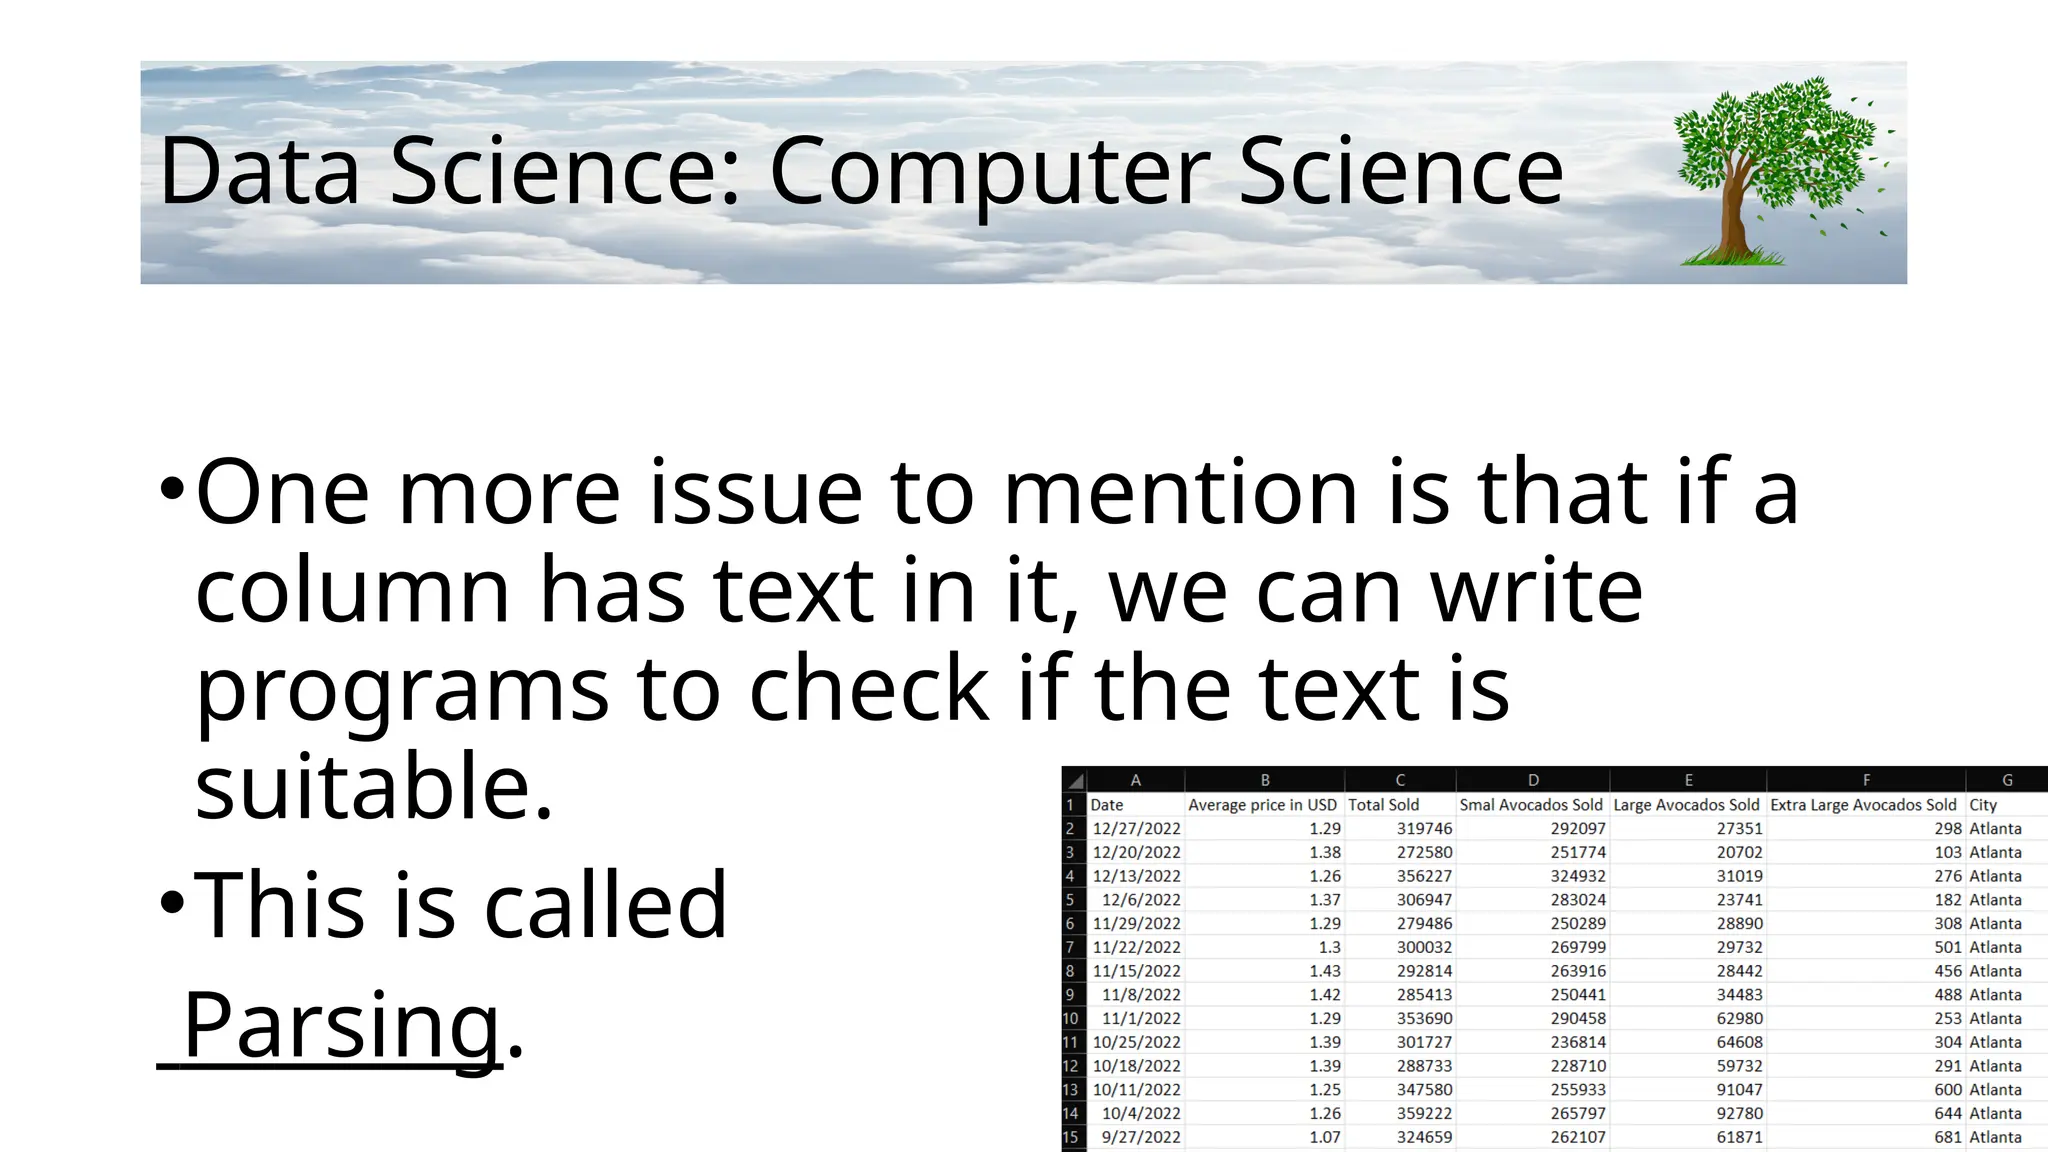
Data Science: ComputerScience
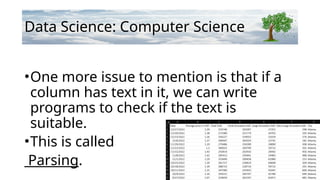
•One more issue to mention is that if a
column has text in it, we can write
programs to check if the text is
suitable.
•This is called
Parsing.
21.
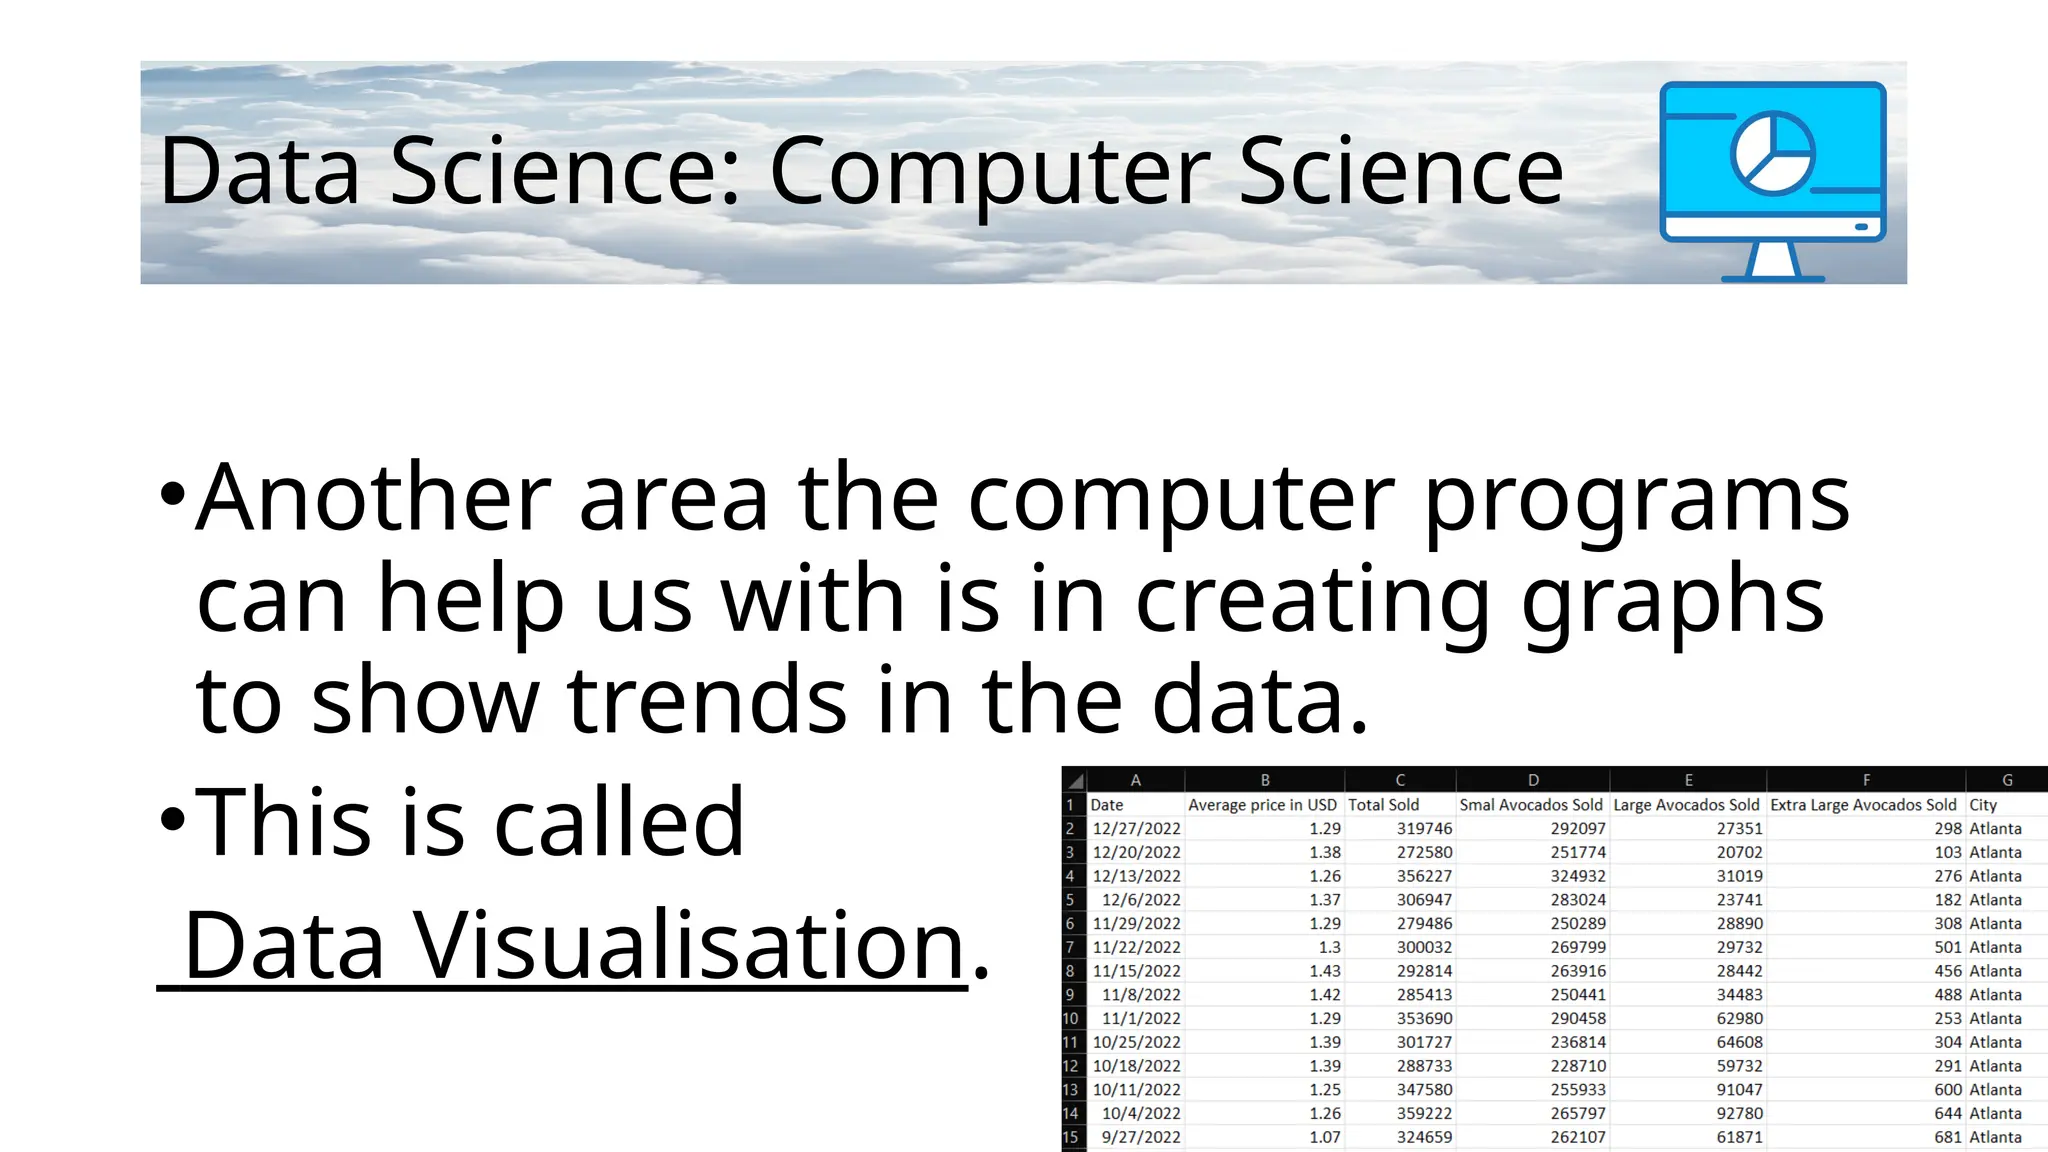
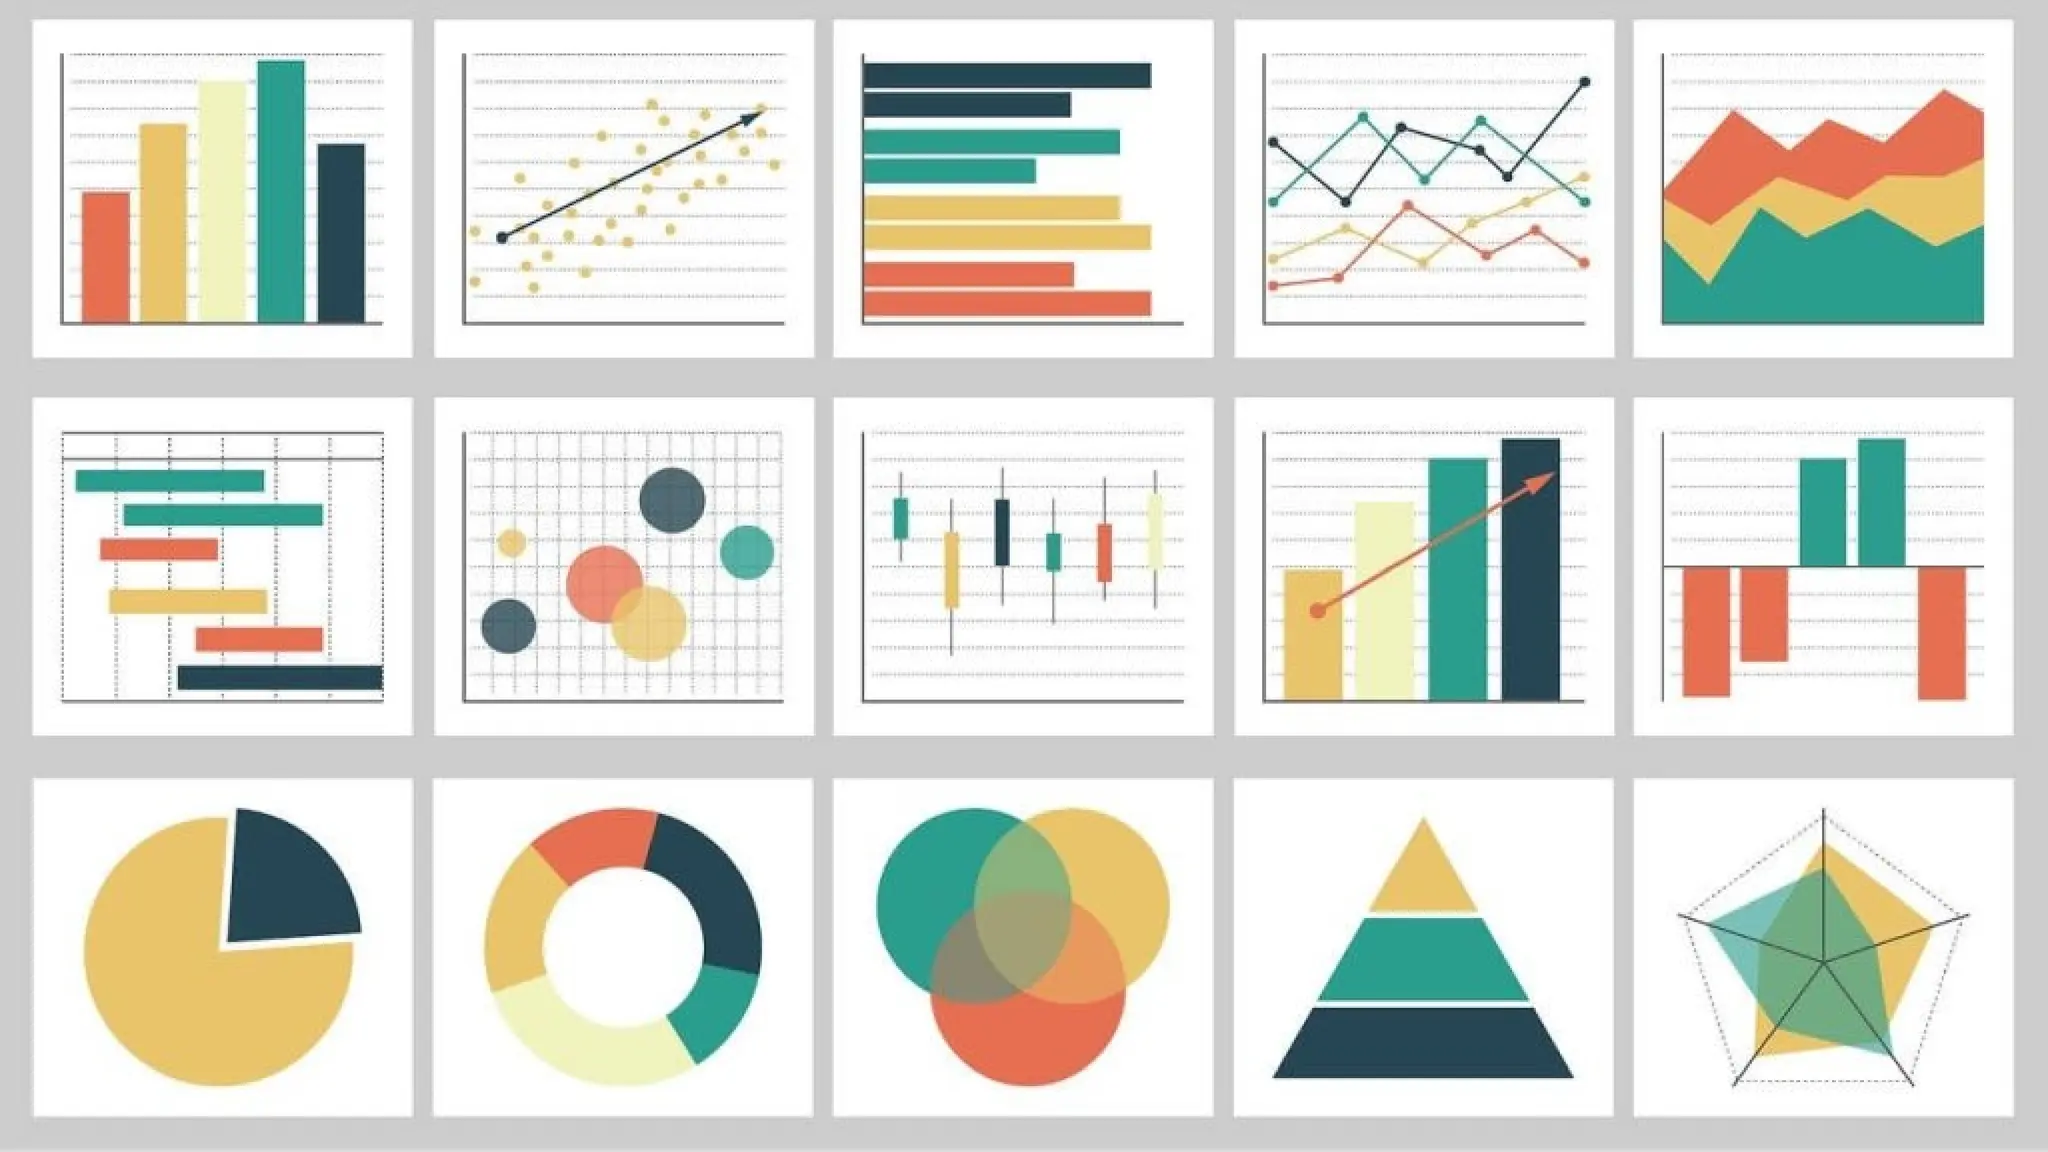
Data Science: ComputerScience
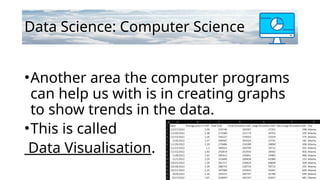
•Another area the computer programs
can help us with is in creating graphs
to show trends in the data.
•This is called
Data Visualisation.
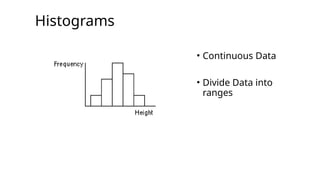
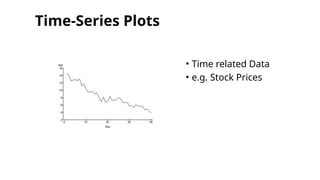
Continuous Data
•It’s datawith a decimal place.
•Continuous Data is data that can take
on any value within a given range. It
can be measured to an infinite level of
precision.
•e.g. height, 1.8542 metres.
•e.g. time, 3 hrs, 4 mins, 34 secs, 34 ms, etc.
25.
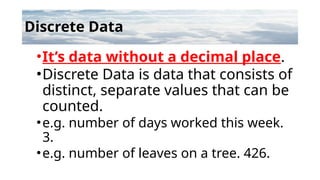
Discrete Data
•It’s datawithout a decimal place.
•Discrete Data is data that consists of
distinct, separate values that can be
counted.
•e.g. number of days worked this week.
3.
•e.g. number of leaves on a tree. 426.
26.
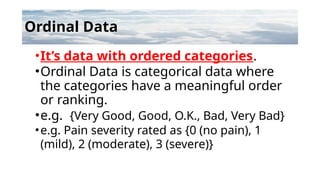
Ordinal Data
•It’s datawith ordered categories.
•Ordinal Data is categorical data where
the categories have a meaningful order
or ranking.
•e.g. {Very Good, Good, O.K., Bad, Very Bad}
•e.g. Pain severity rated as {0 (no pain), 1
(mild), 2 (moderate), 3 (severe)}
27.
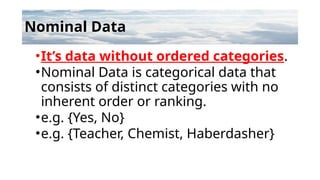
Nominal Data
•It’s datawithout ordered categories.
•Nominal Data is categorical data that
consists of distinct categories with no
inherent order or ranking.
•e.g. {Yes, No}
•e.g. {Teacher, Chemist, Haberdasher}
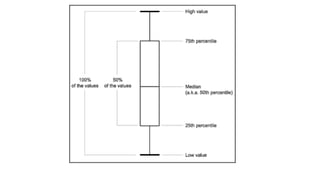
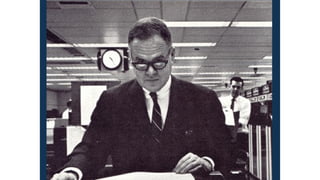
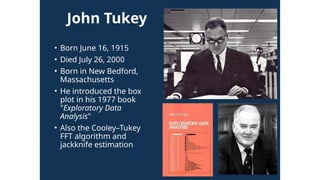
John Tukey
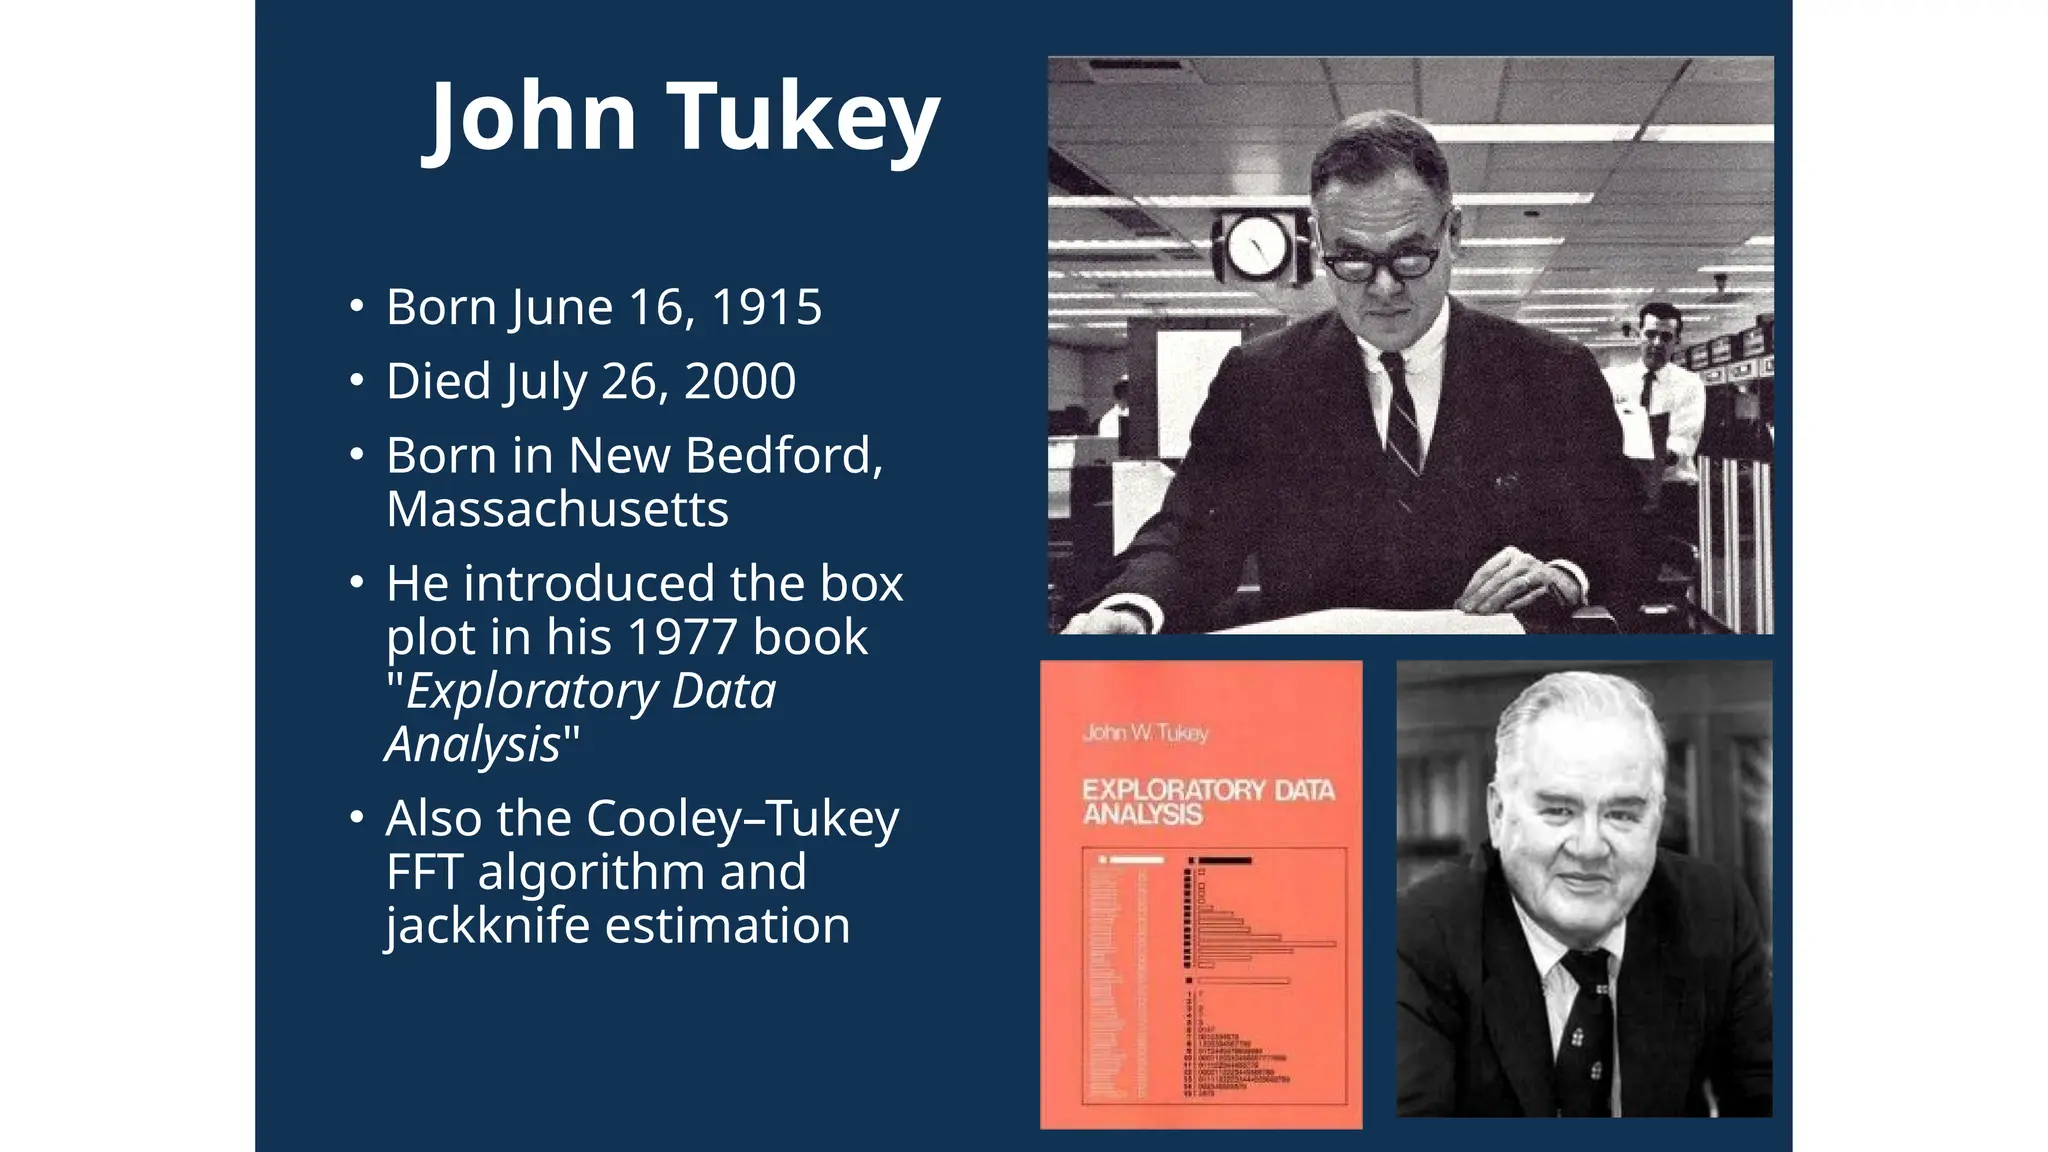
• BornJune 16, 1915
• Died July 26, 2000
• Born in New Bedford,
Massachusetts
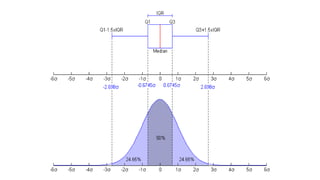
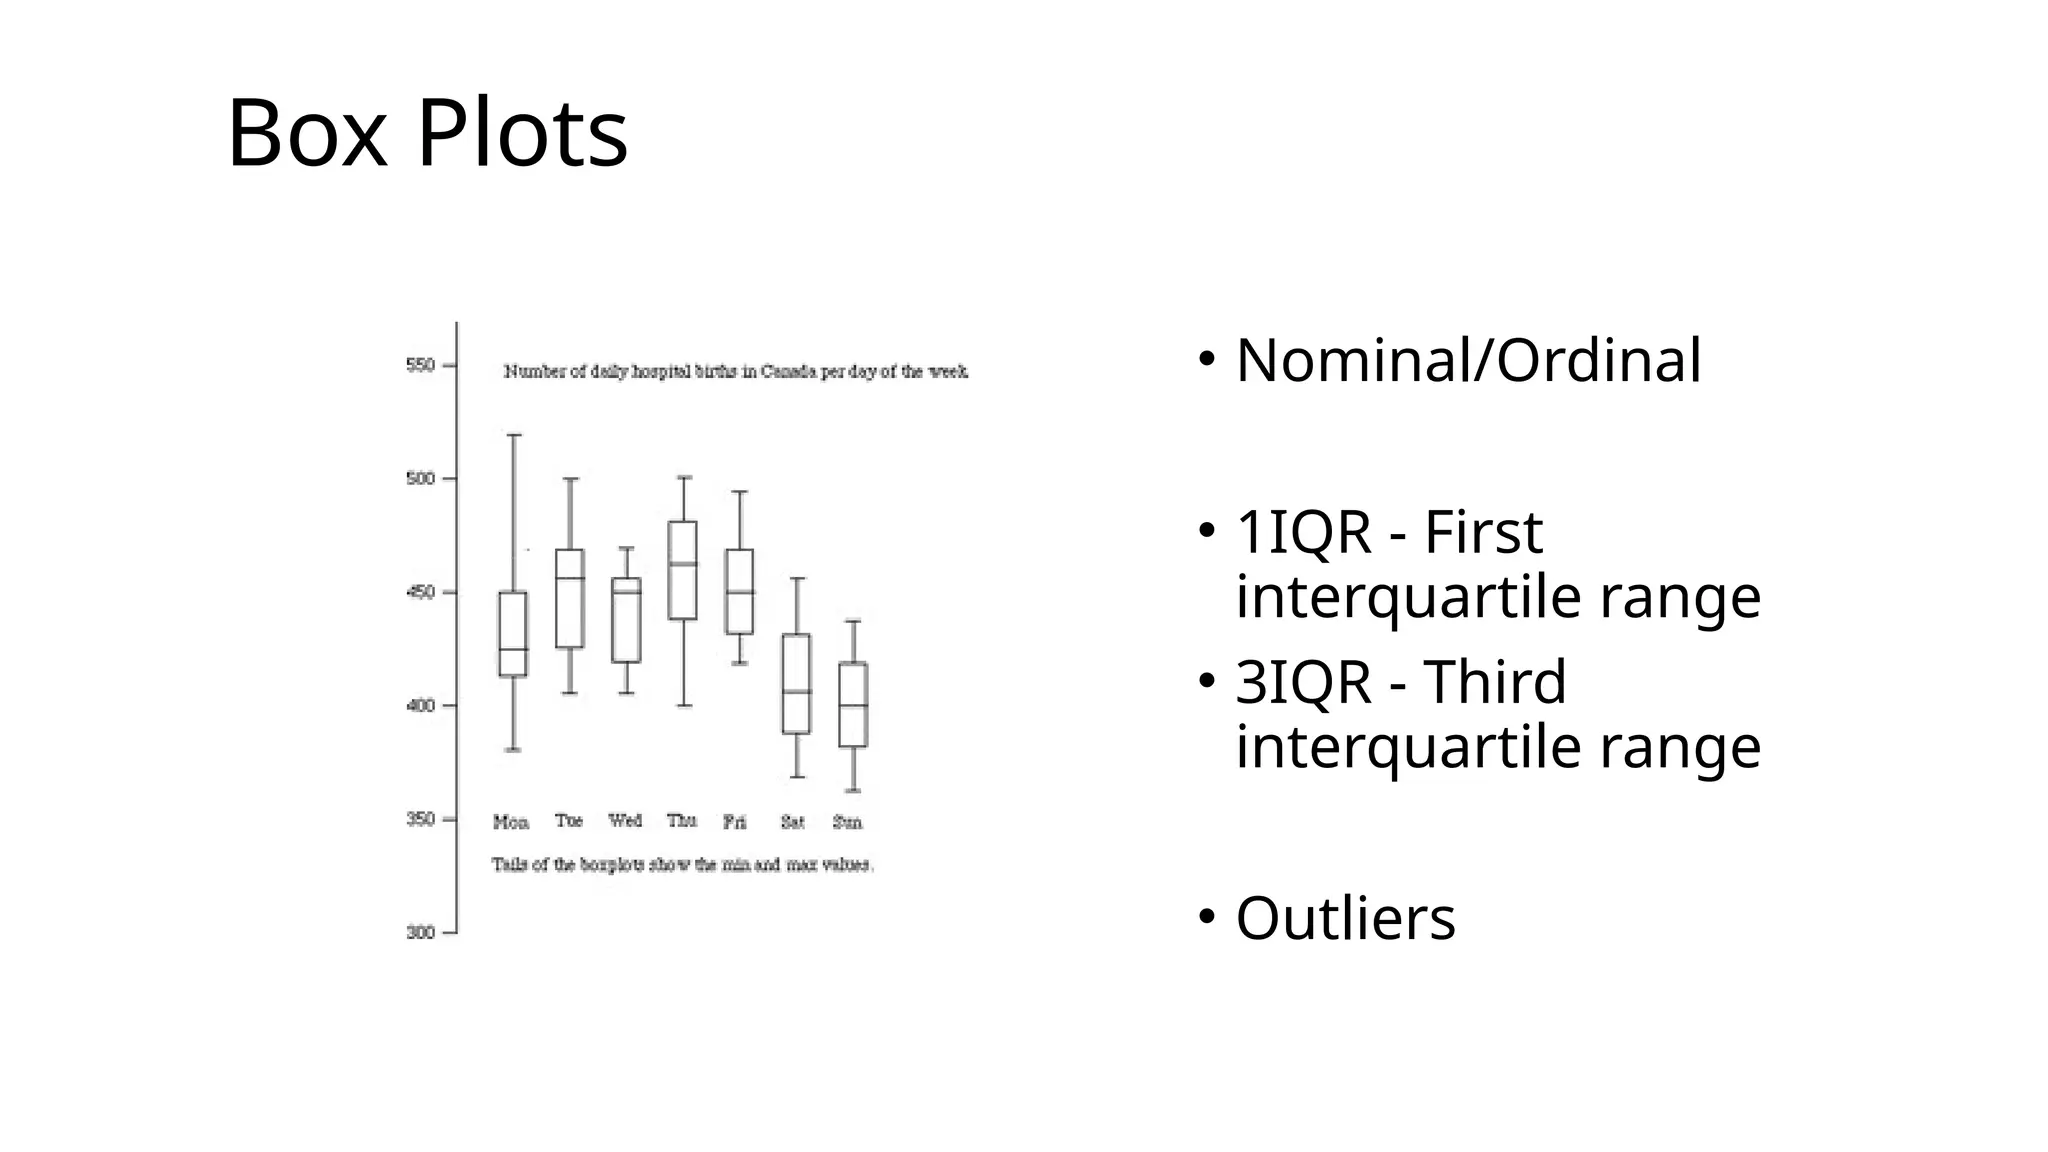
• He introduced the box
plot in his 1977 book
"Exploratory Data
Analysis"
• Also the Cooley–Tukey
FFT algorithm and
jackknife estimation
47.
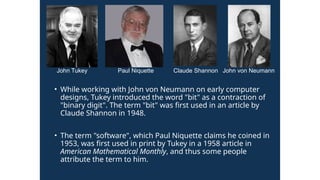
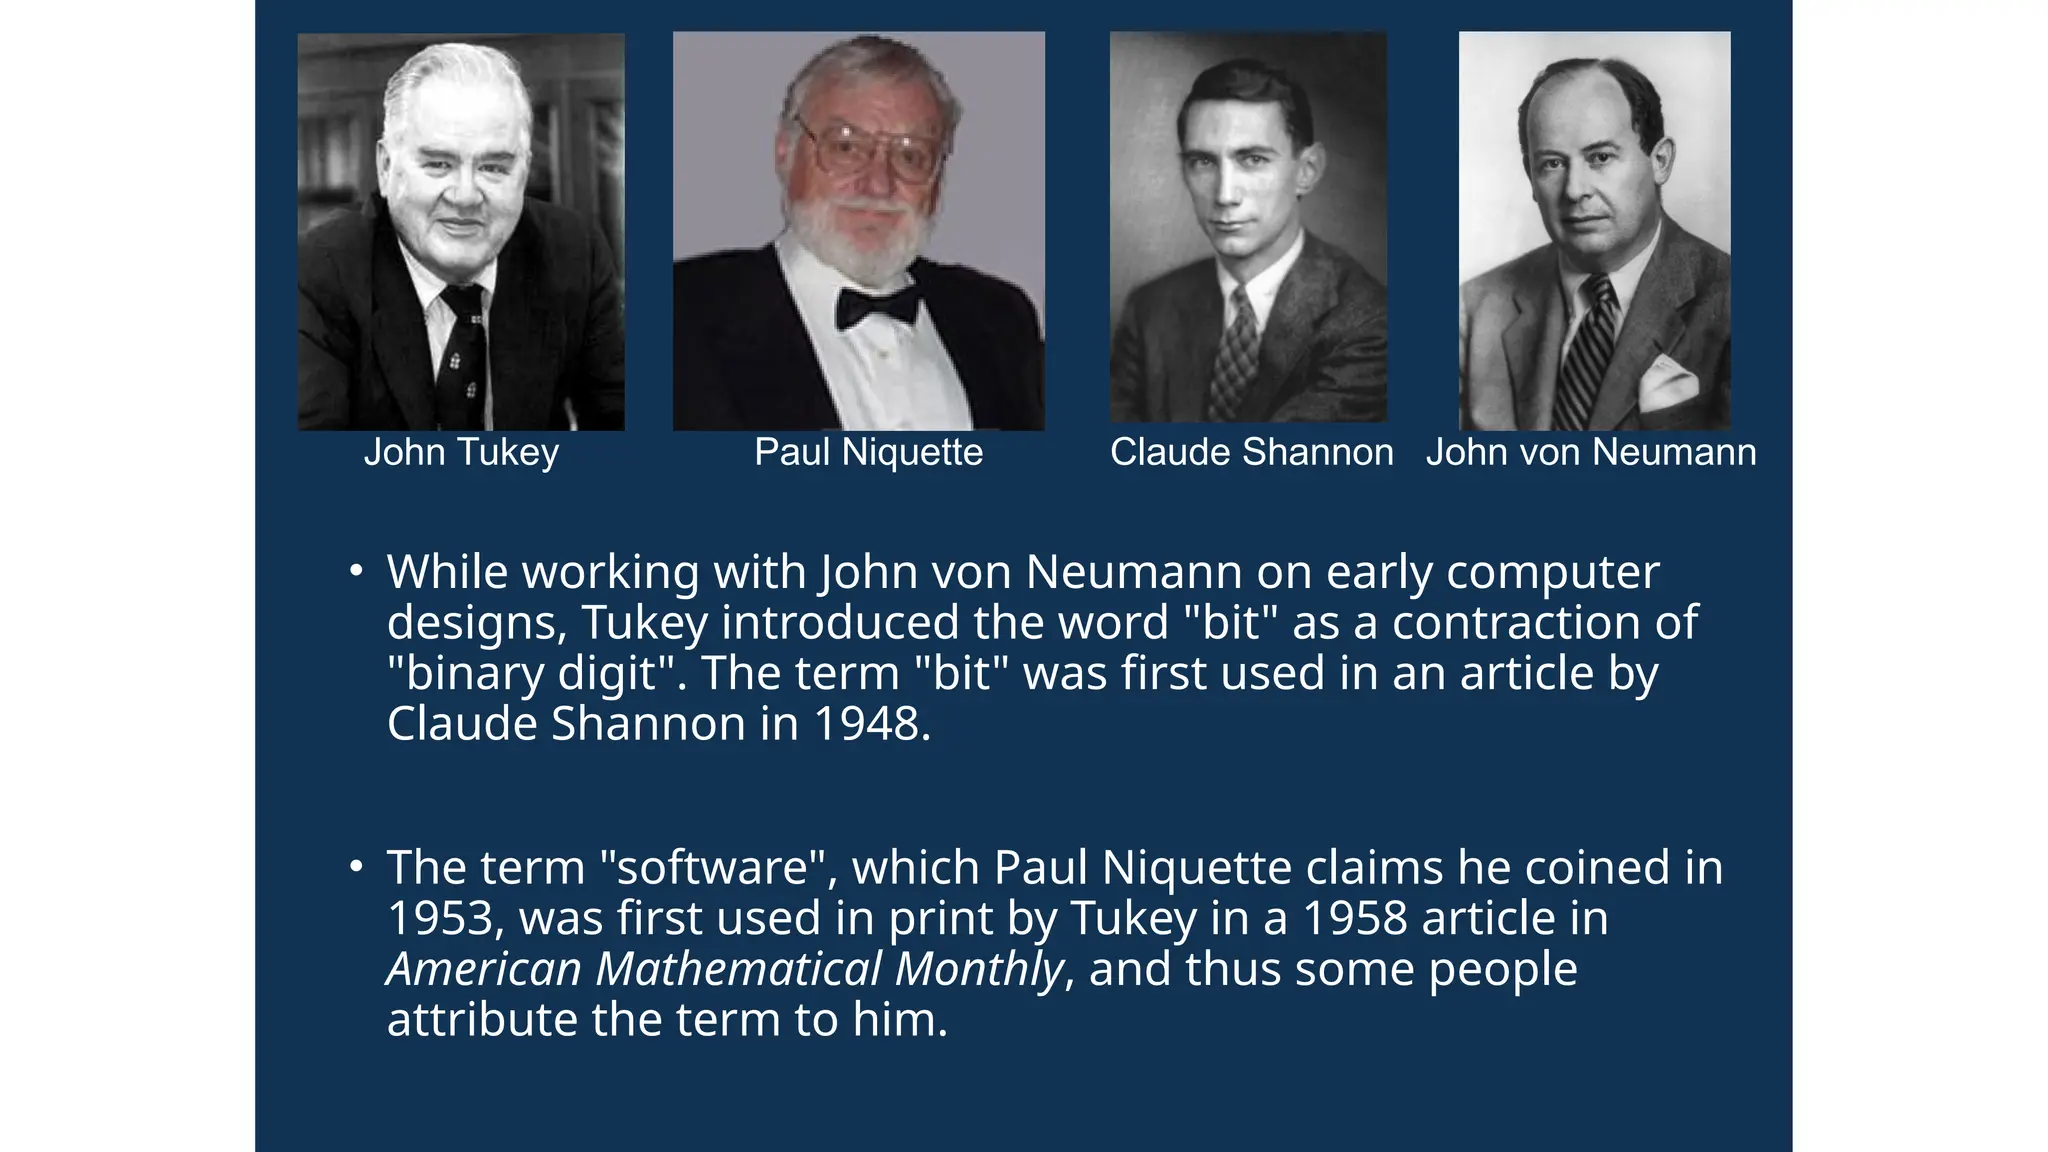
• While workingwith John von Neumann on early computer
designs, Tukey introduced the word "bit" as a contraction of
"binary digit". The term "bit" was first used in an article by
Claude Shannon in 1948.
• The term "software", which Paul Niquette claims he coined in
1953, was first used in print by Tukey in a 1958 article in
American Mathematical Monthly, and thus some people
attribute the term to him.
John Tukey Paul Niquette Claude Shannon John von Neumann
Question 1
In atelephone survey of 68
households, when asked do they
have pets, the following were the
responses :
• 16 : No Pets
• 28 : Dogs
• 32 : Cats
Draw the appropriate graphic to
illustrate the results !!
50.
Question 1 -Solution
Total number surveyed = 68
Number with no pets = 16
=>Total with pets = (68 - 16) = 52
But total 28 dogs + 32 cats = 60
=> So some people have both cats and dogs
52.
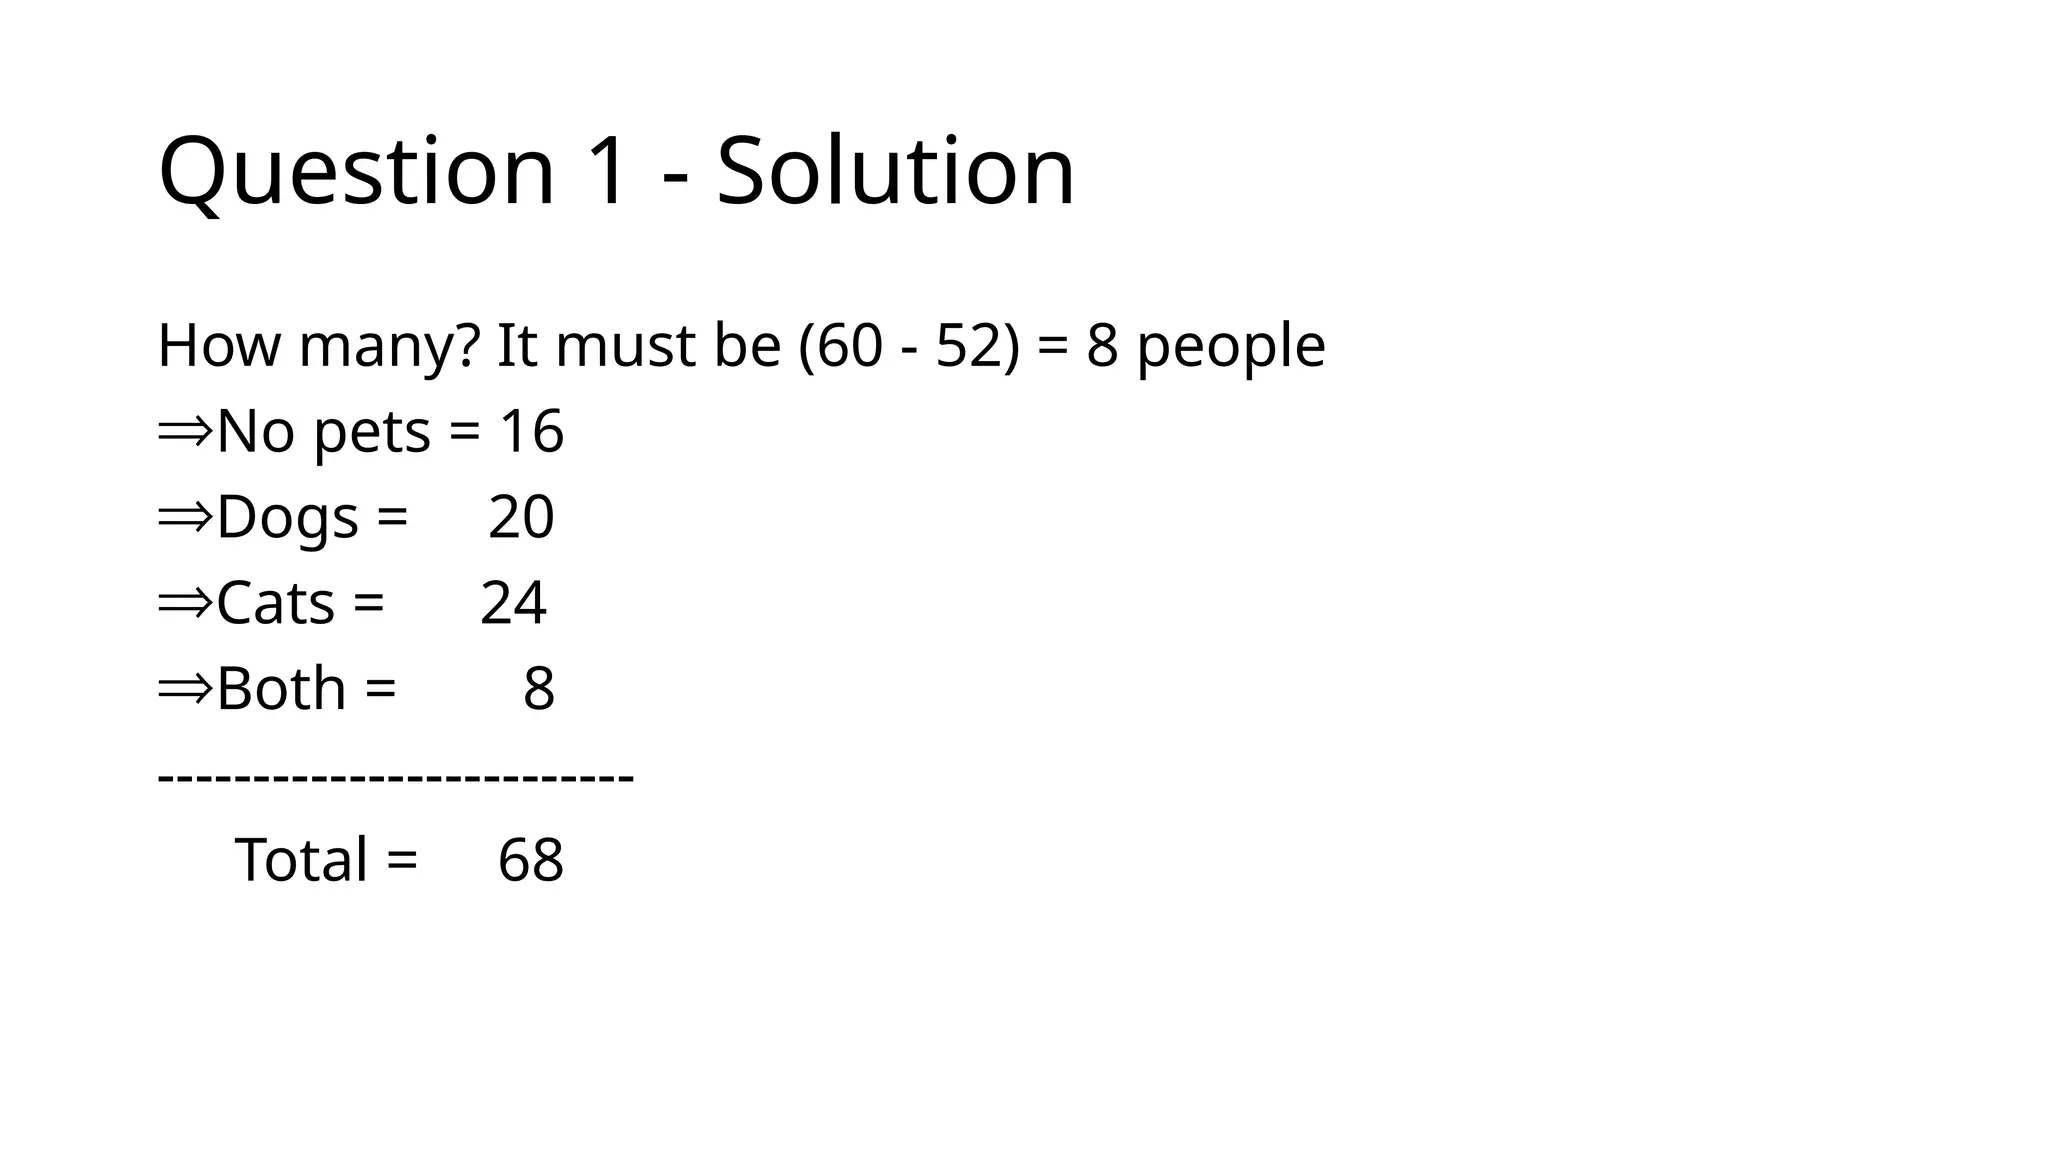
Question 1 -Solution
How many? It must be (60 - 52) = 8 people
ÞNo pets = 16
ÞDogs = 20
ÞCats = 24
ÞBoth = 8
-------------------------
Total = 68
53.
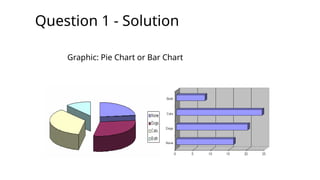
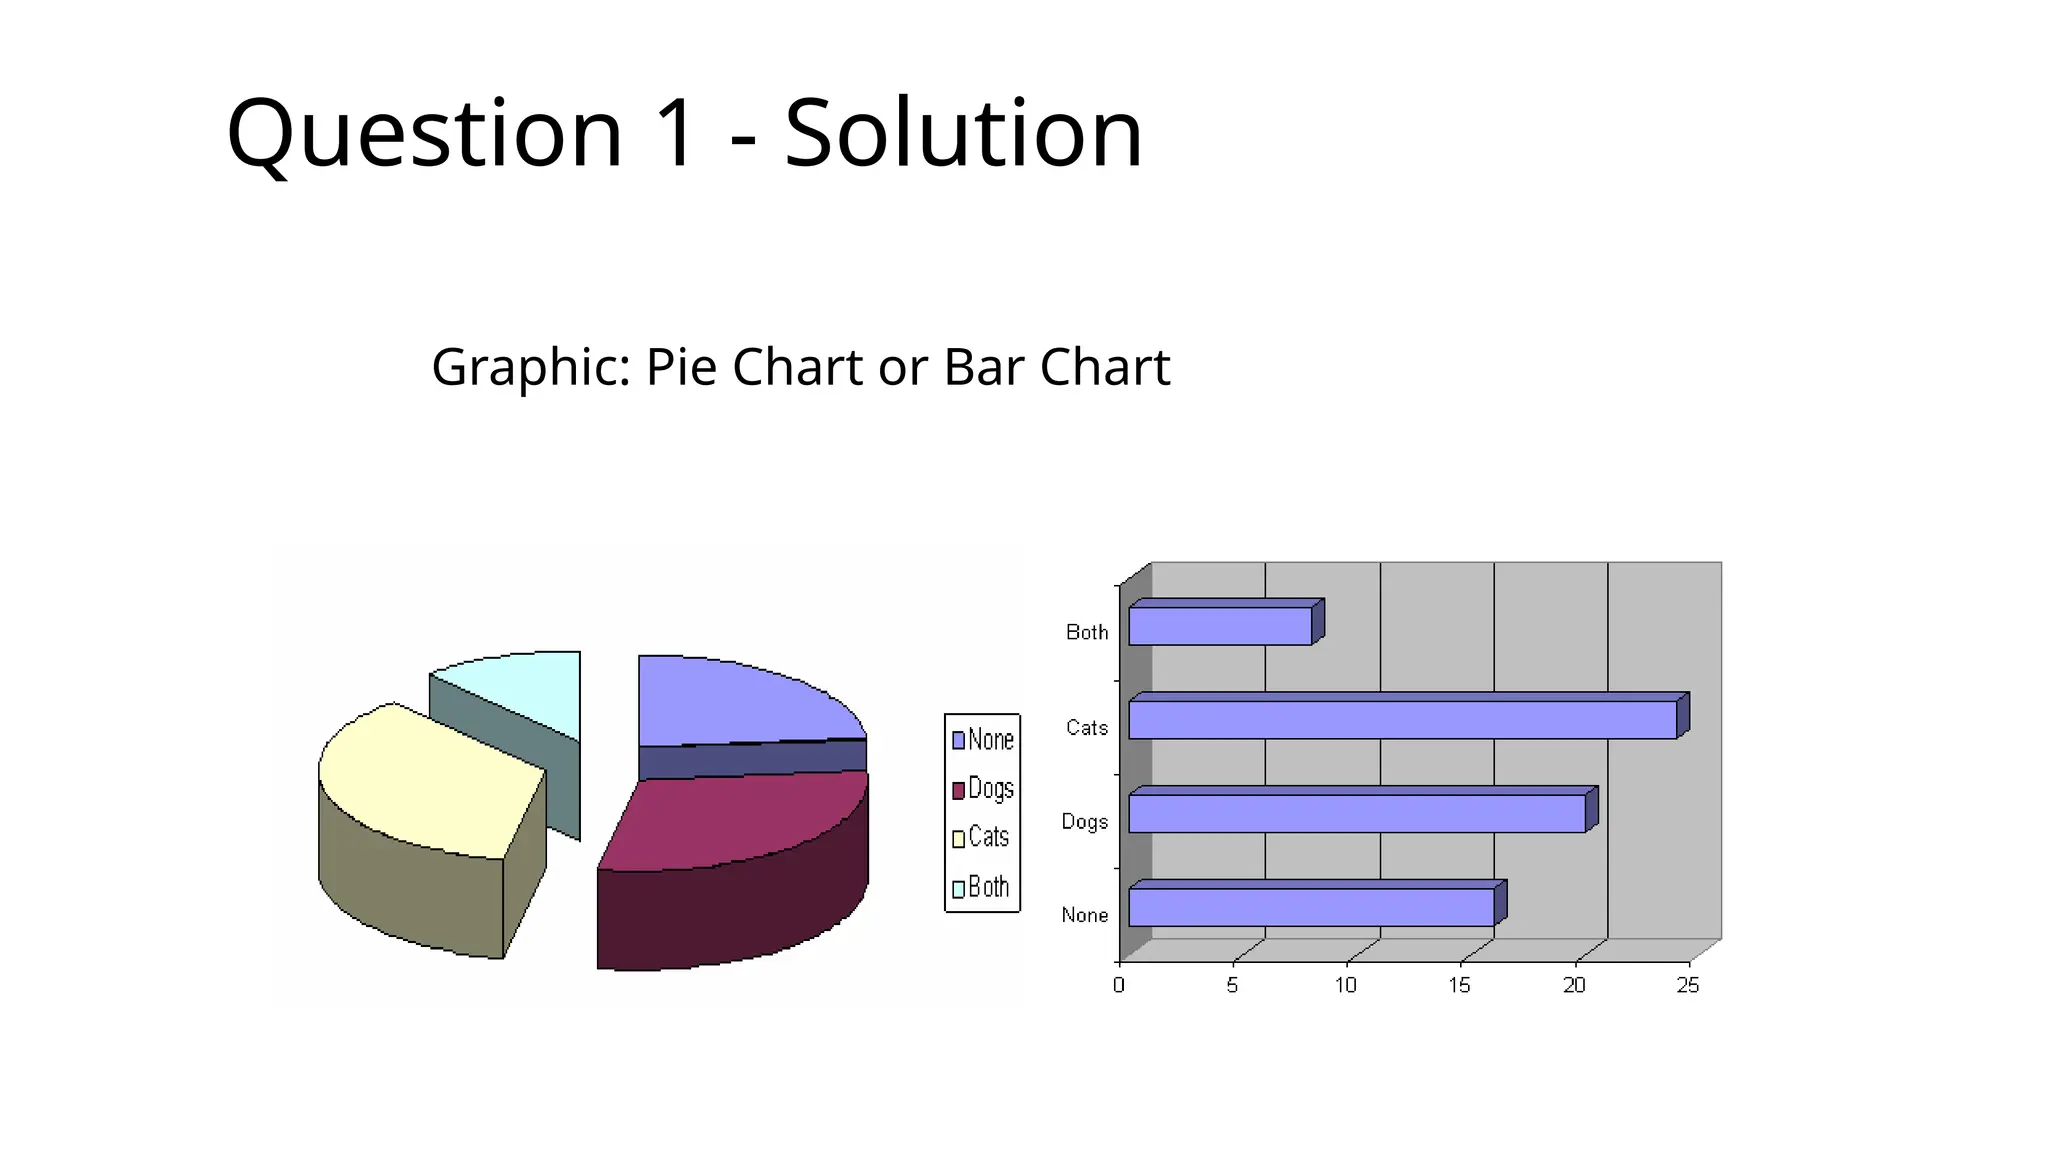
Question 1 -Solution
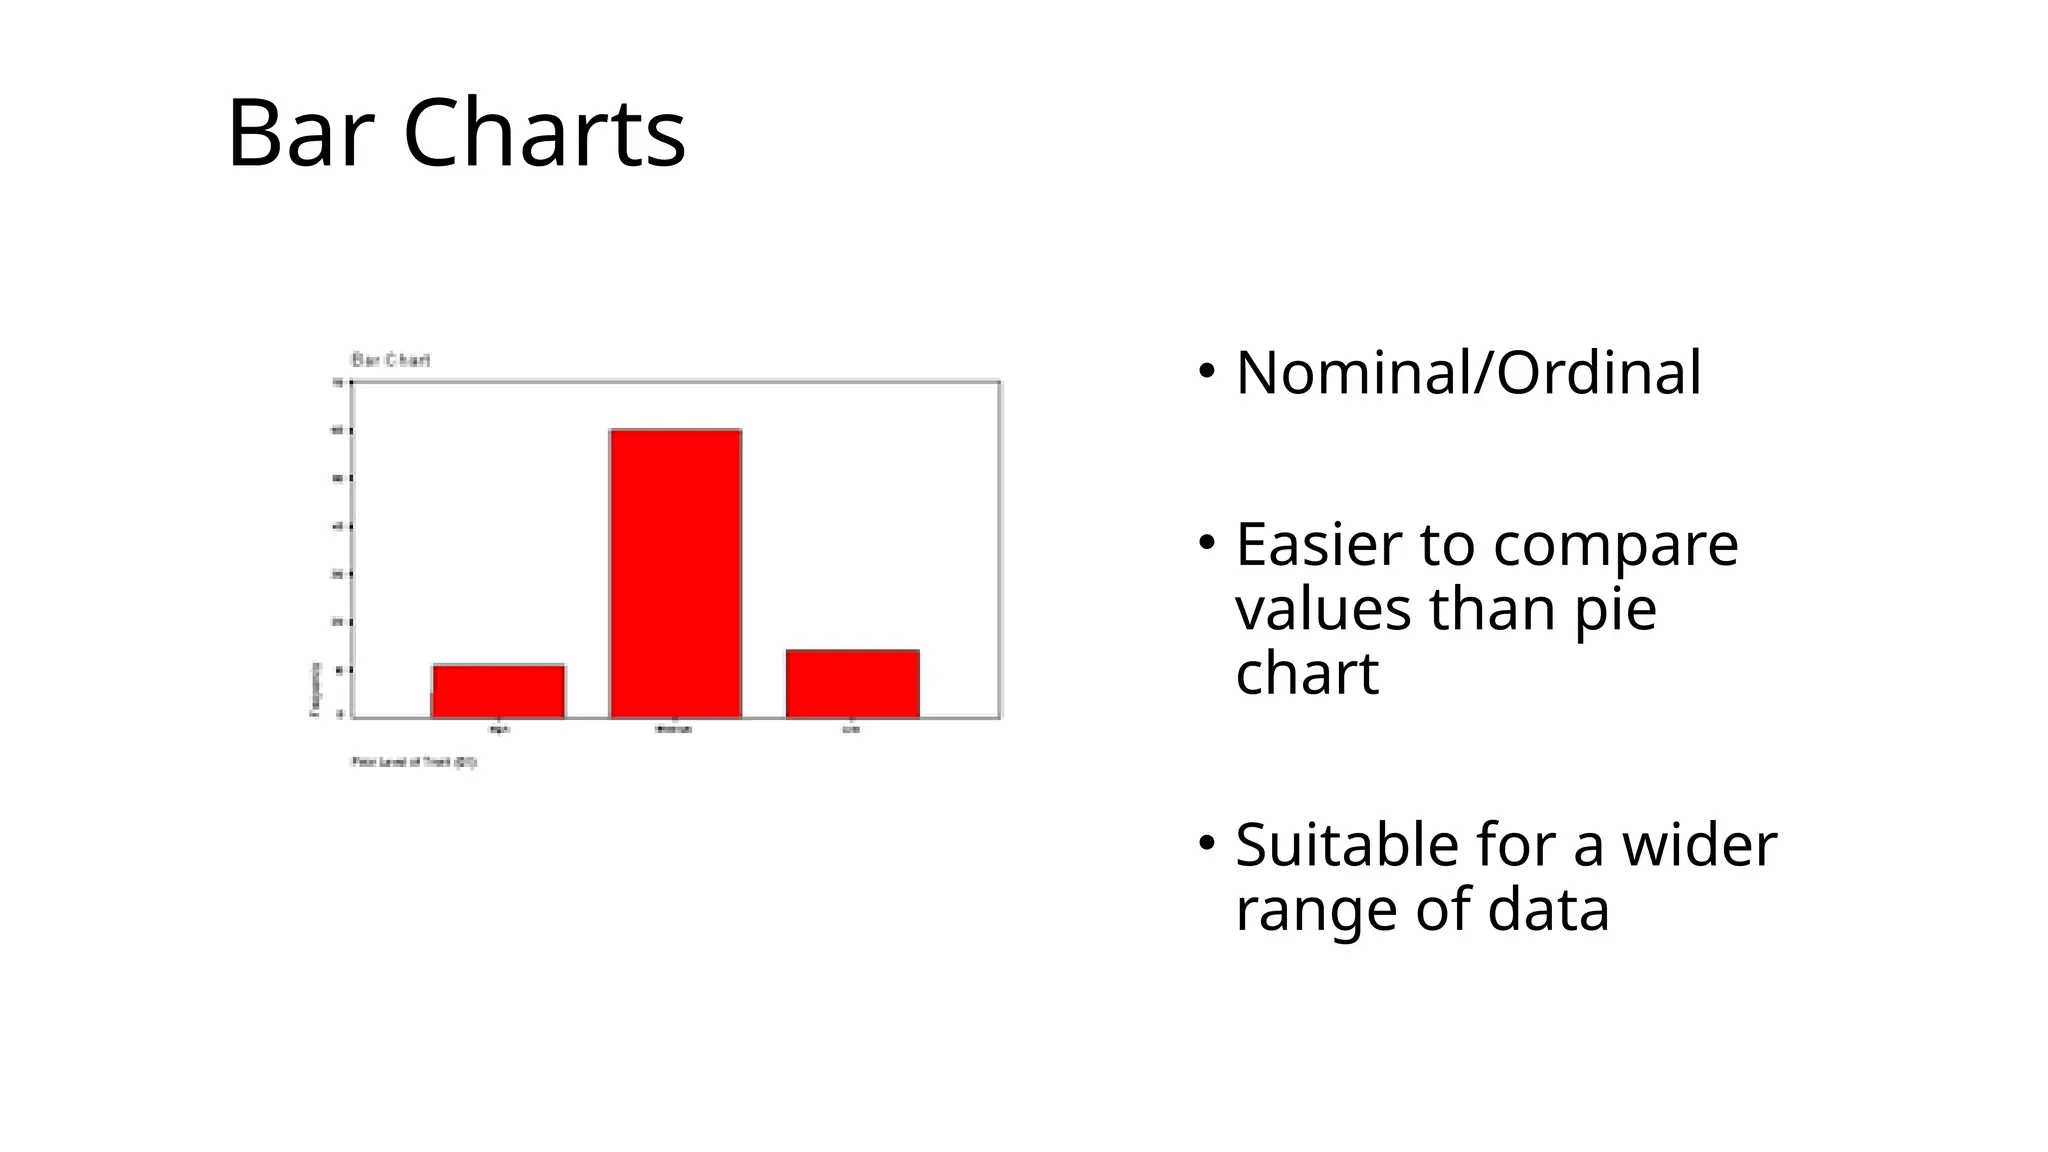
Graphic: Pie Chart or Bar Chart
54.
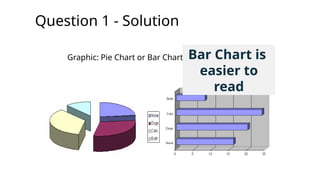
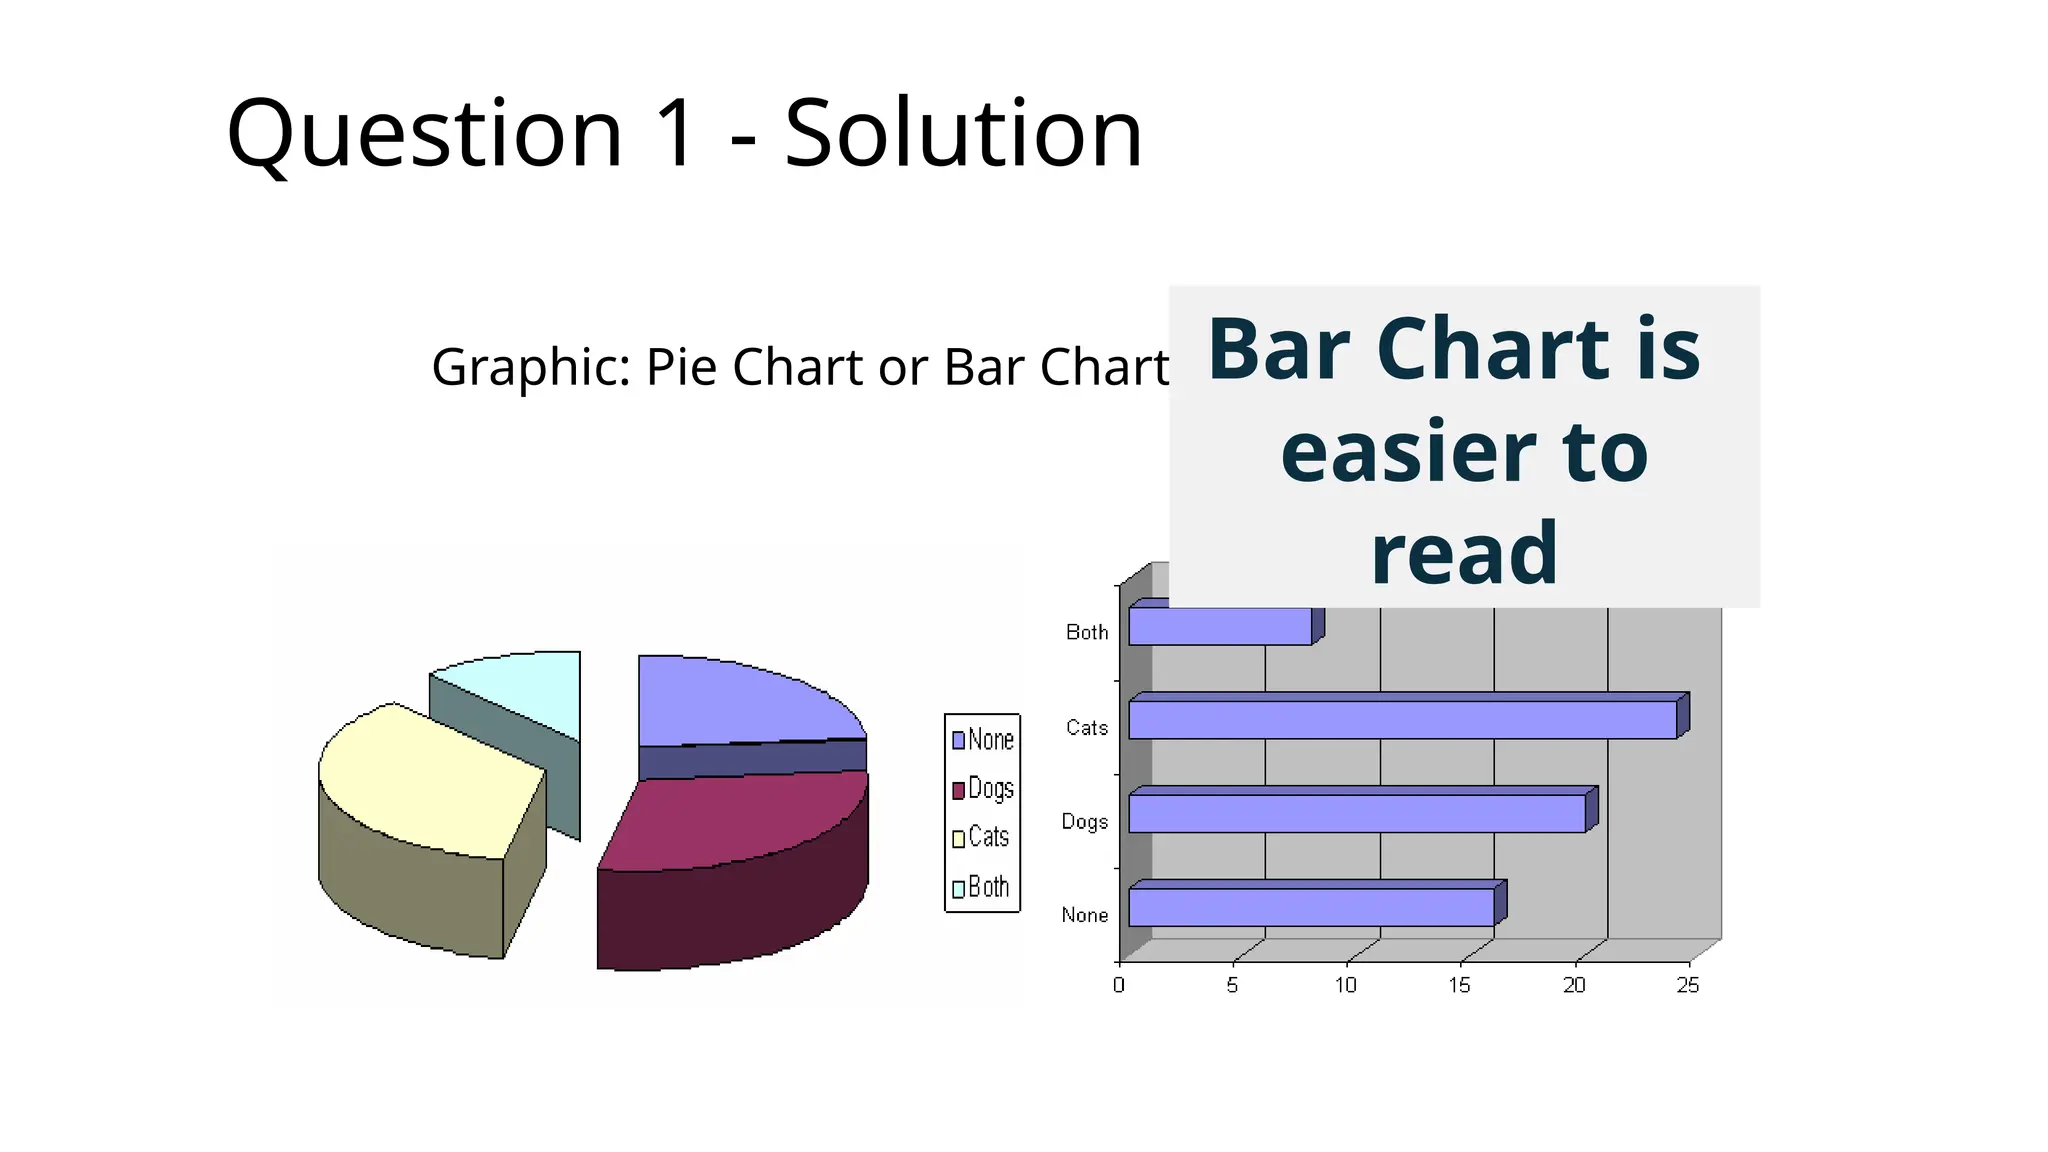
Question 1 -Solution
Graphic: Pie Chart or Bar Chart Bar Chart is
easier to
read
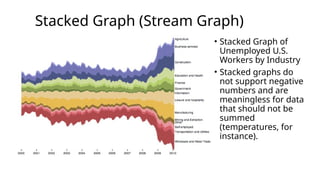
Stacked Graph (StreamGraph)
• Stacked Graph of
Unemployed U.S.
Workers by Industry
• Stacked graphs do
not support negative
numbers and are
meaningless for data
that should not be
summed
(temperatures, for
instance).
57.
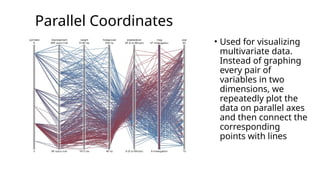
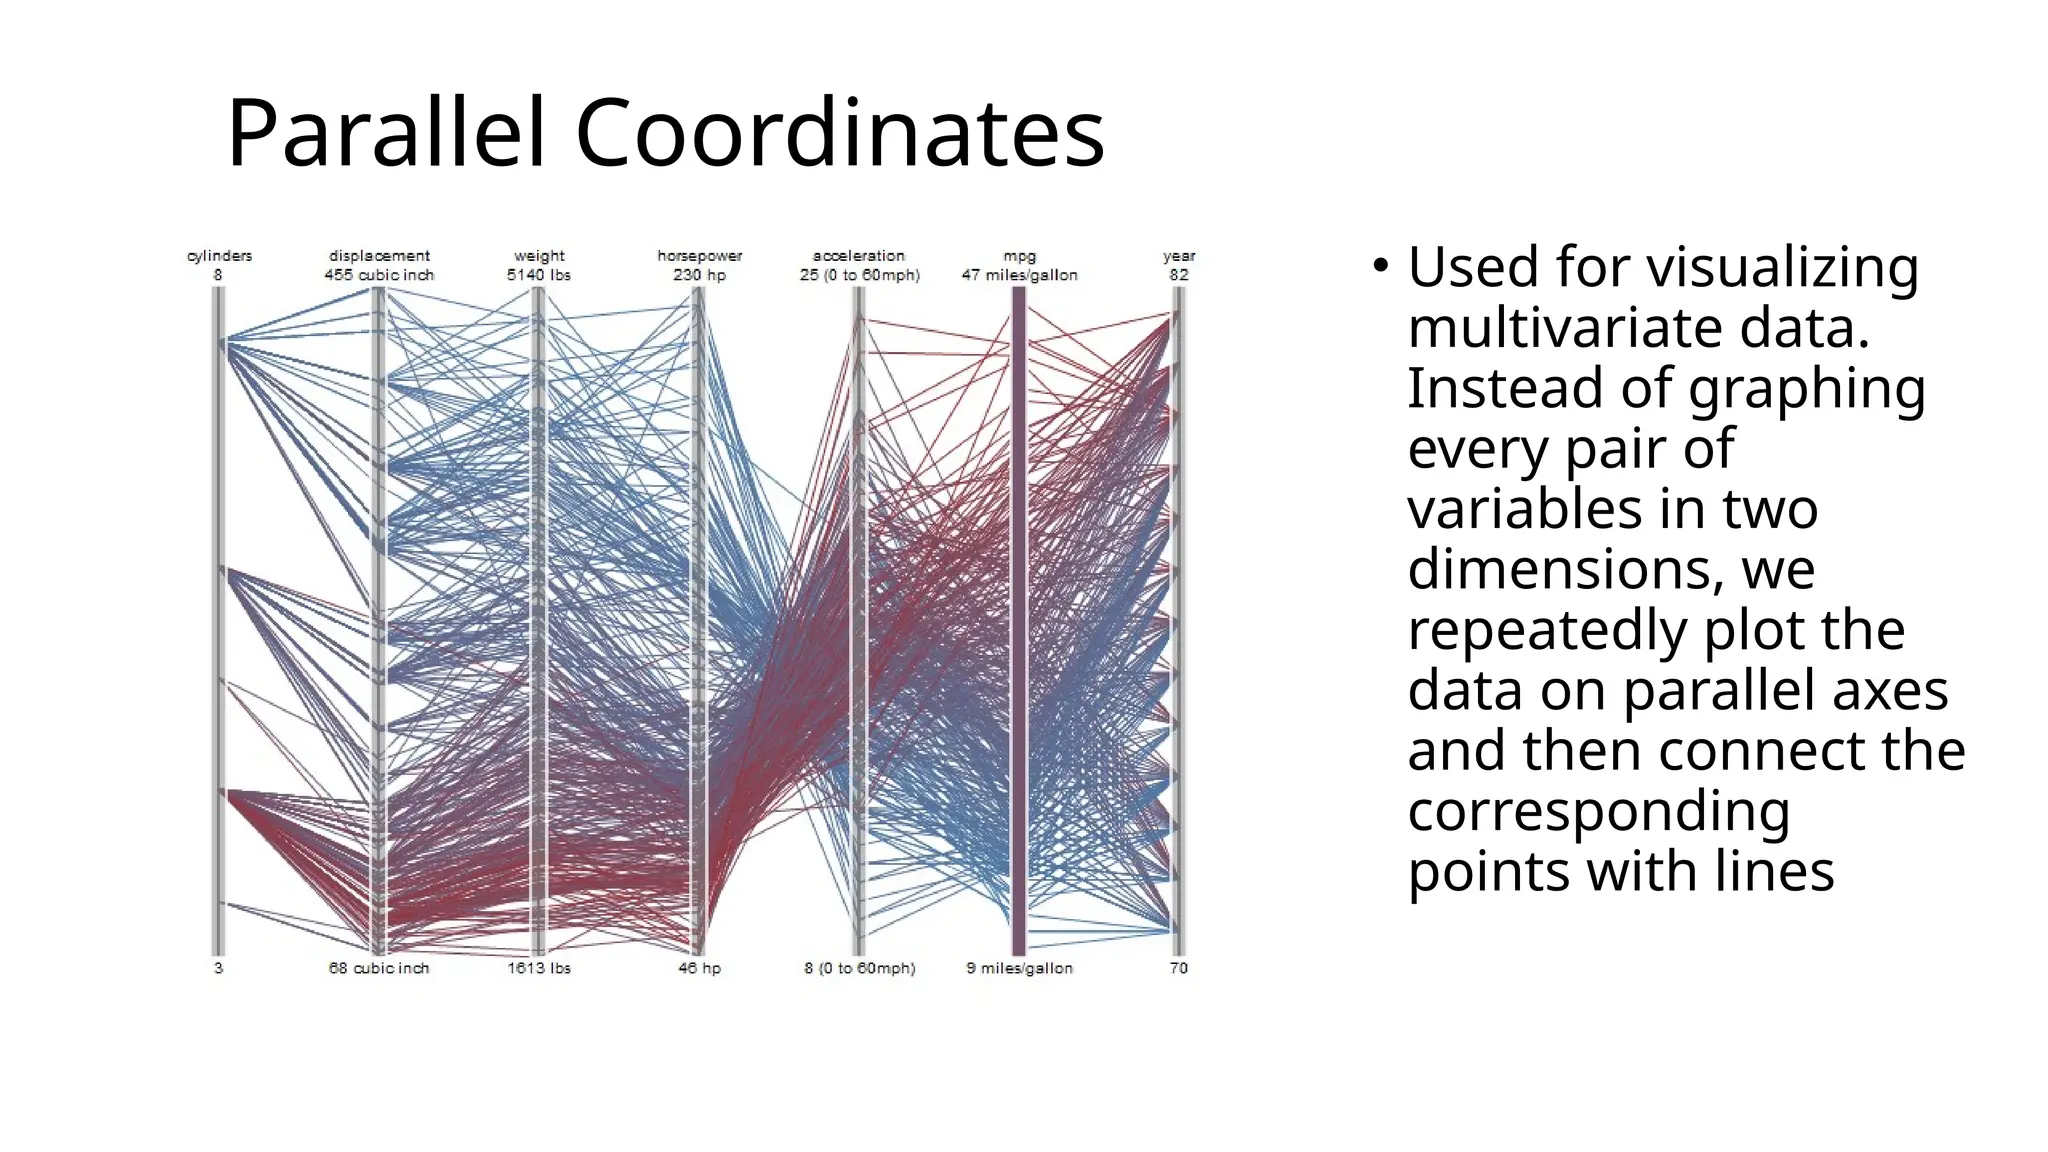
Parallel Coordinates
• Usedfor visualizing
multivariate data.
Instead of graphing
every pair of
variables in two
dimensions, we
repeatedly plot the
data on parallel axes
and then connect the
corresponding
points with lines
58.
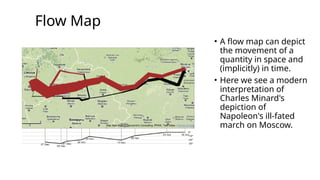
Flow Map
• Aflow map can depict
the movement of a
quantity in space and
(implicitly) in time.
• Here we see a modern
interpretation of
Charles Minard's
depiction of
Napoleon's ill-fated
march on Moscow.
59.
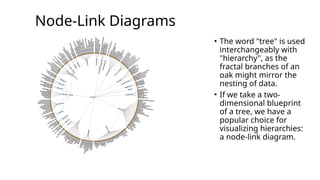
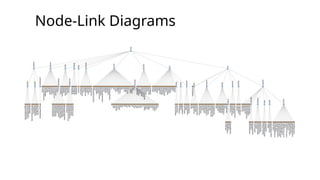
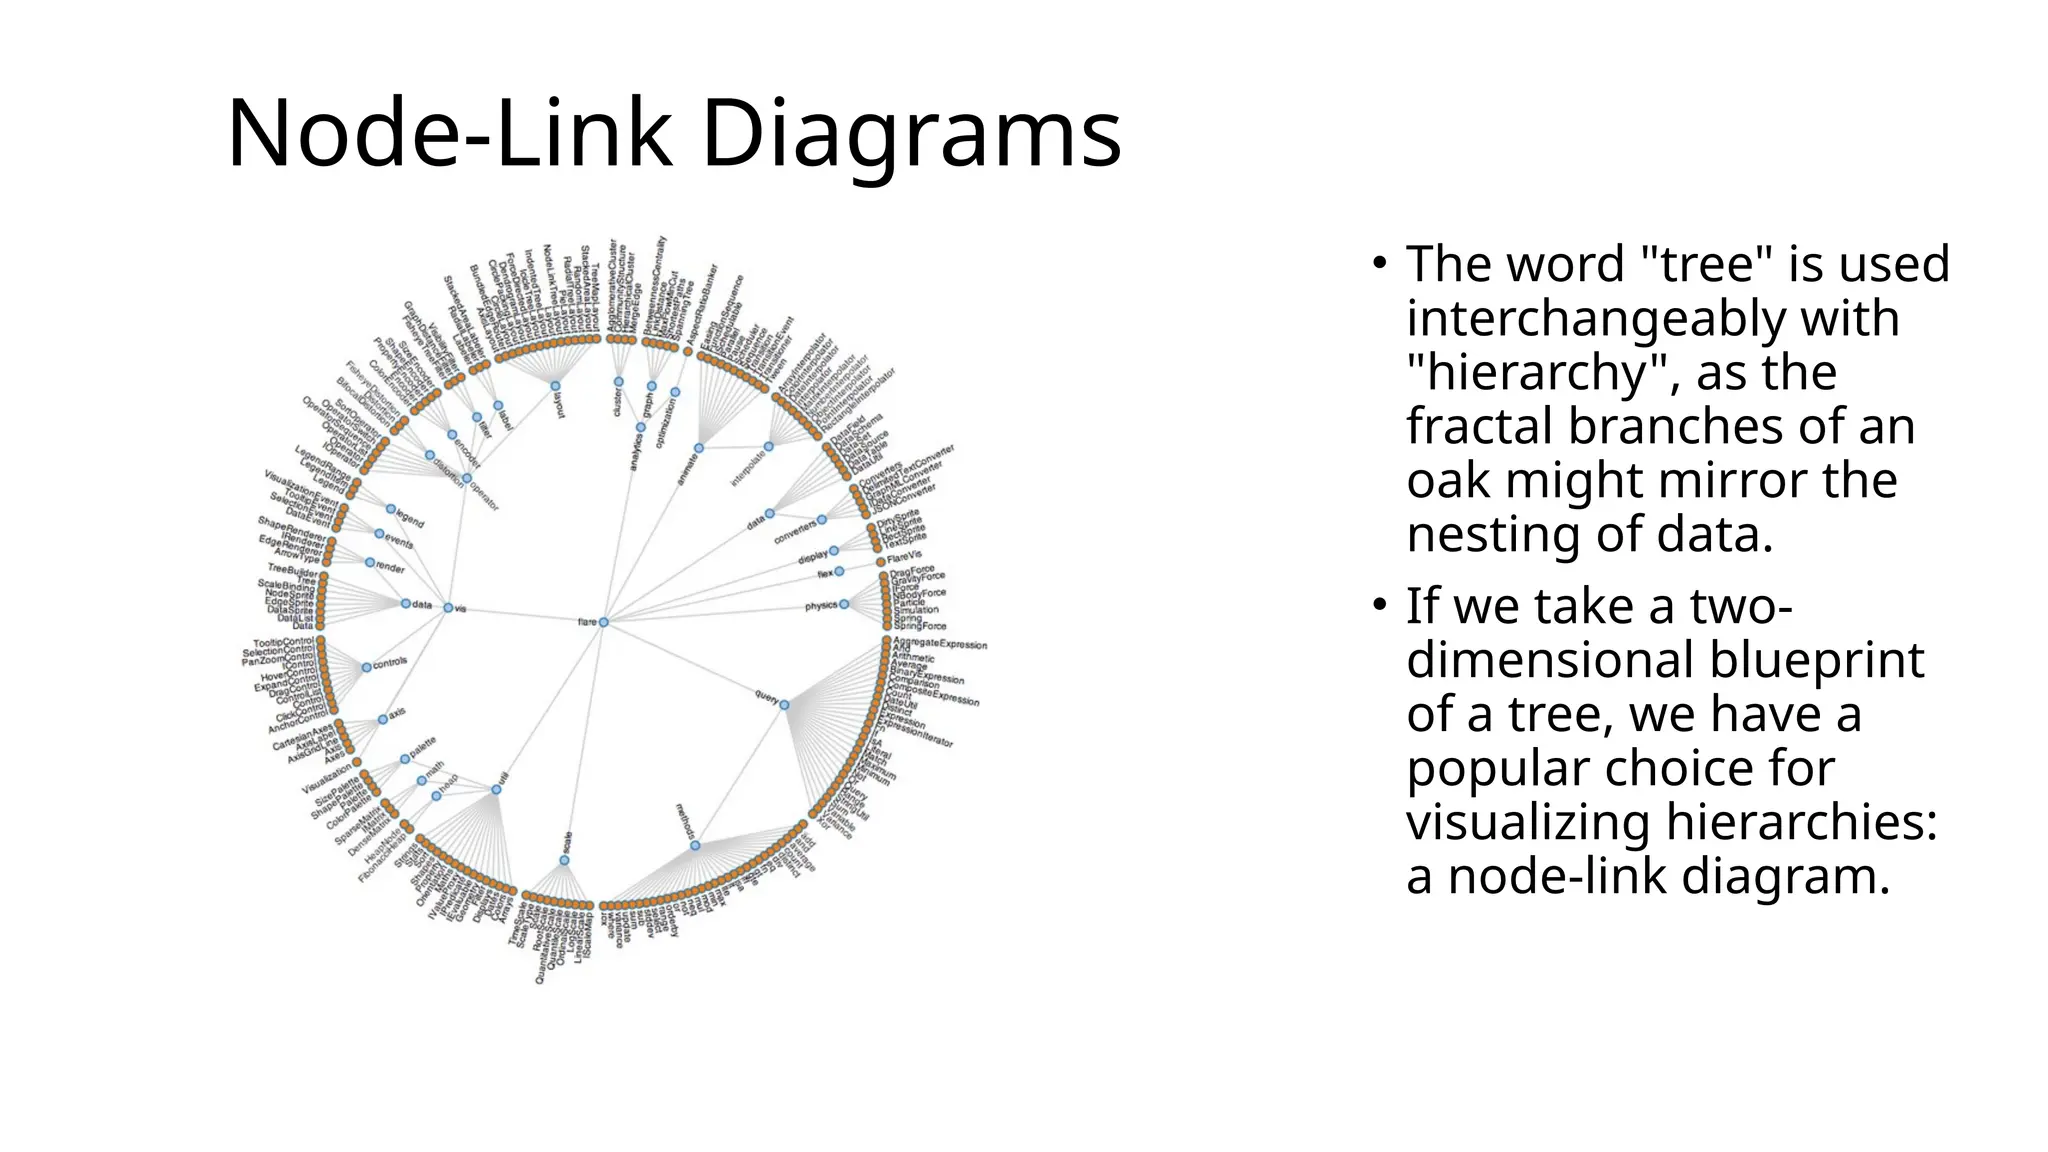
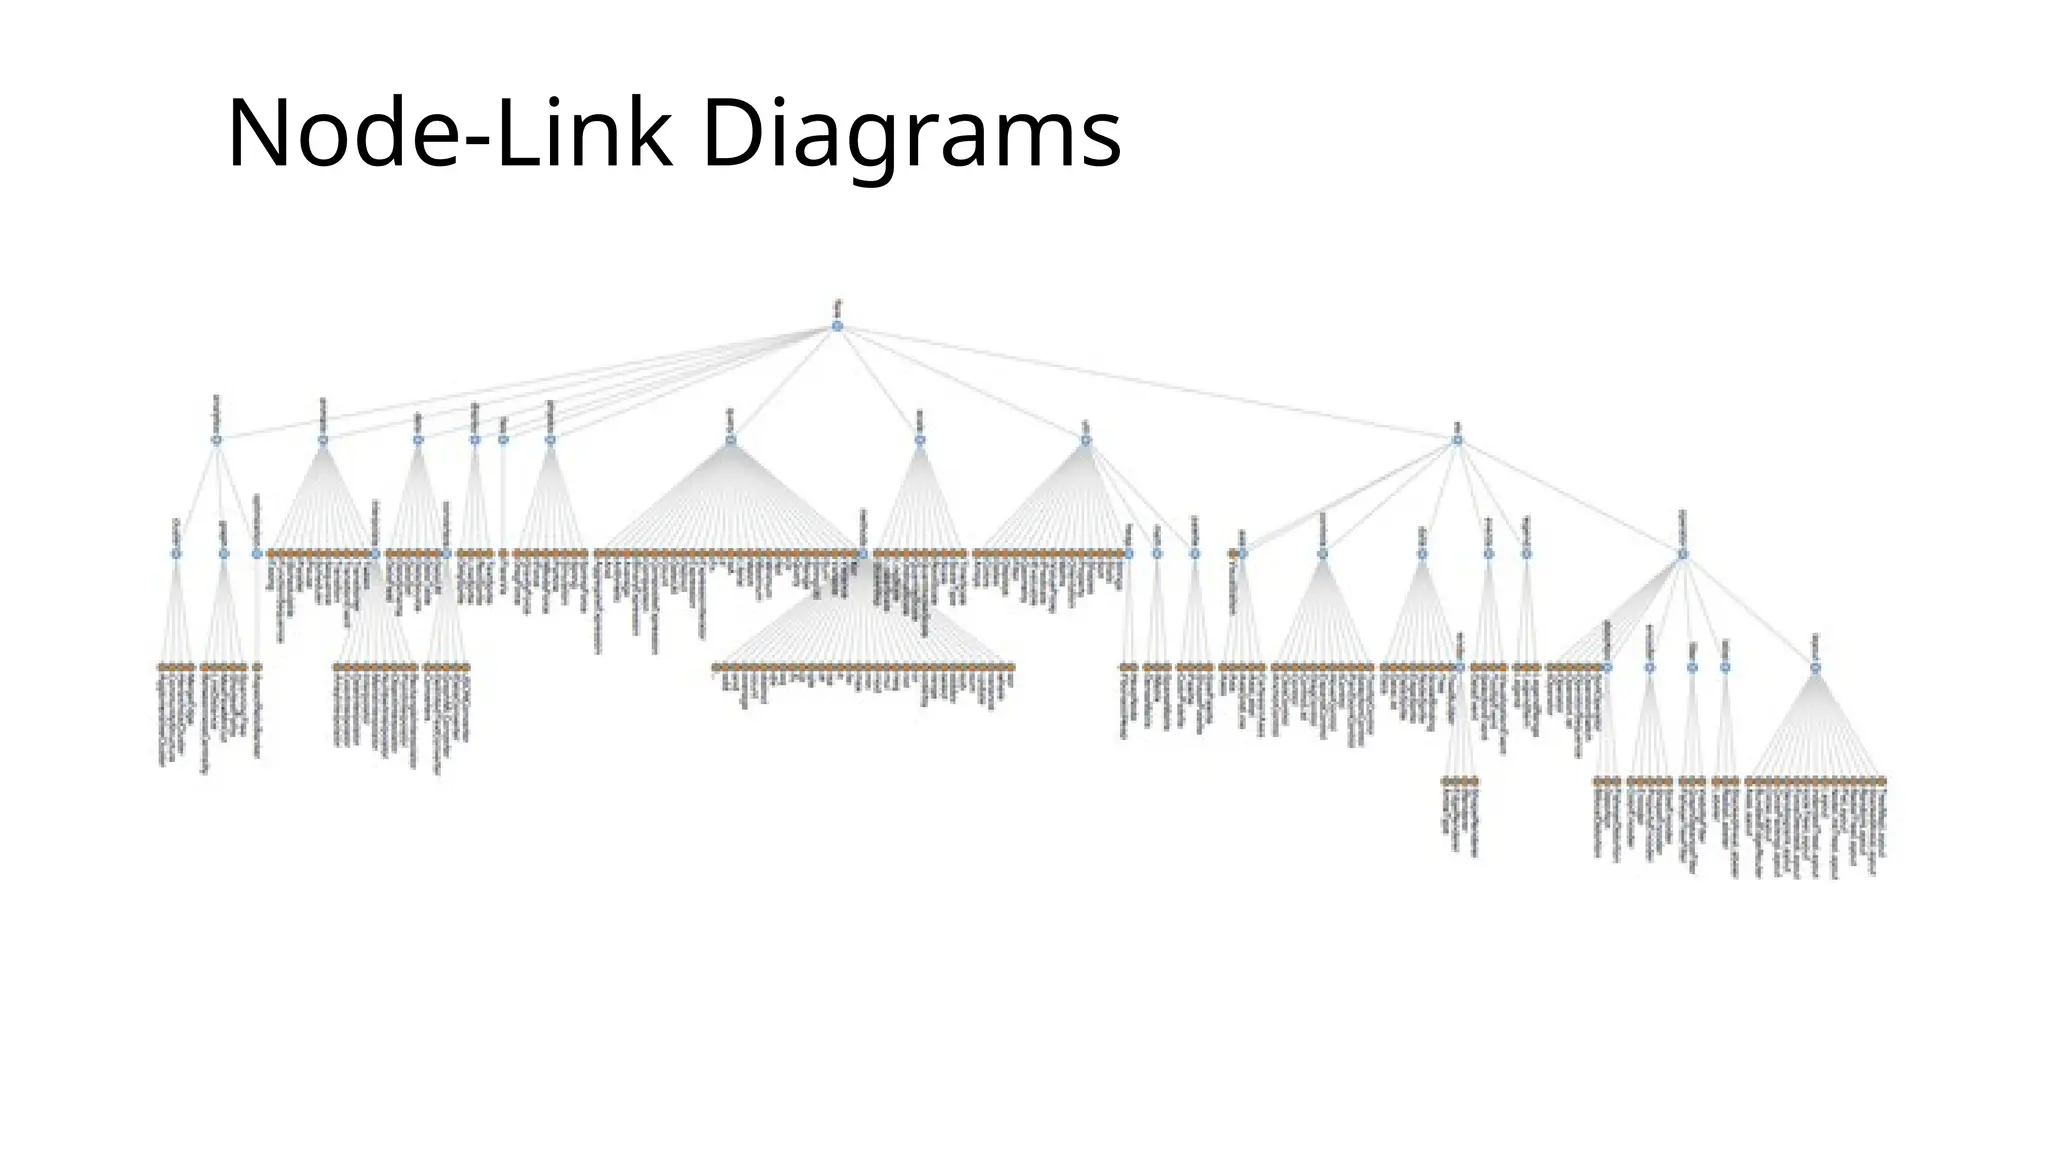
Node-Link Diagrams
• Theword "tree" is used
interchangeably with
"hierarchy", as the
fractal branches of an
oak might mirror the
nesting of data.
• If we take a two-
dimensional blueprint
of a tree, we have a
popular choice for
visualizing hierarchies:
a node-link diagram.
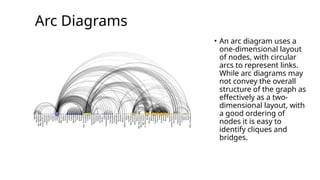
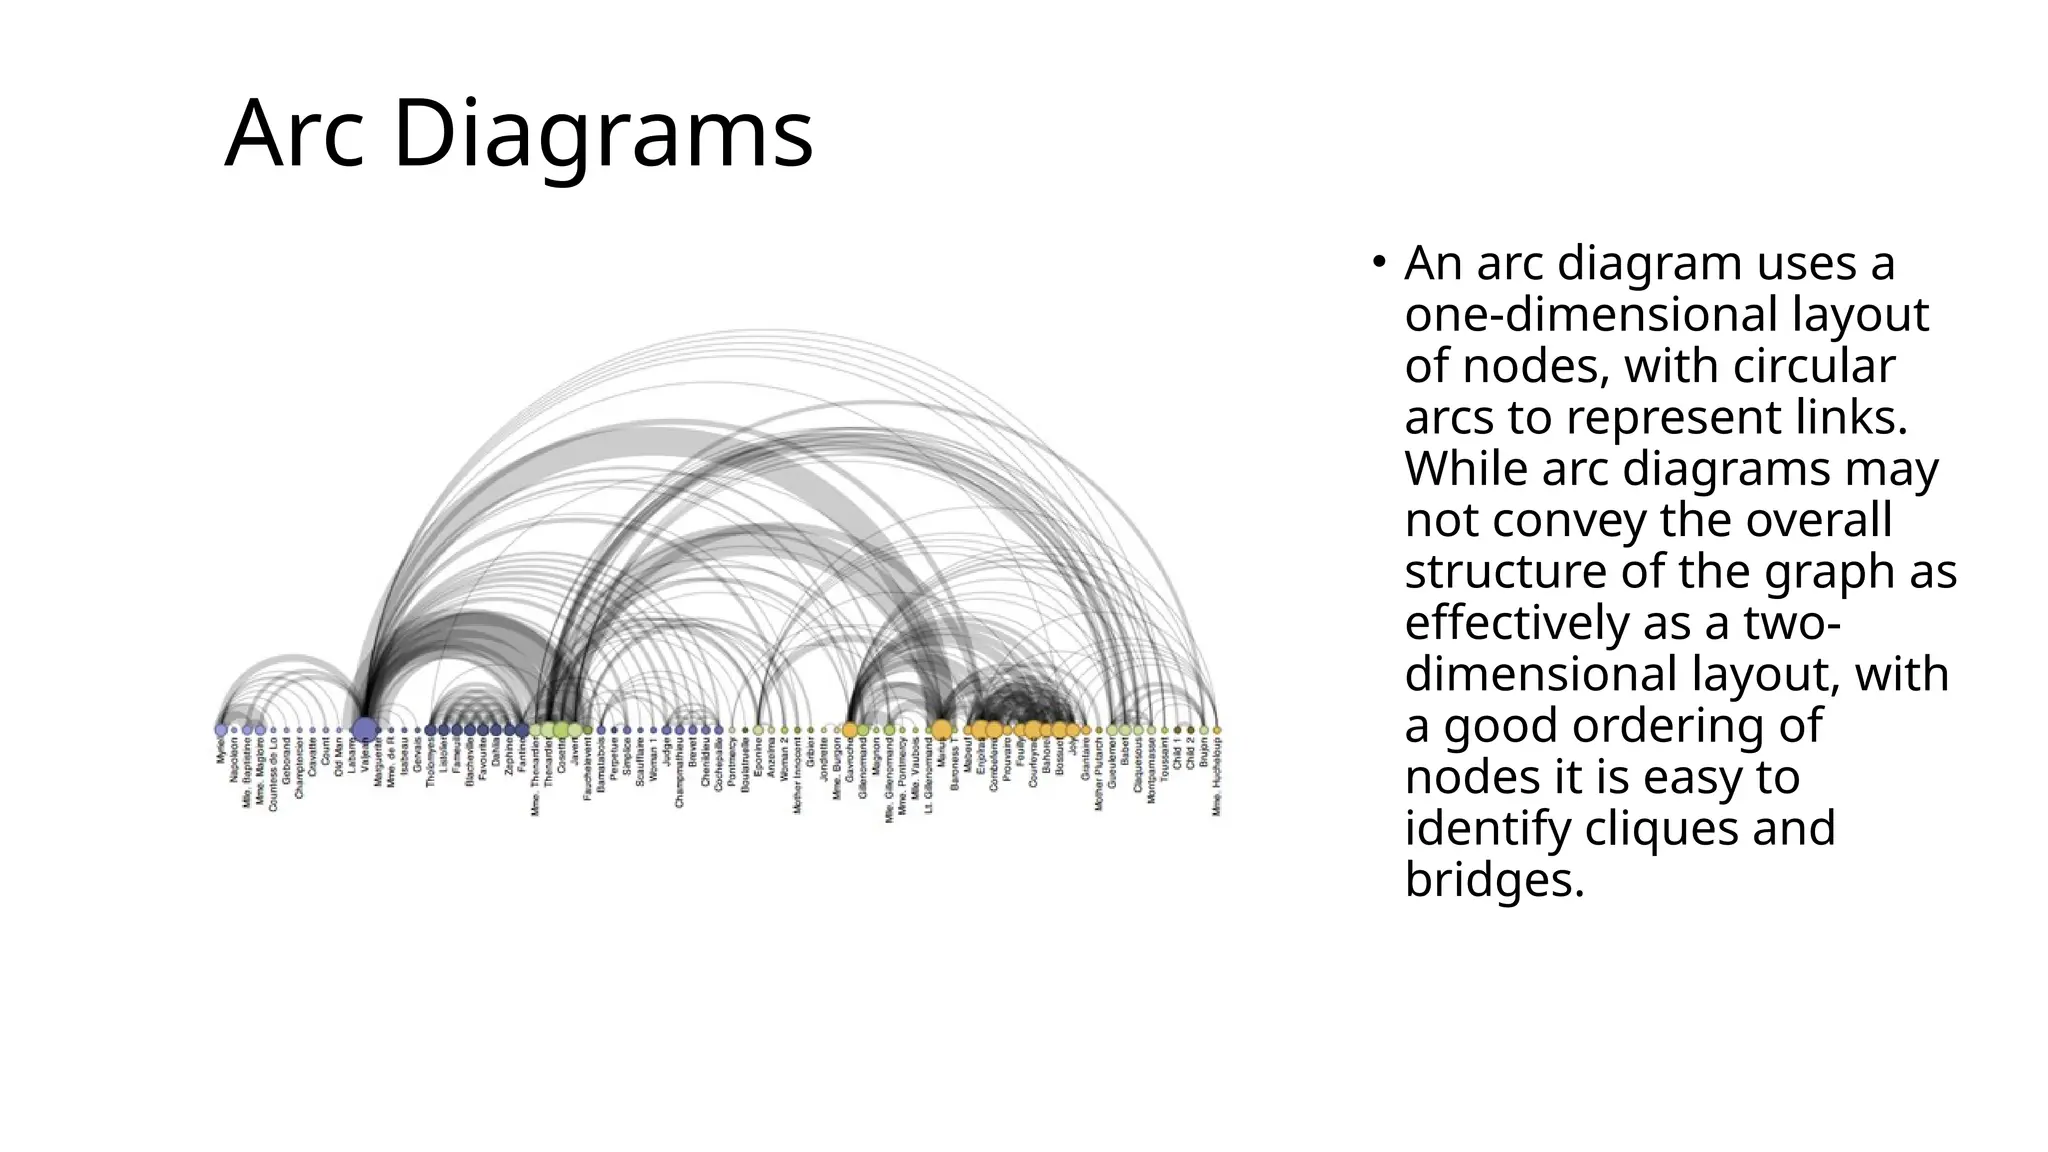
Arc Diagrams
• Anarc diagram uses a
one-dimensional layout
of nodes, with circular
arcs to represent links.
While arc diagrams may
not convey the overall
structure of the graph as
effectively as a two-
dimensional layout, with
a good ordering of
nodes it is easy to
identify cliques and
bridges.
• Some studentswill be using a dataset as part of their
research. This is typically thousands of rows of data.
• We are not talking about the data you might be
collecting from surveys and interviews, but rather a
pre-existing set of data.
• If the data is the key consideration in your research
(although not all projects will necessarily be
concerned with large datasets) it is important to
consider several questions.
Dataset Characteristics
64.
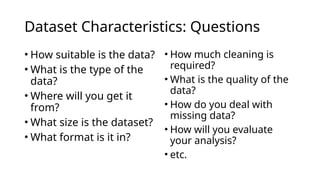
Dataset Characteristics: Questions
•How suitable is the data?
• What is the type of the
data?
• Where will you get it
from?
• What size is the dataset?
• What format is it in?
• How much cleaning is
required?
• What is the quality of the
data?
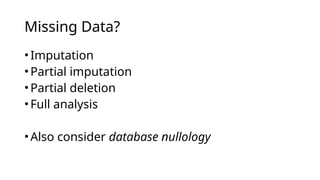
• How do you deal with
missing data?
• How will you evaluate
your analysis?
• etc.
65.
• Determining thesuitability of the data is a vital
consideration, it is not sufficient to simply locate a
dataset that is thematically linked to your research
question, it must be appropriate to explore the
questions that you want to ask.
• For example, just because you want to do Credit Card
Fraud detection and you have a dataset that contains
Credit Card transactions or was used in another Credit
Card Fraud project, does not mean that it will be
suitable for your project.
Dataset Characteristics: Suitability
66.
• Is thedata already labelled?
• This is very important for supervised learning
problems.
• To take the credit card fraud example again, you can
probably get as many credit card transactions as you
like but you probably won't be able to get them
marked up as fraudulent and non-fraudulent.
Suitability: Labelling
67.
• The samething goes for a lot of text analytics
problems - can you get people to label thousands of
documents as being interesting or non-interesting
to them so that you can train a predictive model?
• The availability of labelled data is a key consideration
for any supervised learning problem.
• The areas of semi-supervised learning and active
learning try to address this problem and have some
very interesting open research questions.
Suitability: Labelling
68.
• Two importantconsiderations:
• The Curse of Dimensionality – When the dimensionality increases,
the volume of the space increases so fast that the available data
becomes sparse. In order to obtain a statistically sound result,
the amount of data you need often grows exponentially with the
dimensionality.
• The No Free Lunch Theorem - Classifier performance depends
greatly on the characteristics of the data to be classified. There is
no single classifier that works best on all given problems.
Suitability: Labelling
69.
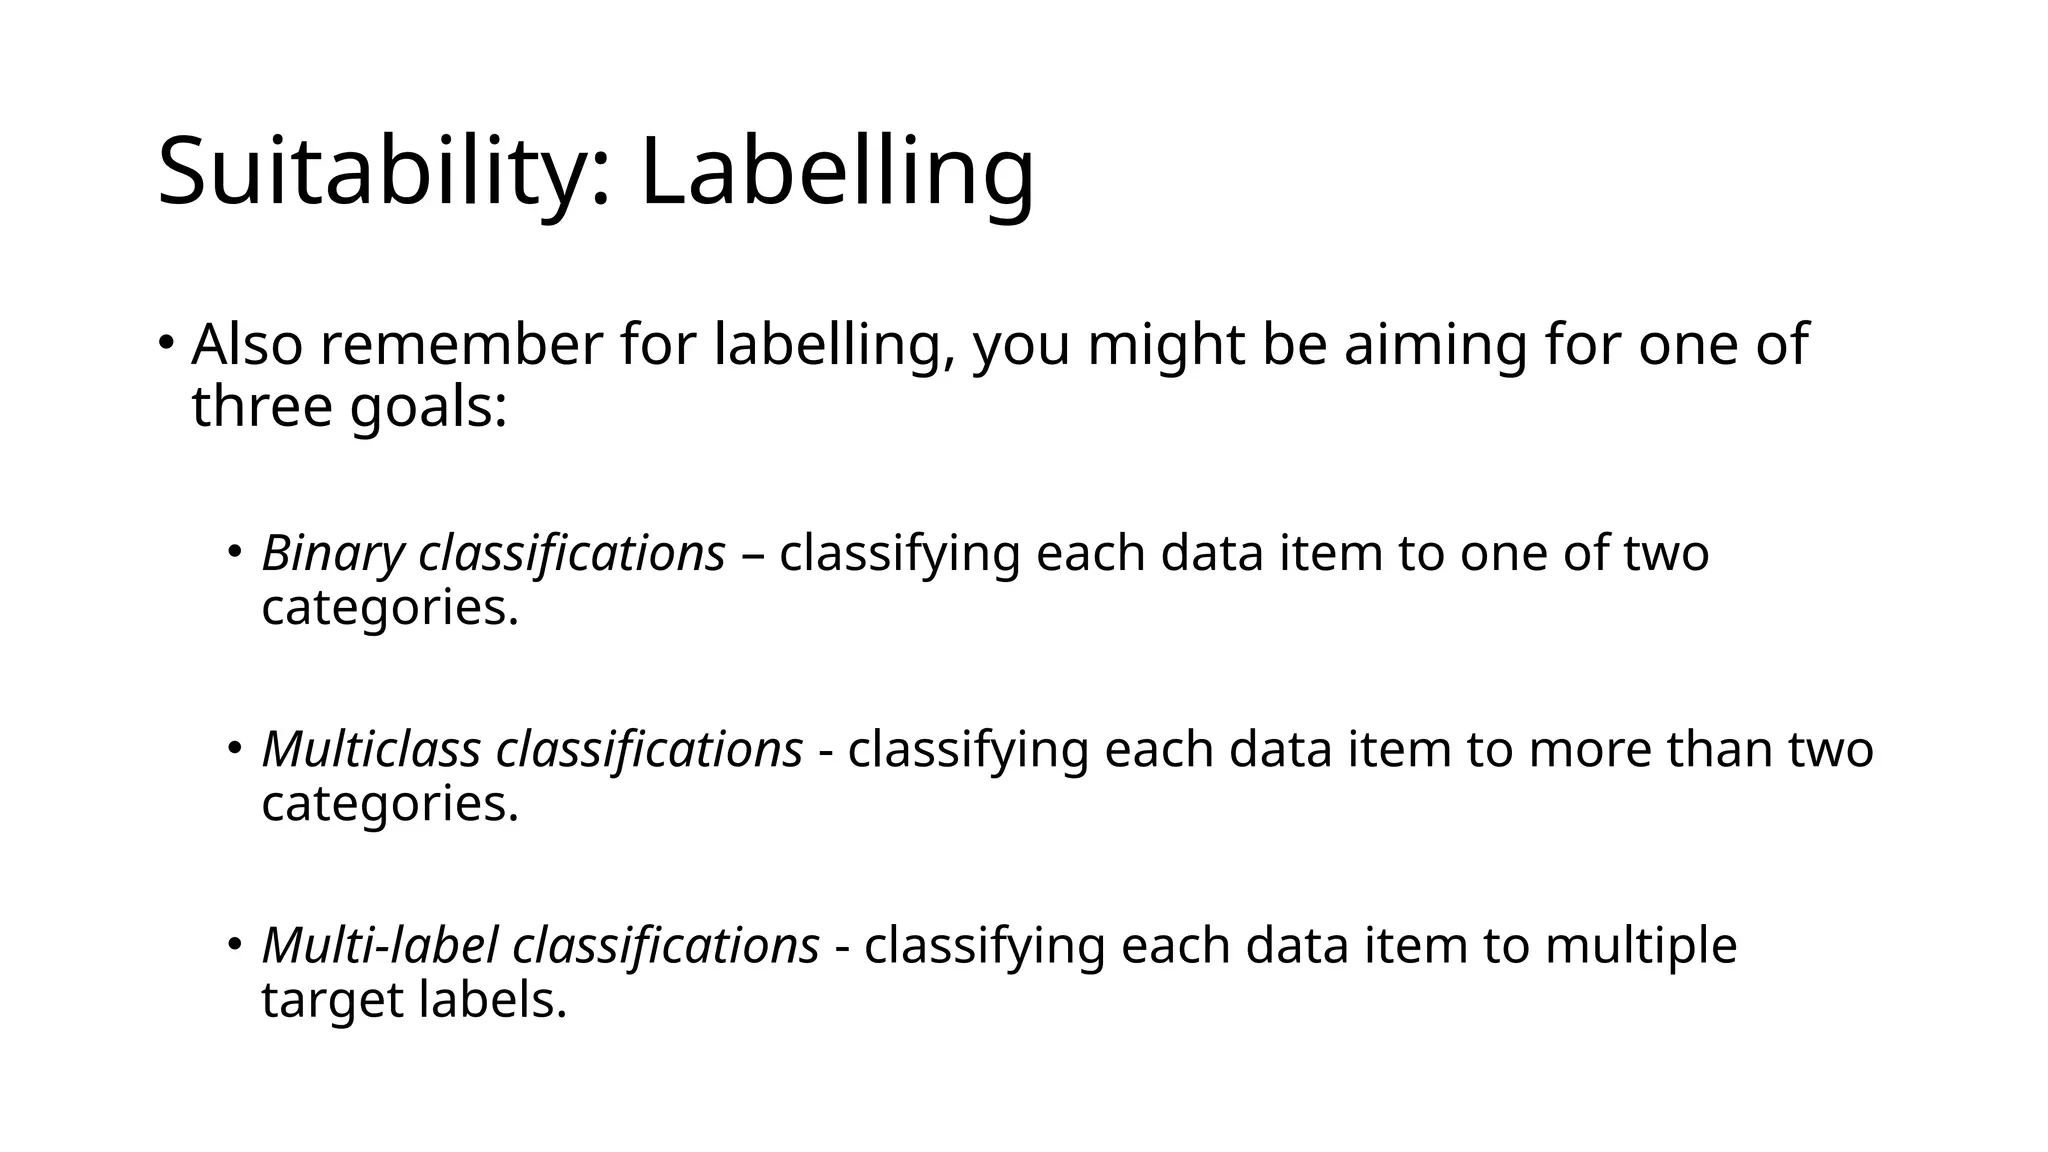
• Also rememberfor labelling, you might be aiming for one of
three goals:
• Binary classifications – classifying each data item to one of two
categories.
• Multiclass classifications - classifying each data item to more than two
categories.
• Multi-label classifications - classifying each data item to multiple
target labels.
Suitability: Labelling
70.
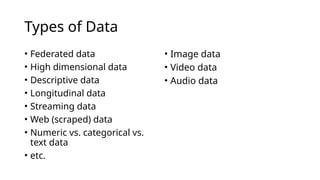
Types of Data
•Federated data
• High dimensional data
• Descriptive data
• Longitudinal data
• Streaming data
• Web (scraped) data
• Numeric vs. categorical vs.
text data
• etc.
• Image data
• Video data
• Audio data
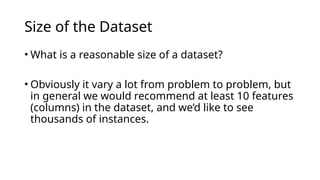
• What isa reasonable size of a dataset?
• Obviously it vary a lot from problem to problem, but
in general we would recommend at least 10 features
(columns) in the dataset, and we’d like to see
thousands of instances.
Size of the Dataset
73.
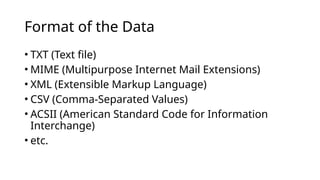
• TXT (Textfile)
• MIME (Multipurpose Internet Mail Extensions)
• XML (Extensible Markup Language)
• CSV (Comma-Separated Values)
• ACSII (American Standard Code for Information
Interchange)
• etc.
Format of the Data
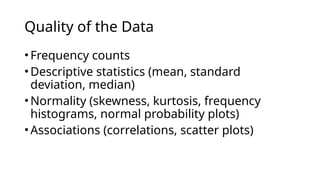
•Frequency counts
•Descriptive statistics(mean, standard
deviation, median)
•Normality (skewness, kurtosis, frequency
histograms, normal probability plots)
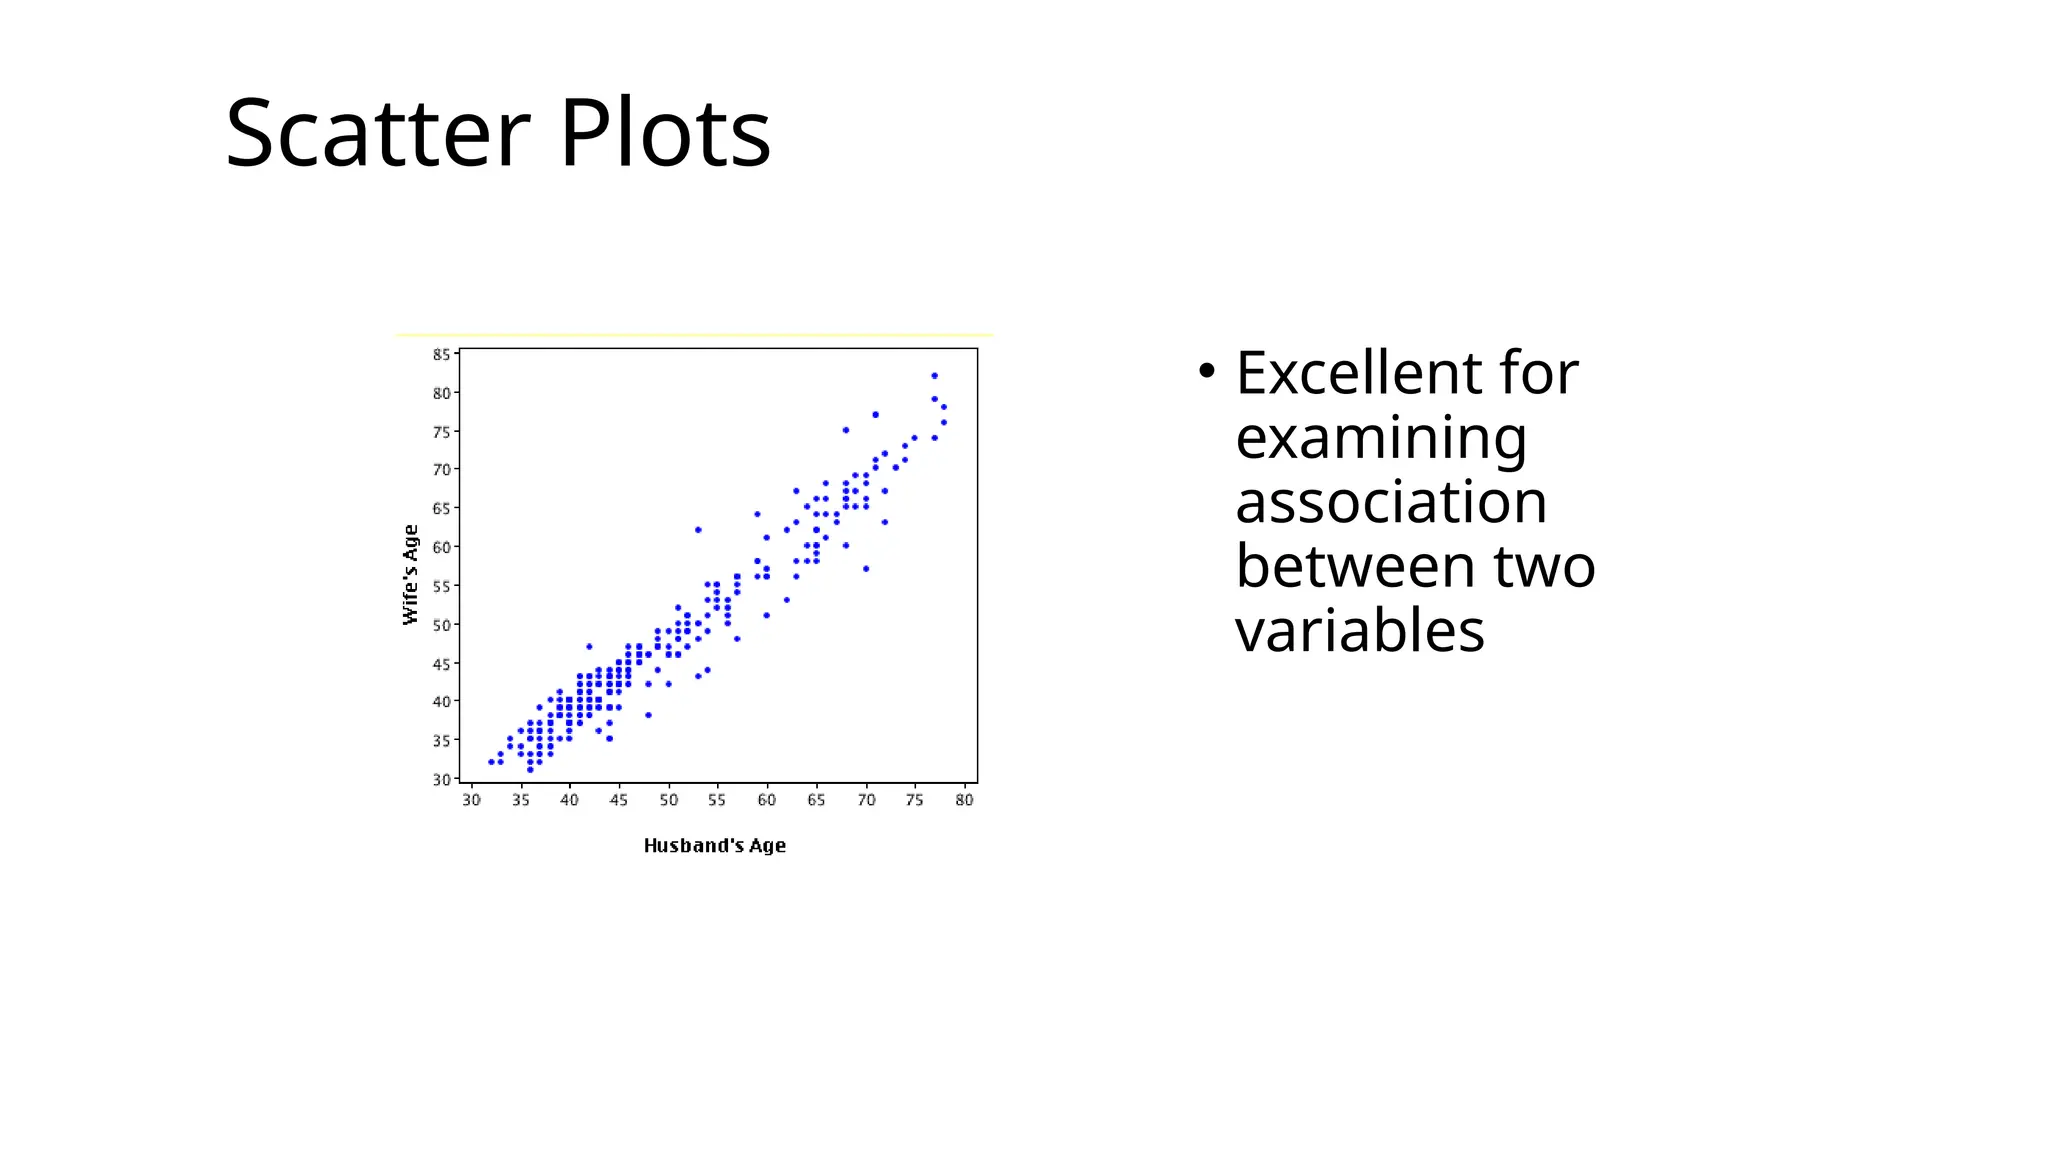
•Associations (correlations, scatter plots)
Quality of the Data
•What about stufflike?
•Area under the Curve
•Misclassification Error
•Confusion Matrix
•N-fold Cross Validation
•ROC Graph
•Log-Loss and Hinge-Loss
Evaluation
79.
• These aregood for evaluating the analysis, so they
are good for checking how good the model is based
on the dataset, and are definitely part of the
evaluation, but if you want to discuss the findings
with respect to the real-world (and to the research
question) you must do the following:
•Test predictions using the real-world
Evaluation


![Wk. 3. Data [12-05-2021] (2).ppt](https://cdn.slidesharecdn.com/ss_thumbnails/wk-240205070901-8f81e253-thumbnail.jpg?width=600ounds&width=560&fit=bounds)


