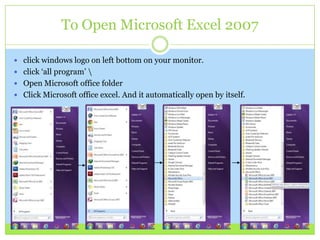
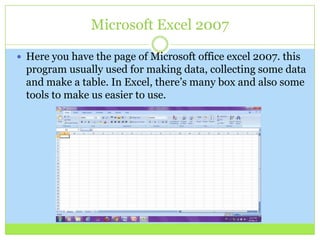
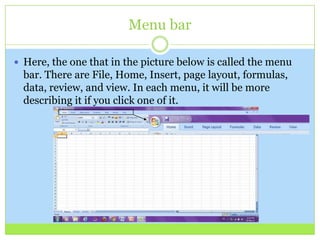
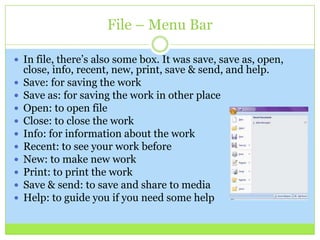
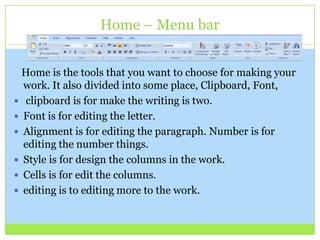
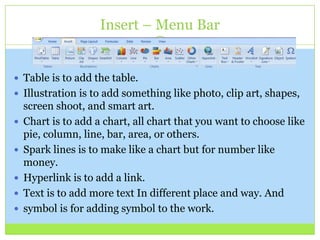
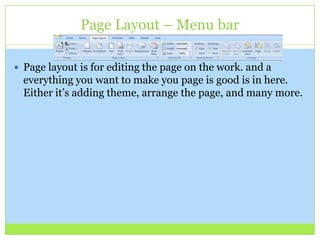
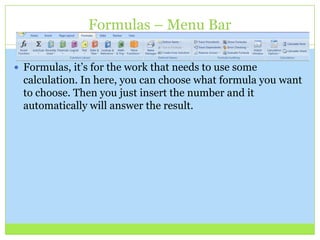
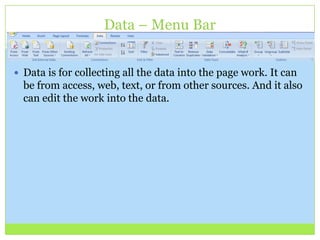
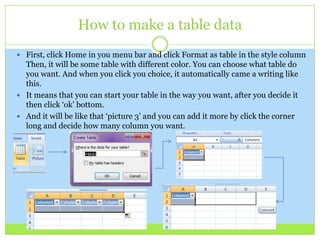
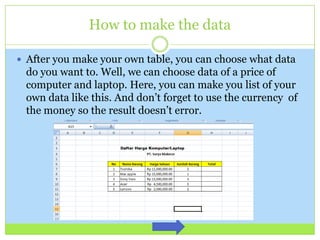
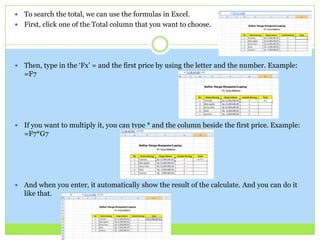
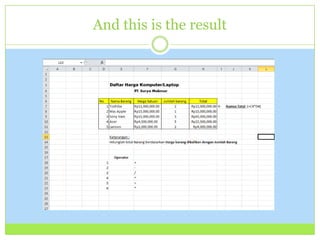
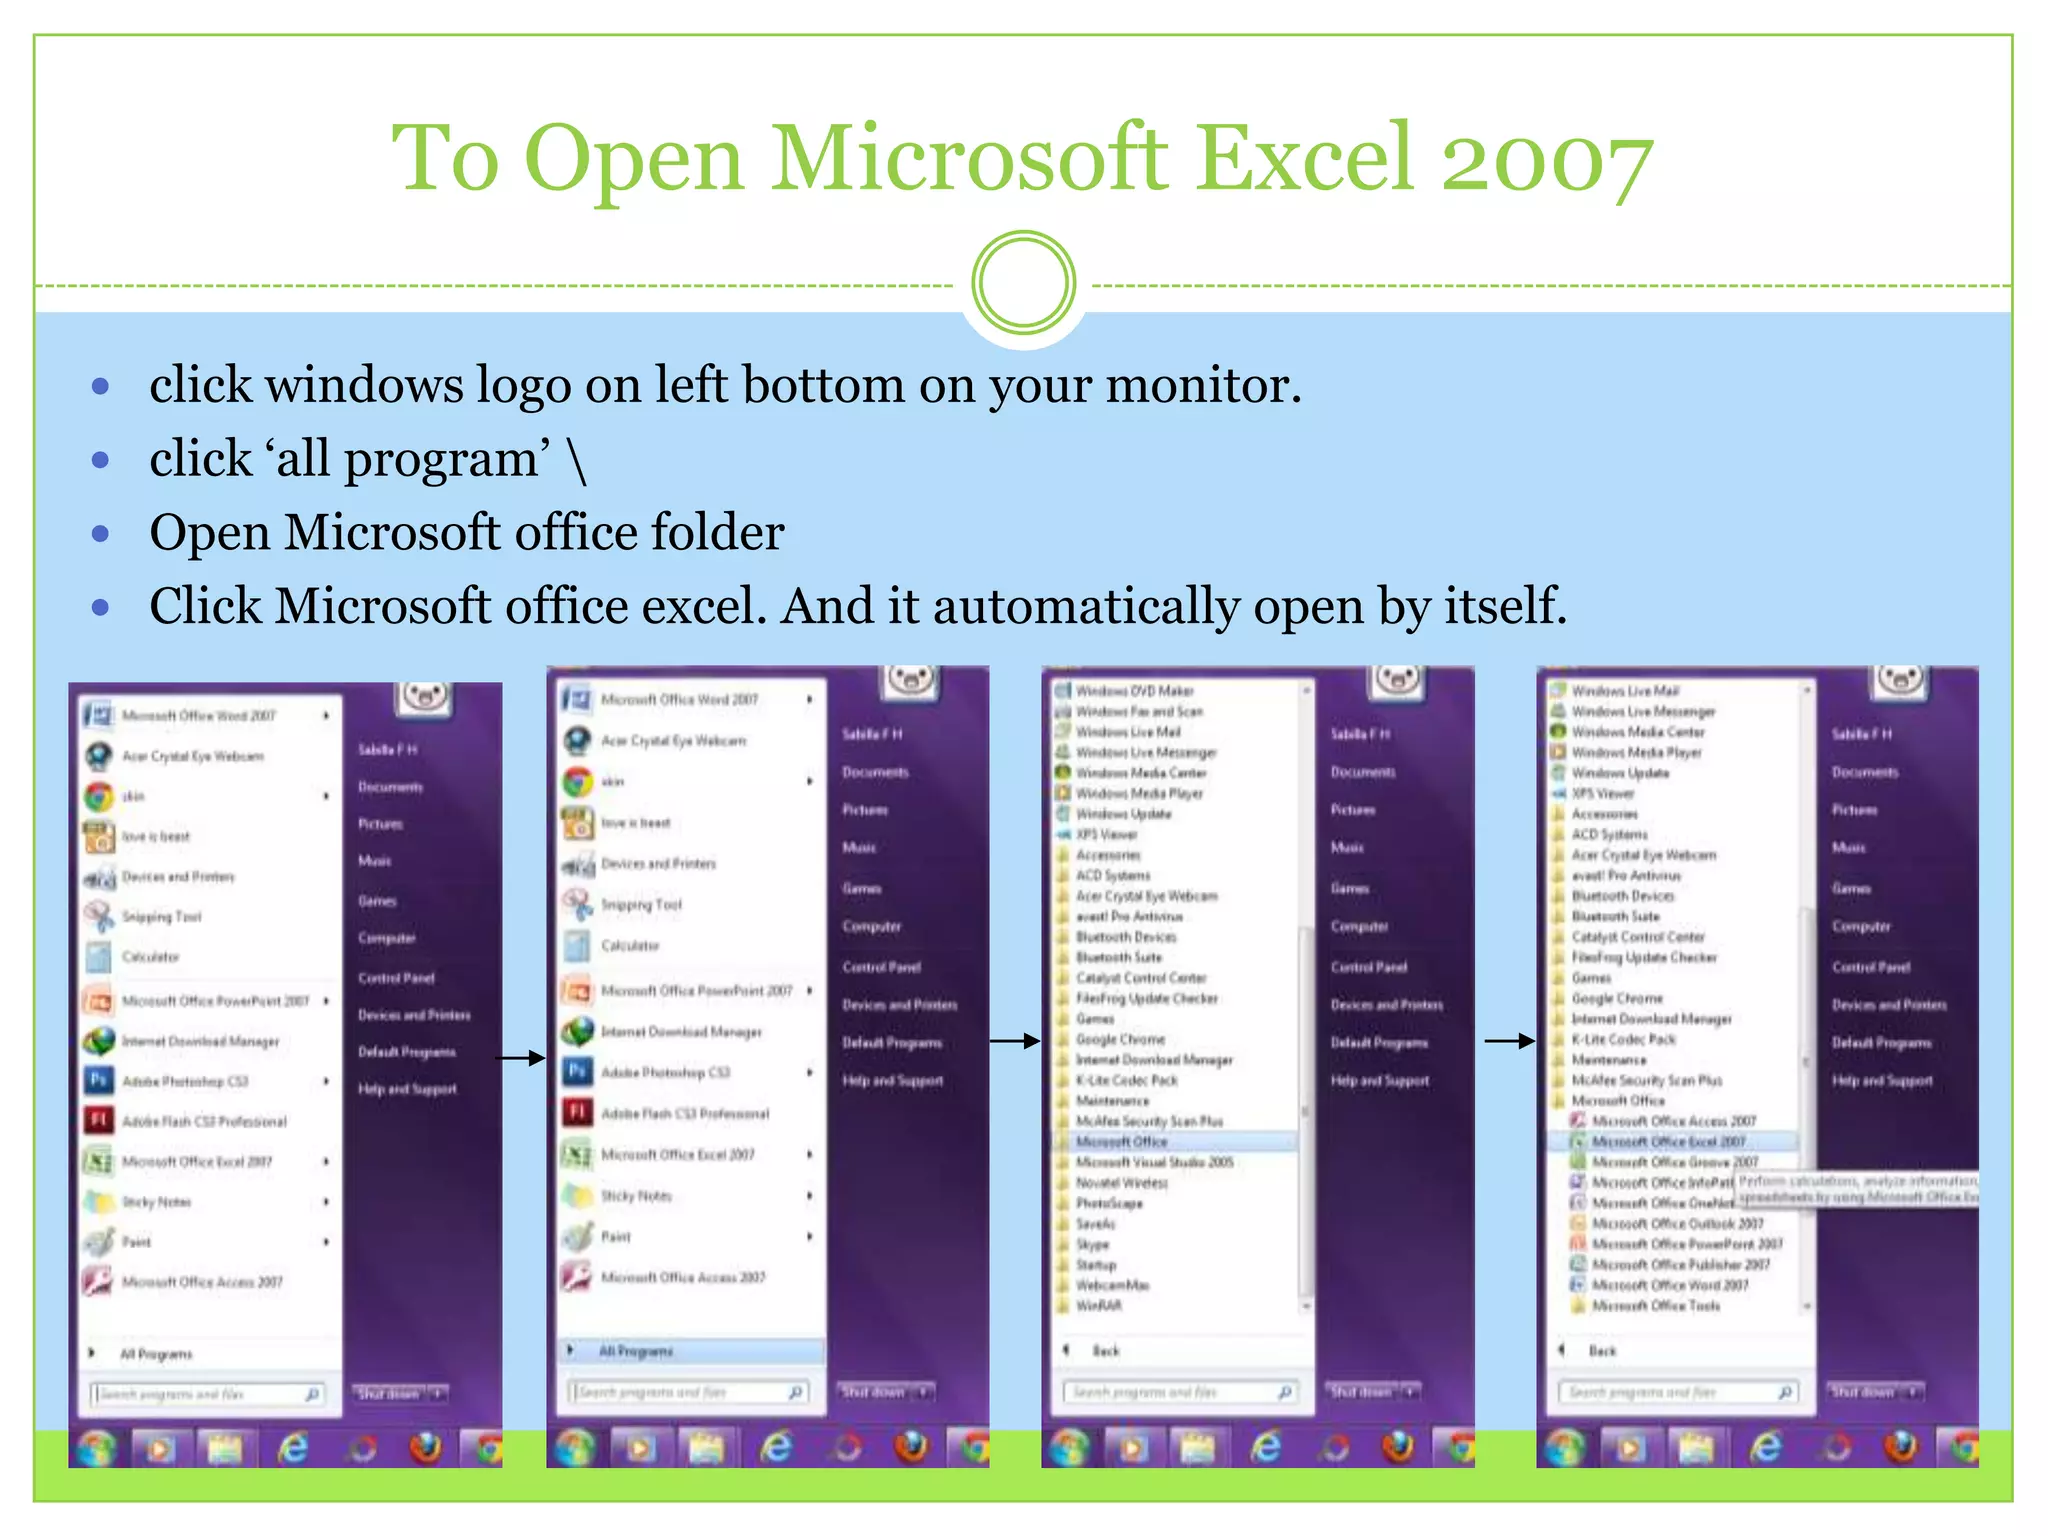
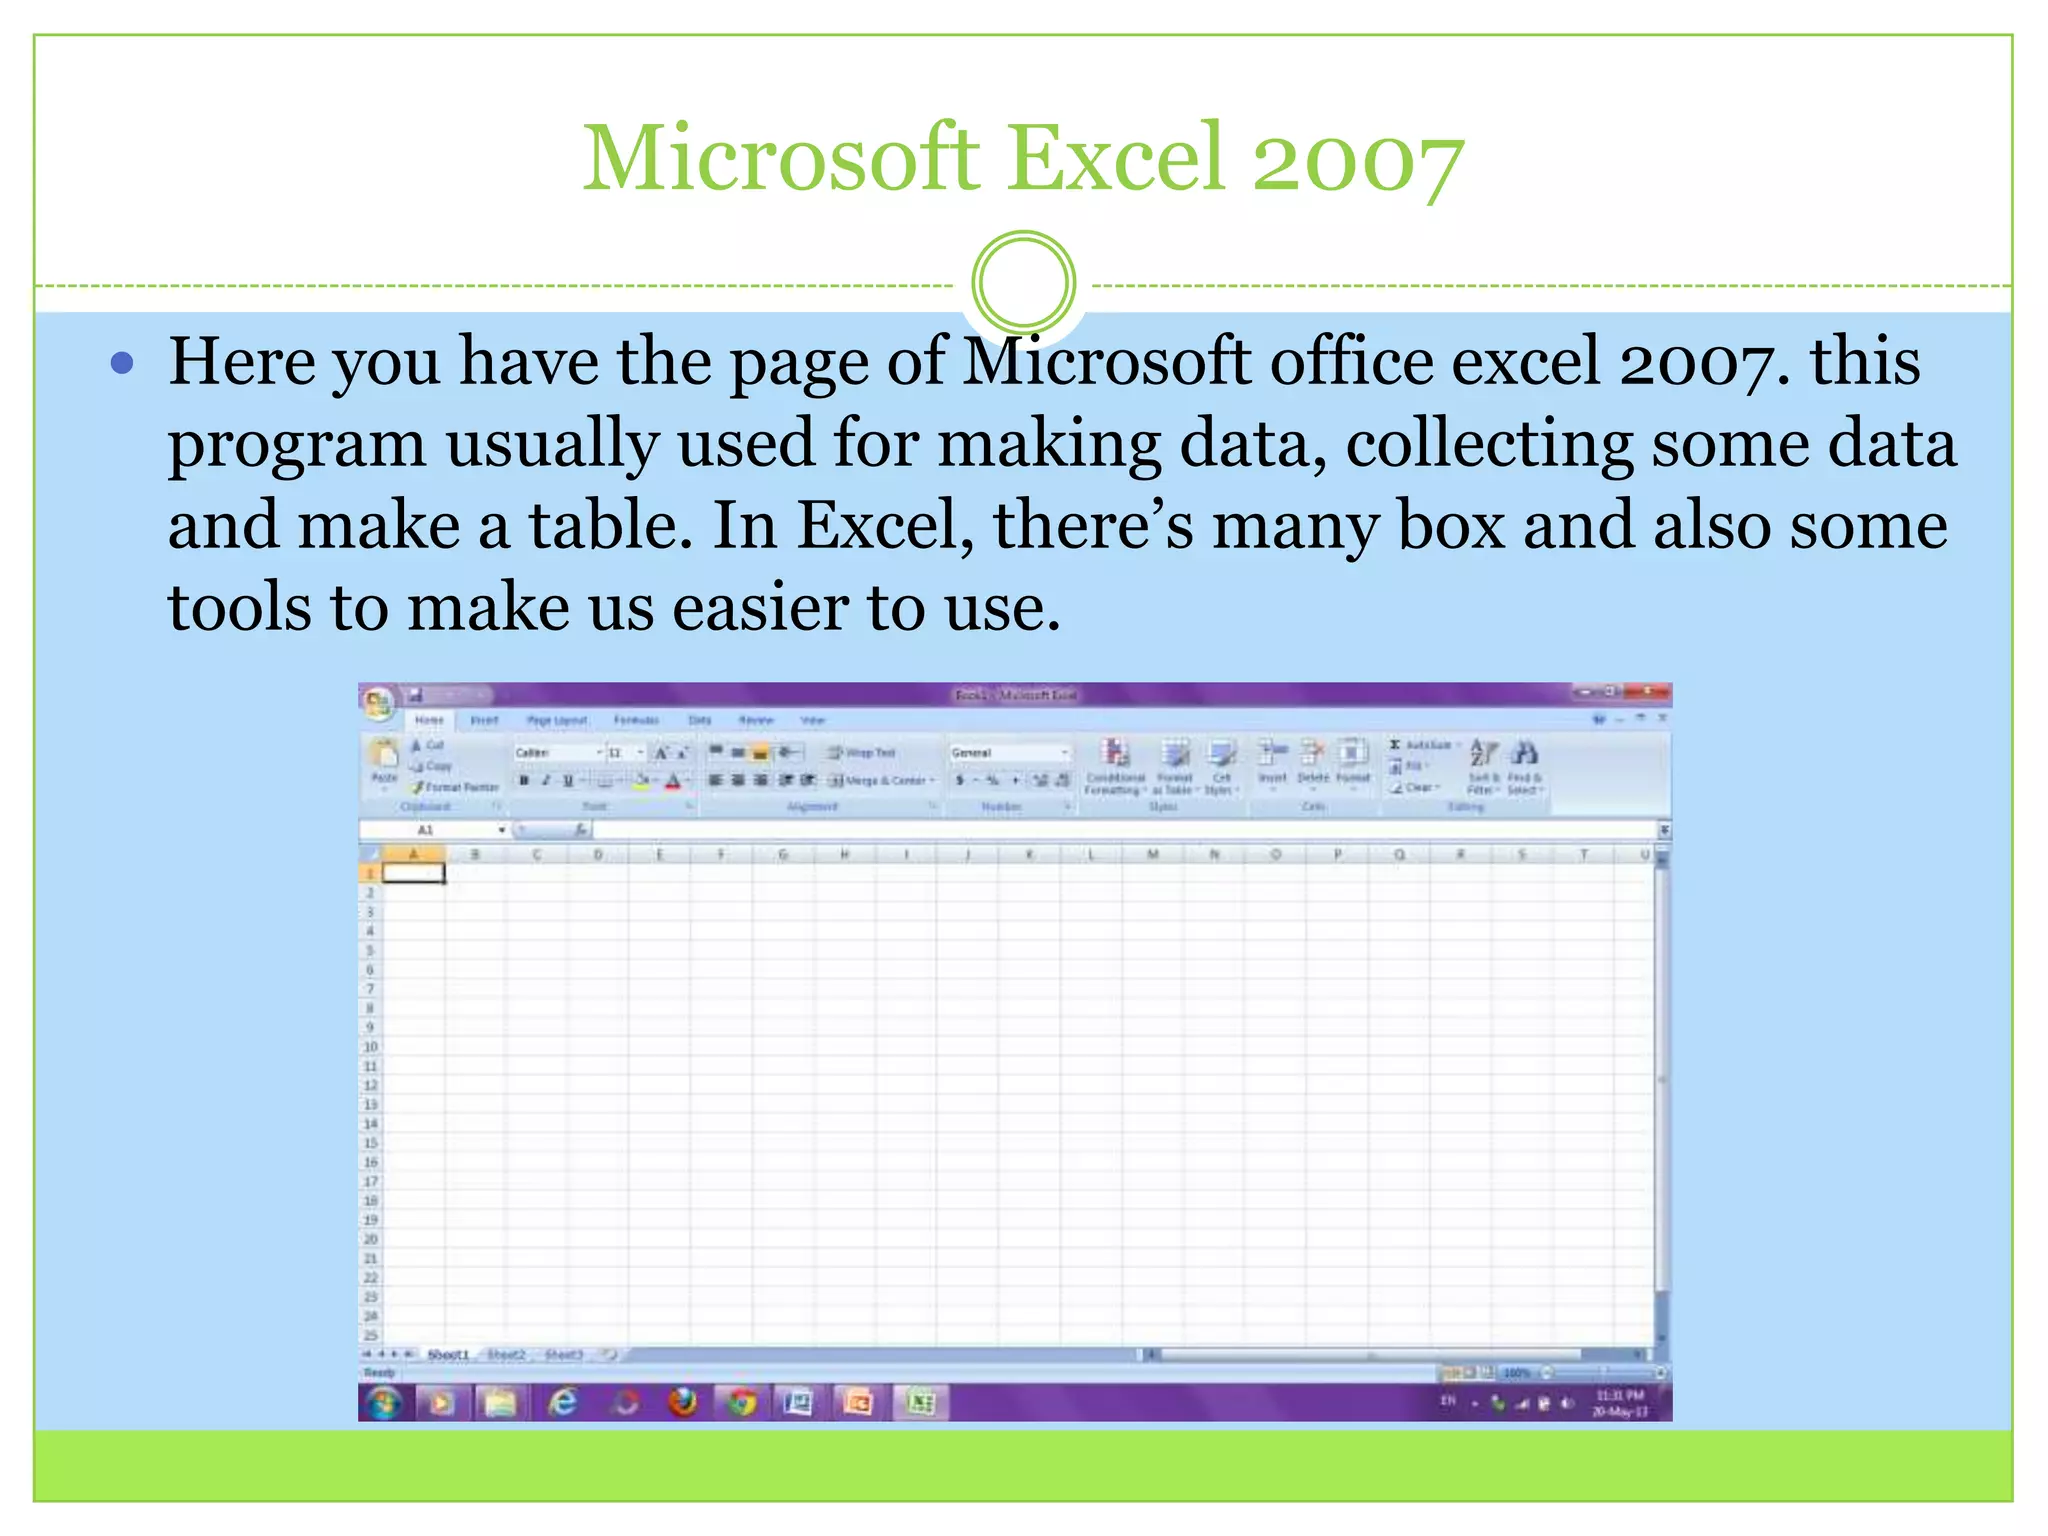
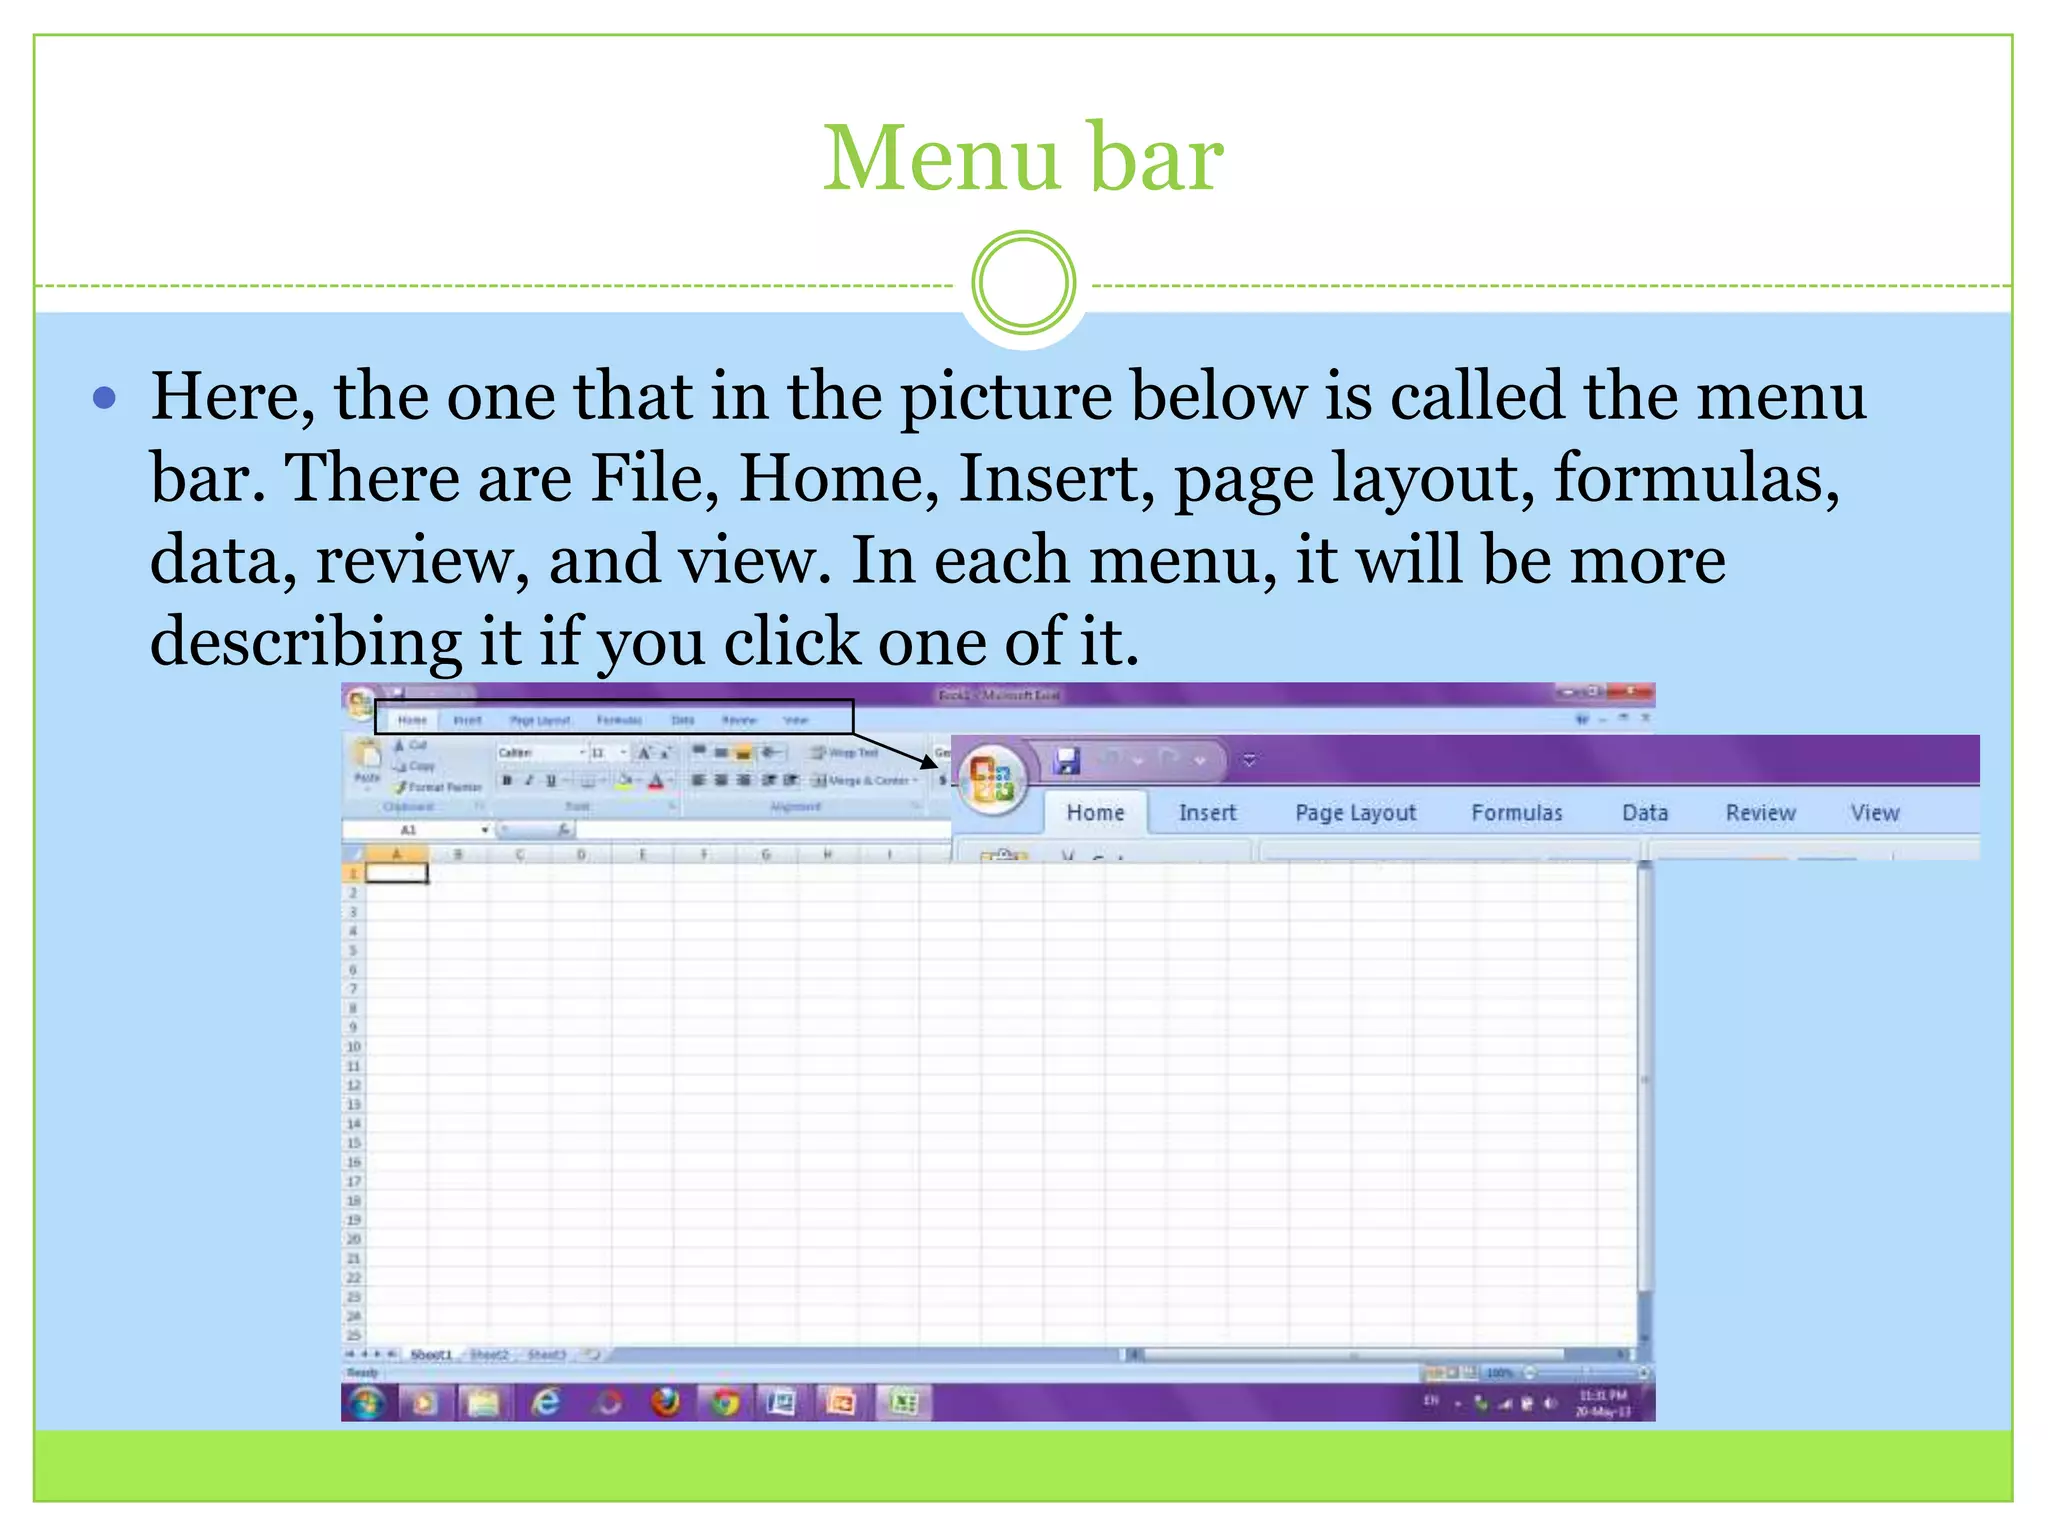
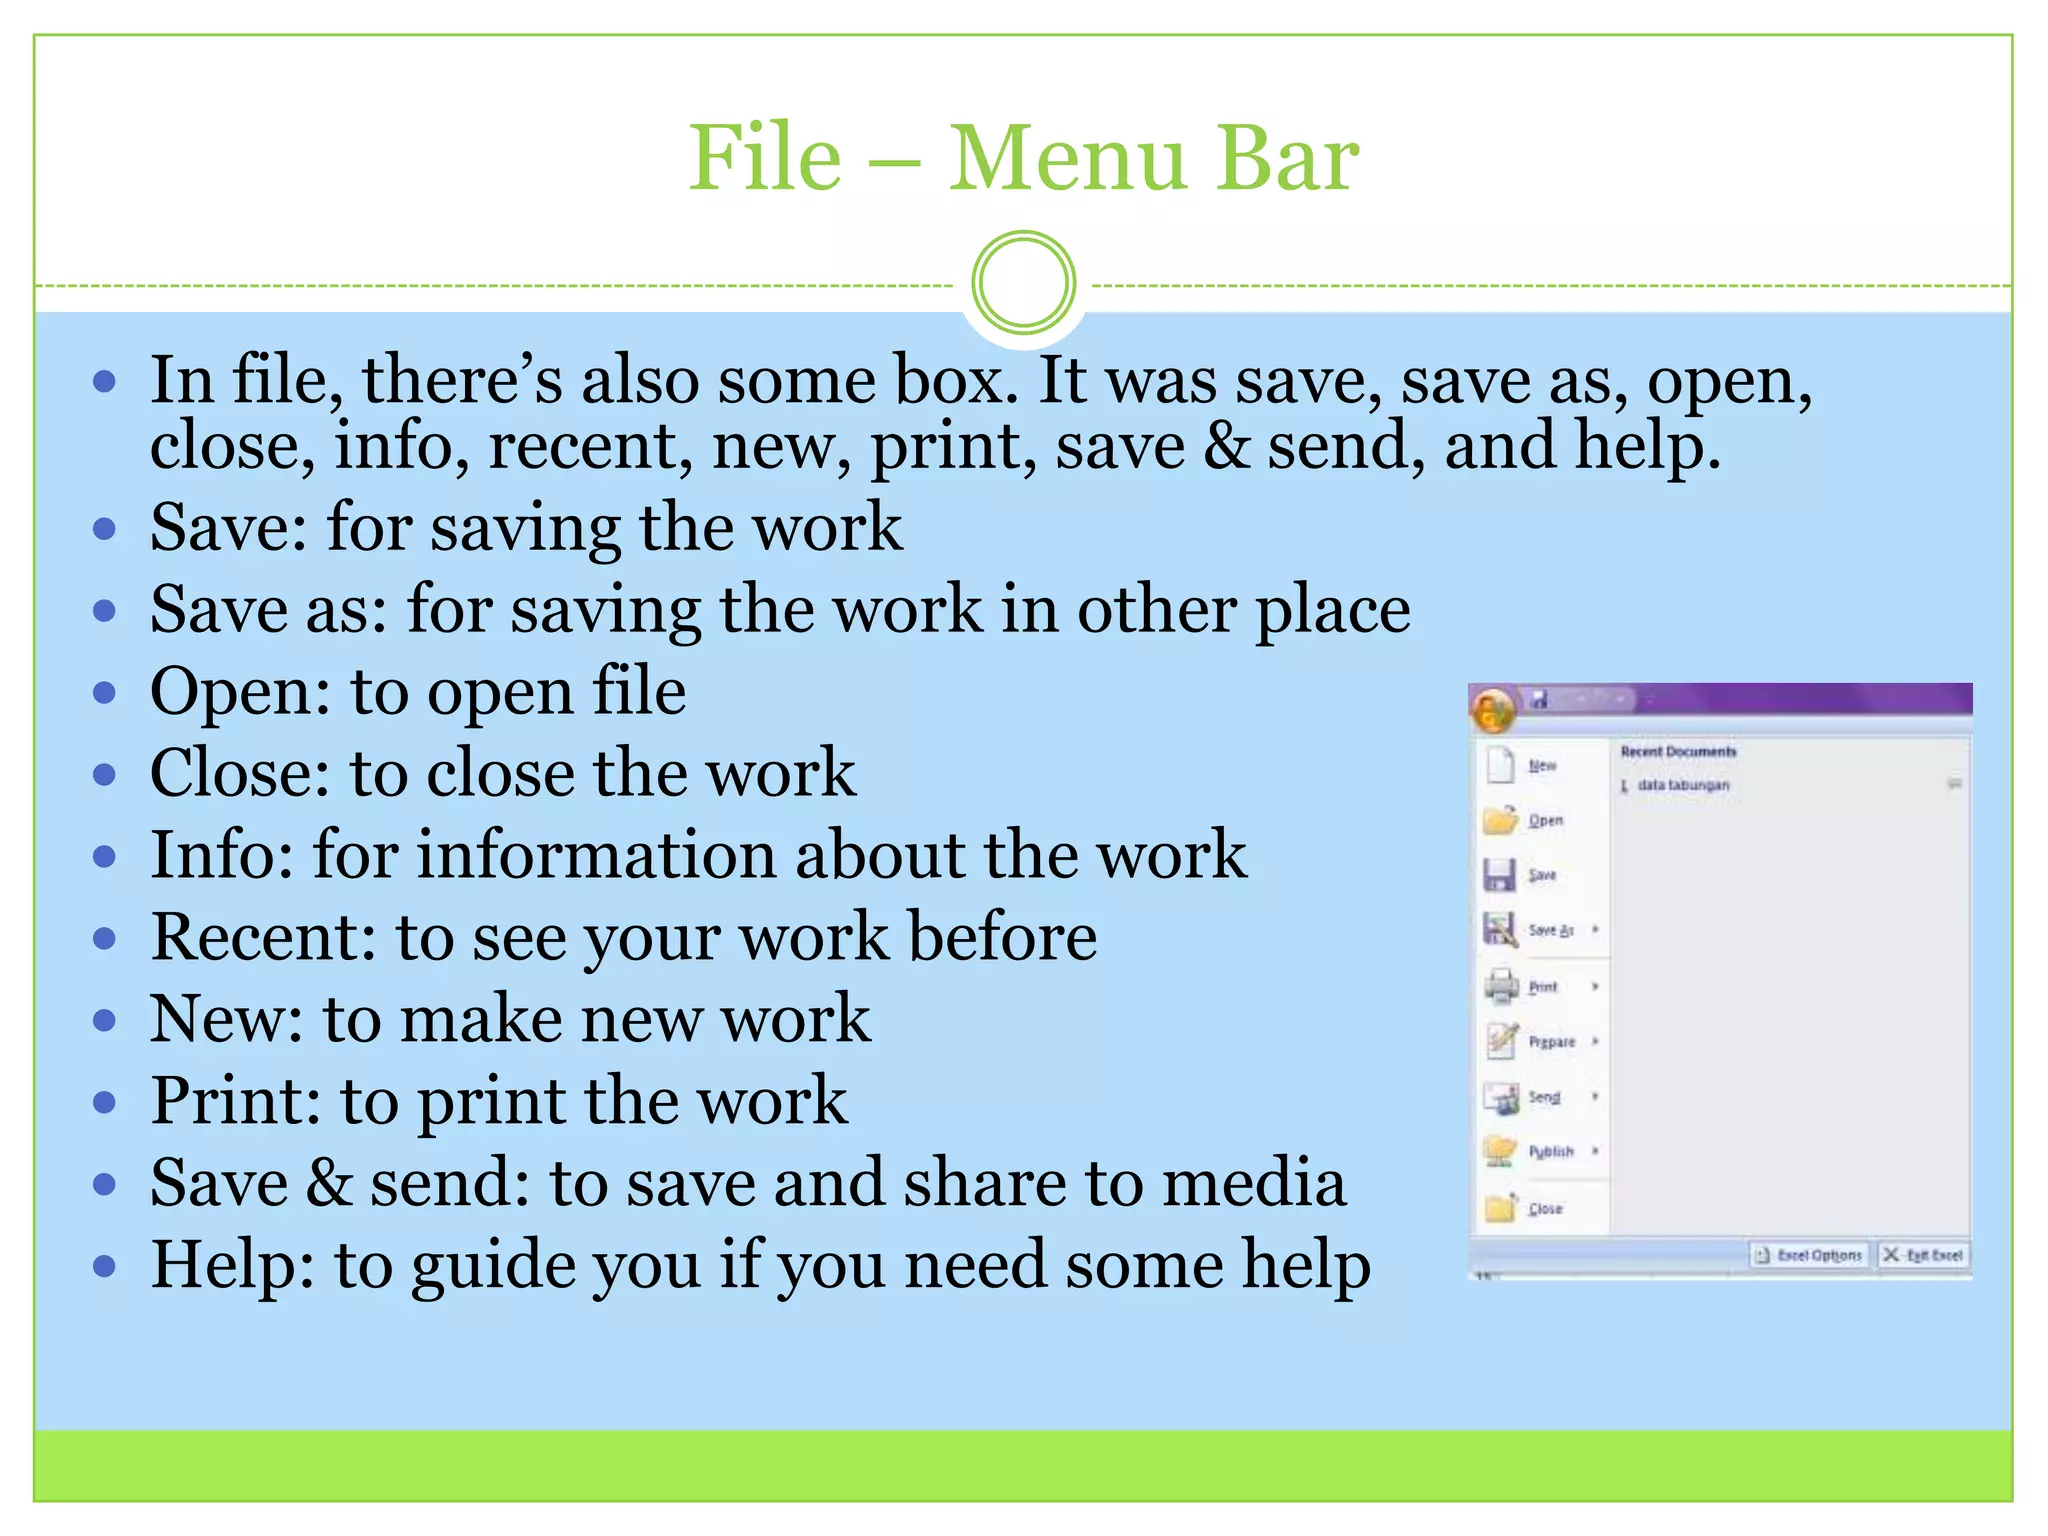
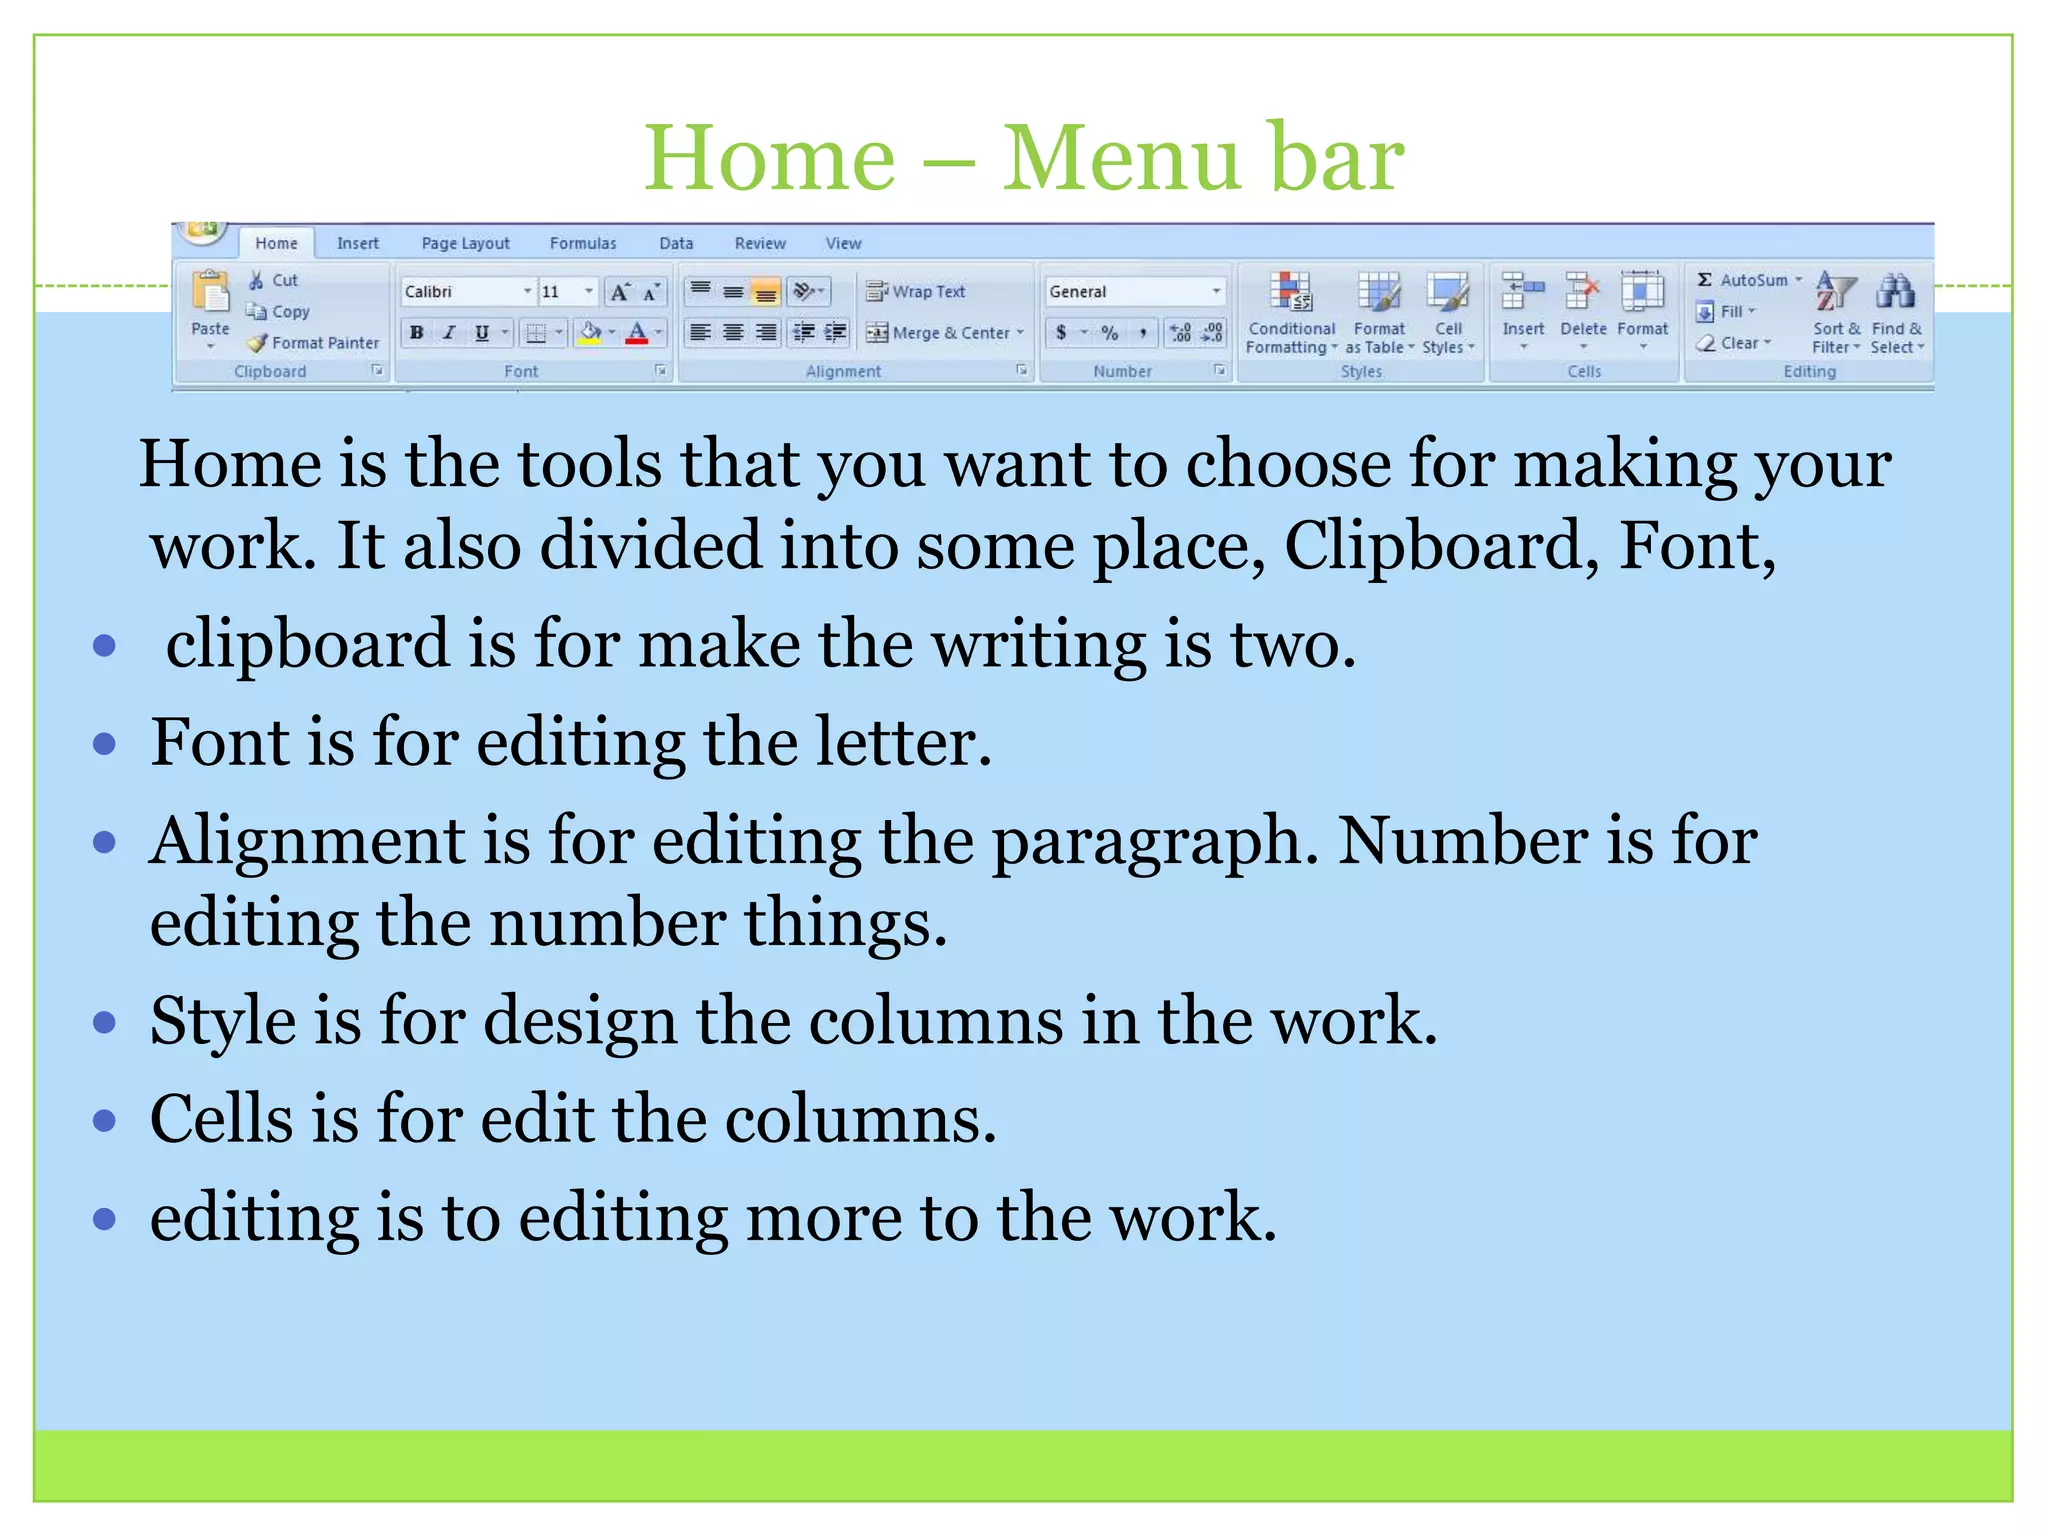
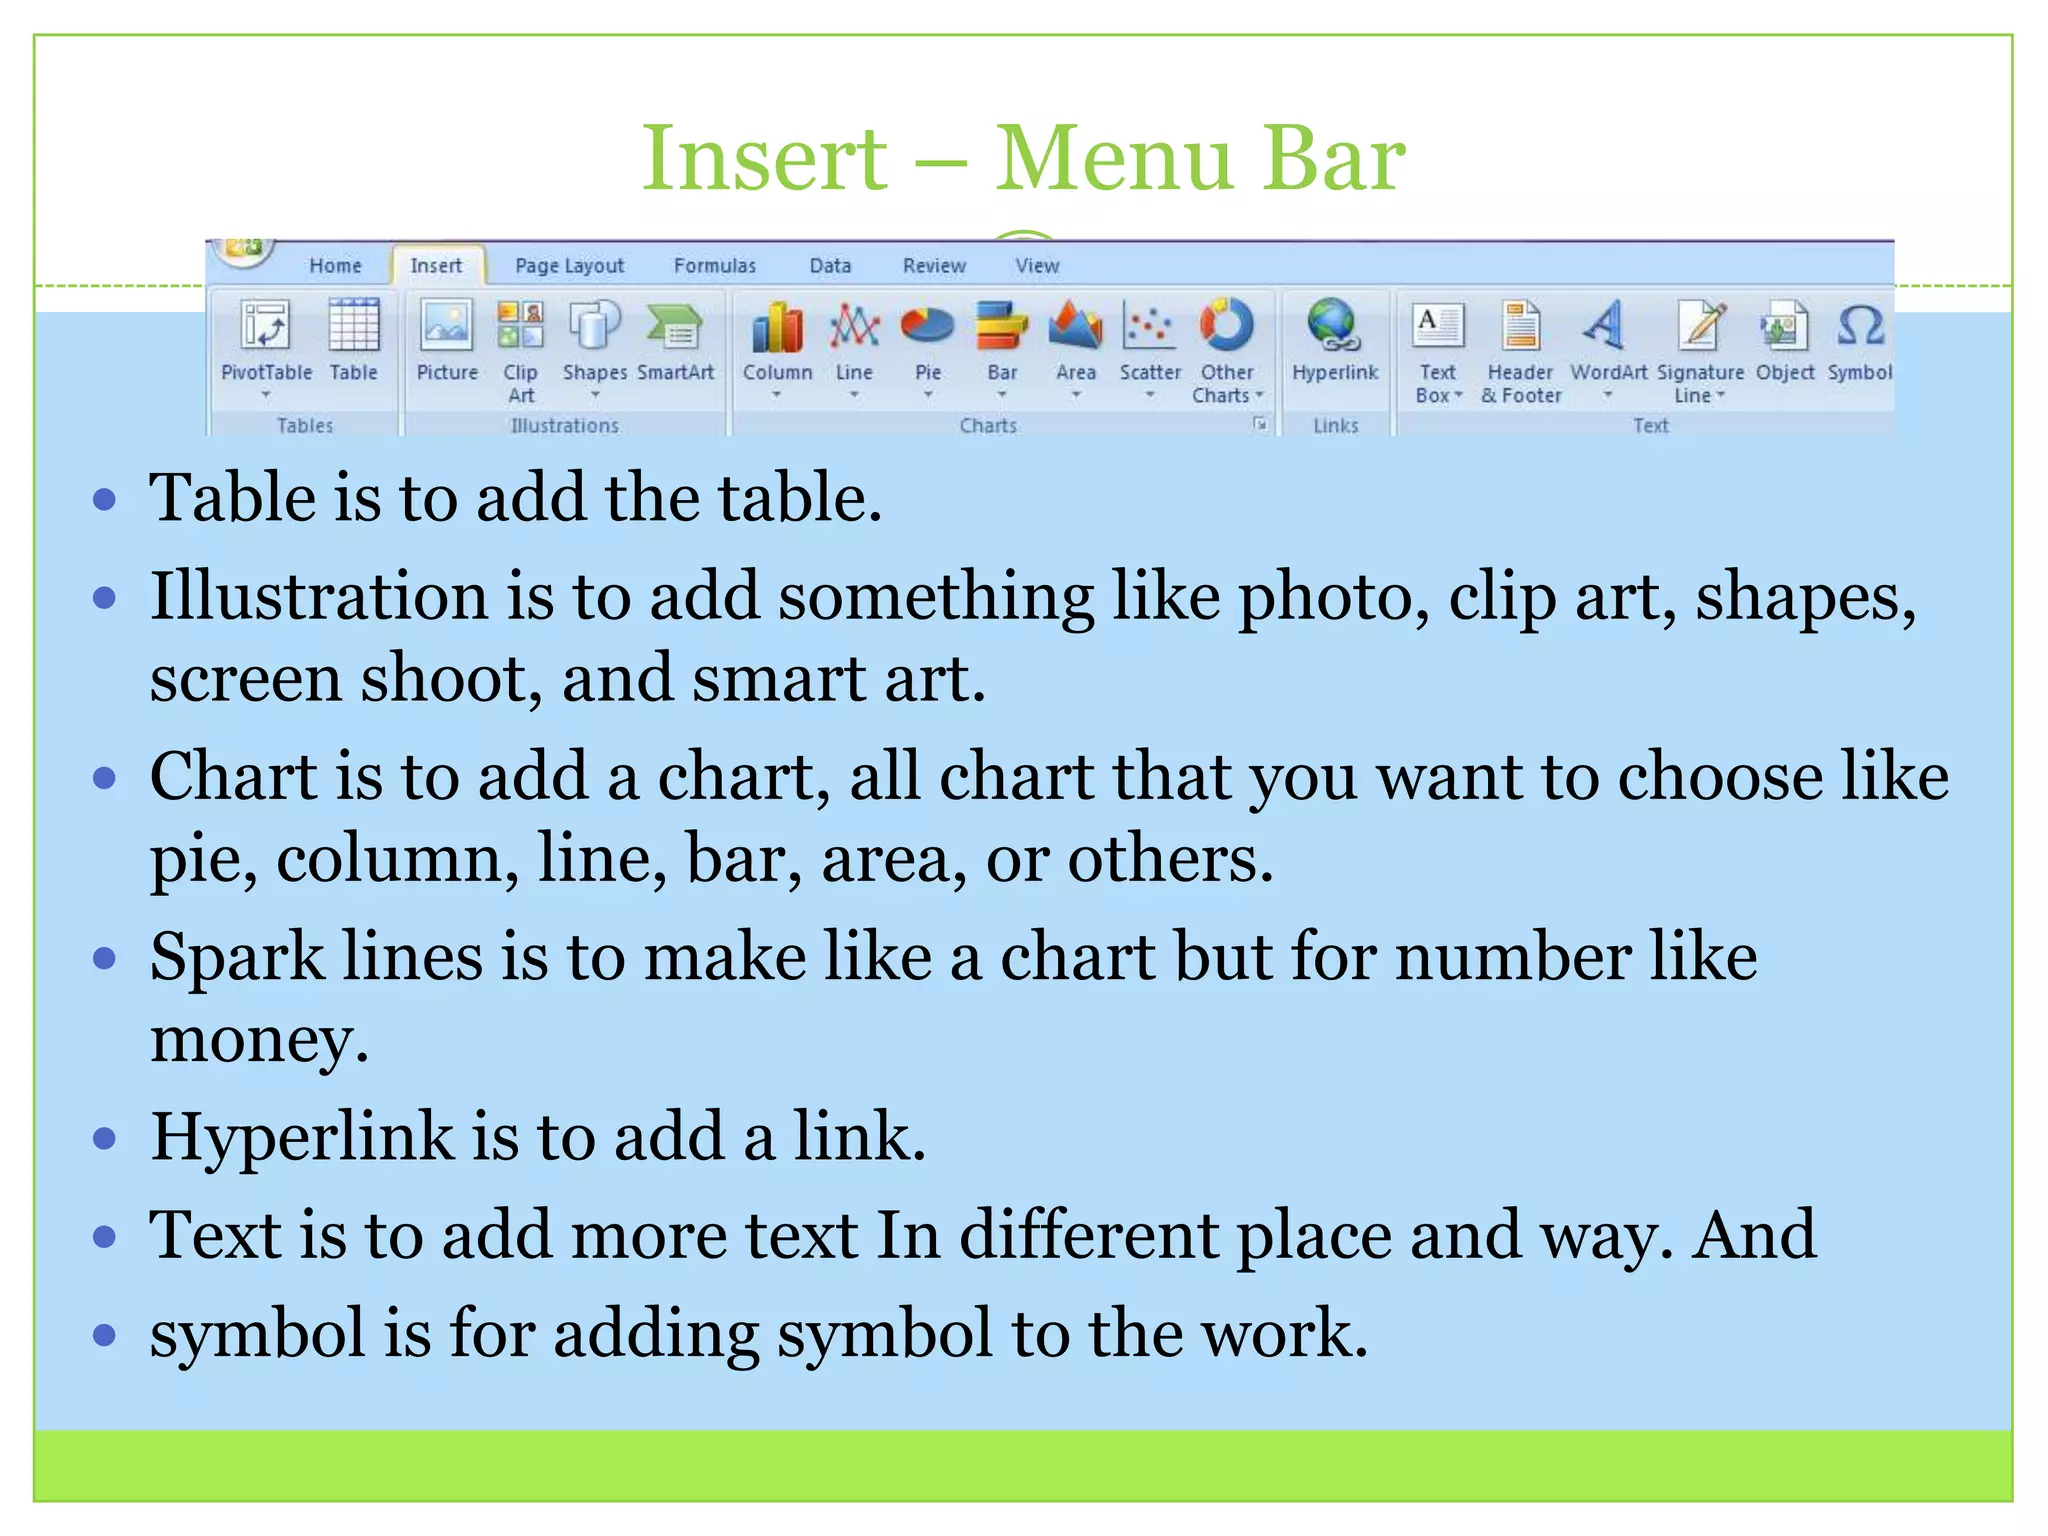
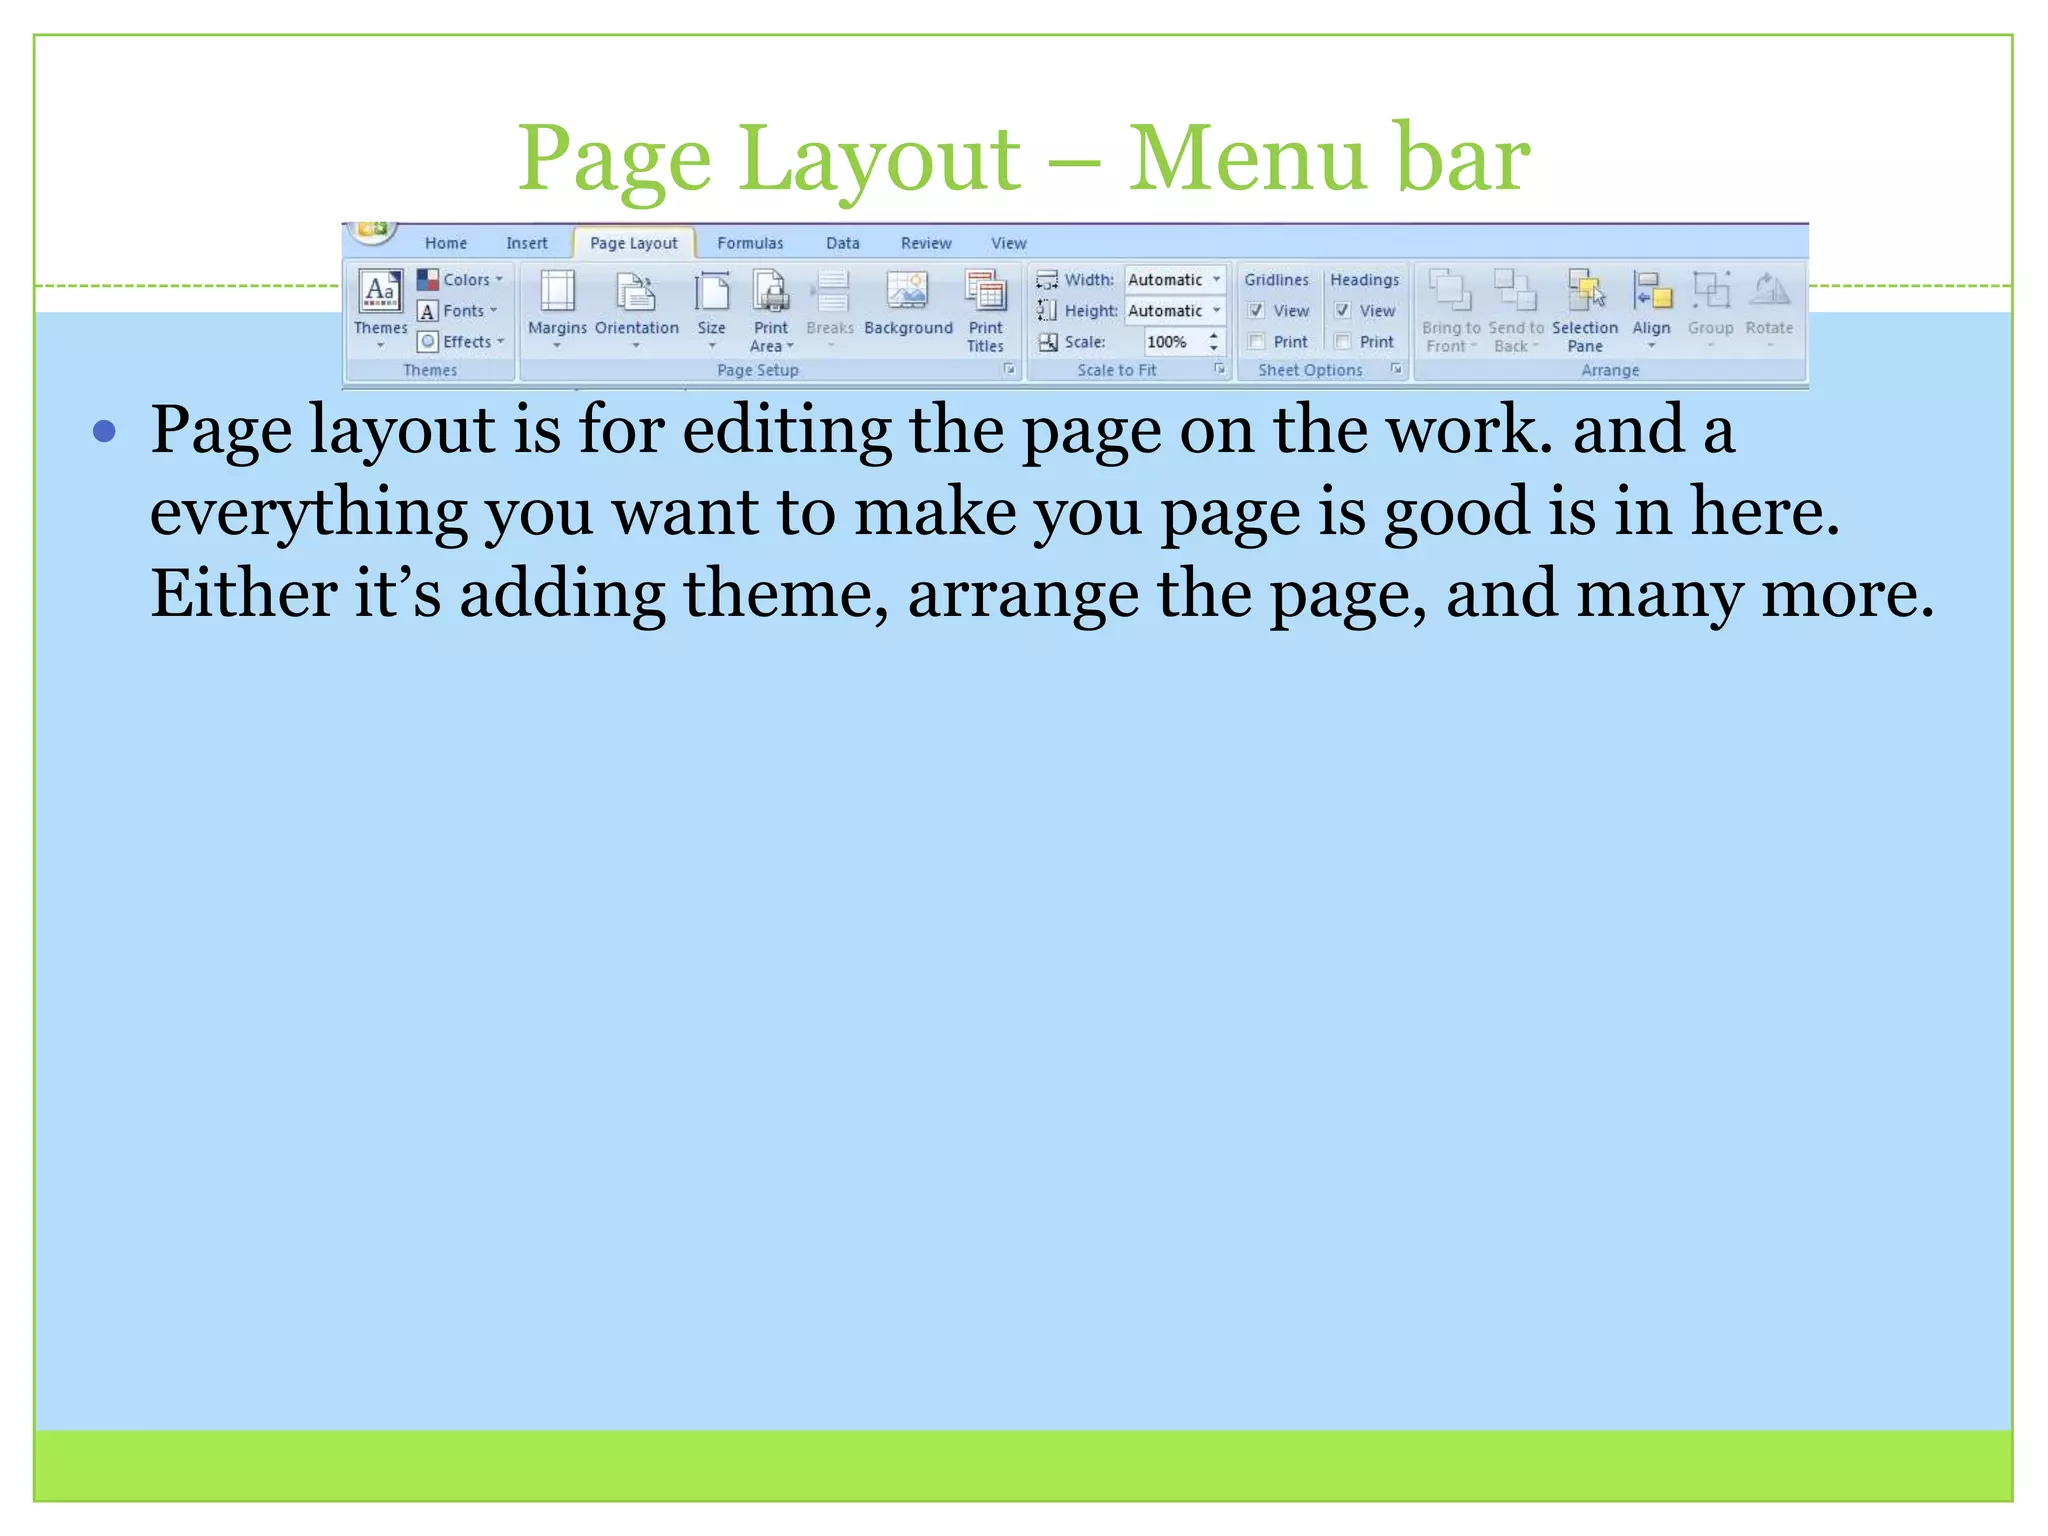
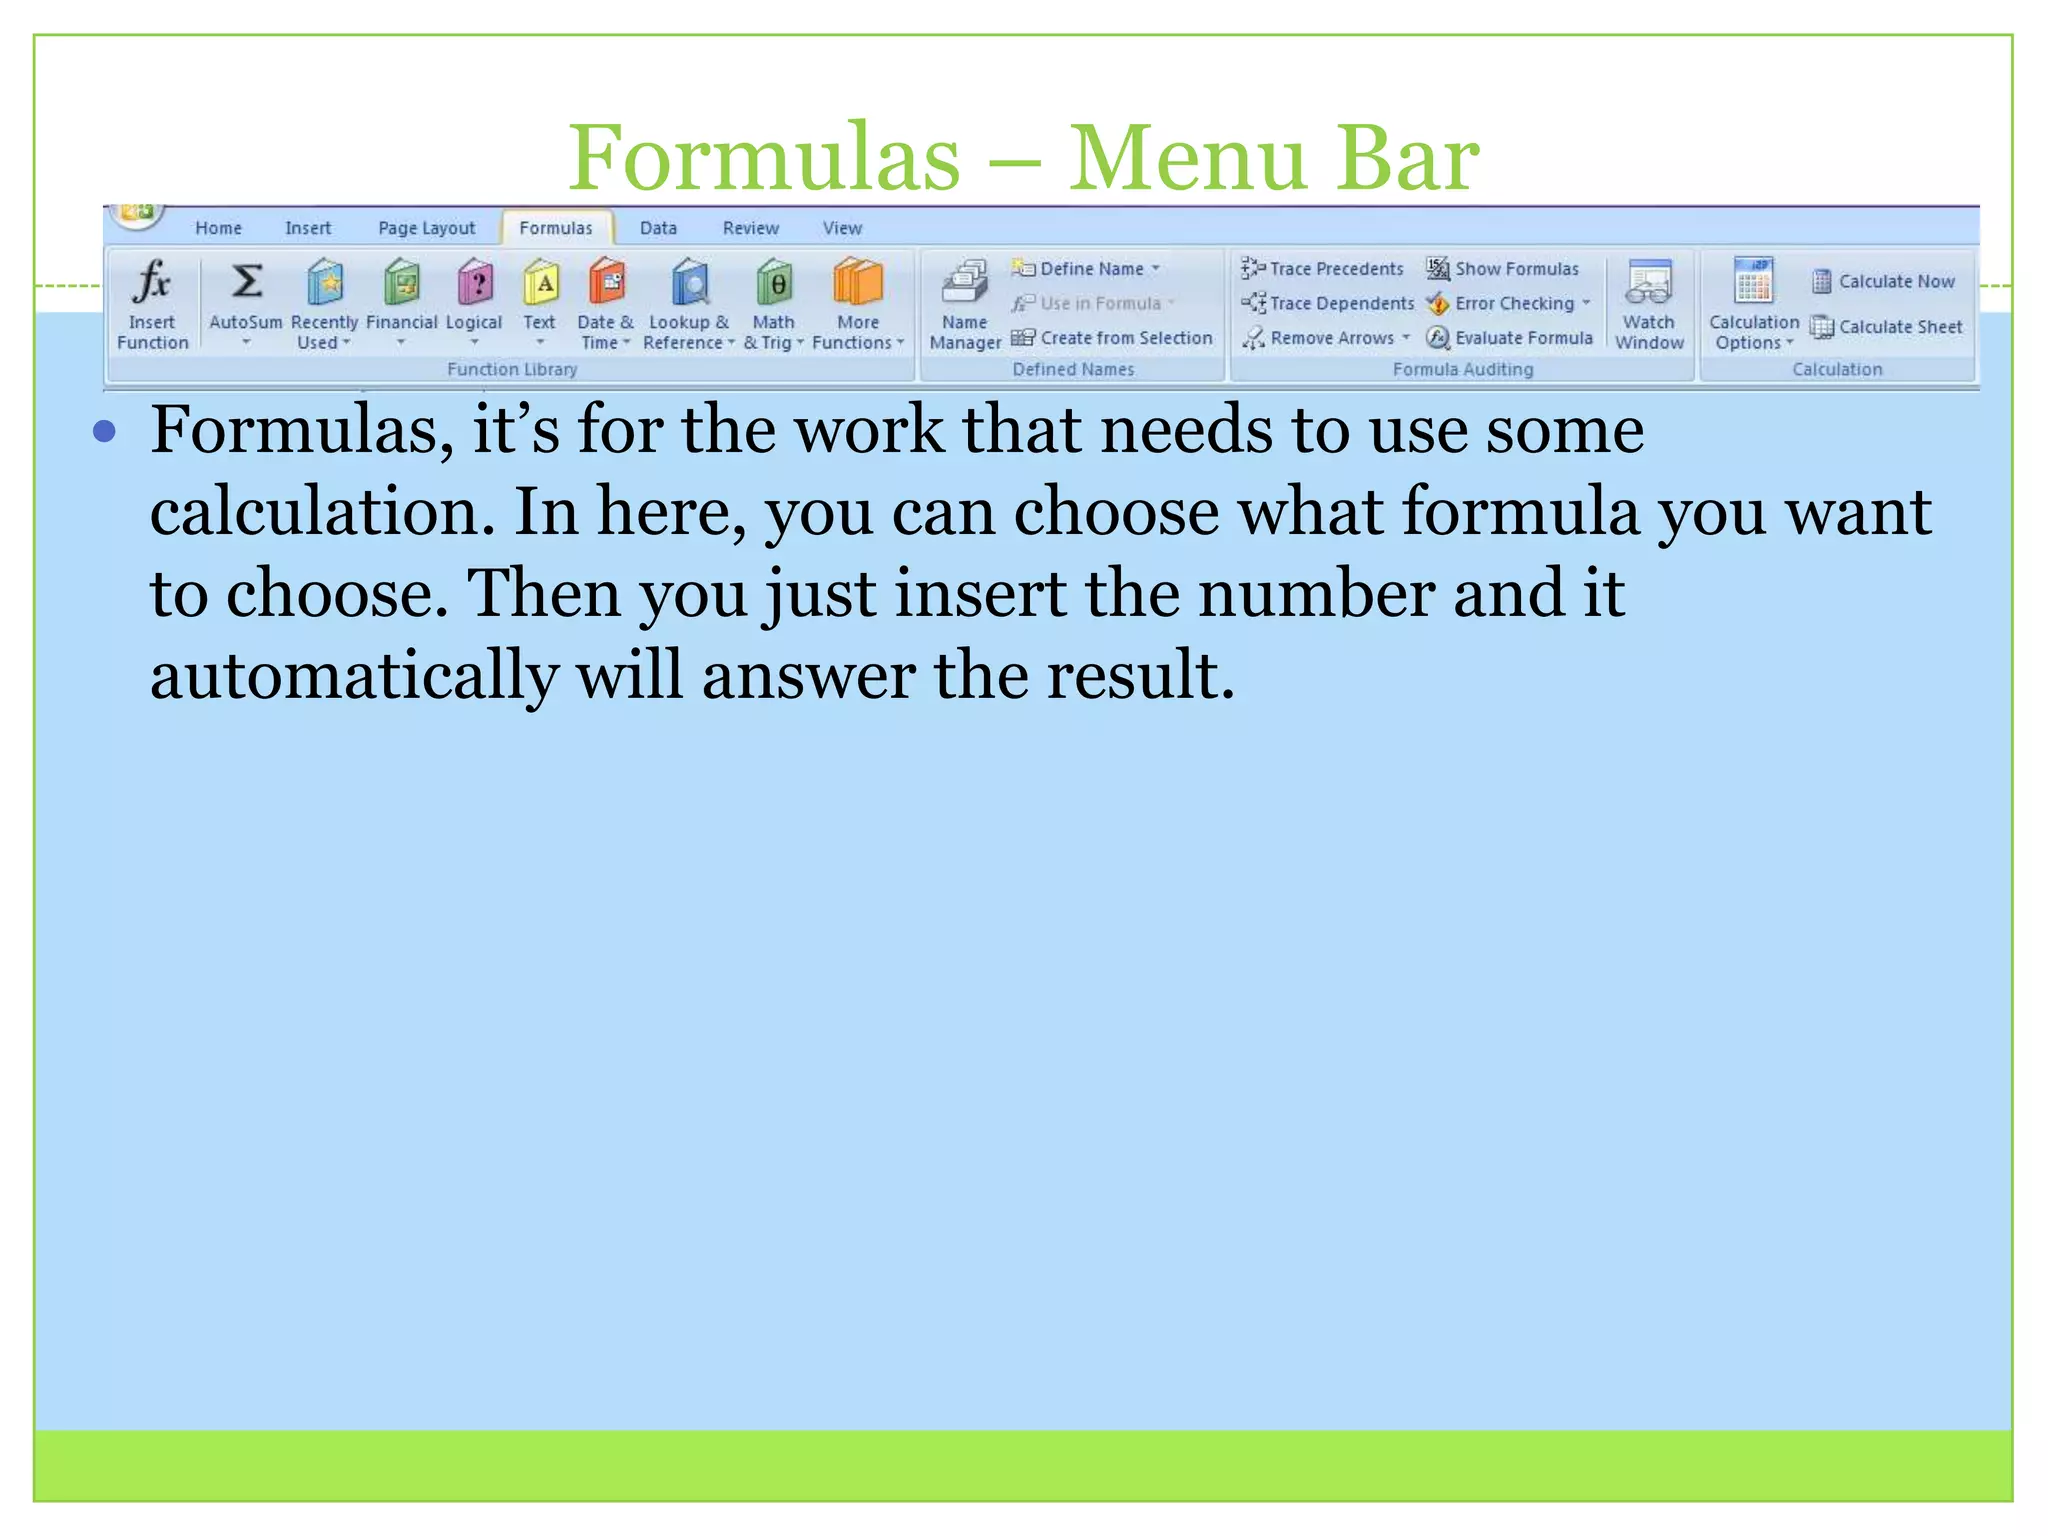
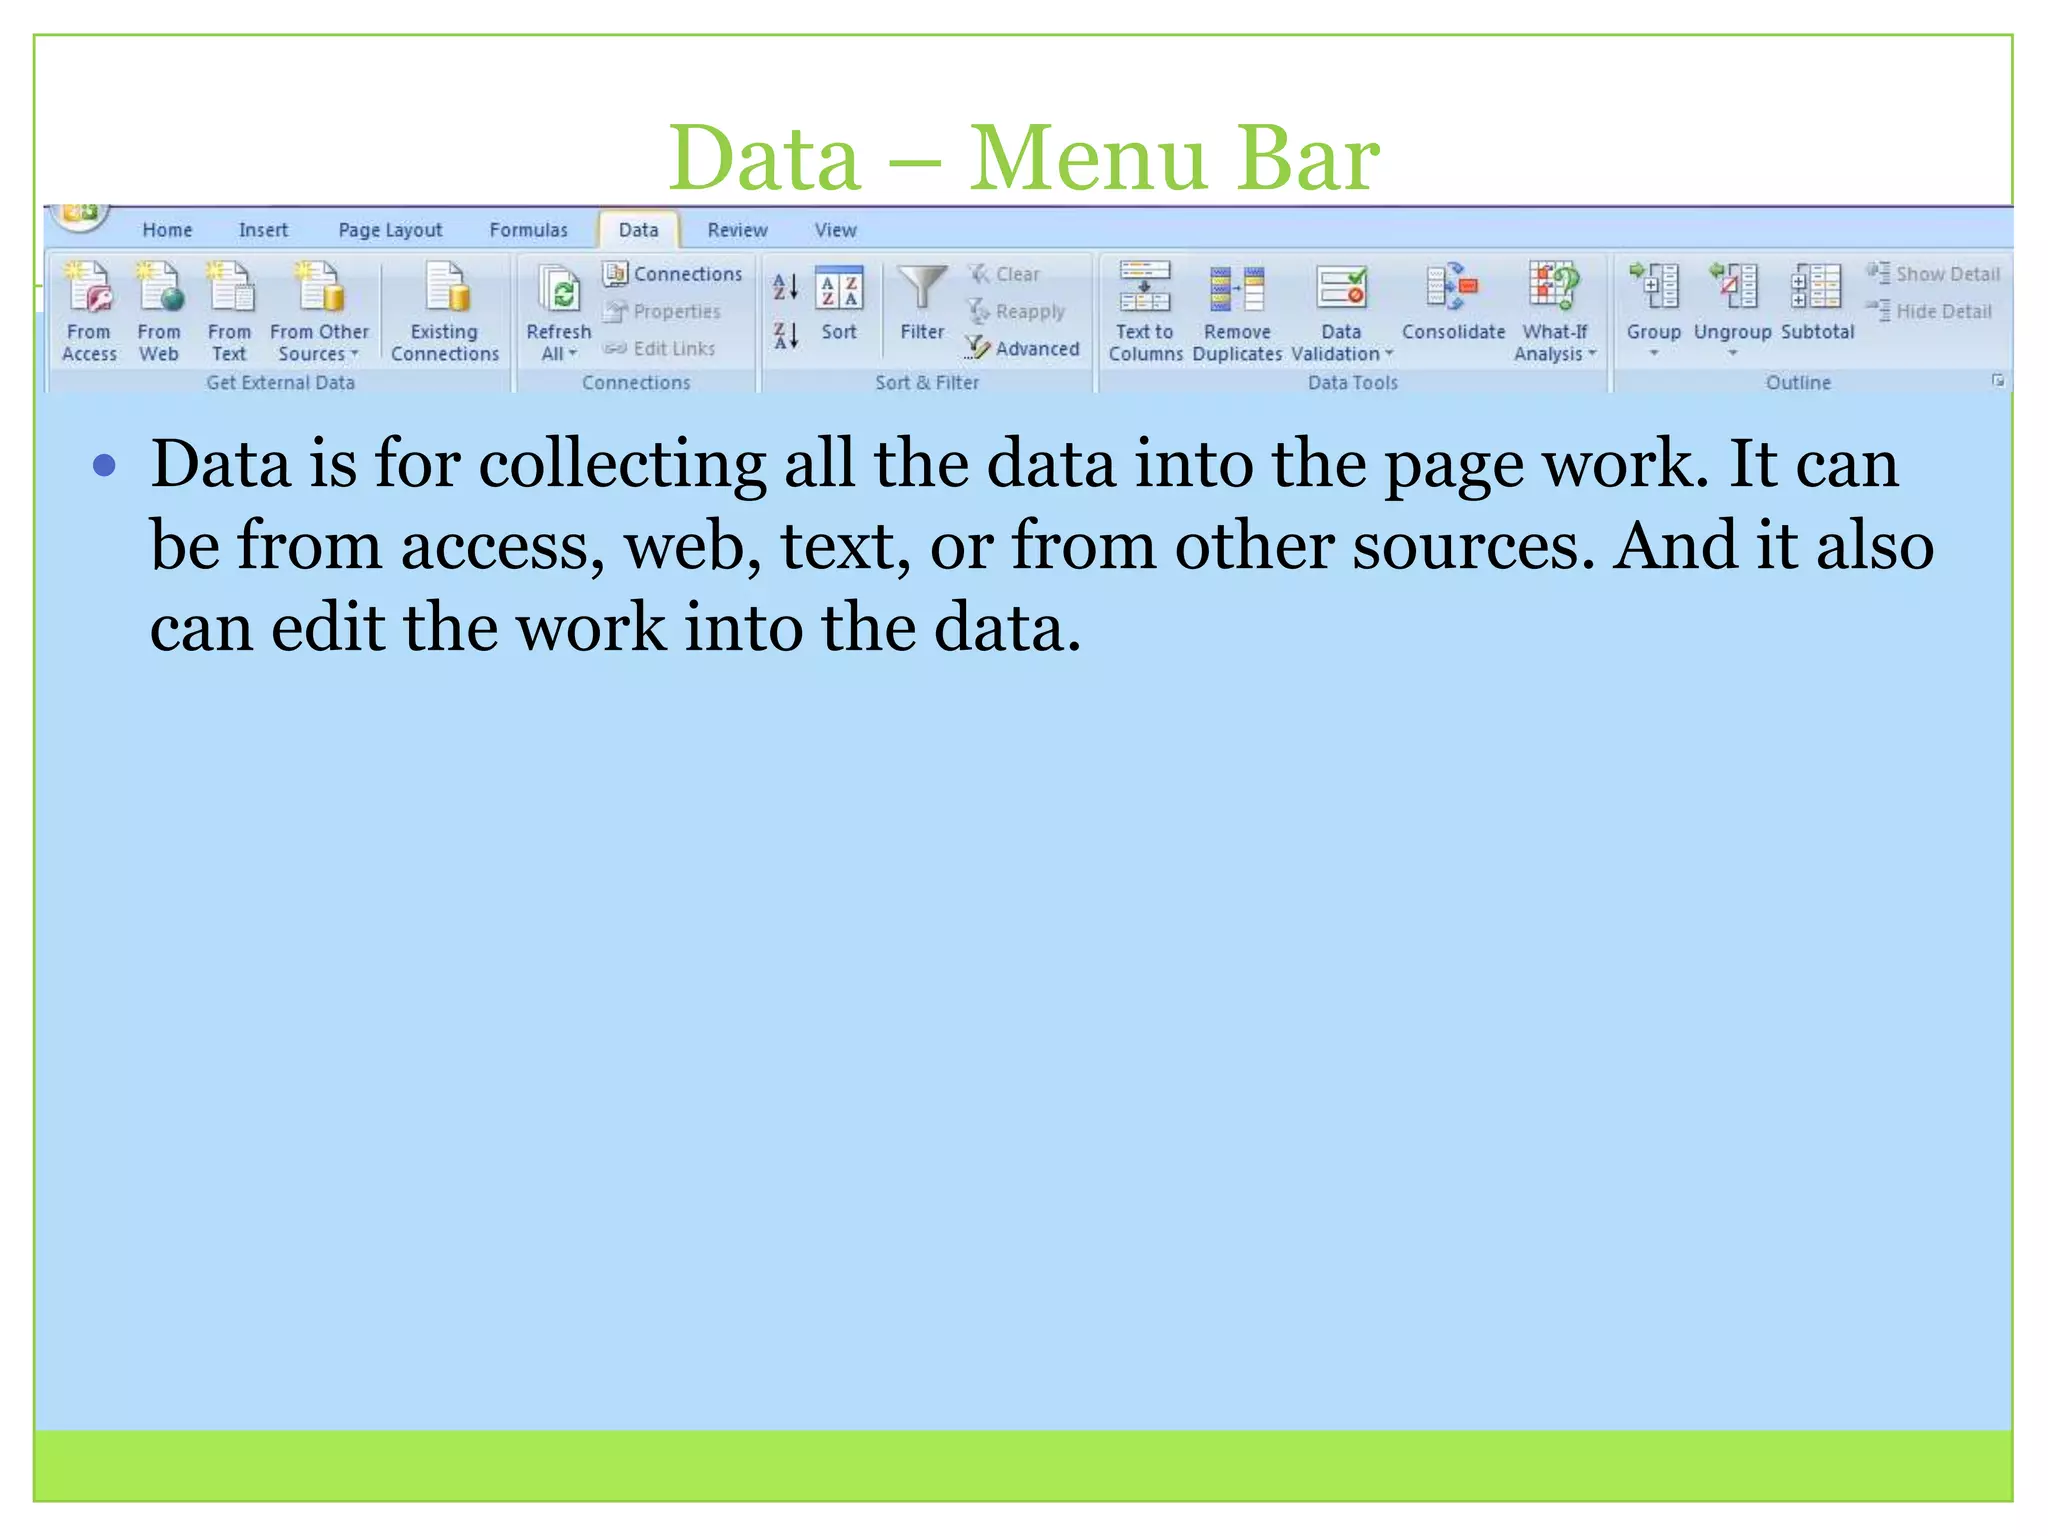
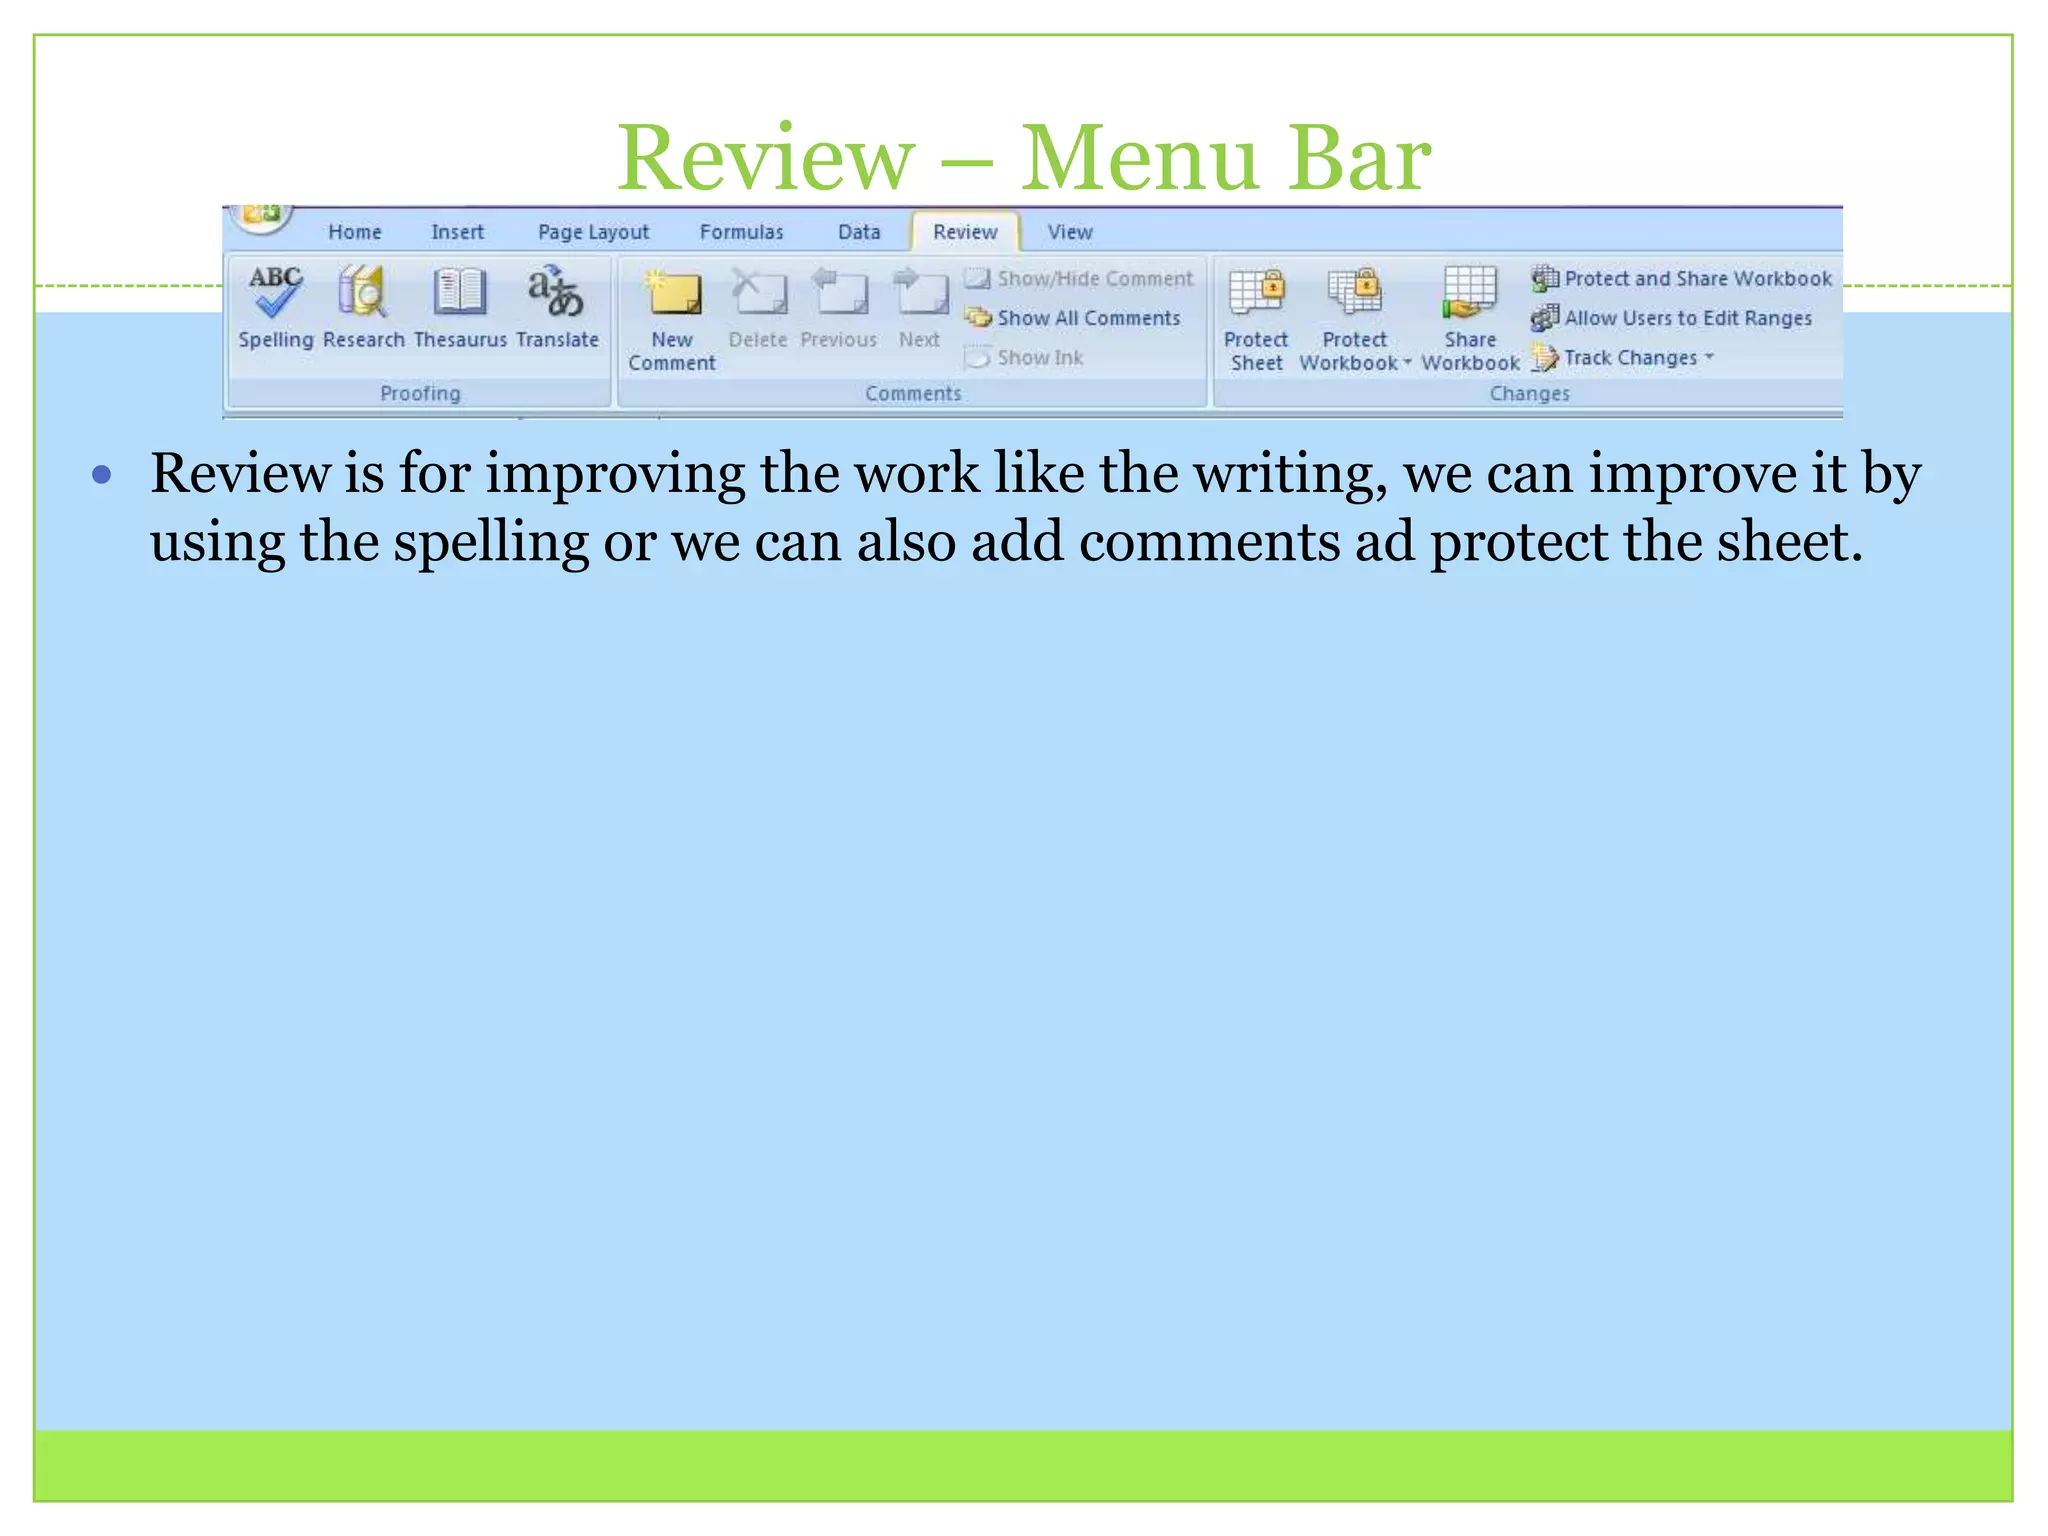
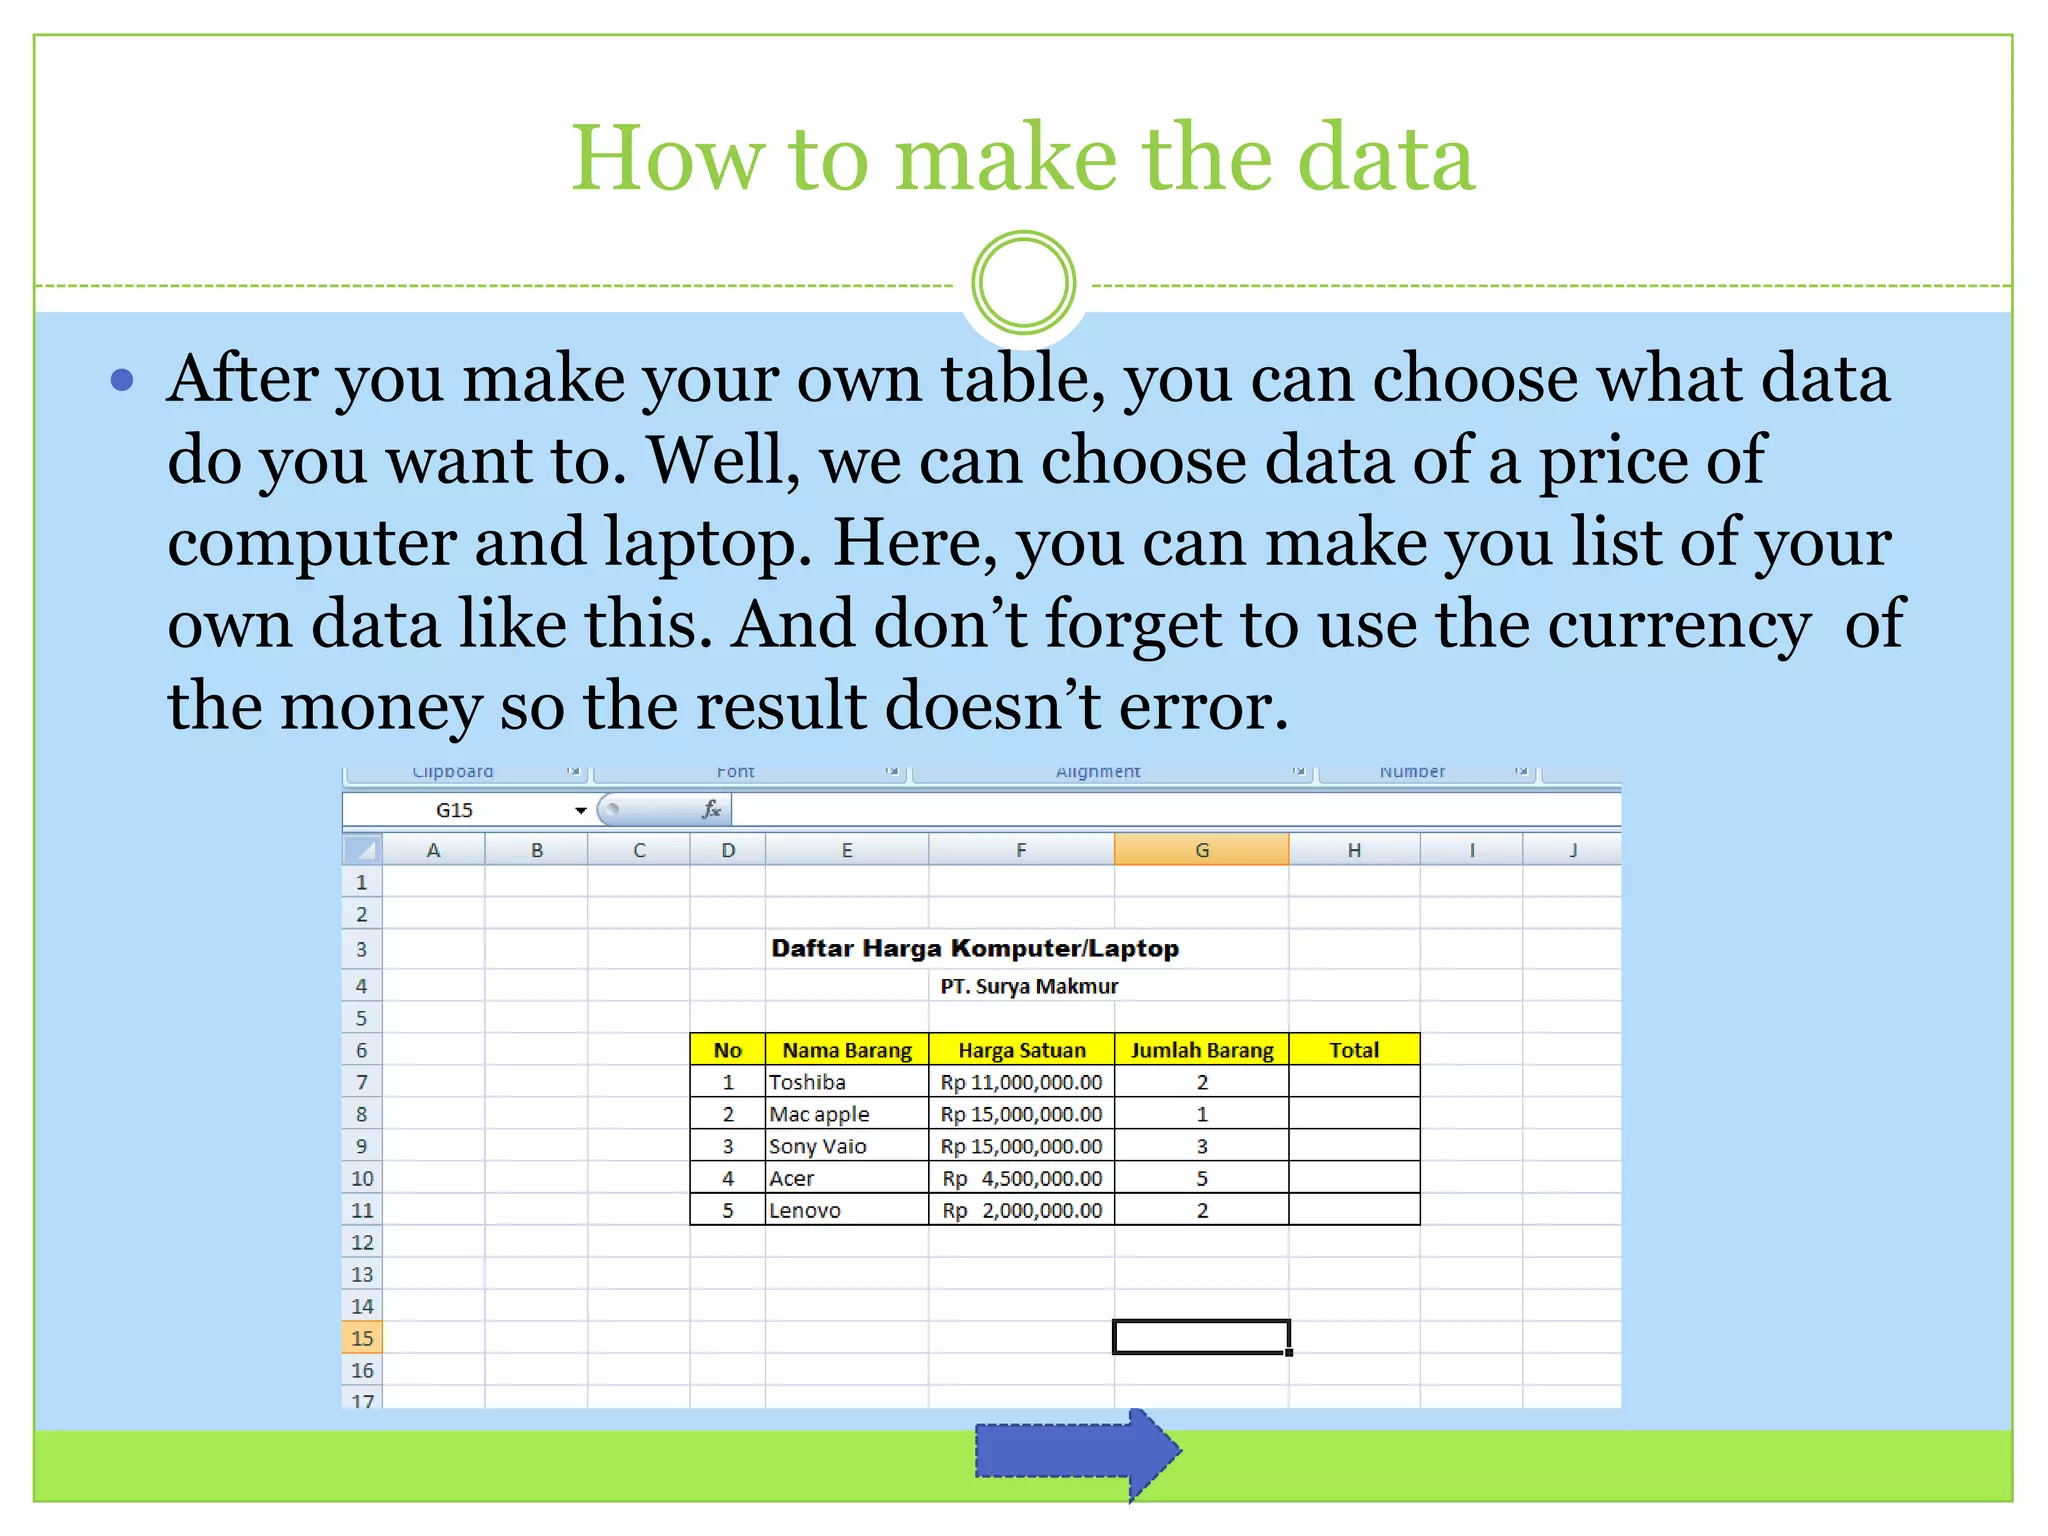
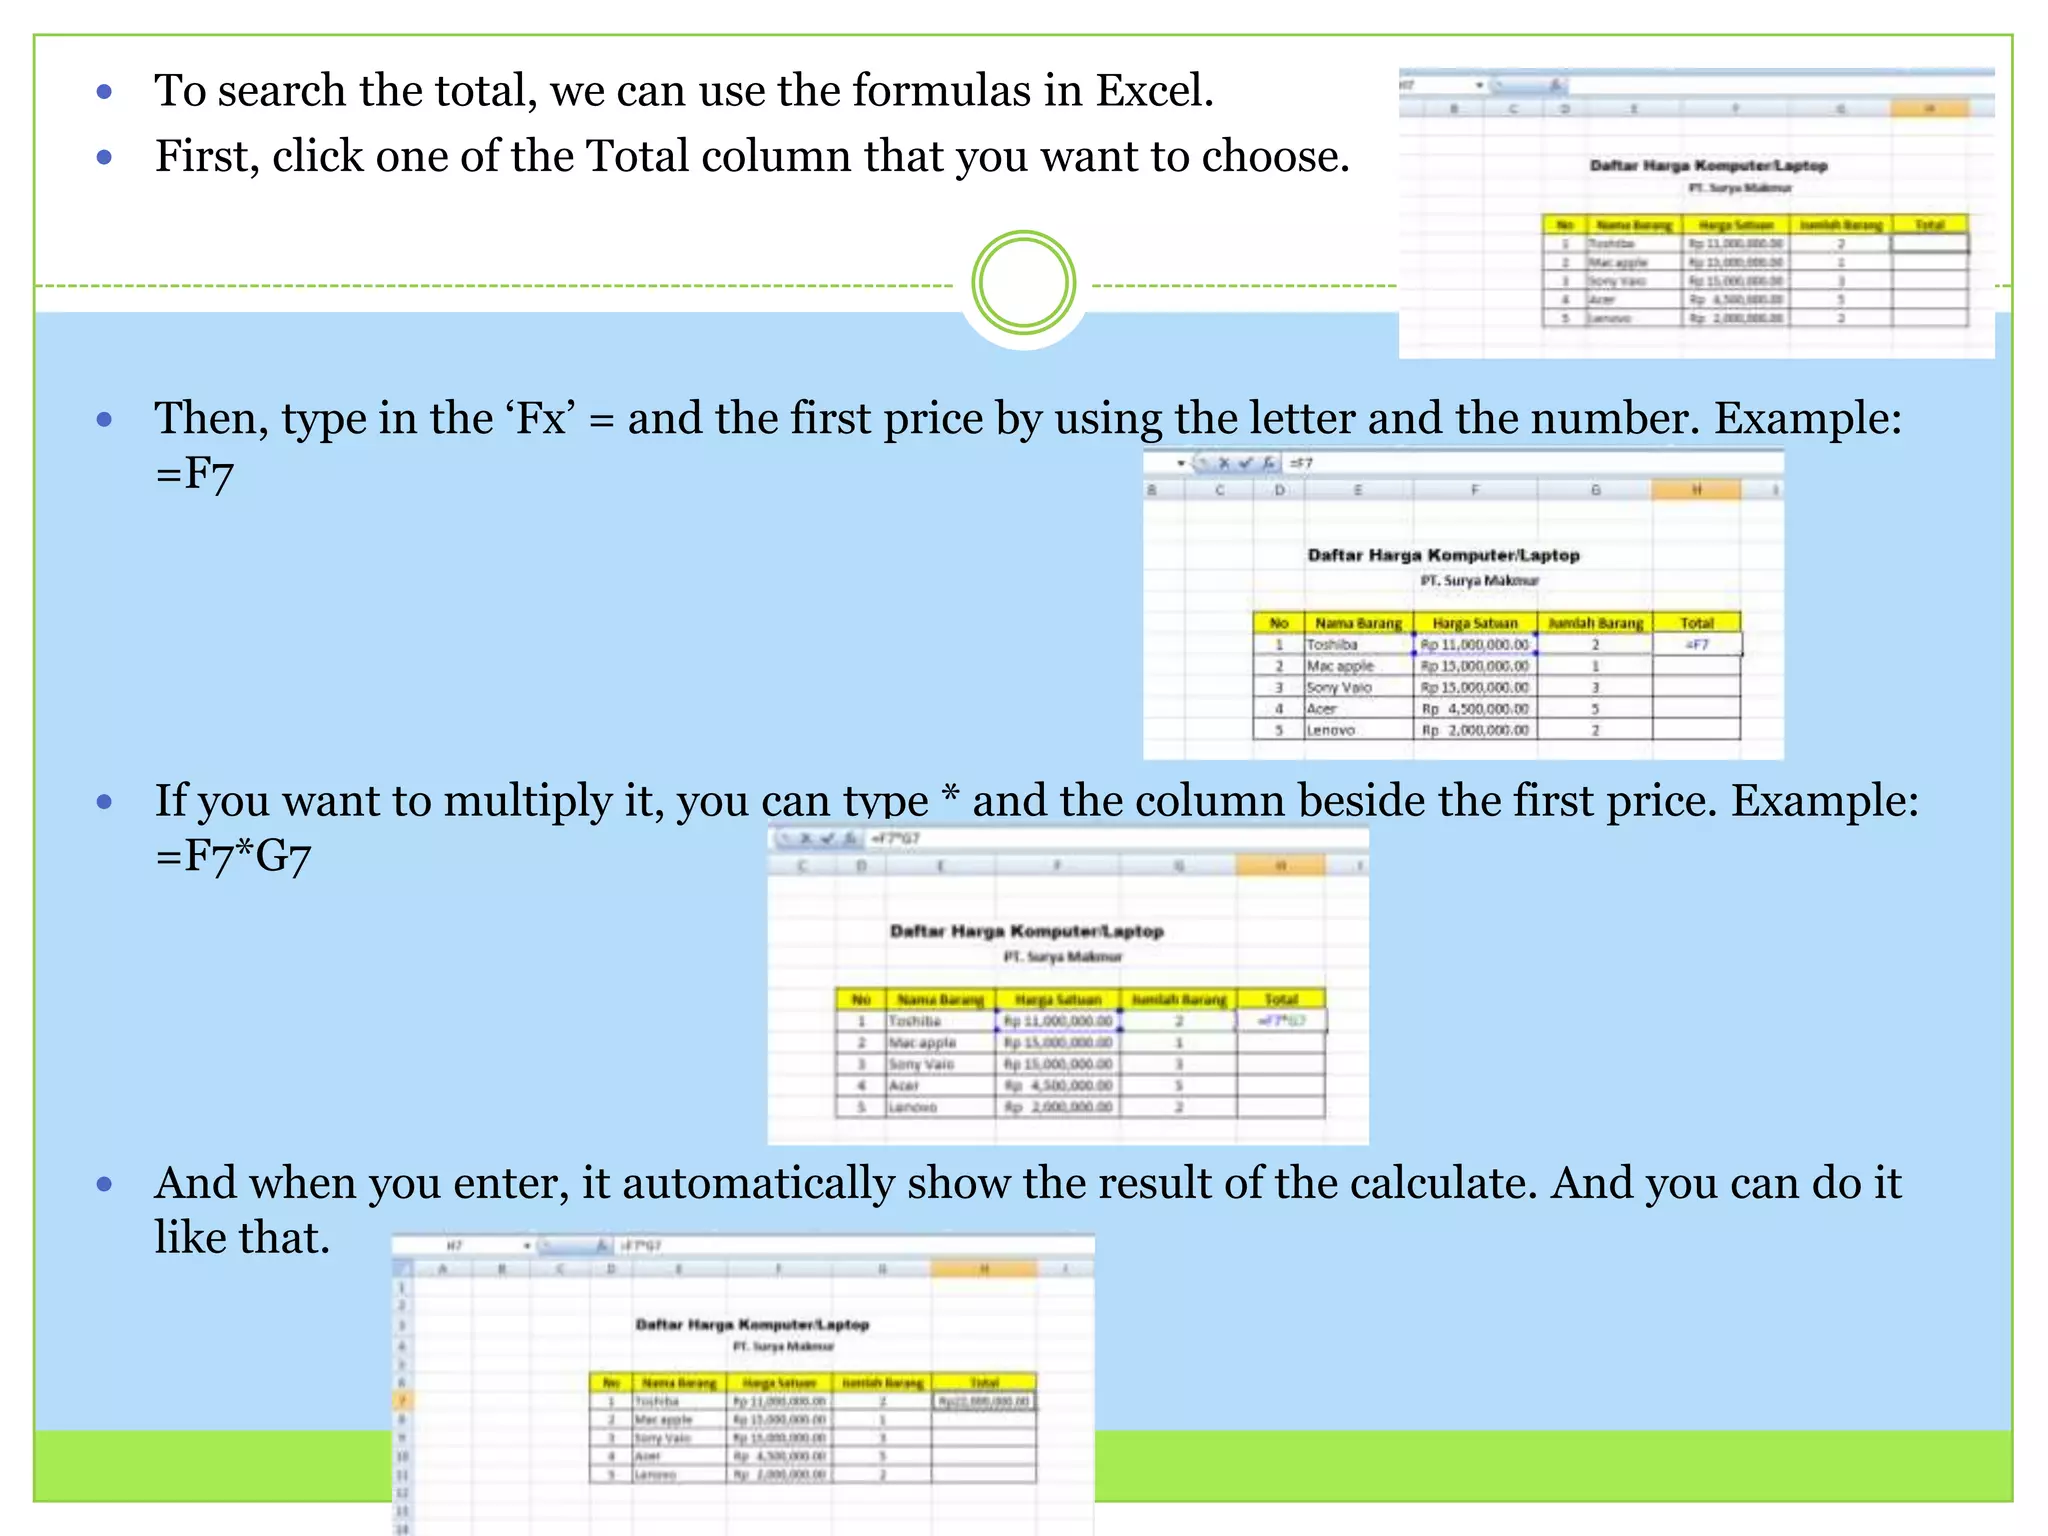
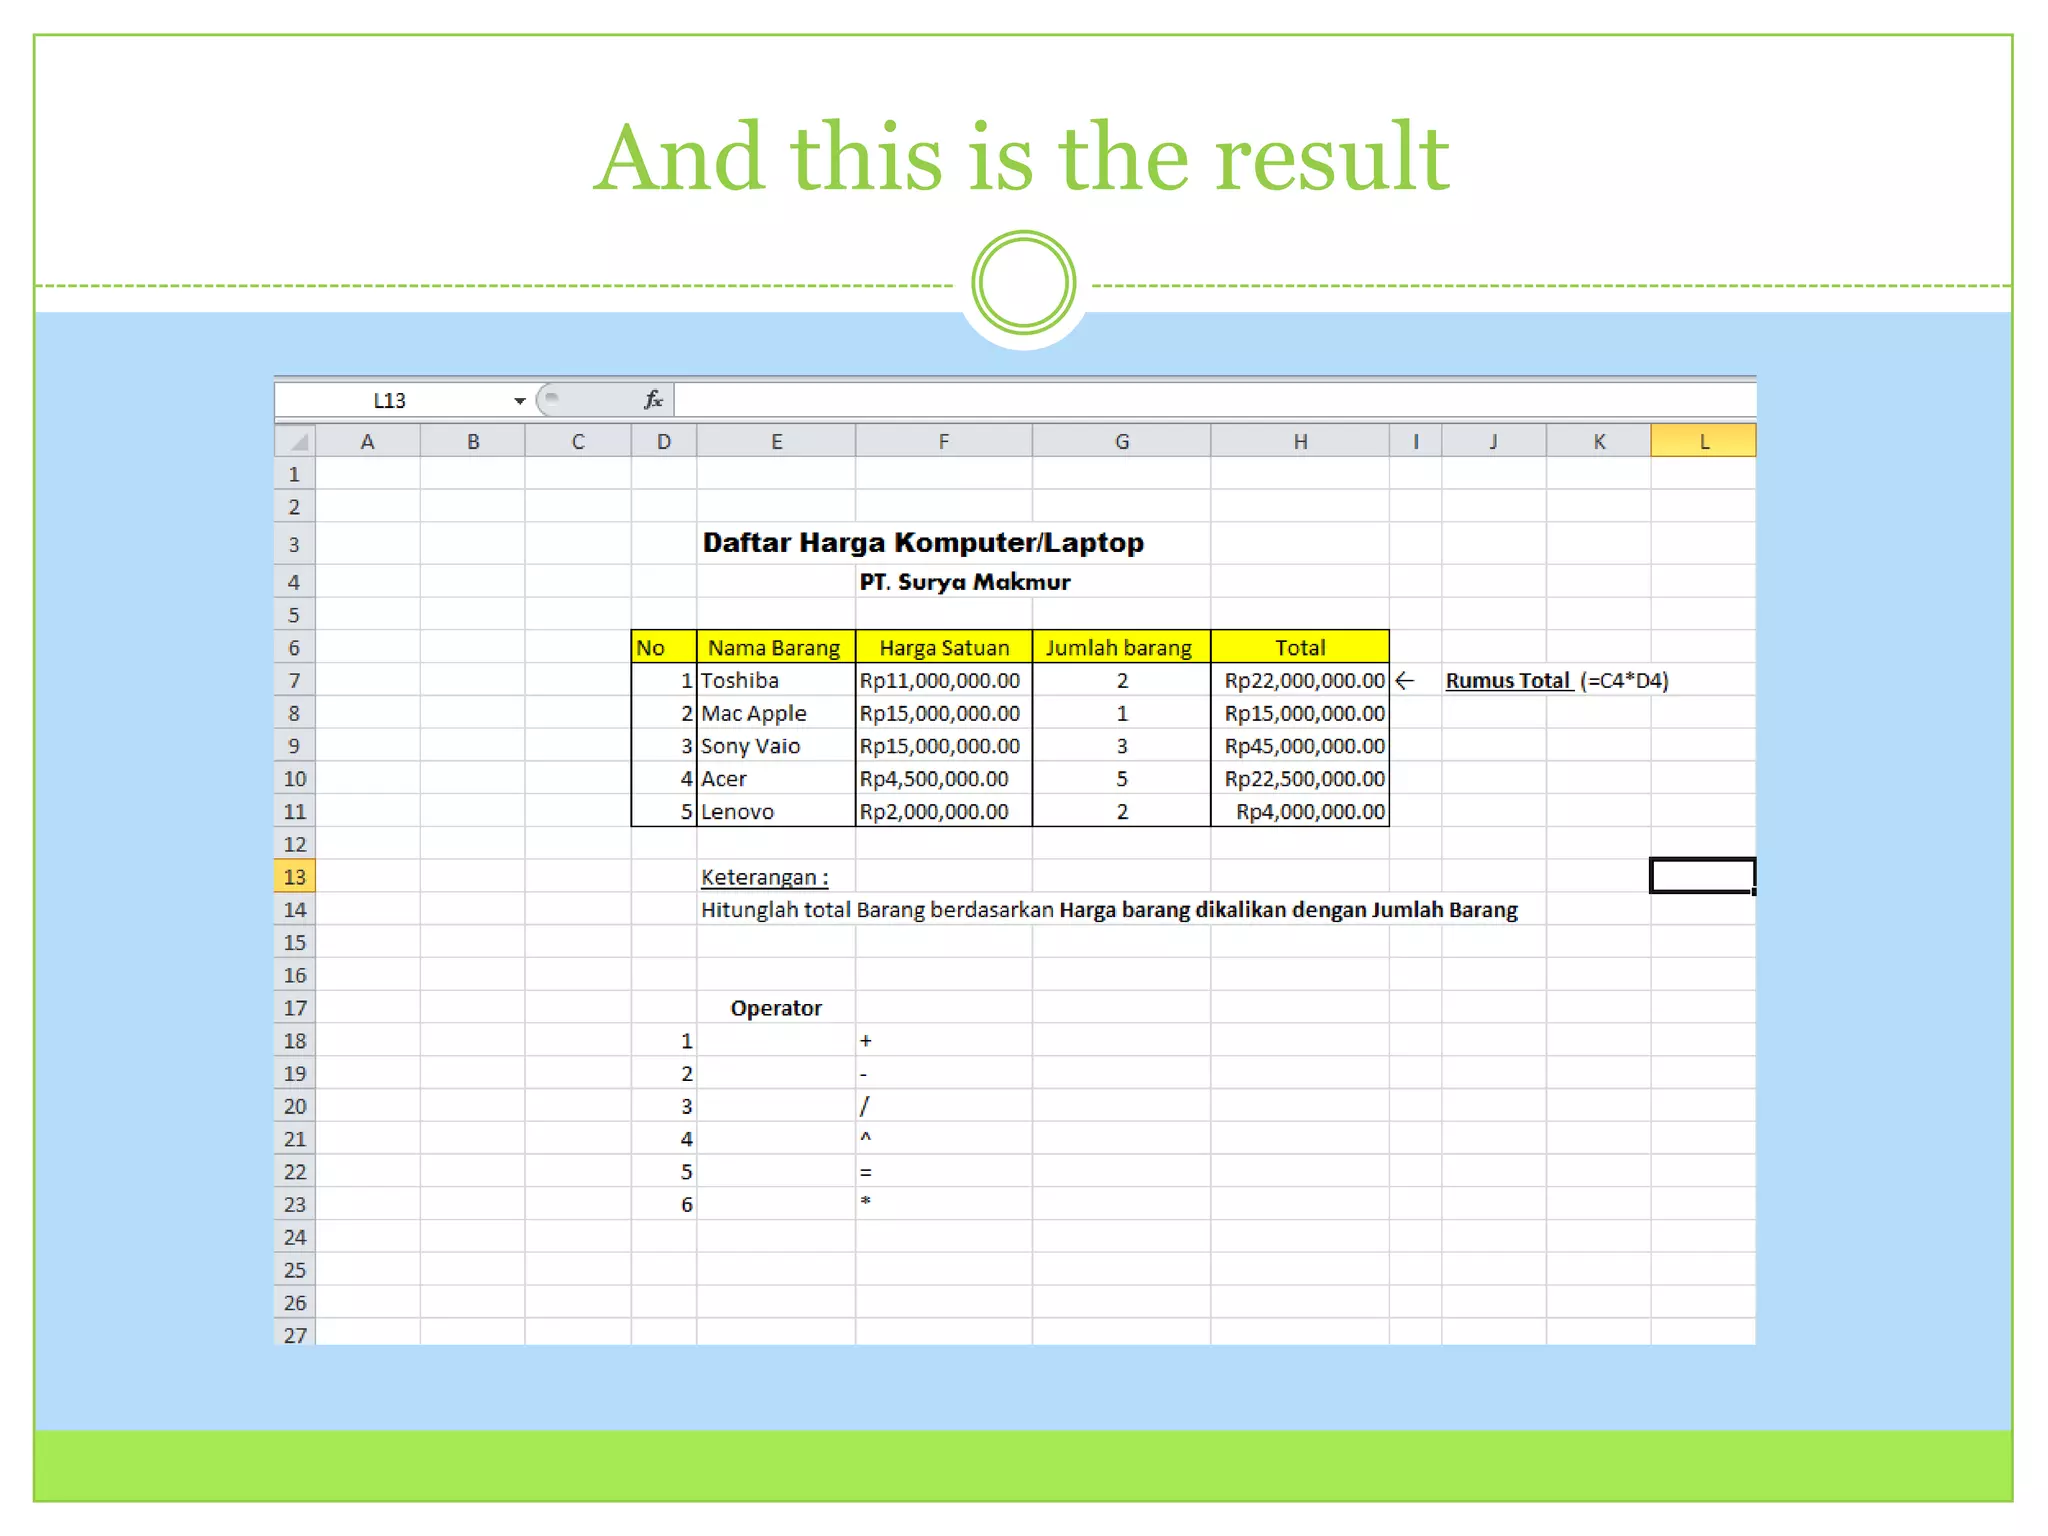
KEMBAR78
Tutorial of microsoft excel 2007 | PPTX
B Y S A B I L L A ~ Y 7
Tutorial of Microsoft Excel
2007
To Open Microsoft Excel 2007
 click windows logo on left bottom on your monitor.
 click ‘all program’ 
 Open Microsoft office folder
 Click Microsoft office excel. And it automatically open by itself.
Microsoft Excel 2007
 Here you have the page of Microsoft office excel 2007. this
program usually used for making data, collecting some data
and make a table. In Excel, there’s many box and also some
tools to make us easier to use.
Menu bar
 Here, the one that in the picture below is called the menu
bar. There are File, Home, Insert, page layout, formulas,
data, review, and view. In each menu, it will be more
describing it if you click one of it.
File – Menu Bar
 In file, there’s also some box. It was save, save as, open,
close, info, recent, new, print, save & send, and help.
 Save: for saving the work
 Save as: for saving the work in other place
 Open: to open file
 Close: to close the work
 Info: for information about the work
 Recent: to see your work before
 New: to make new work
 Print: to print the work
 Save & send: to save and share to media
 Help: to guide you if you need some help
Home – Menu bar
Home is the tools that you want to choose for making your
work. It also divided into some place, Clipboard, Font,
 clipboard is for make the writing is two.
 Font is for editing the letter.
 Alignment is for editing the paragraph. Number is for
editing the number things.
 Style is for design the columns in the work.
 Cells is for edit the columns.
 editing is to editing more to the work.
Insert – Menu Bar
 Table is to add the table.
 Illustration is to add something like photo, clip art, shapes,
screen shoot, and smart art.
 Chart is to add a chart, all chart that you want to choose like
pie, column, line, bar, area, or others.
 Spark lines is to make like a chart but for number like
money.
 Hyperlink is to add a link.
 Text is to add more text In different place and way. And
 symbol is for adding symbol to the work.
Page Layout – Menu bar
 Page layout is for editing the page on the work. and a
everything you want to make you page is good is in here.
Either it’s adding theme, arrange the page, and many more.
Formulas – Menu Bar
 Formulas, it’s for the work that needs to use some
calculation. In here, you can choose what formula you want
to choose. Then you just insert the number and it
automatically will answer the result.
Data – Menu Bar
 Data is for collecting all the data into the page work. It can
be from access, web, text, or from other sources. And it also
can edit the work into the data.
Review – Menu Bar
 Review is for improving the work like the writing, we can improve it by
using the spelling or we can also add comments ad protect the sheet.
How to make a table data
 First, click Home in you menu bar and click Format as table in the style column
Then, it will be some table with different color. You can choose what table do
you want. And when you click you choice, it automatically came a writing like
this.
 It means that you can start your table in the way you want, after you decide it
then click ‘ok’ bottom.
 And it will be like that ‘picture 3’ and you can add it more by click the corner
long and decide how many column you want.
How to make the data
 After you make your own table, you can choose what data
do you want to. Well, we can choose data of a price of
computer and laptop. Here, you can make you list of your
own data like this. And don’t forget to use the currency of
the money so the result doesn’t error.
 To search the total, we can use the formulas in Excel.
 First, click one of the Total column that you want to choose.
 Then, type in the ‘Fx’ = and the first price by using the letter and the number. Example:
=F7
 If you want to multiply it, you can type * and the column beside the first price. Example:
=F7*G7
 And when you enter, it automatically show the result of the calculate. And you can do it
like that.
And this is the result
Thank You

Tutorial of microsoft excel 2007

  • 1.
    B Y SA B I L L A ~ Y 7 Tutorial of Microsoft Excel 2007
  • 2.
    To Open MicrosoftExcel 2007  click windows logo on left bottom on your monitor.  click ‘all program’  Open Microsoft office folder  Click Microsoft office excel. And it automatically open by itself.
  • 3.
    Microsoft Excel 2007 Here you have the page of Microsoft office excel 2007. this program usually used for making data, collecting some data and make a table. In Excel, there’s many box and also some tools to make us easier to use.
  • 4.
    Menu bar  Here,the one that in the picture below is called the menu bar. There are File, Home, Insert, page layout, formulas, data, review, and view. In each menu, it will be more describing it if you click one of it.
  • 5.
    File – MenuBar  In file, there’s also some box. It was save, save as, open, close, info, recent, new, print, save & send, and help.  Save: for saving the work  Save as: for saving the work in other place  Open: to open file  Close: to close the work  Info: for information about the work  Recent: to see your work before  New: to make new work  Print: to print the work  Save & send: to save and share to media  Help: to guide you if you need some help
  • 6.
    Home – Menubar Home is the tools that you want to choose for making your work. It also divided into some place, Clipboard, Font,  clipboard is for make the writing is two.  Font is for editing the letter.  Alignment is for editing the paragraph. Number is for editing the number things.  Style is for design the columns in the work.  Cells is for edit the columns.  editing is to editing more to the work.
  • 7.
    Insert – MenuBar  Table is to add the table.  Illustration is to add something like photo, clip art, shapes, screen shoot, and smart art.  Chart is to add a chart, all chart that you want to choose like pie, column, line, bar, area, or others.  Spark lines is to make like a chart but for number like money.  Hyperlink is to add a link.  Text is to add more text In different place and way. And  symbol is for adding symbol to the work.
  • 8.
    Page Layout –Menu bar  Page layout is for editing the page on the work. and a everything you want to make you page is good is in here. Either it’s adding theme, arrange the page, and many more.
  • 9.
    Formulas – MenuBar  Formulas, it’s for the work that needs to use some calculation. In here, you can choose what formula you want to choose. Then you just insert the number and it automatically will answer the result.
  • 10.
    Data – MenuBar  Data is for collecting all the data into the page work. It can be from access, web, text, or from other sources. And it also can edit the work into the data.
  • 11.
    Review – MenuBar  Review is for improving the work like the writing, we can improve it by using the spelling or we can also add comments ad protect the sheet.
  • 12.
    How to makea table data  First, click Home in you menu bar and click Format as table in the style column Then, it will be some table with different color. You can choose what table do you want. And when you click you choice, it automatically came a writing like this.  It means that you can start your table in the way you want, after you decide it then click ‘ok’ bottom.  And it will be like that ‘picture 3’ and you can add it more by click the corner long and decide how many column you want.
  • 13.
    How to makethe data  After you make your own table, you can choose what data do you want to. Well, we can choose data of a price of computer and laptop. Here, you can make you list of your own data like this. And don’t forget to use the currency of the money so the result doesn’t error.
  • 14.
     To searchthe total, we can use the formulas in Excel.  First, click one of the Total column that you want to choose.  Then, type in the ‘Fx’ = and the first price by using the letter and the number. Example: =F7  If you want to multiply it, you can type * and the column beside the first price. Example: =F7*G7  And when you enter, it automatically show the result of the calculate. And you can do it like that.
  • 15.
    And this isthe result
  • 16.