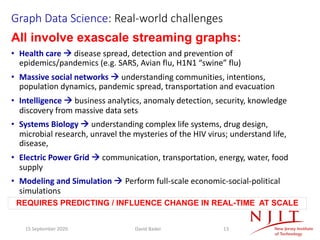
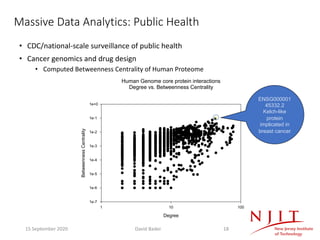
![Network Analysis for Intelligence and Surveillance
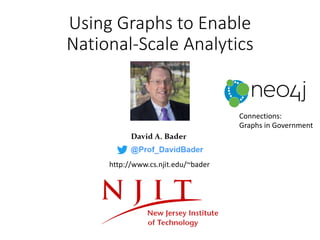
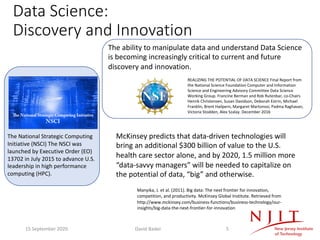
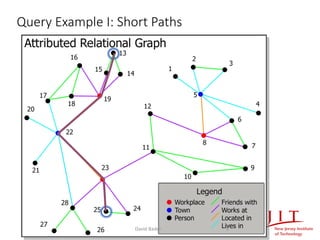
• [Krebs ’04] Post 9/11 Terrorist
Network Analysis from public domain
information
• Plot masterminds correctly identified
from interaction patterns: centrality
• A global view of entities is often more
insightful
• Detect anomalous activities by
exact/approximate graph matching
Image Source: http://www.orgnet.com/hijackers.html
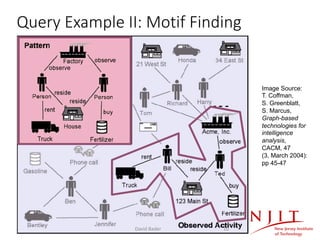
Image Source: T. Coffman, S. Greenblatt, S. Marcus, Graph-based technologies
for intelligence analysis, CACM, 47 (3, March 2004): pp 45-47
15 September 2020 David Bader 17](https://image.slidesharecdn.com/neo4jconnectionsnjit-200915162336/85/Using-Graphs-to-Enable-National-Scale-Analytics-17-320.jpg)
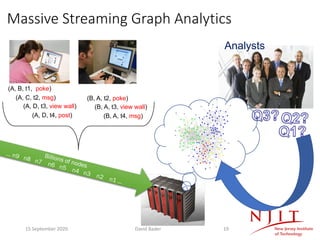
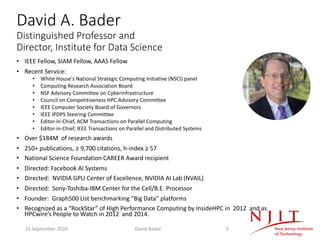
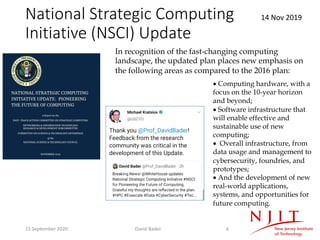
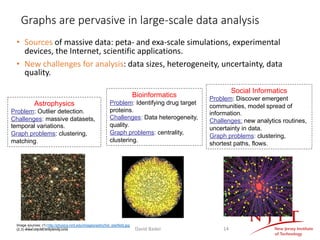
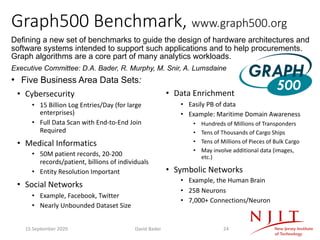
![Betweenness Centrality (BC)
• Key metric in social network analysis
[Freeman ’77, Goh ’02, Newman ’03, Brandes ’03]
• : Number of shortest paths between vertices s and t
• : Number of shortest paths between vertices s and t
passing through v
( )
( )st
s v t V st
v
BC v
s
s¹ ¹ Î
= å
)(vsts
sts
15 September 2020 David Bader 21](https://image.slidesharecdn.com/neo4jconnectionsnjit-200915162336/85/Using-Graphs-to-Enable-National-Scale-Analytics-21-320.jpg)
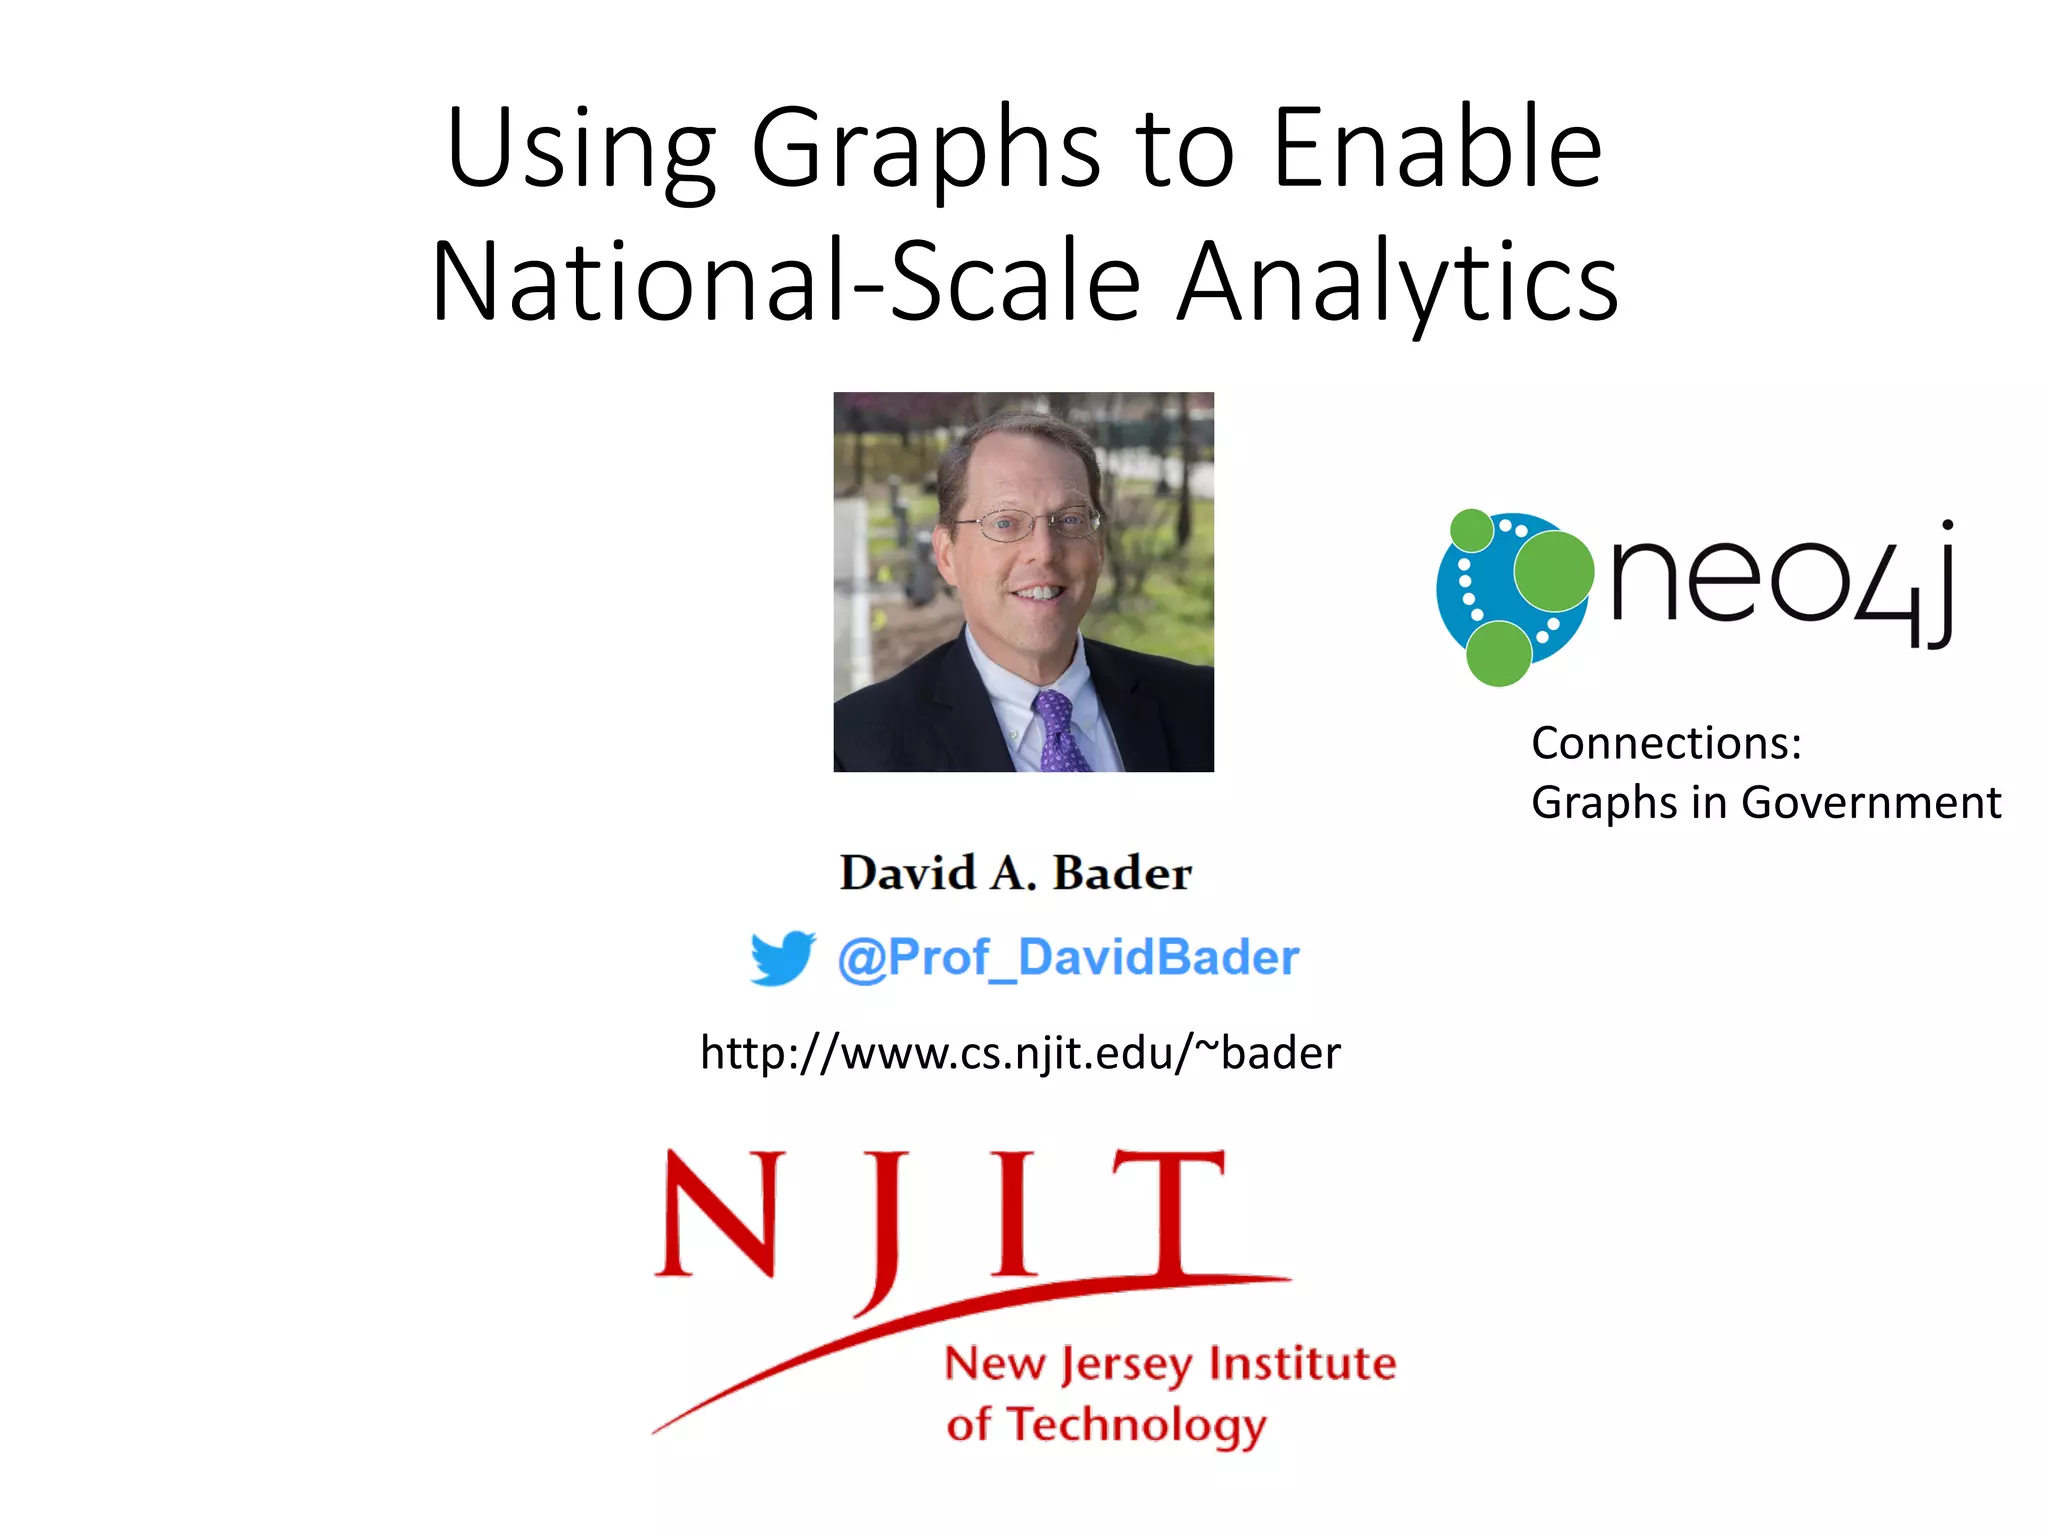


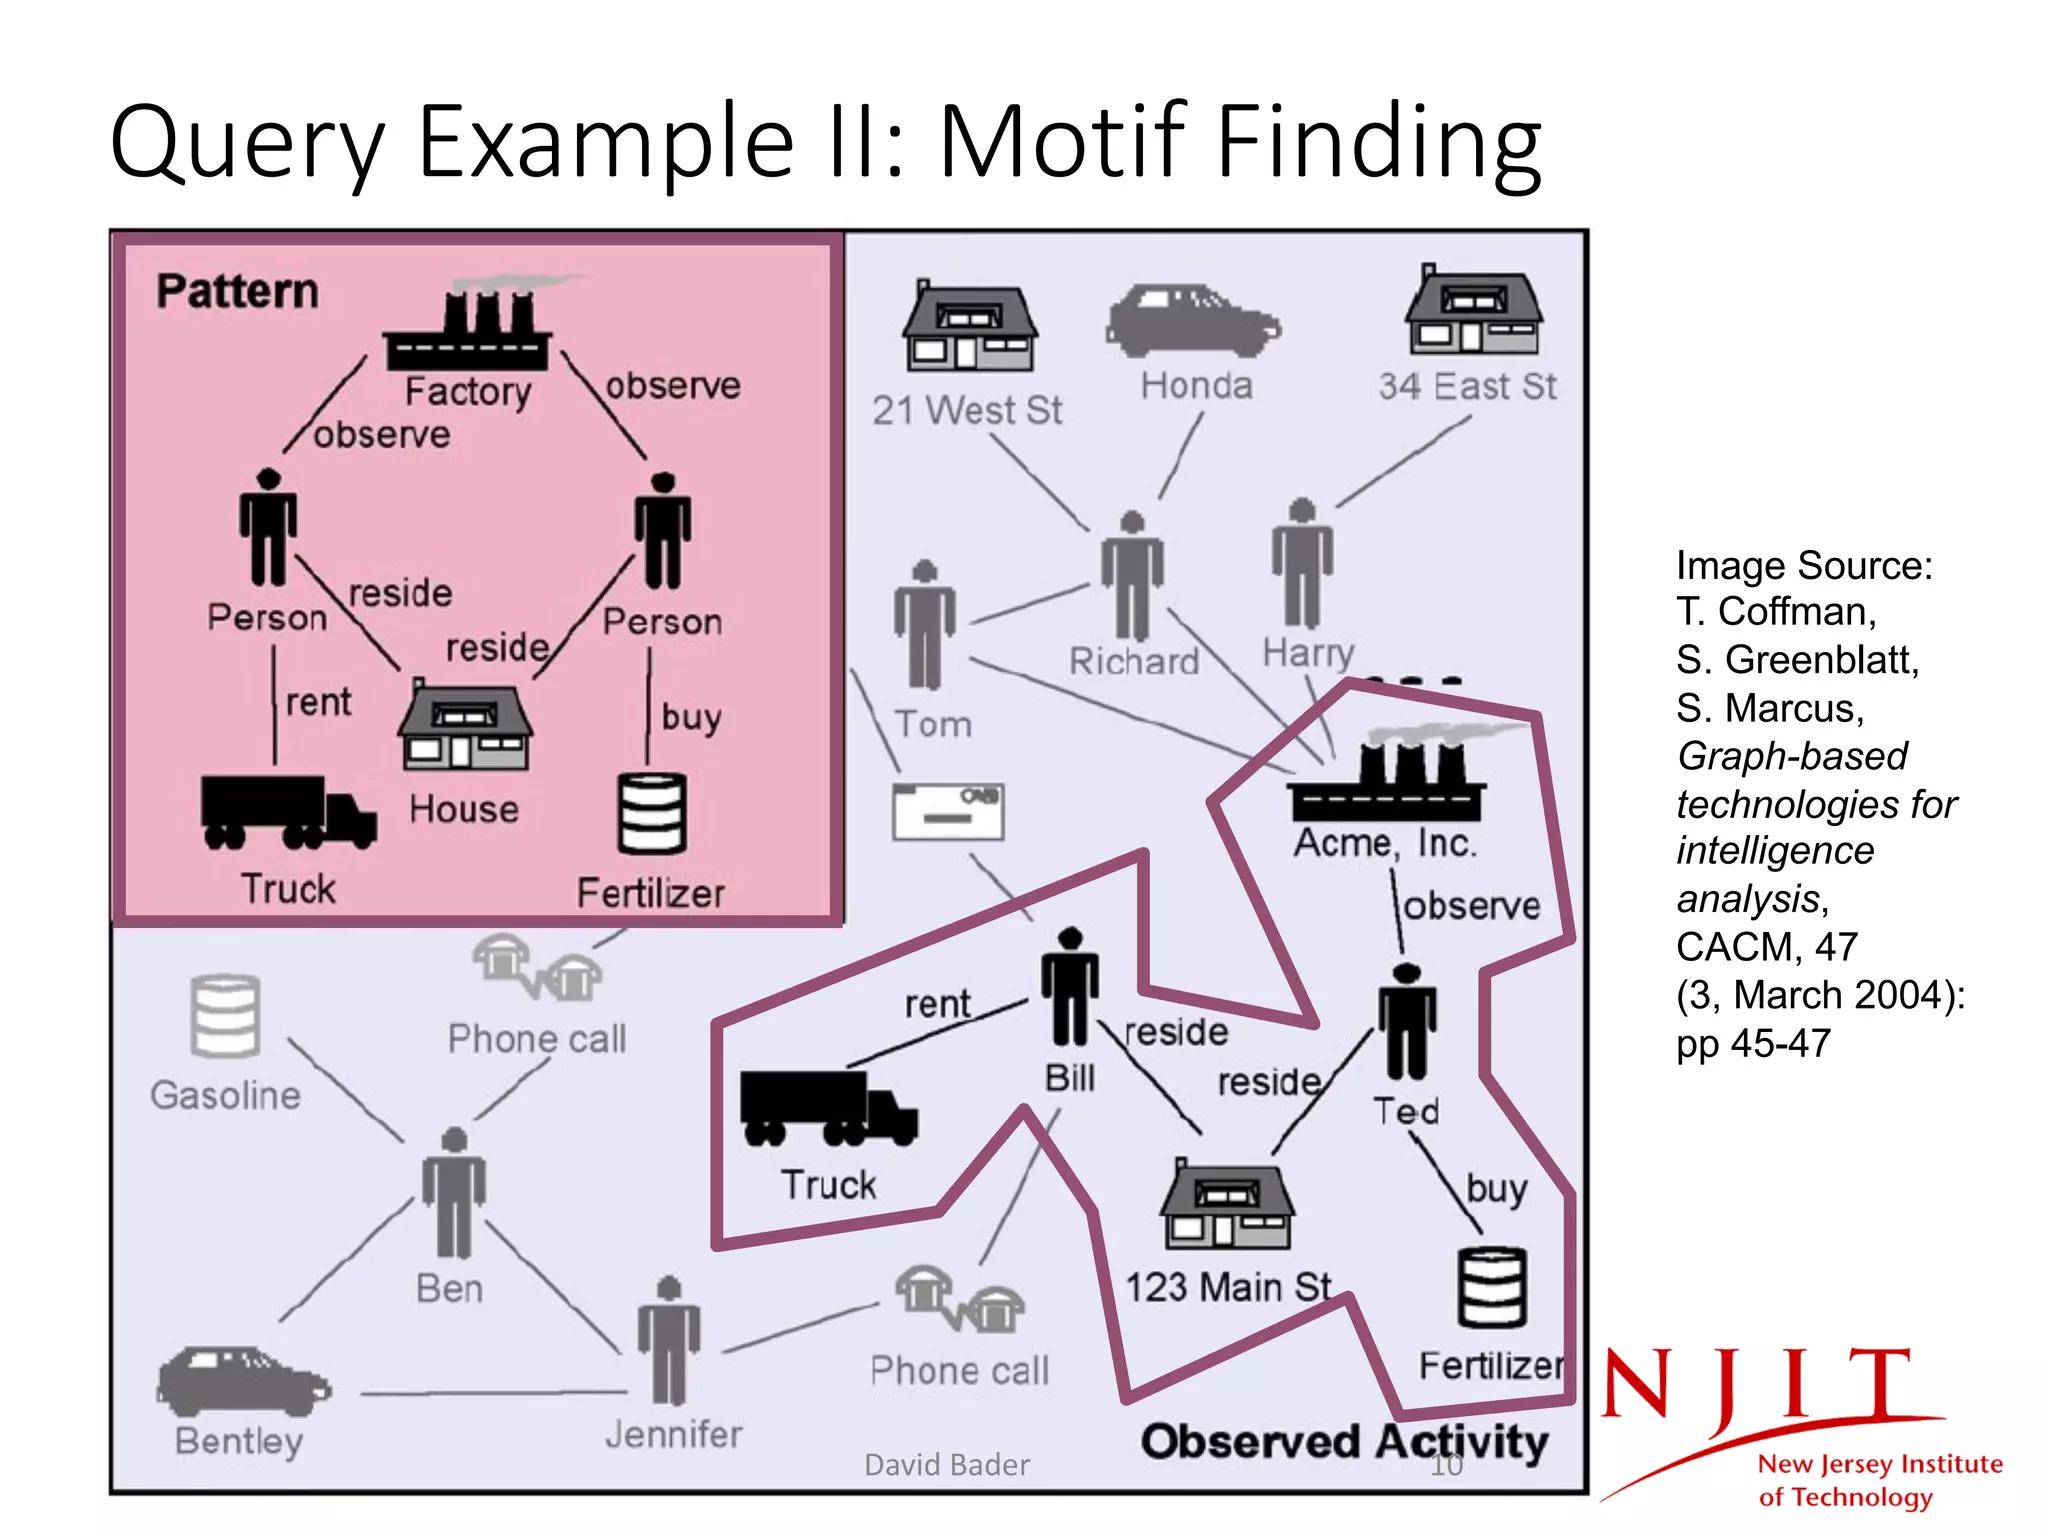

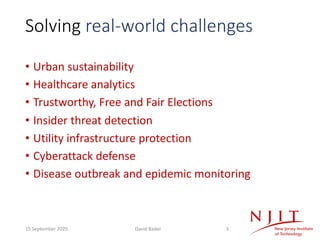
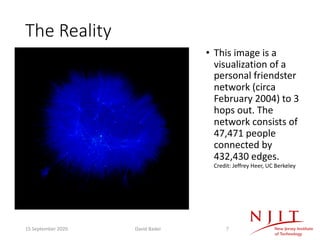
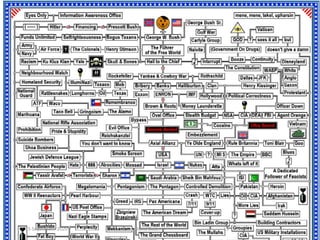
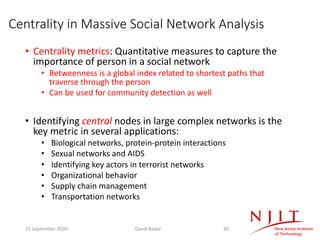
![Network Analysis for Intelligence and Surveillance
• [Krebs ’04] Post 9/11 Terrorist
Network Analysis from public domain
information
• Plot masterminds correctly identified
from interaction patterns: centrality
• A global view of entities is often more
insightful
• Detect anomalous activities by
exact/approximate graph matching
Image Source: http://www.orgnet.com/hijackers.html
Image Source: T. Coffman, S. Greenblatt, S. Marcus, Graph-based technologies
for intelligence analysis, CACM, 47 (3, March 2004): pp 45-47
15 September 2020 David Bader 17](https://image.slidesharecdn.com/neo4jconnectionsnjit-200915162336/75/Using-Graphs-to-Enable-National-Scale-Analytics-17-2048.jpg)


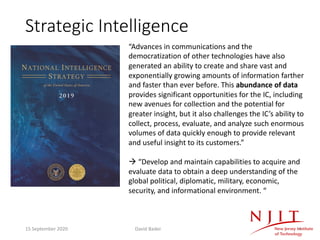
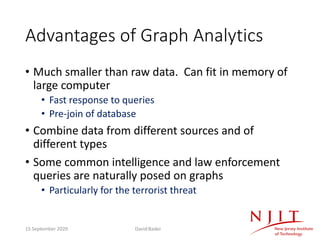
![Betweenness Centrality (BC)
• Key metric in social network analysis
[Freeman ’77, Goh ’02, Newman ’03, Brandes ’03]
• : Number of shortest paths between vertices s and t
• : Number of shortest paths between vertices s and t
passing through v
( )
( )st
s v t V st
v
BC v
s
s¹ ¹ Î
= å
)(vsts
sts
15 September 2020 David Bader 21](https://image.slidesharecdn.com/neo4jconnectionsnjit-200915162336/75/Using-Graphs-to-Enable-National-Scale-Analytics-21-2048.jpg)


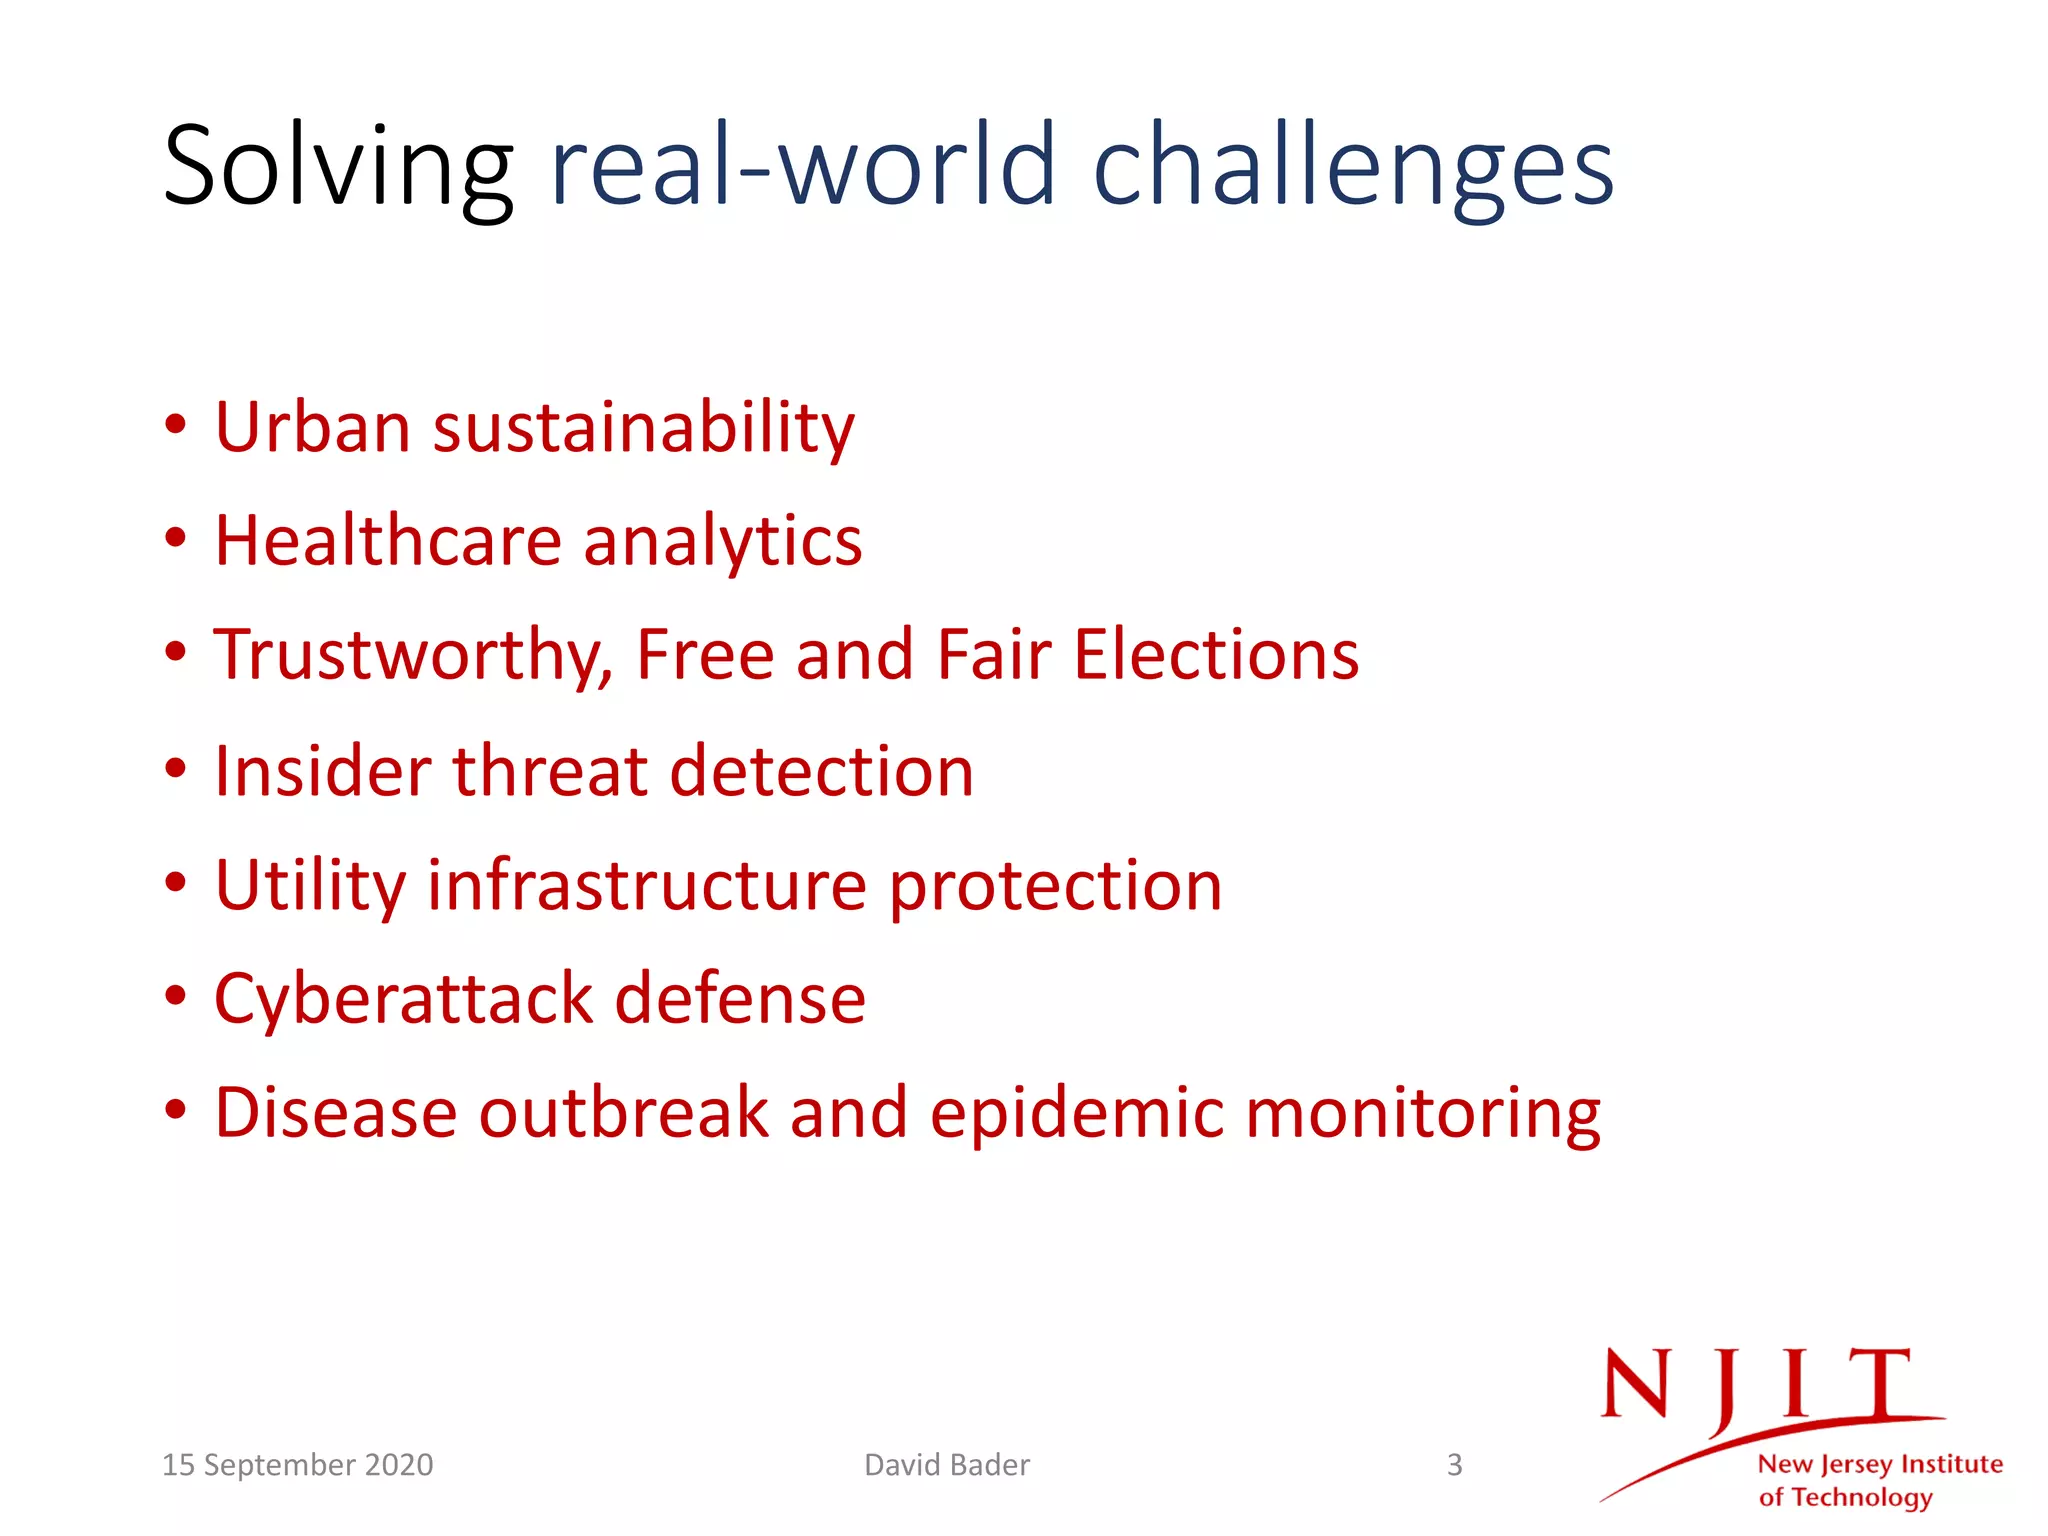
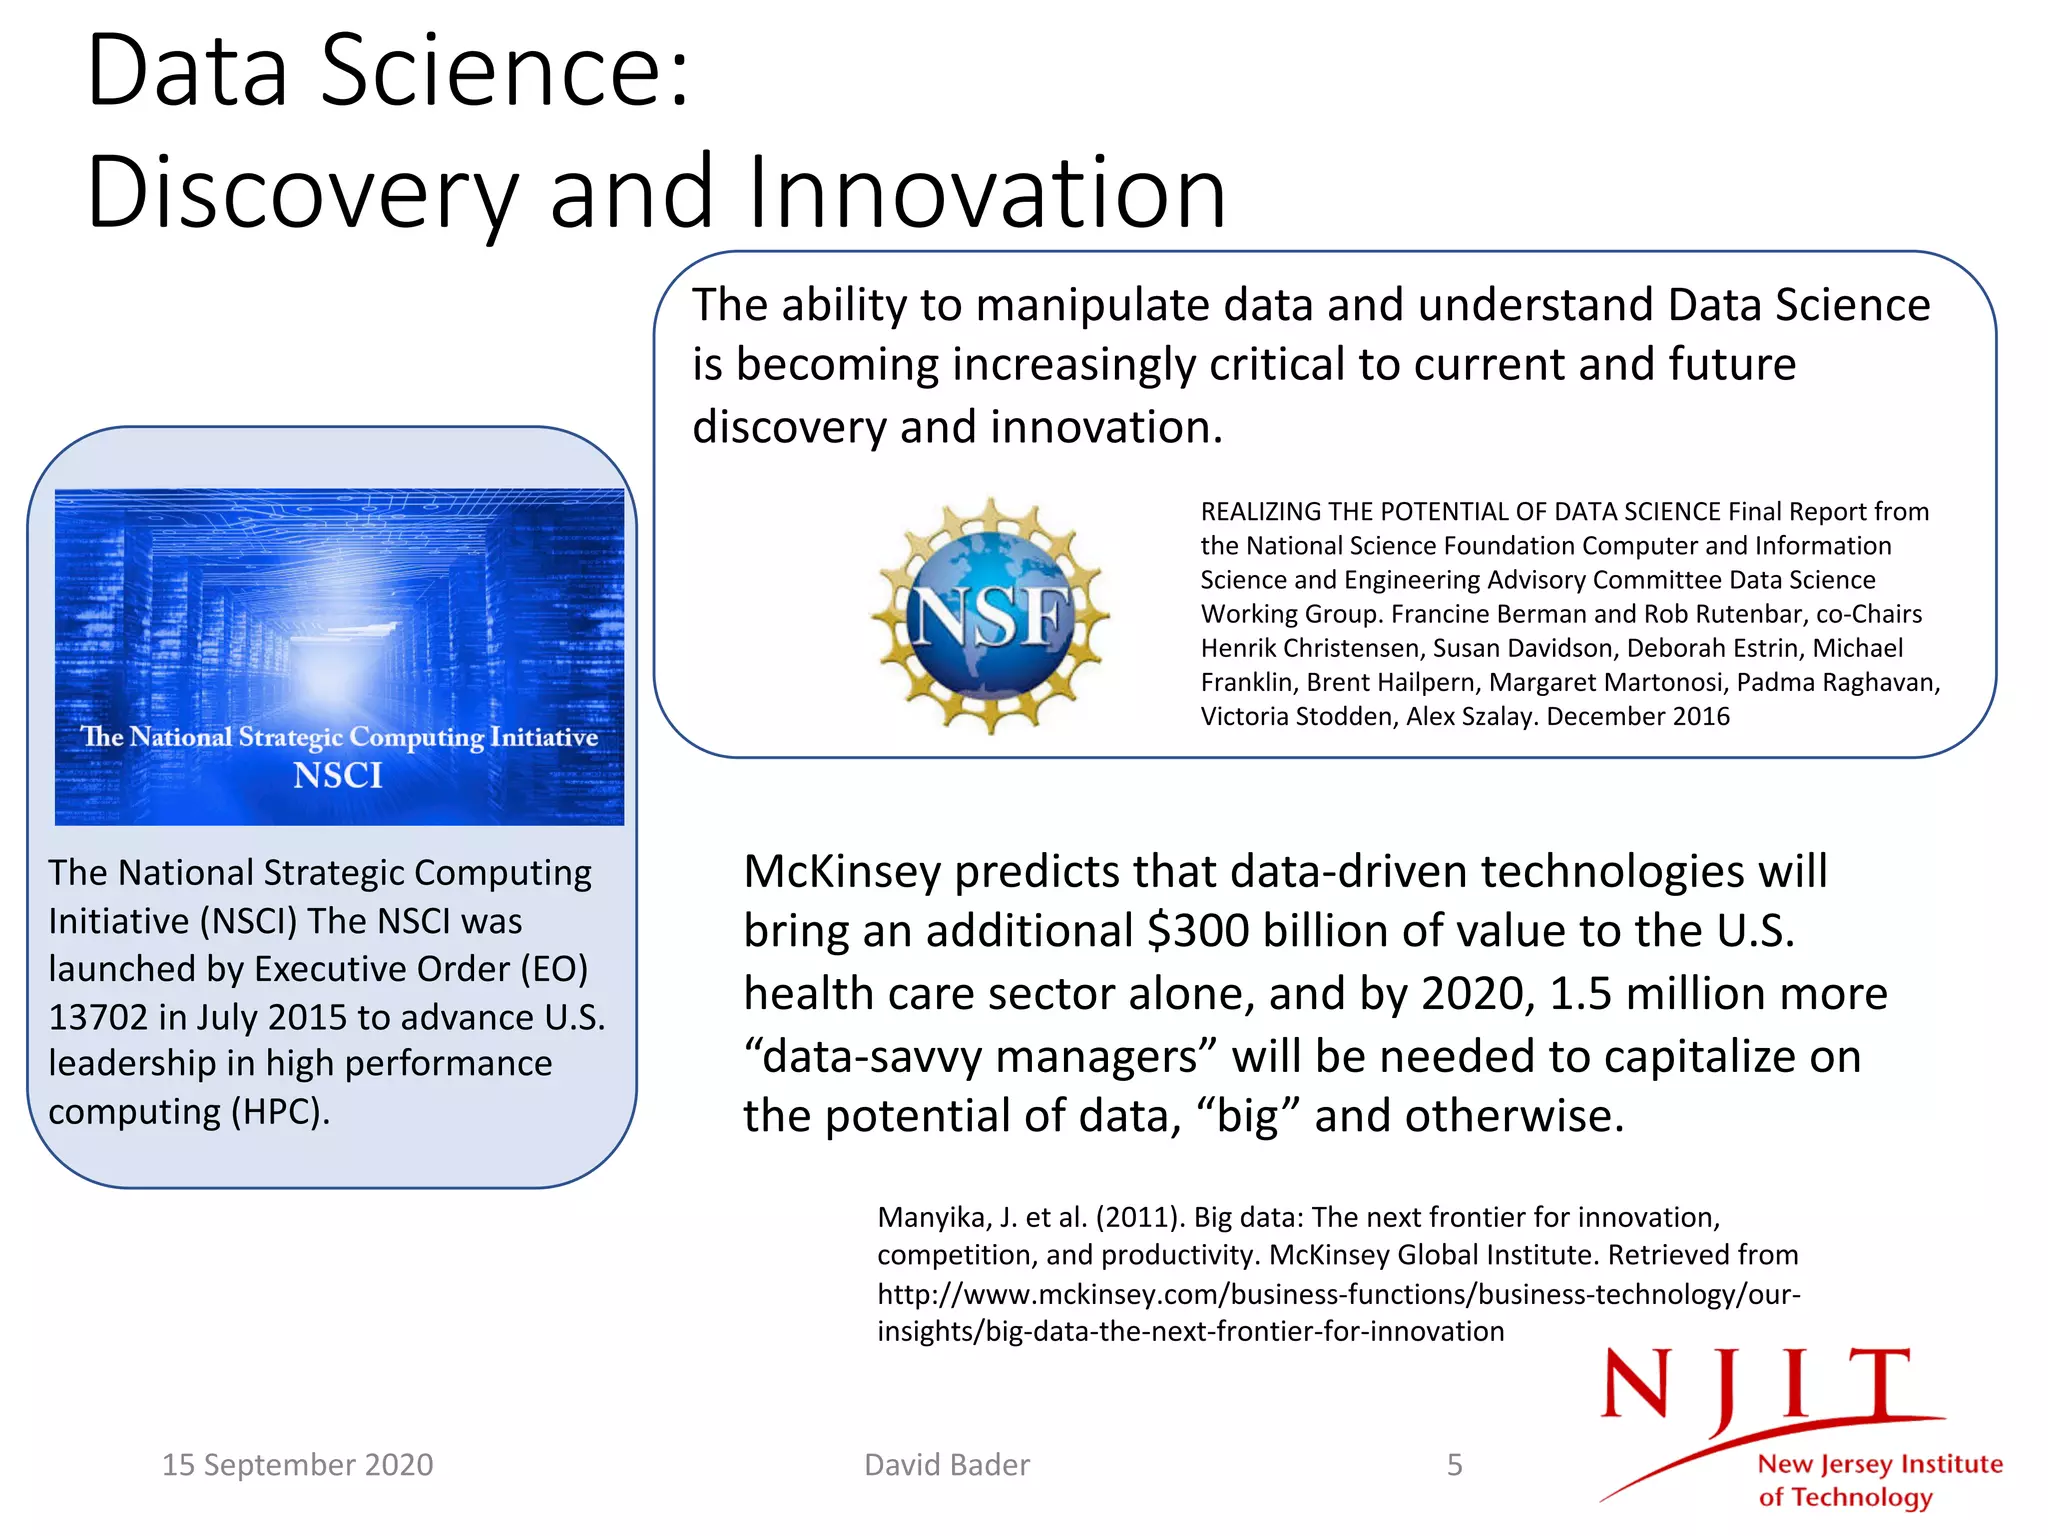
David A. Bader discusses the critical role of graph analytics in addressing significant national challenges such as urban sustainability, healthcare, and cybersecurity. He highlights the National Strategic Computing Initiative's efforts to advance high-performance computing and its application in data science, emphasizing the importance of understanding complex data relationships. The document outlines various real-world applications of graph analytics, reinforcing its value across diverse sectors including public health and intelligence.


![UiPath Automation Suite Installation (Hands-On) [2/3]](https://cdn.slidesharecdn.com/ss_thumbnails/automationsuitecommunitysession2-251015095633-a6d862f1-thumbnail.jpg?width=600ounds&width=560&fit=bounds)


