Download as PDF, PPTX


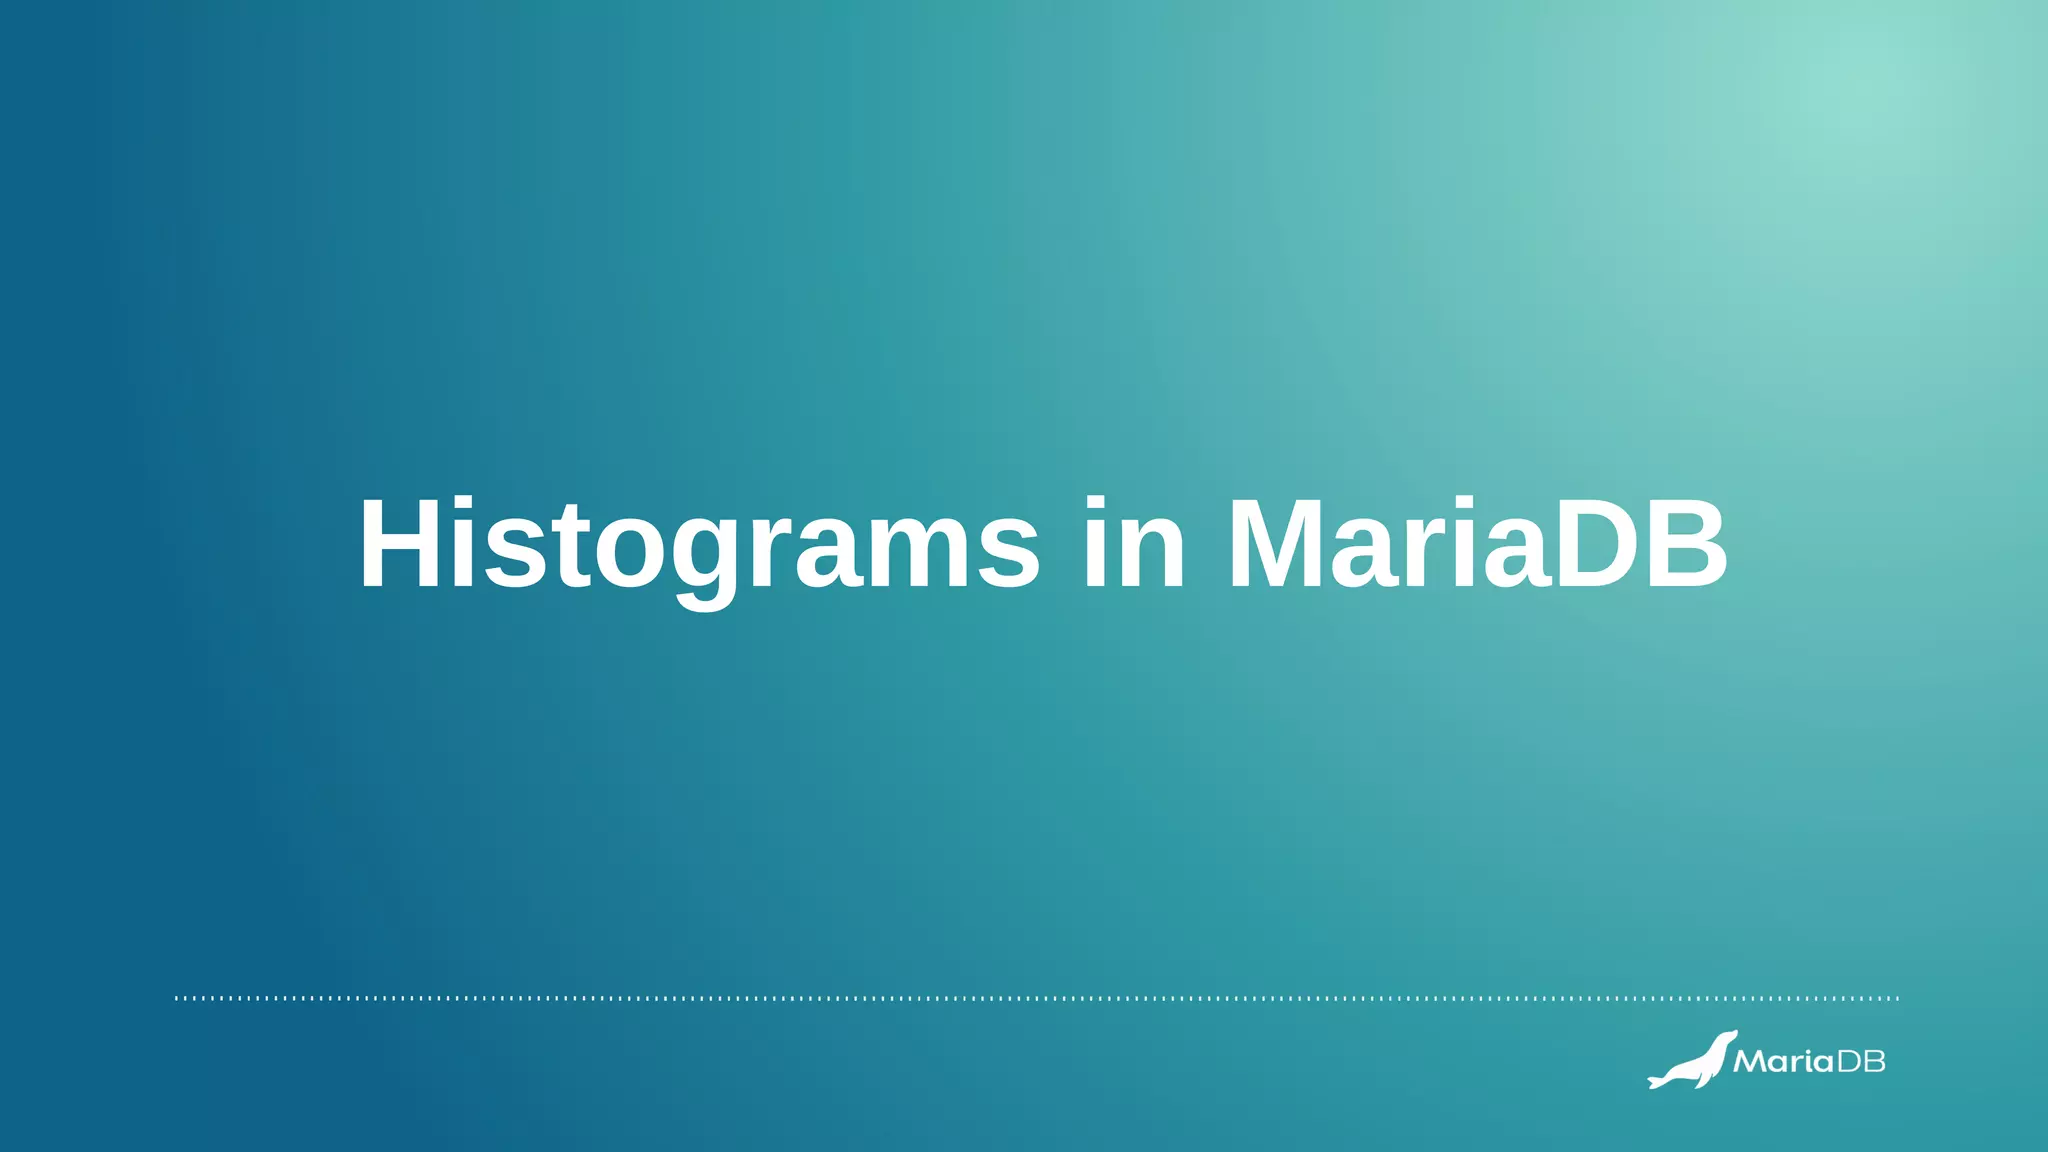
![Histograms are [still] not collected by default
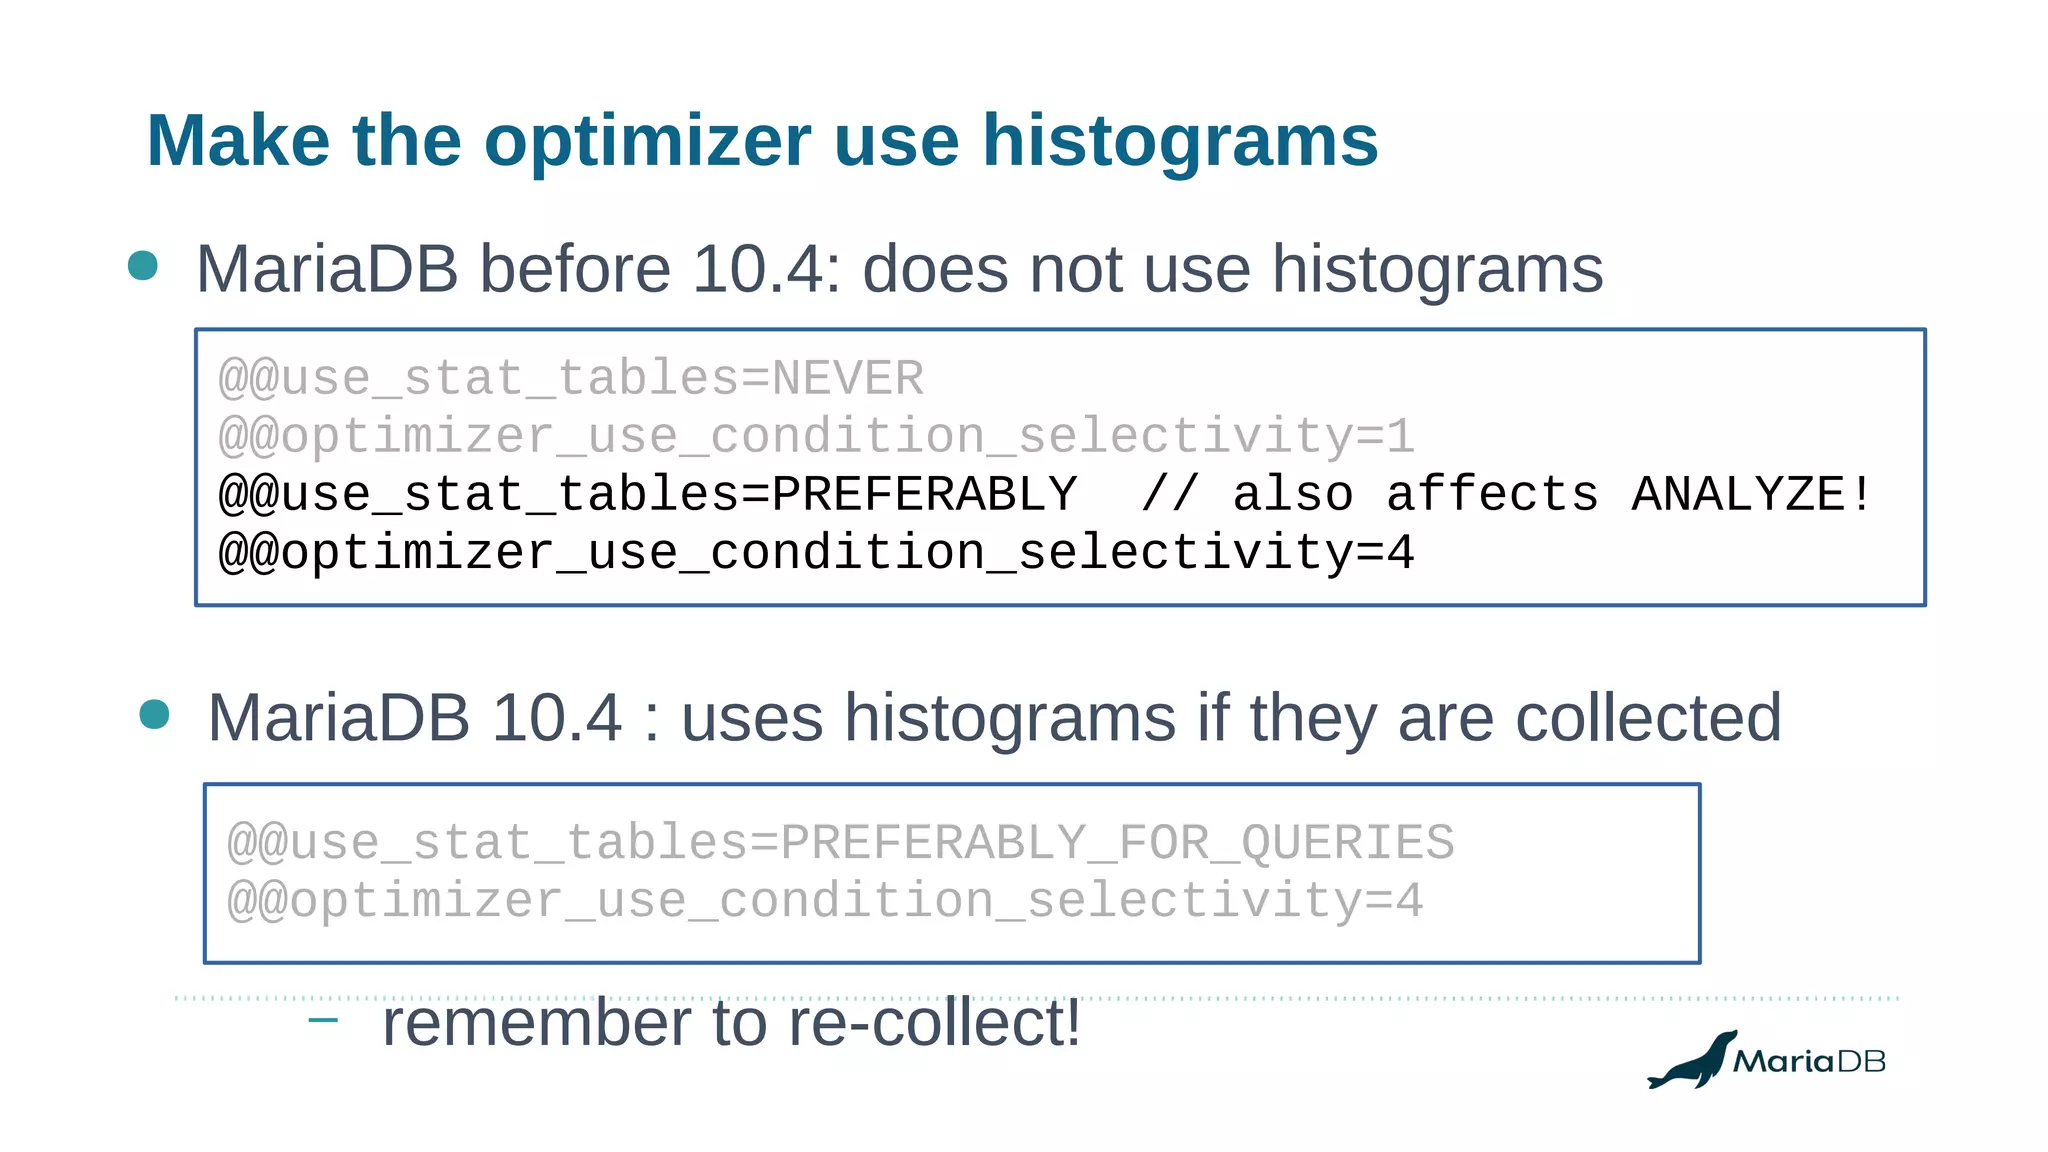
● “ANALYZE TABLE” will not collect a histogram
MariaDB> analyze table t1;
+---------+---------+----------+----------+
| Table | Op | Msg_type | Msg_text |
+---------+---------+----------+----------+
| test.t1 | analyze | status | OK |
+---------+---------+----------+----------+
● This will collect only
– Total #rows in table
– Index cardinalities (#different values)](https://image.slidesharecdn.com/how-to-use-histograms-openworks2019-190227145108/85/Using-histograms-to-get-better-performance-17-320.jpg)


![Histograms are [still] not collected by default
● “ANALYZE TABLE” will not collect a histogram
MariaDB> analyze table t1;
+---------+---------+----------+----------+
| Table | Op | Msg_type | Msg_text |
+---------+---------+----------+----------+
| test.t1 | analyze | status | OK |
+---------+---------+----------+----------+
● This will collect only
– Total #rows in table
– Index cardinalities (#different values)](https://image.slidesharecdn.com/how-to-use-histograms-openworks2019-190227145108/75/Using-histograms-to-get-better-performance-17-2048.jpg)
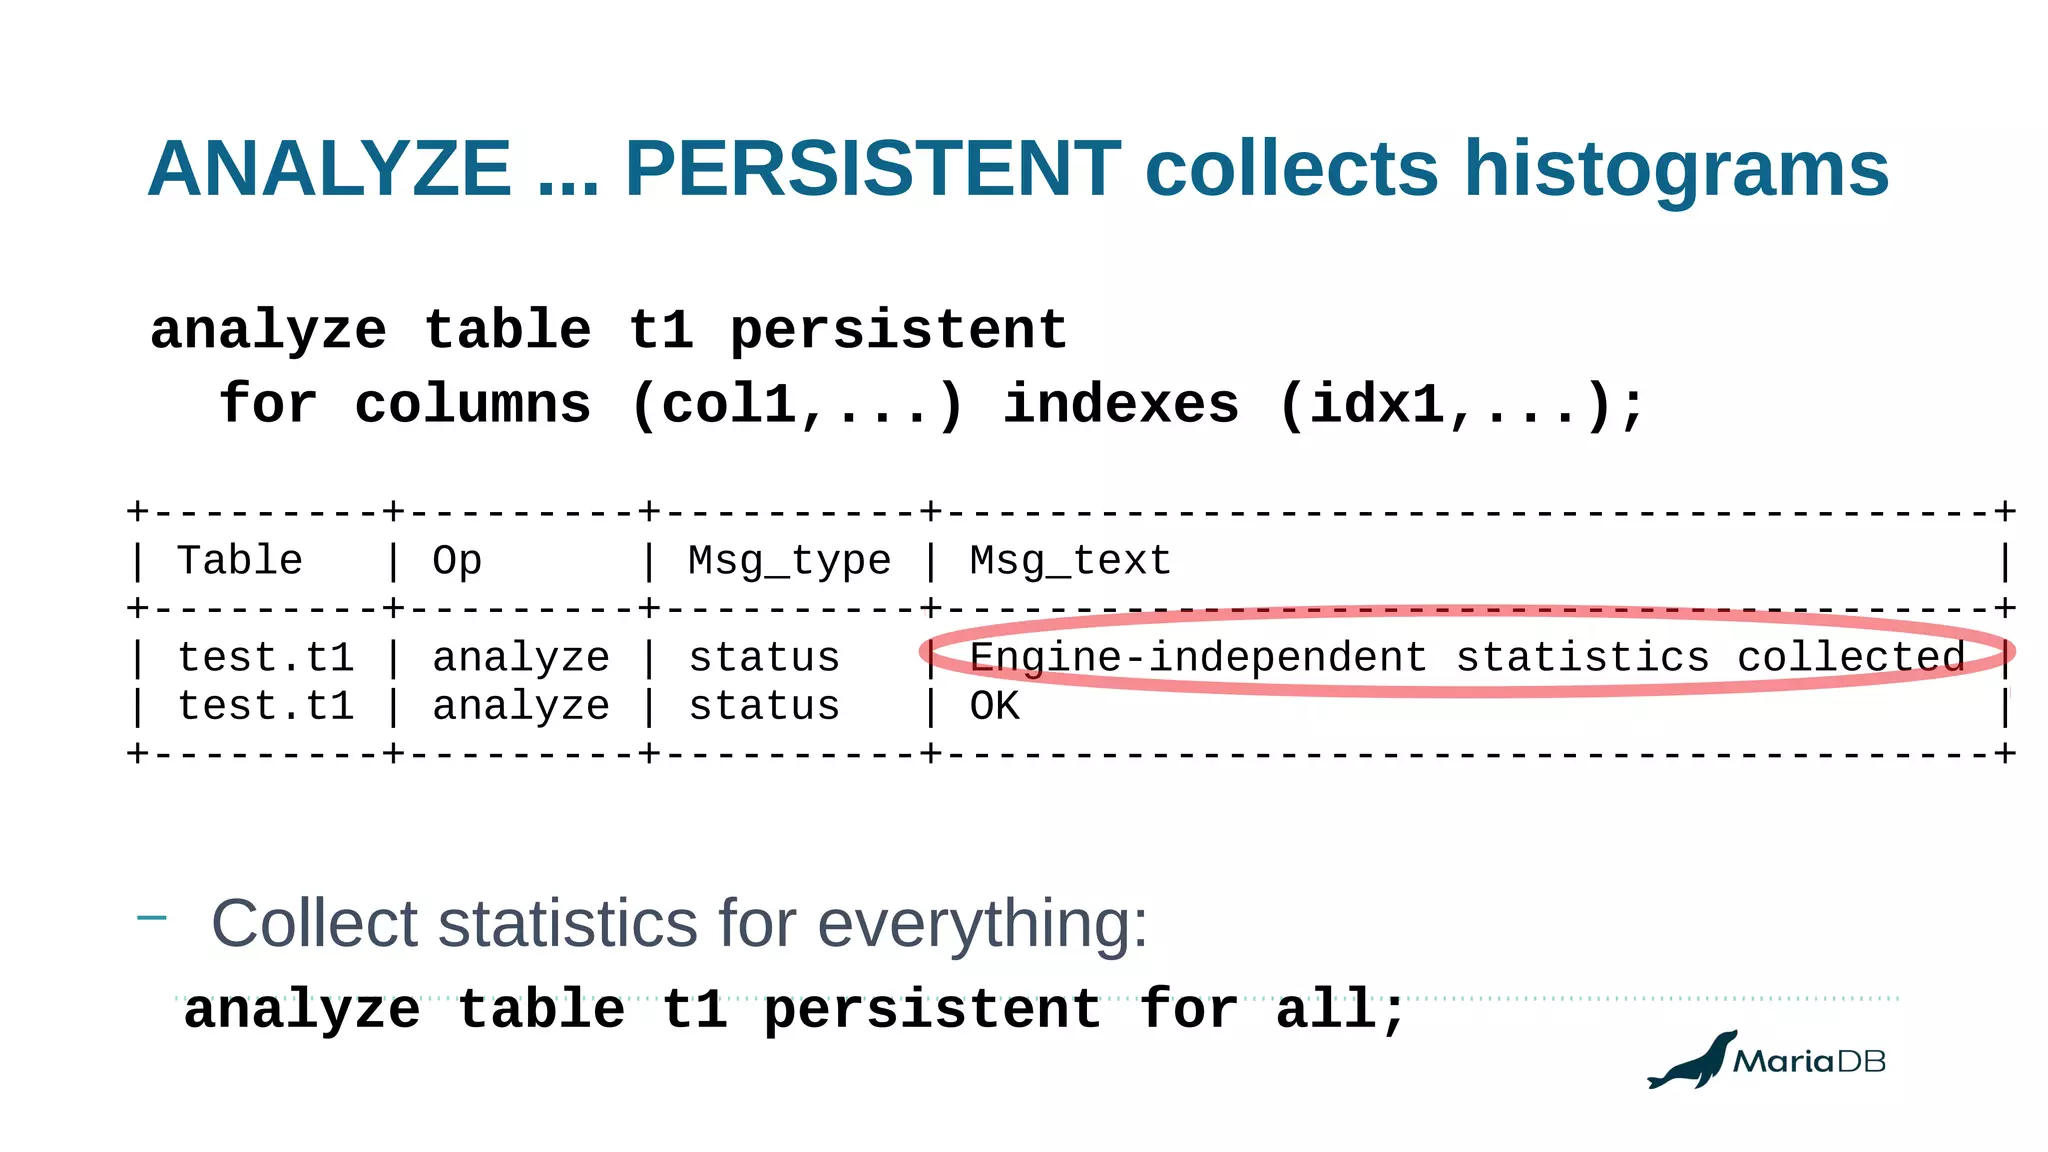
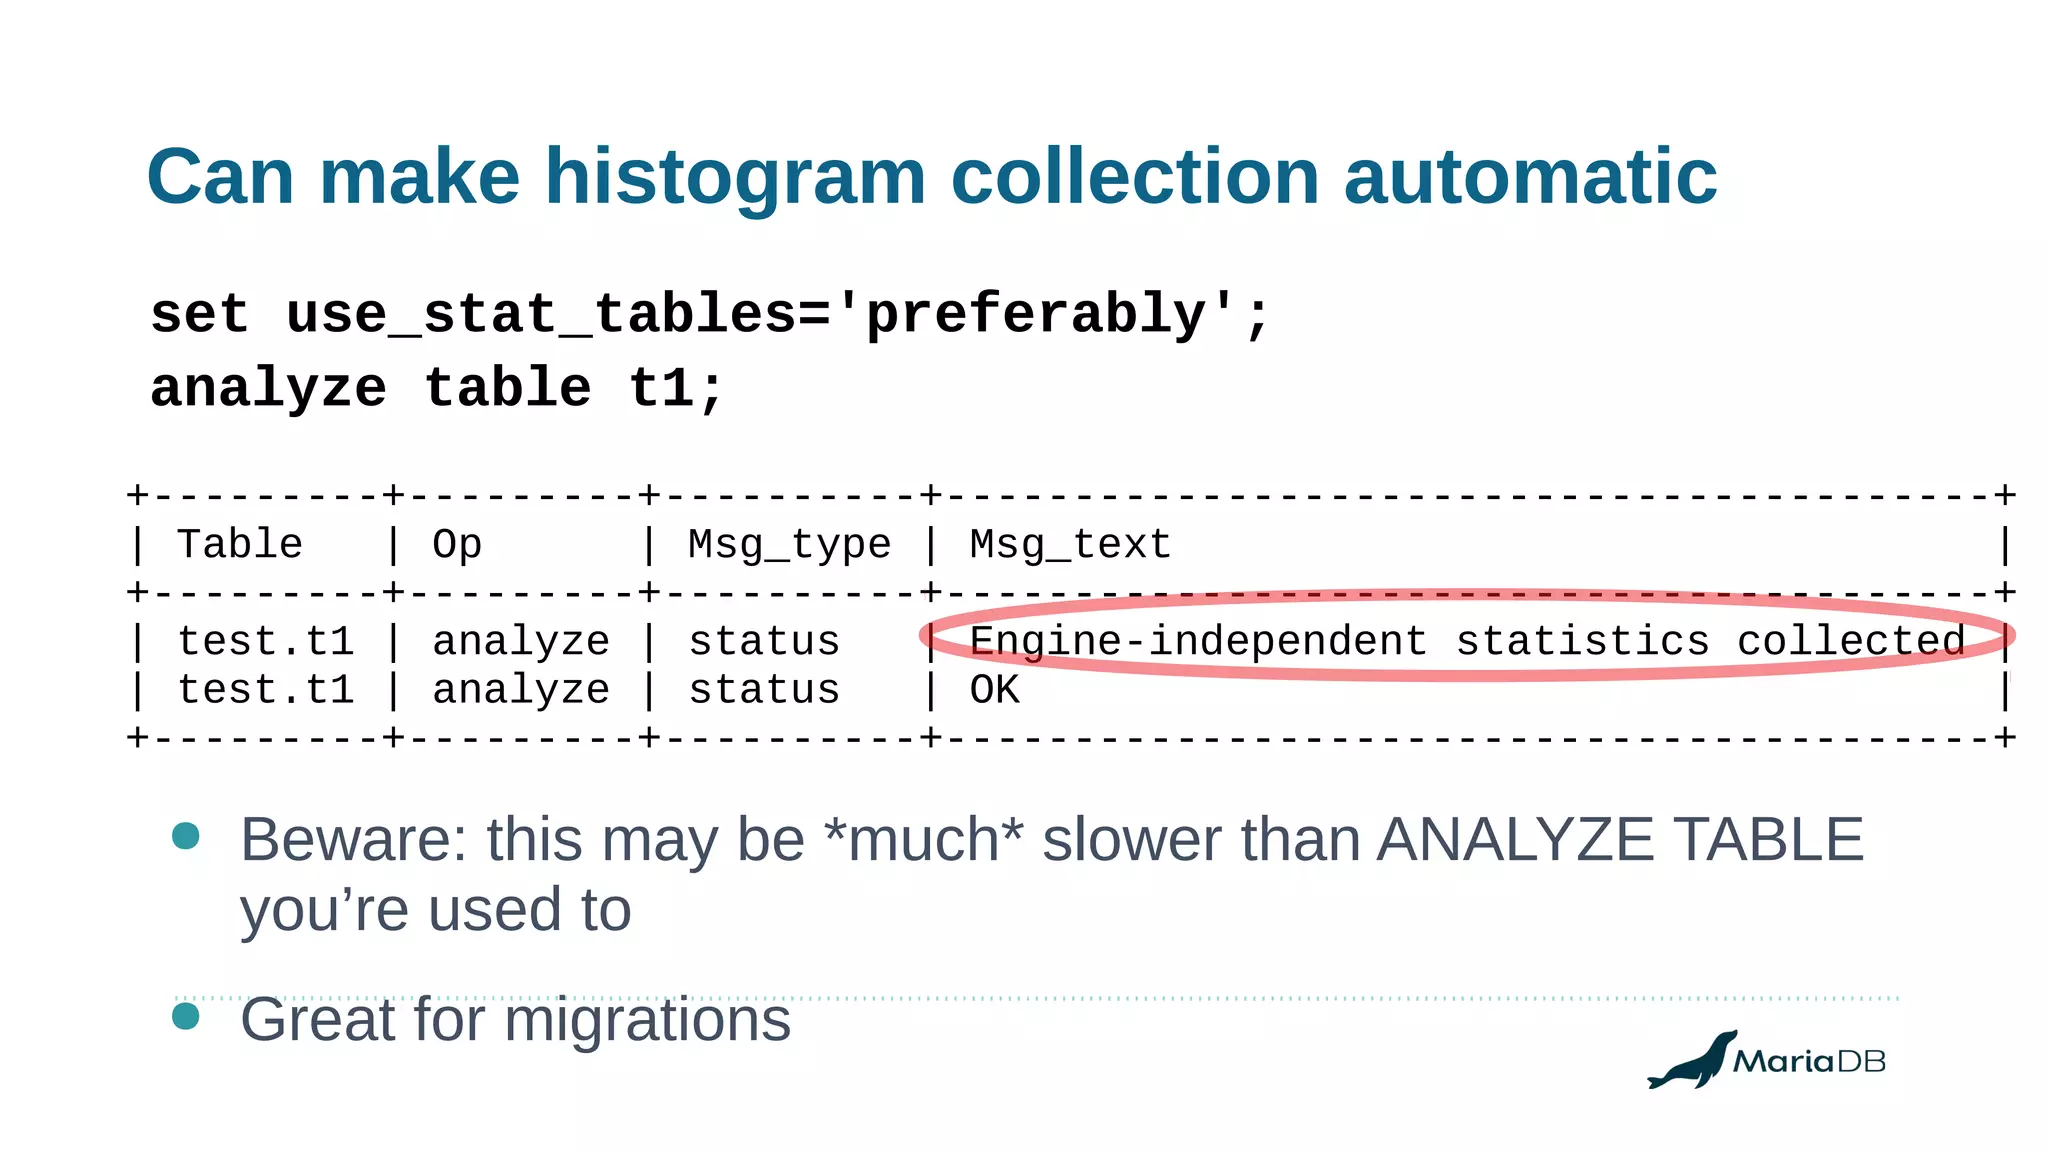
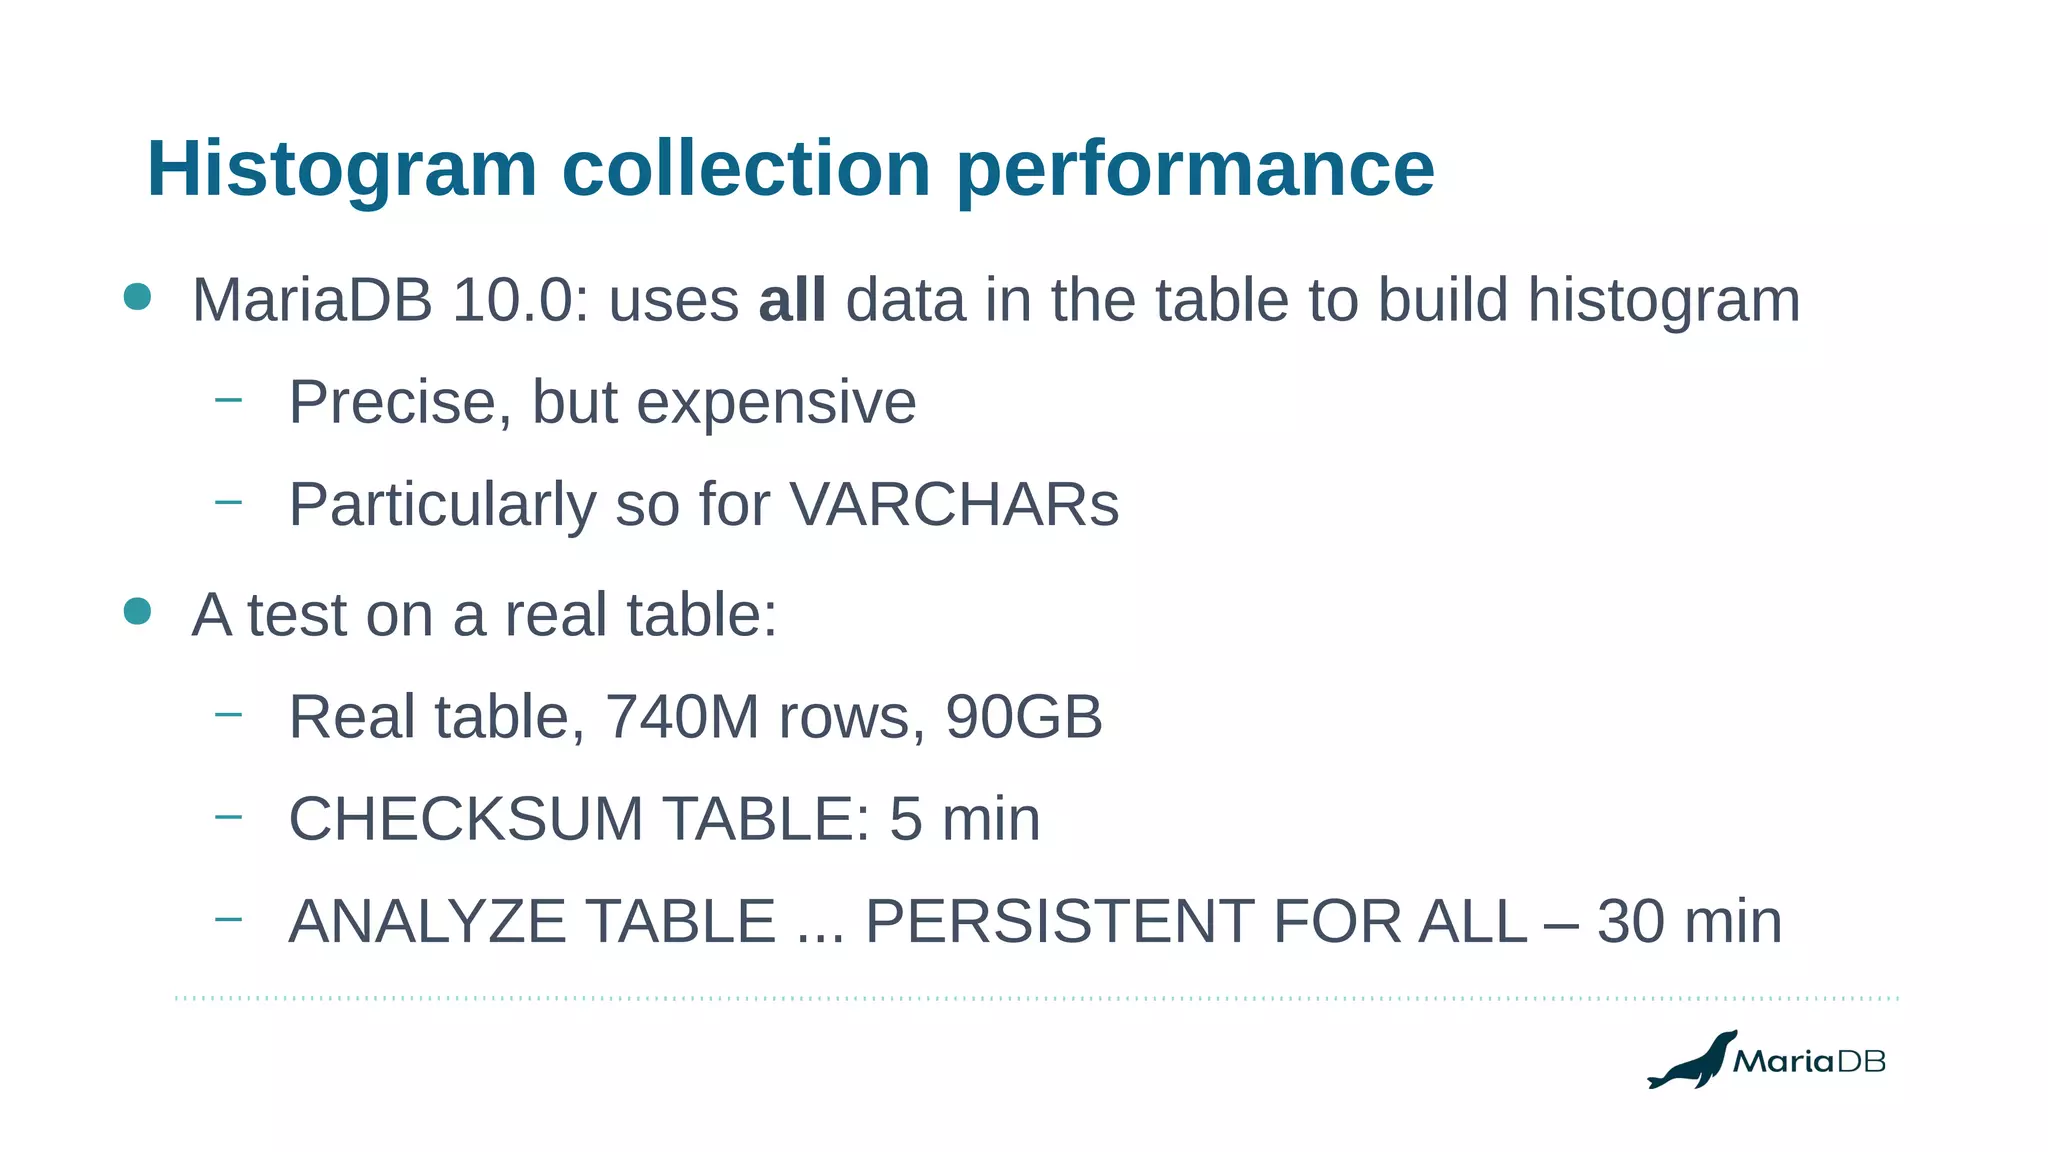

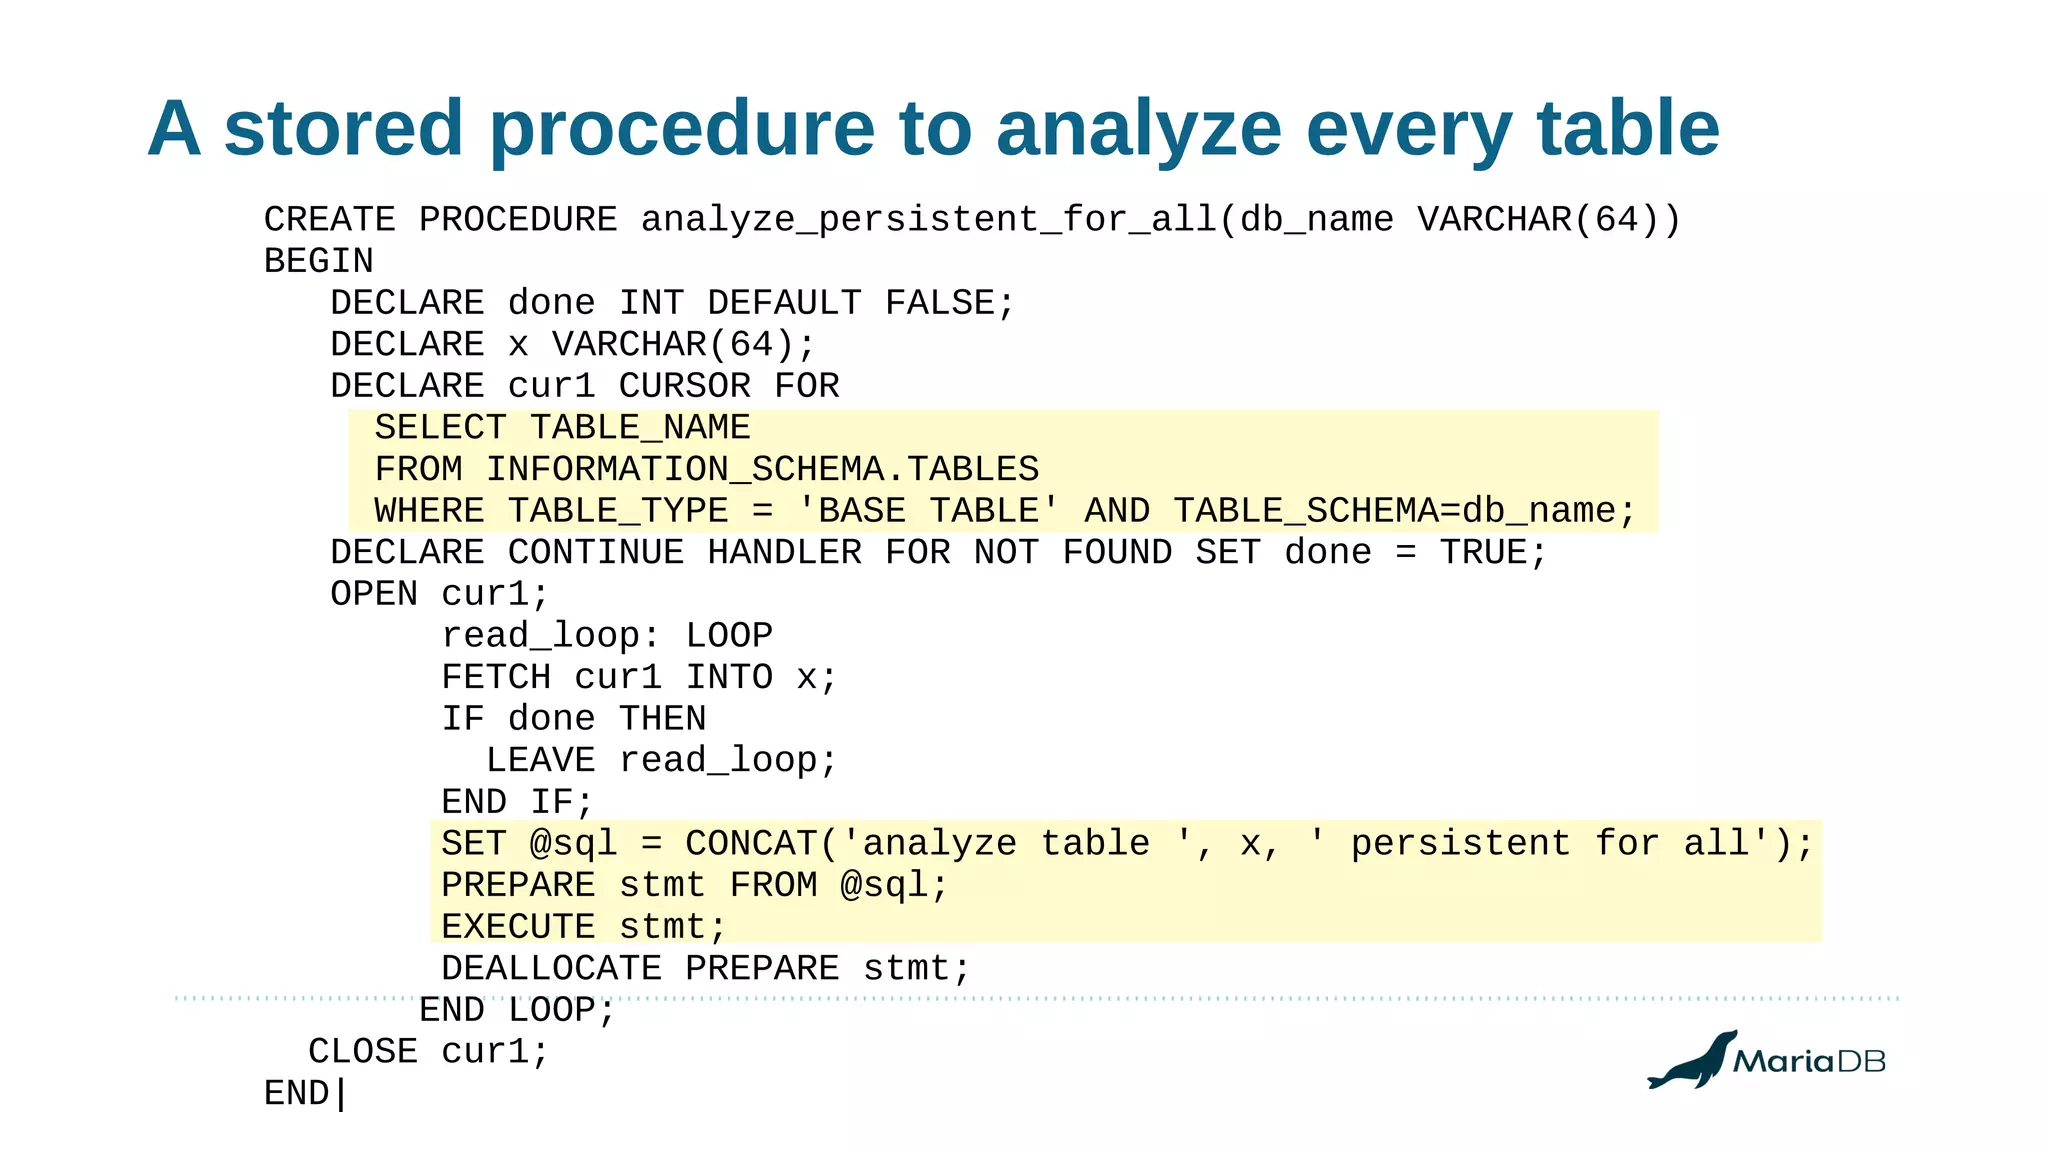
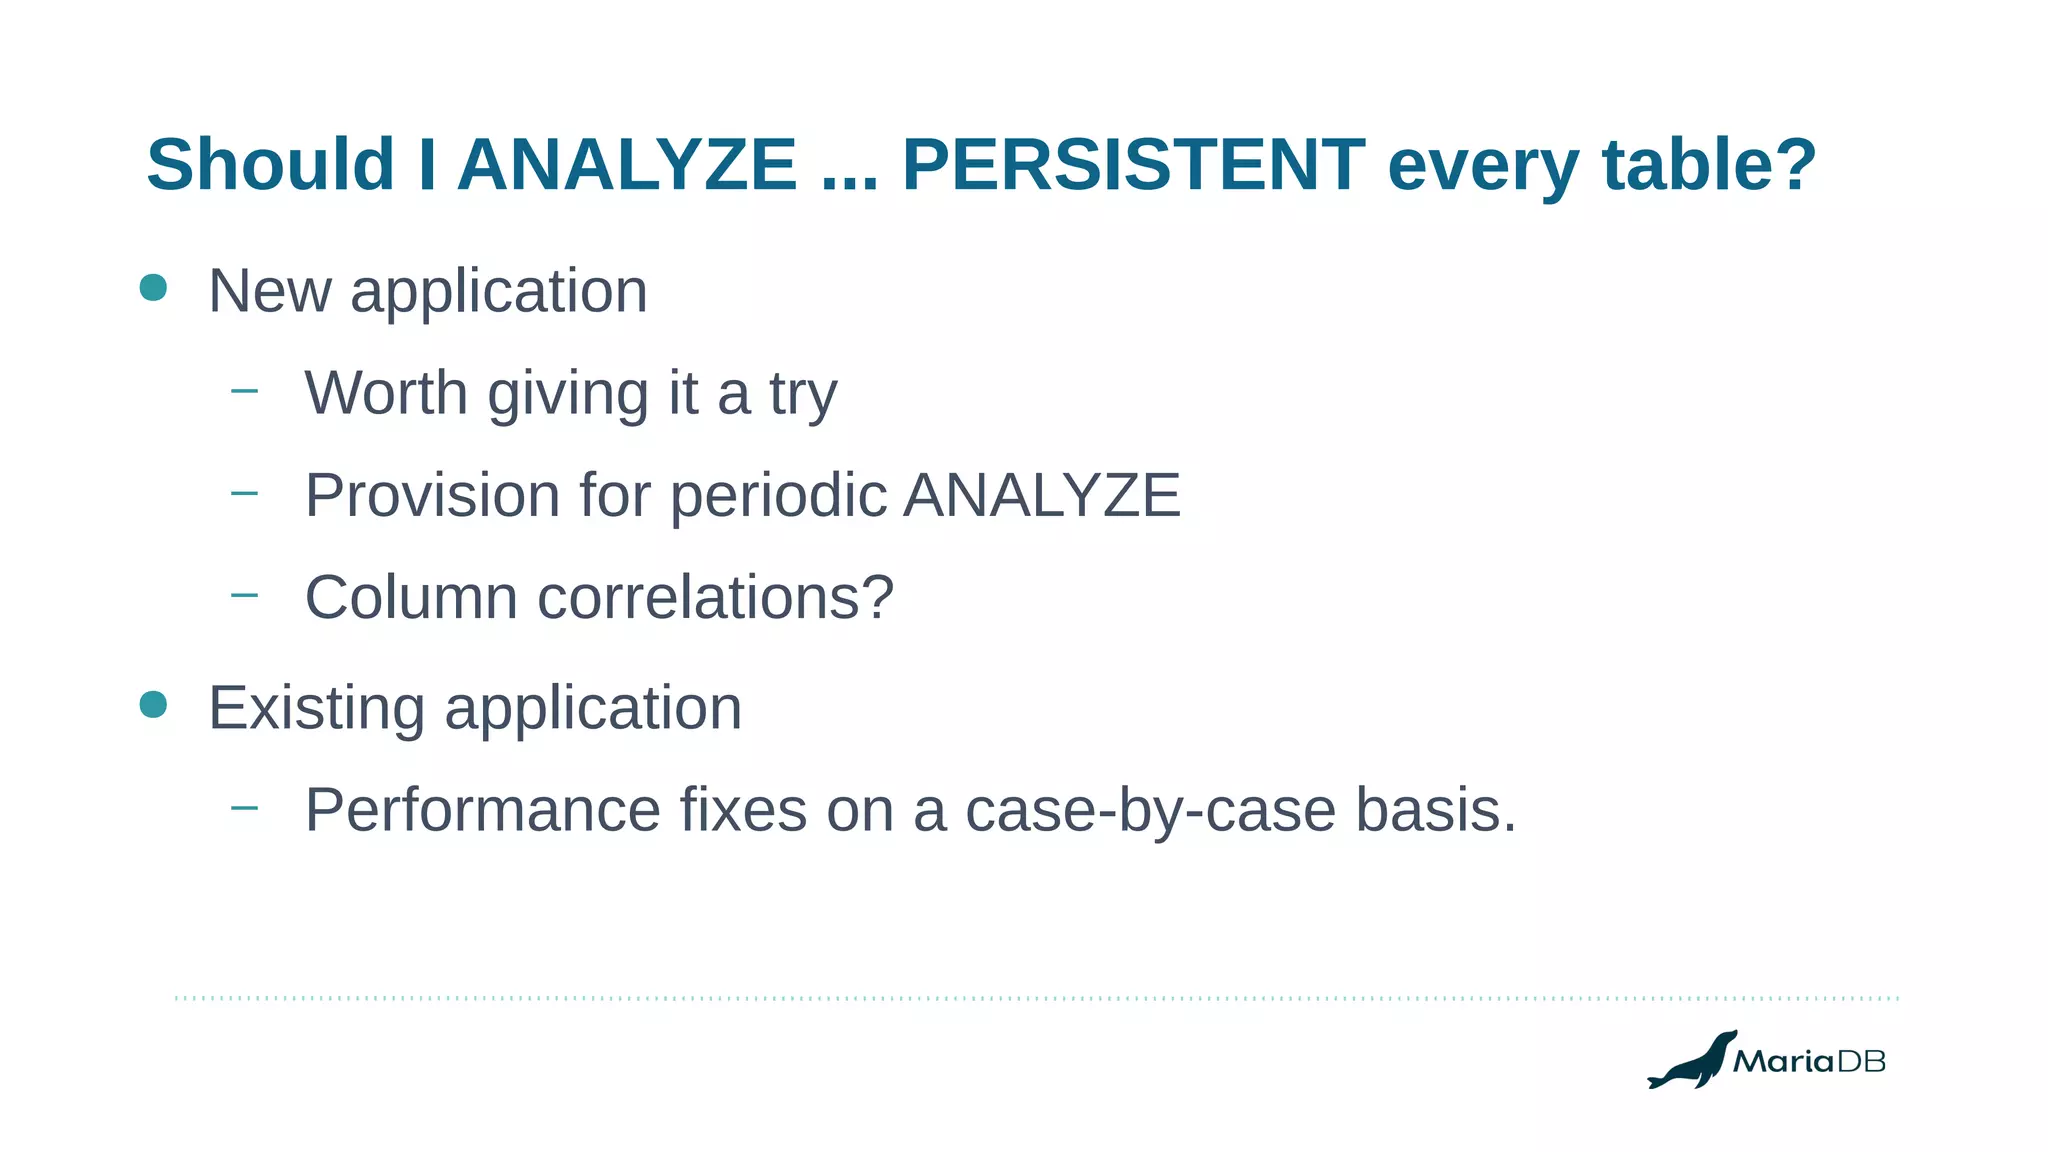

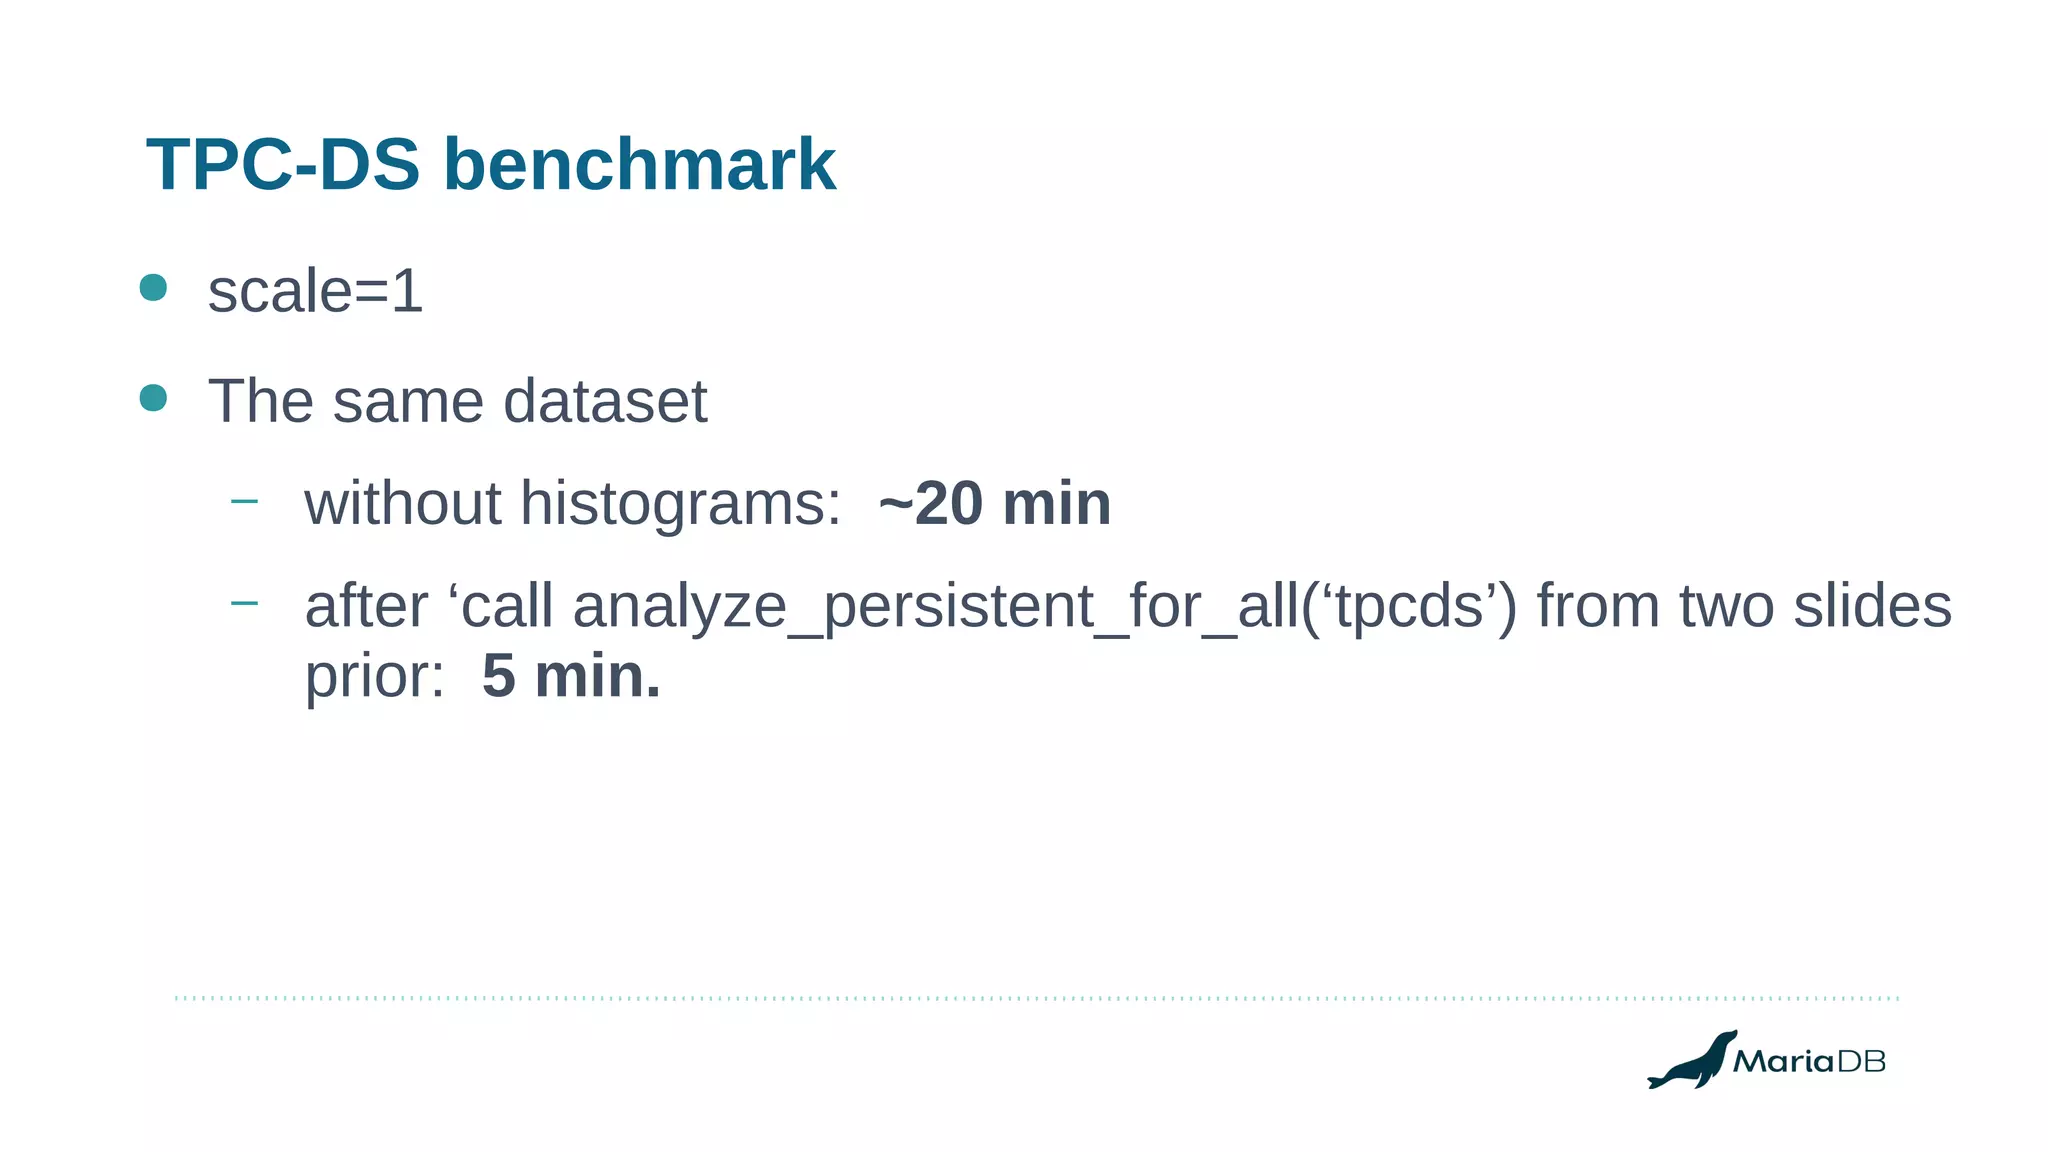
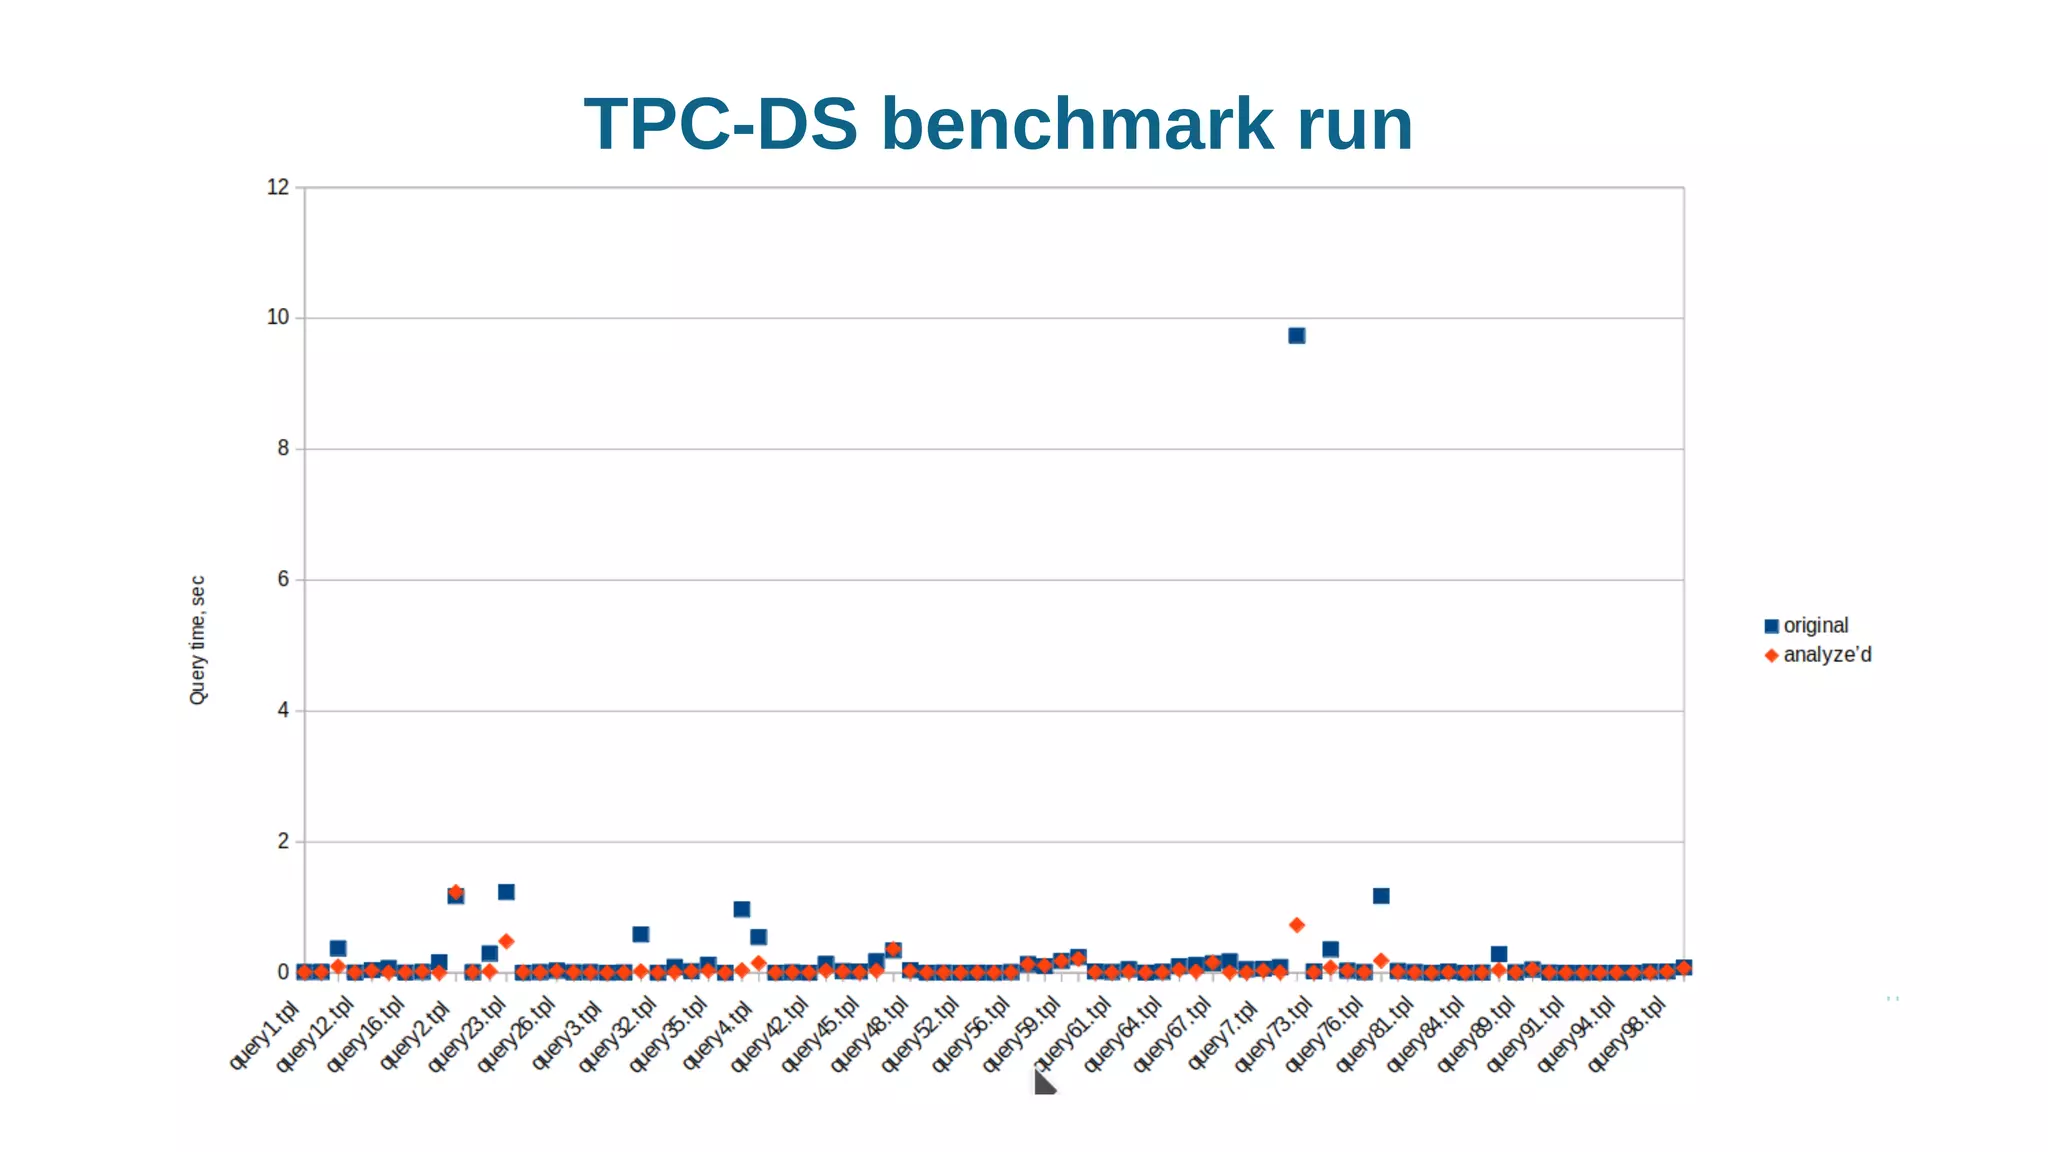
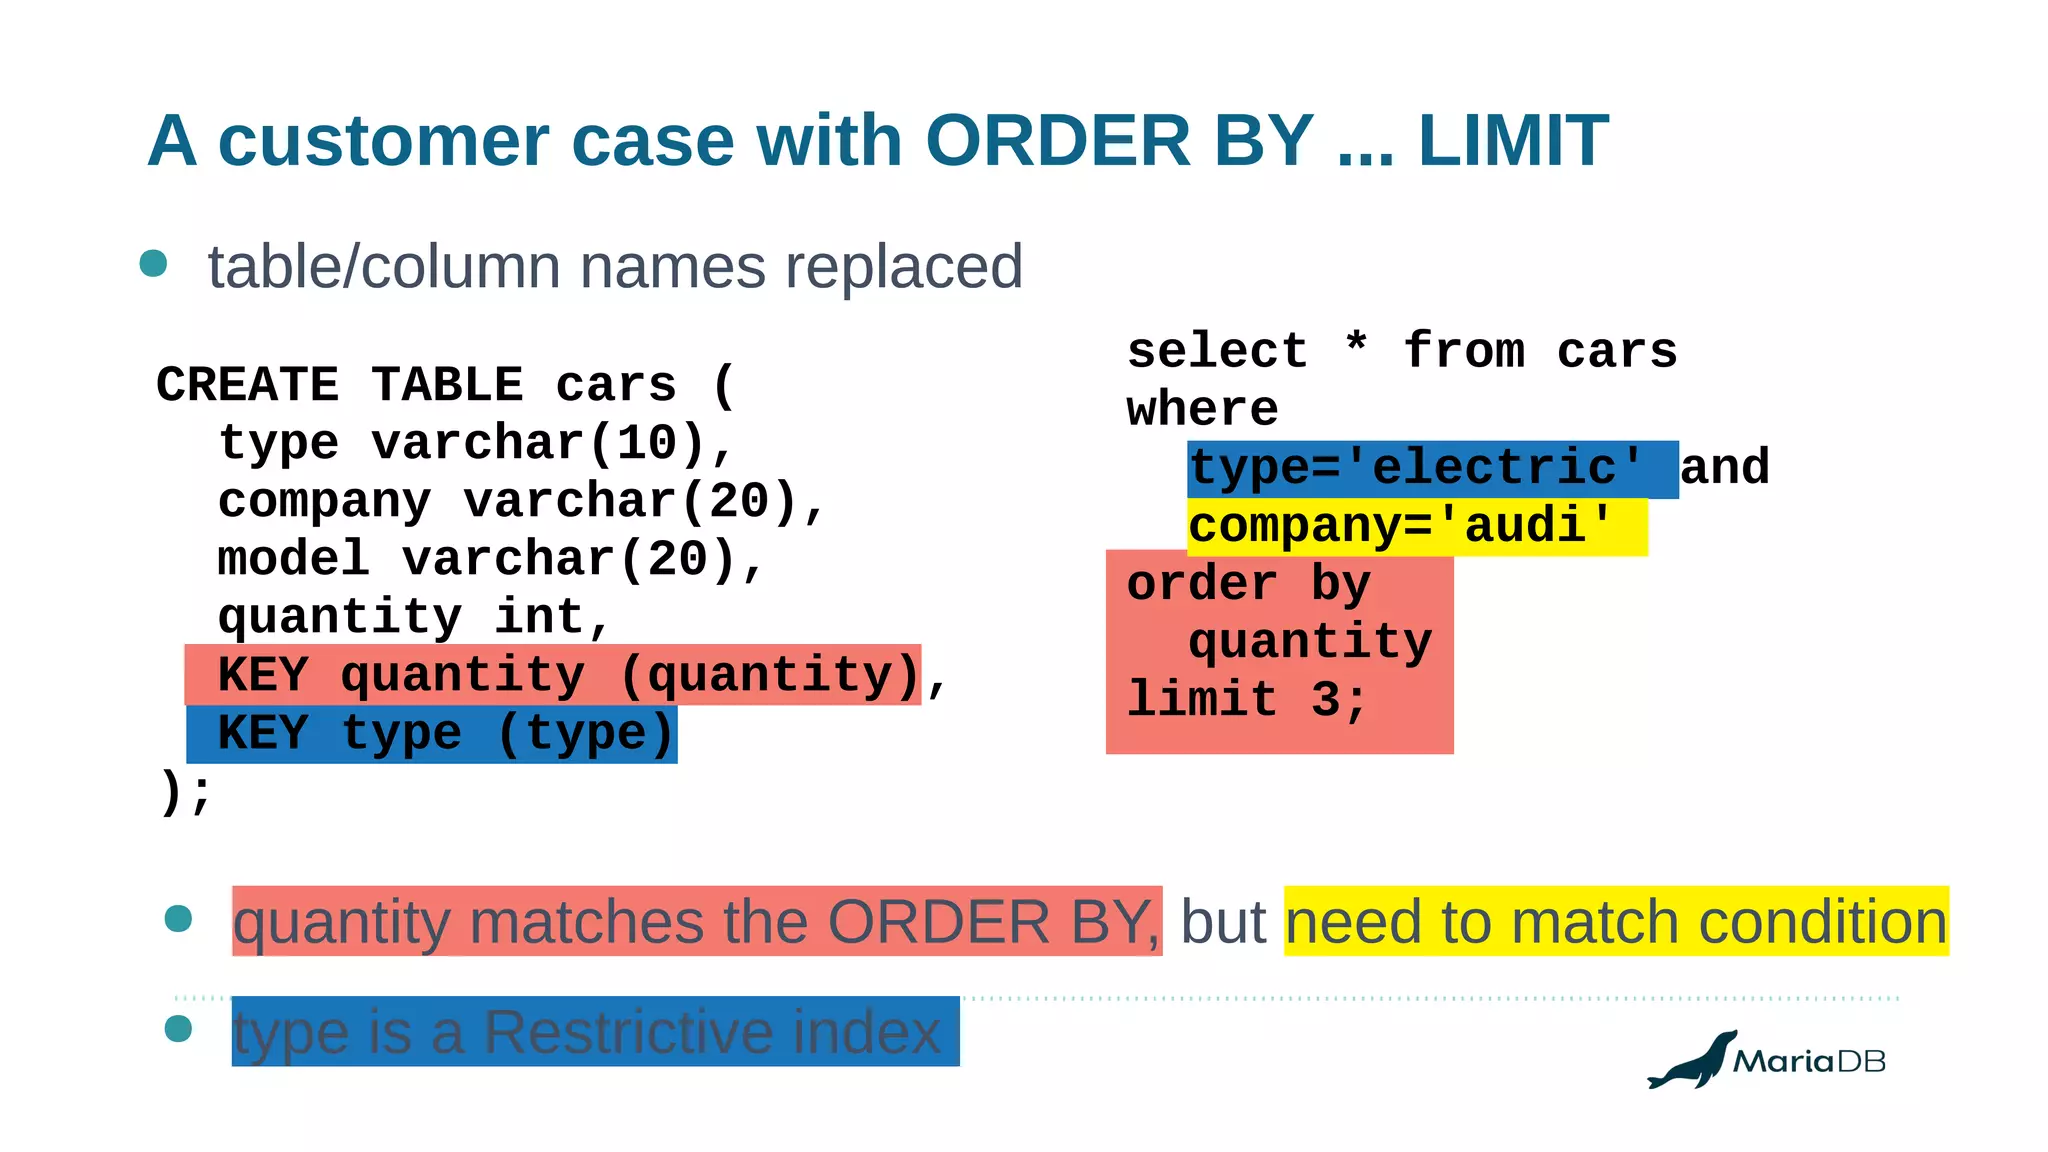
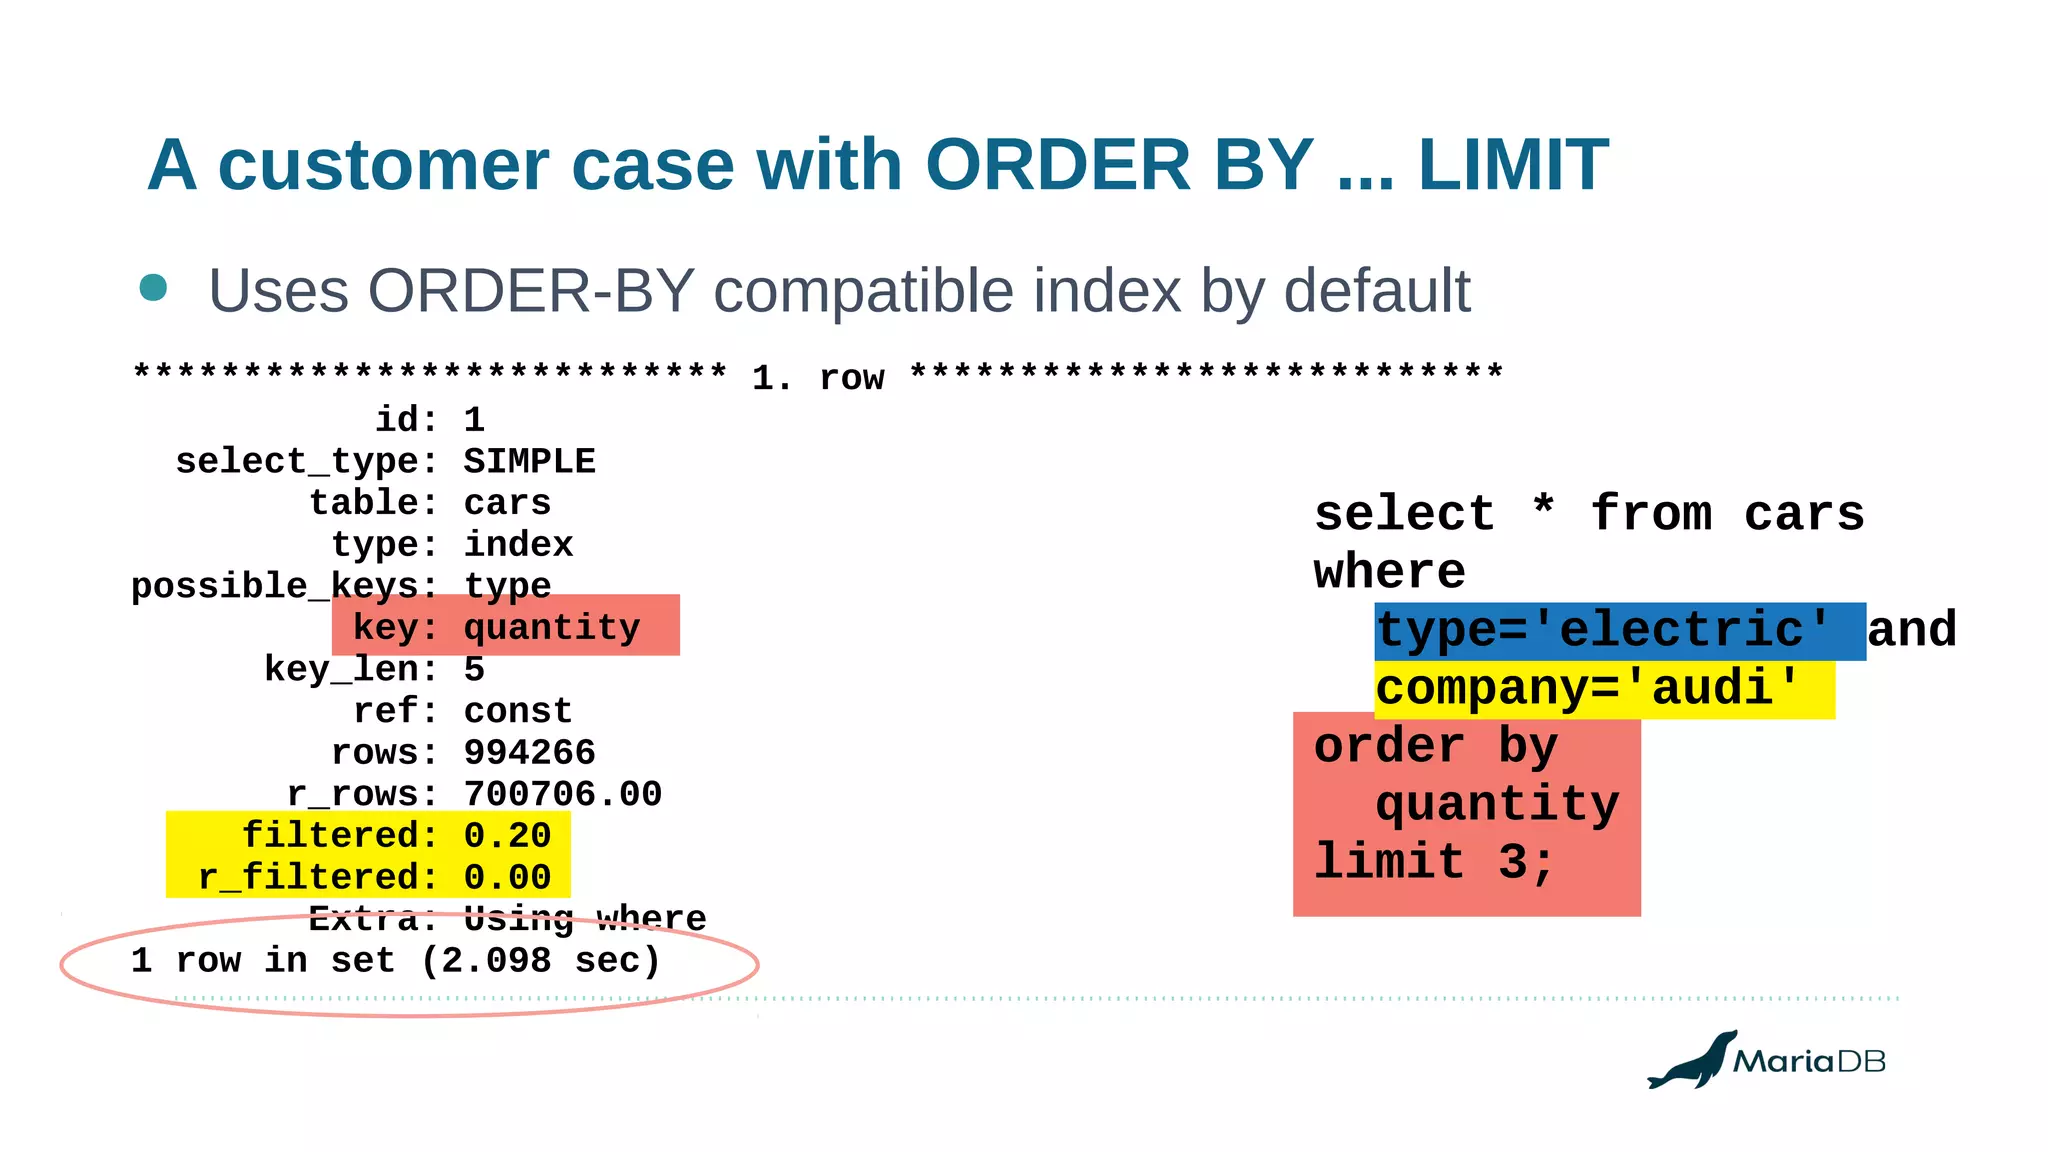
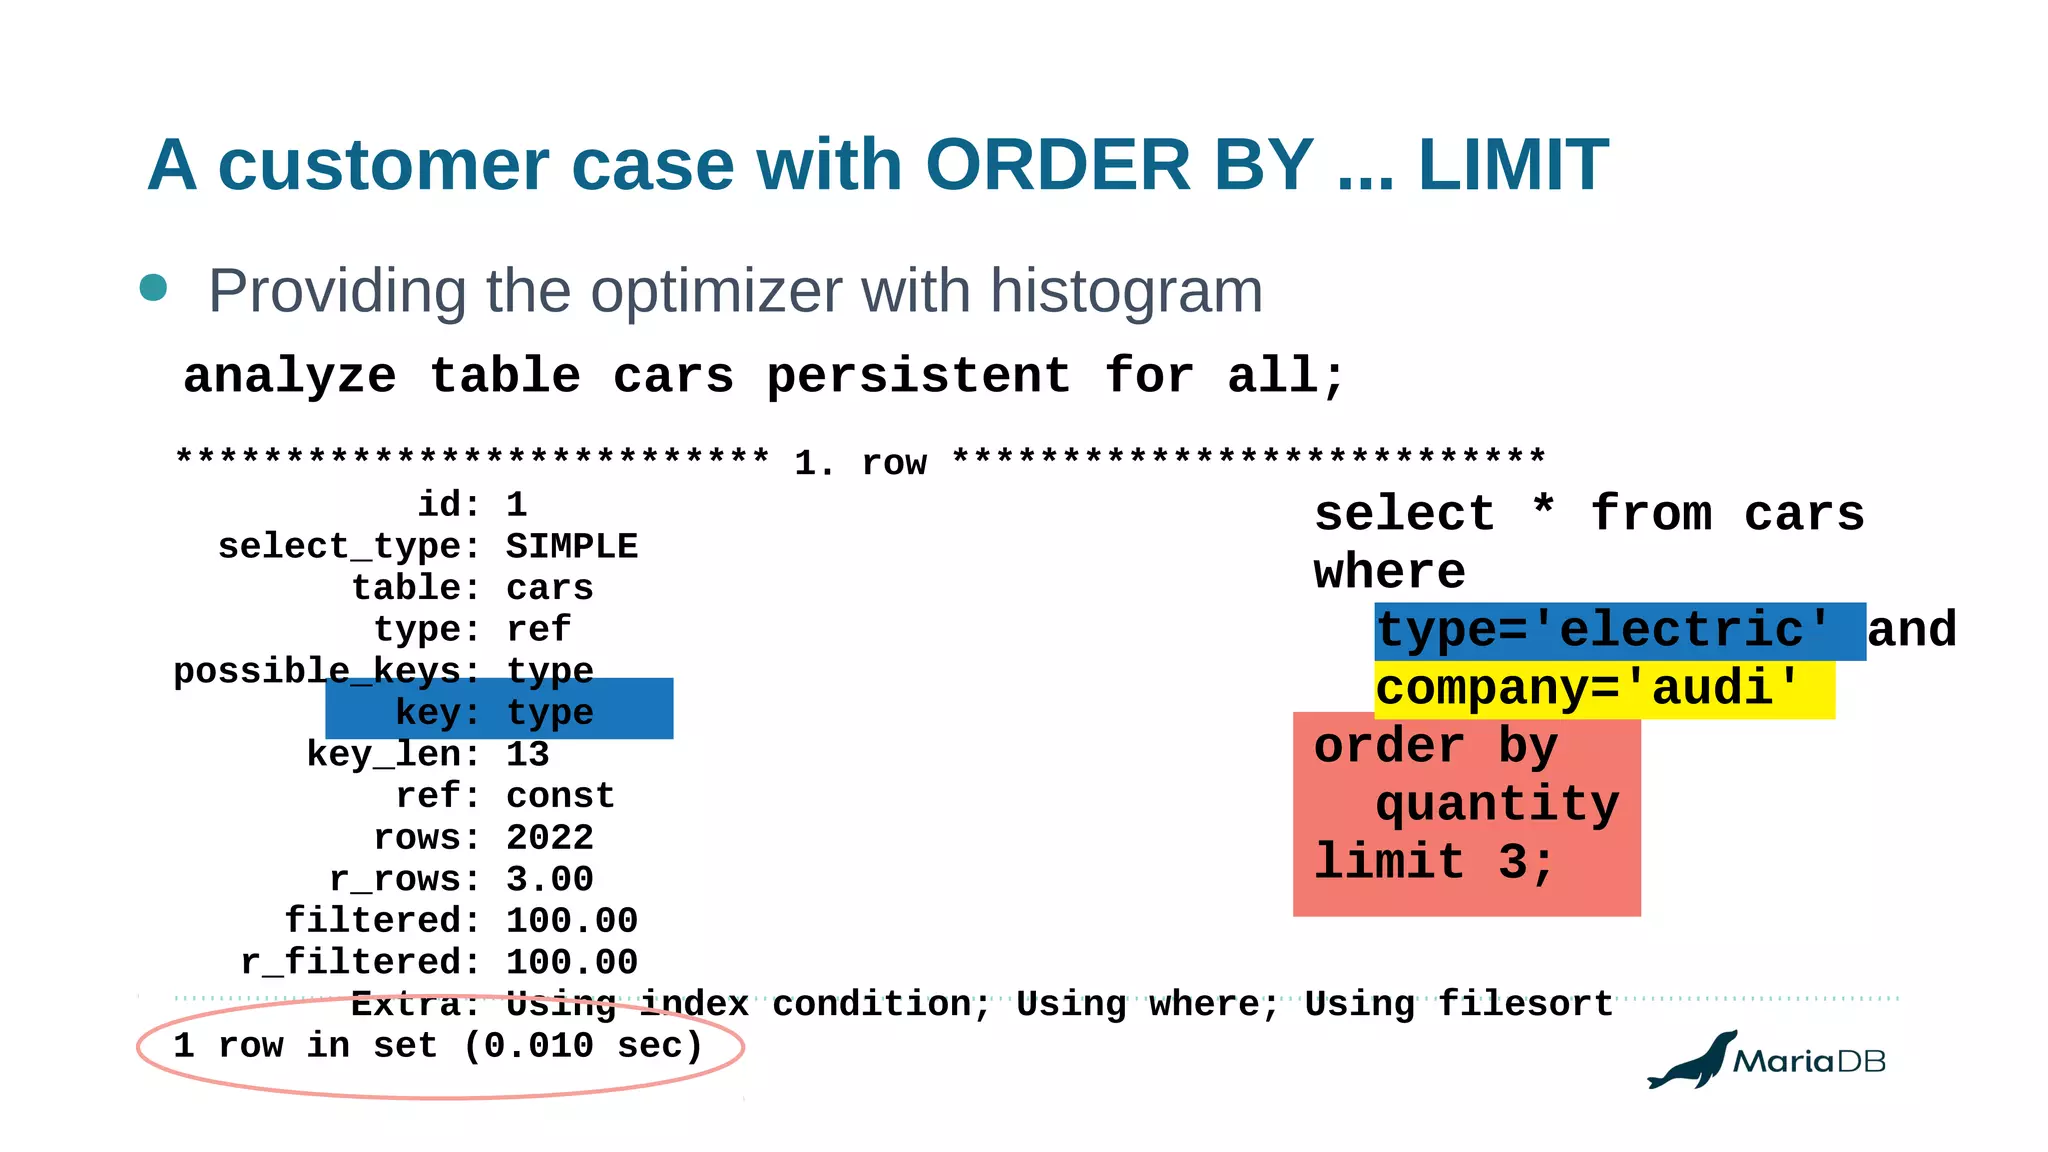


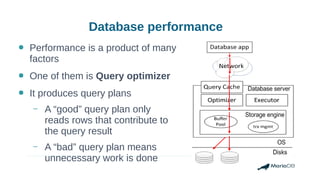
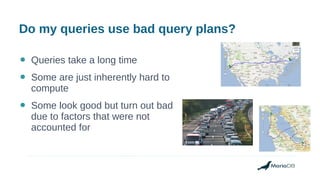
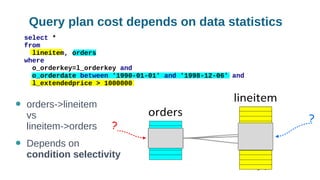
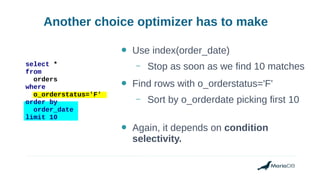
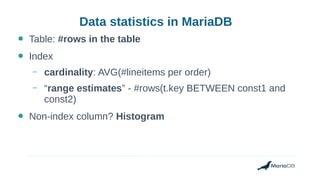
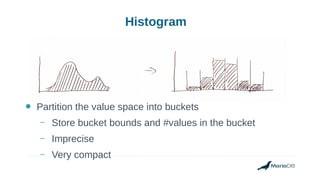
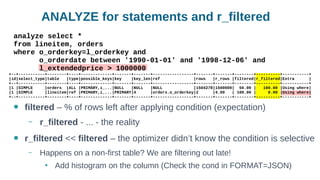
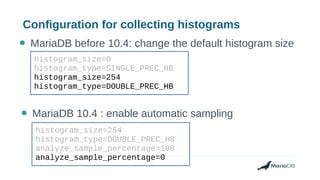
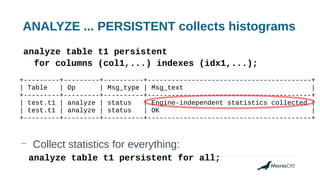
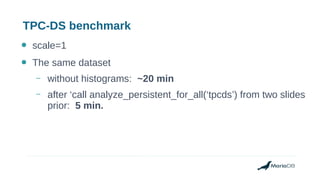
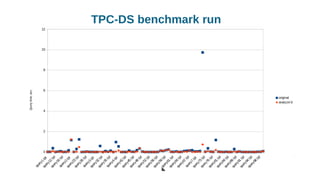
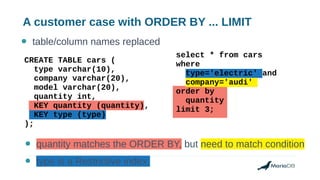
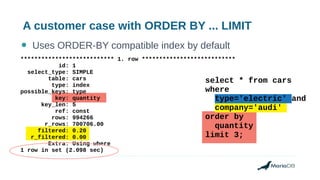
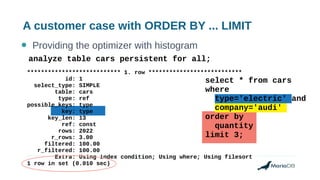
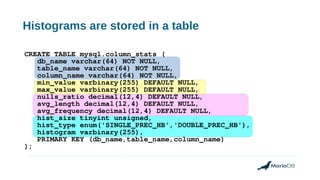
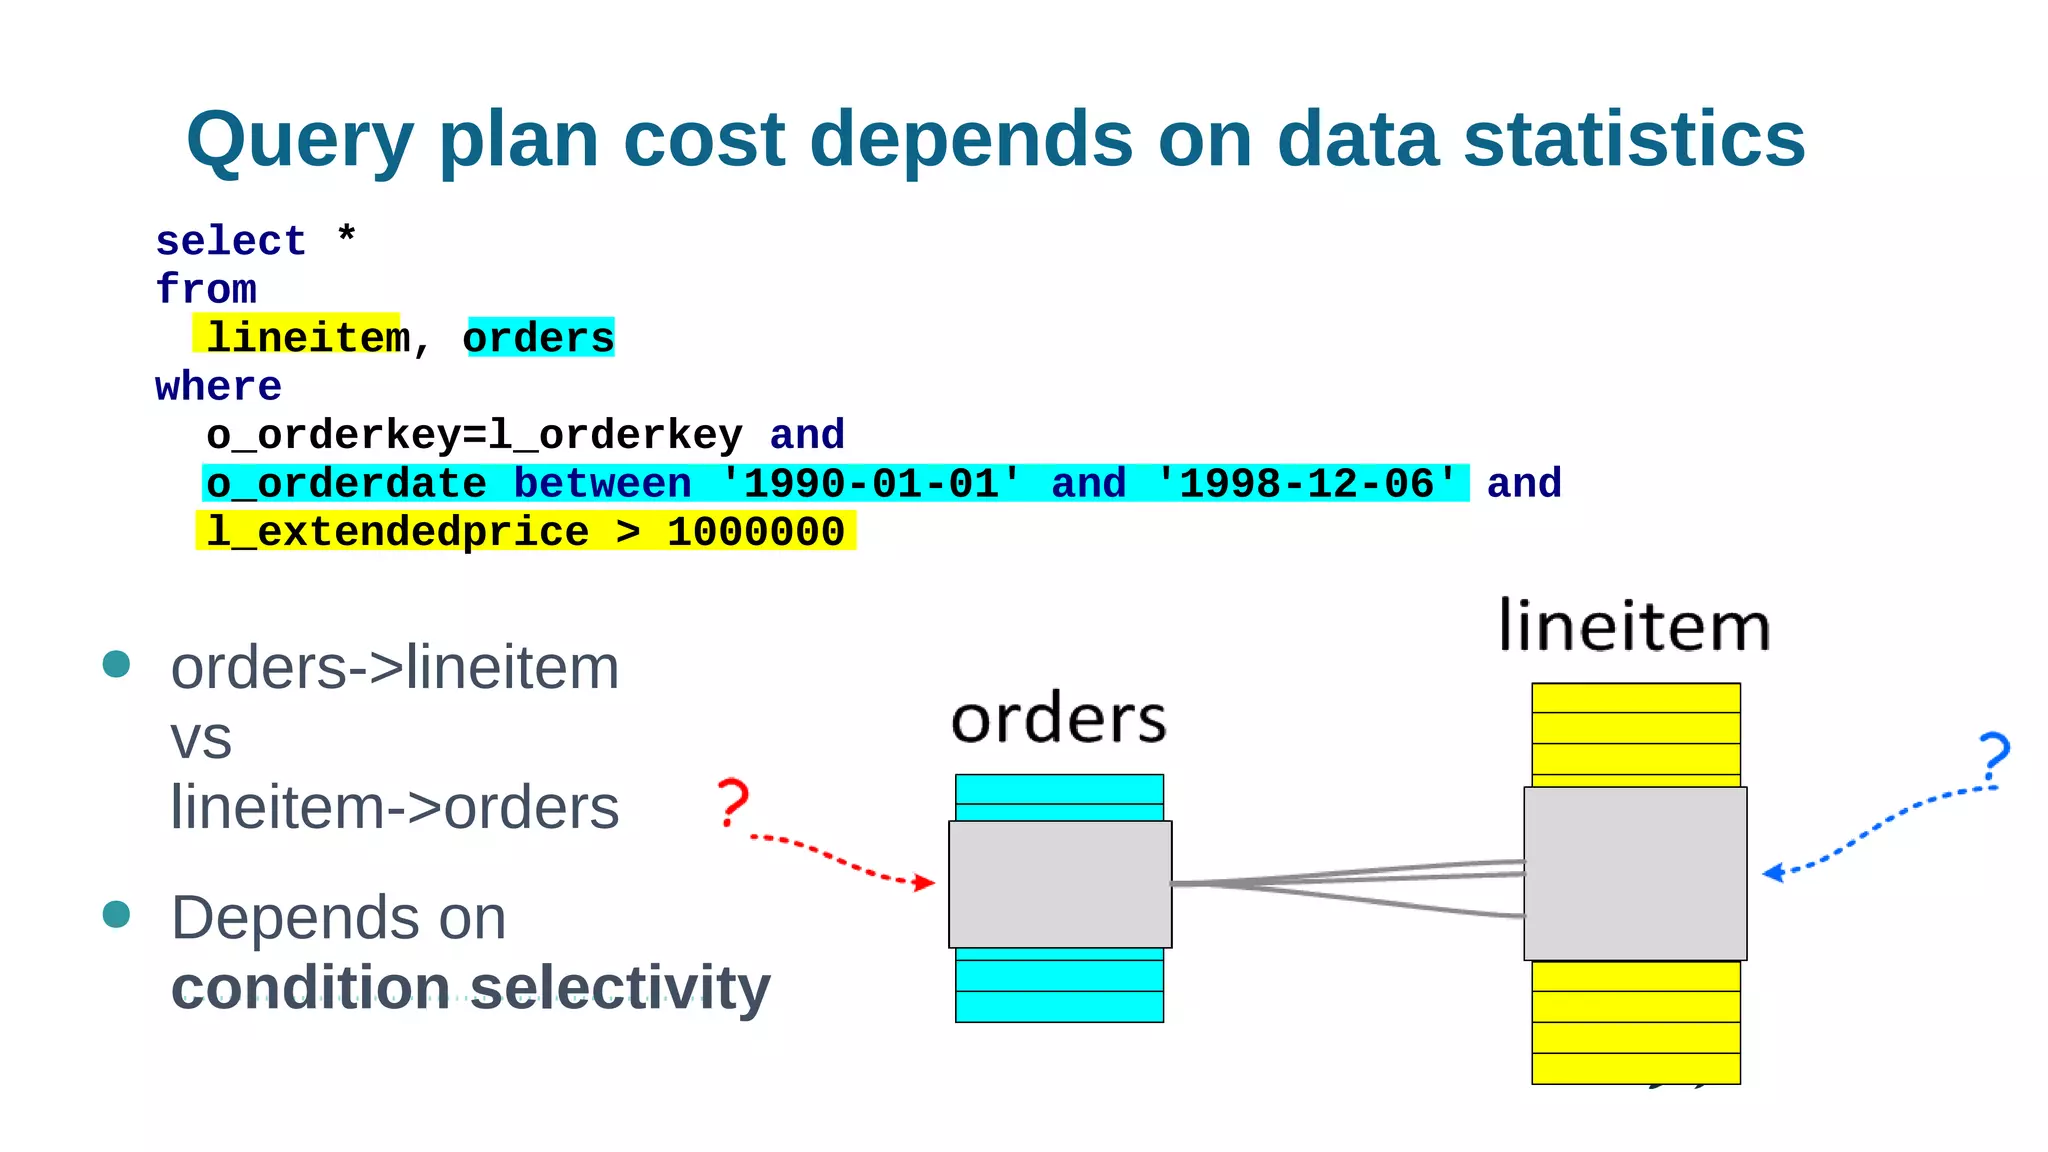
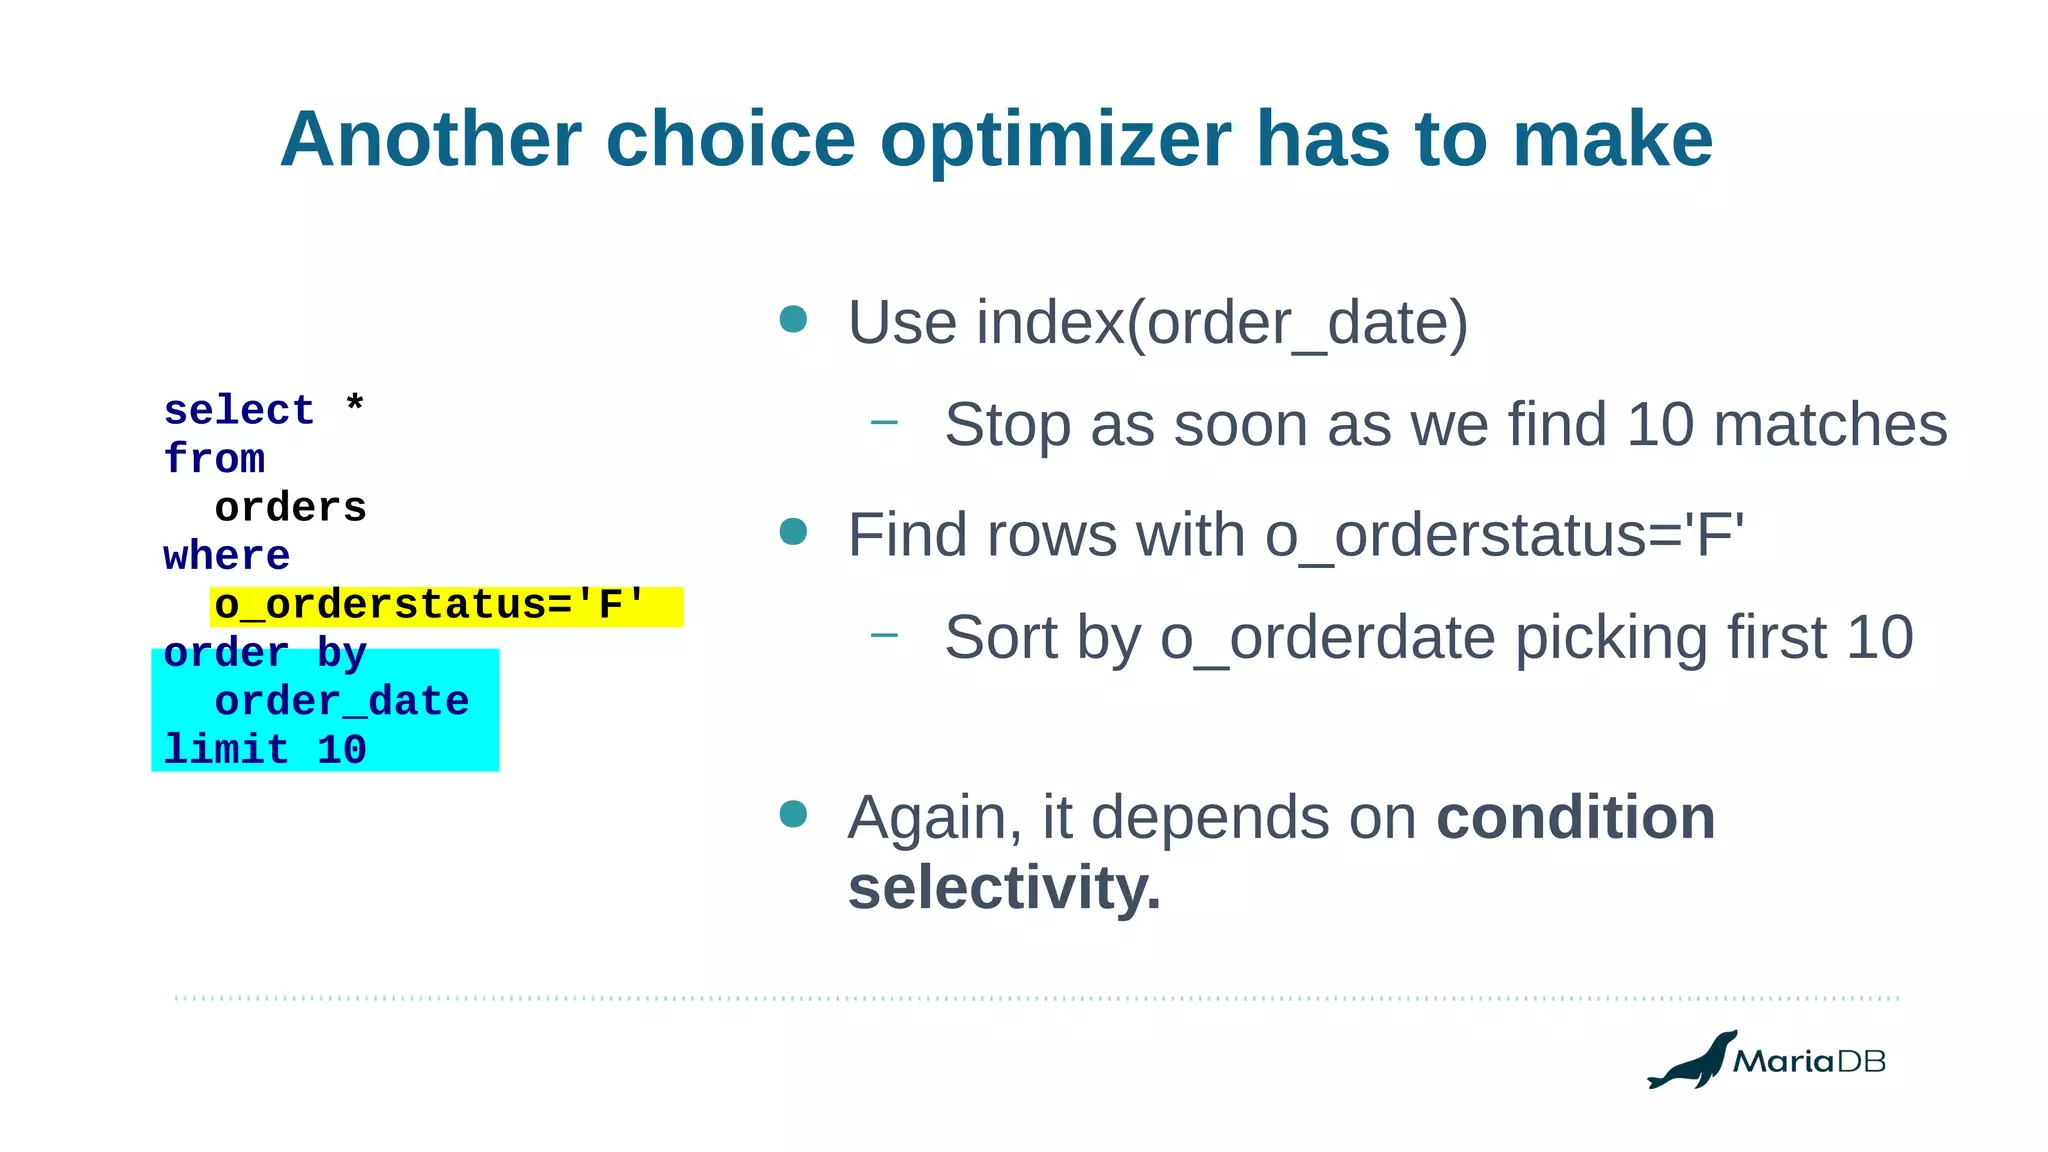
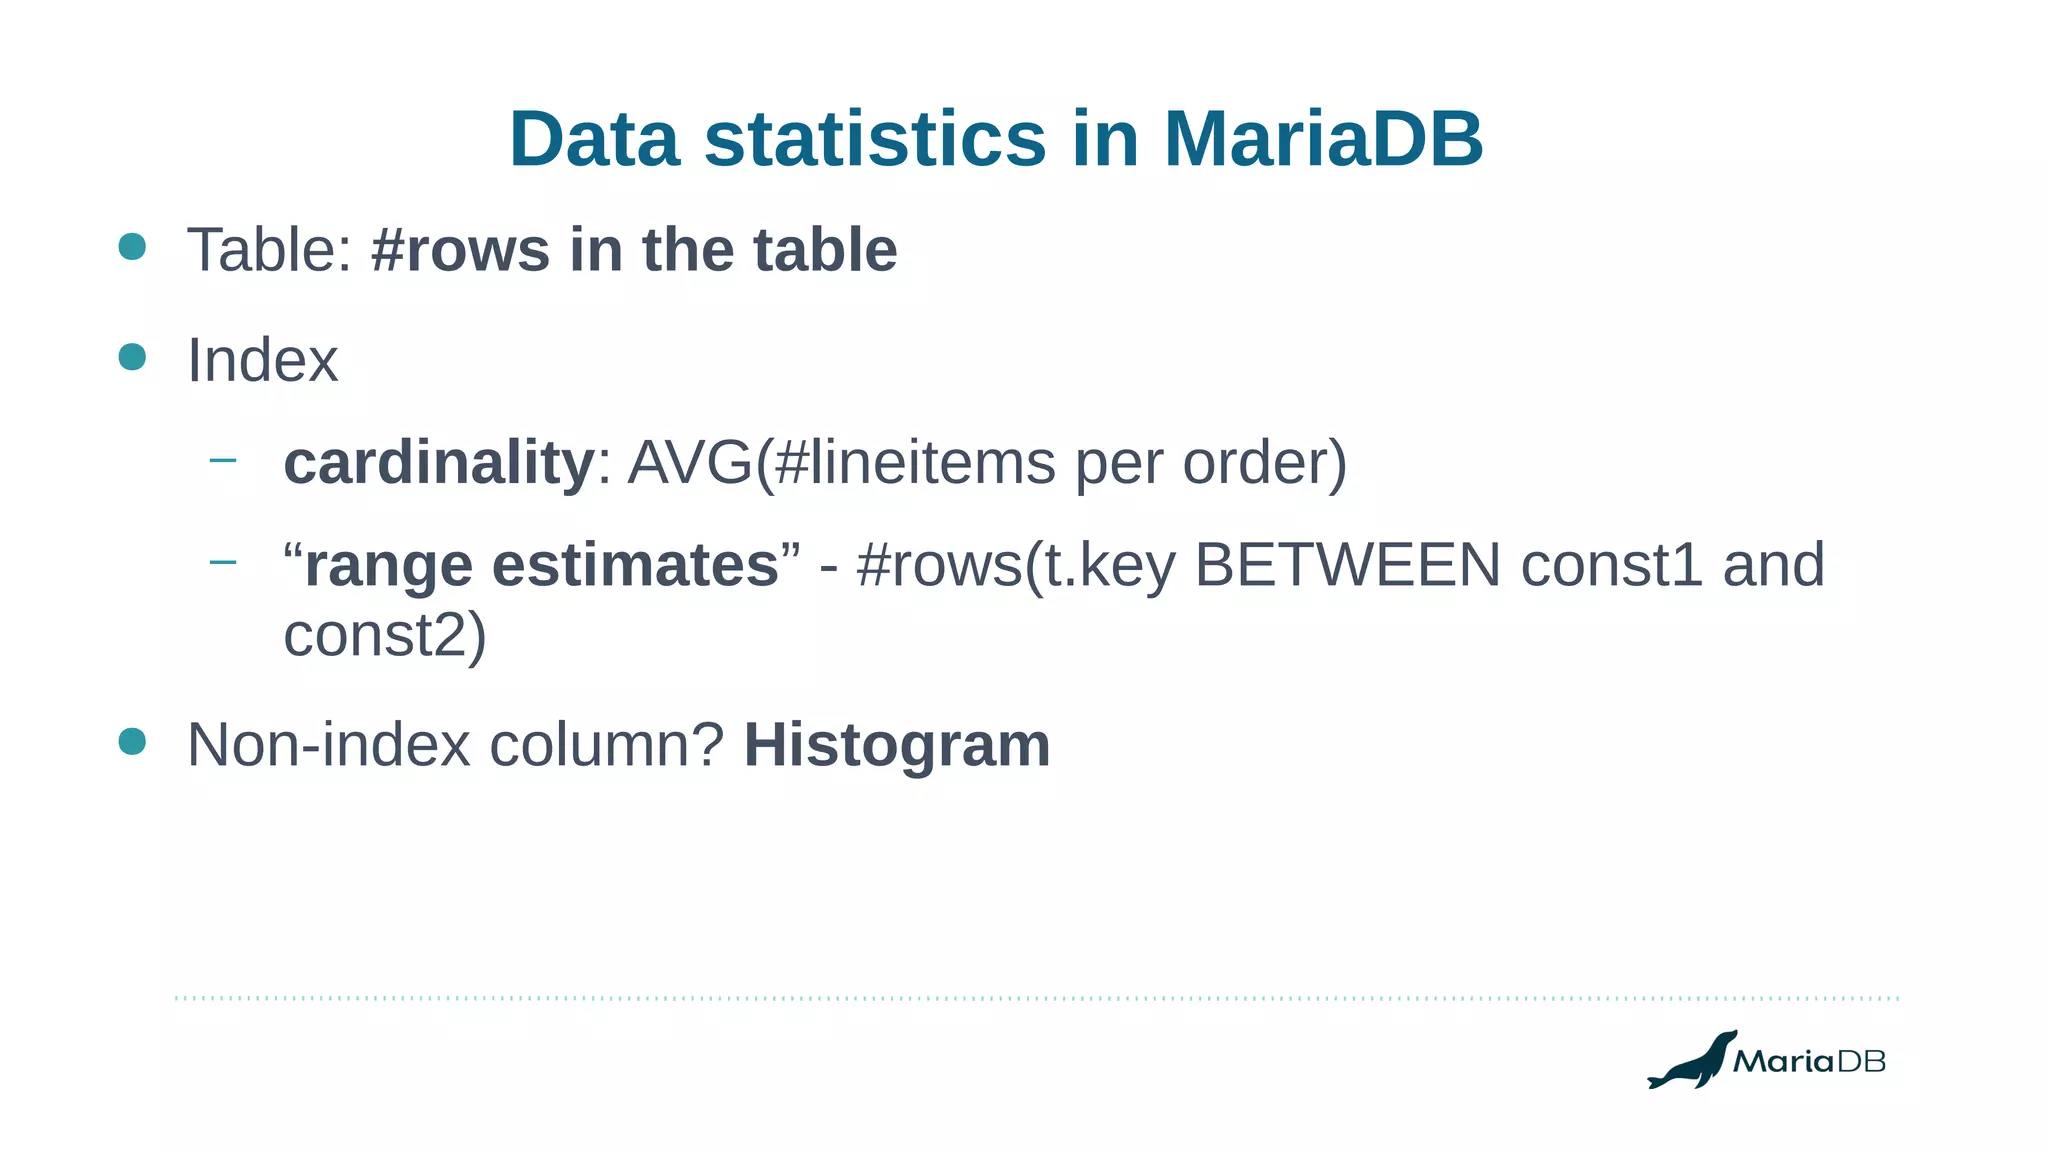
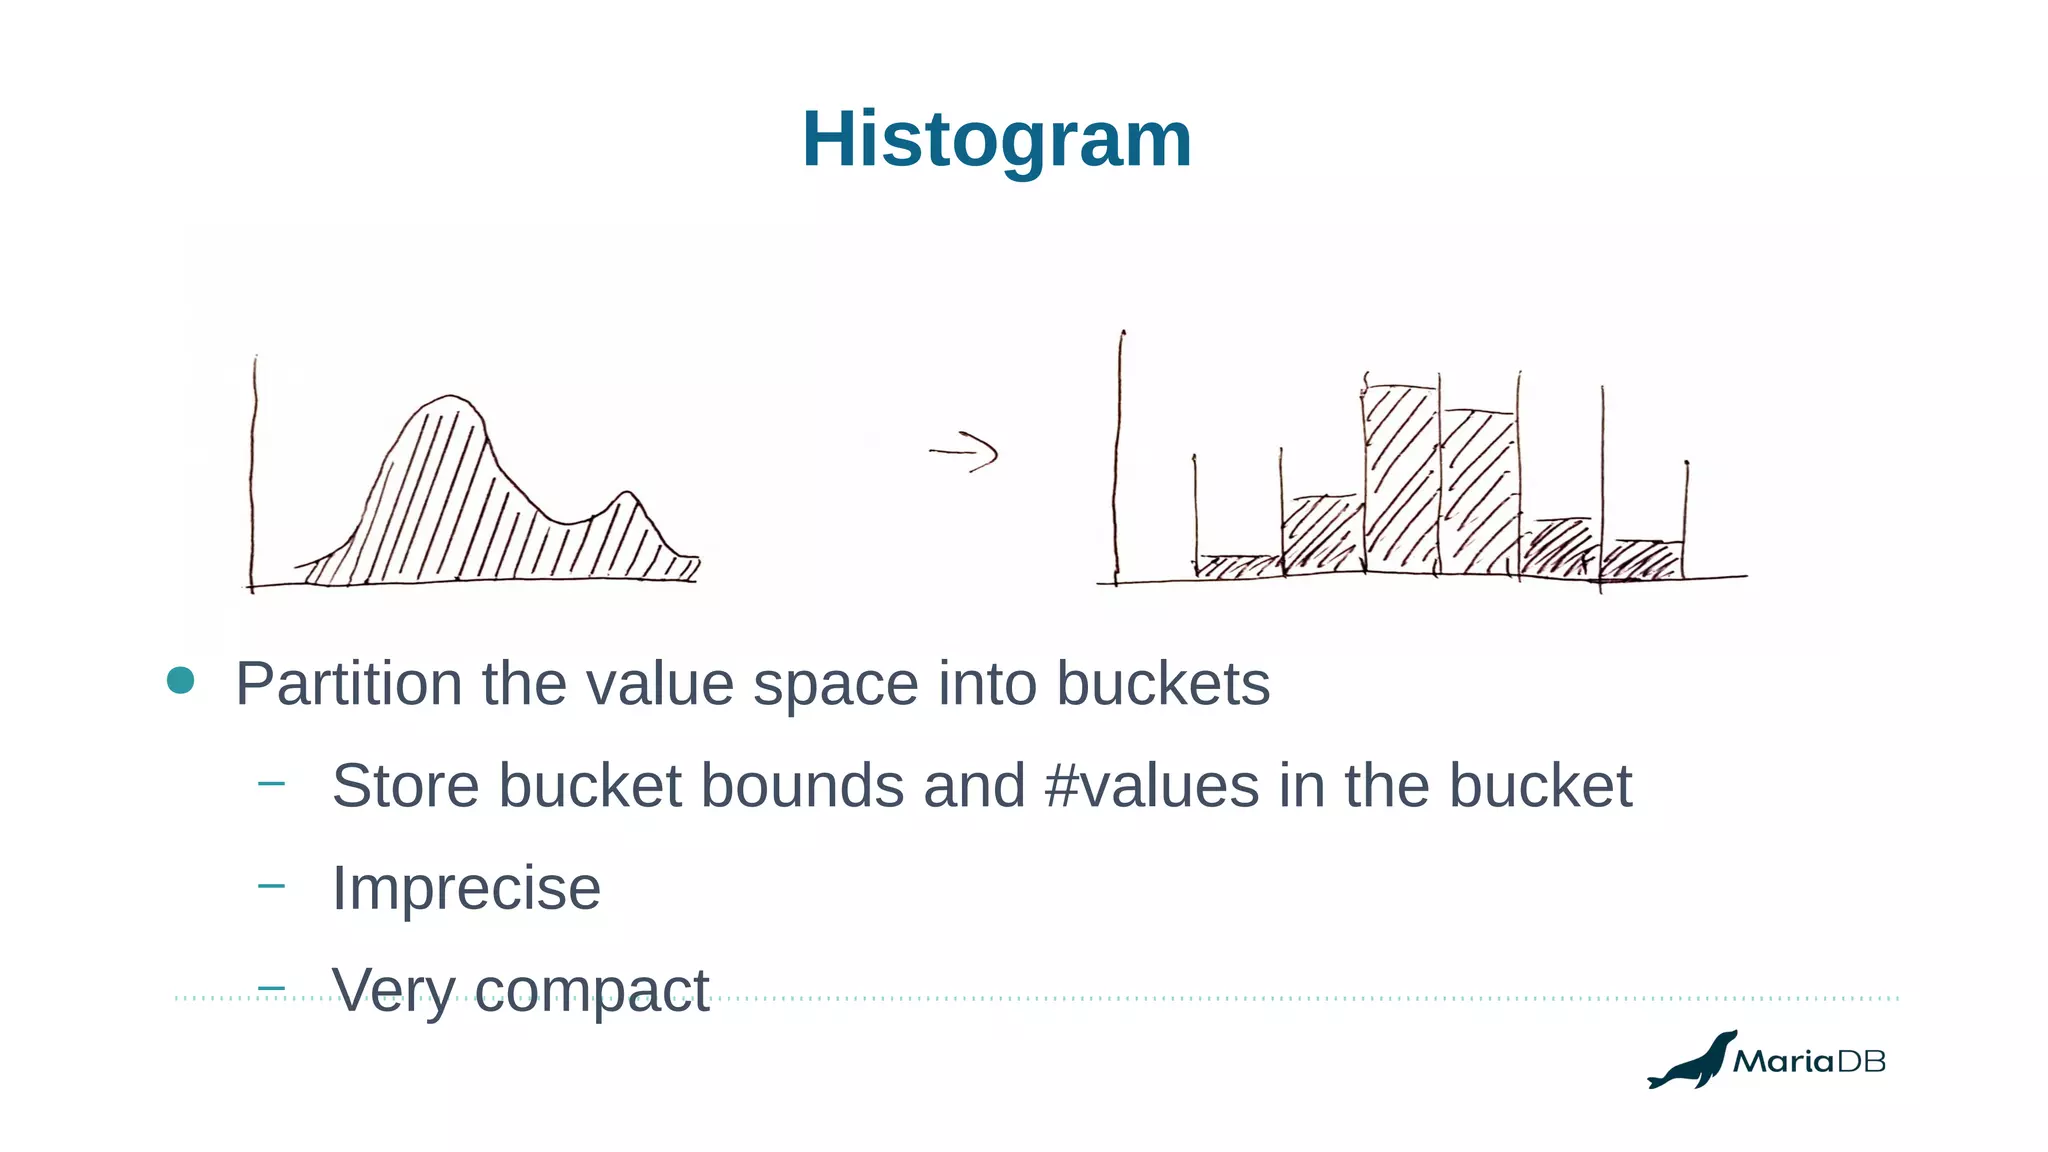
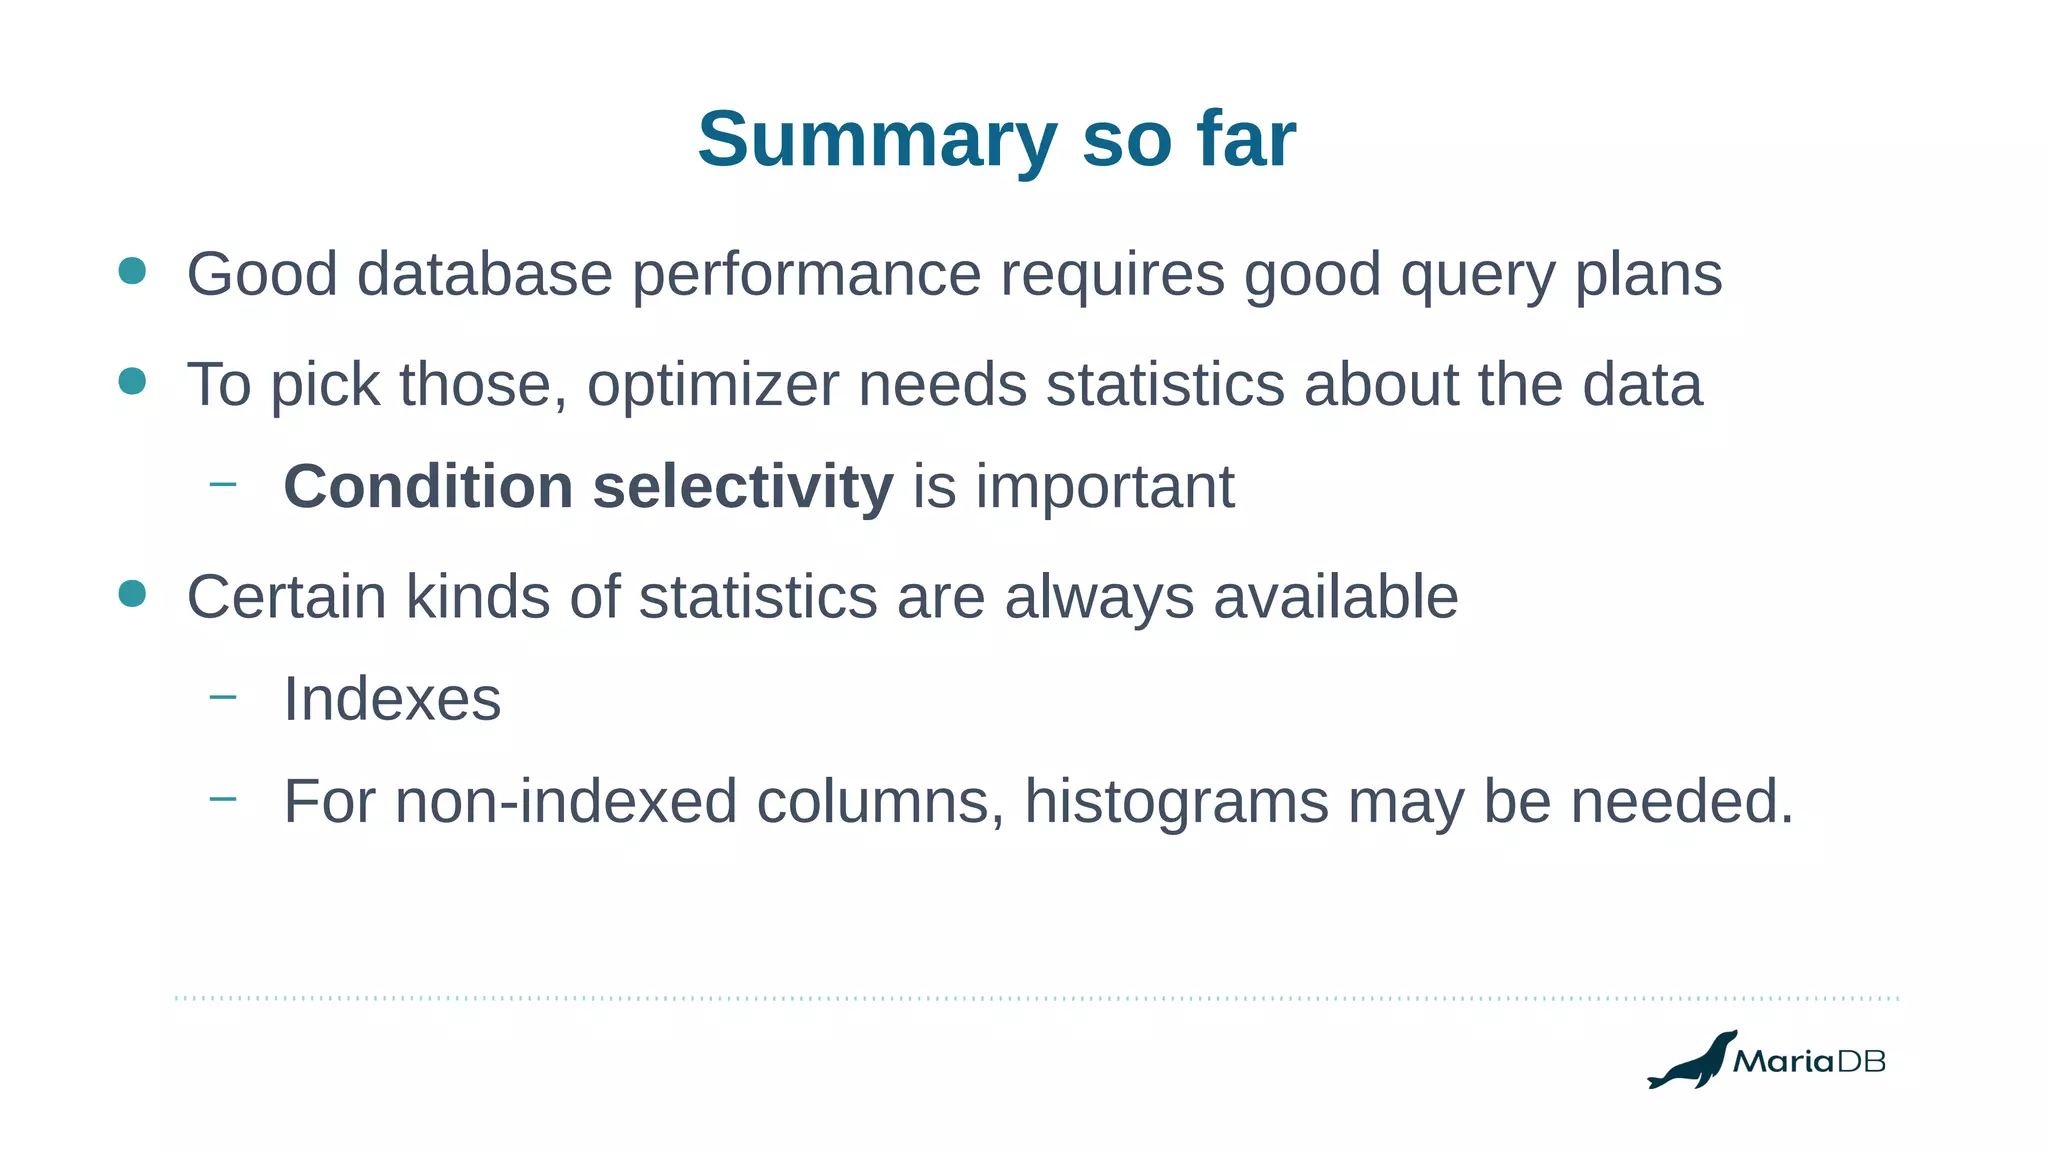
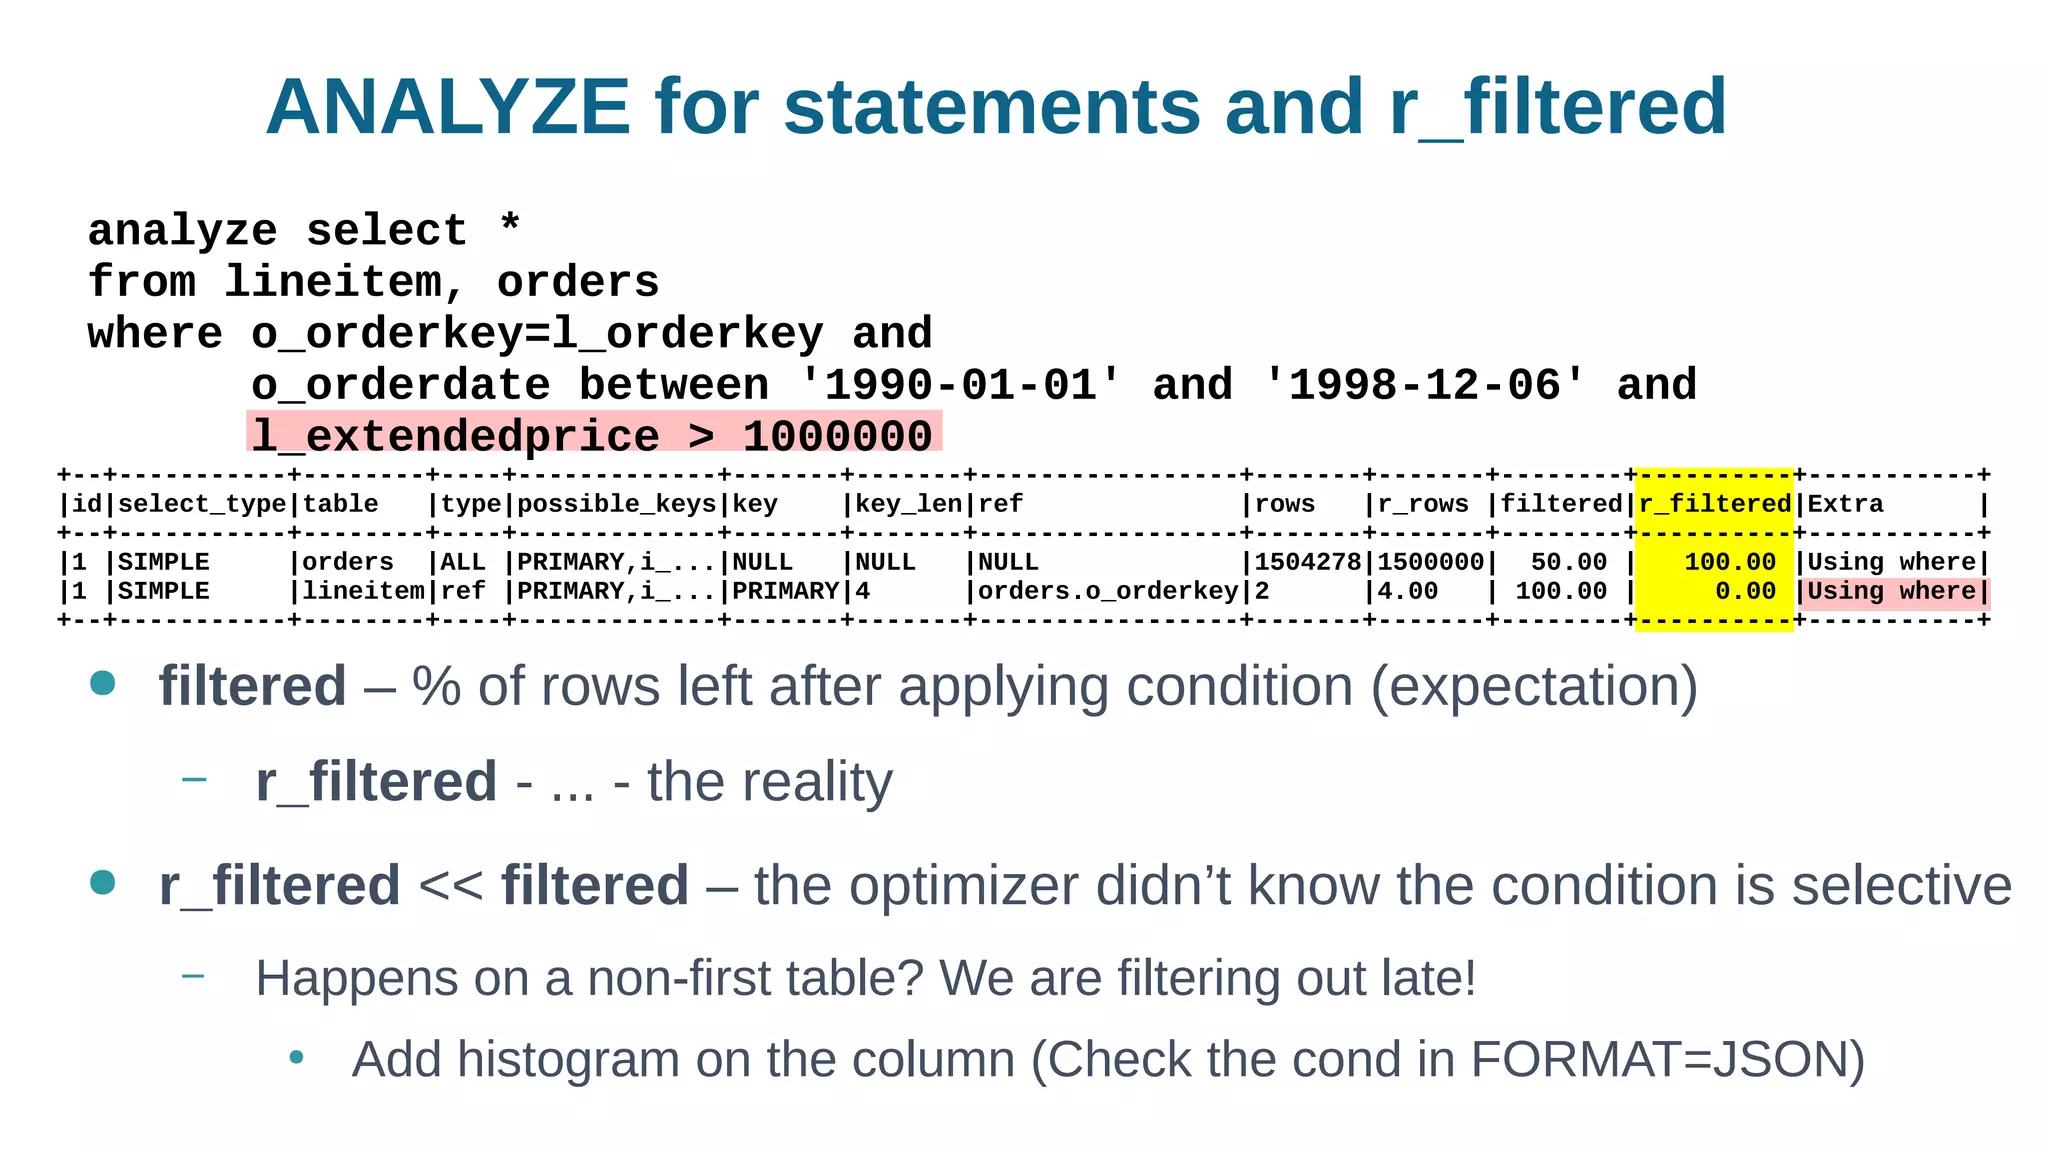
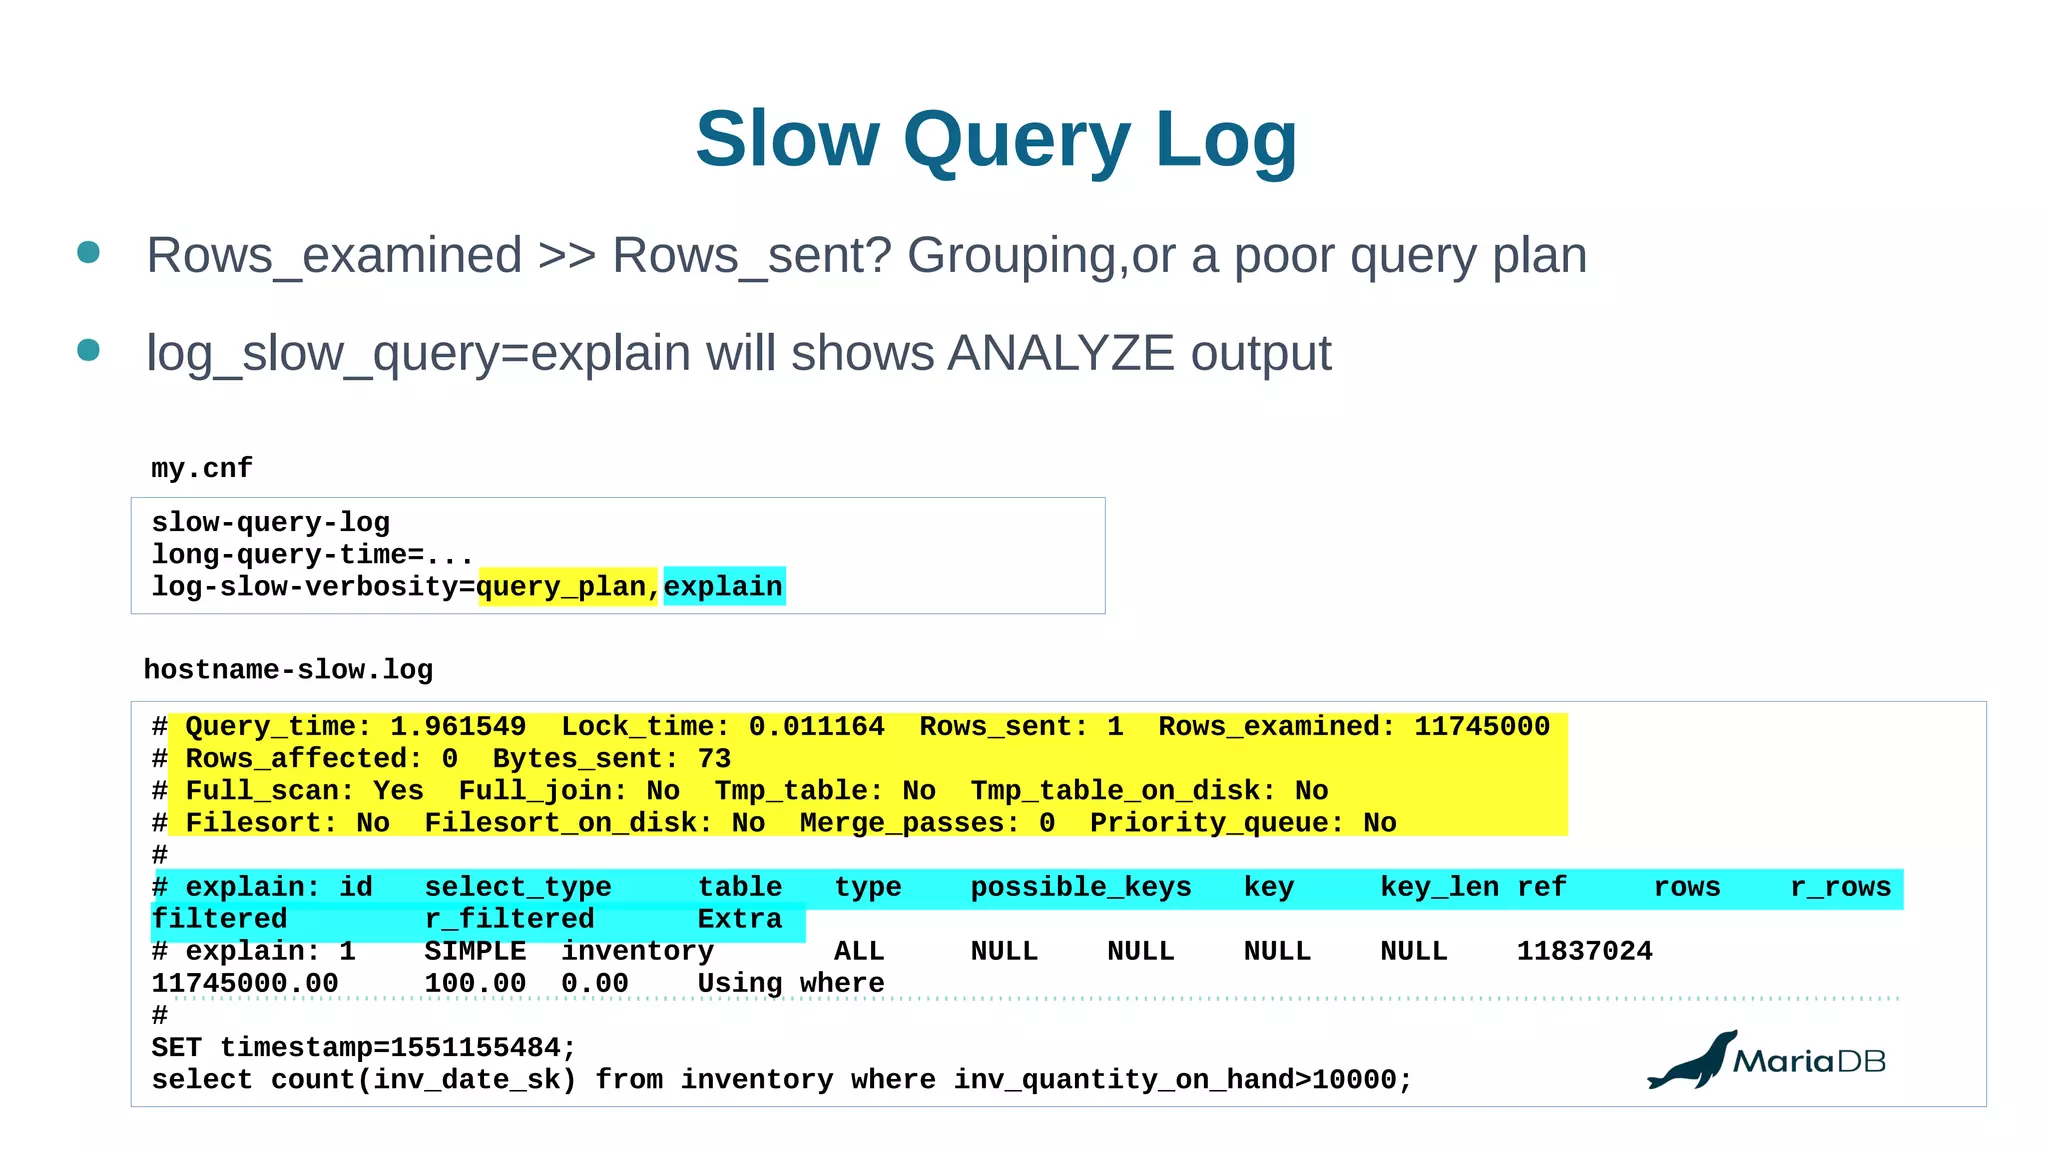
Using histograms to provide better query performance in MariaDB. Histograms capture the distribution of values in columns to help the query optimizer select better execution plans. The optimizer needs statistics on data distributions to estimate query costs accurately. Histograms are not enabled by default but can be collected using ANALYZE TABLE with the PERSISTENT option. Making histograms available improves the performance of queries that have selective filters or ordering on non-indexed columns.


