Download as PDF, PPTX


![Let’s debug some memory error
#include <iostream>
using namespace std;
void func1() {
int* vec = new int [10];
for (int i = 0; i <= 10; ++i) {
vec[i] = 1;
}
}
int main() {
func1();
return 0;
}
==11888== Invalid write of size 4
==11888== at 0x4006F0: func1() (main1.cxx:8)
==11888== by 0x40070F: main (main1.cxx:13)
==11888== Address 0x4c36068 is 0 bytes after a block of size 40 alloc'd
==11888== at 0x4A0674C: operator new[](unsigned long)
(vg_replace_malloc.c:305)
==11888== by 0x4006D5: func1() (main1.cxx:6)
==11888== by 0x40070F: main (main1.cxx:13)
==11888==
==11888==
==11888== HEAP SUMMARY:
==11888== in use at exit: 40 bytes in 1 blocks
==11888== total heap usage: 1 allocs, 0 frees, 40 bytes allocated
==11888==
==11888== 40 bytes in 1 blocks are definitely lost in loss record 1 of 1
==11888== at 0x4A0674C: operator new[](unsigned long)
(vg_replace_malloc.c:305)
==11888== by 0x4006D5: func1() (main1.cxx:6)
==11888== by 0x40070F: main (main1.cxx:13)
==11888==
==11888== LEAK SUMMARY:
==11888== definitely lost: 40 bytes in 1 blocks
==11888== indirectly lost: 0 bytes in 0 blocks
==11888== possibly lost: 0 bytes in 0 blocks
==11888== still reachable: 0 bytes in 0 blocks
==11888== suppressed: 0 bytes in 0 blocks
==11888==
==11888== For counts of detected and suppressed errors, rerun with: -v
==11888== ERROR SUMMARY: 2 errors from 2 contexts (suppressed: 6 from 6)](https://image.slidesharecdn.com/valgrindtutorial-151108172727-lva1-app6892/85/Valgrind-tutorial-5-320.jpg)
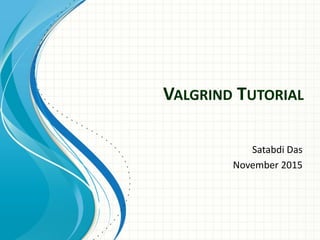
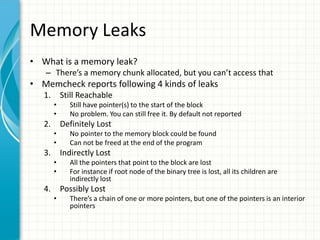
![Understanding the output of
Memcheck
• ==29403== Invalid write of size 4
– Process id : 29403
– Type of error : “Invalid write”
– Below it, the stack trace.
• ==11888== 40 bytes in 1 blocks are definitely
lost in loss record 1 of 1
– Memory leak followed by the stack trace
• Note: Valgrind doesn’t detect static buffer
overflow
int vec2[10];
vec2[10] = 4;
vec2[11] = 5;](https://image.slidesharecdn.com/valgrindtutorial-151108172727-lva1-app6892/85/Valgrind-tutorial-6-320.jpg)
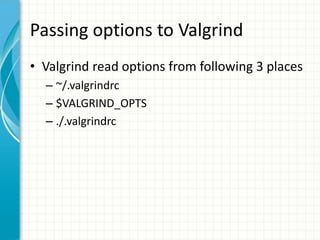
![Memory Error
• Different types of errors
– Illegal read / Illegal write error
• This happens when your program reads or writes
memory at a place which Memcheck reckons it
shouldn't
void func1() {
int* vec = new int [11];
for (int i = 0; i <= 10; ++i) {
vec[i] = 1;
}
delete vec;
vec[10] = 4;
}](https://image.slidesharecdn.com/valgrindtutorial-151108172727-lva1-app6892/85/Valgrind-tutorial-8-320.jpg)
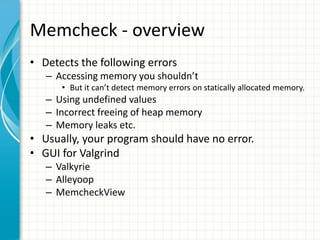
![Memory Error (Contd.)
• Different types of errors
– Use of Uninitialized values
• when your program uses a value which hasn't been initialised --
in other words, is undefined
• Sources of uninitialized value
– Local variables in procedures which have not been initialised
– The contents of heap blocks before you write something
there
void func1() {
int* vec = new int [11];
if (vec[0] == 4) {
cout << "Initialized" << endl;
} else {
cout << "Not initialized" << endl;
}
}](https://image.slidesharecdn.com/valgrindtutorial-151108172727-lva1-app6892/85/Valgrind-tutorial-9-320.jpg)
![Memory Error (Contd.)
• Different types of errors
– Use of uninitialized values in system calls
int main( void ) {
char* arr = malloc(10);
int* arr2 = malloc(sizeof(int));
write( 1 /* stdout */, arr, 10 );
exit(arr2[0]);
}
1. Syscall param write(buf) points to uninitialised byte(s)
2. Syscall param exit(error_code) contains uninitialised byte(s)](https://image.slidesharecdn.com/valgrindtutorial-151108172727-lva1-app6892/85/Valgrind-tutorial-10-320.jpg)
![Memory Error (Contd.)
• Different types of errors
– Illegal Free
• Program freeing memory block twice
– Heap block freed with inappropriate deallocation
function
• If allocated with malloc, calloc, realloc, valloc or memalign,
you must deallocate with free.
• If allocated with new, you must deallocate with delete.
• If allocated with new[], you must deallocate with delete[].
– Overlapping source and destination
• Probable places – memcpy, strcpy etc.](https://image.slidesharecdn.com/valgrindtutorial-151108172727-lva1-app6892/85/Valgrind-tutorial-11-320.jpg)
![Some useful options of Memcheck
– Maximum number of entries shown in the stack trace
– If you use –log-file=<file name>.%p, then the process ID will be added. For
instance
– Needed if your program creates sub-processes through exec system call.
• valgrind –h will list you many other basic user options
--num-callers=<number> [default : 12]
--log-file=<file name>
$ valgrind --log-file=valgrind.log.%p ./main1
$ ls
$ main1 main1.cxx valgrind.log.2866
--trace-children=<yes|no> [default: no]](https://image.slidesharecdn.com/valgrindtutorial-151108172727-lva1-app6892/85/Valgrind-tutorial-12-320.jpg)
![Some useful options of Memcheck
• A very common message seen is – "Conditional jump or move
depends on uninitialised value(s)“
– Memcheck reports use of uninitialised values.
– To know sources of uninitialised data, use the following option
• Suppressing errors
– You may need it to suppress errors in library code.
– Valgrind will pause after every error and ask you to print the
suppression. Press Y.
– Copy all the messages into a file (e.g. my.supp) and in the future
valgrind run, use
--track-origin=yes [default : no]
--gen-suppressions=yes
valgrind --leak-check=yes --suppressions=./my.supp ./main1](https://image.slidesharecdn.com/valgrindtutorial-151108172727-lva1-app6892/85/Valgrind-tutorial-13-320.jpg)
![Suppressing errors
==14682== Conditional jump or move depends on uninitialised value(s)
==14682== at 0x400873: func1() (main1.cxx:7)
==14682== by 0x4008B9: main (main1.cxx:15)
==14682==
==14682==
==14682== ---- Print suppression ? --- [Return/N/n/Y/y/C/c] ---- y
{
<insert_a_suppression_name_here>
Memcheck:Cond
fun:_Z5func1v
fun:main
}
Not initialized
==14682==](https://image.slidesharecdn.com/valgrindtutorial-151108172727-lva1-app6892/85/Valgrind-tutorial-14-320.jpg)
![Attaching a debugger
• 3 simple steps
valgrind --vgdb-error=0 ./main1 [In one terminal]
==17332== Memcheck, a memory error detector
==17332== Copyright (C) 2002-2012, and GNU GPL'd, by Julian Seward et al.
==17332== Using Valgrind-3.8.1 and LibVEX; rerun with -h for copyright info
==17332== Command: ./main1
==17332==
==17332== (action at startup) vgdb me ...
==17332==
==17332== TO DEBUG THIS PROCESS USING GDB: start GDB like this
==17332== /path/to/gdb ./main1
==17332== and then give GDB the following command
==17332== target remote | /usr/lib64/valgrind/../../bin/vgdb --pid=17332
==17332== --pid is optional if only one valgrind process is running
==17332==
gdb ./main1 [In another terminal]
(gdb) target remote | /usr/lib64/valgrind/../../bin/vgdb --pid=17332](https://image.slidesharecdn.com/valgrindtutorial-151108172727-lva1-app6892/85/Valgrind-tutorial-17-320.jpg)
![Attaching a debugger(contd.)
(gdb) c
Continuing.
Program received signal SIGTRAP, Trace/breakpoint trap.
0x0000000000400730 in func1 () at main1.cxx:8
8 vec[i] = 1;
(gdb)](https://image.slidesharecdn.com/valgrindtutorial-151108172727-lva1-app6892/85/Valgrind-tutorial-18-320.jpg)


![Let’s debug some memory error
#include <iostream>
using namespace std;
void func1() {
int* vec = new int [10];
for (int i = 0; i <= 10; ++i) {
vec[i] = 1;
}
}
int main() {
func1();
return 0;
}
==11888== Invalid write of size 4
==11888== at 0x4006F0: func1() (main1.cxx:8)
==11888== by 0x40070F: main (main1.cxx:13)
==11888== Address 0x4c36068 is 0 bytes after a block of size 40 alloc'd
==11888== at 0x4A0674C: operator new[](unsigned long)
(vg_replace_malloc.c:305)
==11888== by 0x4006D5: func1() (main1.cxx:6)
==11888== by 0x40070F: main (main1.cxx:13)
==11888==
==11888==
==11888== HEAP SUMMARY:
==11888== in use at exit: 40 bytes in 1 blocks
==11888== total heap usage: 1 allocs, 0 frees, 40 bytes allocated
==11888==
==11888== 40 bytes in 1 blocks are definitely lost in loss record 1 of 1
==11888== at 0x4A0674C: operator new[](unsigned long)
(vg_replace_malloc.c:305)
==11888== by 0x4006D5: func1() (main1.cxx:6)
==11888== by 0x40070F: main (main1.cxx:13)
==11888==
==11888== LEAK SUMMARY:
==11888== definitely lost: 40 bytes in 1 blocks
==11888== indirectly lost: 0 bytes in 0 blocks
==11888== possibly lost: 0 bytes in 0 blocks
==11888== still reachable: 0 bytes in 0 blocks
==11888== suppressed: 0 bytes in 0 blocks
==11888==
==11888== For counts of detected and suppressed errors, rerun with: -v
==11888== ERROR SUMMARY: 2 errors from 2 contexts (suppressed: 6 from 6)](https://image.slidesharecdn.com/valgrindtutorial-151108172727-lva1-app6892/75/Valgrind-tutorial-5-2048.jpg)
![Understanding the output of
Memcheck
• ==29403== Invalid write of size 4
– Process id : 29403
– Type of error : “Invalid write”
– Below it, the stack trace.
• ==11888== 40 bytes in 1 blocks are definitely
lost in loss record 1 of 1
– Memory leak followed by the stack trace
• Note: Valgrind doesn’t detect static buffer
overflow
int vec2[10];
vec2[10] = 4;
vec2[11] = 5;](https://image.slidesharecdn.com/valgrindtutorial-151108172727-lva1-app6892/75/Valgrind-tutorial-6-2048.jpg)
![Memory Error
• Different types of errors
– Illegal read / Illegal write error
• This happens when your program reads or writes
memory at a place which Memcheck reckons it
shouldn't
void func1() {
int* vec = new int [11];
for (int i = 0; i <= 10; ++i) {
vec[i] = 1;
}
delete vec;
vec[10] = 4;
}](https://image.slidesharecdn.com/valgrindtutorial-151108172727-lva1-app6892/75/Valgrind-tutorial-8-2048.jpg)
![Memory Error (Contd.)
• Different types of errors
– Use of Uninitialized values
• when your program uses a value which hasn't been initialised --
in other words, is undefined
• Sources of uninitialized value
– Local variables in procedures which have not been initialised
– The contents of heap blocks before you write something
there
void func1() {
int* vec = new int [11];
if (vec[0] == 4) {
cout << "Initialized" << endl;
} else {
cout << "Not initialized" << endl;
}
}](https://image.slidesharecdn.com/valgrindtutorial-151108172727-lva1-app6892/75/Valgrind-tutorial-9-2048.jpg)
![Memory Error (Contd.)
• Different types of errors
– Use of uninitialized values in system calls
int main( void ) {
char* arr = malloc(10);
int* arr2 = malloc(sizeof(int));
write( 1 /* stdout */, arr, 10 );
exit(arr2[0]);
}
1. Syscall param write(buf) points to uninitialised byte(s)
2. Syscall param exit(error_code) contains uninitialised byte(s)](https://image.slidesharecdn.com/valgrindtutorial-151108172727-lva1-app6892/75/Valgrind-tutorial-10-2048.jpg)
![Memory Error (Contd.)
• Different types of errors
– Illegal Free
• Program freeing memory block twice
– Heap block freed with inappropriate deallocation
function
• If allocated with malloc, calloc, realloc, valloc or memalign,
you must deallocate with free.
• If allocated with new, you must deallocate with delete.
• If allocated with new[], you must deallocate with delete[].
– Overlapping source and destination
• Probable places – memcpy, strcpy etc.](https://image.slidesharecdn.com/valgrindtutorial-151108172727-lva1-app6892/75/Valgrind-tutorial-11-2048.jpg)
![Some useful options of Memcheck
– Maximum number of entries shown in the stack trace
– If you use –log-file=<file name>.%p, then the process ID will be added. For
instance
– Needed if your program creates sub-processes through exec system call.
• valgrind –h will list you many other basic user options
--num-callers=<number> [default : 12]
--log-file=<file name>
$ valgrind --log-file=valgrind.log.%p ./main1
$ ls
$ main1 main1.cxx valgrind.log.2866
--trace-children=<yes|no> [default: no]](https://image.slidesharecdn.com/valgrindtutorial-151108172727-lva1-app6892/75/Valgrind-tutorial-12-2048.jpg)
![Some useful options of Memcheck
• A very common message seen is – "Conditional jump or move
depends on uninitialised value(s)“
– Memcheck reports use of uninitialised values.
– To know sources of uninitialised data, use the following option
• Suppressing errors
– You may need it to suppress errors in library code.
– Valgrind will pause after every error and ask you to print the
suppression. Press Y.
– Copy all the messages into a file (e.g. my.supp) and in the future
valgrind run, use
--track-origin=yes [default : no]
--gen-suppressions=yes
valgrind --leak-check=yes --suppressions=./my.supp ./main1](https://image.slidesharecdn.com/valgrindtutorial-151108172727-lva1-app6892/75/Valgrind-tutorial-13-2048.jpg)
![Suppressing errors
==14682== Conditional jump or move depends on uninitialised value(s)
==14682== at 0x400873: func1() (main1.cxx:7)
==14682== by 0x4008B9: main (main1.cxx:15)
==14682==
==14682==
==14682== ---- Print suppression ? --- [Return/N/n/Y/y/C/c] ---- y
{
<insert_a_suppression_name_here>
Memcheck:Cond
fun:_Z5func1v
fun:main
}
Not initialized
==14682==](https://image.slidesharecdn.com/valgrindtutorial-151108172727-lva1-app6892/75/Valgrind-tutorial-14-2048.jpg)
![Attaching a debugger
• 3 simple steps
valgrind --vgdb-error=0 ./main1 [In one terminal]
==17332== Memcheck, a memory error detector
==17332== Copyright (C) 2002-2012, and GNU GPL'd, by Julian Seward et al.
==17332== Using Valgrind-3.8.1 and LibVEX; rerun with -h for copyright info
==17332== Command: ./main1
==17332==
==17332== (action at startup) vgdb me ...
==17332==
==17332== TO DEBUG THIS PROCESS USING GDB: start GDB like this
==17332== /path/to/gdb ./main1
==17332== and then give GDB the following command
==17332== target remote | /usr/lib64/valgrind/../../bin/vgdb --pid=17332
==17332== --pid is optional if only one valgrind process is running
==17332==
gdb ./main1 [In another terminal]
(gdb) target remote | /usr/lib64/valgrind/../../bin/vgdb --pid=17332](https://image.slidesharecdn.com/valgrindtutorial-151108172727-lva1-app6892/75/Valgrind-tutorial-17-2048.jpg)
![Attaching a debugger(contd.)
(gdb) c
Continuing.
Program received signal SIGTRAP, Trace/breakpoint trap.
0x0000000000400730 in func1 () at main1.cxx:8
8 vec[i] = 1;
(gdb)](https://image.slidesharecdn.com/valgrindtutorial-151108172727-lva1-app6892/75/Valgrind-tutorial-18-2048.jpg)


Valgrind is a suite of tools for debugging and profiling C and C++ programs. Memcheck is its most popular tool for detecting memory errors like leaks, accesses to uninitialized memory, and invalid reads/writes. It works by instrumenting the program binary to track "V-bits" and "A-bits" associated with each value and memory location. When the program is executed, Memcheck checks these bits to detect errors and produces detailed error reports with stack traces. The tutorial provides instructions on running Memcheck, understanding its output, and using options like suppressions and attaching a debugger. It also briefly describes how Memcheck works and lists some other Valgrind tools.

![[slides] Software Engineering Third Edition - Aggarwal, Singh.pdf](https://cdn.slidesharecdn.com/ss_thumbnails/slidessoftwareengineeringthirdedition-aggarwalsingh-230615025923-02cadfc5-thumbnail.jpg?width=600ounds&width=560&fit=bounds)


