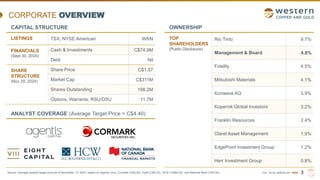
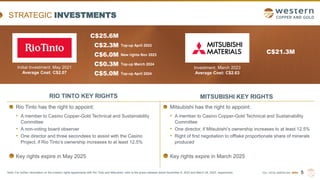
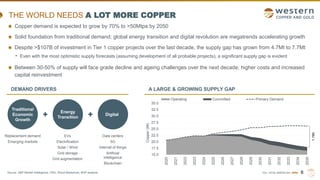
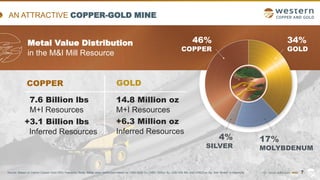
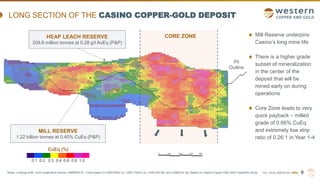
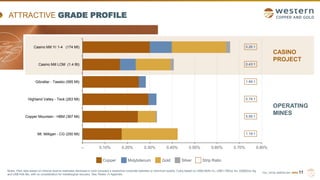
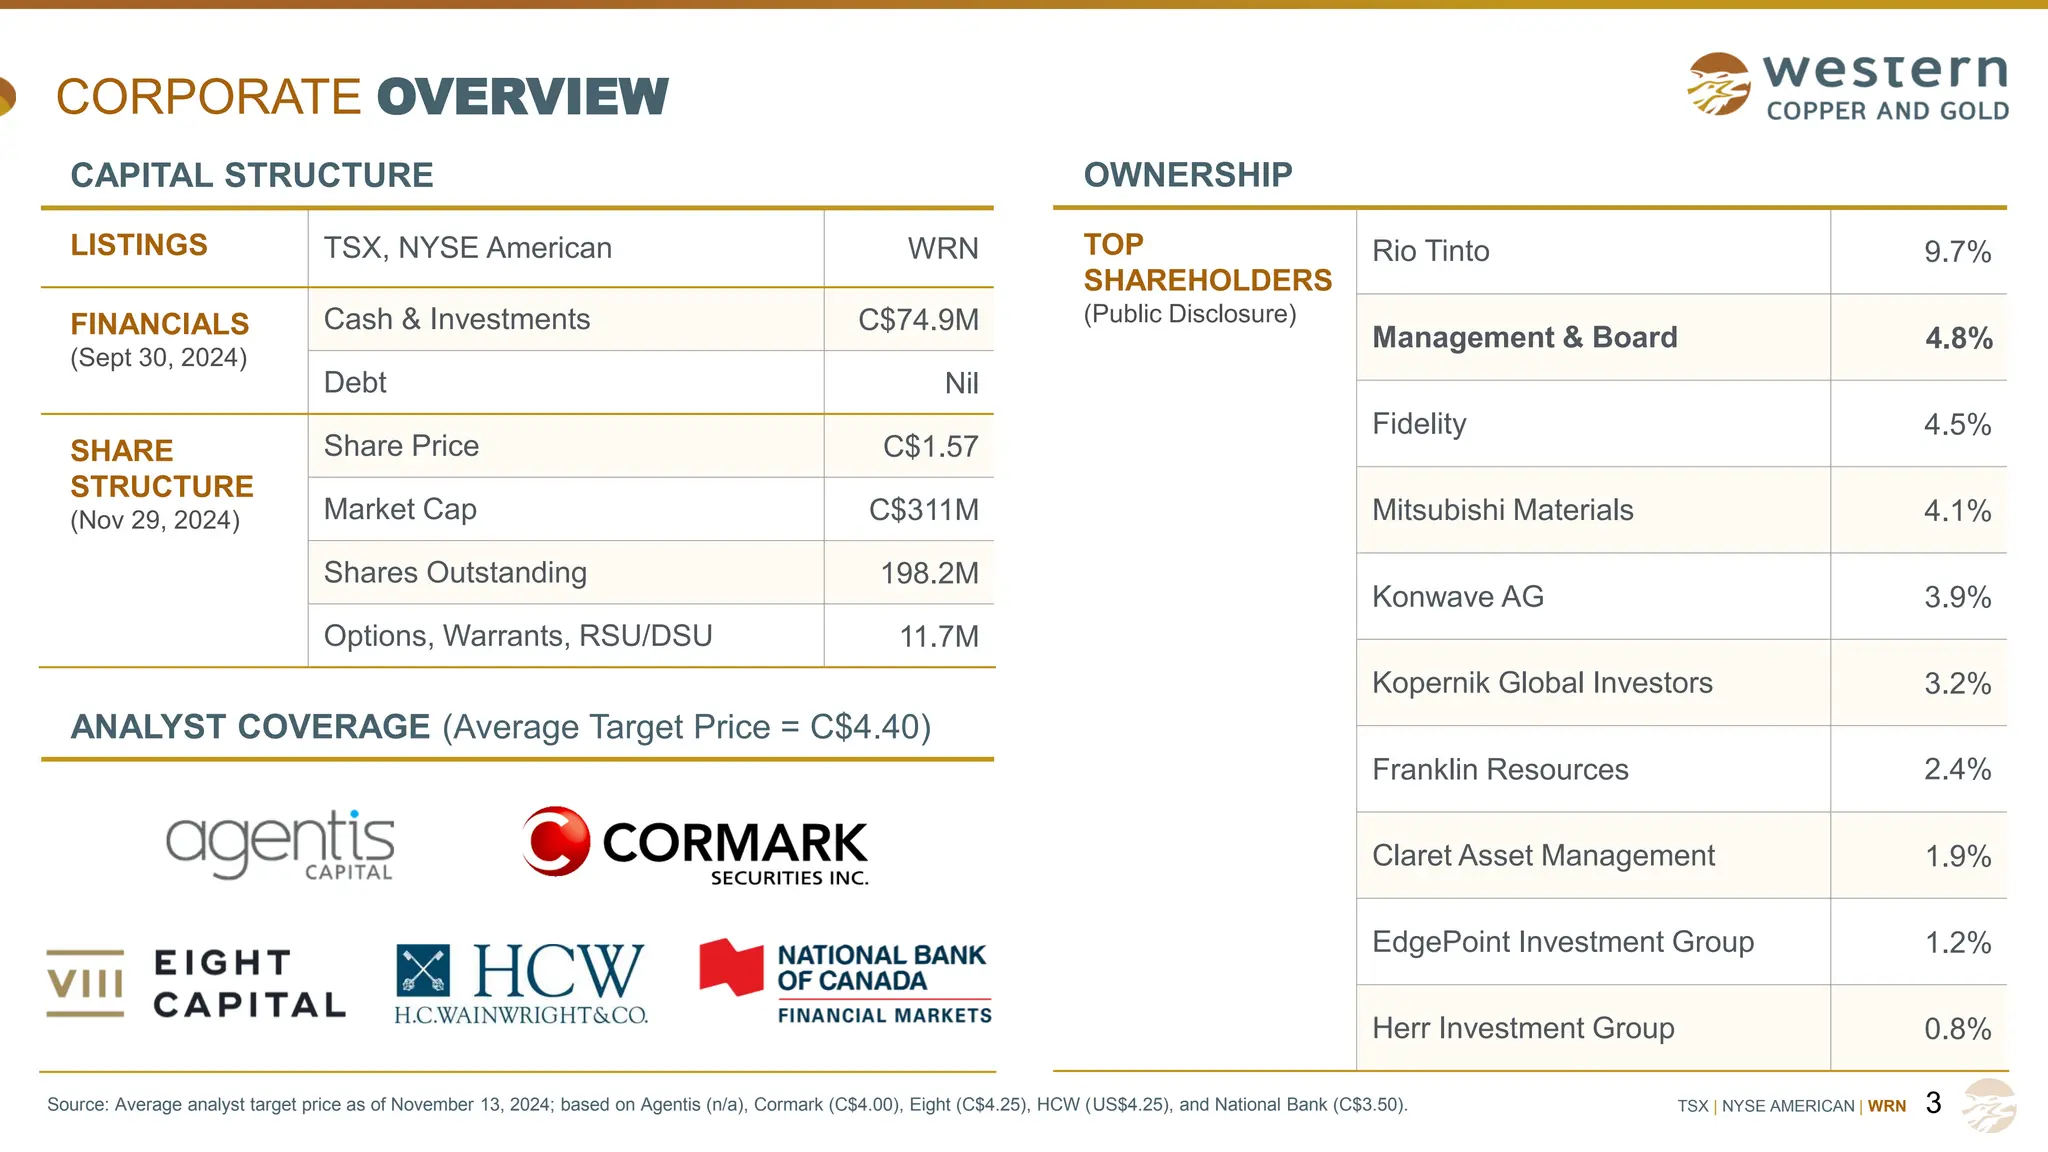
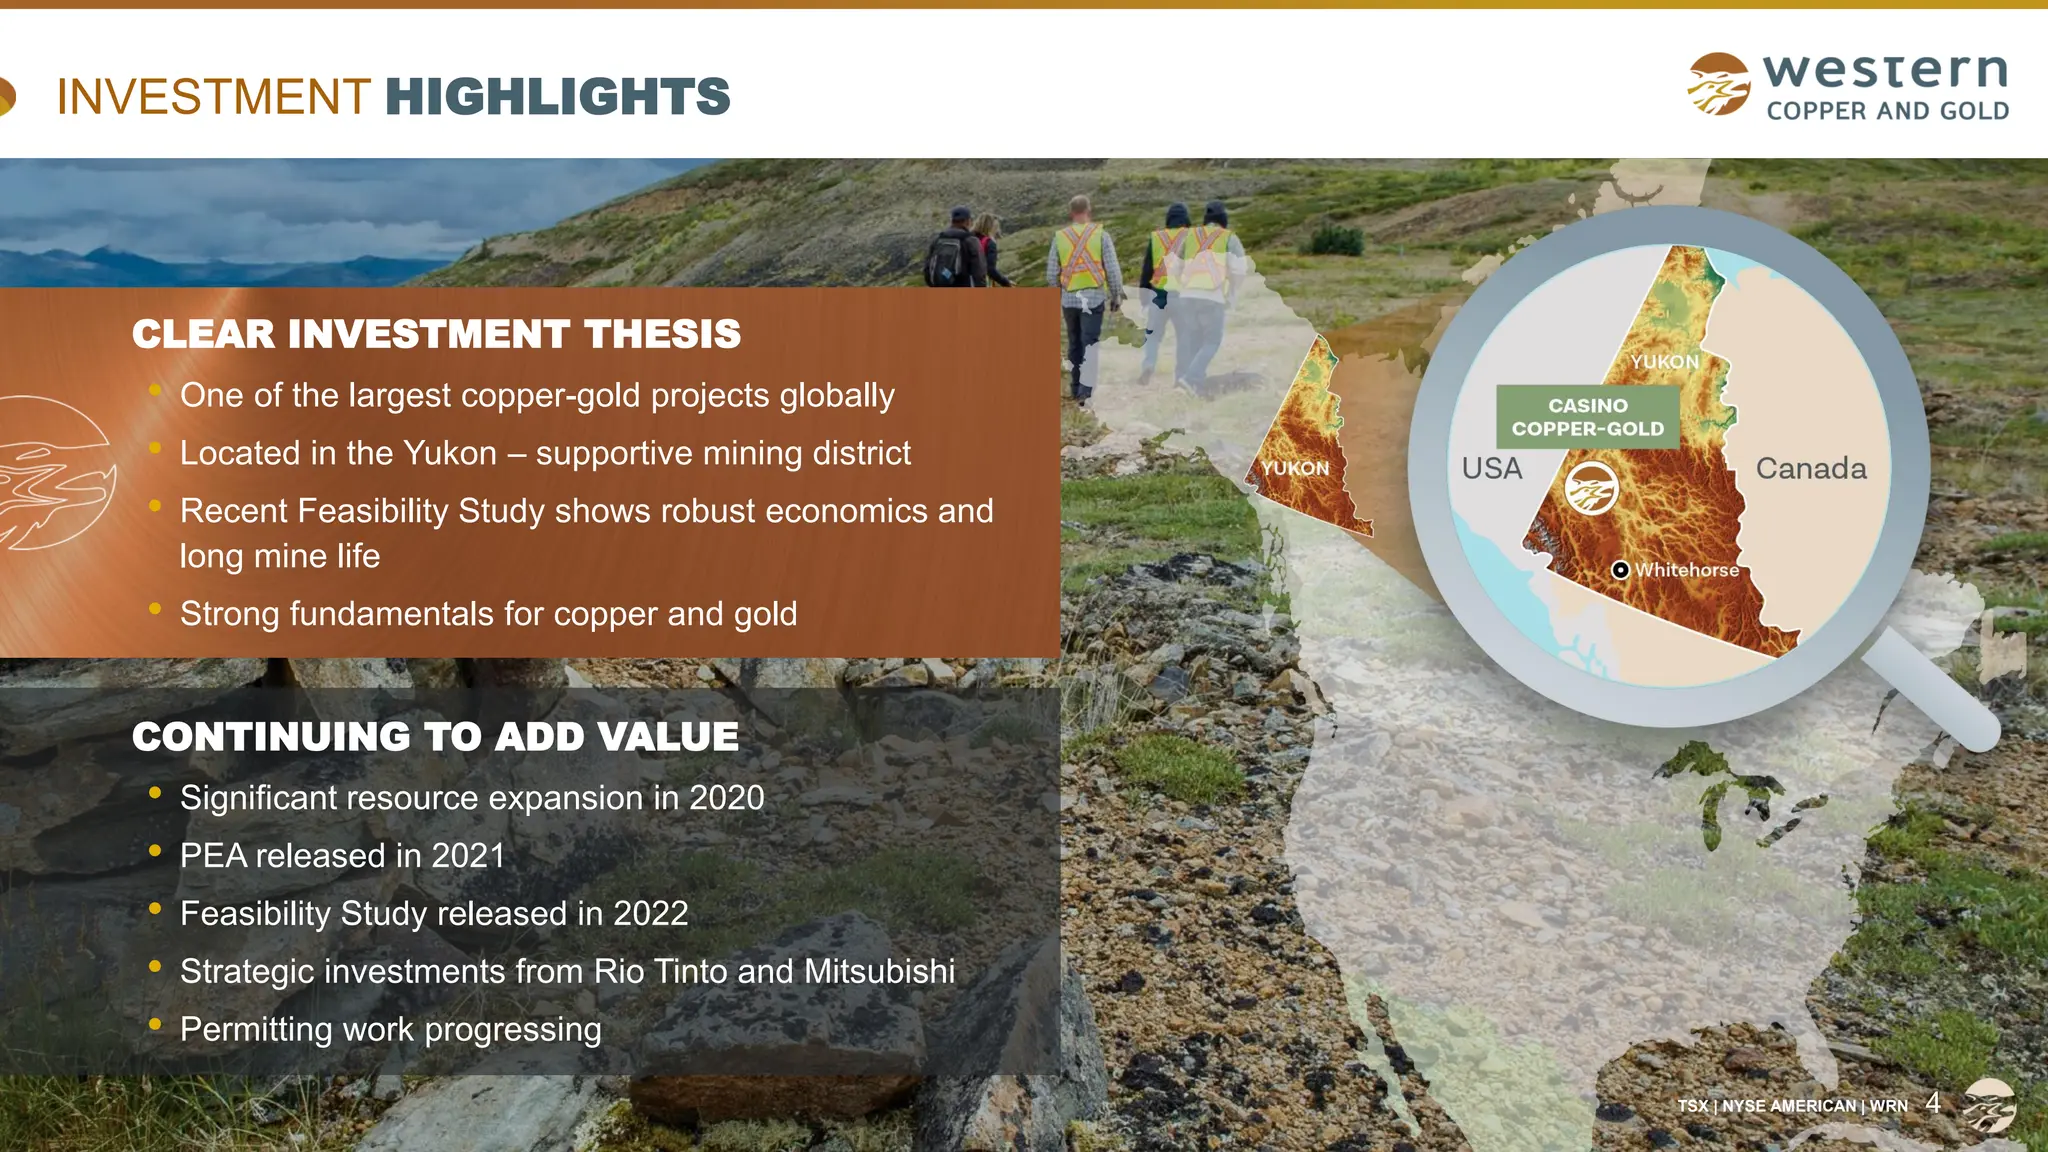
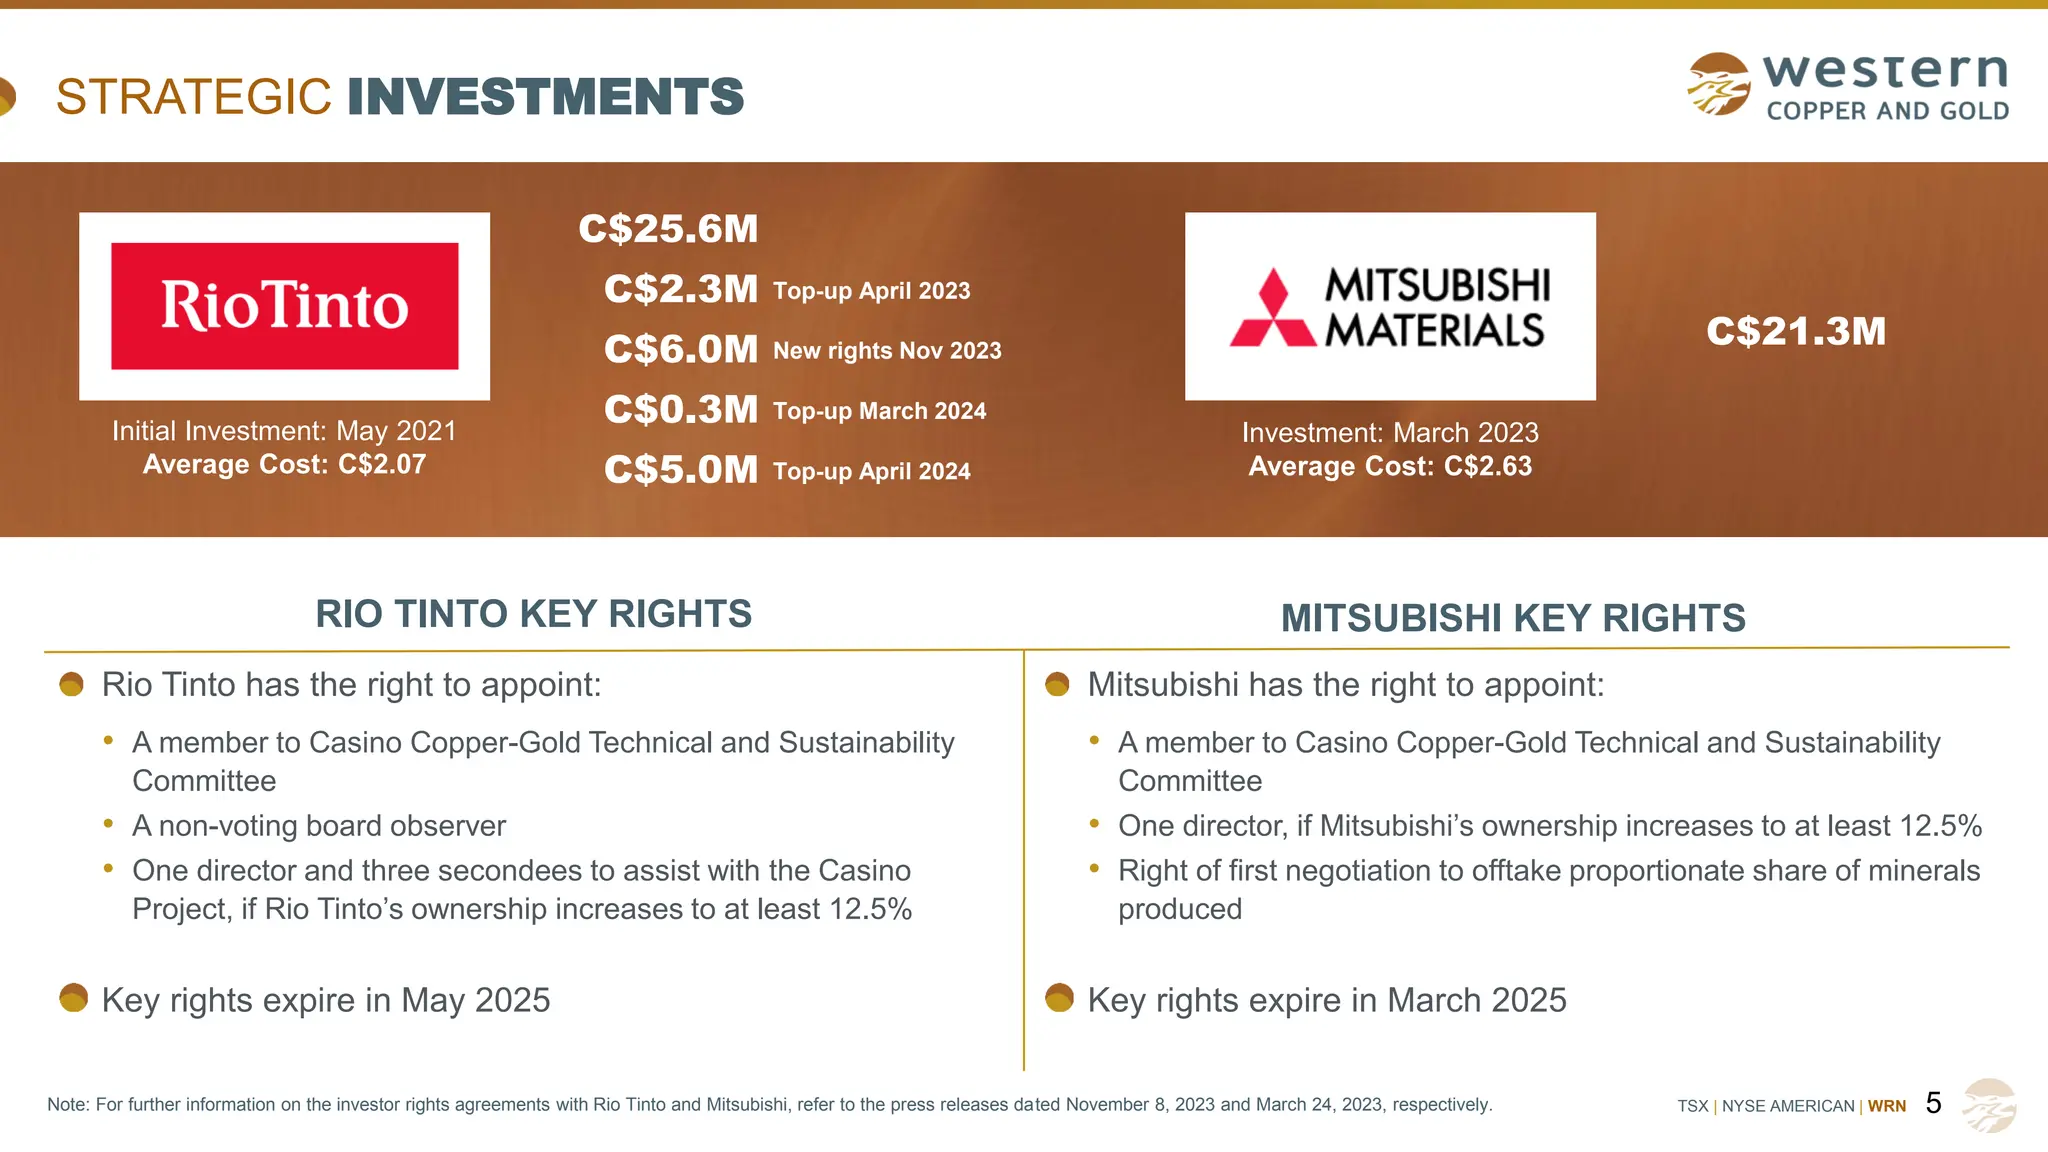
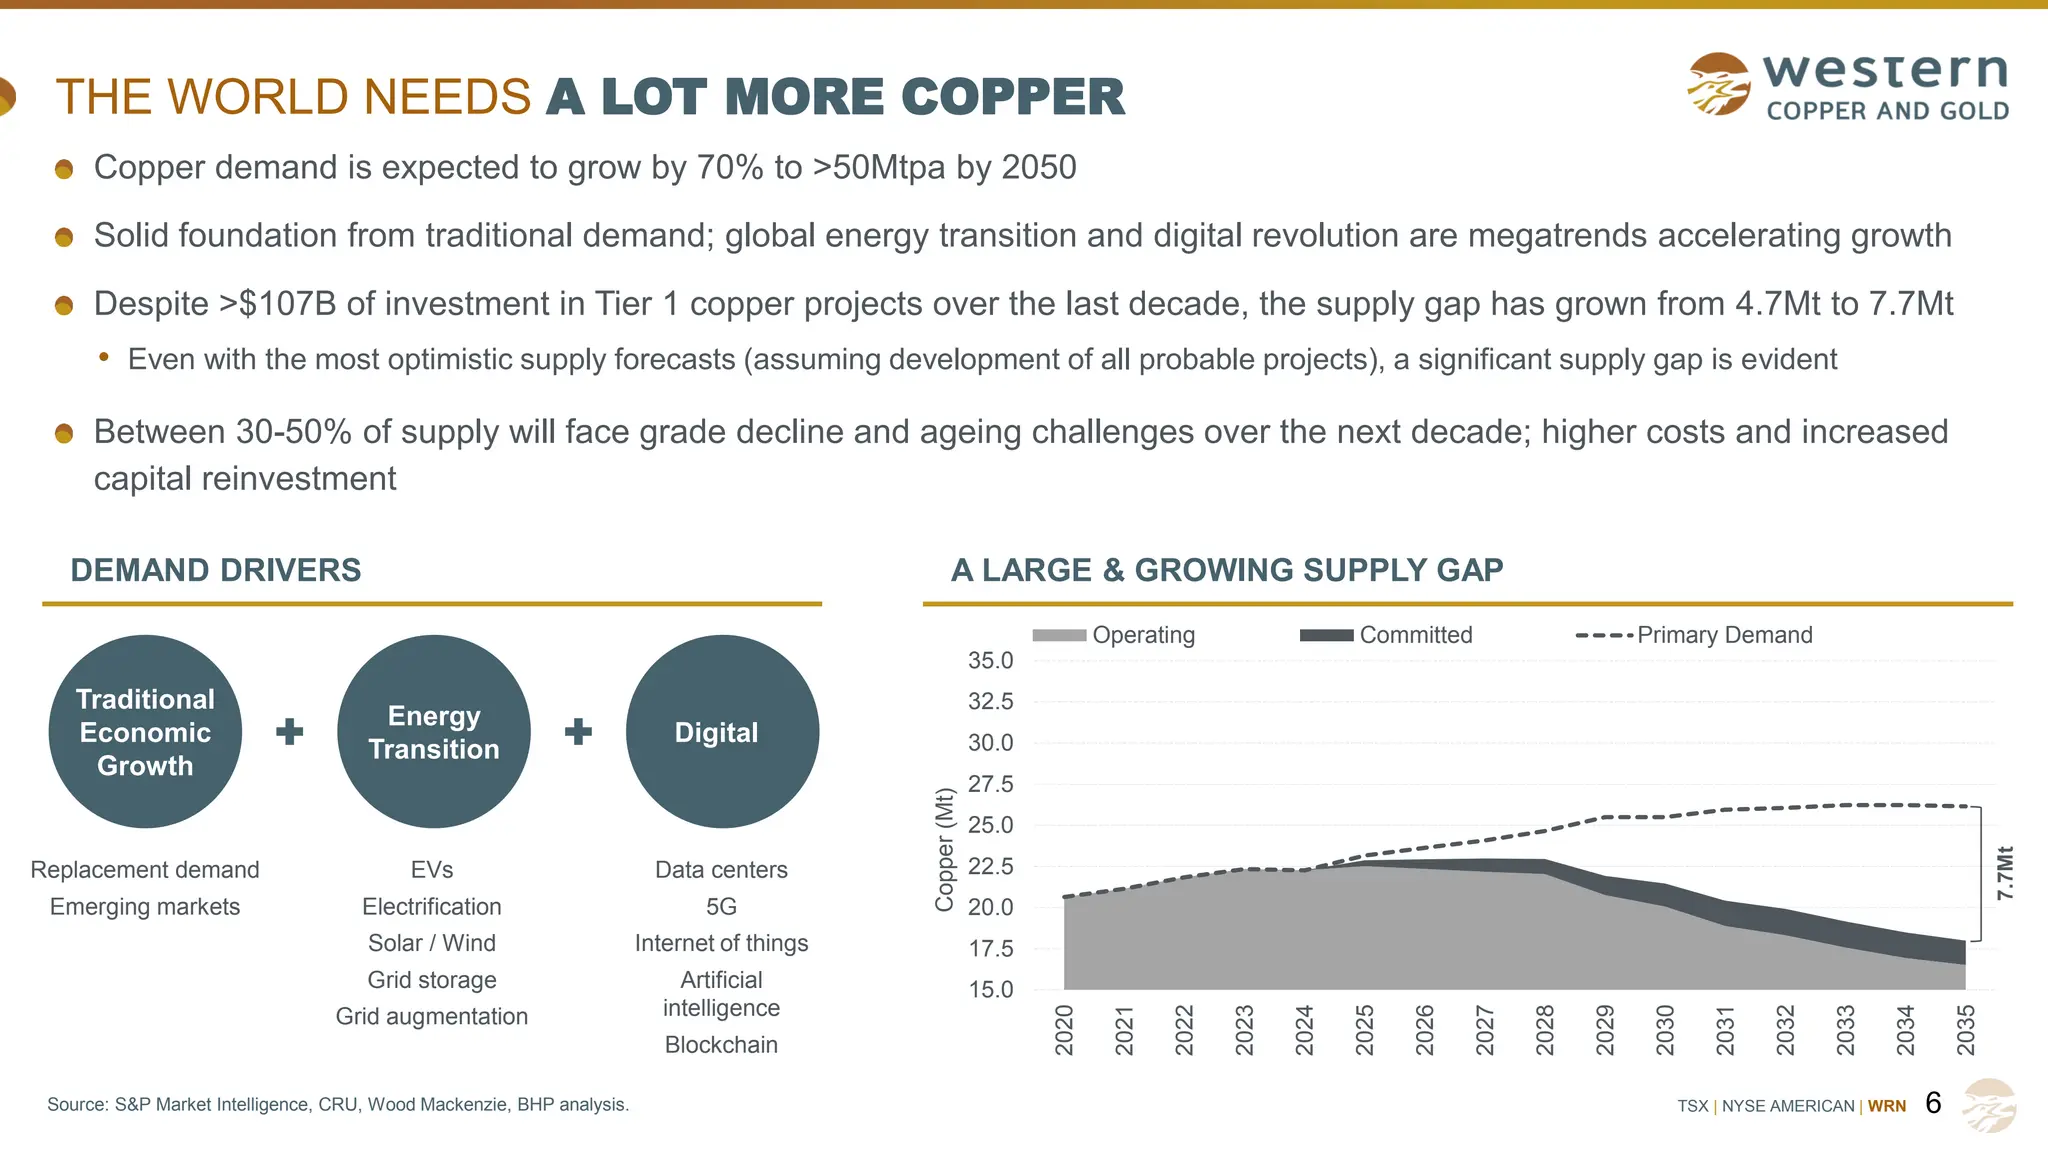
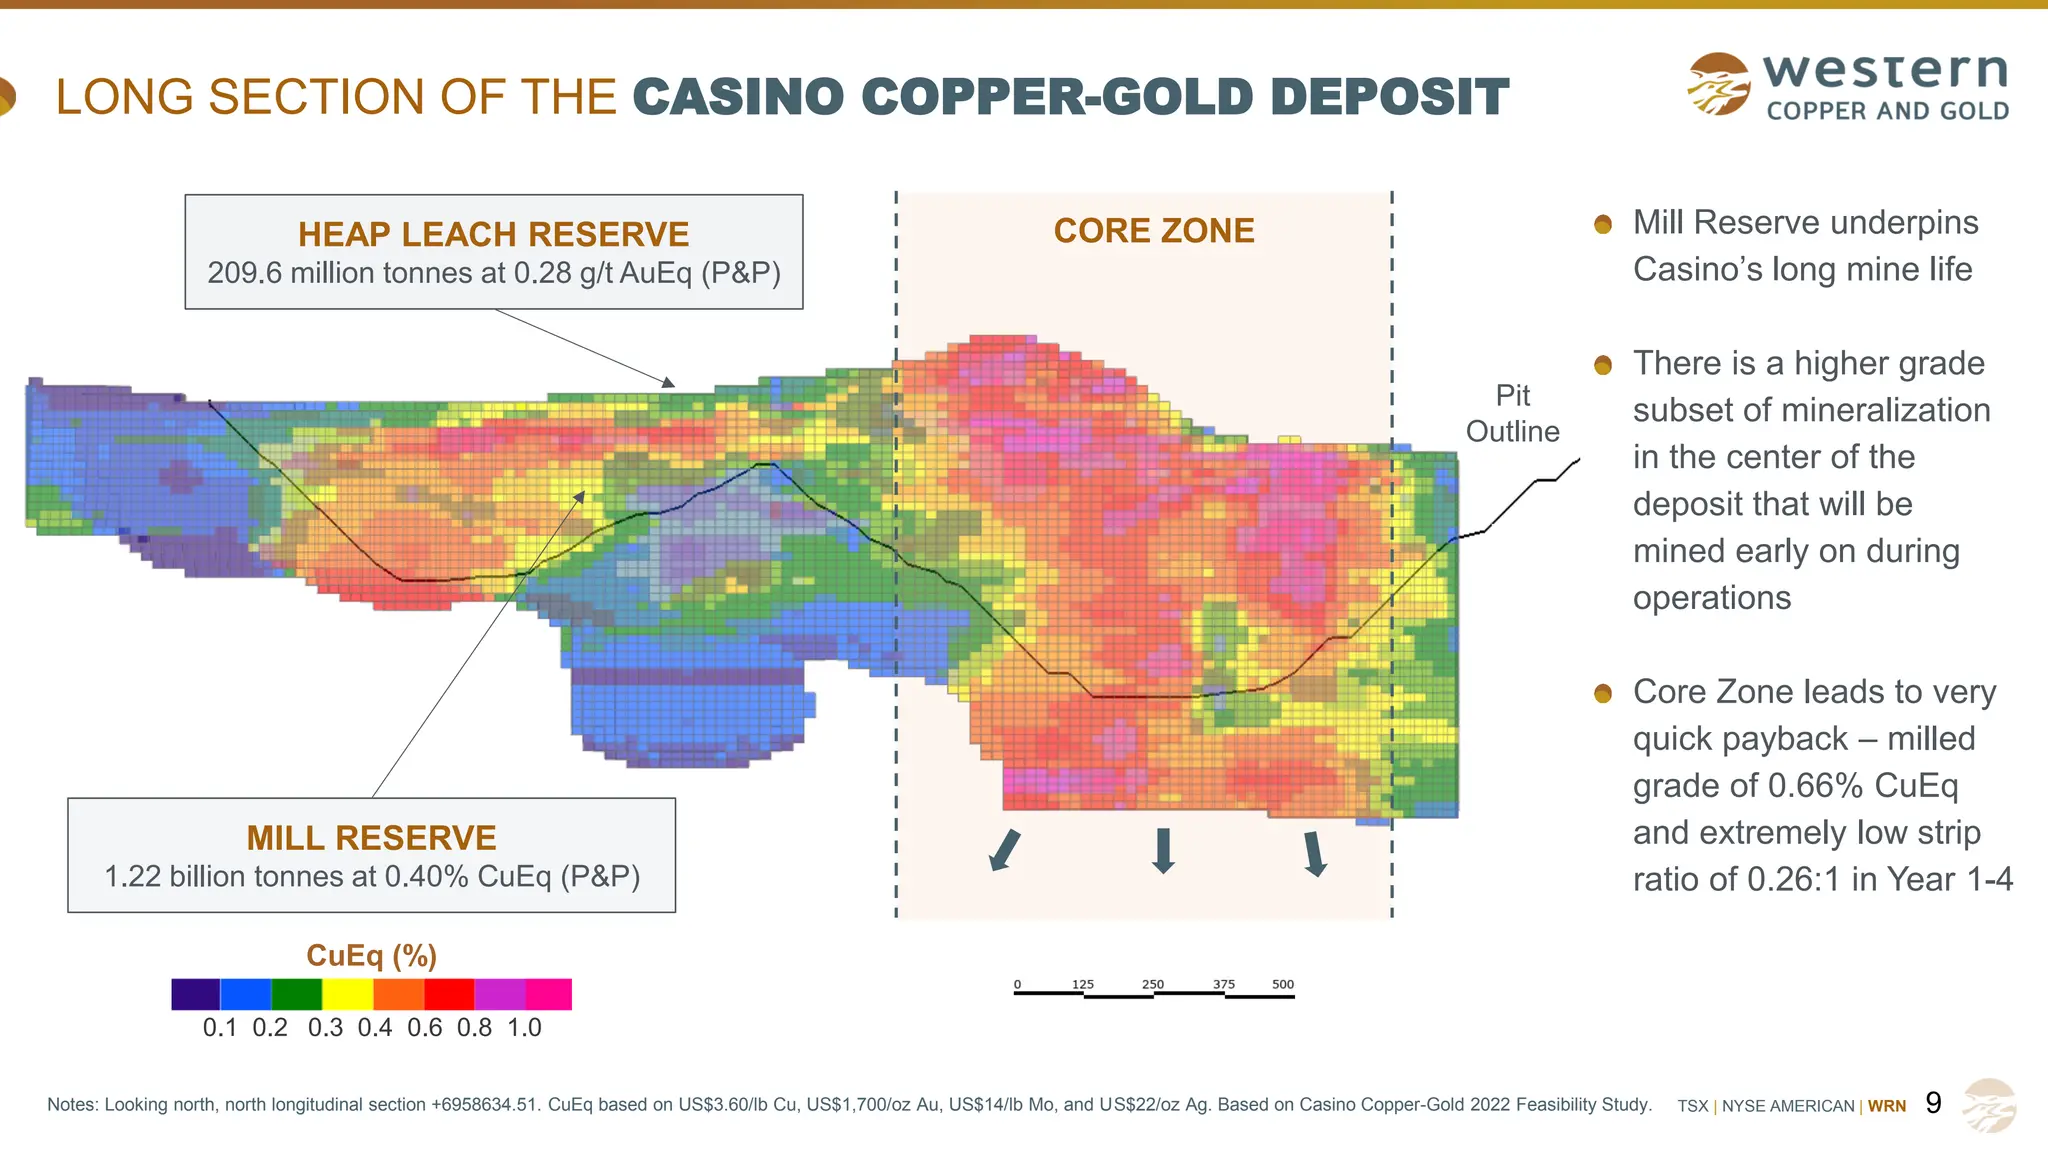
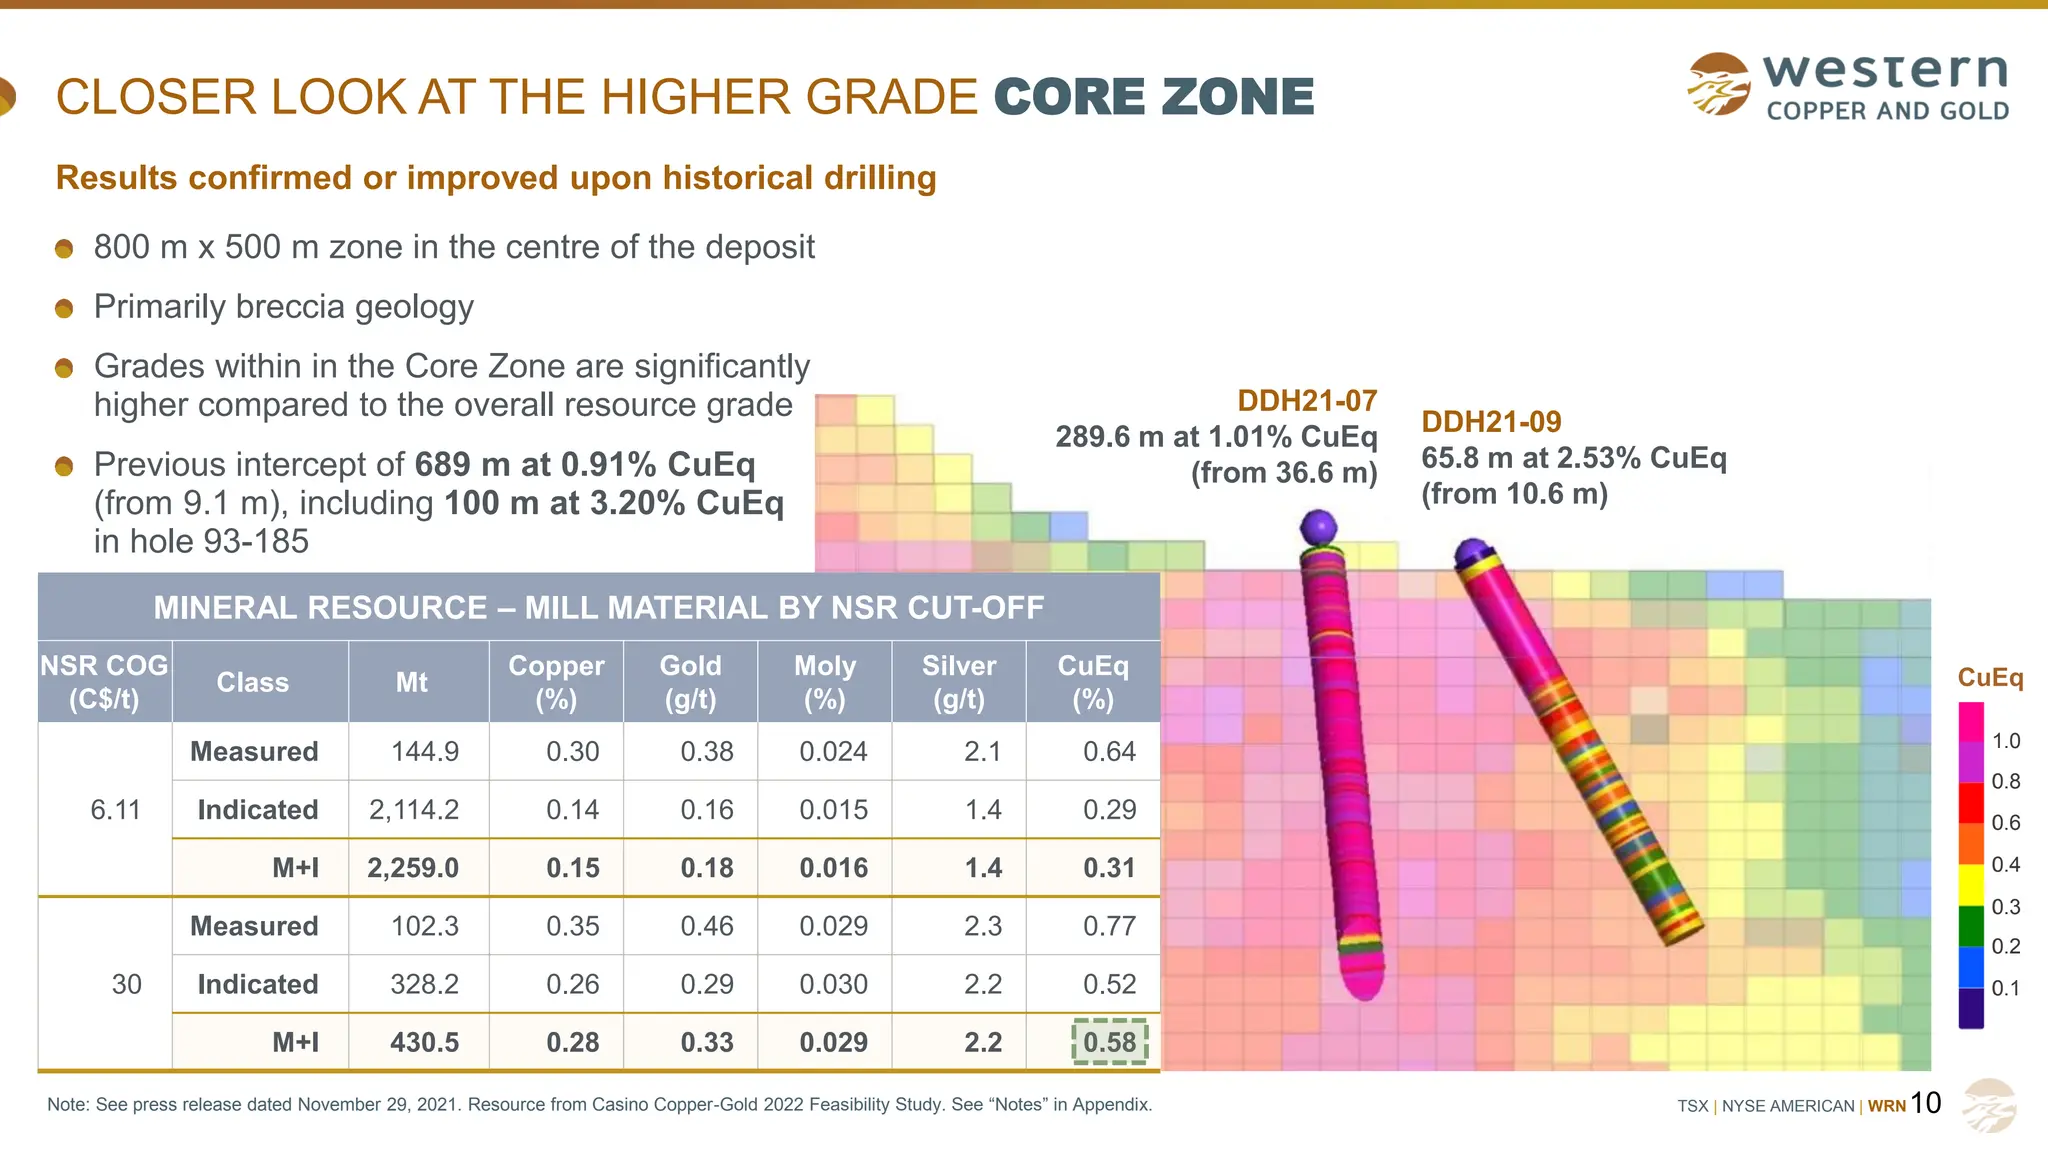
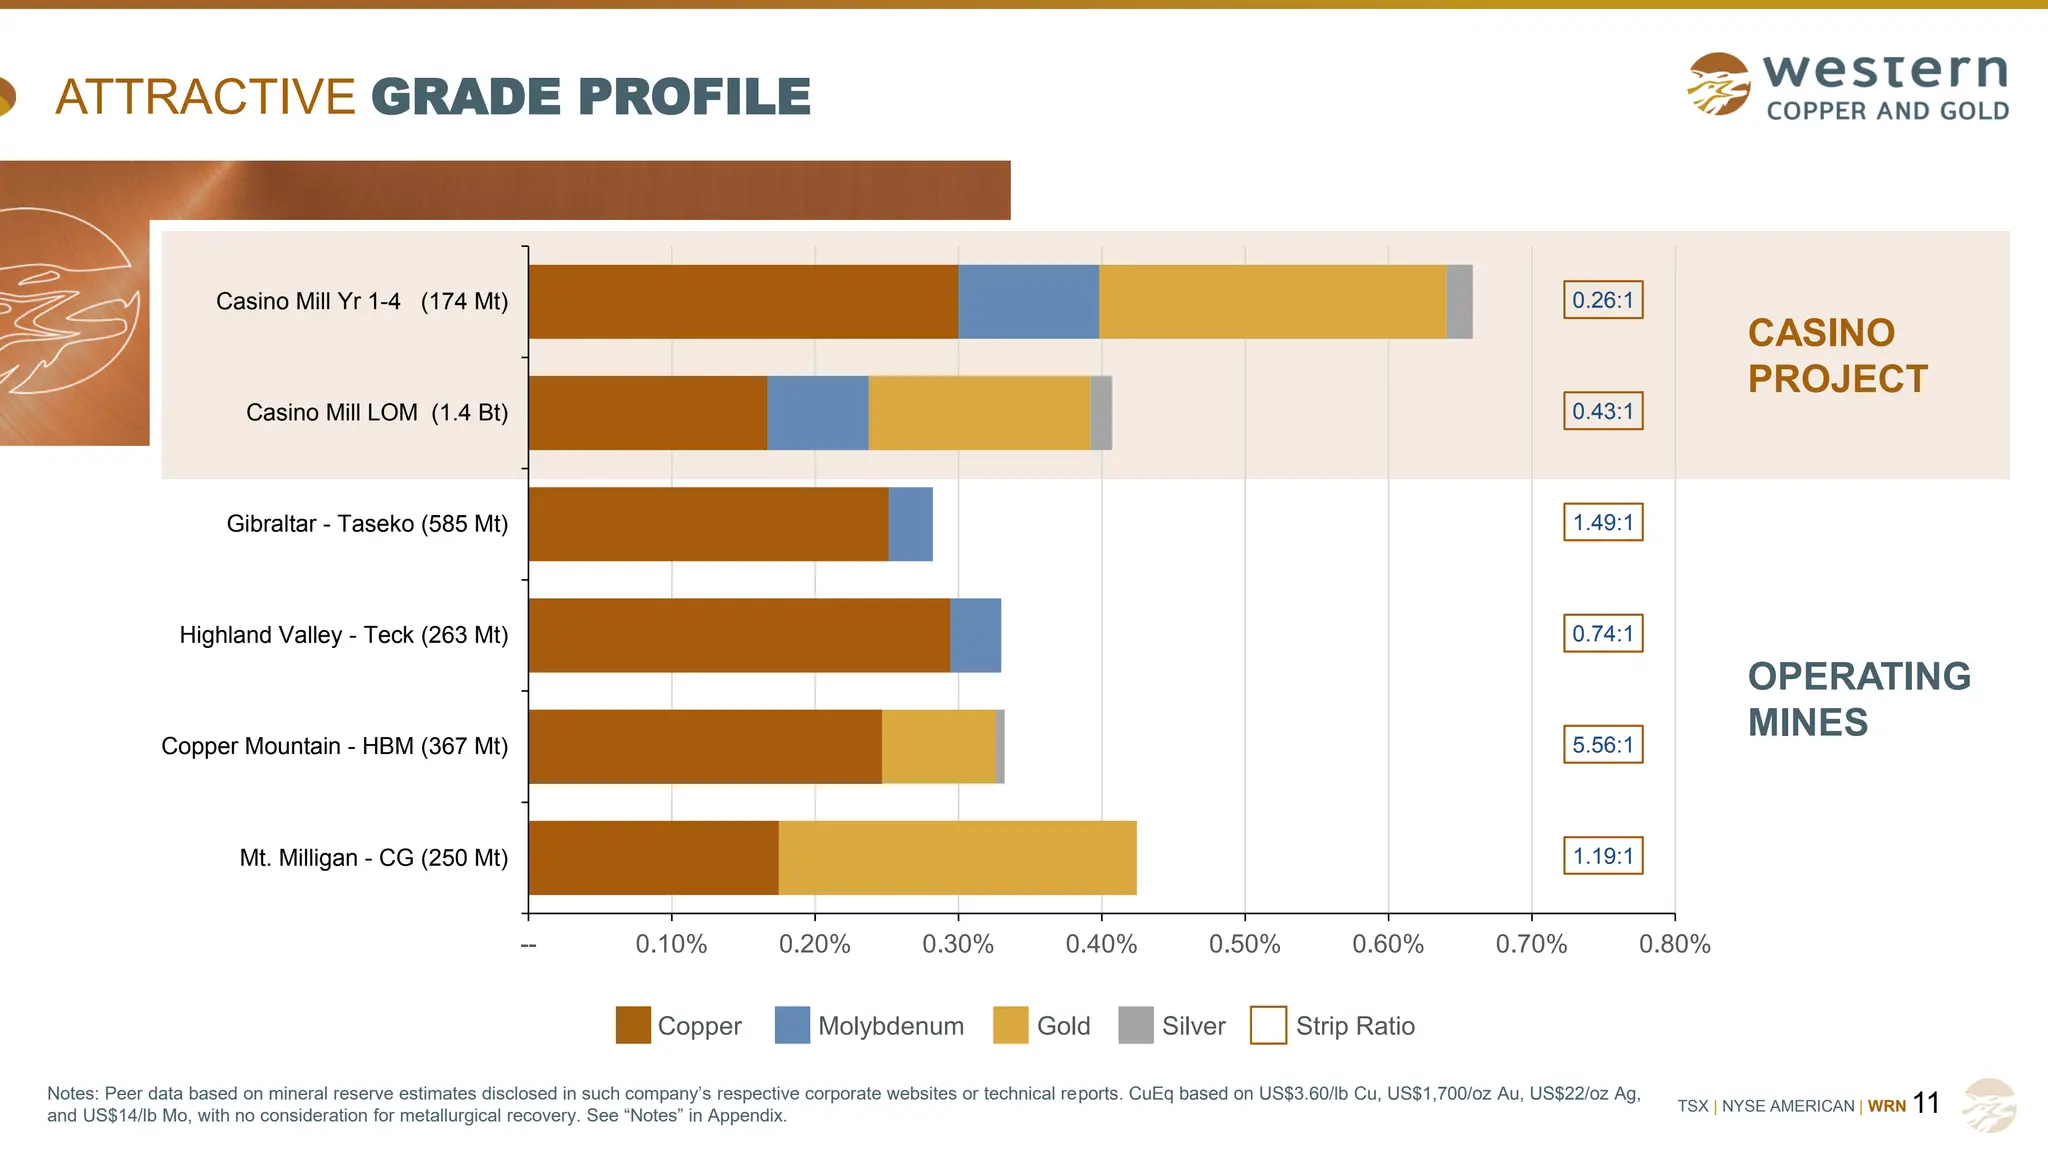
KEMBAR78
WRN_Corporate_Presentation_December 2024.pdf
DEVELOPING
CANADA’S LARGEST
CRITICAL MINERALS
PROJECT
TSX WRN
NYSE AMERICAN WRN
Corporate Presentation | December 2024
TSX | NYSE AMERICAN | WRN
CAUTIONARY NOTES
The information provided in this presentation is not
intended to be a comprehensive review of all matters and
developments concerning Western Copper and Gold
Corporation and its subsidiaries (collectively, the
“Company”). This document should be read in conjunction
with all other disclosure documents of the Company. No
securities commission or regulatory authority has
reviewed the accuracy or adequacy of the information
presented herein.
Note Regarding Forward-Looking Statements
Certain of the statements and information in this
presentation constitute “forward-looking statements”
within the meaning of the United States Private Securities
Litigation Reform Act of 1995 and “forward-looking
information” within the meaning of applicable Canadian
securities laws (together referred to herein as “forward-
looking statements”). Any statements or information that
express or involve discussions with respect to predictions,
expectations, beliefs, plans, projections, objectives,
assumptions, or future events or performance (often, but
not always, using words or phrases such as “expects”, “is
expected”, “anticipates”, “believes”, “plans”, “projects”,
“estimates”, “assumes”, “intends”, “strategies”, “targets”,
“goals”, “forecasts”, “objectives”, “budgets”, “schedules”,
“potential” or variations thereof or stating that certain
actions, events or results “may”, “could”, “would”, “might”
or “will” be taken, occur or be achieved, or the negative of
any of these terms and similar expressions) are not
statements of historical fact and may be forward-looking
statements. Such statements include, but are not limited
to, statements regarding mineral reserve and mineral
resource estimates, planned exploration and development
activities, corporate objectives, the economic prospects of
the Company’s projects, the Company’s future plans or
future revenues, and timing of development, or potential
expansions or improvements.
The forward-looking statements are necessarily based on
a number of estimates, assumptions, beliefs, expectations
and opinions of management as of the date of this
presentation that, while considered reasonable by
management, are inherently subject to significant
business, economic and competitive uncertainties and
contingencies. These estimates, assumptions, beliefs,
expectations and opinions include, without limitation, with
respect to any mineral reserve or mineral resource
estimate, the key assumptions and parameters on which
such estimates are based, prevailing and projected
market prices and foreign exchange rates, projected
capital and operating costs, continued availability of
capital and financing, availability of equipment and
personnel required for construction and operations, the
Company not experiencing unforeseen delays,
unexpected geological or other effects, equipment
failures, permitting delays, and general economic, market
or business conditions.
Forward-looking statements are subject to known and
unknown risks and uncertainties which could cause actual
results to differ materially from estimated results. Such
risks and uncertainties include, but are not limited to, the
Company’s ability to raise sufficient capital to fund
development; changes in general economic conditions or
financial markets, changes in prices for the Company’s
mineral products or increases in input costs; uncertainties
relating to interpretation of drill results and the geological
continuity and grade of mineral deposits; that mineral
resources and mineral reserves are not as estimated;
risks related to cooperation of government agencies and
First Nations in the exploration and development of the
property; litigation; legislative, environmental and other
judicial, regulatory, political and competitive developments
in Canada; technological and operational difficulties or
inability to obtain permits encountered in connection with
exploration and development activities; labour relations
matters, changing foreign exchange rates, and other
factors described under the heading “Risk Factors” in the
Company’s annual information form for the most recently
completed financial year and its other publicly filed
disclosure documents. This list is not exhaustive of the
factors that may affect any of the Company’s forward-
looking statements.
Although the forward-looking statements contained in this
presentation are based upon what management believes
are reasonable assumptions, there can be no assurance
that actual results will be consistent with these forward-
looking statements. All forward-looking statements in this
presentation are qualified by this cautionary note.
Accordingly, readers should not place undue reliance on
such statements. Other than as specifically required by
applicable laws, the Company is under no obligation and
expressly disclaims any such obligation to update or alter
the forward-looking statements whether as a result of new
information, future events or otherwise. These forward-
looking statements are made as of the date of this
presentation.
Note to U.S. Readers/Investors
Information regarding the Company’s mining operations
included in this presentation has been prepared in
accordance with the requirements of the securities laws in
effect in Canada, which differ in certain material respects
from the disclosure requirements of United States
securities laws applicable to domestic United States
issuers. The terms “mineral reserve”, “proven mineral
reserve” and “probable mineral reserve” are Canadian
mining terms as defined in accordance with Canadian
National Instrument 43-101 – Standards of Disclosure for
Mineral Projects (“NI 43-101”) and the Canadian Institute
of Mining, Metallurgy and Petroleum (the “CIM”) Definition
Standards for Mineral Resources and Mineral Reserves,
adopted by the CIM Council, as amended. NI 43-101 is a
rule developed by the Canadian Securities Administrators
that establishes standards for all public disclosure an
issuer makes of scientific and technical information
concerning mineral projects. The definitions of these
terms and other mining terms, such as “inferred mineral
resource”, differ from the definitions of such terms, if any,
for purposes of the disclosure requirements of the U.S.
Securities and Exchange Commission (the “SEC”).
Accordingly, information in this presentation describing
the Company’s mineral deposits may not be comparable
to similar information made public by issuers subject to
the SEC’s reporting and disclosure requirements
applicable to domestic United States issuers.
Note Regarding Inferred Mineral Resources
Under Canadian rules, estimates of inferred mineral
resources are considered too speculative geologically to
have the economic considerations applied to them to
enable them to be categorized as mineral reserves and,
accordingly, may not form the basis of feasibility or pre-
feasibility studies, or economic studies except for a
preliminary economic assessment as defined under NI
43-101. Investors are cautioned not to assume that part or
all of an inferred mineral resource exists or is
economically or legally mineable. Mineral resources that
are not mineral reserves do not have demonstrated
economic viability.
2
TSX | NYSE AMERICAN | WRN
CORPORATE OVERVIEW
3
CAPITAL STRUCTURE
LISTINGS TSX, NYSE American WRN
FINANCIALS
(Sept 30, 2024)
Cash & Investments C$74.9M
Debt Nil
SHARE
STRUCTURE
(Nov 29, 2024)
Share Price C$1.57
Market Cap C$311M
Shares Outstanding 198.2M
Options, Warrants, RSU/DSU 11.7M
OWNERSHIP
TOP
SHAREHOLDERS
(Public Disclosure)
Rio Tinto 9.7%
Management & Board 4.8%
Fidelity 4.5%
Mitsubishi Materials 4.1%
Konwave AG 3.9%
Kopernik Global Investors 3.2%
Franklin Resources 2.4%
Claret Asset Management 1.9%
EdgePoint Investment Group 1.2%
Herr Investment Group 0.8%
ANALYST COVERAGE (Average Target Price = C$4.40)
Source: Average analyst target price as of November 13, 2024; based on Agentis (n/a), Cormark (C$4.00), Eight (C$4.25), HCW (US$4.25), and National Bank (C$3.50).
TSX | NYSE AMERICAN | WRN
INVESTMENT HIGHLIGHTS
CLEAR INVESTMENT THESIS
• One of the largest copper-gold projects globally
• Located in the Yukon – supportive mining district
• Recent Feasibility Study shows robust economics and
long mine life
• Strong fundamentals for copper and gold
CONTINUING TO ADD VALUE
• Significant resource expansion in 2020
• PEA released in 2021
• Feasibility Study released in 2022
• Strategic investments from Rio Tinto and Mitsubishi
• Permitting work progressing
TSX | NYSE AMERICAN | WRN 4
TSX | NYSE AMERICAN | WRN
STRATEGIC INVESTMENTS
5
RIO TINTO KEY RIGHTS
Rio Tinto has the right to appoint:
• A member to Casino Copper-Gold Technical and Sustainability
Committee
• A non-voting board observer
• One director and three secondees to assist with the Casino
Project, if Rio Tinto’s ownership increases to at least 12.5%
Key rights expire in May 2025
Mitsubishi has the right to appoint:
• A member to Casino Copper-Gold Technical and Sustainability
Committee
• One director, if Mitsubishi’s ownership increases to at least 12.5%
• Right of first negotiation to offtake proportionate share of minerals
produced
Key rights expire in March 2025
MITSUBISHI KEY RIGHTS
C$25.6M
C$2.3M
C$6.0M
Top-up April 2023
New rights Nov 2023
C$0.3M Top-up March 2024
C$5.0M Top-up April 2024
C$21.3M
Investment: March 2023
Average Cost: C$2.63
Note: For further information on the investor rights agreements with Rio Tinto and Mitsubishi, refer to the press releases dated November 8, 2023 and March 24, 2023, respectively.
Initial Investment: May 2021
Average Cost: C$2.07
TSX | NYSE AMERICAN | WRN
15.0
17.5
20.0
22.5
25.0
27.5
30.0
32.5
35.0
2020
2021
2022
2023
2024
2025
2026
2027
2028
2029
2030
2031
2032
2033
2034
2035
Copper
(Mt)
Operating Committed Primary Demand
7.7Mt
DEMAND DRIVERS
THE WORLD NEEDS A LOT MORE COPPER
6
Copper demand is expected to grow by 70% to >50Mtpa by 2050
Solid foundation from traditional demand; global energy transition and digital revolution are megatrends accelerating growth
Despite >$107B of investment in Tier 1 copper projects over the last decade, the supply gap has grown from 4.7Mt to 7.7Mt
• Even with the most optimistic supply forecasts (assuming development of all probable projects), a significant supply gap is evident
Between 30-50% of supply will face grade decline and ageing challenges over the next decade; higher costs and increased
capital reinvestment
A LARGE & GROWING SUPPLY GAP
Traditional
Economic
Growth
Energy
Transition
Digital
EVs
Electrification
Solar / Wind
Grid storage
Grid augmentation
Data centers
5G
Internet of things
Artificial
intelligence
Blockchain
Replacement demand
Emerging markets
15.0
17.5
20.0
22.5
25.0
27.5
30.0
32.5
35.0
2020
2021
2022
2023
2024
2025
2026
2027
2028
2029
2030
2031
2032
2033
2034
2035
Copper
(Mt)
Operating Committed Primary Demand
7.7Mt
Source: S&P Market Intelligence, CRU, Wood Mackenzie, BHP analysis.
TSX | NYSE AMERICAN | WRN
AN ATTRACTIVE COPPER-GOLD MINE
7
Metal Value Distribution
in the M&I Mill Resource
46%
COPPER
34%
GOLD
4%
SILVER
17%
MOLYBDENUM
COPPER GOLD
7.6 Billion lbs
M+I Resources
+3.1 Billion lbs
Inferred Resources
14.8 Million oz
M+I Resources
+6.3 Million oz
Inferred Resources
Source: Based on Casino Copper-Gold 2022 Feasibility Study. Metal value distribution based on US$3.60/lb Cu, US$1,700/oz Au, US$14/lb Mo, and US$22/oz Ag. See “Notes” in Appendix.
TSX | NYSE AMERICAN | WRN
CASINO
COPPER-GOLD PROJECT
TSX | NYSE AMERICAN | WRN
LONG SECTION OF THE CASINO COPPER-GOLD DEPOSIT
9
HEAP LEACH RESERVE
209.6 million tonnes at 0.28 g/t AuEq (P&P)
MILL RESERVE
1.22 billion tonnes at 0.40% CuEq (P&P)
CORE ZONE
Pit
Outline
CuEq (%)
1.0
0.8
0.6
0.4
0.3
0.2
0.1
Mill Reserve underpins
Casino’s long mine life
There is a higher grade
subset of mineralization
in the center of the
deposit that will be
mined early on during
operations
Core Zone leads to very
quick payback – milled
grade of 0.66% CuEq
and extremely low strip
ratio of 0.26:1 in Year 1-4
Notes: Looking north, north longitudinal section +6958634.51. CuEq based on US$3.60/lb Cu, US$1,700/oz Au, US$14/lb Mo, and US$22/oz Ag. Based on Casino Copper-Gold 2022 Feasibility Study.
TSX | NYSE AMERICAN | WRN
CLOSER LOOK AT THE HIGHER GRADE CORE ZONE
Results confirmed or improved upon historical drilling
800 m x 500 m zone in the centre of the deposit
Primarily breccia geology
Grades within in the Core Zone are significantly
higher compared to the overall resource grade
Previous intercept of 689 m at 0.91% CuEq
(from 9.1 m), including 100 m at 3.20% CuEq
in hole 93-185
10
DDH21-09
65.8 m at 2.53% CuEq
(from 10.6 m)
DDH21-07
289.6 m at 1.01% CuEq
(from 36.6 m)
CuEq
1.0
0.8
0.6
0.4
0.3
0.2
0.1
MINERAL RESOURCE – MILL MATERIAL BY NSR CUT-OFF
NSR COG
(C$/t)
Class Mt
Copper
(%)
Gold
(g/t)
Moly
(%)
Silver
(g/t)
CuEq
(%)
6.11
Measured 144.9 0.30 0.38 0.024 2.1 0.64
Indicated 2,114.2 0.14 0.16 0.015 1.4 0.29
M+I 2,259.0 0.15 0.18 0.016 1.4 0.31
30
Measured 102.3 0.35 0.46 0.029 2.3 0.77
Indicated 328.2 0.26 0.29 0.030 2.2 0.52
M+I 430.5 0.28 0.33 0.029 2.2 0.58
Note: See press release dated November 29, 2021. Resource from Casino Copper-Gold 2022 Feasibility Study. See “Notes” in Appendix.
TSX | NYSE AMERICAN | WRN 11
CASINO
PROJECT
OPERATING
MINES
ATTRACTIVE GRADE PROFILE
Copper Molybdenum Gold Silver Strip Ratio
Notes: Peer data based on mineral reserve estimates disclosed in such company’s respective corporate websites or technical reports. CuEq based on US$3.60/lb Cu, US$1,700/oz Au, US$22/oz Ag,
and US$14/lb Mo, with no consideration for metallurgical recovery. See “Notes” in Appendix.
1.19:1
5.56:1
0.74:1
1.49:1
0.43:1
0.26:1
-- 0.10% 0.20% 0.30% 0.40% 0.50% 0.60% 0.70% 0.80%
Mt. Milligan - CG (250 Mt)
Copper Mountain - HBM (367 Mt)
Highland Valley - Teck (263 Mt)
Gibraltar - Taseko (585 Mt)
Casino Mill LOM (1.4 Bt)
Casino Mill Yr 1-4 (174 Mt)
TSX | NYSE AMERICAN | WRN
0.31%
0.35%
0.35%
0.38%
0.41%
0.42%
0.44%
0.45%
0.46%
0.50%
0.51%
0.55%
0.65%
0.66%
0.66%
0.69%
0.77%
Yellowhead
Mason
Berg
North Island
CaĂąariaco
Vizcachitas
Casino (LOM)
Schaft Creek
Josemaria
Los Azules
Cactus
Taca Taca
Copper World
Casino (Year 1-4)
Reko Diq
Galore Creek
MARA
0.26
0.43
0.71
0.98
1.00
1.00
1.13
1.16
1.28
1.33
1.40
1.58
1.66
1.82
2.23
2.33
2.49
Casino (Year 1-4)
Casino (LOM)
North Island
Josemaria
Schaft Creek
Reko Diq
Berg
Los Azules
Mason
CaĂąariaco
Yellowhead
Taca Taca
MARA
Copper World
Cactus
Vizcachitas
Galore Creek
0.13%
0.13%
0.15%
0.16%
0.17%
0.18%
0.20%
0.21%
0.22%
0.23%
0.23%
0.23%
0.23%
0.29%
0.30%
0.33%
0.52%
Vizcachitas
Yellowhead
Mason
Cactus
Berg
CaĂąariaco
Galore Creek
Taca Taca
North Island
Schaft Creek
Copper World
Josemaria
Los Azules
MARA
Casino (LOM)
Reko Diq
Casino (Year 1-4)
THE RIGHT COMBINATION OF GRADE AND STRIP RATIO
12
Grade
(% CuEq)
Strip Ratio
(waste : ore)
Strip-Adjusted Grade
(% CuEq moved, ore + waste)
Good grades and a peer-
leading strip-ratio are key
advantages for the
Casino Project
Notes: CuEq based on US$3.60/lb Cu, US$1,700/oz Au, US$14/lb Mo, and US$22/oz Ag, with no consideration for metallurgical recovery. Strip-adjusted grade calculated as CuEq grade divided by 1 +
strip ratio. Grade and strip data from company filings and S&P Capital IQ. Reko Diq based on historical M&I resource and Barrick’s ‘2022 Conceptual Design’.
TSX | NYSE AMERICAN | WRN
FEASIBILITY STUDY SUMMARY
C$2.33 Billion
NPV
AFTER-TAX (8%)
18.1%
IRR
AFTER-TAX
STRIP RATIO
LOM
0.43:1 3-year
PAYBACK
27 years
MINE LIFE – Mill Operation
$10 Billion
LOM CASH FLOW
AFTER-TAX
Metal Prices: Cu US$3.60/lb Au US$1,700/oz Ag US$22/oz Mo US$14/lb; FX Rate: 1 CAD = US$0.80.
13
Note: Based on Casino Copper-Gold 2022 Feasibility Study at base case metal prices. See “Notes” in Appendix.
TSX | NYSE AMERICAN | WRN
ECONOMIC THROUGHOUT THE COMMODITY CYCLE
14
BASE
CASE
BROKER LT
CONSENSUS
BASE CASE
CAD:USD FX OF
US$0.80
US$3.50 US$3.60 US$4.00 US$4.50 US$5.00 US$5.50 US$6.00
NPV 8% C$1,831 C$1,944 C$2,396 C$2,961 C$3,526 C$4,091 C$4,656
IRR % 16.1% 16.5% 18.2% 20.2% 22.1% 23.9% 25.6%
Payback (yrs) 3.7 3.6 3.3 3.0 2.8 2.6 2.4
NPV 8% C$2,221 C$2,334 C$2,786 C$3,351 C$3,917 C$4,481 C$5,043
IRR % 17.7% 18.1% 19.7% 21.6% 23.5% 25.2% 26.9%
Payback 3.4 3.3 3.0 2.8 2.6 2.4 2.3
NPV 8% C$2,807 C$2,920 C$3,372 C$3,937 C$4,501 C$5,026 C$5,624
IRR % 19.9% 20.3% 21.9% 23.7% 25.5% 27.1% 28.7%
Payback (yrs) 3.0 2.9 2.8 2.6 2.4 2.3 2.1
NPV 8% C$3,294 C$3,407 C$3,859 C$4,423 C$4,985 C$5,547 C$6,108
IRR % 21.7% 22.1% 23.6% 25.4% 27.1% 28.7% 30.3%
Payback (yrs) 2.8 2.7 2.6 2.4 2.3 2.1 2.0
NPV 8% C$3,782 C$3,895 C$4,346 C$4,908 C$5,469 C$6,031 C$6,593
IRR % 23.5% 23.9% 25.3% 27.0% 28.7% 30.2% 31.8%
Payback (yrs) 2.6 2.5 2.4 2.3 2.1 2.0 1.9
NPV 8% C$4,268 C$4,381 C$4,830 C$5,392 C$5,954 C$6,515 C$7,077
IRR % 25.2% 25.6% 27.0% 28.6% 30.2% 31.8% 33.3%
Payback (yrs) 2.4 2.4 2.3 2.4 2.0 1.9 1.9
US$2,750
COPPER PRICE (US$/lb)
GOLD
PRICE
(US$/oz)
US$1,500
US$1,700
US$2,000
US$2,250
US$2,500
Note: Based on Casino Copper-Gold 2022 Feasibility Study. CAD:USD exchange rate of US$0.80. NPV and IRR are shown after-tax. “Broker LT Consensus” based on analyst consensus long-term
commodity price forecasts, as provided by CIBC Capital Markets. See “Notes” in Appendix.
TSX | NYSE AMERICAN | WRN
DE-RISKED THROUGH QUICK PAYBACK
15
CASH FLOW & PRODUCTION PROFILE YEARS 1-4 LIFE-OF-MINE
AVERAGE
ANNUAL CASH
FLOW &
COSTS
Cash Flow (Pre-tax) ($M) C$1,033 C$662
Cash Flow (After-tax) ($M) C$951 C$517
Net Smelter Return ($/t ore milled) C$43.15 C$29.08
Operating Cost ($/t ore milled) C$11.16
AVERAGE
ANNUAL
METAL
PRODUCTION
Copper (Mlbs) 241 163
Gold (kozs) 333 211
Silver (kozs) 1,596 1,277
Molybdenum (Mlbs) 15.5 15.1
Copper Equivalent (Mlbs) 468 329
Gold Equivalent (kozs) 992 697
Note: Based on Casino Copper-Gold 2022 Feasibility Study at base case metal prices. See “Notes” in Appendix.
TSX | NYSE AMERICAN | WRN16
ATTRACTIVE COST PROFILE
CASH COSTS
BY-PRODUCT
COSTS
Copper Cash Cost
Net of By-Product Credits ($/lb)
(US$0.80)
CO-PRODUCT
COSTS
Copper Cash Cost
Co-Product ($/lb)
US$1.54
Gold Cash Cost
Co-Product ($/oz)
US$799
Low strip ratio reduces the amount of waste tonnes moved,
resulting in lower hauling costs (the largest component of
mining costs)
Deposit sits on a hilltop, single large open-pit
Haul profiles are favourable (portion of the planned hauls are
downhill loaded)
Processing costs benefit from medium-softer ore
Throughput of 120,000 tpd, benefits from economies of scale
Note: Based on Casino Copper-Gold 2022 Feasibility Study at base case metal prices. See “Notes” in Appendix.
TSX | NYSE AMERICAN | WRN17
FEASIBILITY STUDY CAPITAL COSTS
PROJECTED CAPITAL COSTS
PROCESS PLANT &
INFRASTRUCTURE
Project Directs (Including Freight) C$2,116
Project Indirects C$431
Contingency C$369
Subtotal C$2,916
MINE Mine Equipment C$433
Mine Pre-production C$228
Subtotal C$661
Owners Costs C$41
SUSTAINING & TOTAL Total Initial Capital C$3,618
Total Sustaining Capital C$751
Total Life-Of-Mine Capital C$4,369
Note: Based on Casino Copper-Gold 2022 Feasibility Study at base case metal prices. See “Notes” in Appendix.
TSX | NYSE AMERICAN | WRN
ESG COMMITMENT
18
Committed to health and safety
and committed to the protection
of cultural values
• Ongoing Engagement with Local
Communities and First Nations
• 16+ Years of Operating Responsibly
in the Yukon
• Co-operation Agreements Signed
with Key First Nations
SOCIAL ENVIRONMENTAL
Committed to exceeding best
practices in protecting the
environment
• Accepted the Robert E Leckie Award
for outstanding Environmental
stewardship
• Committed to MAC’s Towards
Sustainable Mining (TSM) initiative
Committed to high ethical
standards and building
long term value
• Corporate Disclosure Policy
• Safety, Health & Environmental Policy
• Whistleblower Policy
• Insider Trading Policy
GOVERNANCE
SUPPORTING
• Yukon community food security
• Yukon-wide sport and culture
• Yukon-wide mental health support
• Industry association support
• Reconciliation
• Yukon First Nations cultural awareness
• Yukon-wide health care
• Yukon education and family literacy
TSX | NYSE AMERICAN | WRN
ACCESS ROAD FUNDING
Construction of the road started in early 2022,
with the first 5 km completed late 2023
19
C$130
Million
Yukon Resource Gateway Project funding
the Casino Copper-Gold Access Road
Federal government has committed
funding towards the construction of a 120
km road to access the Casino Project
TSX | NYSE AMERICAN | WRN
GOVERNMENT-LED INITIATIVE SECURES PORT ACCESS
20
In March 2023, the Yukon government signed an MOU with Municipality of Skagway to
secure long-term tidewater access for Yukon’s mining industry
Term sheet outlining an export cooperation agreement signed in
September 2023
The Yukon government has included C$44.7M in its capital plan
in 2025-28, with C$21.3M approved by the legislature in
November 2023
Facility recently shipped Minto mine’s copper concentrate
Port is 560 km from the Casino Project
C$45
Million
Yukon government investing in Marine Services
Platform as part of Skagway Port Redevelopment
TSX | NYSE AMERICAN | WRN
Casino’s base case is to use an LNG power plant
The Yukon grid is beyond capacity, with 22 rental diesel
generators addressing the shortfall; frequent power outages
Canada’s Critical Minerals Infrastructure Fund conditionally
approved C$40M to advance the BC-Yukon Grid Connect
Project: connecting the capacity-constrained Yukon grid
to the North American grid in BC
Major endorsement of the Casino Project; aligns Casino’s 130 MW load (which helps justify the Grid
Connect Project), with the government’s efforts to provide secure and sustainable energy to the Yukon
A pathway to hydroelectric grid power is transformative for the Casino Project
PROGRESS ON YUKON-BC GRID INTERCONNECTION
21
C$40
Million
Critical Minerals Infrastructure Fund investing in
BC-Yukon Grid Connect Project
763 km of new
transmission
line
“Developments like these help mines get built faster, and they are a key element in seizing the
generational opportunity before us. These investments are needed to support critical minerals
development in the region, improve community access and safety, and create good mining
jobs…” – The Honourable Jonathan Wilkinson, Minister of Energy and Natural Resources
TSX | NYSE AMERICAN | WRN
CASINO PERMITTING TIMELINE
22
TASK YEAR 1 YEAR 2 YEAR 3 YEAR 4
YESAB Process Establish Panel
Technical Analysis
Public Hearings
Panel Report
Decision
Land use
Permit for
Casino Road
Preparation
Obtain Permits
Type A Water
Use License
Preparation
Water Board Process
Quartz Mining
License
Preparation
QML to Initiate Construction
QML Amendment for
Operations
Schedule 2
Amendment
Preparation
ECCC Process
Fisheries Act
Authorization
Preparation
DFO Process
Potential
Construction Start
TSX | NYSE AMERICAN | WRN23
INVESTMENT HIGHLIGHTS
Multi-decade copper and gold resource
High-grade core leads to quick payback
Low strip ratio drives attractive cost profile
Significant leverage to rising commodity prices
Yukon is supportive mining district
De-risking through permitting
Improving infrastructure backdrop through government initiatives
Major endorsements and partnerships
Immense scarcity value of similar projects
TSX | NYSE AMERICAN | WRN
APPENDIX
TSX | NYSE AMERICAN | WRN
SIGNIFICANT POSITIVE ECONOMIC IMPACT ON THE YUKON
Over the life-of-mine, the Casino Project is
estimated to:
• Contribute C$44.3 billion to Canada’s GDP
• Create 132,280 full-time equivalent positions
• Generate C$12.8 billion in wages and salaries
• Generate C$11.2 billion in taxes and royalties to various
governments
25
Each year, the Casino Project is estimated to:
• Contribute C$1.3 billion to Yukon’s economy
• Contribute C$1.5 billion to Canada’s GDP through operation
of the mine
• Creating 3,880 full-time equivalent positions
• Generate C$391 million in wages and salaries across
Canada
Economic Impact of the
development of Casino Copper-Gold
on the Yukon and Canada
Note: See press release dated February 2, 2023.
TSX | NYSE AMERICAN | WRN
TECHNICAL COLLABORATION
Tailings Facility Redesign
Reduced Risk, Reduced Environmental
Impact and Improved Safety
26
Redesign incorporates the outcomes of the BATT study – a
collaboration with First Nations, YESAB, and Yukon government
Substantial reduction in the quantity of free-standing water
impounded during operations
PAG tailings moved to the back of the
facility protected by Waste Rock and
Main Embankment
Closure by rock/sand cover limiting
the need for tailings “pond”
Several other changes to the design
to reduce construction risk
Note: Based on Casino Copper-Gold 2022 Feasibility Study. See “Notes” in Appendix.
TSX | NYSE AMERICAN | WRN
PROPERTY GEOLOGY
27
Note: Based on Casino Copper-Gold 2022 Feasibility Study. See “Notes” in Appendix.
TSX | NYSE AMERICAN | WRN
MINING
Pit designs for five mining phases were developed to
produce 45.4 Mtpa of mill feed ore
Mill material is limited to 1.2 Bt due to TMF capacity
The pits were designed with 40 m wide ramps, 20 m
benches
Pit slope angles of 45 degree for most of the pit, with
some areas at 42 degrees
Komatsu 980E or similar haul trucks (370 t class)
Floating cone based on US$1.75/lb Cu, US$835/oz Au
– very low prices as pit is constrained by TMF capacity
Pit is electrified to power shovels and drills
Strip ratio is 0.43:1 over the life-of-mine
28
Note: Based on Casino Copper-Gold 2022 Feasibility Study. See “Notes” in Appendix.
TSX | NYSE AMERICAN | WRN
PROCESSING
Milling
• Throughput: Average life-of-mine 120,000 tpd
• Grinding Circuit: 40 ft SAG Mill (29 MW) + 2 x 28 ft Ball Mills
(22 MW each)
• Medium – soft ore: BWi – 14.5 kWh/t, 200 µm primary grind
Flotation
• Conventional copper/moly circuit
• Recoveries: Copper 86%, Gold 67%, Moly 71%, Silver 53%
• Sulfide removal circuit to produce suitable tailings for dam
construction
Heap Leach
• Conventional crush/conveyer stack valley fill heap leach
• 25,000 tpd
• SART to remove copper from solution
• Recoveries: Gold 80%, Silver 26%, Copper 18%
29
Note: Based on Casino Copper-Gold 2022 Feasibility Study. See “Notes” in Appendix.
TSX | NYSE AMERICAN | WRN
EXCELLENT CONCENTRATE QUALITY
30
COPPER
CONCENTRATE
ELEMENT AVG VALUE UNIT
Copper 28 %
Gold 25 g/t
Silver 120 g/t
Molybdenum 0.05 %
Iron 26 %
Sulphur 36 %
Arsenic 200 g/t
Antimony 250 g/t
Mercury 1 g/t
Cadmium 40 g/t
Fluorine 100 g/t
Silica 2 %
MOLYBDENUM
CONCENTRATE
ELEMENT AVG VALUE UNIT
Molybdenum 57.4 %
Copper 0.39 %
Rhenium 133.5 g/t
Iron 0.8 %
Sulphur 37.9 %
Arsenic 1,659 g/t
Antimony 100 g/t
Mercury <1 g/t
Cadmium 3 g/t
Fluorine ND g/t
Silica 1.74 %
Note: Based on Casino Copper-Gold 2022 Feasibility Study. See “Notes” in Appendix.
TSX | NYSE AMERICAN | WRN
FEASIBILITY STUDY OPERATING COST
31
LOM
($/TONNE)
MILLING
OPERATION
Milling C$6.42
Mining C$4.28
General & Administrative C$0.46
Total C$11.16
HEAP LEACH
OPERATION
Heap Leach Operation C$1.93
ADR/SART C$4.80
Total C$6.73
Note: Based on Casino Copper-Gold 2022 Feasibility Study. See “Notes” in Appendix.
TSX | NYSE AMERICAN | WRN
ENTERPRISE VALUE/COPPER EQUIVALENT RESOURCE
BENCHMARKING (US¢/lb CuEq)
32
¢14.72
¢10.29
¢1.89
¢1.53 ¢1.48
¢1.22
¢1.13
¢0.92
¢0.81 ¢0.76 ¢0.71
¢0.61
¢0.52
¢0.23 ¢0.22 ¢0.19
Marimaca
(Marimaca)
Ivanhoe
(Santa
Cruz)
Solaris
(Waromtza)
Trilogy
(Artic)
Cordoba
(San
Matias)
Atex
(Valeriano)
Seabridge
(KSM)
SolGold
(Cascabel)
Northisle
(North
Island)
Arizona
Sonoran
(Cactus)
Western
Copper
(Casino)
Panoro
(Cotabambas)
Los
Andes
(Vizcachitas)
Highland
Copper
(Copperwood)
Alta
(CaĂąariaco
Norte)
Northern
Dynasty
(Pebble)
WRN is undervalued with greater growth
opportunity compared to its peers
WESTERN
COPPER & GOLD
Note: Data from S&P CapIQ and company filings. CuEq resource calculated using US$3.60/lb Cu, US$1,700/oz Au, US$14/lb Mo, and $22/oz Ag.
TSX | NYSE AMERICAN | WRN
x
157
144
--
20
40
60
80
100
120
7th LARGEST UNDEVELOPED COPPER-GOLD PROJECT
CONTROLLED BY A JUNIOR
33
CASINO
COPPER-GOLD PROJECT
Junior controlled copper project
Major controlled copper project
WRN’s Casino Copper-Gold project
Ecuador
Argentina
Chile
Ecuador
Peru
Yukon
Alaska
BC
BC
Philippines
BC
Argentina
COPPER
EQUIVALENT
(B
LBS)
Chile
Chile
Note: Data from S&P CapIQ and company filings.
TSX | NYSE AMERICAN | WRN
--
$5,000
$10,000
$15,000
$20,000
$25,000
$30,000
$35,000
$40,000
$45,000
COPPER DEVELOPMENT PROJECT CAPITAL INTENSITY
34
CASINO
COPPER-GOLD PROJECT
INITIAL
CAPITAL
INTENSITY
(US$/TPA
AVERAGE
CUEQ)
WRN Feasibility Pre-Feasibility PEA
Notes: Data from S&P CapIQ on select copper or copper-gold projects. CuEq production calculated using US$3.60/lb Cu, US$1,700/oz Au, US$14/lb Mo, and $22/oz Ag.
TSX | NYSE AMERICAN | WRN
x
35
COPPER DEVELOPMENT TRANSACTIONS
ANALYST CONSENSUS PRICE / NAV MULTIPLES
0.92x
0.79x
0.58x
0.34x
1.03x
0.75x
0.71x
0.25x
0.30x
0.73x
-- 0.20x 0.40x 0.60x 0.80x 1.00x
BHP - 50% Josemaria (Lundin) (US$0.7 Bn)
Lundin Mining / BHP - Filo (US$3.0 Bn)
MACH Metals Australia - Rex Minerals (US$0.2 Bn)
Silvercorp - Adventus (US$0.1 Bn)
Glencore - 56.25% MARA (Pan American) (US$0.5 Bn)
Harmony Gold - Eva (Copper Mountain) (US$0.2 Bn)
Agnico - San NicolĂĄs (Teck) (US$0.2 Bn)
SolGold - Cornerstone (US$0.1 Bn)
Lundin Mining - Josemaria (US$0.5 Bn)
Capstone - 30% Santo Domingo (KORES) (US$0.1 Bn)
Median: 0.72x
Note: Data from public disclosure. Based on transactions since 2021, where the target is a copper project / company.
TSX | NYSE AMERICAN | WRN
ANA AND CASINO B
36
Note: See “Notes” in Appendix
Significant exploration potential to the
west of the pit
Both copper targets similar to Casino
and gold targets similar to the Coffee
deposit to the north
TSX | NYSE AMERICAN | WRN
2022 CASINO COPPER-GOLD RESOURCE
Source: Casino Copper-Gold 2022 Feasibility Study. See “Notes” in Appendix. 37
MILL RESOURCE ($6.11/t NSR CUTOFF)
Class Mt
NSR
(C$/t)
Copper
(%)
Gold
(g/t)
Moly
(%)
Silver
(g/t)
CuEq
(%)
Copper
(M lb)
Gold
(M oz)
Moly
(M lb)
Silver
(M oz)
Measured 144.9 40.09 0.30 0.38 0.024 2.1 0.64 953 1.8 75.2 9.6
Indicated 2,114.2 20.34 0.14 0.16 0.015 1.4 0.29 6,493 11.1 716.0 93.5
M+I 2,259.0 21.60 0.15 0.18 0.016 1.4 0.31 7,446 12.9 791.2 103.1
Inferred 1,371.5 15.41 0.10 0.14 0.009 1.1 0.21 3,029 6.1 286.0 50.5
HEAP LEACH RESOURCE ($6.61/t NSR CUT-OFF)
Class Mt
NSR
(C$/t)
Copper
(%)
Gold
(g/t)
Silver
(g/t)
AuEq
(g/t)
Copper
(M lb)
Gold
(M oz)
Silver
(M oz)
Measured 43.3 23.79 0.05 0.44 2.7 0.47 51.5 0.62 3.7
Indicated 188.4 11.47 0.04 0.21 1.7 0.23 145.4 1.27 10.4
M+I 231.7 13.77 0.04 0.25 1.9 0.27 196.9 1.88 14.1
Inferred 40.9 11.33 0.05 0.20 1.4 0.22 46.9 0.27 1.9
TSX | NYSE AMERICAN | WRN
2022 CASINO COPPER-GOLD RESOURCE
38
TOTAL RESOURCE (MILL + HEAP LEACH)
Class Mt
NSR
(C$/t)
Copper
(%)
Gold
(g/t)
Silver
(g/t)
Copper
(M lb)
Gold
(M oz)
Silver
(M oz)
Measured 188.2 36.34 0.24 0.40 2.2 1,005.0 2.4 13.3
Indicated 2,302.6 19.61 0.13 0.17 1.4 6,638.1 12.4 103.9
M+I 2,490.7 20.88 0.14 0.18 1.5 7,643.1 14.8 117.2
Inferred 1,412.5 15.30 0.10 0.14 1.2 3,075.5 6.3 52.3
Source: Casino Copper-Gold 2022 Feasibility Study. See “Notes” in Appendix.
TSX | NYSE AMERICAN | WRN
2022 CASINO COPPER-GOLD RESERVE
39
MILL RESERVE
Class Mt
NSR
(C$/t)
Copper
(%)
Gold
(g/t)
Moly
(%)
Silver
(g/t)
CuEq
(%)
Copper
(M lb)
Gold
(M oz)
Moly
(M lb)
Silver
(M oz)
Proven 140.1 38.50 0.31 0.39 0.024 2.1 0.67 944 1.8 74.9 9.4
Probable 1,076.9 23.68 0.17 0.19 0.021 1.6 0.36 4,135 6.7 497.1 55.5
P+P 1,217.1 25.38 0.19 0.22 0.021 1.7 0.40 5,079 8.5 571.9 64.9
HEAP LEACH RESERVE
Class Mt
NSR
(C$/t)
Gold
(g/t)
Copper
(%)
Moly
(%)
Silver
(g/t)
AuEq
(g/t)
Gold
(M oz)
Copper
(M lb)
Moly
(M lb)
Silver
(M oz)
Proven 42.9 22.52 0.45 0.055 N/A 2.7 0.47 0.62 51.8 N/A 3.7
Probable 166.8 11.14 0.22 0.031 N/A 1.8 0.23 1.17 113.5 N/A 9.4
P+P 209.6 13.47 0.26 0.036 N/A 1.9 0.28 1.78 165.3 N/A 13.1
Source: Casino Copper-Gold 2022 Feasibility Study. See “Notes” in Appendix.
TSX | NYSE AMERICAN | WRN
NOTES
Technical report entitled “Casino Copper-Gold Project, Form 43-101 F1
Technical Report Feasibility Study” dated June 13, 2022, a copy of which is
available on the Company's website at www.westerncopperandgold.com.
Prepared by: Daniel Roth, P.Eng.; Laurie Tahija, MMSA-QP; Patrick Dugan,
P.E.; Mike Hester, F Aus IMM; John M. Marek, P.Eng.; Carl Schulze, P.Geo.;
Daniel Friedman, P.Eng; Scott Weston, P.Geo; each of whom is a qualified
person pursuant to National Instrument 43-101 ("Qualified Person")
Mineral Resources
• The Mineral Resources have an effective date of 29 April 2022 and
the estimate was prepared using the definitions in CIM Definition Standards
(10 May 2014).
• All figures are rounded to reflect the relative accuracy of the estimate and
therefore numbers may not appear to add precisely.
• Mineral Resources that are not Mineral Reserves do not have demonstrated
economic viability.
• Mineral Resources for leach material are based on prices of US$3.50/lb
copper, US$1,650/oz gold and US$22/oz silver
• Mineral Resources for mill material are based on prices of US$3.50/lb
copper, US$1,650/oz gold, US$22/oz silver, and US$12.00/lb moly.
• Mineral Resources are based on NSR cut-off of C$6.61/t for leach material
and C$6.11/t for mill material.
• NSR value for leach material is as follows:
- NSR (C$/t) = $15.21 x copper (%) + $50.51 x gold (g/t) + $0.210 x silver (g/t), based
on copper recovery of 18%, gold recovery of 80% and silver recovery of 26%.
40
“Casino Copper-Gold Feasibility Study” • NSR value for hypogene sulphide mill material is:
- NSR (C$/t) = $73.81 x copper (%) + $41.16 x gold (g/t) + $213.78 x moly (%) +
0.386 x silver (g/t), based on recoveries of 92.2% copper, 66% gold, 50% silver
and 78.6% moly.
• NSR value for supergene mill material is:
- NSR (C$/t) = $80.06 x recoverable copper (%) + $43.03 x gold (g/t) + $142.11 x
moly (%) + 0.464 x silver (g/t), based on recoveries of 69% gold, 60% silver and
52.3% moly. Recoverable copper = 0.94 x (total copper – soluble copper).
• Mineral Resources are reported in relation to a conceptual constraining
pit shell in order to demonstrate reasonable prospects for eventual
economic extraction, as required by the definition of Mineral Resource in
NI 43-101; mineralization lying outside of the pit shell is excluded from
the Mineral Resource.
• AuEq and CuEq values are based on prices of US$3.50/lb copper,
US$1,650/oz gold, US$22/oz silver, and US$12.00/lb moly, and account
for all metal recoveries and smelting/refining charges.
• The NSR calculations also account for smelting and refining charges and
payables.
TSX | NYSE AMERICAN | WRN
NOTES
Mineral Reserve
• The Mineral Reserve estimate has an effective date of June 13, 2022 and
was prepared using the CIM Definition Standards (10 May 2014).
• Columns may not sum exactly due to rounding.
• Mineral Reserves are based on commodity prices of US$3.25/lb Cu,
US$1,550/oz Au, US$12.00/lb Mo, and US$22.00/oz Ag.
• Mineral Reserves amenable to milling are based on NSR cutoffs that vary by
time period to balance mine and plant production capacities. They range from
a low of $6.11/t to a high of $25.00/t.
• NSR value for supergene (SOX and SUS) mill material is
- NSR (C$/t) = $73.63 x recoverable copper (%) + $40.41 x gold (g/t) + $142.11 x moly (%)
+ 0.464 x silver (g/t), based on recoveries of 69% gold, 52.3% molybdenum and 60%
silver. Recoverable copper = 0.94 x (total copper – soluble copper).
• NSR value for hypogene (HYP) mill material is
- NSR (C$/t) = $67.88 x copper (%) + $38.66 x gold (g/t) + $213.78 x moly (%) + $0.386 x
silver (g/t), based on recoveries of 92.2% copper, 66% gold, 78.6% molybdenum and 50%
silver.
• Mineral Reserves amenable to heap leaching are based on an NSR cutoff of
$6.61/t.
41
“Casino Copper-Gold Feasibility Study”
Other technical information in this presentation:
• NSR value for leach material is
- NSR (C$/t) = $14.05 x copper (%) + $47.44 x gold (g/t) + $0.210 x silver (g/t), based
on recoveries of 18% copper, 80% gold and 26% silver.
• AuEq and CuEq values are based on prices of US$ 3.25/lb Cu,
US$1,550/oz Au, US$12.00/lb Mo, and US$22.00/oz Ag, and account for
all metal recoveries and smelting/refining charges.
• The NSR calculations also account for smelter/refinery treatment charges
and payables.
Technical information regarding the Casino Copper-Gold Project contained
in this presentation is based on the Casino Copper-Gold 2022 FS prepared
by or under the supervision of the Qualified Persons noted previously.
Copper equivalent calculations in this presentation, not associated with the
Casino mineral resource or reserve, are based on: US$3.60/lb copper;
US$1,700/oz gold; US$14/lb molybdenum; and US$22/oz silver with no
accounting for metallurgical recovery.
TSX | NYSE AMERICAN | WRN
info@westerncopperandgold.com
604 684 9497
www.westerncopperandgold.com

WRN_Corporate_Presentation_December 2024.pdf

  • 1.
    DEVELOPING CANADA’S LARGEST CRITICAL MINERALS PROJECT TSXWRN NYSE AMERICAN WRN Corporate Presentation | December 2024
  • 2.
    TSX | NYSEAMERICAN | WRN CAUTIONARY NOTES The information provided in this presentation is not intended to be a comprehensive review of all matters and developments concerning Western Copper and Gold Corporation and its subsidiaries (collectively, the “Company”). This document should be read in conjunction with all other disclosure documents of the Company. No securities commission or regulatory authority has reviewed the accuracy or adequacy of the information presented herein. Note Regarding Forward-Looking Statements Certain of the statements and information in this presentation constitute “forward-looking statements” within the meaning of the United States Private Securities Litigation Reform Act of 1995 and “forward-looking information” within the meaning of applicable Canadian securities laws (together referred to herein as “forward- looking statements”). Any statements or information that express or involve discussions with respect to predictions, expectations, beliefs, plans, projections, objectives, assumptions, or future events or performance (often, but not always, using words or phrases such as “expects”, “is expected”, “anticipates”, “believes”, “plans”, “projects”, “estimates”, “assumes”, “intends”, “strategies”, “targets”, “goals”, “forecasts”, “objectives”, “budgets”, “schedules”, “potential” or variations thereof or stating that certain actions, events or results “may”, “could”, “would”, “might” or “will” be taken, occur or be achieved, or the negative of any of these terms and similar expressions) are not statements of historical fact and may be forward-looking statements. Such statements include, but are not limited to, statements regarding mineral reserve and mineral resource estimates, planned exploration and development activities, corporate objectives, the economic prospects of the Company’s projects, the Company’s future plans or future revenues, and timing of development, or potential expansions or improvements. The forward-looking statements are necessarily based on a number of estimates, assumptions, beliefs, expectations and opinions of management as of the date of this presentation that, while considered reasonable by management, are inherently subject to significant business, economic and competitive uncertainties and contingencies. These estimates, assumptions, beliefs, expectations and opinions include, without limitation, with respect to any mineral reserve or mineral resource estimate, the key assumptions and parameters on which such estimates are based, prevailing and projected market prices and foreign exchange rates, projected capital and operating costs, continued availability of capital and financing, availability of equipment and personnel required for construction and operations, the Company not experiencing unforeseen delays, unexpected geological or other effects, equipment failures, permitting delays, and general economic, market or business conditions. Forward-looking statements are subject to known and unknown risks and uncertainties which could cause actual results to differ materially from estimated results. Such risks and uncertainties include, but are not limited to, the Company’s ability to raise sufficient capital to fund development; changes in general economic conditions or financial markets, changes in prices for the Company’s mineral products or increases in input costs; uncertainties relating to interpretation of drill results and the geological continuity and grade of mineral deposits; that mineral resources and mineral reserves are not as estimated; risks related to cooperation of government agencies and First Nations in the exploration and development of the property; litigation; legislative, environmental and other judicial, regulatory, political and competitive developments in Canada; technological and operational difficulties or inability to obtain permits encountered in connection with exploration and development activities; labour relations matters, changing foreign exchange rates, and other factors described under the heading “Risk Factors” in the Company’s annual information form for the most recently completed financial year and its other publicly filed disclosure documents. This list is not exhaustive of the factors that may affect any of the Company’s forward- looking statements. Although the forward-looking statements contained in this presentation are based upon what management believes are reasonable assumptions, there can be no assurance that actual results will be consistent with these forward- looking statements. All forward-looking statements in this presentation are qualified by this cautionary note. Accordingly, readers should not place undue reliance on such statements. Other than as specifically required by applicable laws, the Company is under no obligation and expressly disclaims any such obligation to update or alter the forward-looking statements whether as a result of new information, future events or otherwise. These forward- looking statements are made as of the date of this presentation. Note to U.S. Readers/Investors Information regarding the Company’s mining operations included in this presentation has been prepared in accordance with the requirements of the securities laws in effect in Canada, which differ in certain material respects from the disclosure requirements of United States securities laws applicable to domestic United States issuers. The terms “mineral reserve”, “proven mineral reserve” and “probable mineral reserve” are Canadian mining terms as defined in accordance with Canadian National Instrument 43-101 – Standards of Disclosure for Mineral Projects (“NI 43-101”) and the Canadian Institute of Mining, Metallurgy and Petroleum (the “CIM”) Definition Standards for Mineral Resources and Mineral Reserves, adopted by the CIM Council, as amended. NI 43-101 is a rule developed by the Canadian Securities Administrators that establishes standards for all public disclosure an issuer makes of scientific and technical information concerning mineral projects. The definitions of these terms and other mining terms, such as “inferred mineral resource”, differ from the definitions of such terms, if any, for purposes of the disclosure requirements of the U.S. Securities and Exchange Commission (the “SEC”). Accordingly, information in this presentation describing the Company’s mineral deposits may not be comparable to similar information made public by issuers subject to the SEC’s reporting and disclosure requirements applicable to domestic United States issuers. Note Regarding Inferred Mineral Resources Under Canadian rules, estimates of inferred mineral resources are considered too speculative geologically to have the economic considerations applied to them to enable them to be categorized as mineral reserves and, accordingly, may not form the basis of feasibility or pre- feasibility studies, or economic studies except for a preliminary economic assessment as defined under NI 43-101. Investors are cautioned not to assume that part or all of an inferred mineral resource exists or is economically or legally mineable. Mineral resources that are not mineral reserves do not have demonstrated economic viability. 2
  • 3.
    TSX | NYSEAMERICAN | WRN CORPORATE OVERVIEW 3 CAPITAL STRUCTURE LISTINGS TSX, NYSE American WRN FINANCIALS (Sept 30, 2024) Cash & Investments C$74.9M Debt Nil SHARE STRUCTURE (Nov 29, 2024) Share Price C$1.57 Market Cap C$311M Shares Outstanding 198.2M Options, Warrants, RSU/DSU 11.7M OWNERSHIP TOP SHAREHOLDERS (Public Disclosure) Rio Tinto 9.7% Management & Board 4.8% Fidelity 4.5% Mitsubishi Materials 4.1% Konwave AG 3.9% Kopernik Global Investors 3.2% Franklin Resources 2.4% Claret Asset Management 1.9% EdgePoint Investment Group 1.2% Herr Investment Group 0.8% ANALYST COVERAGE (Average Target Price = C$4.40) Source: Average analyst target price as of November 13, 2024; based on Agentis (n/a), Cormark (C$4.00), Eight (C$4.25), HCW (US$4.25), and National Bank (C$3.50).
  • 4.
    TSX | NYSEAMERICAN | WRN INVESTMENT HIGHLIGHTS CLEAR INVESTMENT THESIS • One of the largest copper-gold projects globally • Located in the Yukon – supportive mining district • Recent Feasibility Study shows robust economics and long mine life • Strong fundamentals for copper and gold CONTINUING TO ADD VALUE • Significant resource expansion in 2020 • PEA released in 2021 • Feasibility Study released in 2022 • Strategic investments from Rio Tinto and Mitsubishi • Permitting work progressing TSX | NYSE AMERICAN | WRN 4
  • 5.
    TSX | NYSEAMERICAN | WRN STRATEGIC INVESTMENTS 5 RIO TINTO KEY RIGHTS Rio Tinto has the right to appoint: • A member to Casino Copper-Gold Technical and Sustainability Committee • A non-voting board observer • One director and three secondees to assist with the Casino Project, if Rio Tinto’s ownership increases to at least 12.5% Key rights expire in May 2025 Mitsubishi has the right to appoint: • A member to Casino Copper-Gold Technical and Sustainability Committee • One director, if Mitsubishi’s ownership increases to at least 12.5% • Right of first negotiation to offtake proportionate share of minerals produced Key rights expire in March 2025 MITSUBISHI KEY RIGHTS C$25.6M C$2.3M C$6.0M Top-up April 2023 New rights Nov 2023 C$0.3M Top-up March 2024 C$5.0M Top-up April 2024 C$21.3M Investment: March 2023 Average Cost: C$2.63 Note: For further information on the investor rights agreements with Rio Tinto and Mitsubishi, refer to the press releases dated November 8, 2023 and March 24, 2023, respectively. Initial Investment: May 2021 Average Cost: C$2.07
  • 6.
    TSX | NYSEAMERICAN | WRN 15.0 17.5 20.0 22.5 25.0 27.5 30.0 32.5 35.0 2020 2021 2022 2023 2024 2025 2026 2027 2028 2029 2030 2031 2032 2033 2034 2035 Copper (Mt) Operating Committed Primary Demand 7.7Mt DEMAND DRIVERS THE WORLD NEEDS A LOT MORE COPPER 6 Copper demand is expected to grow by 70% to >50Mtpa by 2050 Solid foundation from traditional demand; global energy transition and digital revolution are megatrends accelerating growth Despite >$107B of investment in Tier 1 copper projects over the last decade, the supply gap has grown from 4.7Mt to 7.7Mt • Even with the most optimistic supply forecasts (assuming development of all probable projects), a significant supply gap is evident Between 30-50% of supply will face grade decline and ageing challenges over the next decade; higher costs and increased capital reinvestment A LARGE & GROWING SUPPLY GAP Traditional Economic Growth Energy Transition Digital EVs Electrification Solar / Wind Grid storage Grid augmentation Data centers 5G Internet of things Artificial intelligence Blockchain Replacement demand Emerging markets 15.0 17.5 20.0 22.5 25.0 27.5 30.0 32.5 35.0 2020 2021 2022 2023 2024 2025 2026 2027 2028 2029 2030 2031 2032 2033 2034 2035 Copper (Mt) Operating Committed Primary Demand 7.7Mt Source: S&P Market Intelligence, CRU, Wood Mackenzie, BHP analysis.
  • 7.
    TSX | NYSEAMERICAN | WRN AN ATTRACTIVE COPPER-GOLD MINE 7 Metal Value Distribution in the M&I Mill Resource 46% COPPER 34% GOLD 4% SILVER 17% MOLYBDENUM COPPER GOLD 7.6 Billion lbs M+I Resources +3.1 Billion lbs Inferred Resources 14.8 Million oz M+I Resources +6.3 Million oz Inferred Resources Source: Based on Casino Copper-Gold 2022 Feasibility Study. Metal value distribution based on US$3.60/lb Cu, US$1,700/oz Au, US$14/lb Mo, and US$22/oz Ag. See “Notes” in Appendix.
  • 8.
    TSX | NYSEAMERICAN | WRN CASINO COPPER-GOLD PROJECT
  • 9.
    TSX | NYSEAMERICAN | WRN LONG SECTION OF THE CASINO COPPER-GOLD DEPOSIT 9 HEAP LEACH RESERVE 209.6 million tonnes at 0.28 g/t AuEq (P&P) MILL RESERVE 1.22 billion tonnes at 0.40% CuEq (P&P) CORE ZONE Pit Outline CuEq (%) 1.0 0.8 0.6 0.4 0.3 0.2 0.1 Mill Reserve underpins Casino’s long mine life There is a higher grade subset of mineralization in the center of the deposit that will be mined early on during operations Core Zone leads to very quick payback – milled grade of 0.66% CuEq and extremely low strip ratio of 0.26:1 in Year 1-4 Notes: Looking north, north longitudinal section +6958634.51. CuEq based on US$3.60/lb Cu, US$1,700/oz Au, US$14/lb Mo, and US$22/oz Ag. Based on Casino Copper-Gold 2022 Feasibility Study.
  • 10.
    TSX | NYSEAMERICAN | WRN CLOSER LOOK AT THE HIGHER GRADE CORE ZONE Results confirmed or improved upon historical drilling 800 m x 500 m zone in the centre of the deposit Primarily breccia geology Grades within in the Core Zone are significantly higher compared to the overall resource grade Previous intercept of 689 m at 0.91% CuEq (from 9.1 m), including 100 m at 3.20% CuEq in hole 93-185 10 DDH21-09 65.8 m at 2.53% CuEq (from 10.6 m) DDH21-07 289.6 m at 1.01% CuEq (from 36.6 m) CuEq 1.0 0.8 0.6 0.4 0.3 0.2 0.1 MINERAL RESOURCE – MILL MATERIAL BY NSR CUT-OFF NSR COG (C$/t) Class Mt Copper (%) Gold (g/t) Moly (%) Silver (g/t) CuEq (%) 6.11 Measured 144.9 0.30 0.38 0.024 2.1 0.64 Indicated 2,114.2 0.14 0.16 0.015 1.4 0.29 M+I 2,259.0 0.15 0.18 0.016 1.4 0.31 30 Measured 102.3 0.35 0.46 0.029 2.3 0.77 Indicated 328.2 0.26 0.29 0.030 2.2 0.52 M+I 430.5 0.28 0.33 0.029 2.2 0.58 Note: See press release dated November 29, 2021. Resource from Casino Copper-Gold 2022 Feasibility Study. See “Notes” in Appendix.
  • 11.
    TSX | NYSEAMERICAN | WRN 11 CASINO PROJECT OPERATING MINES ATTRACTIVE GRADE PROFILE Copper Molybdenum Gold Silver Strip Ratio Notes: Peer data based on mineral reserve estimates disclosed in such company’s respective corporate websites or technical reports. CuEq based on US$3.60/lb Cu, US$1,700/oz Au, US$22/oz Ag, and US$14/lb Mo, with no consideration for metallurgical recovery. See “Notes” in Appendix. 1.19:1 5.56:1 0.74:1 1.49:1 0.43:1 0.26:1 -- 0.10% 0.20% 0.30% 0.40% 0.50% 0.60% 0.70% 0.80% Mt. Milligan - CG (250 Mt) Copper Mountain - HBM (367 Mt) Highland Valley - Teck (263 Mt) Gibraltar - Taseko (585 Mt) Casino Mill LOM (1.4 Bt) Casino Mill Yr 1-4 (174 Mt)
  • 12.
    TSX | NYSEAMERICAN | WRN 0.31% 0.35% 0.35% 0.38% 0.41% 0.42% 0.44% 0.45% 0.46% 0.50% 0.51% 0.55% 0.65% 0.66% 0.66% 0.69% 0.77% Yellowhead Mason Berg North Island Cañariaco Vizcachitas Casino (LOM) Schaft Creek Josemaria Los Azules Cactus Taca Taca Copper World Casino (Year 1-4) Reko Diq Galore Creek MARA 0.26 0.43 0.71 0.98 1.00 1.00 1.13 1.16 1.28 1.33 1.40 1.58 1.66 1.82 2.23 2.33 2.49 Casino (Year 1-4) Casino (LOM) North Island Josemaria Schaft Creek Reko Diq Berg Los Azules Mason Cañariaco Yellowhead Taca Taca MARA Copper World Cactus Vizcachitas Galore Creek 0.13% 0.13% 0.15% 0.16% 0.17% 0.18% 0.20% 0.21% 0.22% 0.23% 0.23% 0.23% 0.23% 0.29% 0.30% 0.33% 0.52% Vizcachitas Yellowhead Mason Cactus Berg Cañariaco Galore Creek Taca Taca North Island Schaft Creek Copper World Josemaria Los Azules MARA Casino (LOM) Reko Diq Casino (Year 1-4) THE RIGHT COMBINATION OF GRADE AND STRIP RATIO 12 Grade (% CuEq) Strip Ratio (waste : ore) Strip-Adjusted Grade (% CuEq moved, ore + waste) Good grades and a peer- leading strip-ratio are key advantages for the Casino Project Notes: CuEq based on US$3.60/lb Cu, US$1,700/oz Au, US$14/lb Mo, and US$22/oz Ag, with no consideration for metallurgical recovery. Strip-adjusted grade calculated as CuEq grade divided by 1 + strip ratio. Grade and strip data from company filings and S&P Capital IQ. Reko Diq based on historical M&I resource and Barrick’s ‘2022 Conceptual Design’.
  • 13.
    TSX | NYSEAMERICAN | WRN FEASIBILITY STUDY SUMMARY C$2.33 Billion NPV AFTER-TAX (8%) 18.1% IRR AFTER-TAX STRIP RATIO LOM 0.43:1 3-year PAYBACK 27 years MINE LIFE – Mill Operation $10 Billion LOM CASH FLOW AFTER-TAX Metal Prices: Cu US$3.60/lb Au US$1,700/oz Ag US$22/oz Mo US$14/lb; FX Rate: 1 CAD = US$0.80. 13 Note: Based on Casino Copper-Gold 2022 Feasibility Study at base case metal prices. See “Notes” in Appendix.
  • 14.
    TSX | NYSEAMERICAN | WRN ECONOMIC THROUGHOUT THE COMMODITY CYCLE 14 BASE CASE BROKER LT CONSENSUS BASE CASE CAD:USD FX OF US$0.80 US$3.50 US$3.60 US$4.00 US$4.50 US$5.00 US$5.50 US$6.00 NPV 8% C$1,831 C$1,944 C$2,396 C$2,961 C$3,526 C$4,091 C$4,656 IRR % 16.1% 16.5% 18.2% 20.2% 22.1% 23.9% 25.6% Payback (yrs) 3.7 3.6 3.3 3.0 2.8 2.6 2.4 NPV 8% C$2,221 C$2,334 C$2,786 C$3,351 C$3,917 C$4,481 C$5,043 IRR % 17.7% 18.1% 19.7% 21.6% 23.5% 25.2% 26.9% Payback 3.4 3.3 3.0 2.8 2.6 2.4 2.3 NPV 8% C$2,807 C$2,920 C$3,372 C$3,937 C$4,501 C$5,026 C$5,624 IRR % 19.9% 20.3% 21.9% 23.7% 25.5% 27.1% 28.7% Payback (yrs) 3.0 2.9 2.8 2.6 2.4 2.3 2.1 NPV 8% C$3,294 C$3,407 C$3,859 C$4,423 C$4,985 C$5,547 C$6,108 IRR % 21.7% 22.1% 23.6% 25.4% 27.1% 28.7% 30.3% Payback (yrs) 2.8 2.7 2.6 2.4 2.3 2.1 2.0 NPV 8% C$3,782 C$3,895 C$4,346 C$4,908 C$5,469 C$6,031 C$6,593 IRR % 23.5% 23.9% 25.3% 27.0% 28.7% 30.2% 31.8% Payback (yrs) 2.6 2.5 2.4 2.3 2.1 2.0 1.9 NPV 8% C$4,268 C$4,381 C$4,830 C$5,392 C$5,954 C$6,515 C$7,077 IRR % 25.2% 25.6% 27.0% 28.6% 30.2% 31.8% 33.3% Payback (yrs) 2.4 2.4 2.3 2.4 2.0 1.9 1.9 US$2,750 COPPER PRICE (US$/lb) GOLD PRICE (US$/oz) US$1,500 US$1,700 US$2,000 US$2,250 US$2,500 Note: Based on Casino Copper-Gold 2022 Feasibility Study. CAD:USD exchange rate of US$0.80. NPV and IRR are shown after-tax. “Broker LT Consensus” based on analyst consensus long-term commodity price forecasts, as provided by CIBC Capital Markets. See “Notes” in Appendix.
  • 15.
    TSX | NYSEAMERICAN | WRN DE-RISKED THROUGH QUICK PAYBACK 15 CASH FLOW & PRODUCTION PROFILE YEARS 1-4 LIFE-OF-MINE AVERAGE ANNUAL CASH FLOW & COSTS Cash Flow (Pre-tax) ($M) C$1,033 C$662 Cash Flow (After-tax) ($M) C$951 C$517 Net Smelter Return ($/t ore milled) C$43.15 C$29.08 Operating Cost ($/t ore milled) C$11.16 AVERAGE ANNUAL METAL PRODUCTION Copper (Mlbs) 241 163 Gold (kozs) 333 211 Silver (kozs) 1,596 1,277 Molybdenum (Mlbs) 15.5 15.1 Copper Equivalent (Mlbs) 468 329 Gold Equivalent (kozs) 992 697 Note: Based on Casino Copper-Gold 2022 Feasibility Study at base case metal prices. See “Notes” in Appendix.
  • 16.
    TSX | NYSEAMERICAN | WRN16 ATTRACTIVE COST PROFILE CASH COSTS BY-PRODUCT COSTS Copper Cash Cost Net of By-Product Credits ($/lb) (US$0.80) CO-PRODUCT COSTS Copper Cash Cost Co-Product ($/lb) US$1.54 Gold Cash Cost Co-Product ($/oz) US$799 Low strip ratio reduces the amount of waste tonnes moved, resulting in lower hauling costs (the largest component of mining costs) Deposit sits on a hilltop, single large open-pit Haul profiles are favourable (portion of the planned hauls are downhill loaded) Processing costs benefit from medium-softer ore Throughput of 120,000 tpd, benefits from economies of scale Note: Based on Casino Copper-Gold 2022 Feasibility Study at base case metal prices. See “Notes” in Appendix.
  • 17.
    TSX | NYSEAMERICAN | WRN17 FEASIBILITY STUDY CAPITAL COSTS PROJECTED CAPITAL COSTS PROCESS PLANT & INFRASTRUCTURE Project Directs (Including Freight) C$2,116 Project Indirects C$431 Contingency C$369 Subtotal C$2,916 MINE Mine Equipment C$433 Mine Pre-production C$228 Subtotal C$661 Owners Costs C$41 SUSTAINING & TOTAL Total Initial Capital C$3,618 Total Sustaining Capital C$751 Total Life-Of-Mine Capital C$4,369 Note: Based on Casino Copper-Gold 2022 Feasibility Study at base case metal prices. See “Notes” in Appendix.
  • 18.
    TSX | NYSEAMERICAN | WRN ESG COMMITMENT 18 Committed to health and safety and committed to the protection of cultural values • Ongoing Engagement with Local Communities and First Nations • 16+ Years of Operating Responsibly in the Yukon • Co-operation Agreements Signed with Key First Nations SOCIAL ENVIRONMENTAL Committed to exceeding best practices in protecting the environment • Accepted the Robert E Leckie Award for outstanding Environmental stewardship • Committed to MAC’s Towards Sustainable Mining (TSM) initiative Committed to high ethical standards and building long term value • Corporate Disclosure Policy • Safety, Health & Environmental Policy • Whistleblower Policy • Insider Trading Policy GOVERNANCE SUPPORTING • Yukon community food security • Yukon-wide sport and culture • Yukon-wide mental health support • Industry association support • Reconciliation • Yukon First Nations cultural awareness • Yukon-wide health care • Yukon education and family literacy
  • 19.
    TSX | NYSEAMERICAN | WRN ACCESS ROAD FUNDING Construction of the road started in early 2022, with the first 5 km completed late 2023 19 C$130 Million Yukon Resource Gateway Project funding the Casino Copper-Gold Access Road Federal government has committed funding towards the construction of a 120 km road to access the Casino Project
  • 20.
    TSX | NYSEAMERICAN | WRN GOVERNMENT-LED INITIATIVE SECURES PORT ACCESS 20 In March 2023, the Yukon government signed an MOU with Municipality of Skagway to secure long-term tidewater access for Yukon’s mining industry Term sheet outlining an export cooperation agreement signed in September 2023 The Yukon government has included C$44.7M in its capital plan in 2025-28, with C$21.3M approved by the legislature in November 2023 Facility recently shipped Minto mine’s copper concentrate Port is 560 km from the Casino Project C$45 Million Yukon government investing in Marine Services Platform as part of Skagway Port Redevelopment
  • 21.
    TSX | NYSEAMERICAN | WRN Casino’s base case is to use an LNG power plant The Yukon grid is beyond capacity, with 22 rental diesel generators addressing the shortfall; frequent power outages Canada’s Critical Minerals Infrastructure Fund conditionally approved C$40M to advance the BC-Yukon Grid Connect Project: connecting the capacity-constrained Yukon grid to the North American grid in BC Major endorsement of the Casino Project; aligns Casino’s 130 MW load (which helps justify the Grid Connect Project), with the government’s efforts to provide secure and sustainable energy to the Yukon A pathway to hydroelectric grid power is transformative for the Casino Project PROGRESS ON YUKON-BC GRID INTERCONNECTION 21 C$40 Million Critical Minerals Infrastructure Fund investing in BC-Yukon Grid Connect Project 763 km of new transmission line “Developments like these help mines get built faster, and they are a key element in seizing the generational opportunity before us. These investments are needed to support critical minerals development in the region, improve community access and safety, and create good mining jobs…” – The Honourable Jonathan Wilkinson, Minister of Energy and Natural Resources
  • 22.
    TSX | NYSEAMERICAN | WRN CASINO PERMITTING TIMELINE 22 TASK YEAR 1 YEAR 2 YEAR 3 YEAR 4 YESAB Process Establish Panel Technical Analysis Public Hearings Panel Report Decision Land use Permit for Casino Road Preparation Obtain Permits Type A Water Use License Preparation Water Board Process Quartz Mining License Preparation QML to Initiate Construction QML Amendment for Operations Schedule 2 Amendment Preparation ECCC Process Fisheries Act Authorization Preparation DFO Process Potential Construction Start
  • 23.
    TSX | NYSEAMERICAN | WRN23 INVESTMENT HIGHLIGHTS Multi-decade copper and gold resource High-grade core leads to quick payback Low strip ratio drives attractive cost profile Significant leverage to rising commodity prices Yukon is supportive mining district De-risking through permitting Improving infrastructure backdrop through government initiatives Major endorsements and partnerships Immense scarcity value of similar projects
  • 24.
    TSX | NYSEAMERICAN | WRN APPENDIX
  • 25.
    TSX | NYSEAMERICAN | WRN SIGNIFICANT POSITIVE ECONOMIC IMPACT ON THE YUKON Over the life-of-mine, the Casino Project is estimated to: • Contribute C$44.3 billion to Canada’s GDP • Create 132,280 full-time equivalent positions • Generate C$12.8 billion in wages and salaries • Generate C$11.2 billion in taxes and royalties to various governments 25 Each year, the Casino Project is estimated to: • Contribute C$1.3 billion to Yukon’s economy • Contribute C$1.5 billion to Canada’s GDP through operation of the mine • Creating 3,880 full-time equivalent positions • Generate C$391 million in wages and salaries across Canada Economic Impact of the development of Casino Copper-Gold on the Yukon and Canada Note: See press release dated February 2, 2023.
  • 26.
    TSX | NYSEAMERICAN | WRN TECHNICAL COLLABORATION Tailings Facility Redesign Reduced Risk, Reduced Environmental Impact and Improved Safety 26 Redesign incorporates the outcomes of the BATT study – a collaboration with First Nations, YESAB, and Yukon government Substantial reduction in the quantity of free-standing water impounded during operations PAG tailings moved to the back of the facility protected by Waste Rock and Main Embankment Closure by rock/sand cover limiting the need for tailings “pond” Several other changes to the design to reduce construction risk Note: Based on Casino Copper-Gold 2022 Feasibility Study. See “Notes” in Appendix.
  • 27.
    TSX | NYSEAMERICAN | WRN PROPERTY GEOLOGY 27 Note: Based on Casino Copper-Gold 2022 Feasibility Study. See “Notes” in Appendix.
  • 28.
    TSX | NYSEAMERICAN | WRN MINING Pit designs for five mining phases were developed to produce 45.4 Mtpa of mill feed ore Mill material is limited to 1.2 Bt due to TMF capacity The pits were designed with 40 m wide ramps, 20 m benches Pit slope angles of 45 degree for most of the pit, with some areas at 42 degrees Komatsu 980E or similar haul trucks (370 t class) Floating cone based on US$1.75/lb Cu, US$835/oz Au – very low prices as pit is constrained by TMF capacity Pit is electrified to power shovels and drills Strip ratio is 0.43:1 over the life-of-mine 28 Note: Based on Casino Copper-Gold 2022 Feasibility Study. See “Notes” in Appendix.
  • 29.
    TSX | NYSEAMERICAN | WRN PROCESSING Milling • Throughput: Average life-of-mine 120,000 tpd • Grinding Circuit: 40 ft SAG Mill (29 MW) + 2 x 28 ft Ball Mills (22 MW each) • Medium – soft ore: BWi – 14.5 kWh/t, 200 µm primary grind Flotation • Conventional copper/moly circuit • Recoveries: Copper 86%, Gold 67%, Moly 71%, Silver 53% • Sulfide removal circuit to produce suitable tailings for dam construction Heap Leach • Conventional crush/conveyer stack valley fill heap leach • 25,000 tpd • SART to remove copper from solution • Recoveries: Gold 80%, Silver 26%, Copper 18% 29 Note: Based on Casino Copper-Gold 2022 Feasibility Study. See “Notes” in Appendix.
  • 30.
    TSX | NYSEAMERICAN | WRN EXCELLENT CONCENTRATE QUALITY 30 COPPER CONCENTRATE ELEMENT AVG VALUE UNIT Copper 28 % Gold 25 g/t Silver 120 g/t Molybdenum 0.05 % Iron 26 % Sulphur 36 % Arsenic 200 g/t Antimony 250 g/t Mercury 1 g/t Cadmium 40 g/t Fluorine 100 g/t Silica 2 % MOLYBDENUM CONCENTRATE ELEMENT AVG VALUE UNIT Molybdenum 57.4 % Copper 0.39 % Rhenium 133.5 g/t Iron 0.8 % Sulphur 37.9 % Arsenic 1,659 g/t Antimony 100 g/t Mercury <1 g/t Cadmium 3 g/t Fluorine ND g/t Silica 1.74 % Note: Based on Casino Copper-Gold 2022 Feasibility Study. See “Notes” in Appendix.
  • 31.
    TSX | NYSEAMERICAN | WRN FEASIBILITY STUDY OPERATING COST 31 LOM ($/TONNE) MILLING OPERATION Milling C$6.42 Mining C$4.28 General & Administrative C$0.46 Total C$11.16 HEAP LEACH OPERATION Heap Leach Operation C$1.93 ADR/SART C$4.80 Total C$6.73 Note: Based on Casino Copper-Gold 2022 Feasibility Study. See “Notes” in Appendix.
  • 32.
    TSX | NYSEAMERICAN | WRN ENTERPRISE VALUE/COPPER EQUIVALENT RESOURCE BENCHMARKING (US¢/lb CuEq) 32 ¢14.72 ¢10.29 ¢1.89 ¢1.53 ¢1.48 ¢1.22 ¢1.13 ¢0.92 ¢0.81 ¢0.76 ¢0.71 ¢0.61 ¢0.52 ¢0.23 ¢0.22 ¢0.19 Marimaca (Marimaca) Ivanhoe (Santa Cruz) Solaris (Waromtza) Trilogy (Artic) Cordoba (San Matias) Atex (Valeriano) Seabridge (KSM) SolGold (Cascabel) Northisle (North Island) Arizona Sonoran (Cactus) Western Copper (Casino) Panoro (Cotabambas) Los Andes (Vizcachitas) Highland Copper (Copperwood) Alta (Caùariaco Norte) Northern Dynasty (Pebble) WRN is undervalued with greater growth opportunity compared to its peers WESTERN COPPER & GOLD Note: Data from S&P CapIQ and company filings. CuEq resource calculated using US$3.60/lb Cu, US$1,700/oz Au, US$14/lb Mo, and $22/oz Ag.
  • 33.
    TSX | NYSEAMERICAN | WRN x 157 144 -- 20 40 60 80 100 120 7th LARGEST UNDEVELOPED COPPER-GOLD PROJECT CONTROLLED BY A JUNIOR 33 CASINO COPPER-GOLD PROJECT Junior controlled copper project Major controlled copper project WRN’s Casino Copper-Gold project Ecuador Argentina Chile Ecuador Peru Yukon Alaska BC BC Philippines BC Argentina COPPER EQUIVALENT (B LBS) Chile Chile Note: Data from S&P CapIQ and company filings.
  • 34.
    TSX | NYSEAMERICAN | WRN -- $5,000 $10,000 $15,000 $20,000 $25,000 $30,000 $35,000 $40,000 $45,000 COPPER DEVELOPMENT PROJECT CAPITAL INTENSITY 34 CASINO COPPER-GOLD PROJECT INITIAL CAPITAL INTENSITY (US$/TPA AVERAGE CUEQ) WRN Feasibility Pre-Feasibility PEA Notes: Data from S&P CapIQ on select copper or copper-gold projects. CuEq production calculated using US$3.60/lb Cu, US$1,700/oz Au, US$14/lb Mo, and $22/oz Ag.
  • 35.
    TSX | NYSEAMERICAN | WRN x 35 COPPER DEVELOPMENT TRANSACTIONS ANALYST CONSENSUS PRICE / NAV MULTIPLES 0.92x 0.79x 0.58x 0.34x 1.03x 0.75x 0.71x 0.25x 0.30x 0.73x -- 0.20x 0.40x 0.60x 0.80x 1.00x BHP - 50% Josemaria (Lundin) (US$0.7 Bn) Lundin Mining / BHP - Filo (US$3.0 Bn) MACH Metals Australia - Rex Minerals (US$0.2 Bn) Silvercorp - Adventus (US$0.1 Bn) Glencore - 56.25% MARA (Pan American) (US$0.5 Bn) Harmony Gold - Eva (Copper Mountain) (US$0.2 Bn) Agnico - San NicolĂĄs (Teck) (US$0.2 Bn) SolGold - Cornerstone (US$0.1 Bn) Lundin Mining - Josemaria (US$0.5 Bn) Capstone - 30% Santo Domingo (KORES) (US$0.1 Bn) Median: 0.72x Note: Data from public disclosure. Based on transactions since 2021, where the target is a copper project / company.
  • 36.
    TSX | NYSEAMERICAN | WRN ANA AND CASINO B 36 Note: See “Notes” in Appendix Significant exploration potential to the west of the pit Both copper targets similar to Casino and gold targets similar to the Coffee deposit to the north
  • 37.
    TSX | NYSEAMERICAN | WRN 2022 CASINO COPPER-GOLD RESOURCE Source: Casino Copper-Gold 2022 Feasibility Study. See “Notes” in Appendix. 37 MILL RESOURCE ($6.11/t NSR CUTOFF) Class Mt NSR (C$/t) Copper (%) Gold (g/t) Moly (%) Silver (g/t) CuEq (%) Copper (M lb) Gold (M oz) Moly (M lb) Silver (M oz) Measured 144.9 40.09 0.30 0.38 0.024 2.1 0.64 953 1.8 75.2 9.6 Indicated 2,114.2 20.34 0.14 0.16 0.015 1.4 0.29 6,493 11.1 716.0 93.5 M+I 2,259.0 21.60 0.15 0.18 0.016 1.4 0.31 7,446 12.9 791.2 103.1 Inferred 1,371.5 15.41 0.10 0.14 0.009 1.1 0.21 3,029 6.1 286.0 50.5 HEAP LEACH RESOURCE ($6.61/t NSR CUT-OFF) Class Mt NSR (C$/t) Copper (%) Gold (g/t) Silver (g/t) AuEq (g/t) Copper (M lb) Gold (M oz) Silver (M oz) Measured 43.3 23.79 0.05 0.44 2.7 0.47 51.5 0.62 3.7 Indicated 188.4 11.47 0.04 0.21 1.7 0.23 145.4 1.27 10.4 M+I 231.7 13.77 0.04 0.25 1.9 0.27 196.9 1.88 14.1 Inferred 40.9 11.33 0.05 0.20 1.4 0.22 46.9 0.27 1.9
  • 38.
    TSX | NYSEAMERICAN | WRN 2022 CASINO COPPER-GOLD RESOURCE 38 TOTAL RESOURCE (MILL + HEAP LEACH) Class Mt NSR (C$/t) Copper (%) Gold (g/t) Silver (g/t) Copper (M lb) Gold (M oz) Silver (M oz) Measured 188.2 36.34 0.24 0.40 2.2 1,005.0 2.4 13.3 Indicated 2,302.6 19.61 0.13 0.17 1.4 6,638.1 12.4 103.9 M+I 2,490.7 20.88 0.14 0.18 1.5 7,643.1 14.8 117.2 Inferred 1,412.5 15.30 0.10 0.14 1.2 3,075.5 6.3 52.3 Source: Casino Copper-Gold 2022 Feasibility Study. See “Notes” in Appendix.
  • 39.
    TSX | NYSEAMERICAN | WRN 2022 CASINO COPPER-GOLD RESERVE 39 MILL RESERVE Class Mt NSR (C$/t) Copper (%) Gold (g/t) Moly (%) Silver (g/t) CuEq (%) Copper (M lb) Gold (M oz) Moly (M lb) Silver (M oz) Proven 140.1 38.50 0.31 0.39 0.024 2.1 0.67 944 1.8 74.9 9.4 Probable 1,076.9 23.68 0.17 0.19 0.021 1.6 0.36 4,135 6.7 497.1 55.5 P+P 1,217.1 25.38 0.19 0.22 0.021 1.7 0.40 5,079 8.5 571.9 64.9 HEAP LEACH RESERVE Class Mt NSR (C$/t) Gold (g/t) Copper (%) Moly (%) Silver (g/t) AuEq (g/t) Gold (M oz) Copper (M lb) Moly (M lb) Silver (M oz) Proven 42.9 22.52 0.45 0.055 N/A 2.7 0.47 0.62 51.8 N/A 3.7 Probable 166.8 11.14 0.22 0.031 N/A 1.8 0.23 1.17 113.5 N/A 9.4 P+P 209.6 13.47 0.26 0.036 N/A 1.9 0.28 1.78 165.3 N/A 13.1 Source: Casino Copper-Gold 2022 Feasibility Study. See “Notes” in Appendix.
  • 40.
    TSX | NYSEAMERICAN | WRN NOTES Technical report entitled “Casino Copper-Gold Project, Form 43-101 F1 Technical Report Feasibility Study” dated June 13, 2022, a copy of which is available on the Company's website at www.westerncopperandgold.com. Prepared by: Daniel Roth, P.Eng.; Laurie Tahija, MMSA-QP; Patrick Dugan, P.E.; Mike Hester, F Aus IMM; John M. Marek, P.Eng.; Carl Schulze, P.Geo.; Daniel Friedman, P.Eng; Scott Weston, P.Geo; each of whom is a qualified person pursuant to National Instrument 43-101 ("Qualified Person") Mineral Resources • The Mineral Resources have an effective date of 29 April 2022 and the estimate was prepared using the definitions in CIM Definition Standards (10 May 2014). • All figures are rounded to reflect the relative accuracy of the estimate and therefore numbers may not appear to add precisely. • Mineral Resources that are not Mineral Reserves do not have demonstrated economic viability. • Mineral Resources for leach material are based on prices of US$3.50/lb copper, US$1,650/oz gold and US$22/oz silver • Mineral Resources for mill material are based on prices of US$3.50/lb copper, US$1,650/oz gold, US$22/oz silver, and US$12.00/lb moly. • Mineral Resources are based on NSR cut-off of C$6.61/t for leach material and C$6.11/t for mill material. • NSR value for leach material is as follows: - NSR (C$/t) = $15.21 x copper (%) + $50.51 x gold (g/t) + $0.210 x silver (g/t), based on copper recovery of 18%, gold recovery of 80% and silver recovery of 26%. 40 “Casino Copper-Gold Feasibility Study” • NSR value for hypogene sulphide mill material is: - NSR (C$/t) = $73.81 x copper (%) + $41.16 x gold (g/t) + $213.78 x moly (%) + 0.386 x silver (g/t), based on recoveries of 92.2% copper, 66% gold, 50% silver and 78.6% moly. • NSR value for supergene mill material is: - NSR (C$/t) = $80.06 x recoverable copper (%) + $43.03 x gold (g/t) + $142.11 x moly (%) + 0.464 x silver (g/t), based on recoveries of 69% gold, 60% silver and 52.3% moly. Recoverable copper = 0.94 x (total copper – soluble copper). • Mineral Resources are reported in relation to a conceptual constraining pit shell in order to demonstrate reasonable prospects for eventual economic extraction, as required by the definition of Mineral Resource in NI 43-101; mineralization lying outside of the pit shell is excluded from the Mineral Resource. • AuEq and CuEq values are based on prices of US$3.50/lb copper, US$1,650/oz gold, US$22/oz silver, and US$12.00/lb moly, and account for all metal recoveries and smelting/refining charges. • The NSR calculations also account for smelting and refining charges and payables.
  • 41.
    TSX | NYSEAMERICAN | WRN NOTES Mineral Reserve • The Mineral Reserve estimate has an effective date of June 13, 2022 and was prepared using the CIM Definition Standards (10 May 2014). • Columns may not sum exactly due to rounding. • Mineral Reserves are based on commodity prices of US$3.25/lb Cu, US$1,550/oz Au, US$12.00/lb Mo, and US$22.00/oz Ag. • Mineral Reserves amenable to milling are based on NSR cutoffs that vary by time period to balance mine and plant production capacities. They range from a low of $6.11/t to a high of $25.00/t. • NSR value for supergene (SOX and SUS) mill material is - NSR (C$/t) = $73.63 x recoverable copper (%) + $40.41 x gold (g/t) + $142.11 x moly (%) + 0.464 x silver (g/t), based on recoveries of 69% gold, 52.3% molybdenum and 60% silver. Recoverable copper = 0.94 x (total copper – soluble copper). • NSR value for hypogene (HYP) mill material is - NSR (C$/t) = $67.88 x copper (%) + $38.66 x gold (g/t) + $213.78 x moly (%) + $0.386 x silver (g/t), based on recoveries of 92.2% copper, 66% gold, 78.6% molybdenum and 50% silver. • Mineral Reserves amenable to heap leaching are based on an NSR cutoff of $6.61/t. 41 “Casino Copper-Gold Feasibility Study” Other technical information in this presentation: • NSR value for leach material is - NSR (C$/t) = $14.05 x copper (%) + $47.44 x gold (g/t) + $0.210 x silver (g/t), based on recoveries of 18% copper, 80% gold and 26% silver. • AuEq and CuEq values are based on prices of US$ 3.25/lb Cu, US$1,550/oz Au, US$12.00/lb Mo, and US$22.00/oz Ag, and account for all metal recoveries and smelting/refining charges. • The NSR calculations also account for smelter/refinery treatment charges and payables. Technical information regarding the Casino Copper-Gold Project contained in this presentation is based on the Casino Copper-Gold 2022 FS prepared by or under the supervision of the Qualified Persons noted previously. Copper equivalent calculations in this presentation, not associated with the Casino mineral resource or reserve, are based on: US$3.60/lb copper; US$1,700/oz gold; US$14/lb molybdenum; and US$22/oz silver with no accounting for metallurgical recovery.
  • 42.
    TSX | NYSEAMERICAN | WRN info@westerncopperandgold.com 604 684 9497 www.westerncopperandgold.com