We’ve all been there, staring at a WordPress site that loads at a snail’s pace. Finding the exact cause can feel like searching for a needle in a digital haystack.
After years of debugging websites, we discovered the Query Monitor plugin. It improves how we work, acting like an X-ray that reveals performance issues hiding in the background.
This powerful tool shows you everything, from slow database queries to scripts that might be causing delays. Our team uses it regularly to keep WPBeginner and our other sites running smoothly.
In this guide, we will show you exactly how to add and use Query Monitor to troubleshoot your website. You’ll learn how to get a clear view of your site’s performance just like we do.
What Is WordPress Query Monitor?
A WordPress query monitor is a debugging tool that monitors the requests your WordPress website makes to the server.
You can then use this information to troubleshoot WordPress issues or find and fix common WordPress errors.
Some of the things you can look up are:
- Database queries triggered by a page in WordPress
- HTTP requests made by scripts in your themes or plugins
- Hooks and actions triggered on a page
- Language, user role checks, and template files used to display the page
- Your hosting environments like PHP and MySQL versions, memory limits, and more
That being said, let’s take a look at how to add a query monitor on your WordPress site.
Adding Query Monitor in WordPress
The first thing you need to do is install and activate the Query Monitor plugin. For more details, see our step-by-step guide on how to install a WordPress plugin.
Upon activation, the plugin will add the query monitor menu to your WordPress admin bar.
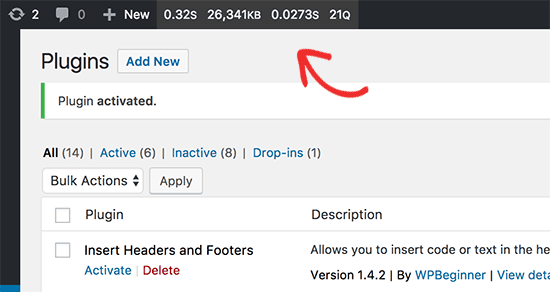
Taking your mouse over to the query monitor will display the menu, allowing you to jump to a parameter quickly. You can also click on the query monitor stats to view all data.
🌟Expert Tip: Not confident about fixing errors yourself? Why not leave things to the professionals?
Our team at WPBeginner offers Emergency WordPress Support Services, available 24/7. We can fix everything from SSL errors to plugin issues at affordable prices for small businesses and website owners.
Viewing Data in WordPress Query Monitor
As you explore these sections, you’ll mainly be looking for two things: what’s slow and what’s causing errors. Look for high numbers in ‘Page Generation Time’ and ‘Peak Memory Usage’ at the top. In the sections below, keep an eye out for slow database queries (high time values), duplicate queries, or scripts from plugins you don’t need on a specific page. These are common clues to what’s slowing your site down.
First, you need to make sure that the WordPress admin bar is visible when you are viewing your website. Simply go to the Users » Your Profile page and check the box next to the ‘Show Toolbar when viewing site’ option.
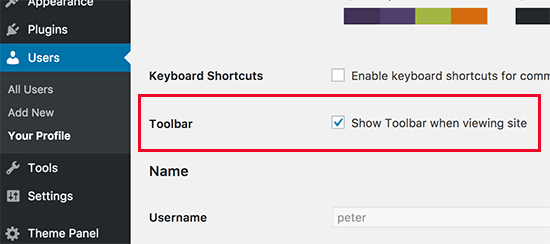
Don’t forget to click on the ‘Update profile’ button to store your settings.
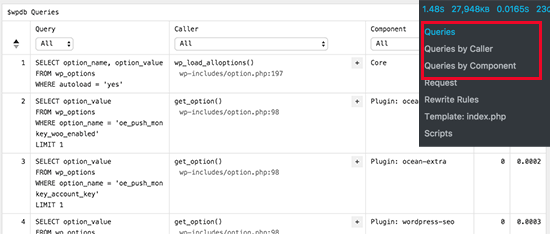
Next, you need to visit the page you want to check the queries for. Once on this page, simply take the mouse over to the query monitor menu in the admin bar and click on the section you want to view.
Monitoring SQL Queries
The Query Monitor plugin enables you to monitor all SQL queries, the number of queries by caller, and queries by component. The queries by component section shows you the queries made by plugins, themes, and core files.
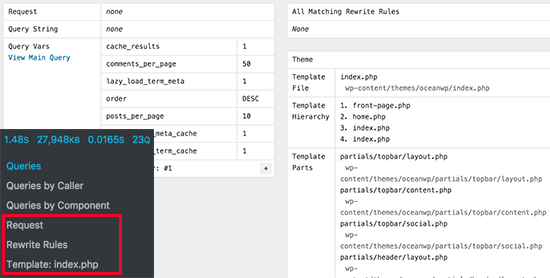
Rewrite Rules and Templates
This section of the plugin shows you matching rewrite rules and the templates being used to display the current page.
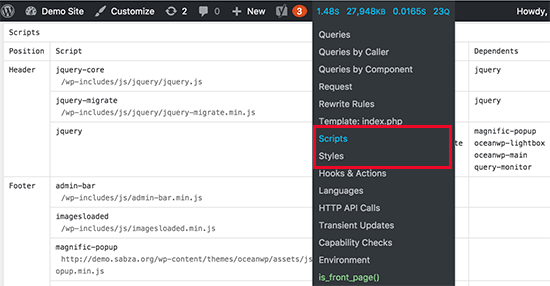
Scripts and Styles
Ever wonder if a specific plugin is loading too many files and slowing your site down? This section is where you find out. It lists every single JavaScript file and stylesheet loaded on the page and tells you which plugin or theme it belongs to.
You will also see where these files are loaded, for example, in the header or footer.
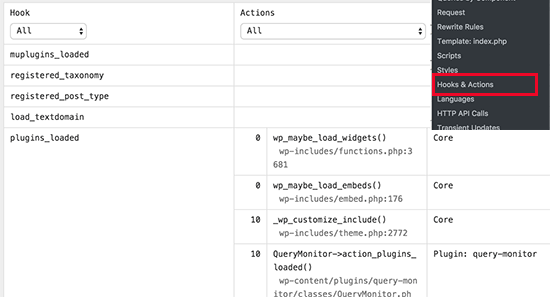
Hooks and Actions
This is a more advanced section, but it can be very useful for seeing how your plugins ‘talk’ to each other and to WordPress core. It shows all the hooks and actions that run on the page, which can help pinpoint conflicts between plugins.
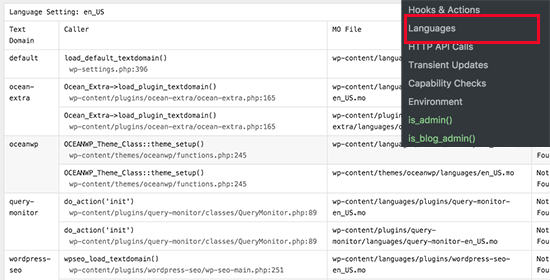
Languages Section
This section shows you the language files requested and loaded by the current page.
If you run a multilingual WordPress site, then this helps you figure out which themes and plugins have language files available.
HTTP API Calls
This section shows you any requests your website makes to other services online. For example, if you use a Google Maps plugin or a weather widget, it makes an ‘API call’ to get data. If your site feels slow, this section can help you see if a slow response from an external service is the cause.
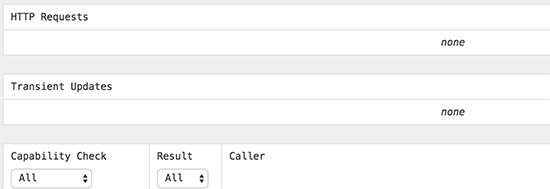
Transient Updates
This section shows you any requests your website makes to other services online. For example, if you use a Google Maps plugin or a weather widget, it makes an ‘API call’ to get data. If your site feels slow, this section can help you see if a slow response from an external service is the cause.
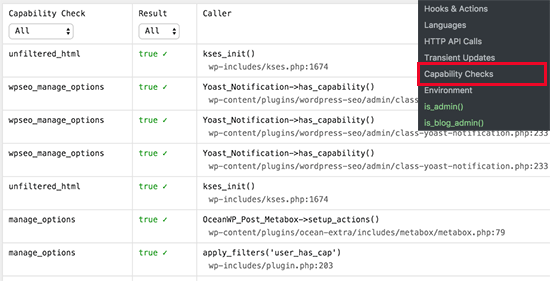
Capability Checks Section
The Capability Checks section displays user capabilities checks run by WordPress core, plugins, and themes while loading the current page.
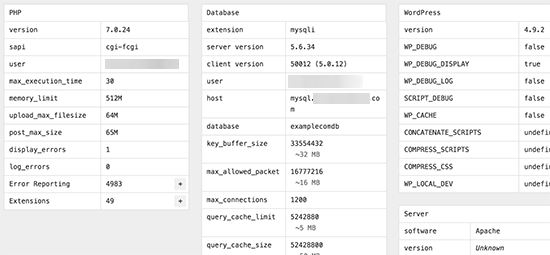
Environment Section
This is where you will get your WordPress hosting environment information, like the PHP version, MySQL version, MySQL Host, WordPress database name, and more.
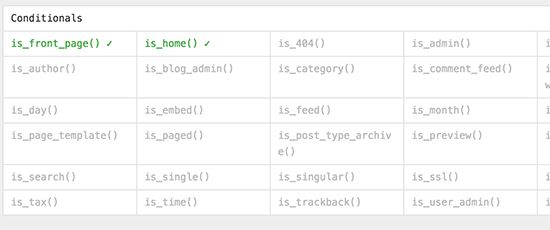
Conditional Checks
This is where the plugin shows conditions that were required to display the current page view.
Frequently Asked Questions
Here are answers to some of the most common questions we receive about using the Query Monitor plugin for WordPress.
1. What is the Query Monitor plugin used for?
The Query Monitor plugin is a free debugging tool for WordPress. It helps site owners and developers find performance bottlenecks by showing detailed information about database queries, PHP errors, loaded scripts and styles, HTTP API calls, and much more.
2. Will the Query Monitor plugin slow down my website?
While any plugin adds some overhead, Query Monitor is highly optimized and its impact on performance is minimal. The information it provides is only visible to administrators, so it will not affect the experience for your regular website visitors.
3. Can I use Query Monitor on a live site?
Yes, you can safely use Query Monitor on a live website. It’s an excellent tool for troubleshooting real-world issues as they happen. Just remember to deactivate it once you are finished debugging to keep your site as lean as possible.
4. Who should use the Query Monitor plugin?
Query Monitor is most useful for WordPress developers, theme designers, and site administrators who want to optimize their site’s performance. However, even non-technical users can use it to identify which plugins or themes are causing slowdowns on their site.
Additional Resources
We hope this guide helped you learn how to use the Query Monitor plugin to debug your WordPress site. By peeking under the hood, you can stop guessing what’s wrong and start making targeted fixes to improve your site’s performance and stability. It’s a must-have tool for any serious WordPress site owner!
Now that you know how to use Query Monitor, you can take your website optimization even further. Here are some extra guides from our team that you may find helpful:
- How to Properly Run a Website Speed Test – A good speed test is the first step to identifying what needs fixing. This guide shows you the right way to do it.
- The Ultimate Guide to Boost WordPress Speed & Performance – Discover a complete list of actionable tips to make your WordPress site faster.
- Beginner’s Guide to Troubleshooting WordPress Errors – Learn a step-by-step process for figuring out and fixing common WordPress issues.
- Best WordPress Caching Plugins – Caching is one of the most effective ways to improve site speed. See our top picks.
If you liked this article, then please subscribe to our YouTube Channel for WordPress video tutorials. You can also find us on Twitter and Facebook.



Luke Cavanagh
When you do not need to find slow queries on your site, deactivate Query Monitor, if left active it can decrease performance on the site and increase memory usage.