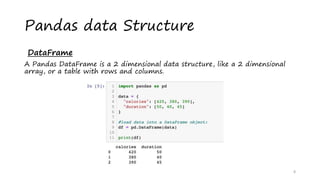
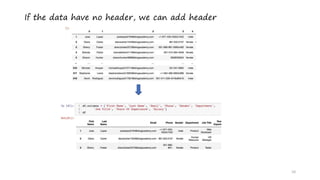
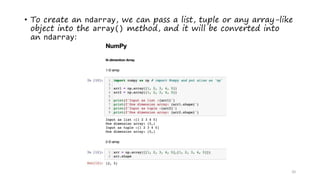
KEMBAR78
2. Data Preprocessing with Numpy and Pandas.pptx
Data Preprocessing
Lay Puthineath
Session 2:
1
Contents
- Introducing Data Analysis
- Introducing Pandas
- Introducing Numpy
2
Data Analysis?
3
Data Analysis: the process of discovering useful
information from the raw data to empower data-driven
business decision. It is the detailed examination of the
elements or structure of something.
Data Analytics: It is a systematic computational analysis
of data or statistics.
4
Process Flow of Data Analysis:
5
Requirements:
gathering and
planning
Data Collection Data Cleansing
Data Preparation
Data Analysis
Data
Interpretation
and Result
Summarization
Data
Visualization
Why use
Pandas?
6
Pandas data Structure
Series
• A Pandas Series is like a column in a table.
• It is a one-dimensional array holding data of any type.
7
Pandas data Structure
DataFrame
A Pandas DataFrame is a 2 dimensional data structure, like a 2 dimensional
array, or a table with rows and columns.
8
Pandas data Structure
Load CSV file
• A simple way to store big data sets is to use CSV files (comma separated
files).
• CSV files contains plain text and is a well know format that can be read by
everyone including Pandas.
employees.csv
9
10
If the data have no header, we can add header
Exploring data of a DataFrame
11
• DataFrame.shape
The shape will return the number of rows and columns
Data below contains 320 rows and 9 columns
Exploring data of a DataFrame
12
• DataFrame.head(n) and DataFrame.tail(n)
Exploring data of a DataFrame
13
• DataFrame.info(): a useful tool for getting a quick overview of a
DataFrame. It can be used to identify the data types of the
columns, the number of rows and columns, and the memory
usage of the DataFrame. This information can be helpful for
understanding the DataFrame and for planning further analysis.
14
The dataframe.describe(): method
calculates the following statistics for each
column in the DataFrame:
• Count: The number of non-null values
in the column.
• Mean: The average value of the column.
• Standard deviation: The standard
deviation of the column.
• Minimum: The minimum value in the
column.
• 25% percentile: The 25th percentile of
the column.
• 50% percentile: The 50th percentile of
the column, also known as the median.
• 75% percentile: The 75th percentile of
the column.
• Maximum: The maximum value in the
column.
15
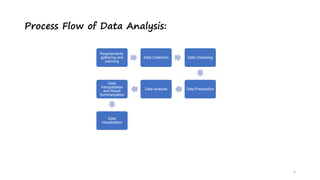
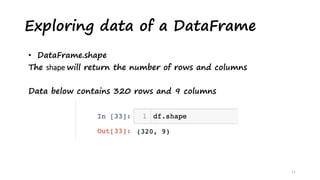
The dataframe.dtypes :method get the data
types of the columns in a DataFrame. This
method returns a Series object with the data
type of each column. The index of the Series
object is the name of the column and the
value of the Series object is the data type of
the column.
The data types that can be returned by the
dataframe.dtypes method include:
•object: strings, lists, or other non-numeric
data.
•int64: integers.
•float64: floating-point numbers.
•datetime64[ns]: dates and times.
16
dataframe.value_counts()
method includes the count
of each unique value in the
"Job Title" column.
• Handling duplicate data
• Dropping or deleting duplicate records
• Handing missing value in data
• Dropping the row which has missing data/ filling missing values
17
Data Cleansing
• Grouping data
• Sorting
• Ranking
18
Data Summary
Why NumPy?
19
NumPy (Numerical Python) is :
• vastly used Python library for scientific computation
• It is memory efficient and fast
• It has N-dimensional array objects and a rich collection of
routines to process and analyse them
• Homogenous array (same data types)
• To create an ndarray, we can pass a list, tuple or any array-like
object into the array() method, and it will be converted into
an ndarray:
20
21
22
NumPy array manipulation
Function Description
reshape() A returned new array with a specific shape without modify data
flat() flattens the array then returns the element of a specific index
flatten() returns the one-dimensional copy of input array
ravel() returns the one-dimensional view of input array
transpose() Transpose the axes
resize() Same as reshape(), but resize modifies the input array on which
this has been applied.
23
24
References
• Dixit, R. (2022). Data Analysis with Python: Introducing NumPy,
Pandas, Matplotlib, and Essential Elements of Python
Programming (English Edition). India: BPB Publications.
25

2. Data Preprocessing with Numpy and Pandas.pptx

  • 1.
  • 2.
    Contents - Introducing DataAnalysis - Introducing Pandas - Introducing Numpy 2
  • 3.
  • 4.
    Data Analysis: theprocess of discovering useful information from the raw data to empower data-driven business decision. It is the detailed examination of the elements or structure of something. Data Analytics: It is a systematic computational analysis of data or statistics. 4
  • 5.
    Process Flow ofData Analysis: 5 Requirements: gathering and planning Data Collection Data Cleansing Data Preparation Data Analysis Data Interpretation and Result Summarization Data Visualization
  • 6.
  • 7.
    Pandas data Structure Series •A Pandas Series is like a column in a table. • It is a one-dimensional array holding data of any type. 7
  • 8.
    Pandas data Structure DataFrame APandas DataFrame is a 2 dimensional data structure, like a 2 dimensional array, or a table with rows and columns. 8
  • 9.
    Pandas data Structure LoadCSV file • A simple way to store big data sets is to use CSV files (comma separated files). • CSV files contains plain text and is a well know format that can be read by everyone including Pandas. employees.csv 9
  • 10.
    10 If the datahave no header, we can add header
  • 11.
    Exploring data ofa DataFrame 11 • DataFrame.shape The shape will return the number of rows and columns Data below contains 320 rows and 9 columns
  • 12.
    Exploring data ofa DataFrame 12 • DataFrame.head(n) and DataFrame.tail(n)
  • 13.
    Exploring data ofa DataFrame 13 • DataFrame.info(): a useful tool for getting a quick overview of a DataFrame. It can be used to identify the data types of the columns, the number of rows and columns, and the memory usage of the DataFrame. This information can be helpful for understanding the DataFrame and for planning further analysis.
  • 14.
    14 The dataframe.describe(): method calculatesthe following statistics for each column in the DataFrame: • Count: The number of non-null values in the column. • Mean: The average value of the column. • Standard deviation: The standard deviation of the column. • Minimum: The minimum value in the column. • 25% percentile: The 25th percentile of the column. • 50% percentile: The 50th percentile of the column, also known as the median. • 75% percentile: The 75th percentile of the column. • Maximum: The maximum value in the column.
  • 15.
    15 The dataframe.dtypes :methodget the data types of the columns in a DataFrame. This method returns a Series object with the data type of each column. The index of the Series object is the name of the column and the value of the Series object is the data type of the column. The data types that can be returned by the dataframe.dtypes method include: •object: strings, lists, or other non-numeric data. •int64: integers. •float64: floating-point numbers. •datetime64[ns]: dates and times.
  • 16.
    16 dataframe.value_counts() method includes thecount of each unique value in the "Job Title" column.
  • 17.
    • Handling duplicatedata • Dropping or deleting duplicate records • Handing missing value in data • Dropping the row which has missing data/ filling missing values 17 Data Cleansing
  • 18.
    • Grouping data •Sorting • Ranking 18 Data Summary
  • 19.
    Why NumPy? 19 NumPy (NumericalPython) is : • vastly used Python library for scientific computation • It is memory efficient and fast • It has N-dimensional array objects and a rich collection of routines to process and analyse them • Homogenous array (same data types)
  • 20.
    • To createan ndarray, we can pass a list, tuple or any array-like object into the array() method, and it will be converted into an ndarray: 20
  • 21.
  • 22.
  • 23.
    NumPy array manipulation FunctionDescription reshape() A returned new array with a specific shape without modify data flat() flattens the array then returns the element of a specific index flatten() returns the one-dimensional copy of input array ravel() returns the one-dimensional view of input array transpose() Transpose the axes resize() Same as reshape(), but resize modifies the input array on which this has been applied. 23
  • 24.
  • 25.
    References • Dixit, R.(2022). Data Analysis with Python: Introducing NumPy, Pandas, Matplotlib, and Essential Elements of Python Programming (English Edition). India: BPB Publications. 25