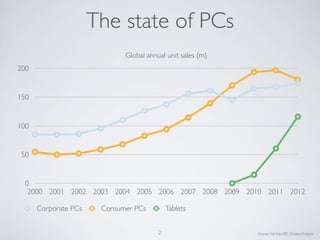
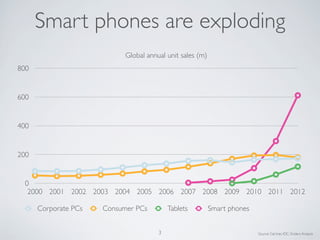
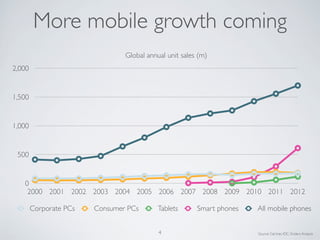
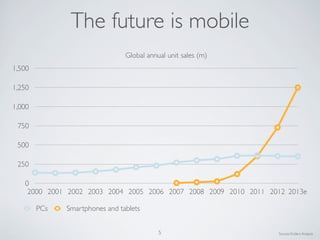
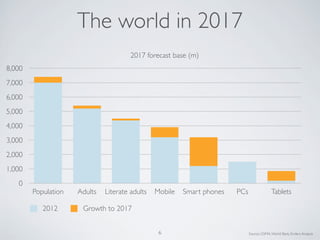
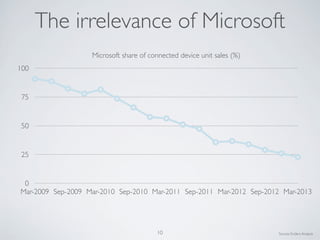
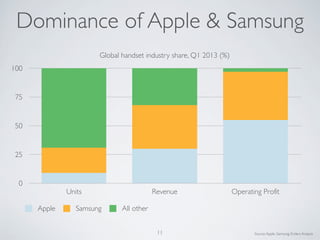
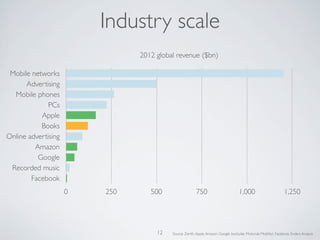
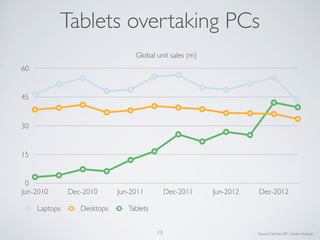
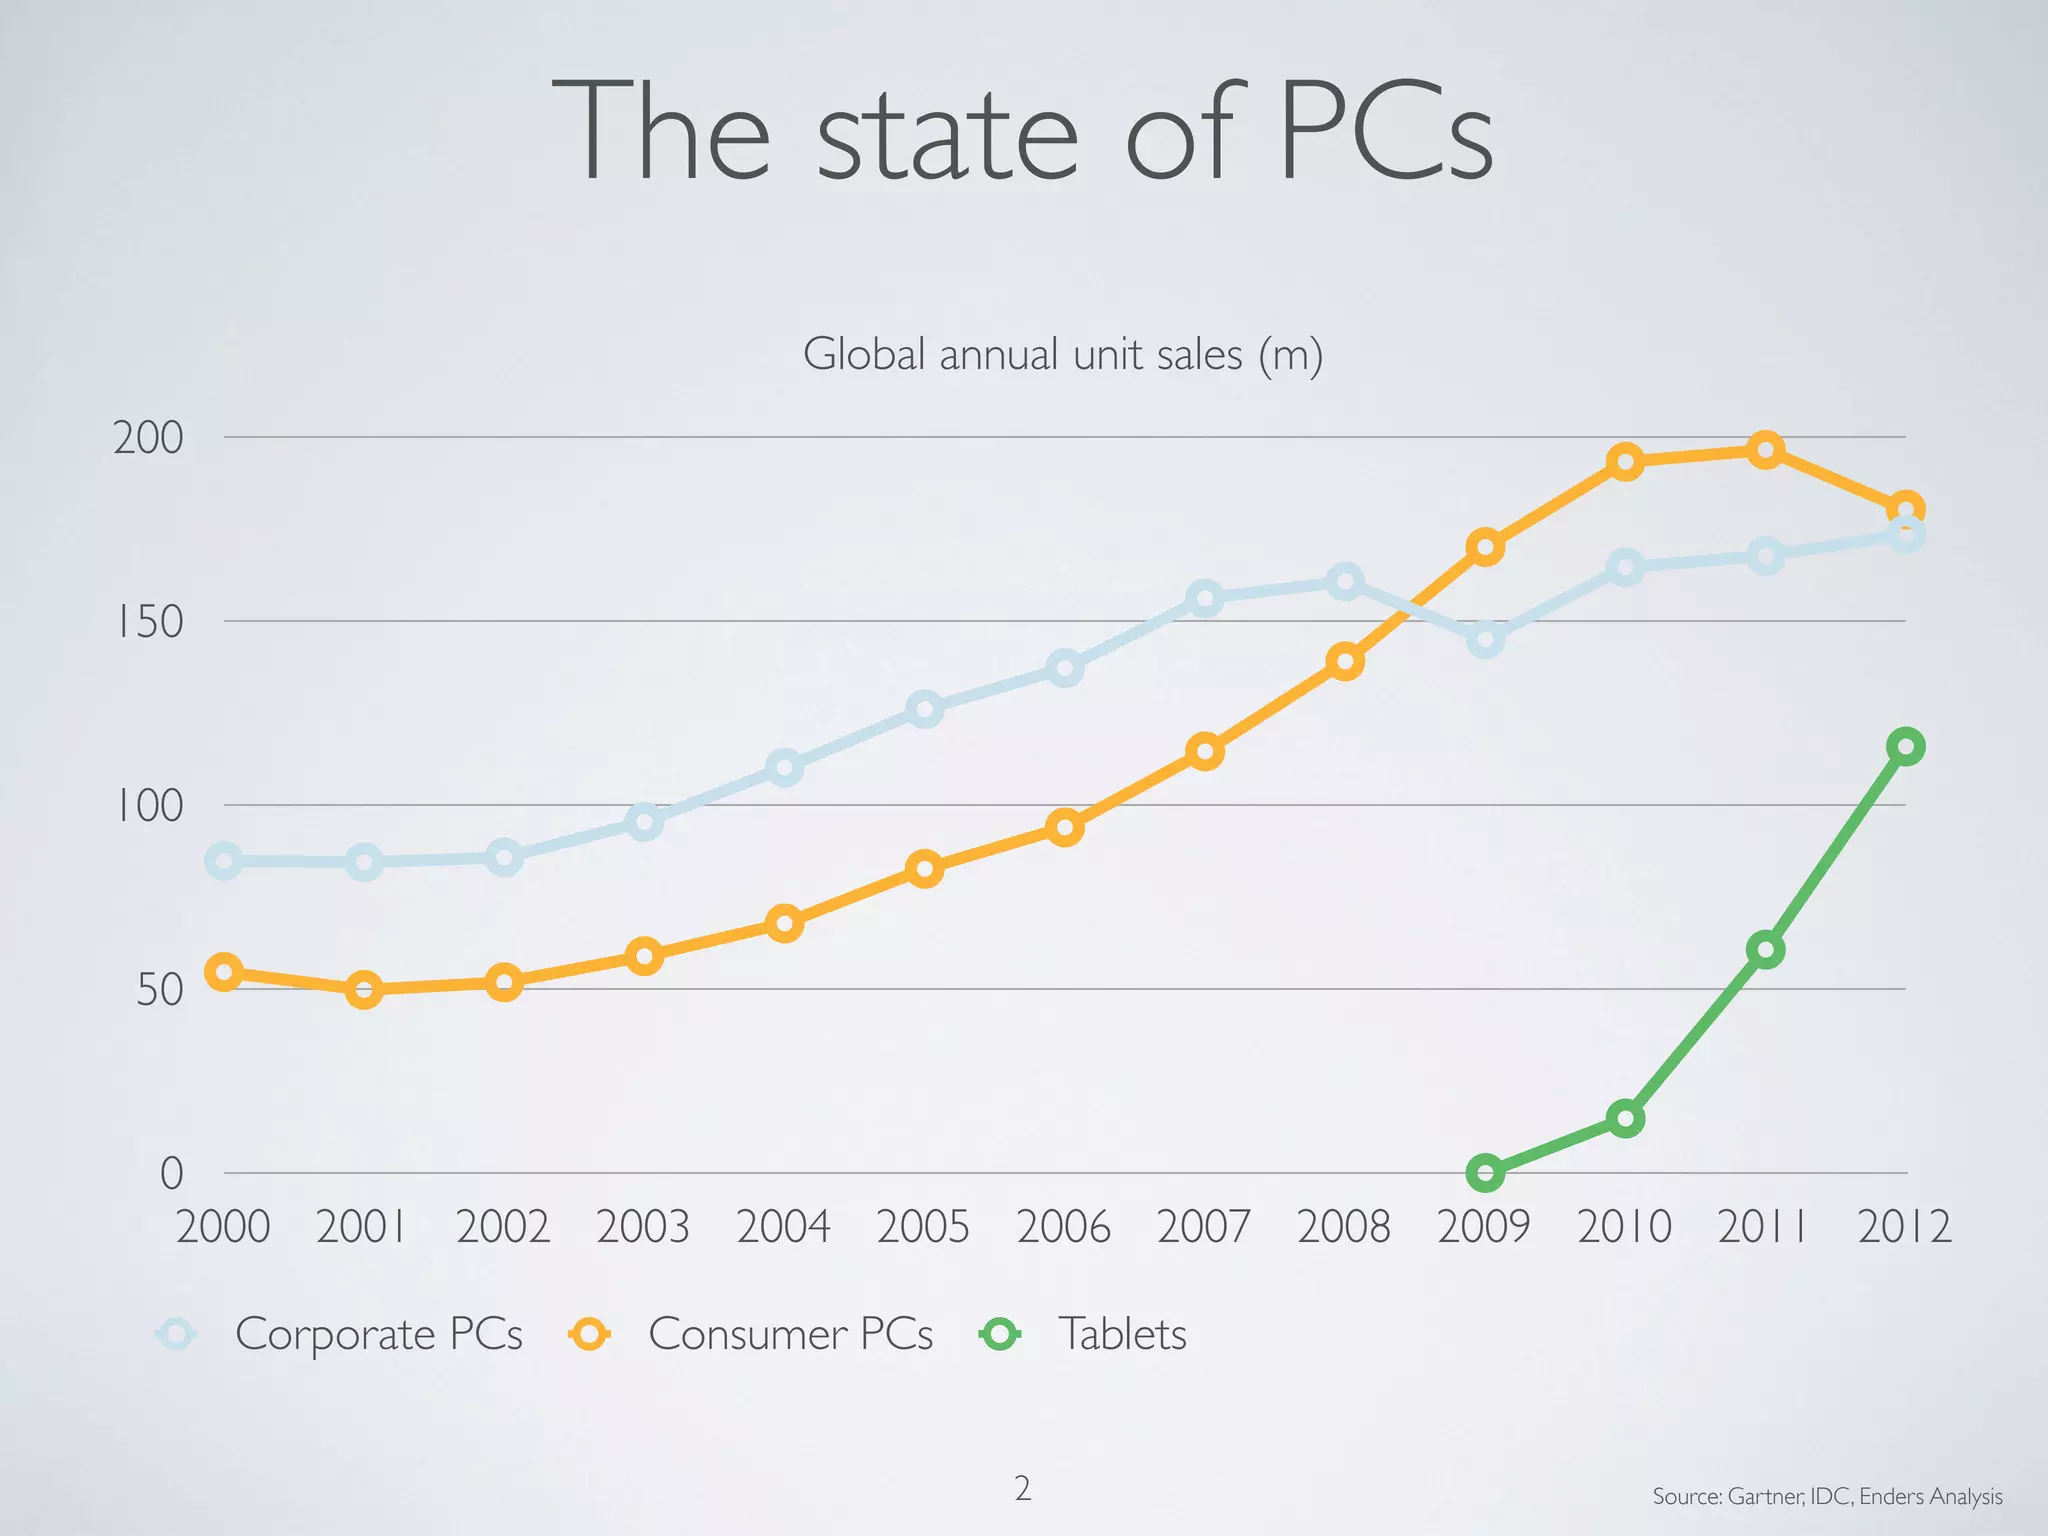
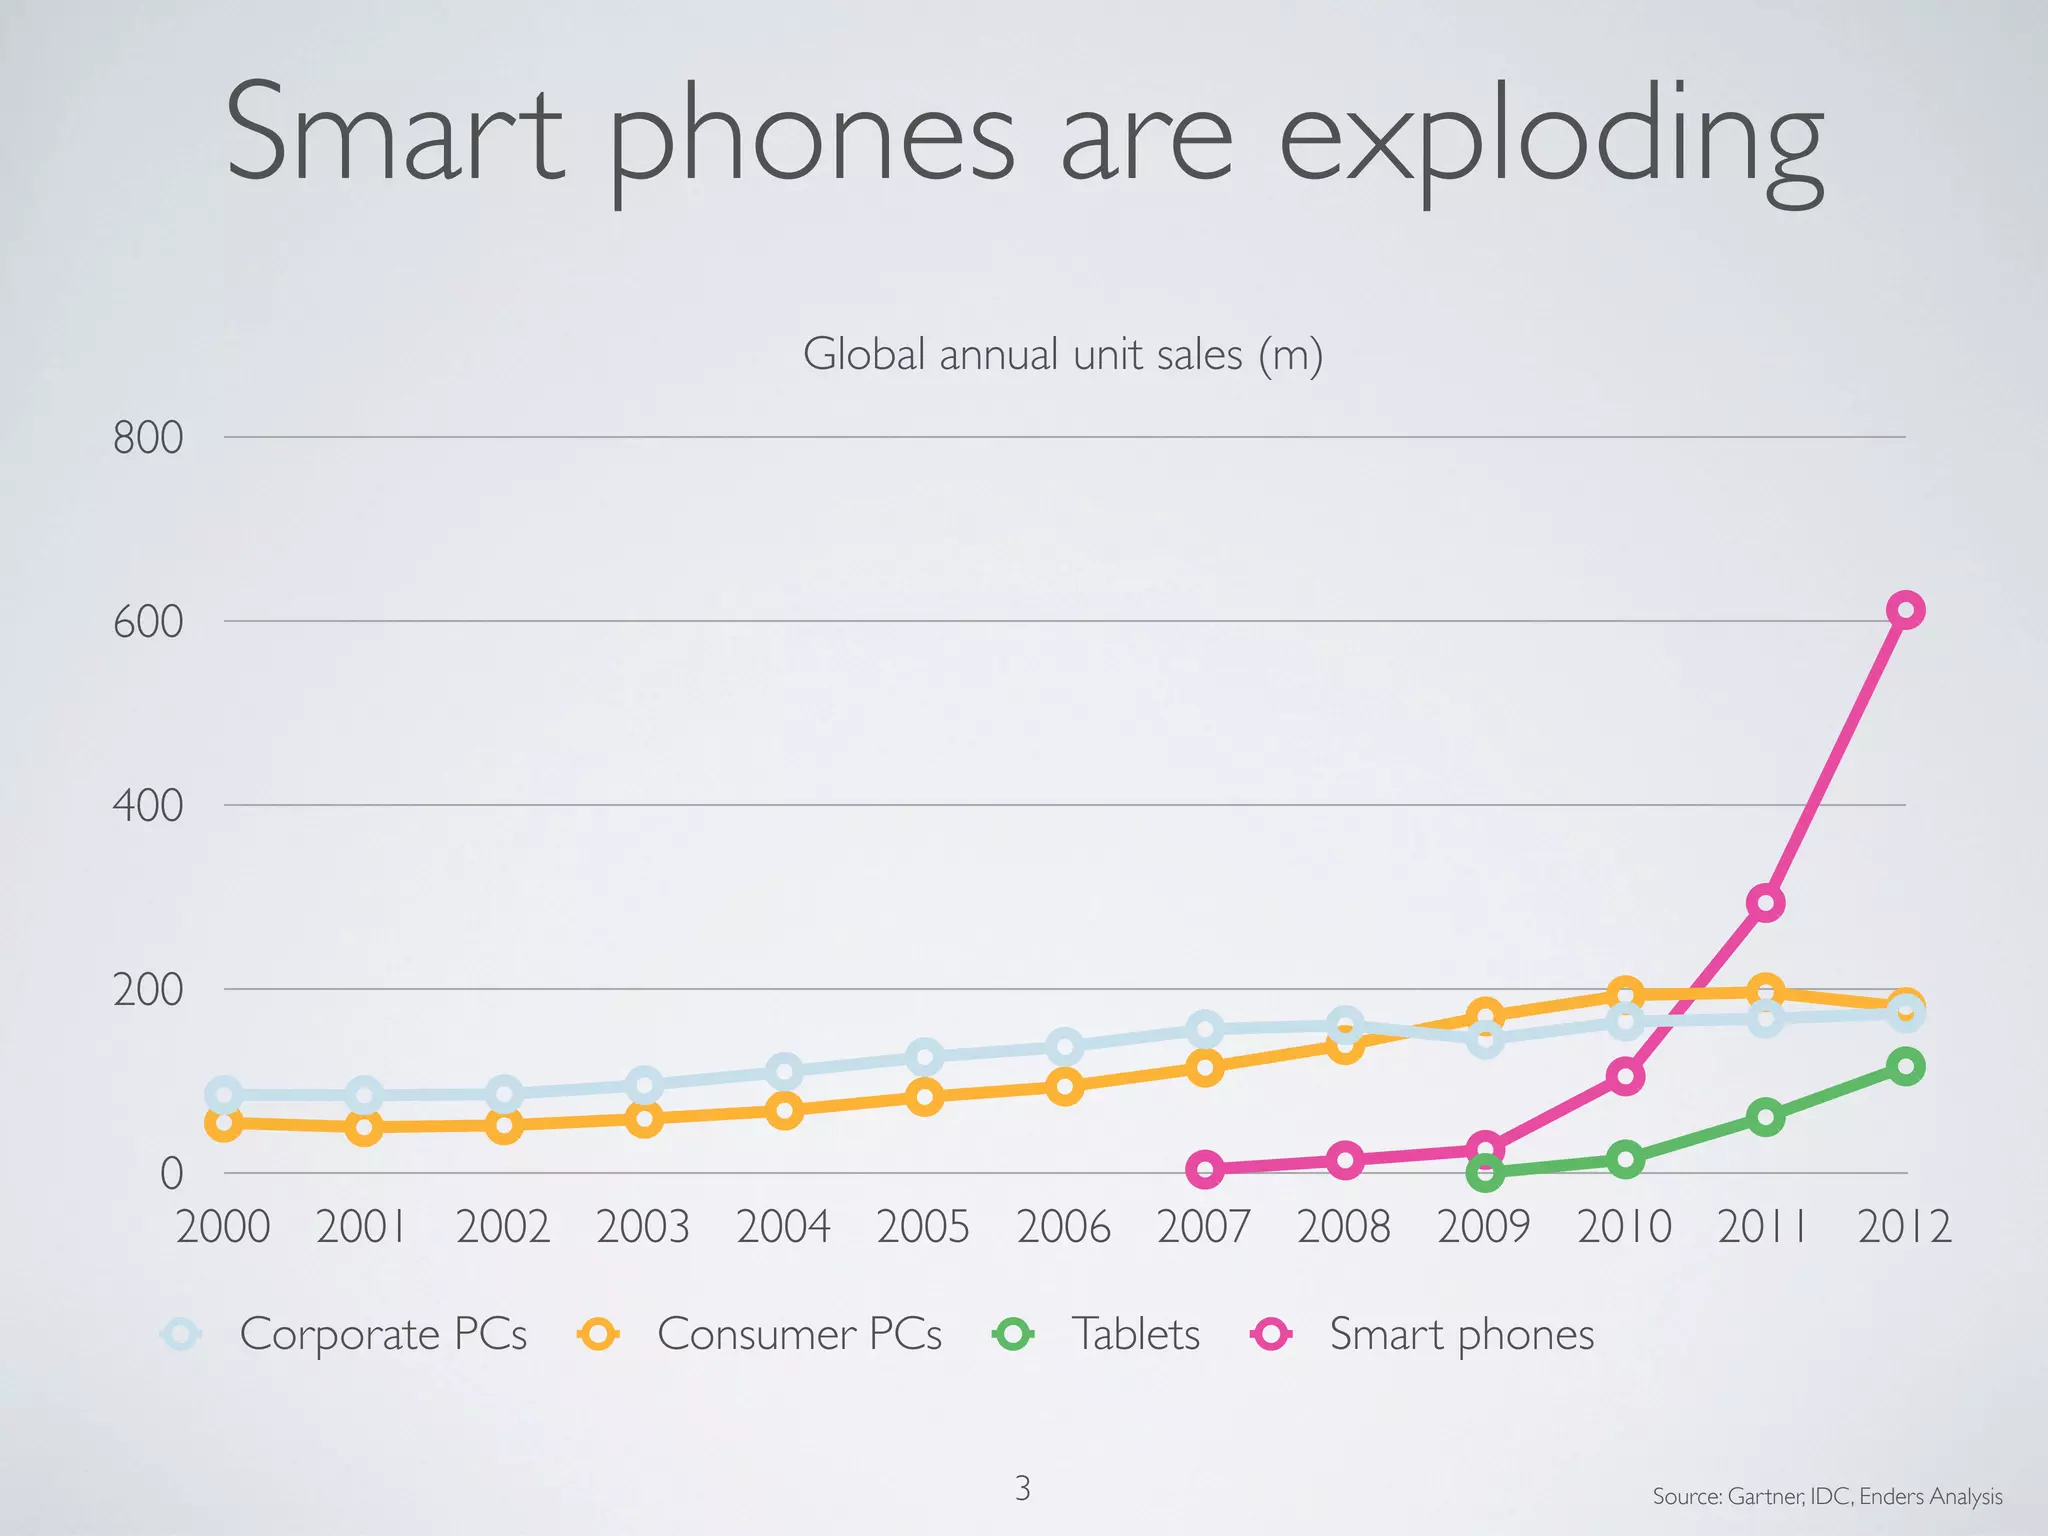
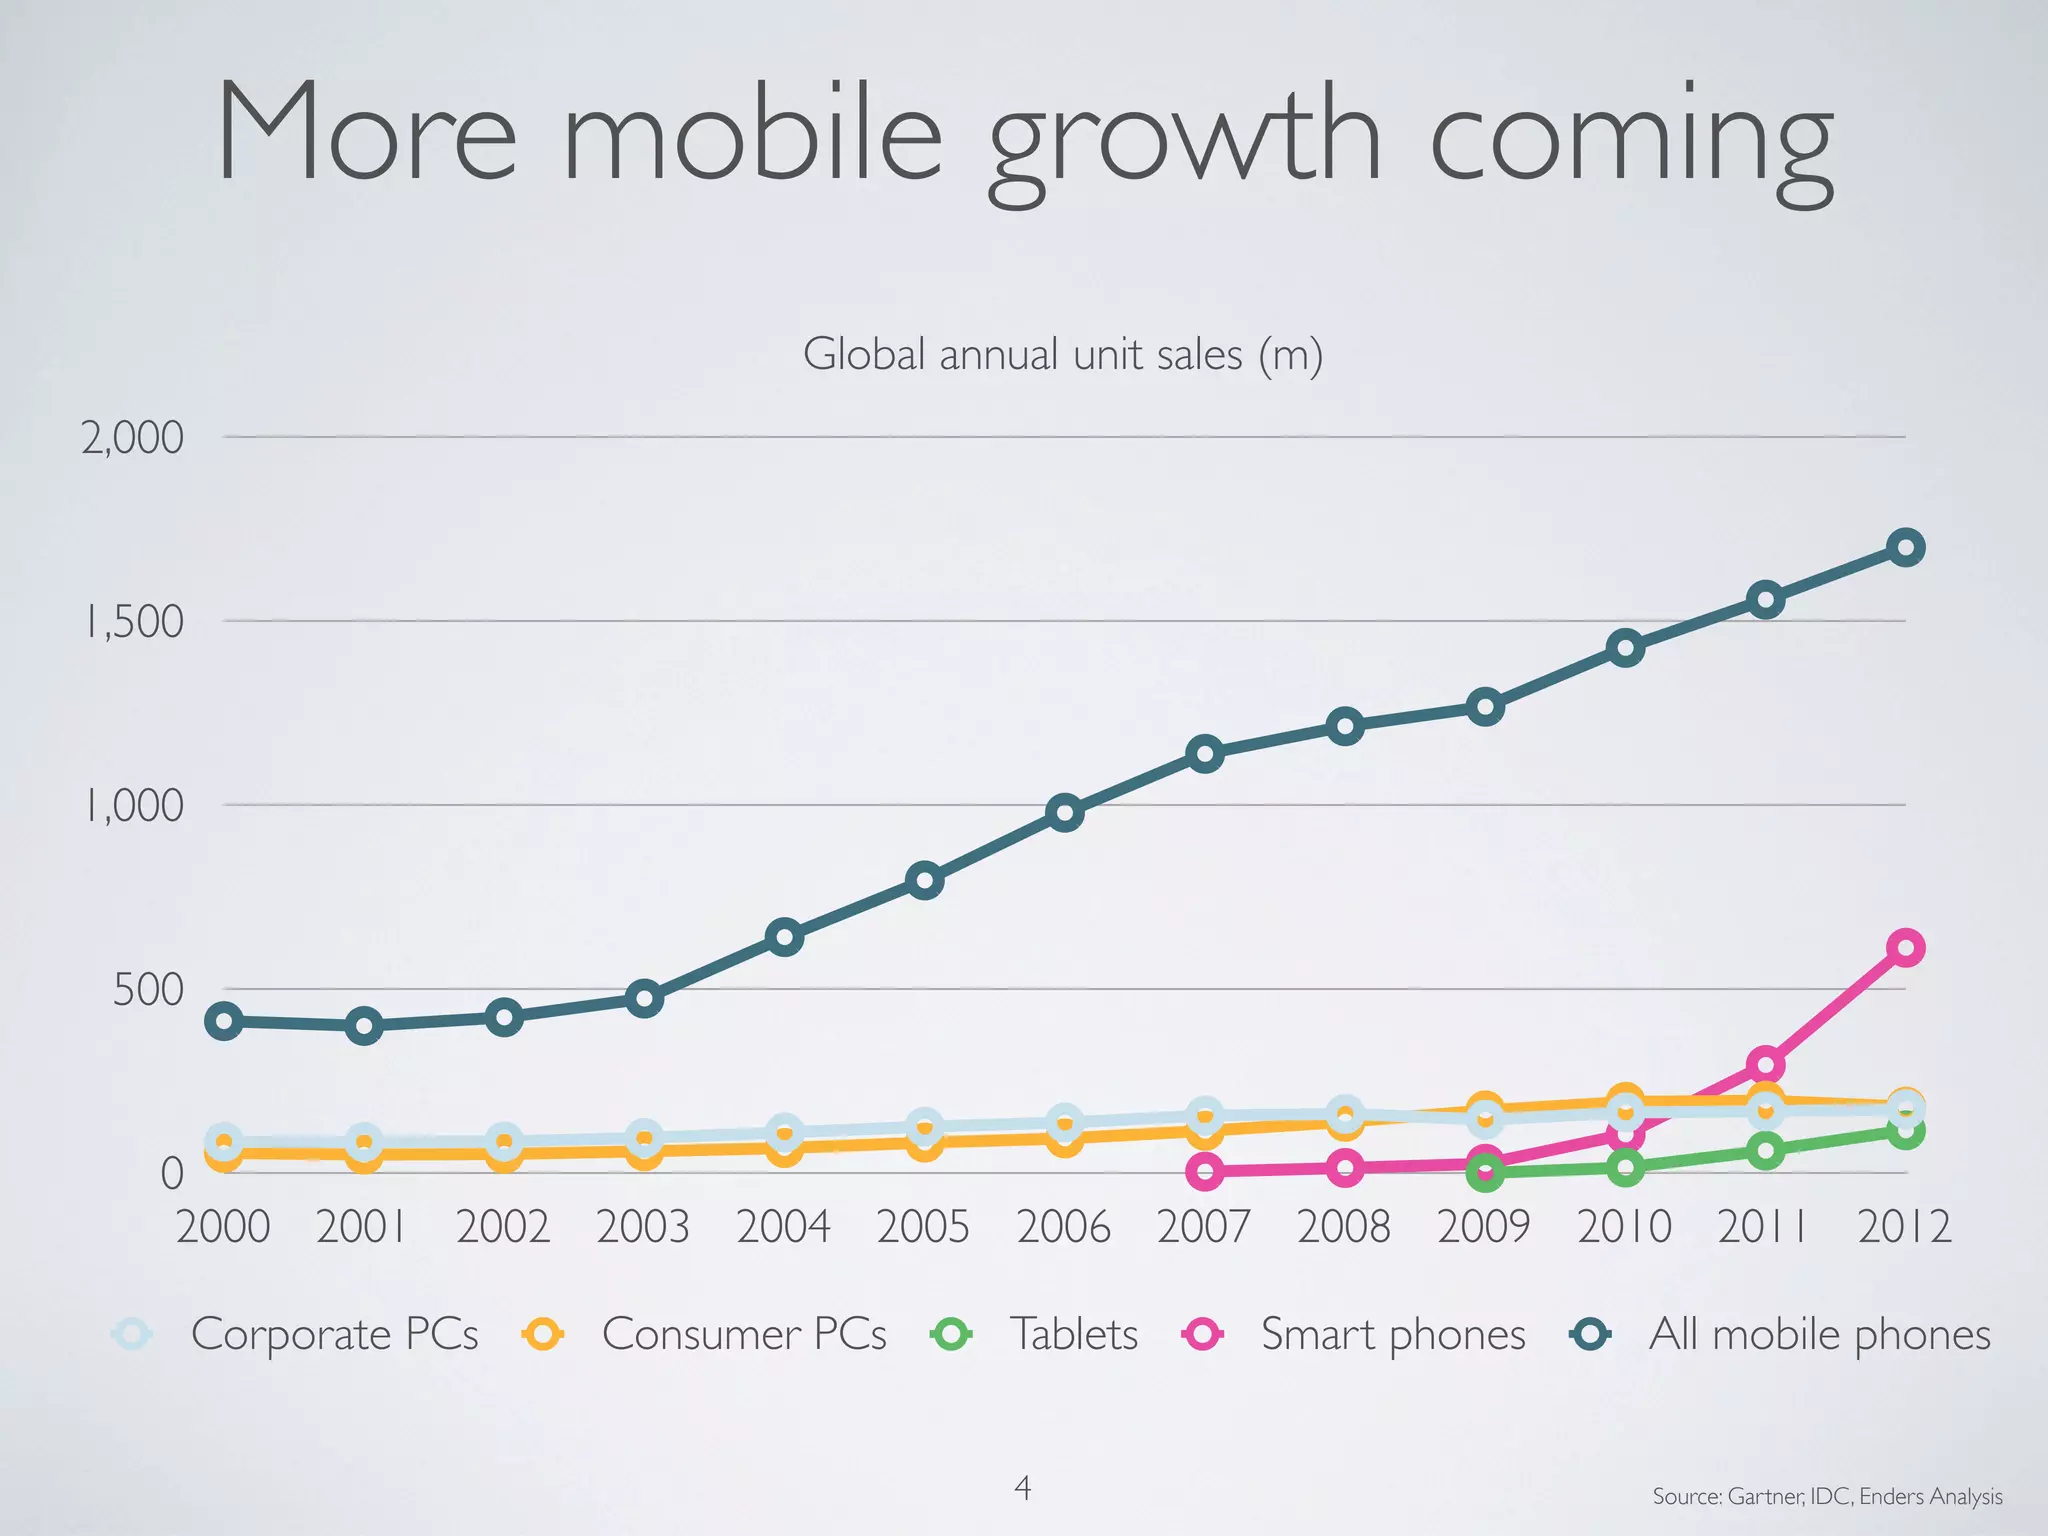
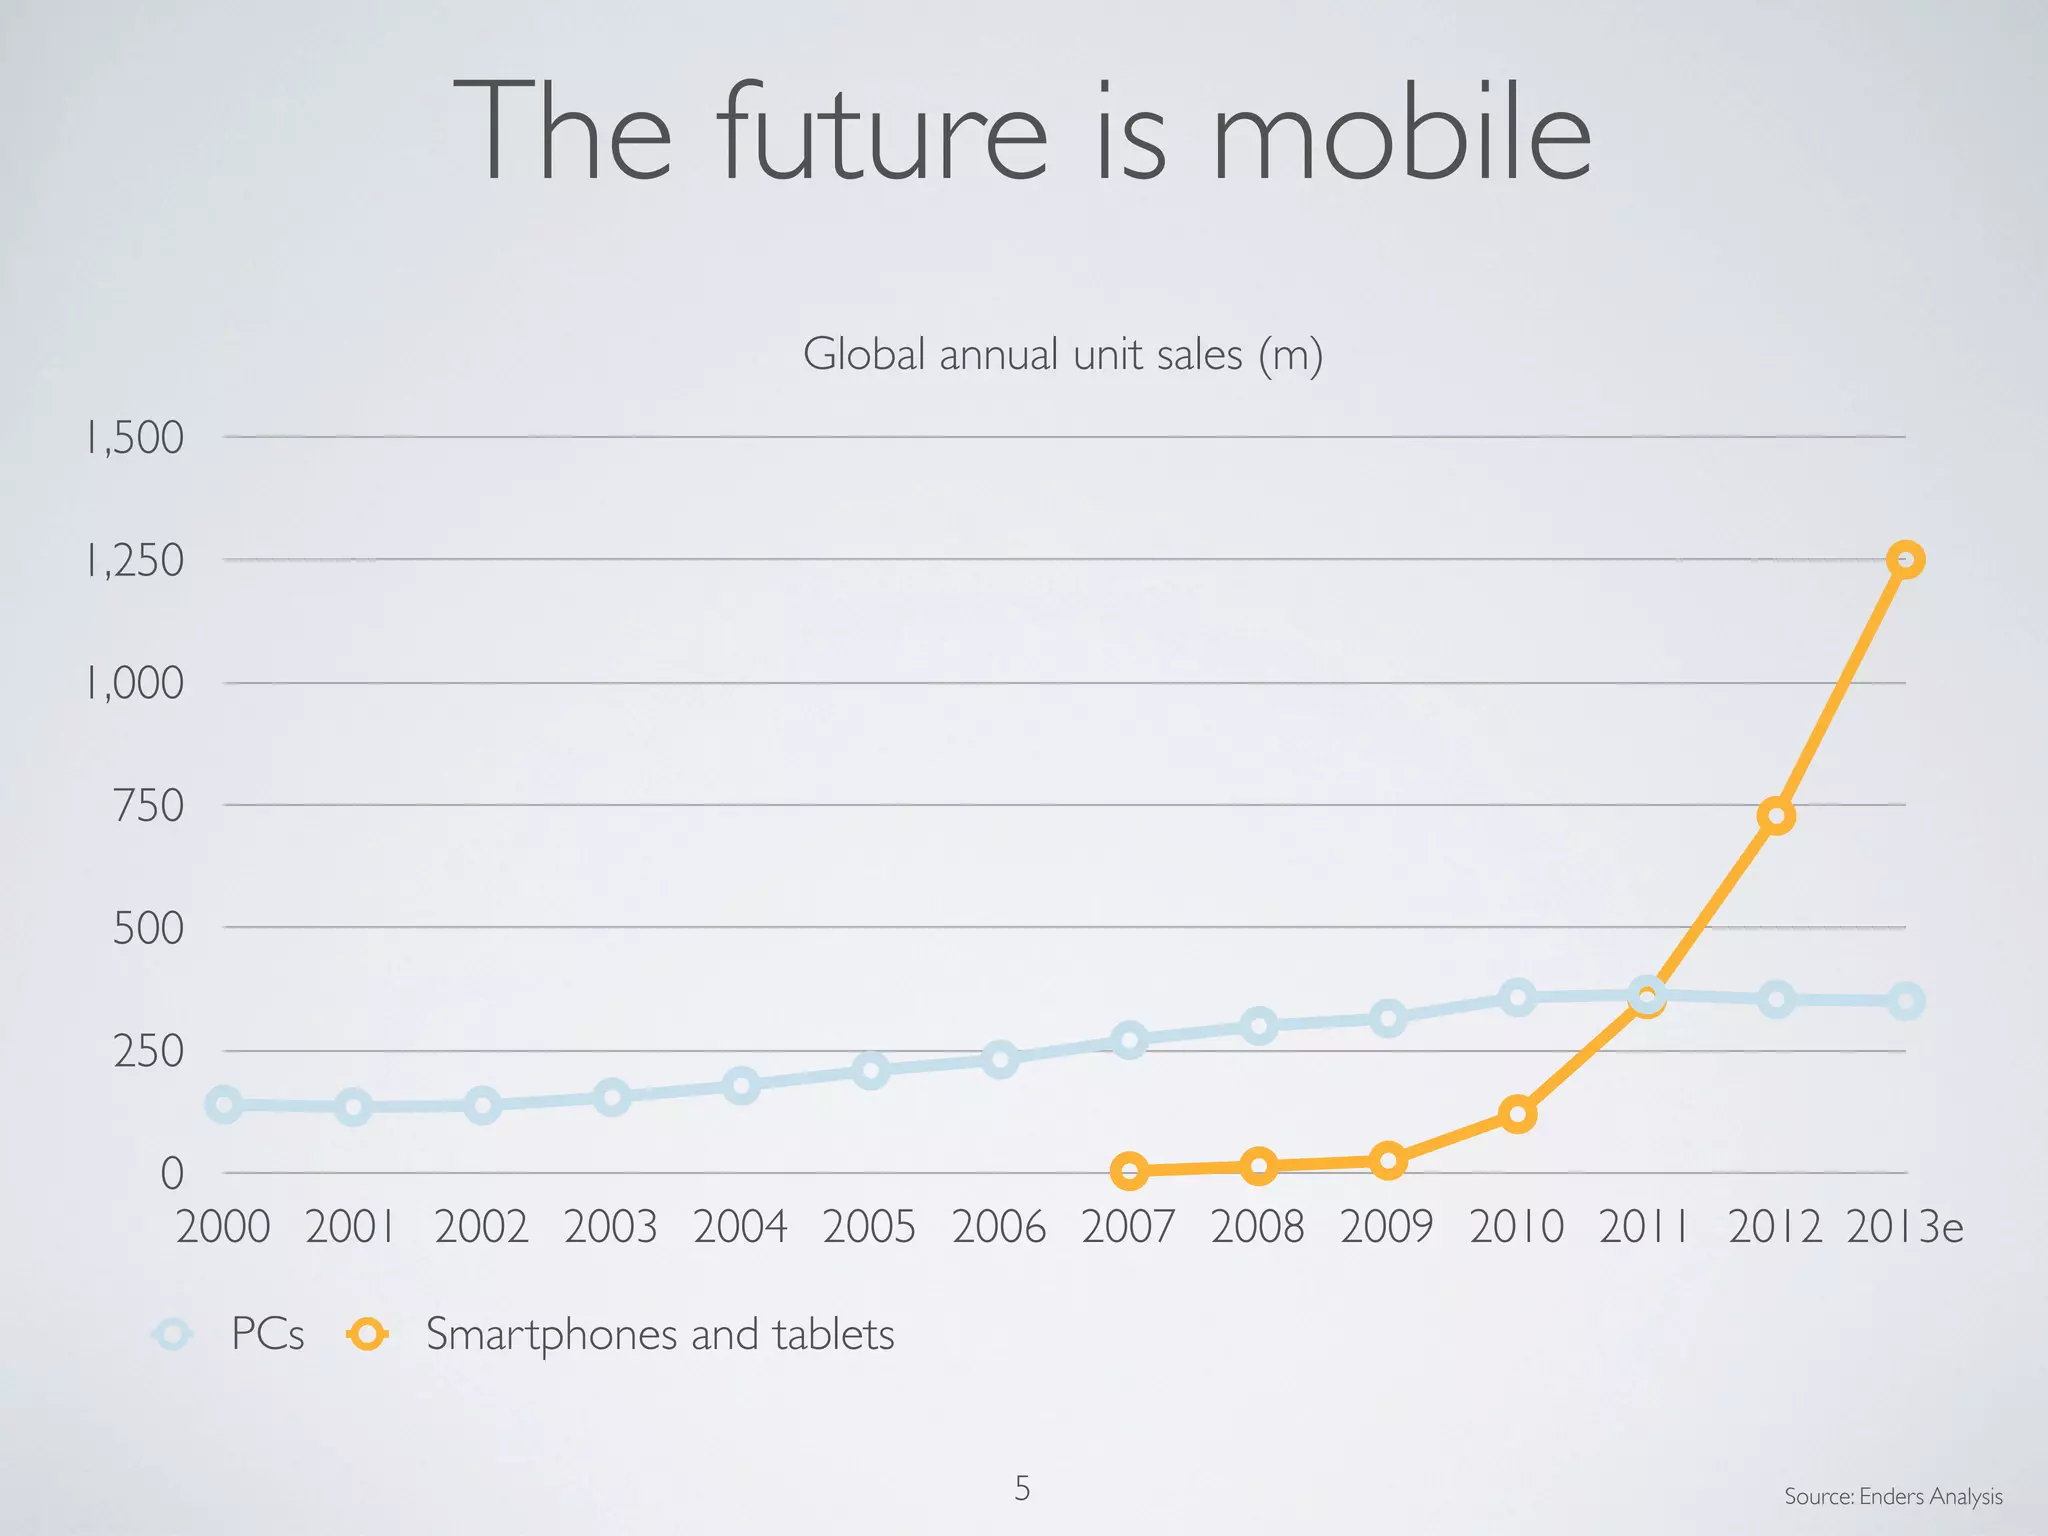
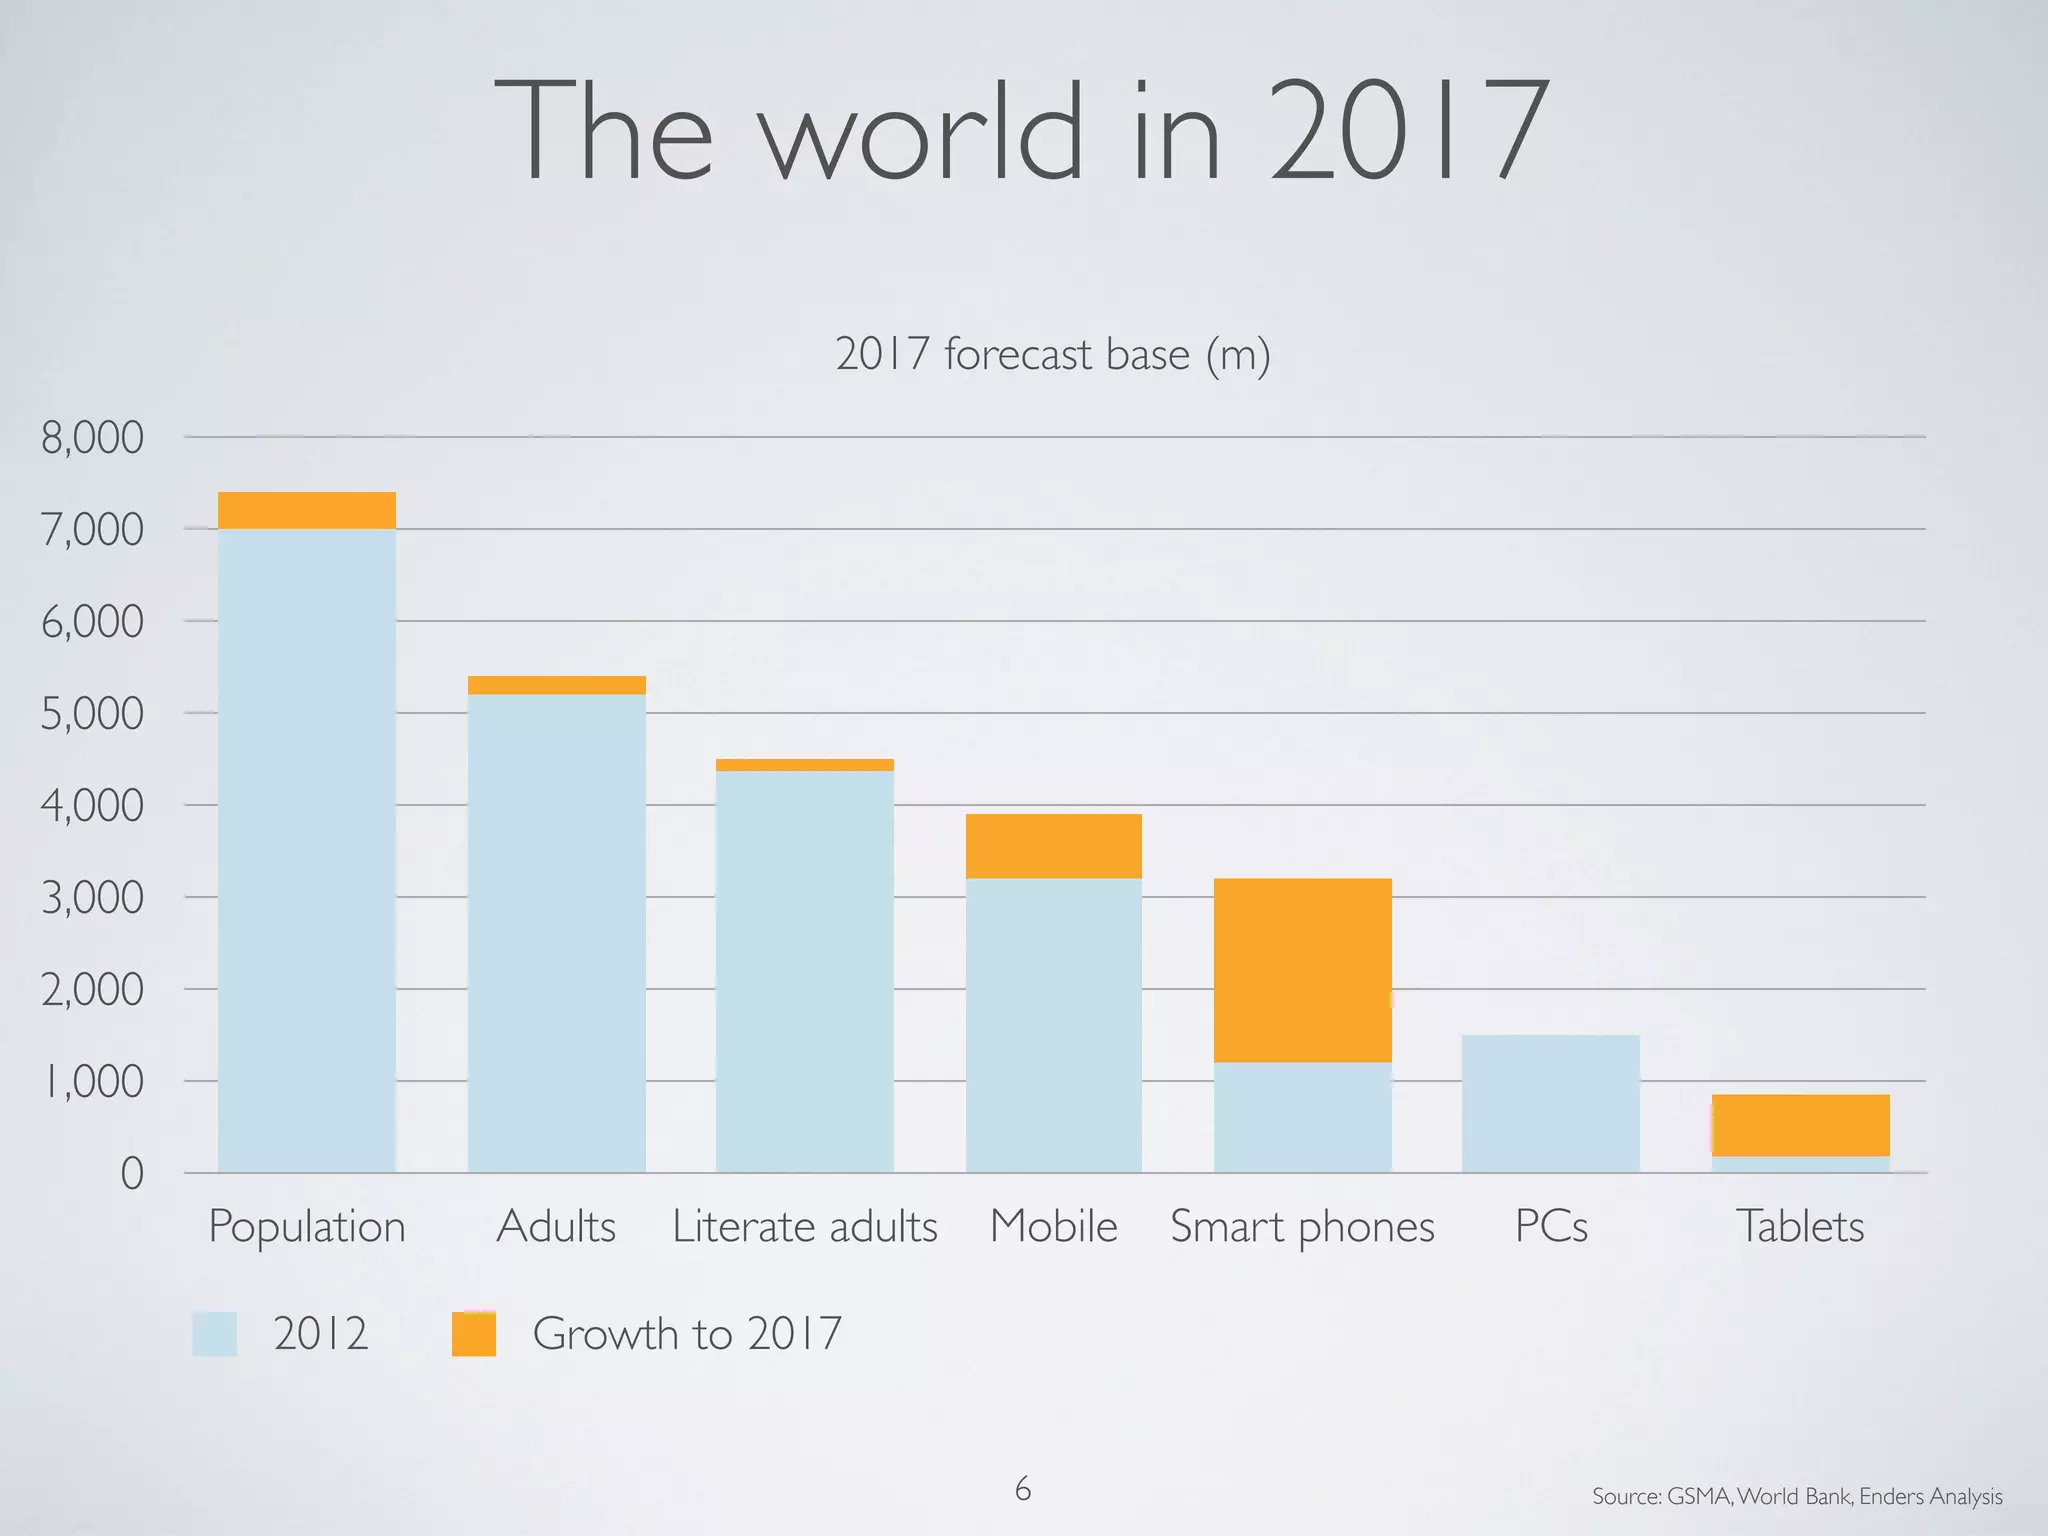
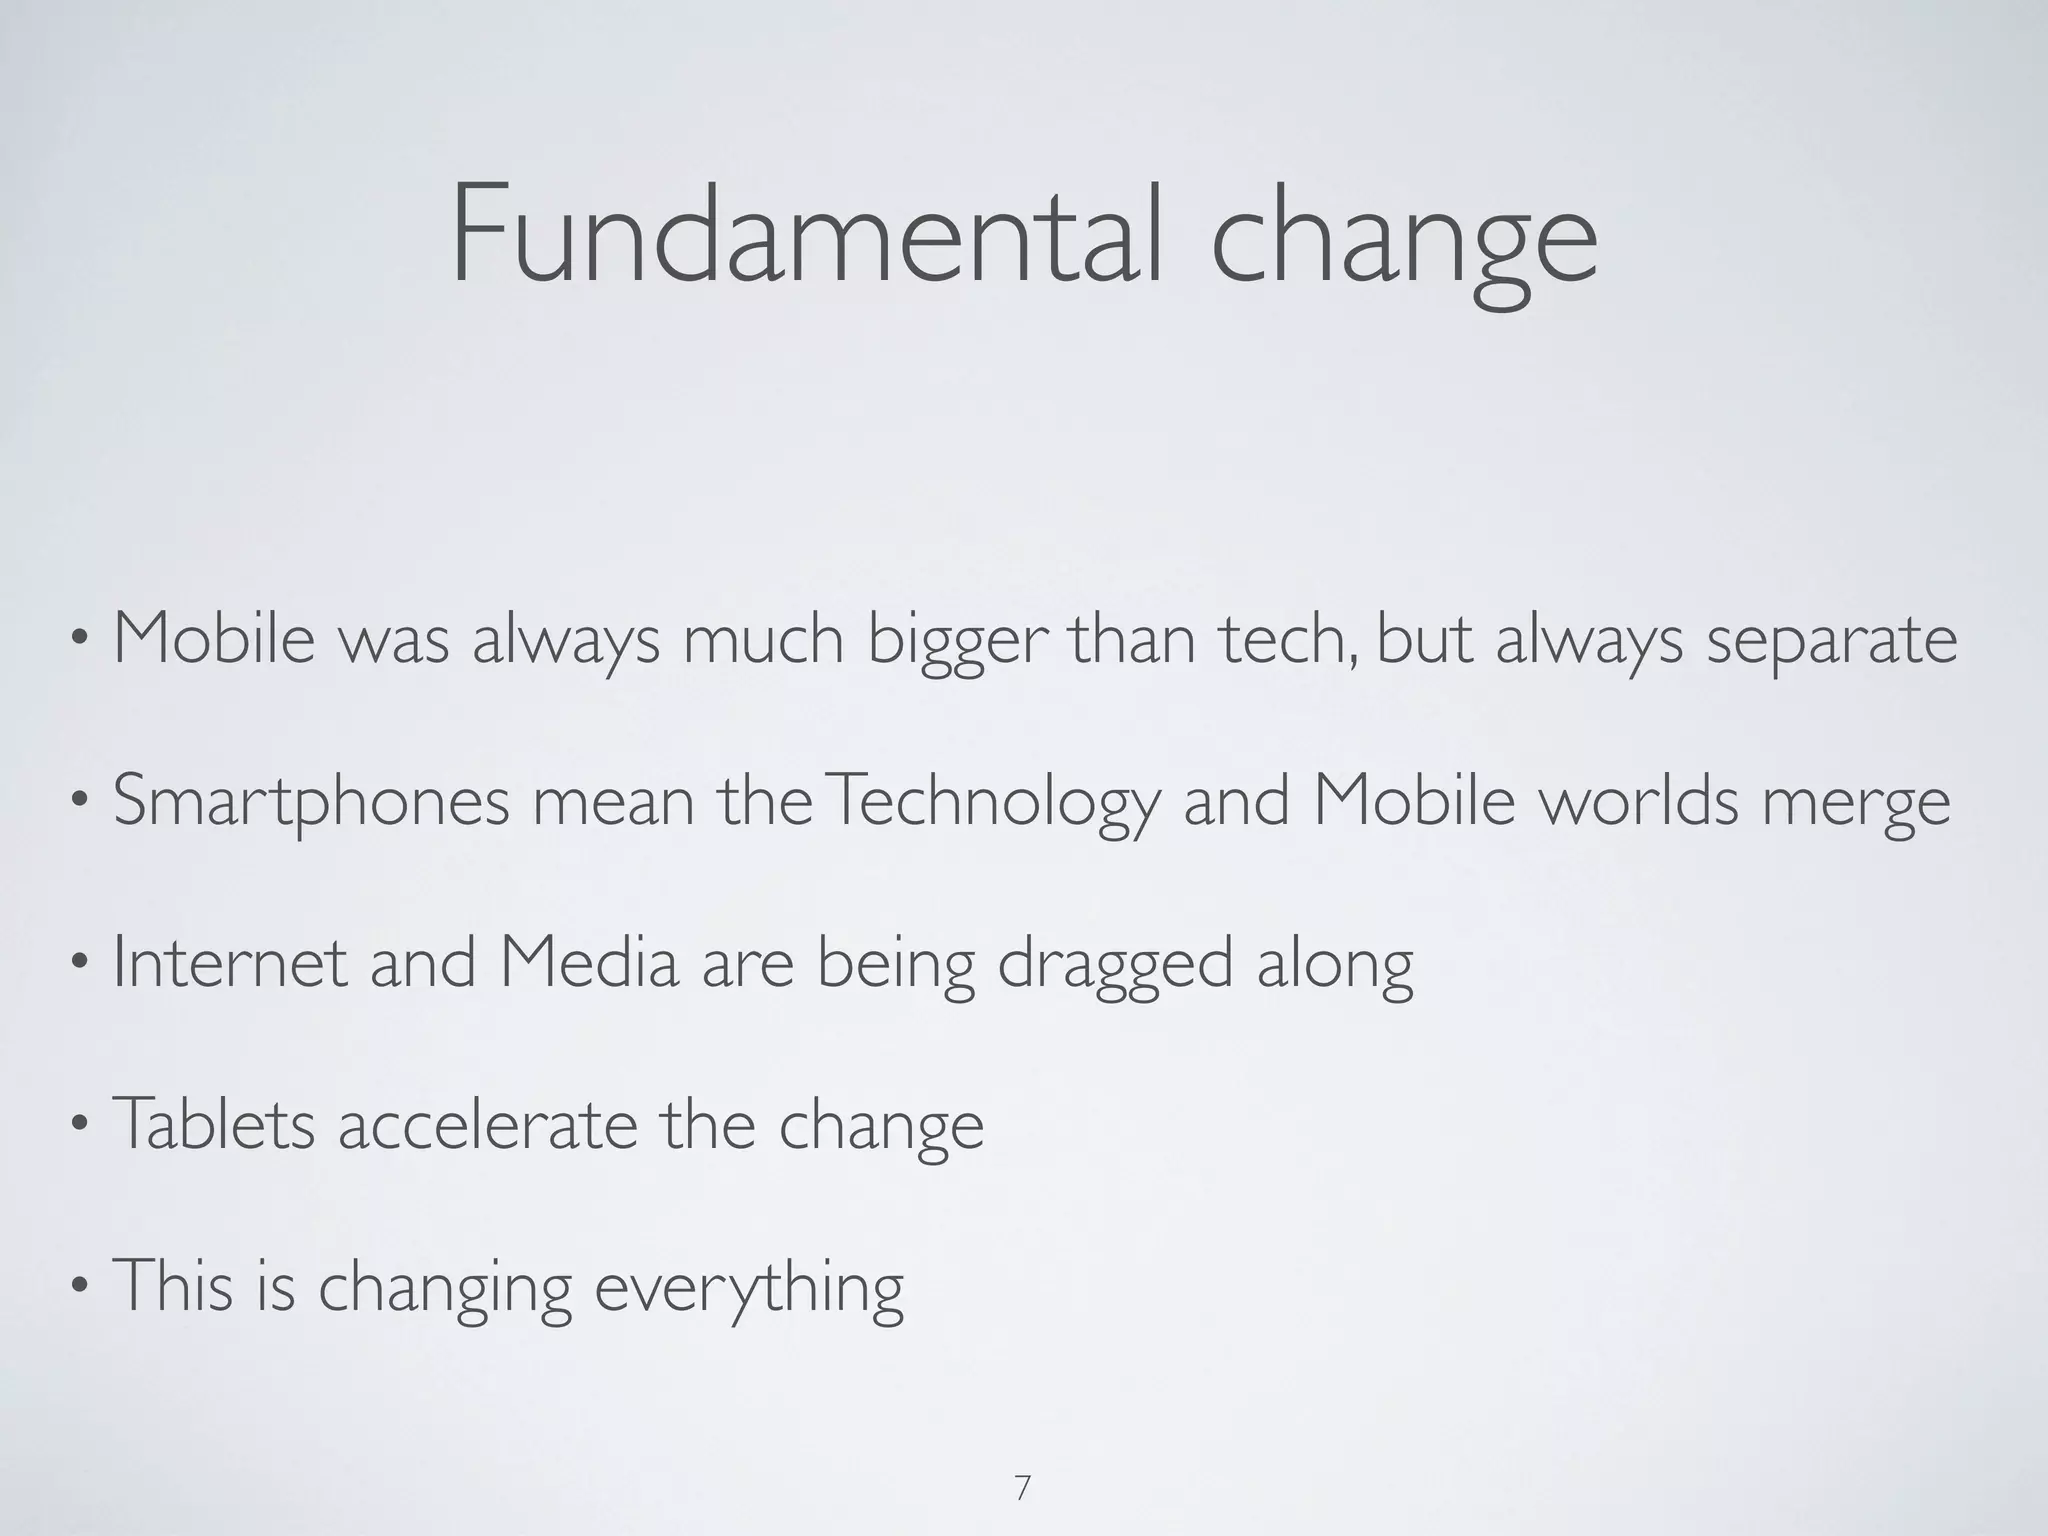
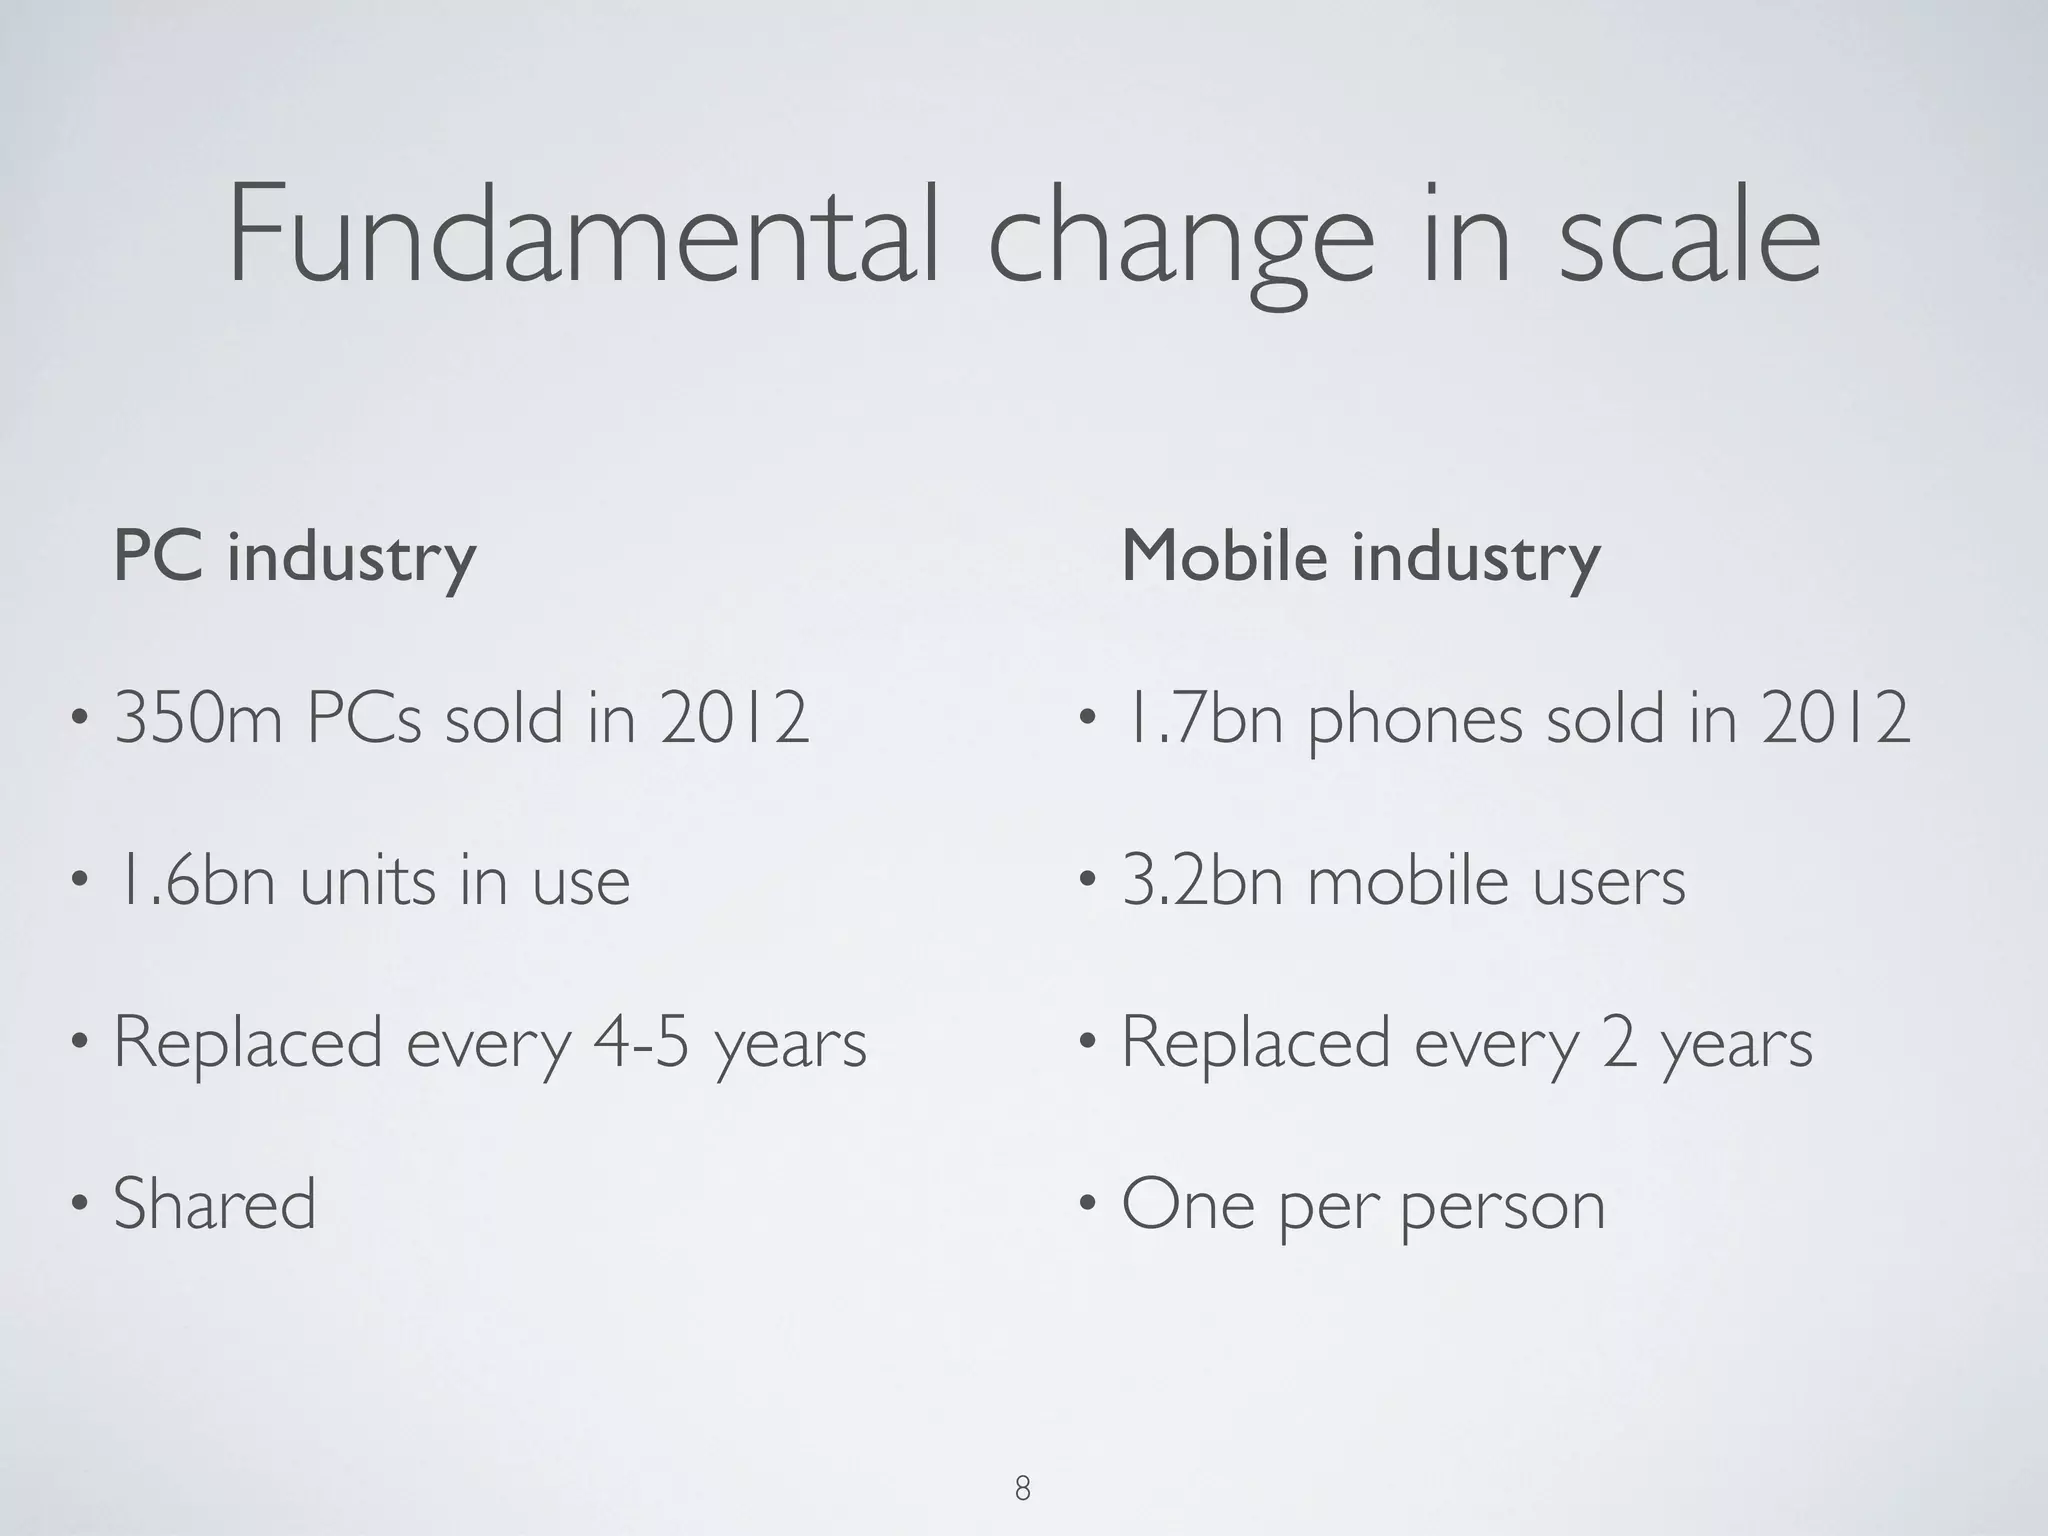
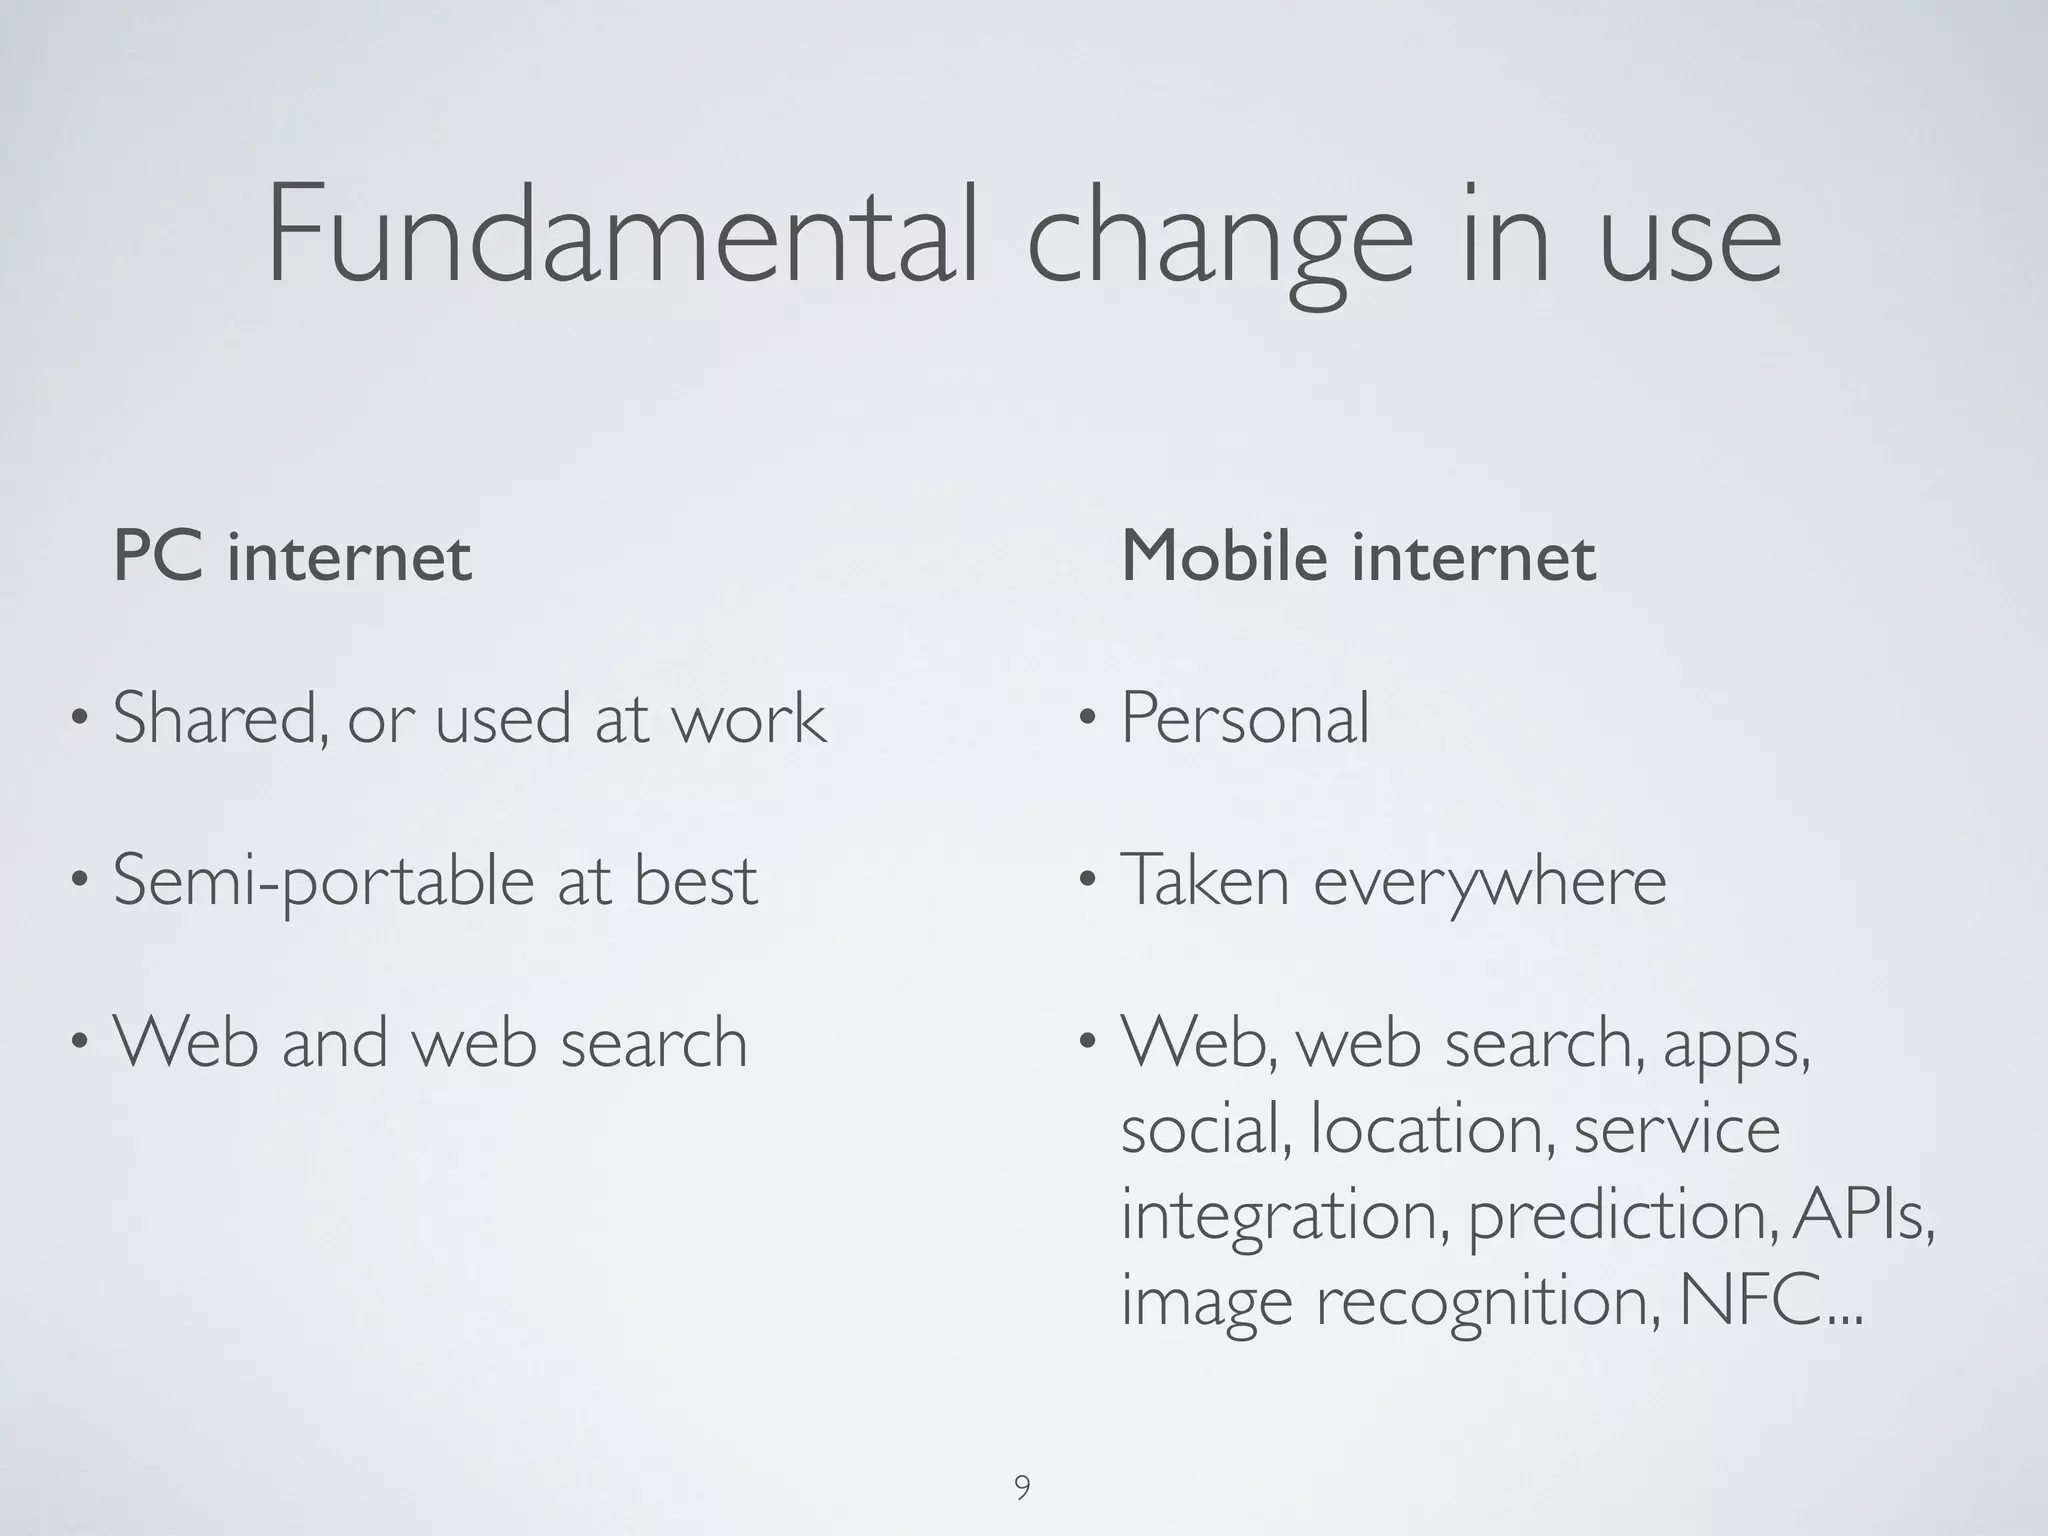
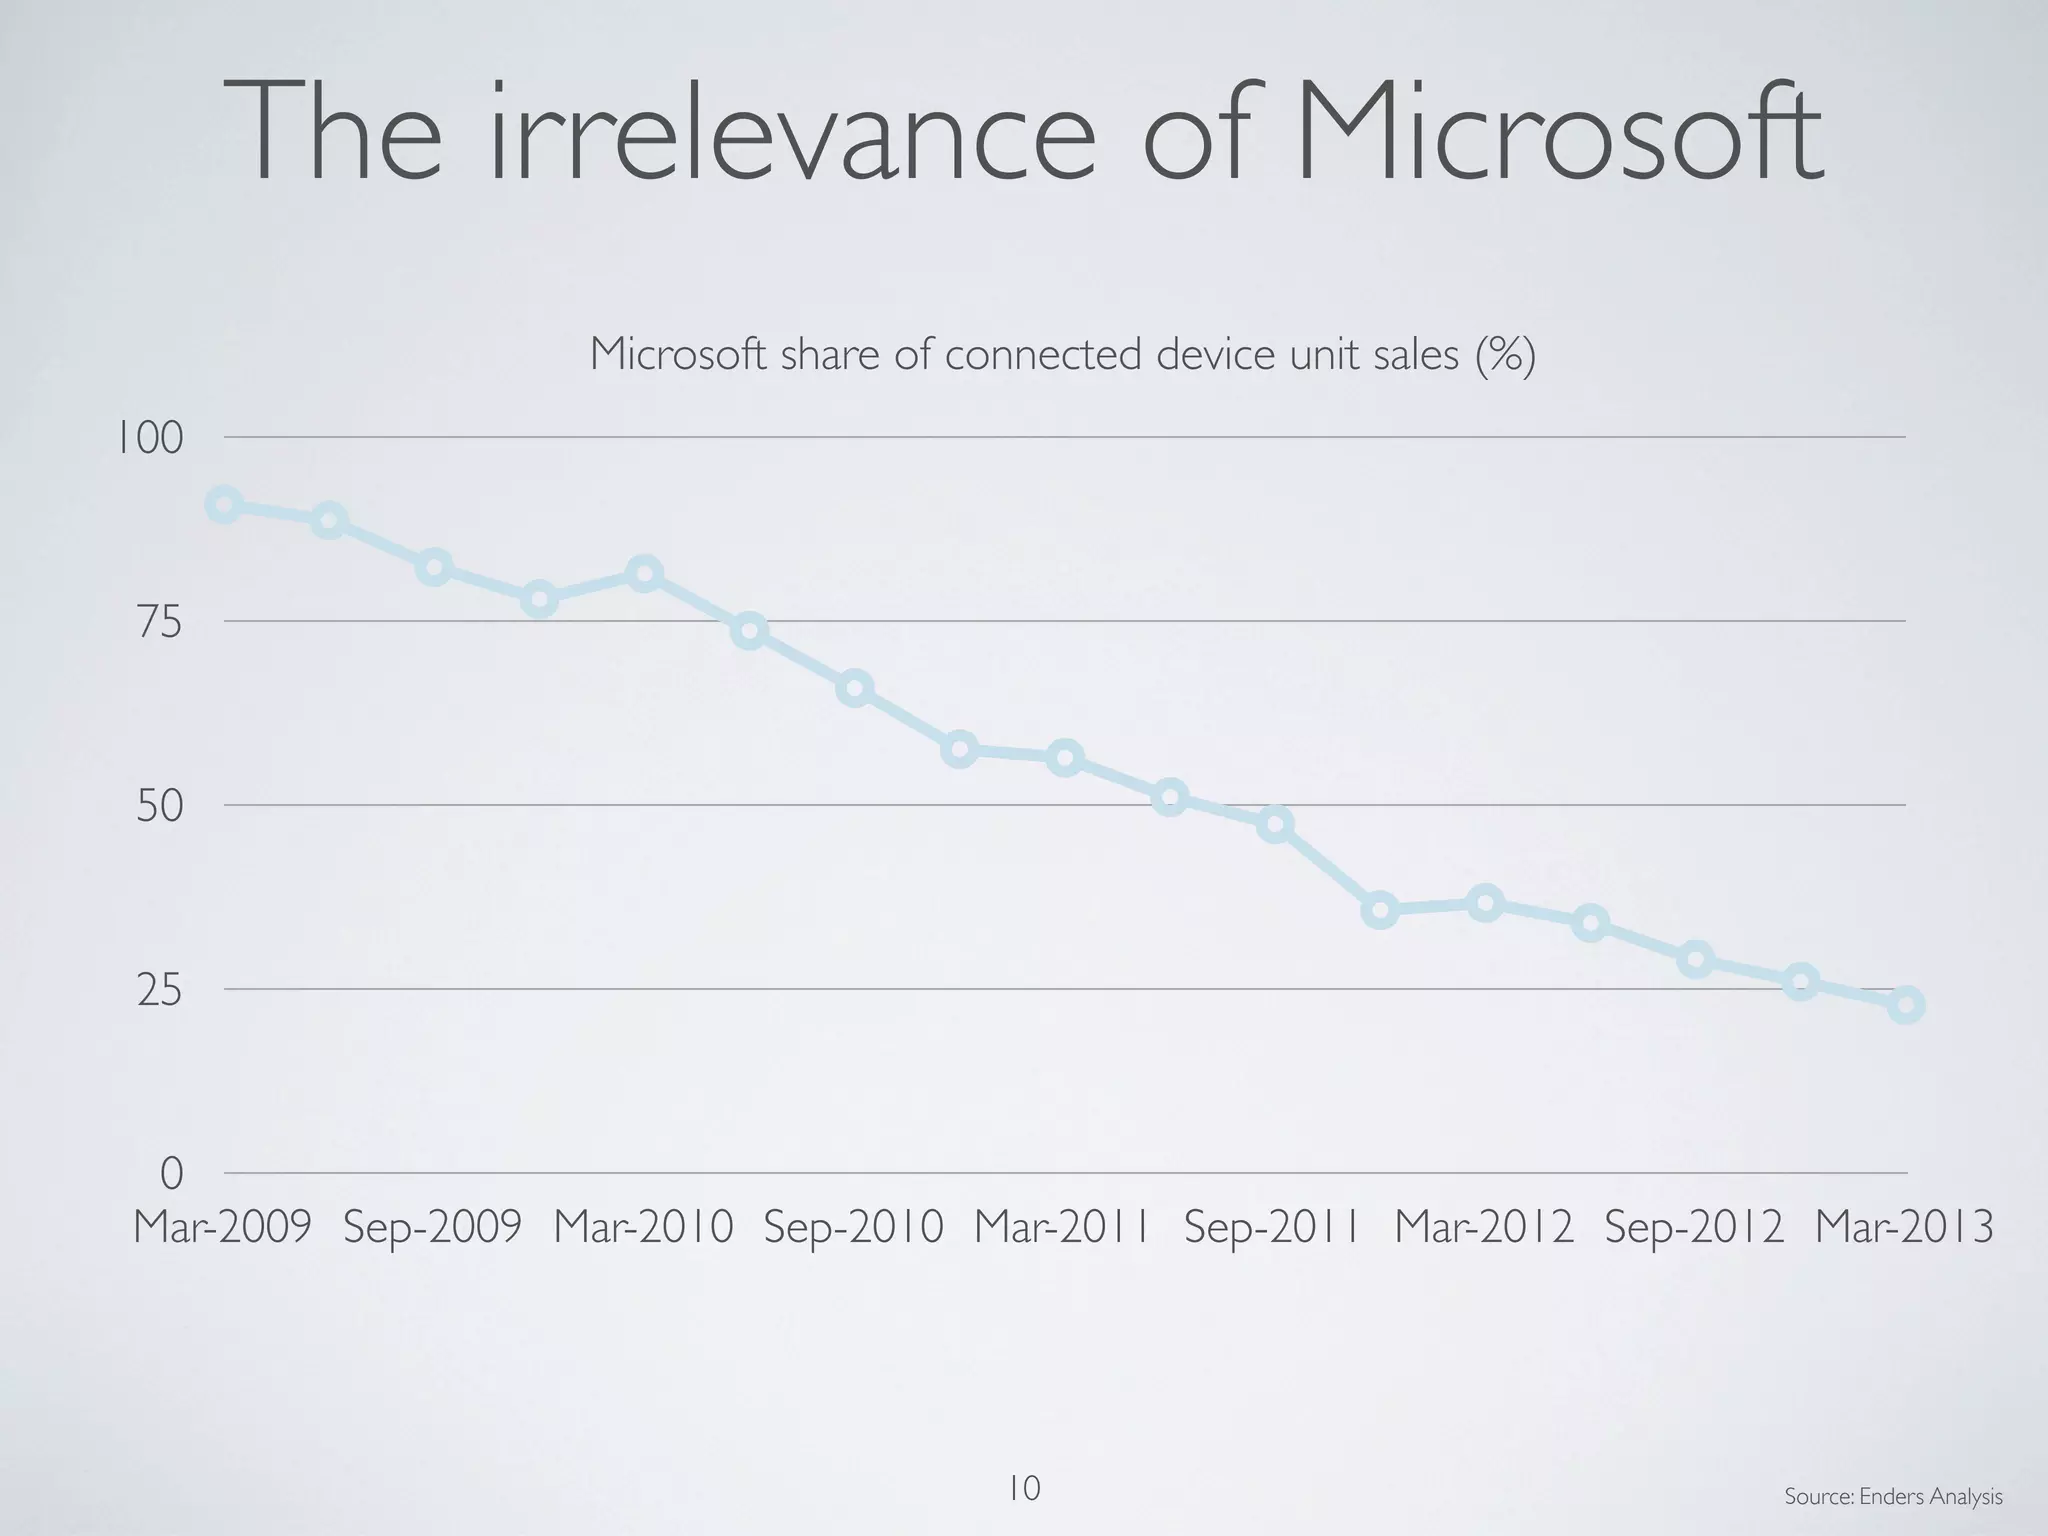
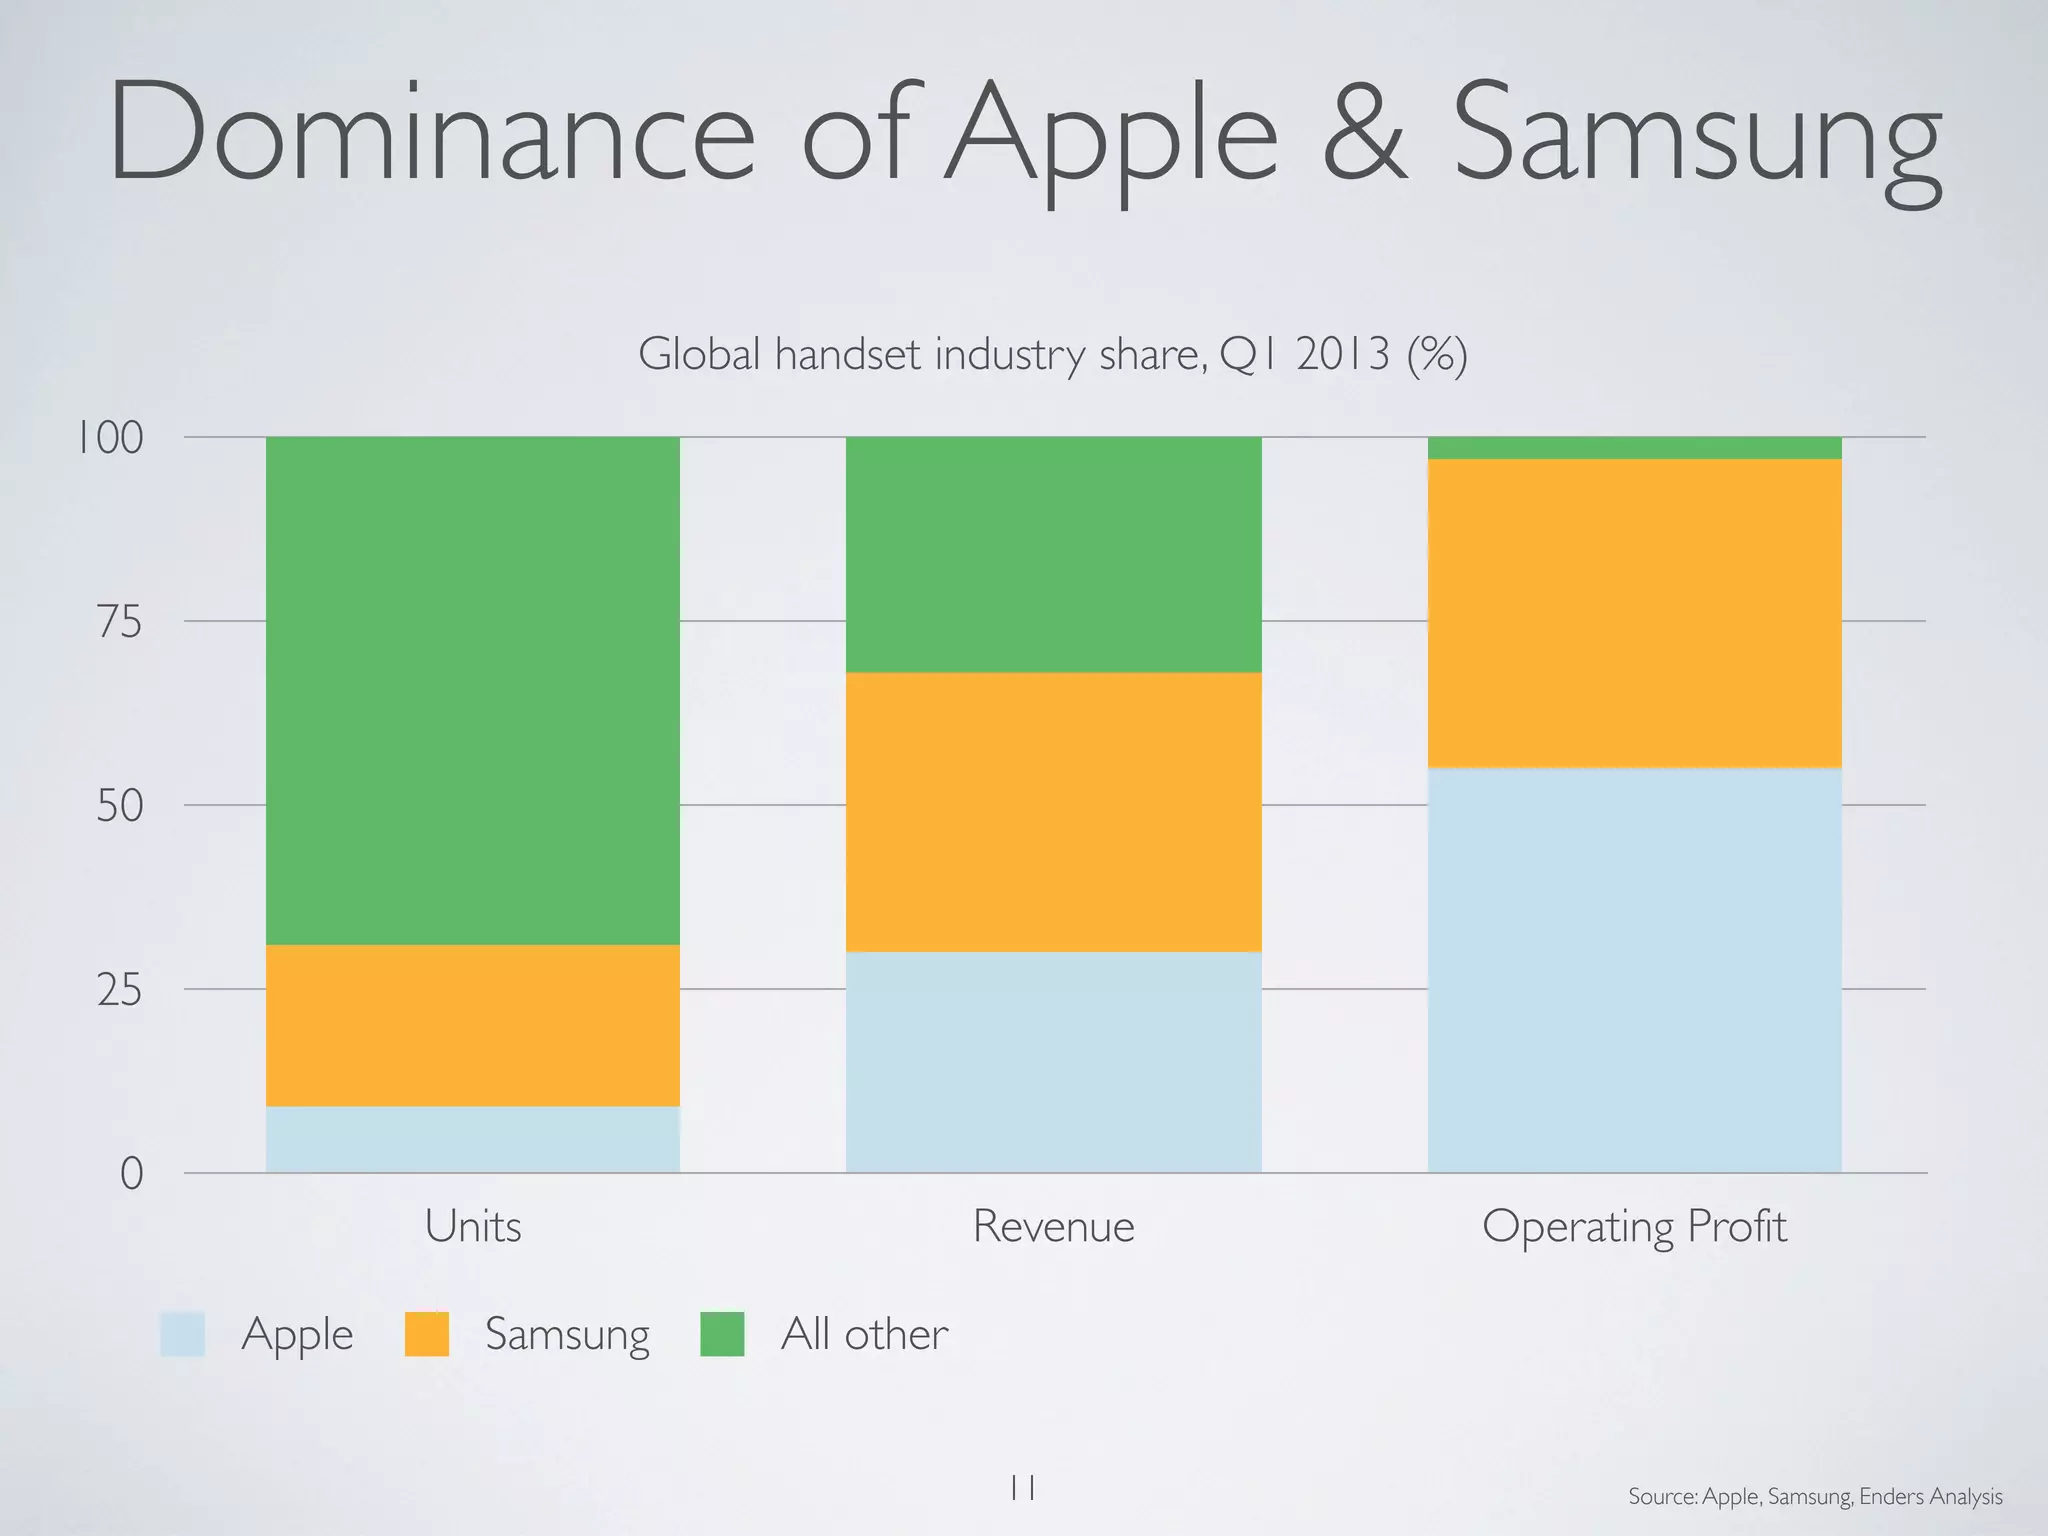
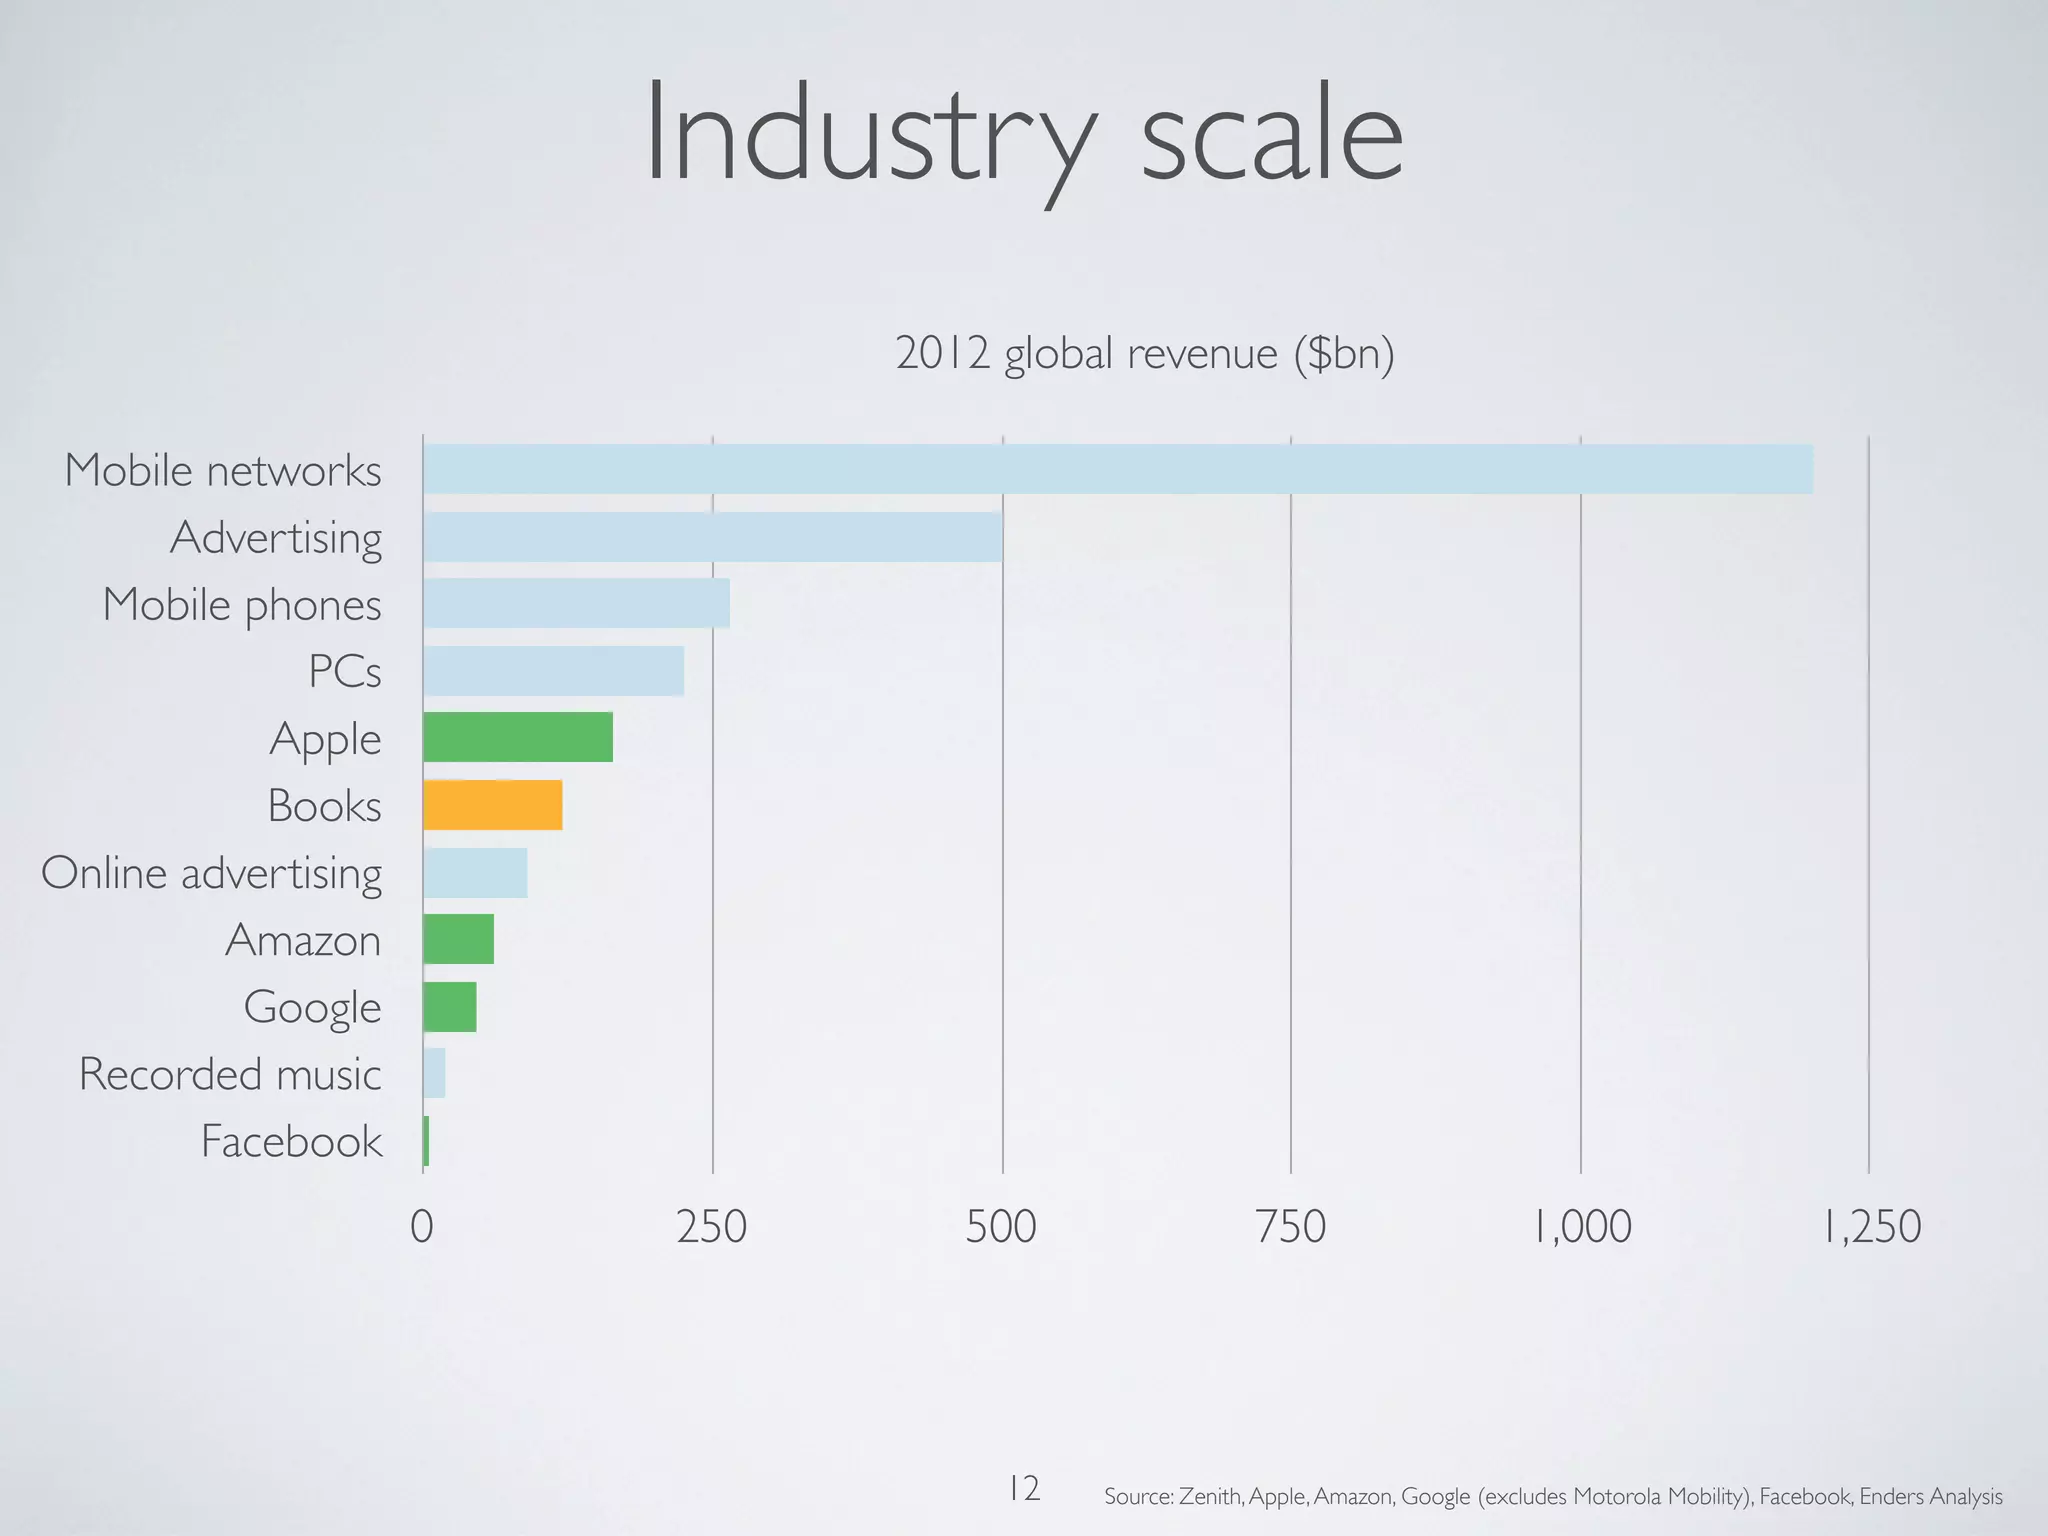
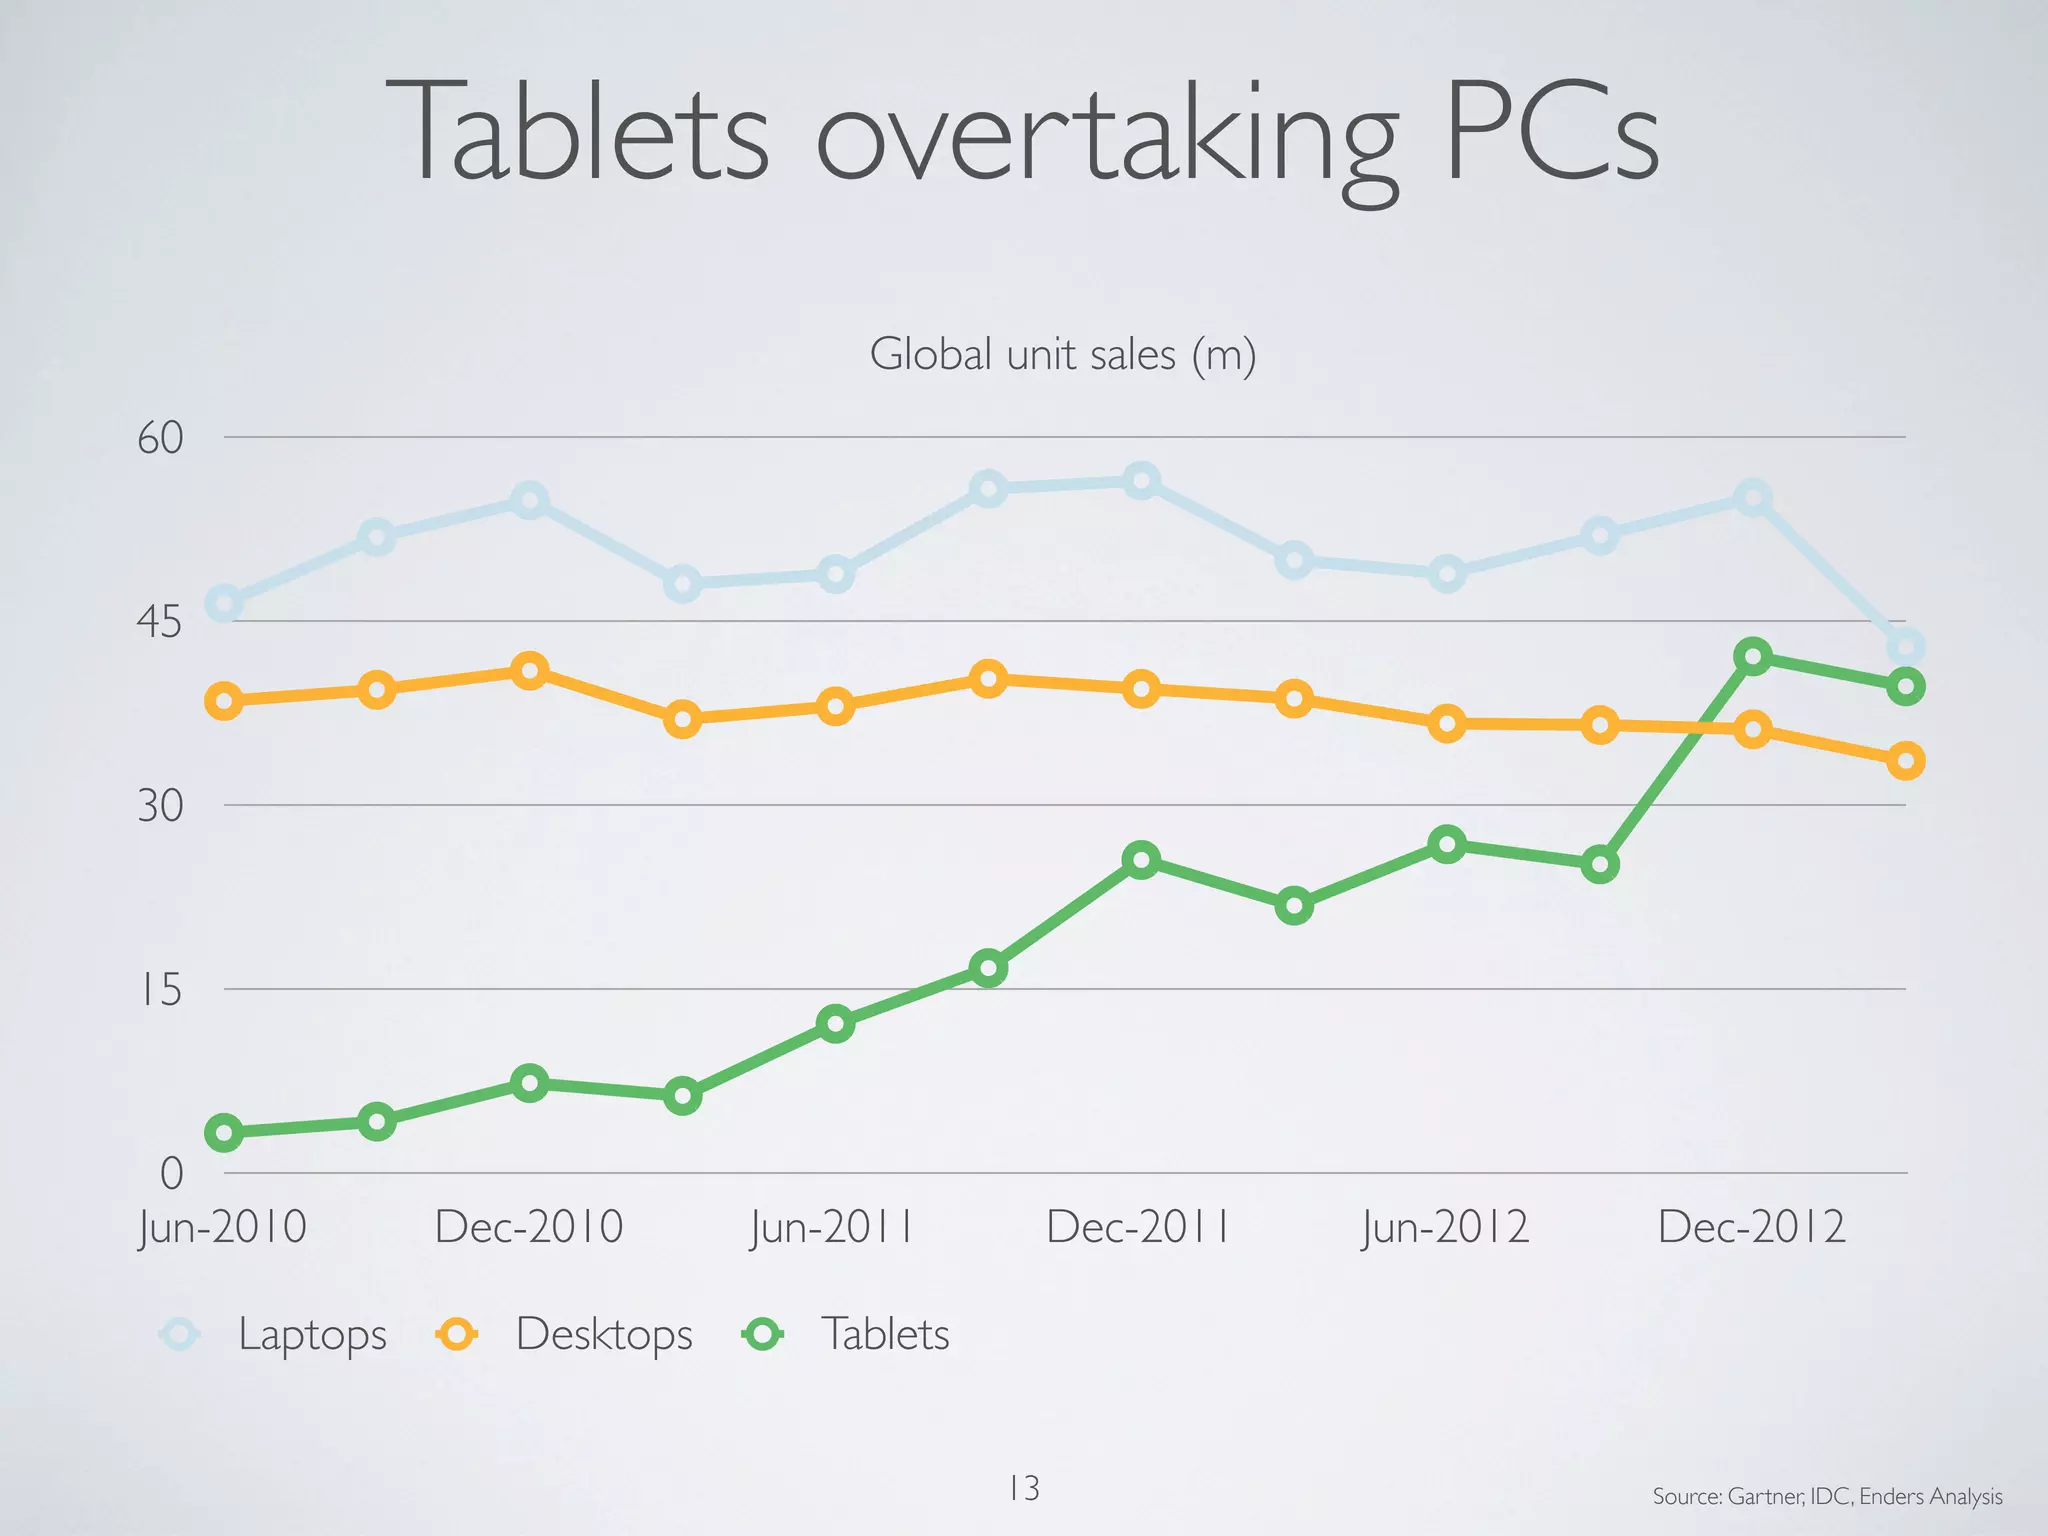
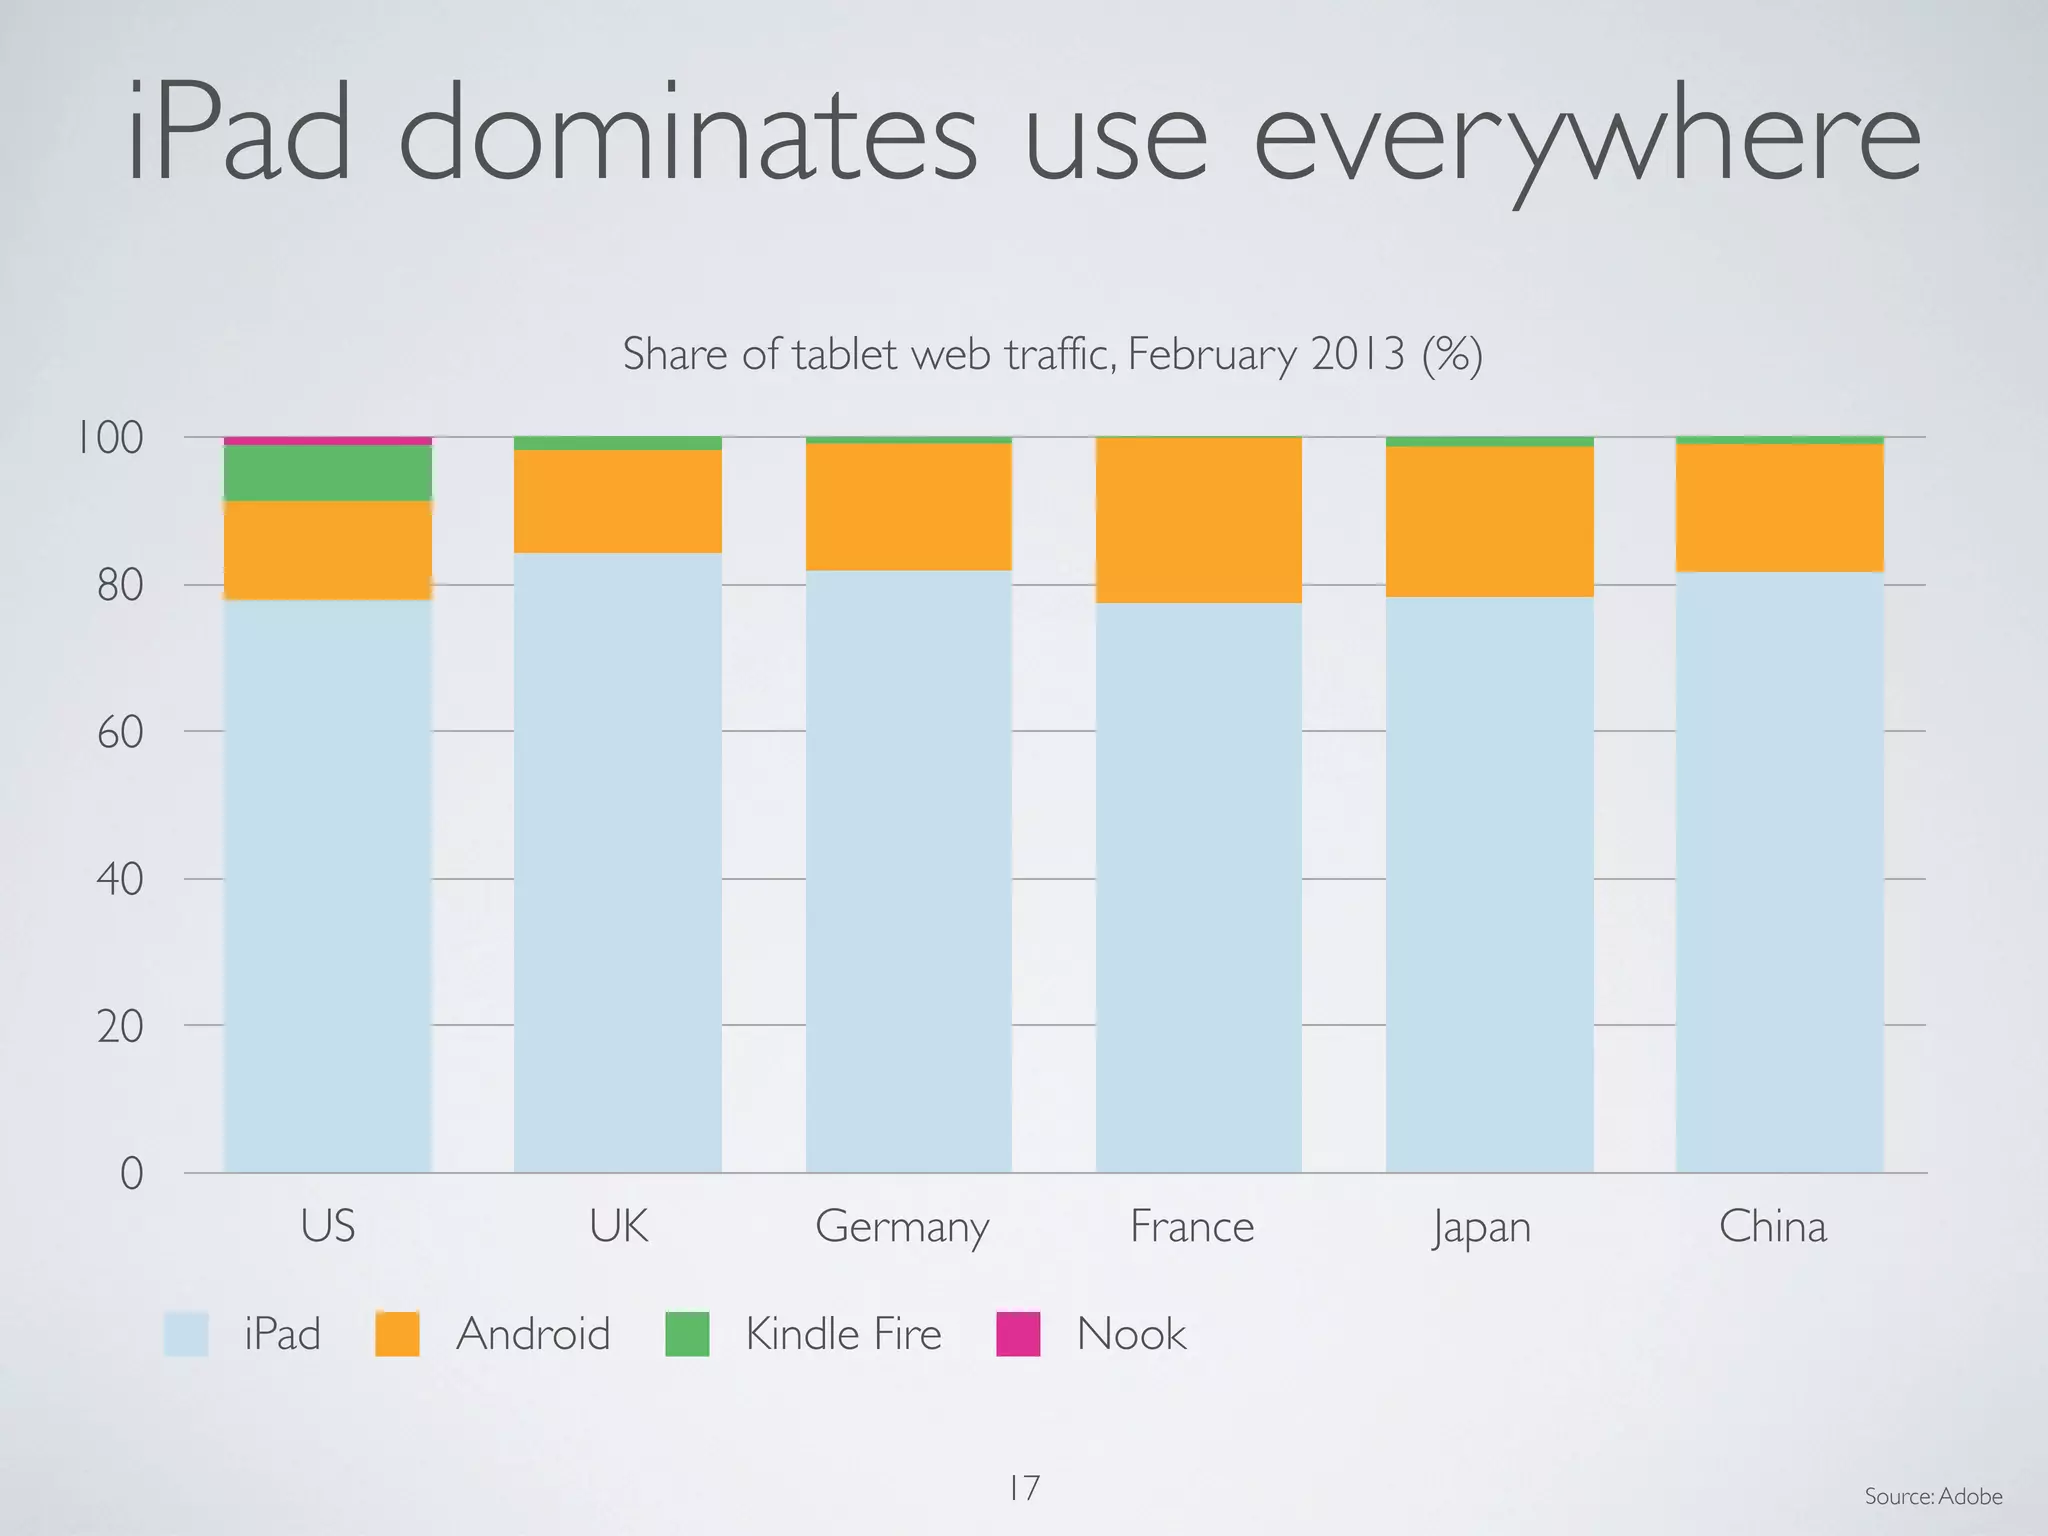
KEMBAR78
2013 05 BEA - ’Mobile is eating the World’ | PDF
MOBILE IS EATINGTHE
WORLD
Presented at BEA, May 2013
Benedict Evans
@benedictevans
Enders Analysis
0
50
100
150
200
2000 2001 2002 2003 2004 2005 2006 2007 2008 2009 2010 2011 2012
Global annual unit sales (m)
Corporate PCs Consumer PCs Tablets
The state of PCs
Source: Gartner, IDC, Enders Analysis2
0
200
400
600
800
2000 2001 2002 2003 2004 2005 2006 2007 2008 2009 2010 2011 2012
Global annual unit sales (m)
Corporate PCs Consumer PCs Tablets Smart phones
Smart phones are exploding
3 Source: Gartner, IDC, Enders Analysis
0
500
1,000
1,500
2,000
2000 2001 2002 2003 2004 2005 2006 2007 2008 2009 2010 2011 2012
Global annual unit sales (m)
Corporate PCs Consumer PCs Tablets Smart phones All mobile phones
4
More mobile growth coming
Source: Gartner, IDC, Enders Analysis
0
250
500
750
1,000
1,250
1,500
2000 2001 2002 2003 2004 2005 2006 2007 2008 2009 2010 2011 2012 2013e
Global annual unit sales (m)
PCs Smartphones and tablets
Source: Enders Analysis5
The future is mobile
The world in 2017
0
1,000
2,000
3,000
4,000
5,000
6,000
7,000
8,000
Population Adults Literate adults Mobile Smart phones PCs Tablets
2017 forecast base (m)
Source: GSMA,World Bank, Enders Analysis6
2012 Growth to 2017
• Mobile was always much bigger than tech, but always separate
• Smartphones mean theTechnology and Mobile worlds merge
• Internet and Media are being dragged along
• Tablets accelerate the change
• This is changing everything
Fundamental change
7
Fundamental change in scale
PC industry
• 350m PCs sold in 2012
• 1.6bn units in use
• Replaced every 4-5 years
• Shared
Mobile industry
• 1.7bn phones sold in 2012
• 3.2bn mobile users
• Replaced every 2 years
• One per person
8
Fundamental change in use
PC internet
• Shared, or used at work
• Semi-portable at best
• Web and web search
Mobile internet
• Personal
• Taken everywhere
• Web, web search, apps,
social, location, service
integration, prediction,APIs,
image recognition, NFC...
9
0
25
50
75
100
Mar-2009 Sep-2009 Mar-2010 Sep-2010 Mar-2011 Sep-2011 Mar-2012 Sep-2012 Mar-2013
Microsoft share of connected device unit sales (%)
Source: Enders Analysis10
The irrelevance of Microsoft
0
25
50
75
100
Units Revenue Operating Profit
Global handset industry share, Q1 2013 (%)
Apple Samsung All other
Source:Apple, Samsung, Enders Analysis11
Dominance of Apple & Samsung
Industry scale
Mobile networks
Advertising
Mobile phones
PCs
Apple
Books
Online advertising
Amazon
Google
Recorded music
Facebook
0 250 500 750 1,000 1,250
2012 global revenue ($bn)
Source: Zenith,Apple,Amazon, Google (excludes Motorola Mobility), Facebook, Enders Analysis12
0
15
30
45
60
Jun-2010 Dec-2010 Jun-2011 Dec-2011 Jun-2012 Dec-2012
Global unit sales (m)
Laptops Desktops Tablets
Tablets overtaking PCs
13 Source: Gartner, IDC, Enders Analysis
0
10
20
30
40
50
Jun-2010 Dec-2010 Jun-2011 Dec-2011 Jun-2012 Dec-2012
Global unit sales (m)
iPad Branded Android Kindle Fire Nexus
120m tablets in 2012 - 66m iPads
Source:Apple, Google,Asus, Enders Analysis14
• Well over 200m tablets will be sold in 2013
• Driven by size and price - 7” screens, $300 and (far below)
• A flood of cheap generic Chinese Androids - perhaps 125m
units in China alone this year, with prices under $150
• Not clear these compete directly with Apple, Samsung &
Google
Tablets in 2013
15
0
25
50
75
100
Jan 2009 Dec 2009 Dec 2010 Dec 2011 Dec 2012
US Google search volume (indexed)
kindle kindle fire nook
Weakening interest in ereaders
Source: Google16
iPad dominates use everywhere
0
20
40
60
80
100
US UK Germany France Japan China
Share of tablet web traffic, February 2013 (%)
iPad Android Kindle Fire Nook
Source:Adobe17
Amazon
-10
0
10
20
30
40
50
60
70
1995 1997 1999 2001 2003 2005 2007 2009 2011
Annual results ($bn)
Revenue Net income
Source:Amazon18
0
2
4
6
8
10
Mar-10 Sep-10 Mar-11 Sep-11 Mar-12 Sep-12 Mar-13
Amazon North American revenue ($bn)
Media revenue General merchandise & other revenue
Source:Amazon19
21st Century Sears Roebuck
0%
1%
2%
4%
5%
6%
7%
2001 2002 2003 2004 2005 2006 2007 2008 2009 2010 2011 2012
Ecommerce as % US retail revenue
Much more ecommerce to come
Source: BLS, Enders Analysis20
‘Four horsemen’
Apple Google Facebook Amazon
21
0
200
400
600
800
Mar-10 Sept-10 Mar-11 Sept-11 Mar-12 Sept-12 Mar-13
Active users (m)
Apple iOS Google Android Facebook mobile users Amazon accounts
22 Source:Apple, Google, Facebook,Amazon, Enders Analysis
Ecosystem sizes
• Apple and Google’s Android have won
• Unlikely that other platforms will be relevant (Windows
Phone, Blackberry, other newer efforts)
• But share of value and use between Apple and Android is fluid
• Google’s control of Android is partial - Amazon Kindle,
Chinese Android, Samsung intentions unclear
• Facebook and Amazon trying to extract value
23
Platform wars
24
For Apple, the
ecosystem is what
sells hardware
For Amazon, Google
and Facebook, the
experience on the
phone is what drives
engagement with all
their services
Ecosystem is the key leverage
point

2013 05 BEA - ’Mobile is eating the World’

  • 1.
    MOBILE IS EATINGTHE WORLD Presentedat BEA, May 2013 Benedict Evans @benedictevans Enders Analysis
  • 2.
    0 50 100 150 200 2000 2001 20022003 2004 2005 2006 2007 2008 2009 2010 2011 2012 Global annual unit sales (m) Corporate PCs Consumer PCs Tablets The state of PCs Source: Gartner, IDC, Enders Analysis2
  • 3.
    0 200 400 600 800 2000 2001 20022003 2004 2005 2006 2007 2008 2009 2010 2011 2012 Global annual unit sales (m) Corporate PCs Consumer PCs Tablets Smart phones Smart phones are exploding 3 Source: Gartner, IDC, Enders Analysis
  • 4.
    0 500 1,000 1,500 2,000 2000 2001 20022003 2004 2005 2006 2007 2008 2009 2010 2011 2012 Global annual unit sales (m) Corporate PCs Consumer PCs Tablets Smart phones All mobile phones 4 More mobile growth coming Source: Gartner, IDC, Enders Analysis
  • 5.
    0 250 500 750 1,000 1,250 1,500 2000 2001 20022003 2004 2005 2006 2007 2008 2009 2010 2011 2012 2013e Global annual unit sales (m) PCs Smartphones and tablets Source: Enders Analysis5 The future is mobile
  • 6.
    The world in2017 0 1,000 2,000 3,000 4,000 5,000 6,000 7,000 8,000 Population Adults Literate adults Mobile Smart phones PCs Tablets 2017 forecast base (m) Source: GSMA,World Bank, Enders Analysis6 2012 Growth to 2017
  • 7.
    • Mobile wasalways much bigger than tech, but always separate • Smartphones mean theTechnology and Mobile worlds merge • Internet and Media are being dragged along • Tablets accelerate the change • This is changing everything Fundamental change 7
  • 8.
    Fundamental change inscale PC industry • 350m PCs sold in 2012 • 1.6bn units in use • Replaced every 4-5 years • Shared Mobile industry • 1.7bn phones sold in 2012 • 3.2bn mobile users • Replaced every 2 years • One per person 8
  • 9.
    Fundamental change inuse PC internet • Shared, or used at work • Semi-portable at best • Web and web search Mobile internet • Personal • Taken everywhere • Web, web search, apps, social, location, service integration, prediction,APIs, image recognition, NFC... 9
  • 10.
    0 25 50 75 100 Mar-2009 Sep-2009 Mar-2010Sep-2010 Mar-2011 Sep-2011 Mar-2012 Sep-2012 Mar-2013 Microsoft share of connected device unit sales (%) Source: Enders Analysis10 The irrelevance of Microsoft
  • 11.
    0 25 50 75 100 Units Revenue OperatingProfit Global handset industry share, Q1 2013 (%) Apple Samsung All other Source:Apple, Samsung, Enders Analysis11 Dominance of Apple & Samsung
  • 12.
    Industry scale Mobile networks Advertising Mobilephones PCs Apple Books Online advertising Amazon Google Recorded music Facebook 0 250 500 750 1,000 1,250 2012 global revenue ($bn) Source: Zenith,Apple,Amazon, Google (excludes Motorola Mobility), Facebook, Enders Analysis12
  • 13.
    0 15 30 45 60 Jun-2010 Dec-2010 Jun-2011Dec-2011 Jun-2012 Dec-2012 Global unit sales (m) Laptops Desktops Tablets Tablets overtaking PCs 13 Source: Gartner, IDC, Enders Analysis
  • 14.
    0 10 20 30 40 50 Jun-2010 Dec-2010 Jun-2011Dec-2011 Jun-2012 Dec-2012 Global unit sales (m) iPad Branded Android Kindle Fire Nexus 120m tablets in 2012 - 66m iPads Source:Apple, Google,Asus, Enders Analysis14
  • 15.
    • Well over200m tablets will be sold in 2013 • Driven by size and price - 7” screens, $300 and (far below) • A flood of cheap generic Chinese Androids - perhaps 125m units in China alone this year, with prices under $150 • Not clear these compete directly with Apple, Samsung & Google Tablets in 2013 15
  • 16.
    0 25 50 75 100 Jan 2009 Dec2009 Dec 2010 Dec 2011 Dec 2012 US Google search volume (indexed) kindle kindle fire nook Weakening interest in ereaders Source: Google16
  • 17.
    iPad dominates useeverywhere 0 20 40 60 80 100 US UK Germany France Japan China Share of tablet web traffic, February 2013 (%) iPad Android Kindle Fire Nook Source:Adobe17
  • 18.
    Amazon -10 0 10 20 30 40 50 60 70 1995 1997 19992001 2003 2005 2007 2009 2011 Annual results ($bn) Revenue Net income Source:Amazon18
  • 19.
    0 2 4 6 8 10 Mar-10 Sep-10 Mar-11Sep-11 Mar-12 Sep-12 Mar-13 Amazon North American revenue ($bn) Media revenue General merchandise & other revenue Source:Amazon19 21st Century Sears Roebuck
  • 20.
    0% 1% 2% 4% 5% 6% 7% 2001 2002 20032004 2005 2006 2007 2008 2009 2010 2011 2012 Ecommerce as % US retail revenue Much more ecommerce to come Source: BLS, Enders Analysis20
  • 21.
  • 22.
    0 200 400 600 800 Mar-10 Sept-10 Mar-11Sept-11 Mar-12 Sept-12 Mar-13 Active users (m) Apple iOS Google Android Facebook mobile users Amazon accounts 22 Source:Apple, Google, Facebook,Amazon, Enders Analysis Ecosystem sizes
  • 23.
    • Apple andGoogle’s Android have won • Unlikely that other platforms will be relevant (Windows Phone, Blackberry, other newer efforts) • But share of value and use between Apple and Android is fluid • Google’s control of Android is partial - Amazon Kindle, Chinese Android, Samsung intentions unclear • Facebook and Amazon trying to extract value 23 Platform wars
  • 24.
    24 For Apple, the ecosystemis what sells hardware For Amazon, Google and Facebook, the experience on the phone is what drives engagement with all their services Ecosystem is the key leverage point