Download as PDF, PPTX

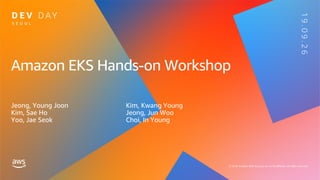


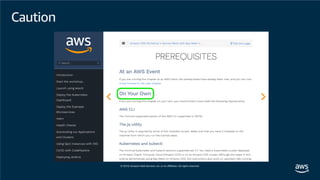
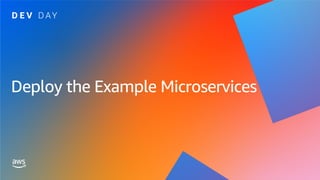
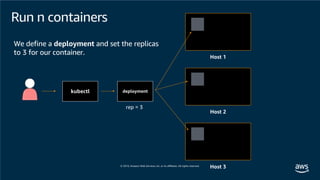
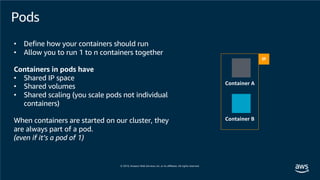

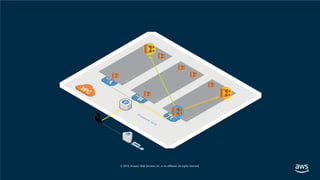
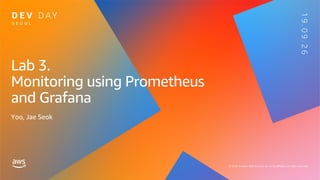
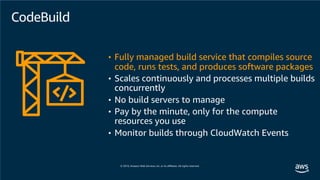
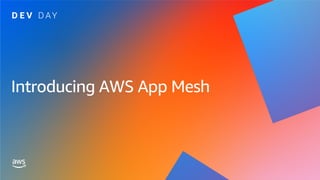
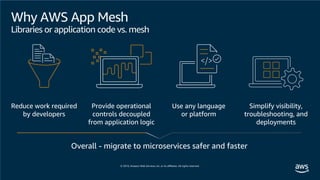
![Lab Architecture
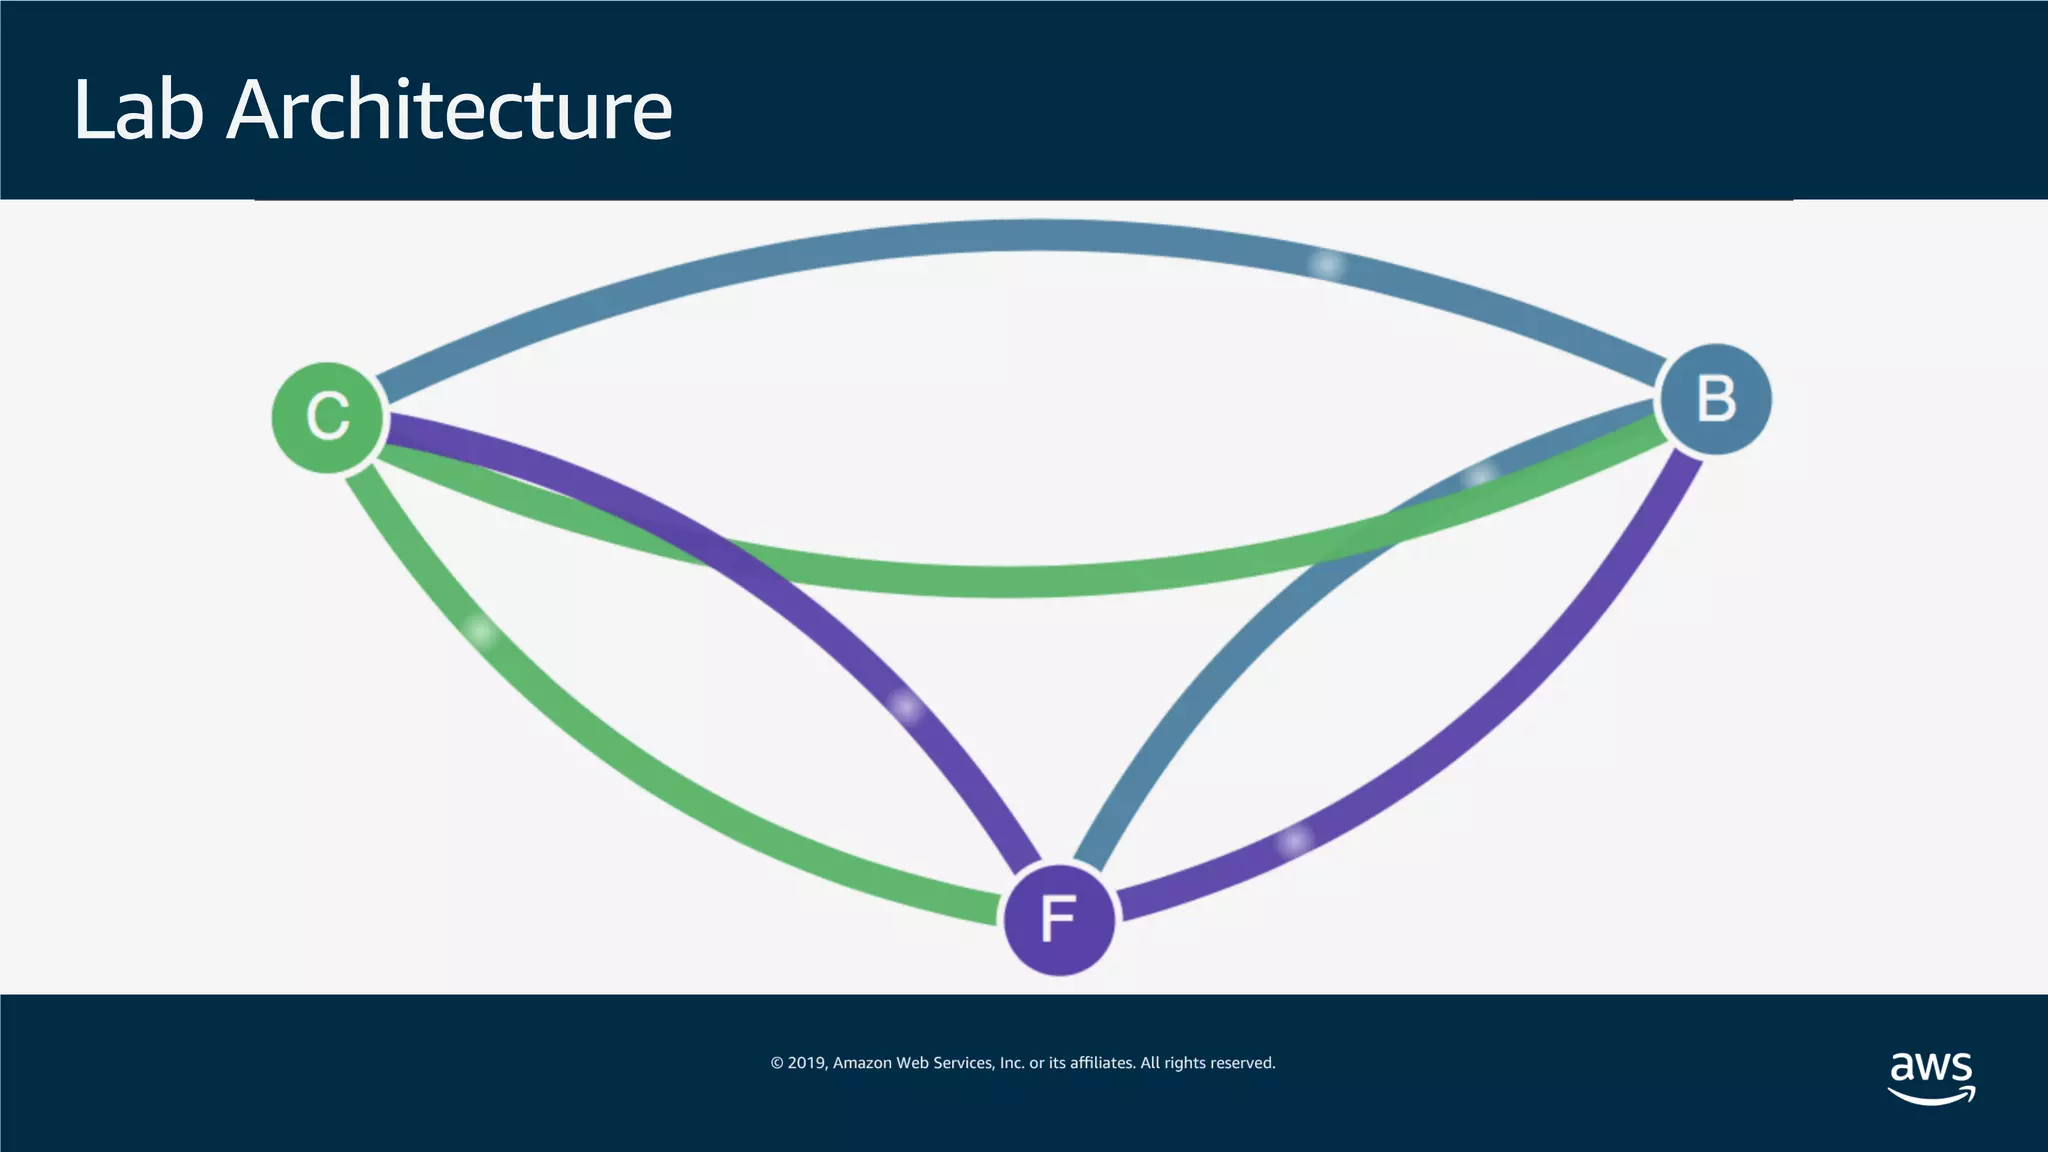
I, [2019-09-17T03:26:03.072922 #1] INFO -- : Started GET "/" for 192.168.233.51 at 2019-09-17 03:26:03 +0000
I, [2019-09-17T03:26:03.075543 #1] INFO -- : Processing by ApplicationController#index as HTML
I, [2019-09-17T03:26:03.081943 #1] INFO -- : uri port is 80
I, [2019-09-17T03:26:03.081977 #1] INFO -- : expanded http://ecsdemo-nodejs.default.svc.cluster.local/ to http://ecsdemo-nodejs
.default.svc.cluster.local/
I, [2019-09-17T03:26:03.089166 #1] INFO -- : uri port is 80
I, [2019-09-17T03:26:03.089197 #1] INFO -- : expanded http://ecsdemo-nodejs.default.svc.cluster.local/ to http://ecsdemo-nodejs
.default.svc.cluster.local/
I, [2019-09-17T03:26:03.092048 #1] INFO -- : uri port is 80
I, [2019-09-17T03:26:03.092078 #1] INFO -- : expanded http://ecsdemo-nodejs.default.svc.cluster.local/ to http://ecsdemo-nodejs
.default.svc.cluster.local/
I, [2019-09-17T03:26:03.121076 #1] INFO -- : uri port is 80
I, [2019-09-17T03:26:03.121120 #1] INFO -- : expanded http://ecsdemo-crystal.default.svc.cluster.local/crystal to http://ecsdem
o-crystal.default.svc.cluster.local/crystal
I, [2019-09-17T03:26:03.128501 #1] INFO -- : uri port is 80
I, [2019-09-17T03:26:03.128538 #1] INFO -- : expanded http://ecsdemo-crystal.default.svc.cluster.local/crystal to http://ecsdem
o-crystal.default.svc.cluster.local/crystal
I, [2019-09-17T03:26:03.135349 #1] INFO -- : uri port is 80
I, [2019-09-17T03:26:03.135382 #1] INFO -- : expanded http://ecsdemo-crystal.default.svc.cluster.local/crystal to http://ecsdem
o-crystal.default.svc.cluster.local/crystal
I, [2019-09-17T03:26:03.146138 #1] INFO -- : Rendered application/index.html.erb within layouts/application (2.5ms)
I, [2019-09-17T03:26:03.146535 #1] INFO -- : Completed 200 OK in 71ms (Views: 6.3ms | ActiveRecord: 0.0ms)](https://image.slidesharecdn.com/awsdevdayseoul2019-amazonekshands-onworkshopv0-190930092336/85/AWS-Dev-Day-Amazon-EKS-28-320.jpg)


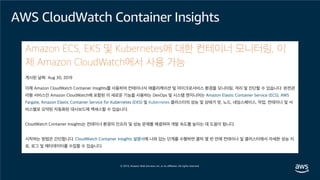


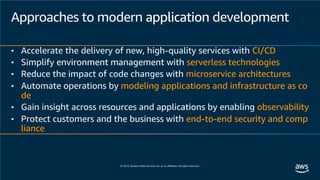


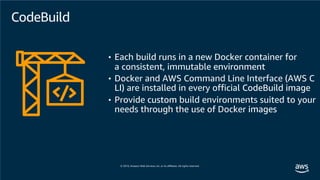


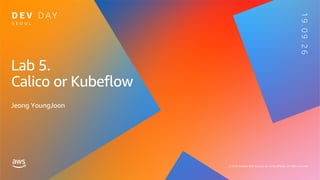


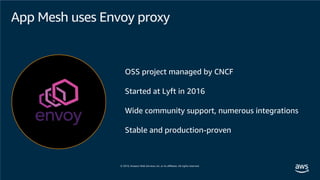
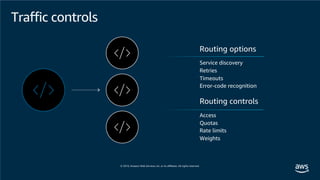
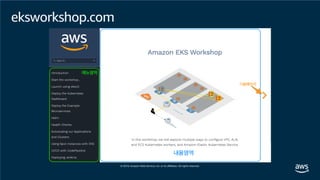
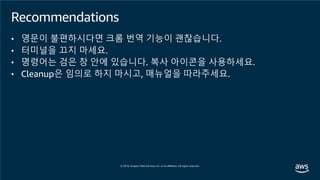
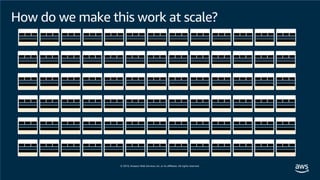
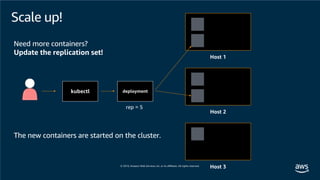
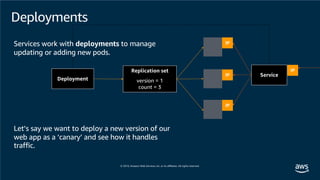
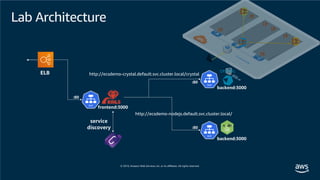
![Mesh – [sample_app]
Virtual router
HTTP route
Targets:
Prefix: /
B
B’
Virtual
node A
Service
discovery
Listener Backends Virtual
node B
Service
discovery
Listener Backends
Virtual
node B’
Service
discovery
Listener Backends
B
B
B’
B’
A
Connecting microservices](https://image.slidesharecdn.com/awsdevdayseoul2019-amazonekshands-onworkshopv0-190930092336/85/AWS-Dev-Day-Amazon-EKS-88-320.jpg)


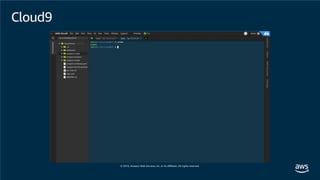
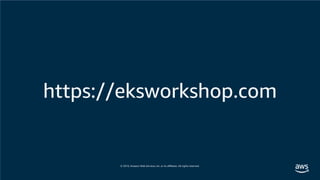
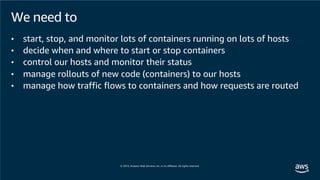
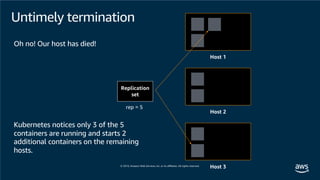
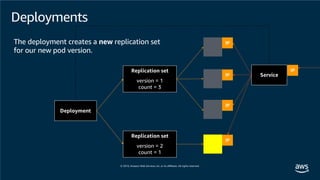
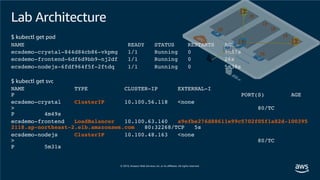
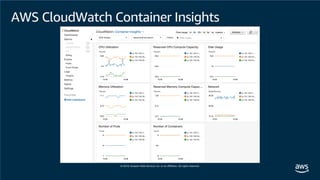
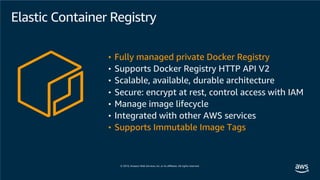
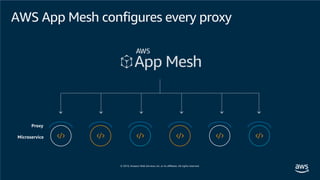
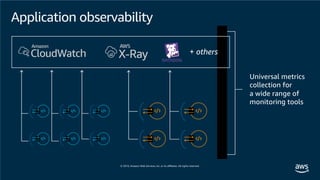
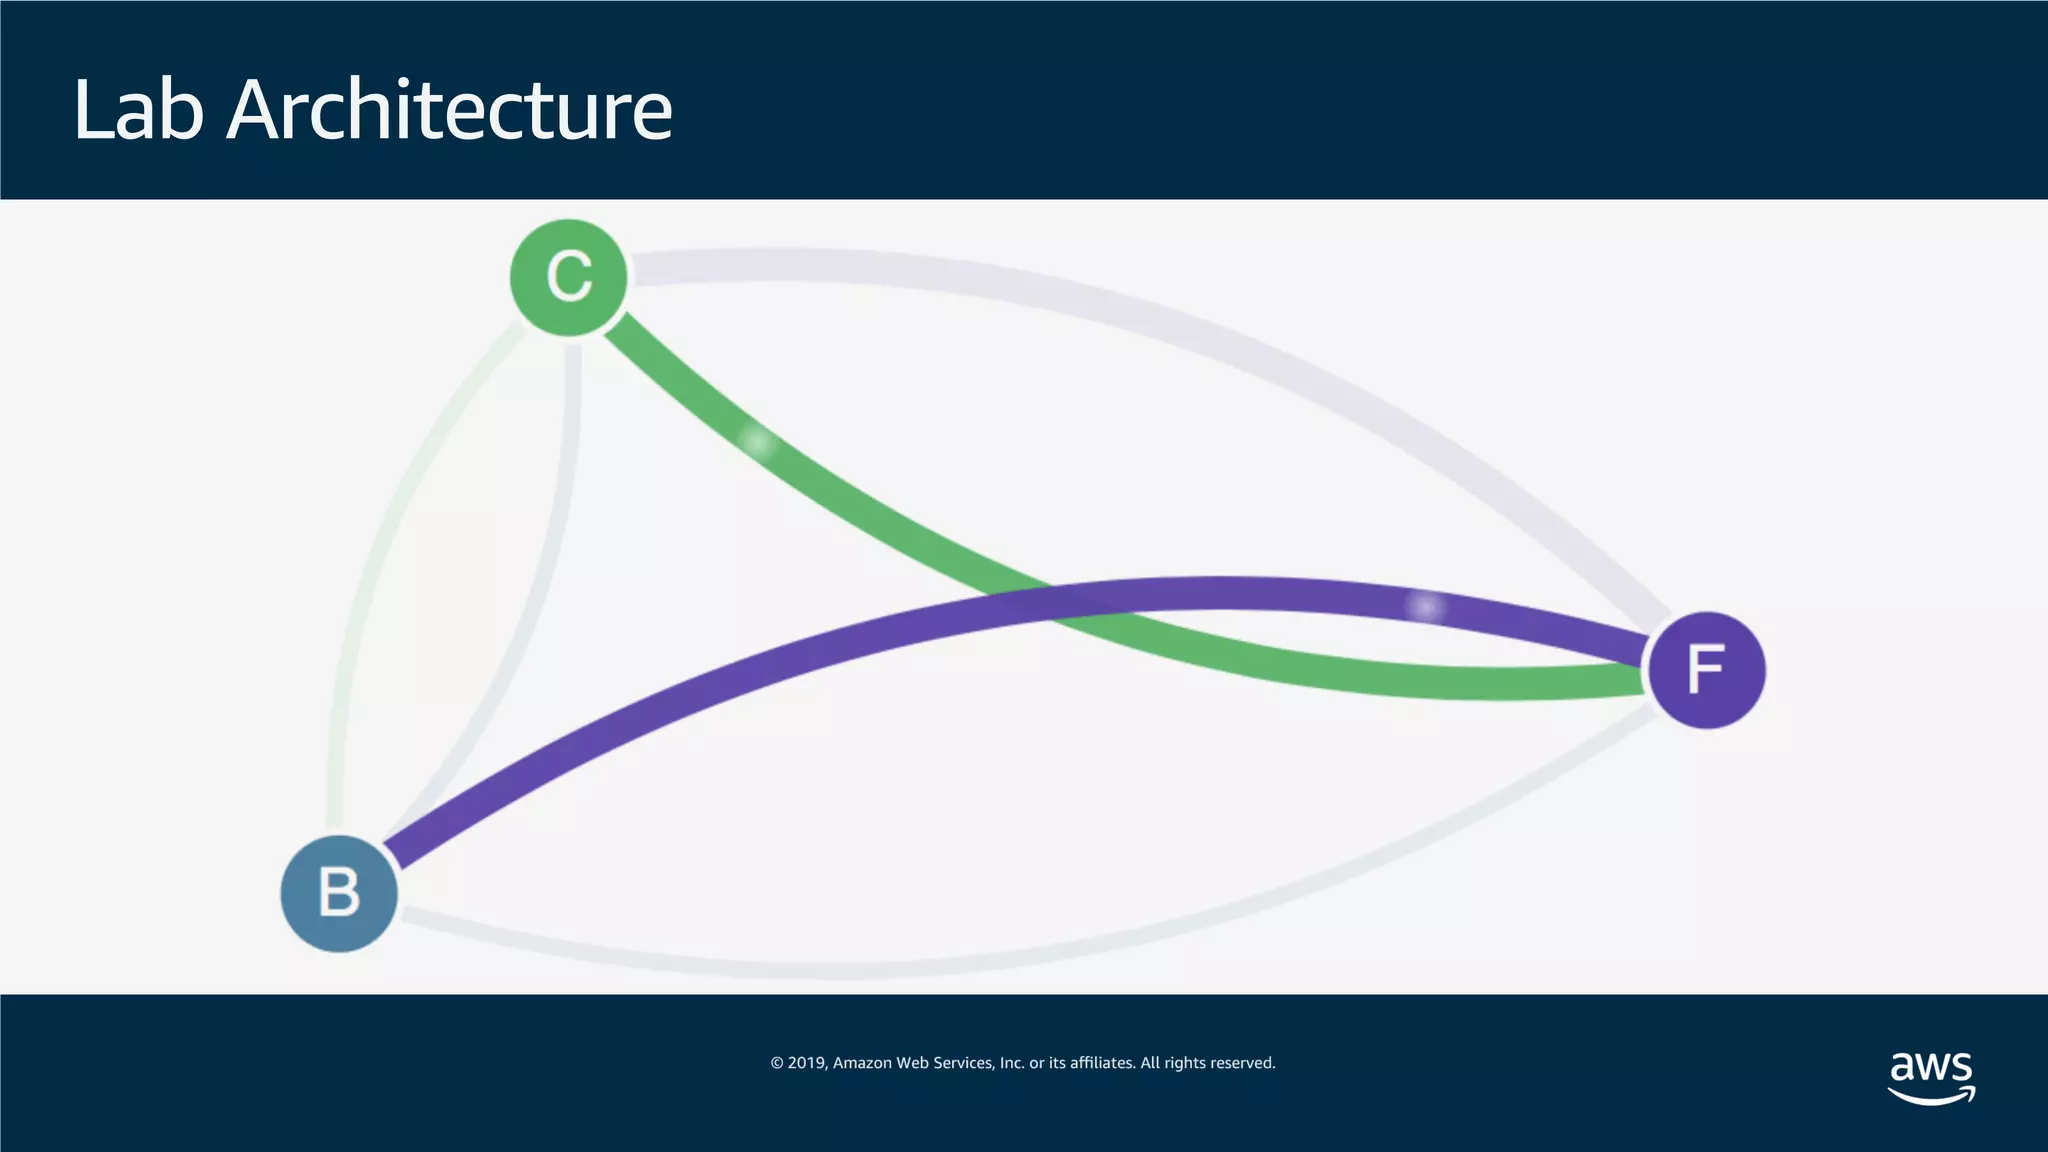
![Lab Architecture
I, [2019-09-17T03:26:03.072922 #1] INFO -- : Started GET "/" for 192.168.233.51 at 2019-09-17 03:26:03 +0000
I, [2019-09-17T03:26:03.075543 #1] INFO -- : Processing by ApplicationController#index as HTML
I, [2019-09-17T03:26:03.081943 #1] INFO -- : uri port is 80
I, [2019-09-17T03:26:03.081977 #1] INFO -- : expanded http://ecsdemo-nodejs.default.svc.cluster.local/ to http://ecsdemo-nodejs
.default.svc.cluster.local/
I, [2019-09-17T03:26:03.089166 #1] INFO -- : uri port is 80
I, [2019-09-17T03:26:03.089197 #1] INFO -- : expanded http://ecsdemo-nodejs.default.svc.cluster.local/ to http://ecsdemo-nodejs
.default.svc.cluster.local/
I, [2019-09-17T03:26:03.092048 #1] INFO -- : uri port is 80
I, [2019-09-17T03:26:03.092078 #1] INFO -- : expanded http://ecsdemo-nodejs.default.svc.cluster.local/ to http://ecsdemo-nodejs
.default.svc.cluster.local/
I, [2019-09-17T03:26:03.121076 #1] INFO -- : uri port is 80
I, [2019-09-17T03:26:03.121120 #1] INFO -- : expanded http://ecsdemo-crystal.default.svc.cluster.local/crystal to http://ecsdem
o-crystal.default.svc.cluster.local/crystal
I, [2019-09-17T03:26:03.128501 #1] INFO -- : uri port is 80
I, [2019-09-17T03:26:03.128538 #1] INFO -- : expanded http://ecsdemo-crystal.default.svc.cluster.local/crystal to http://ecsdem
o-crystal.default.svc.cluster.local/crystal
I, [2019-09-17T03:26:03.135349 #1] INFO -- : uri port is 80
I, [2019-09-17T03:26:03.135382 #1] INFO -- : expanded http://ecsdemo-crystal.default.svc.cluster.local/crystal to http://ecsdem
o-crystal.default.svc.cluster.local/crystal
I, [2019-09-17T03:26:03.146138 #1] INFO -- : Rendered application/index.html.erb within layouts/application (2.5ms)
I, [2019-09-17T03:26:03.146535 #1] INFO -- : Completed 200 OK in 71ms (Views: 6.3ms | ActiveRecord: 0.0ms)](https://image.slidesharecdn.com/awsdevdayseoul2019-amazonekshands-onworkshopv0-190930092336/75/AWS-Dev-Day-Amazon-EKS-28-2048.jpg)


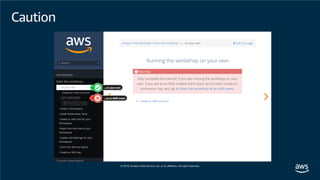
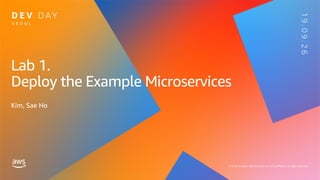
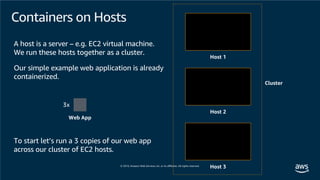
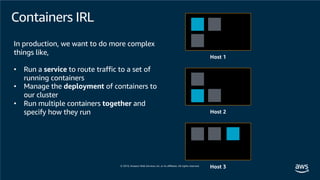
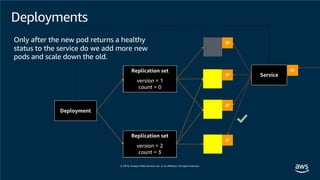
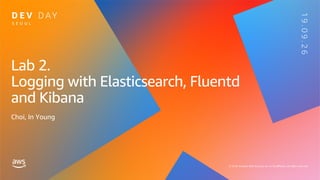
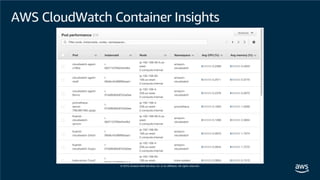
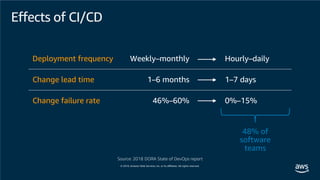
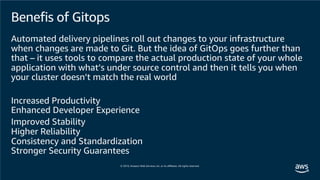
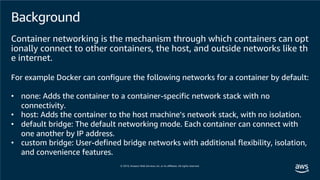
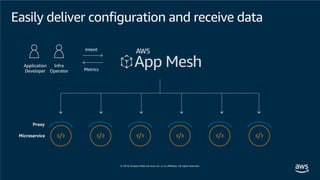
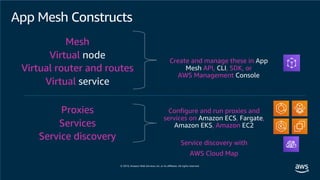
![Mesh – [sample_app]
Virtual router
HTTP route
Targets:
Prefix: /
B
B’
Virtual
node A
Service
discovery
Listener Backends Virtual
node B
Service
discovery
Listener Backends
Virtual
node B’
Service
discovery
Listener Backends
B
B
B’
B’
A
Connecting microservices](https://image.slidesharecdn.com/awsdevdayseoul2019-amazonekshands-onworkshopv0-190930092336/75/AWS-Dev-Day-Amazon-EKS-88-2048.jpg)


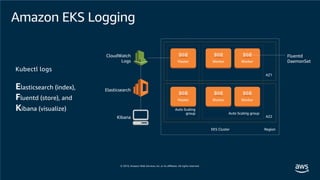
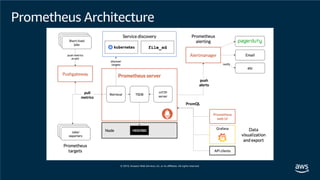
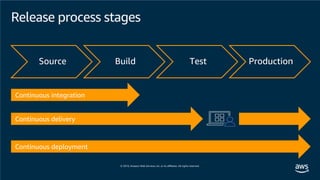
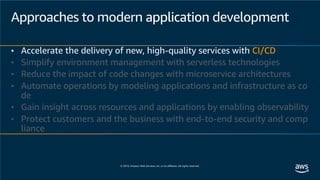
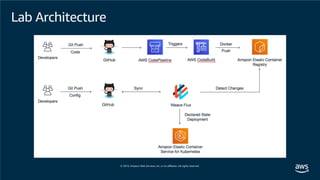
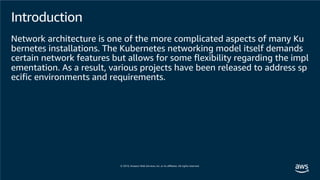
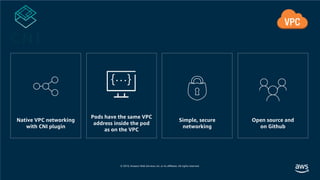
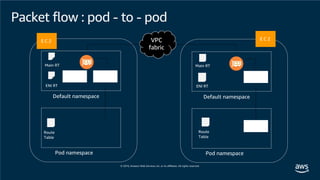
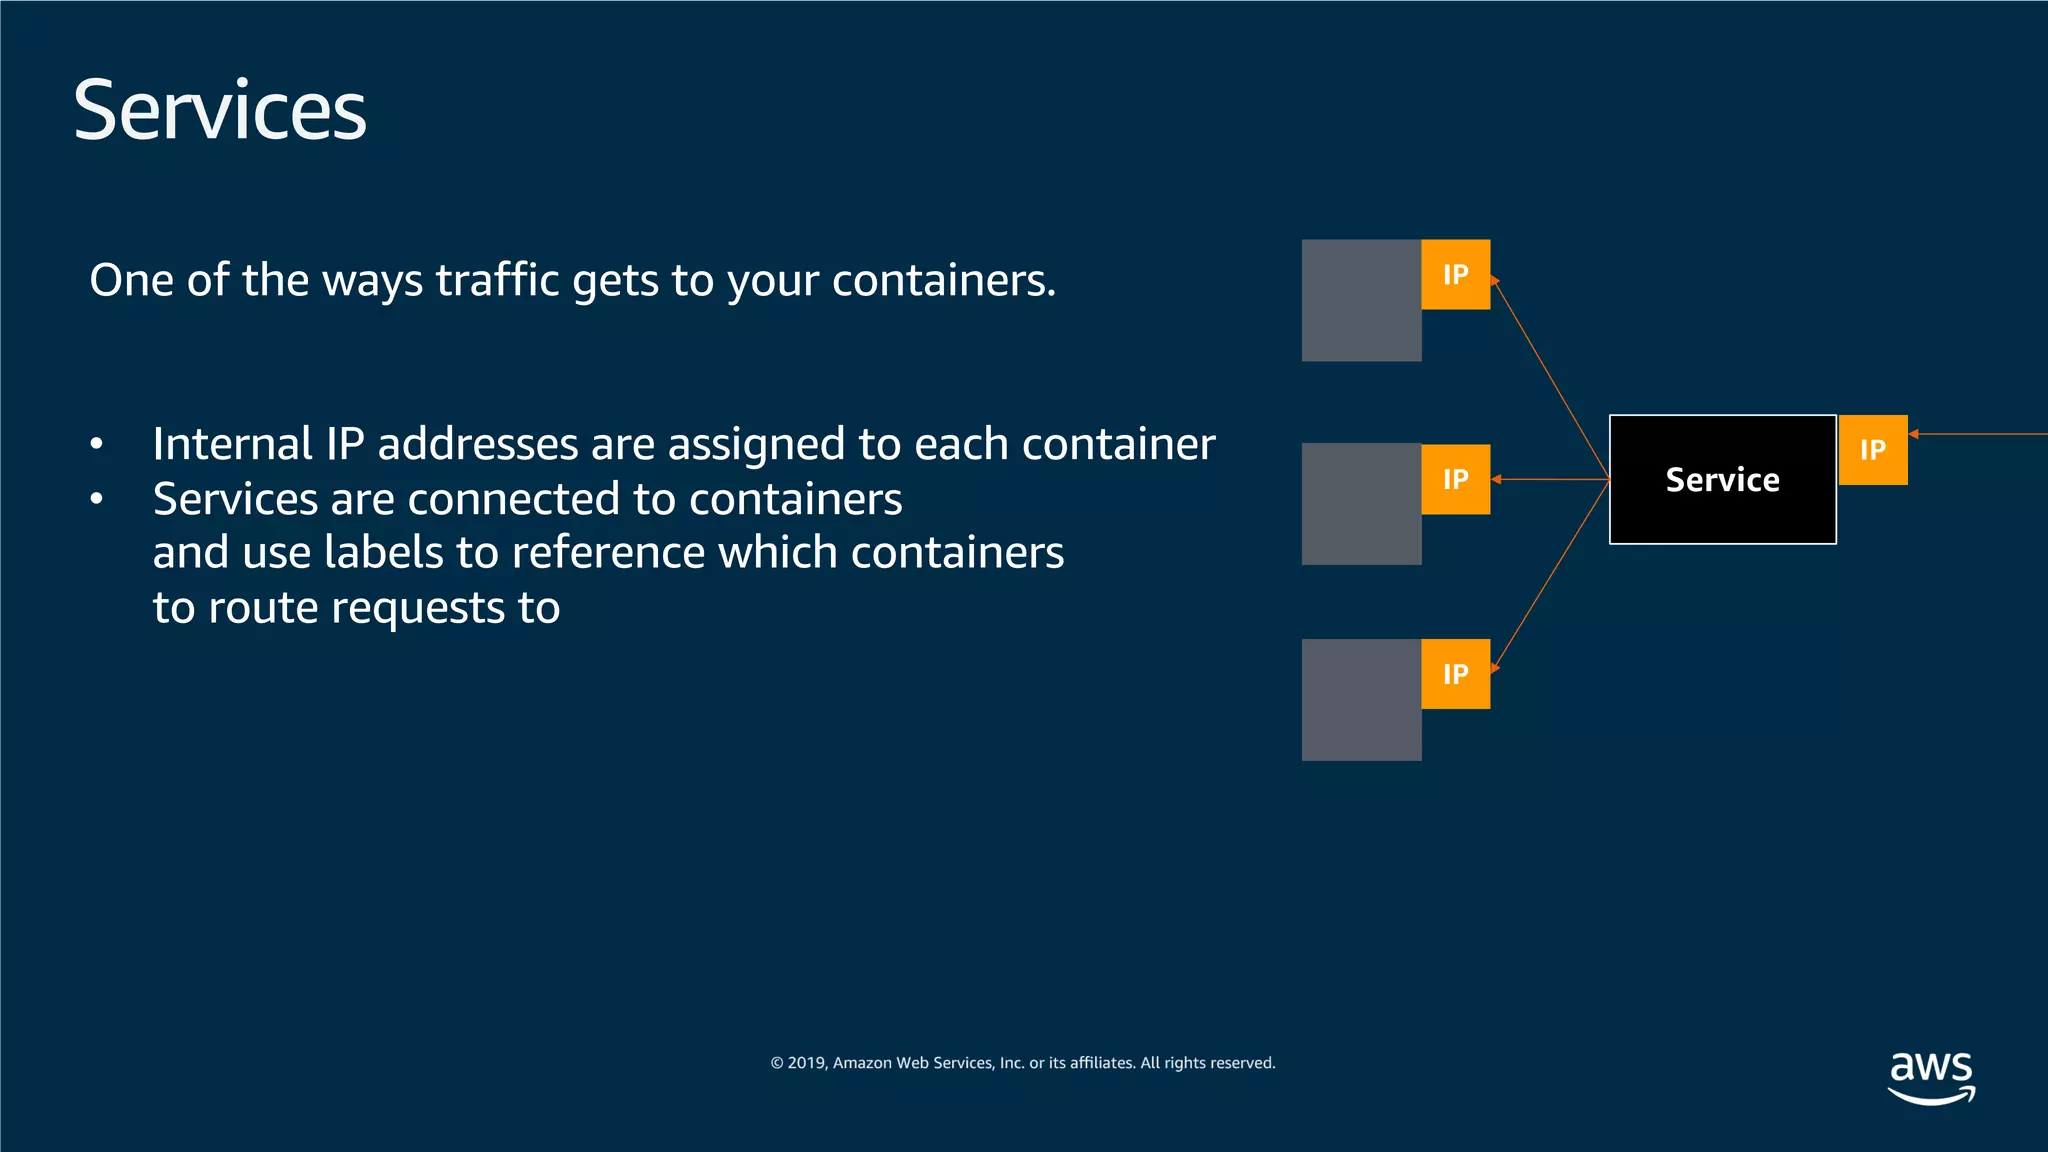
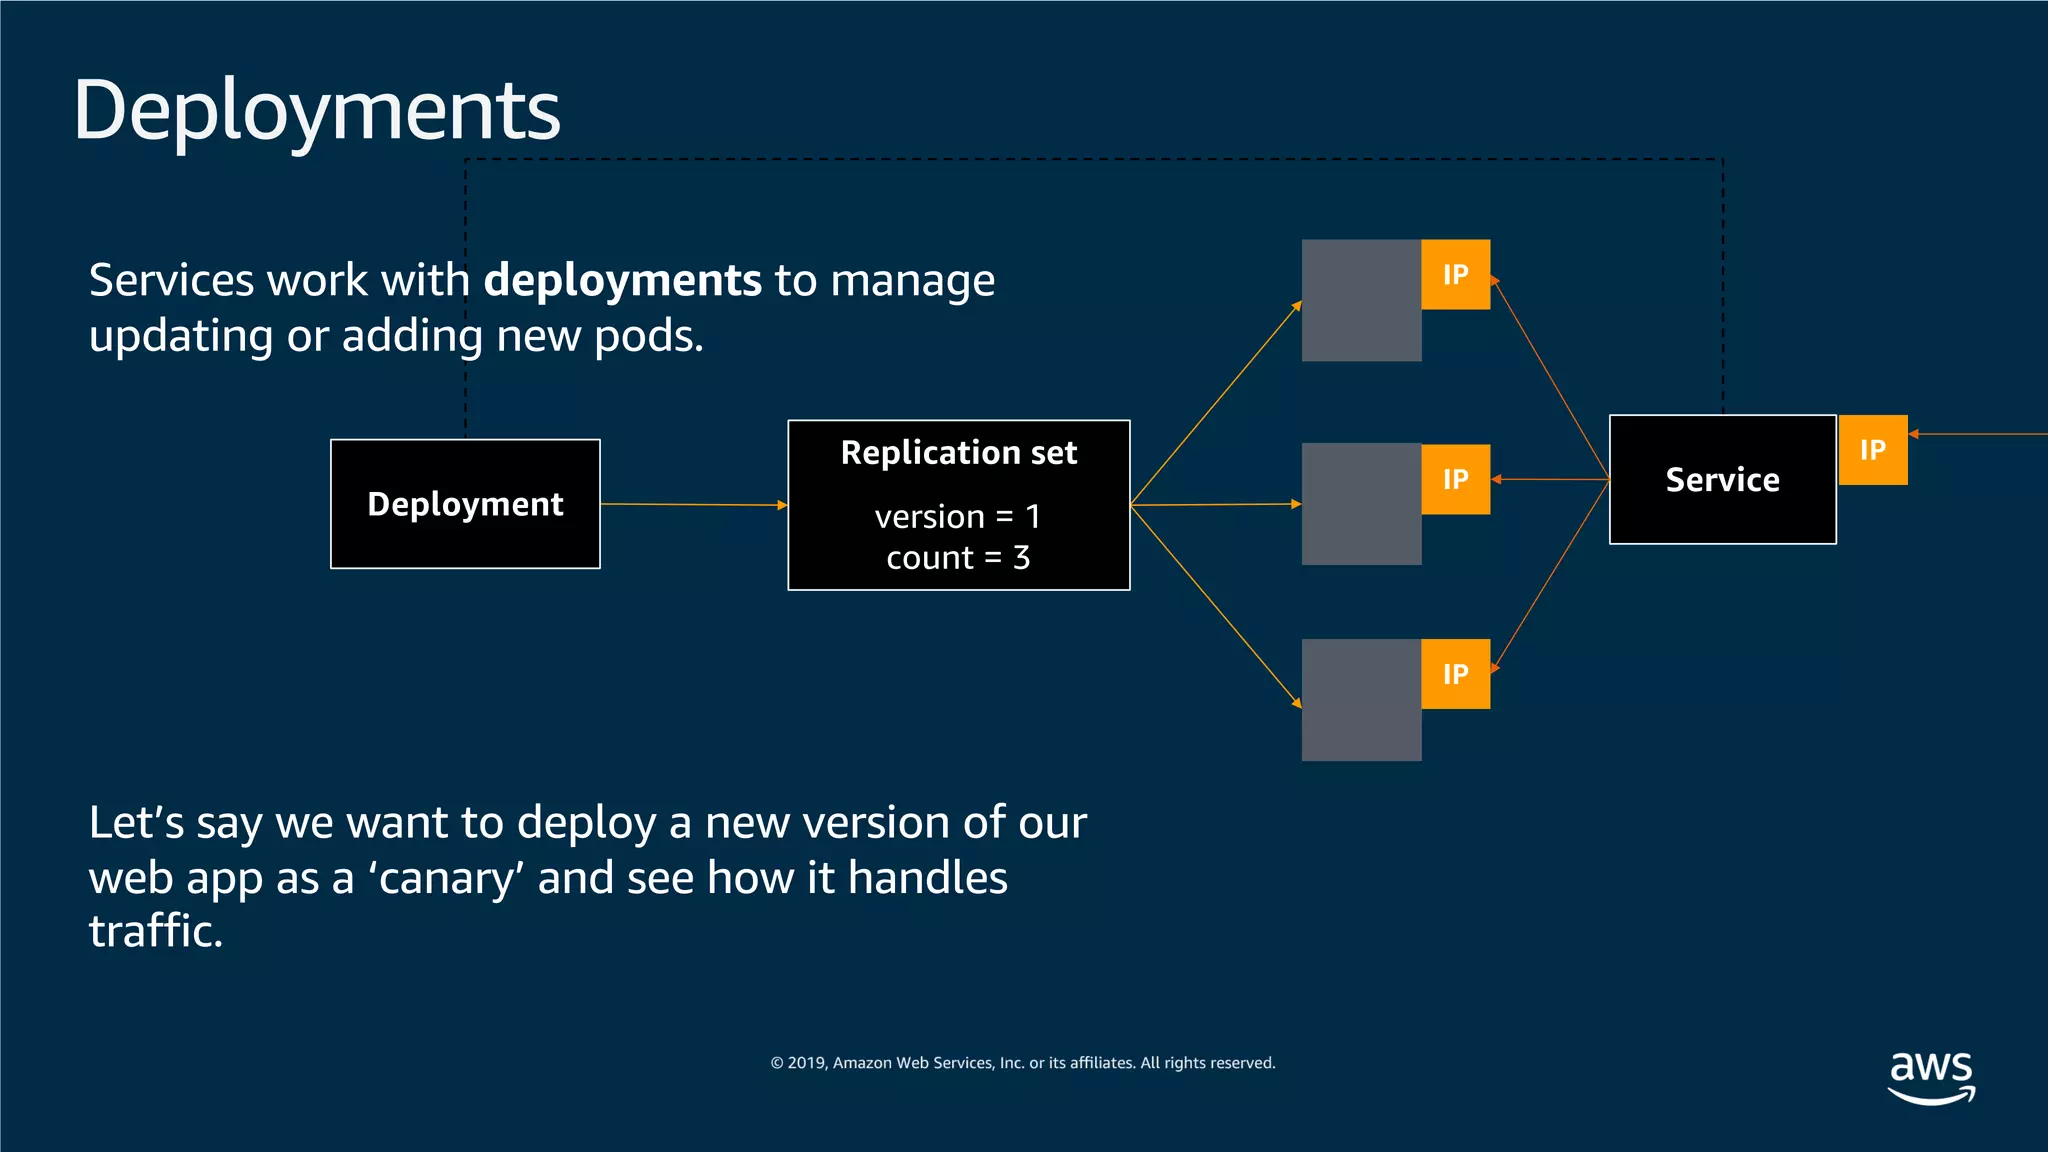
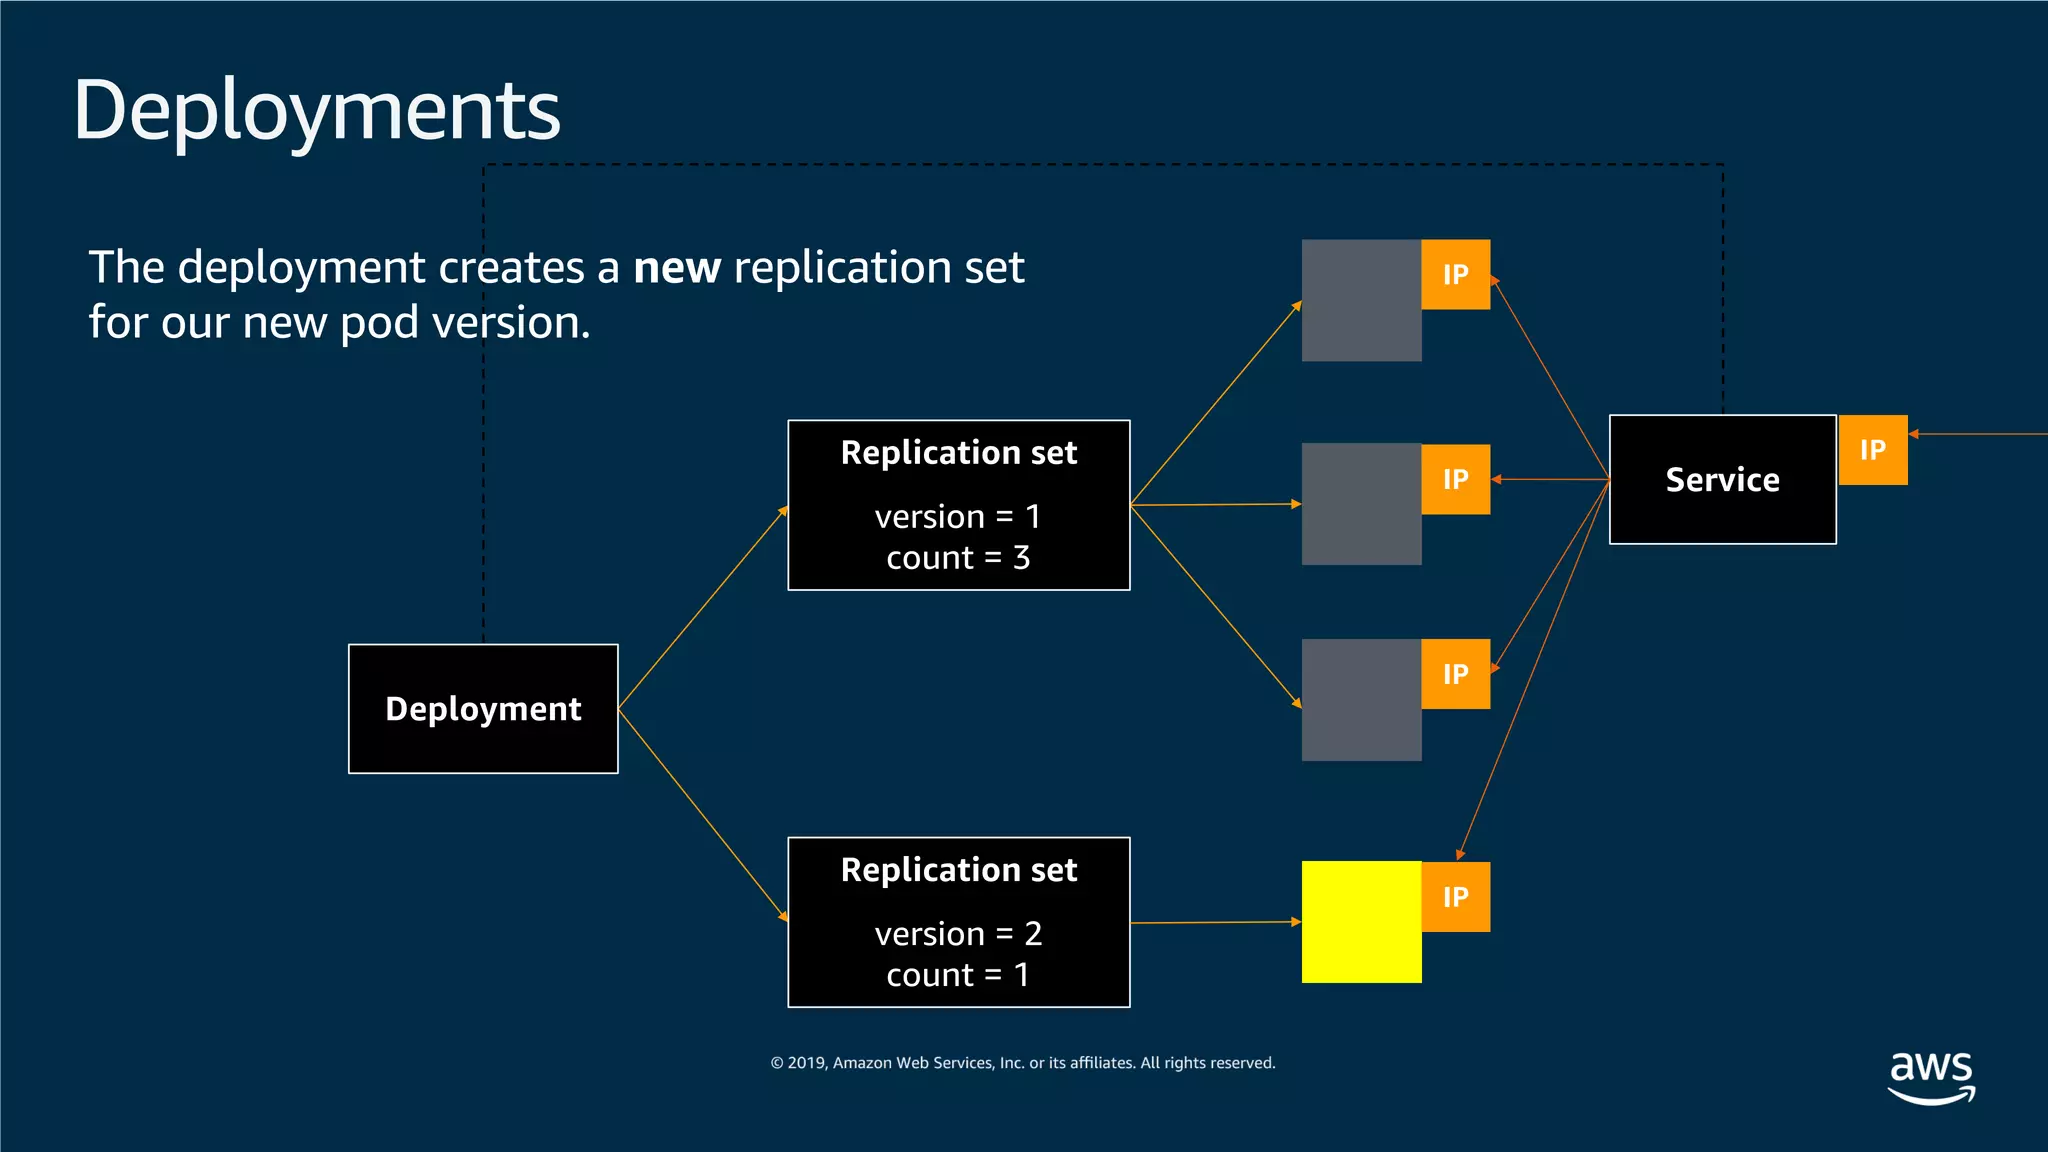
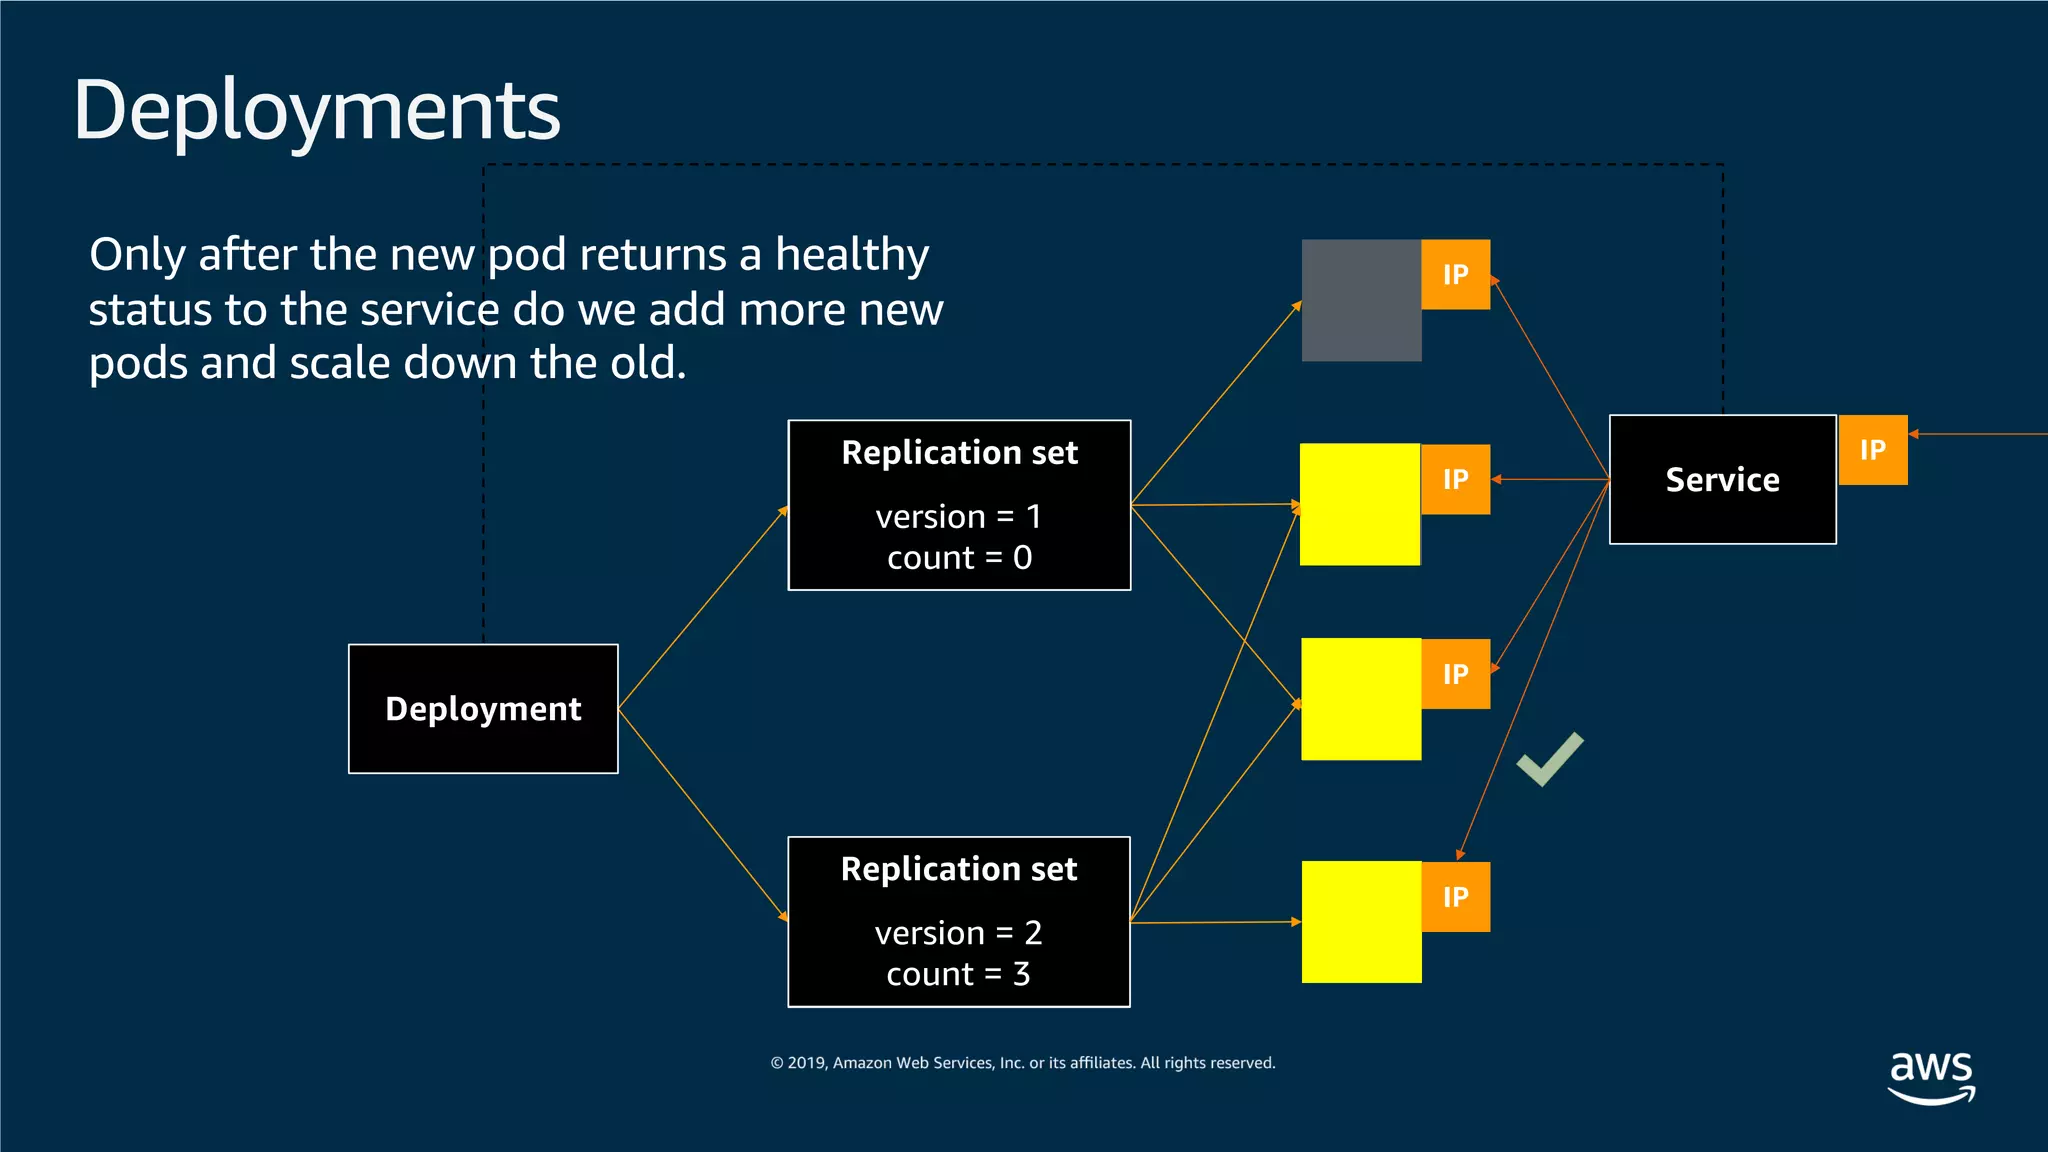
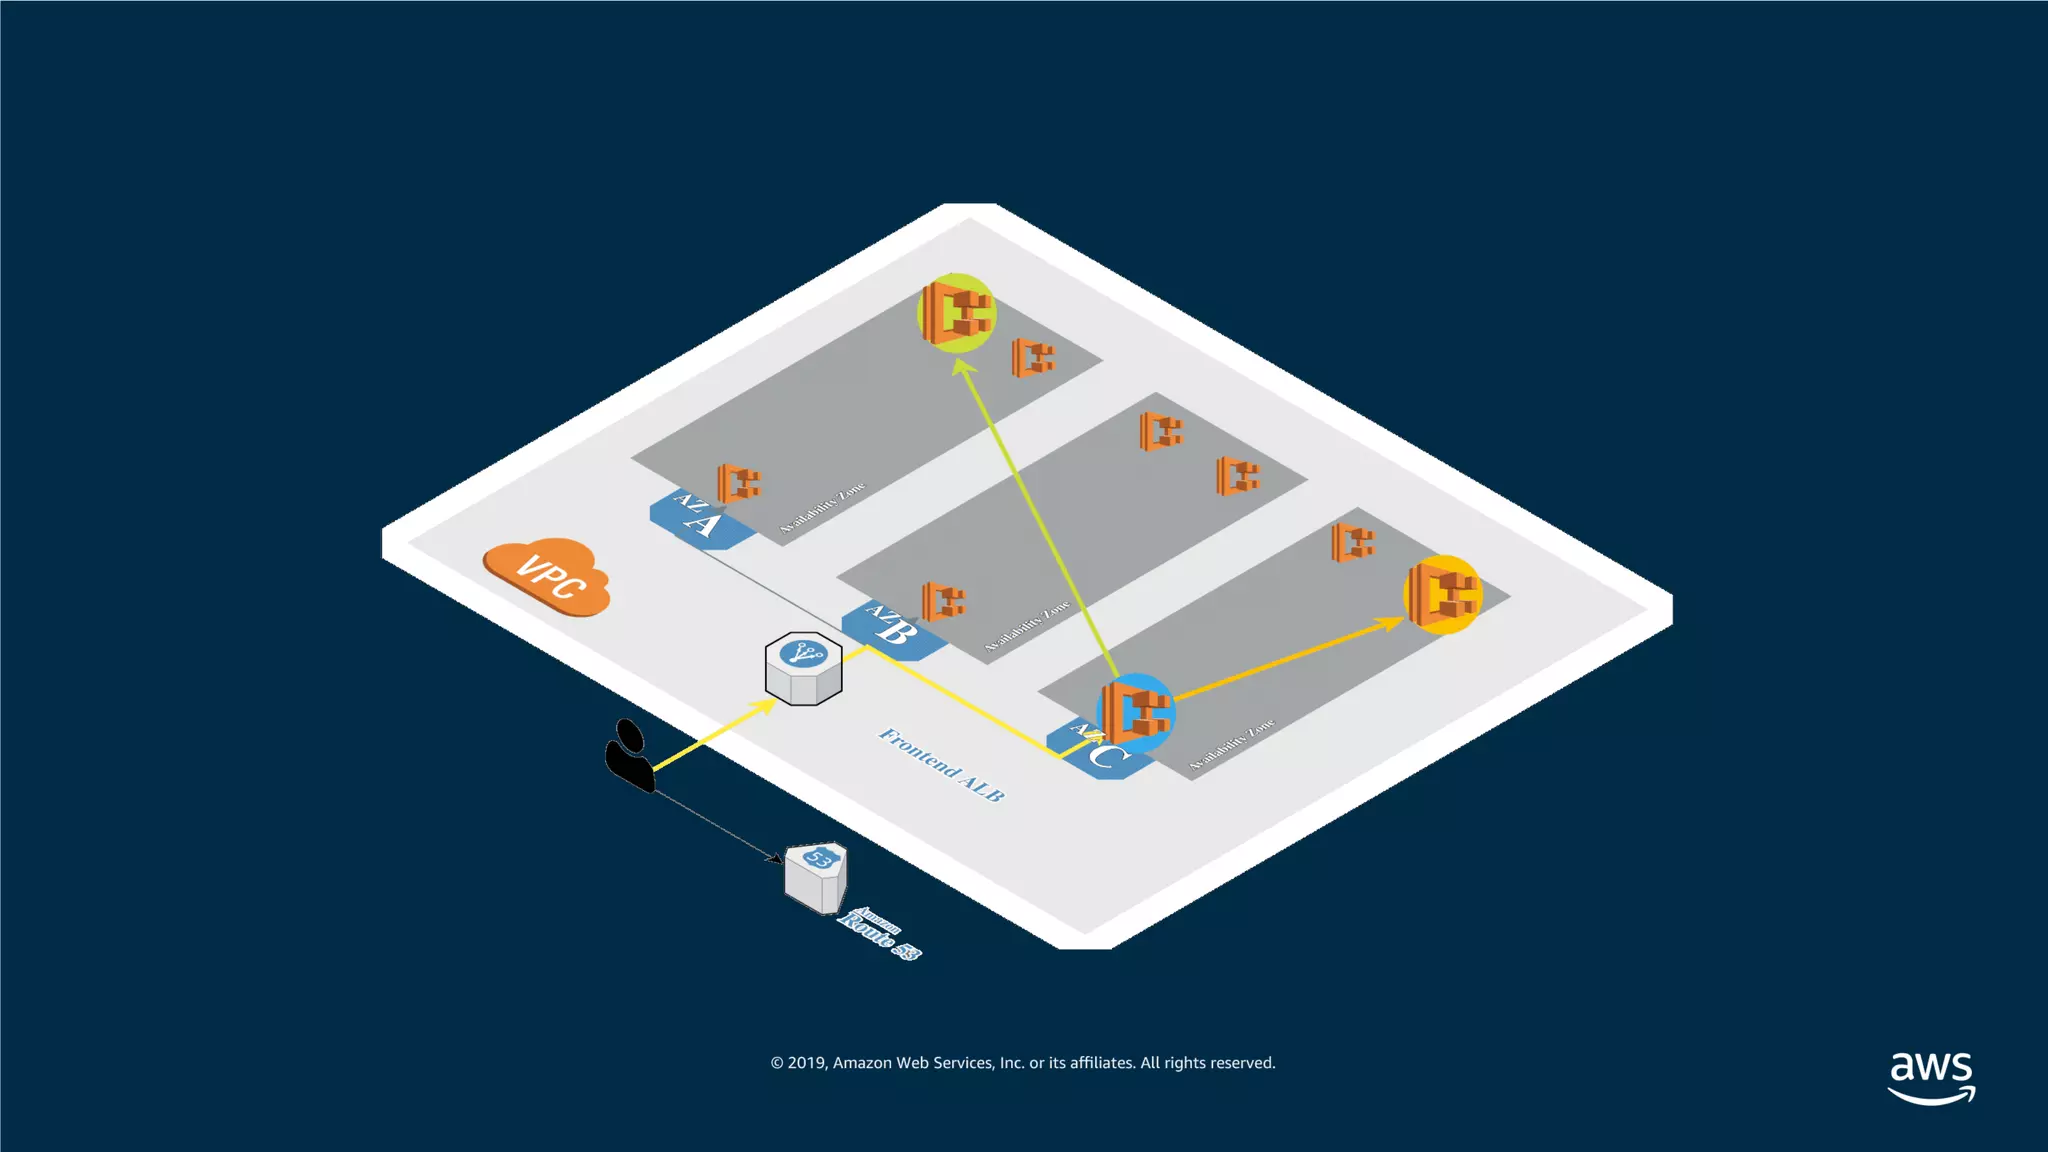
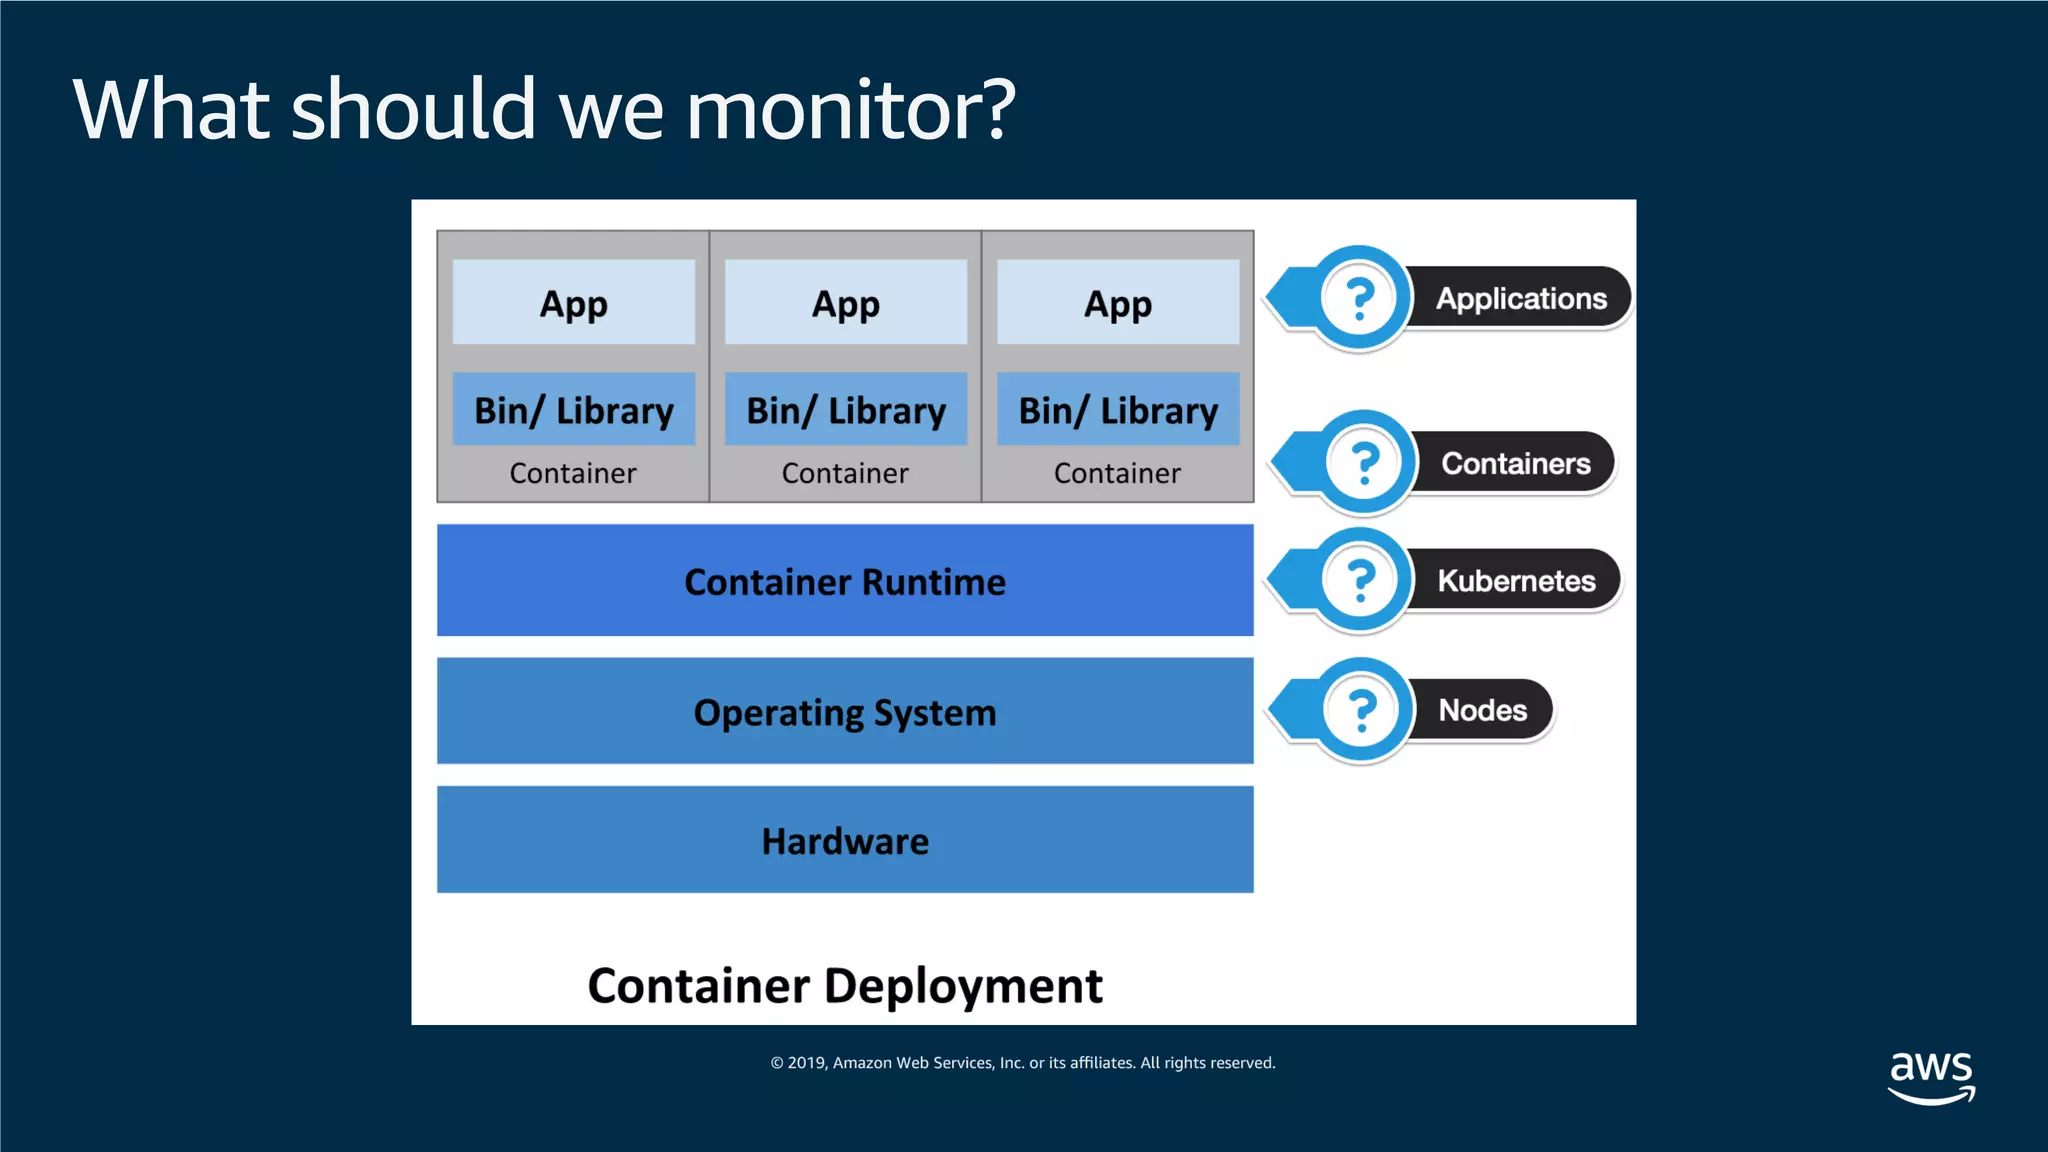
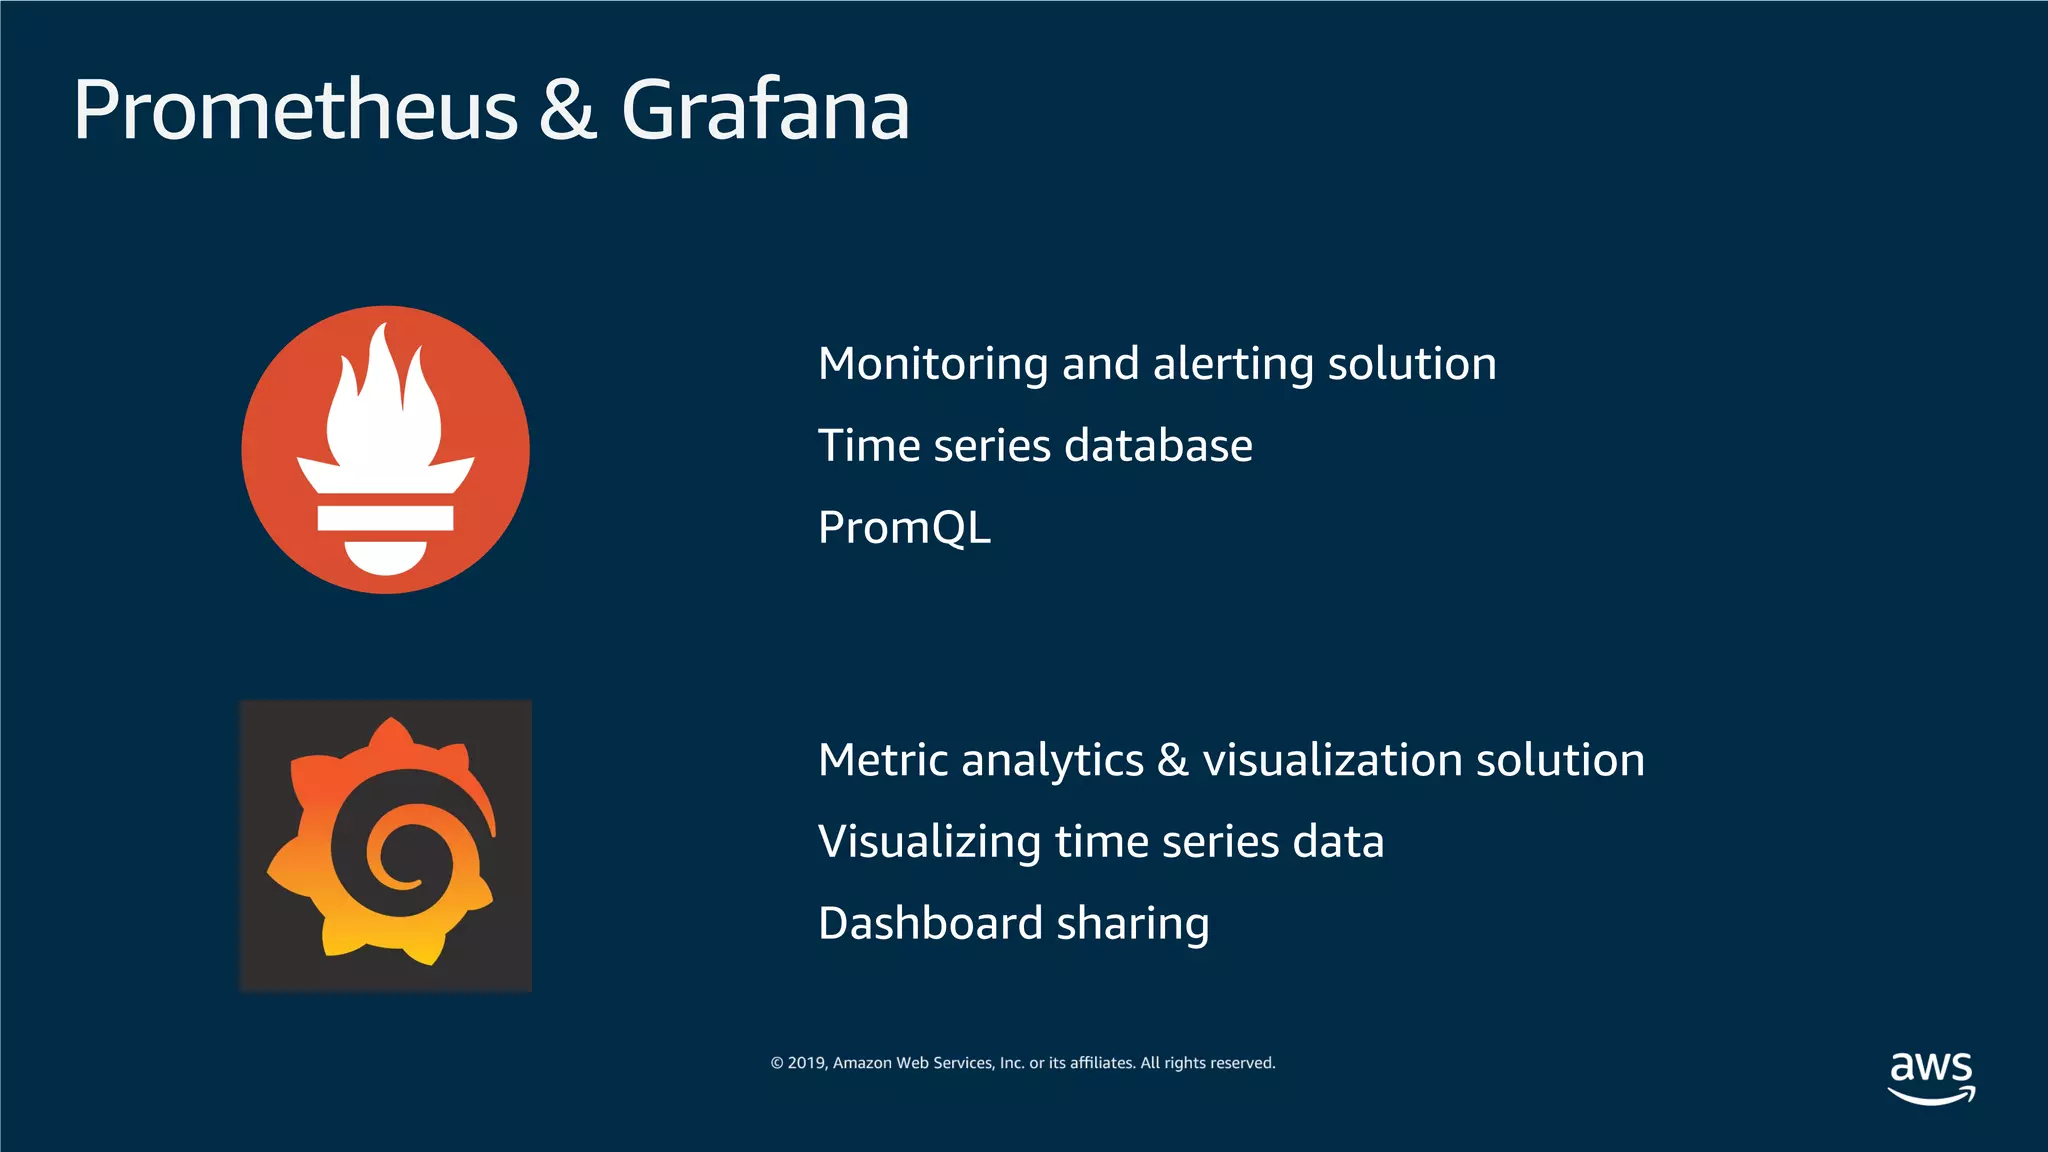
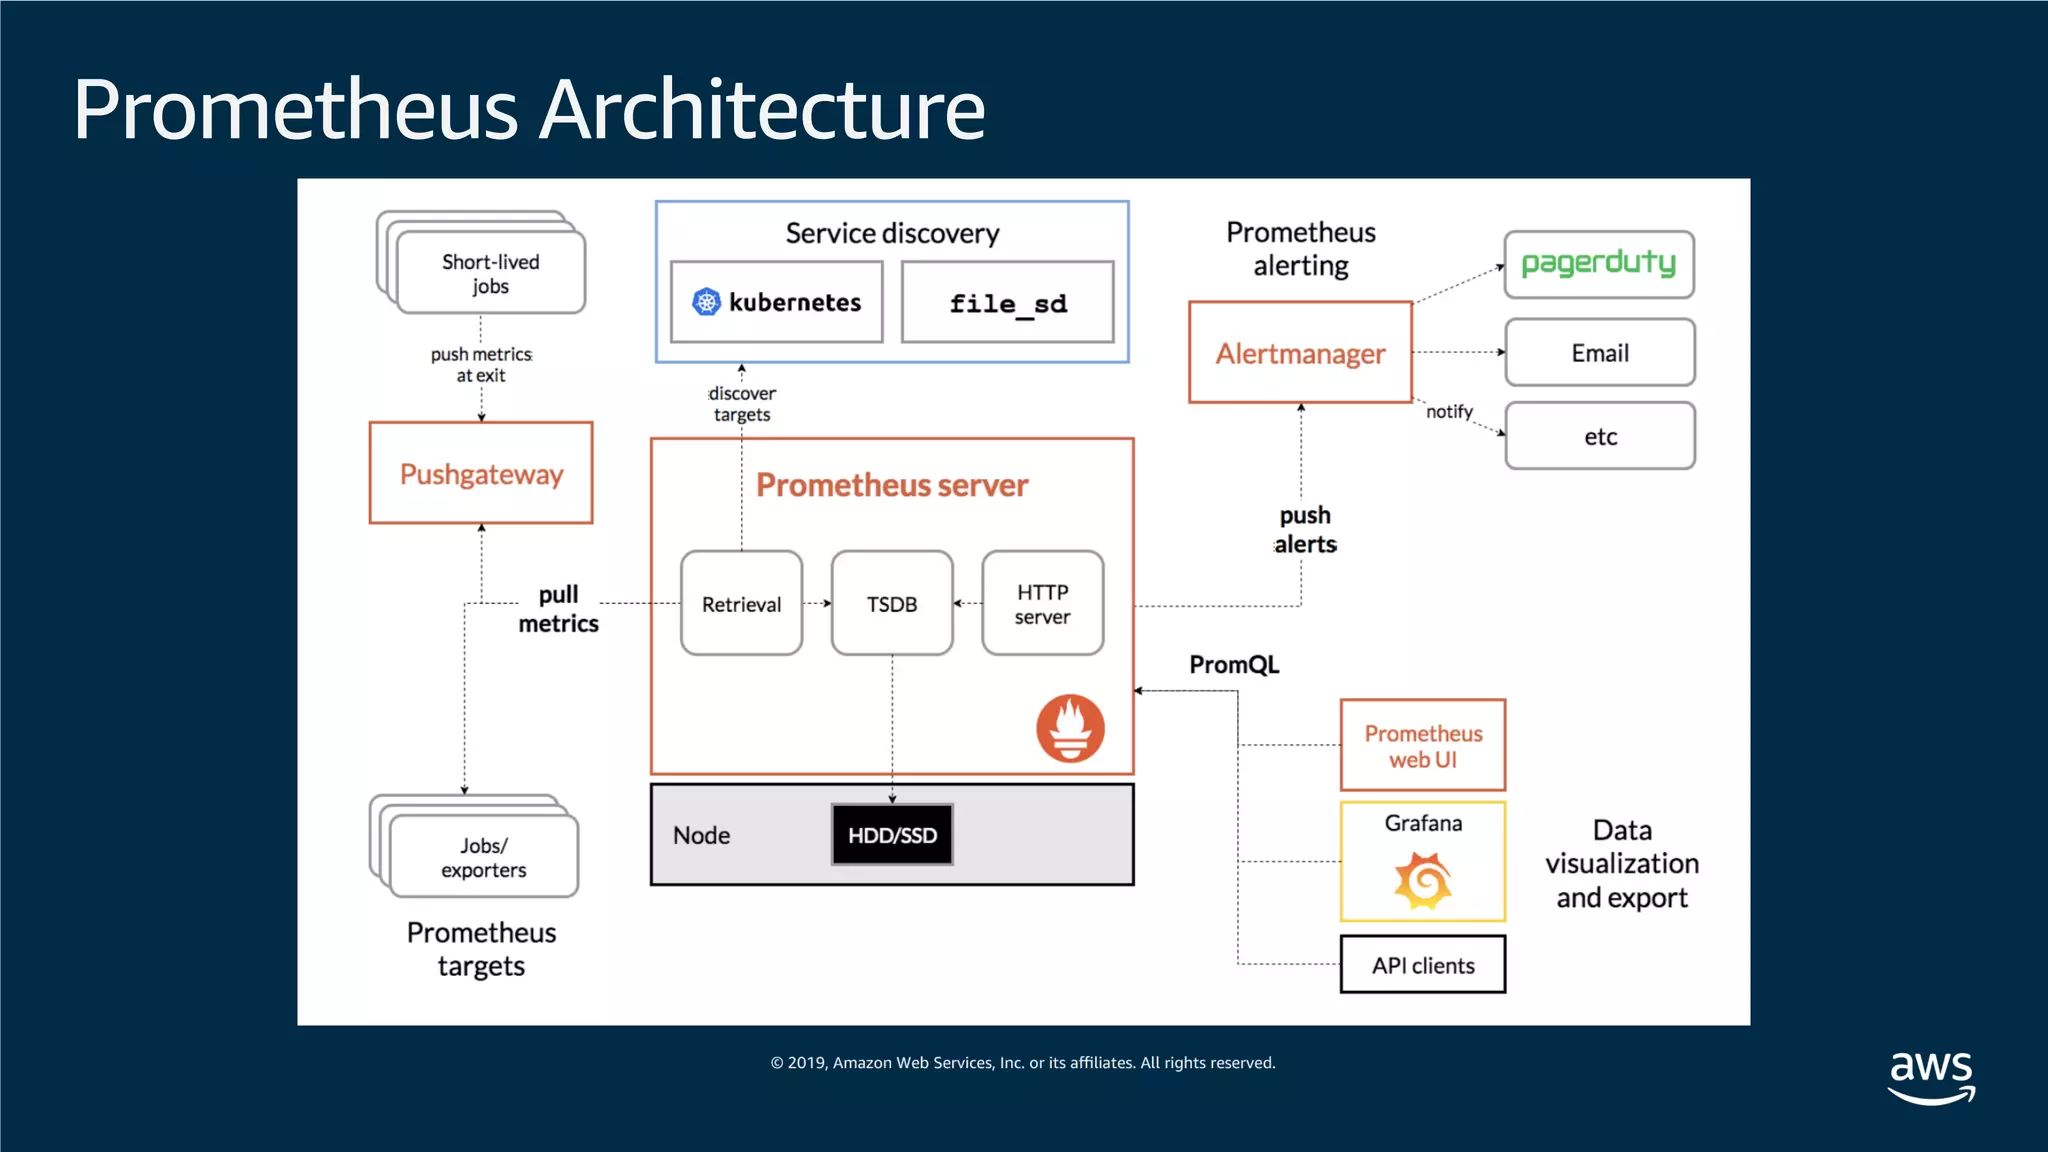
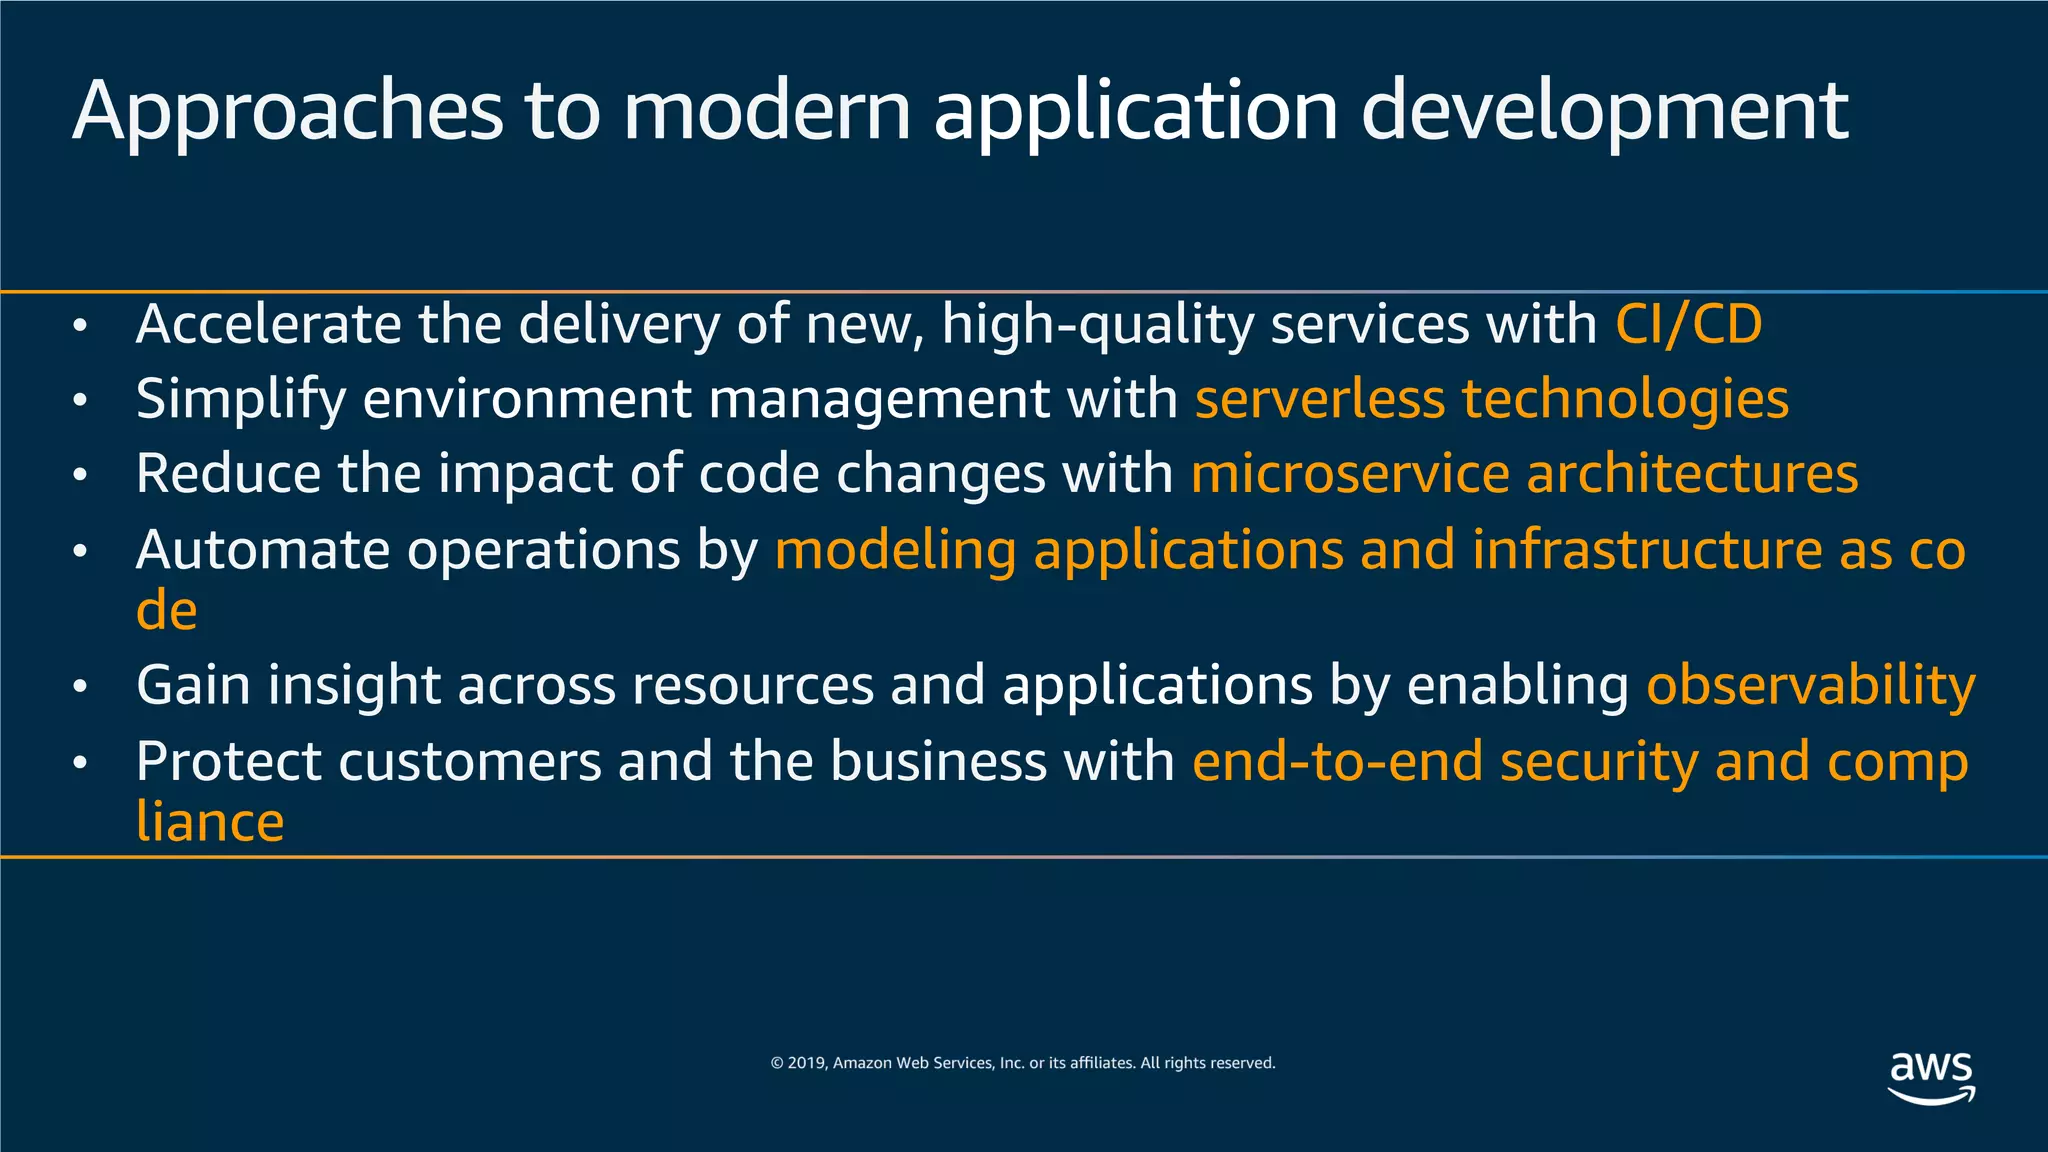
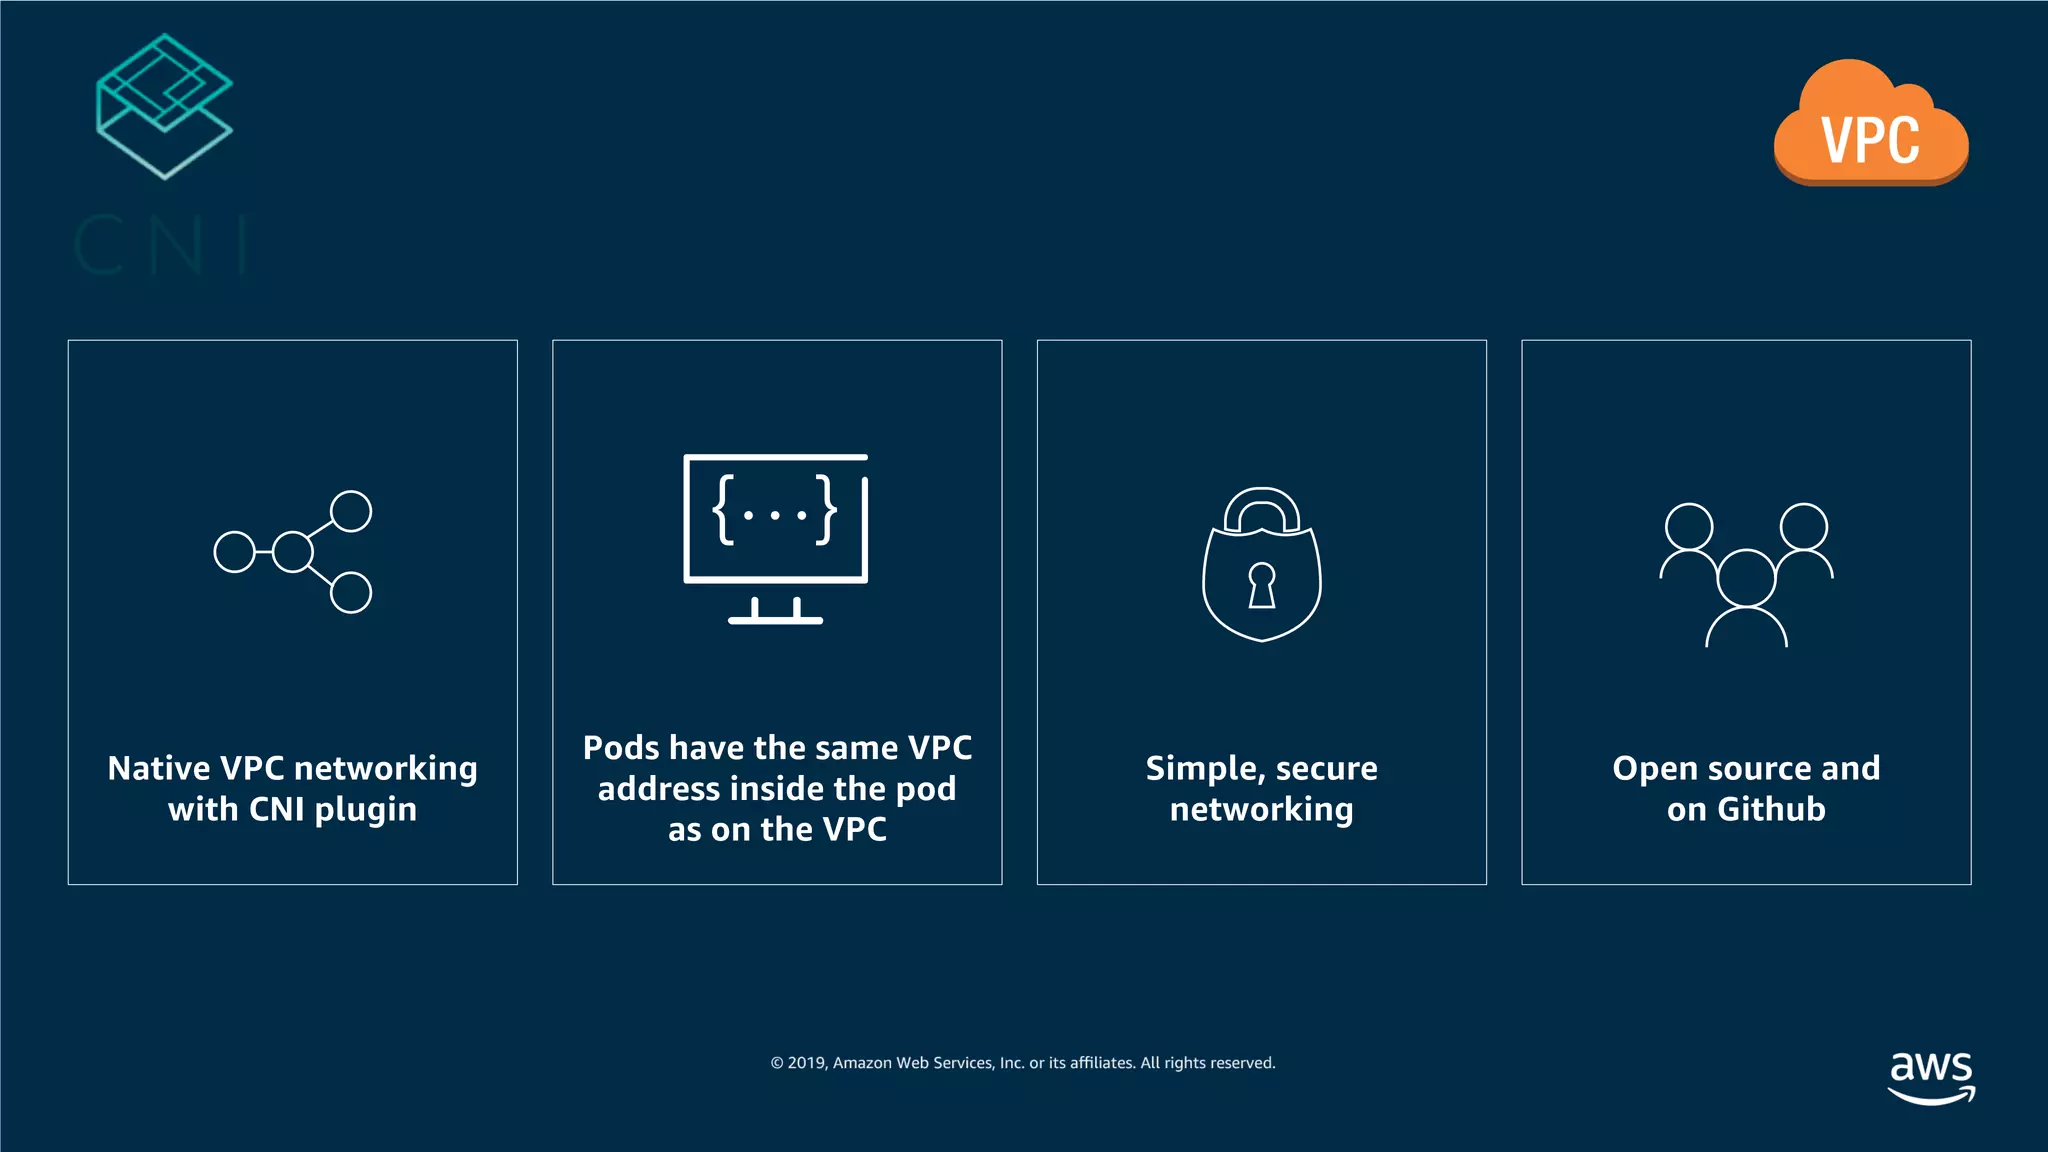
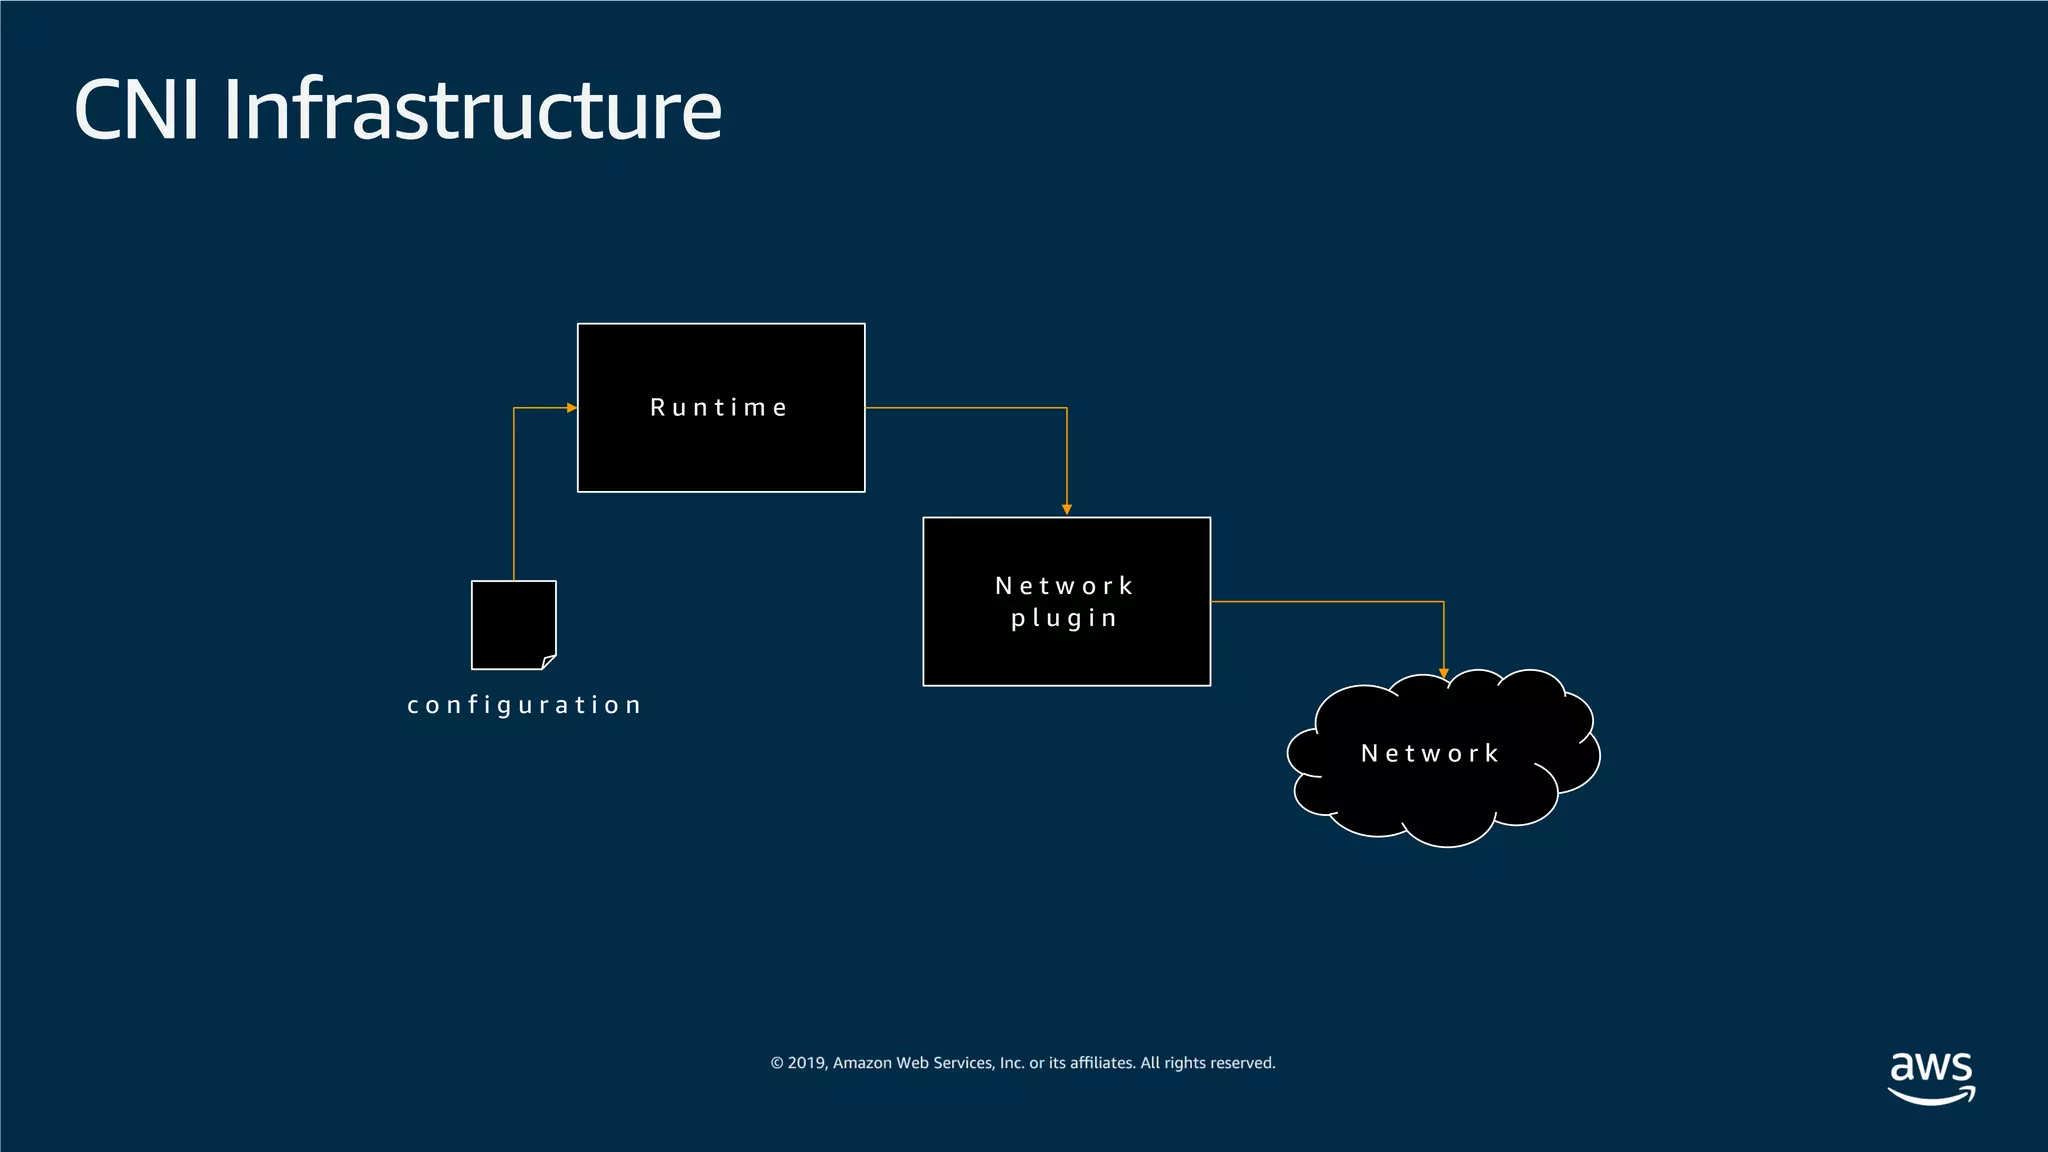
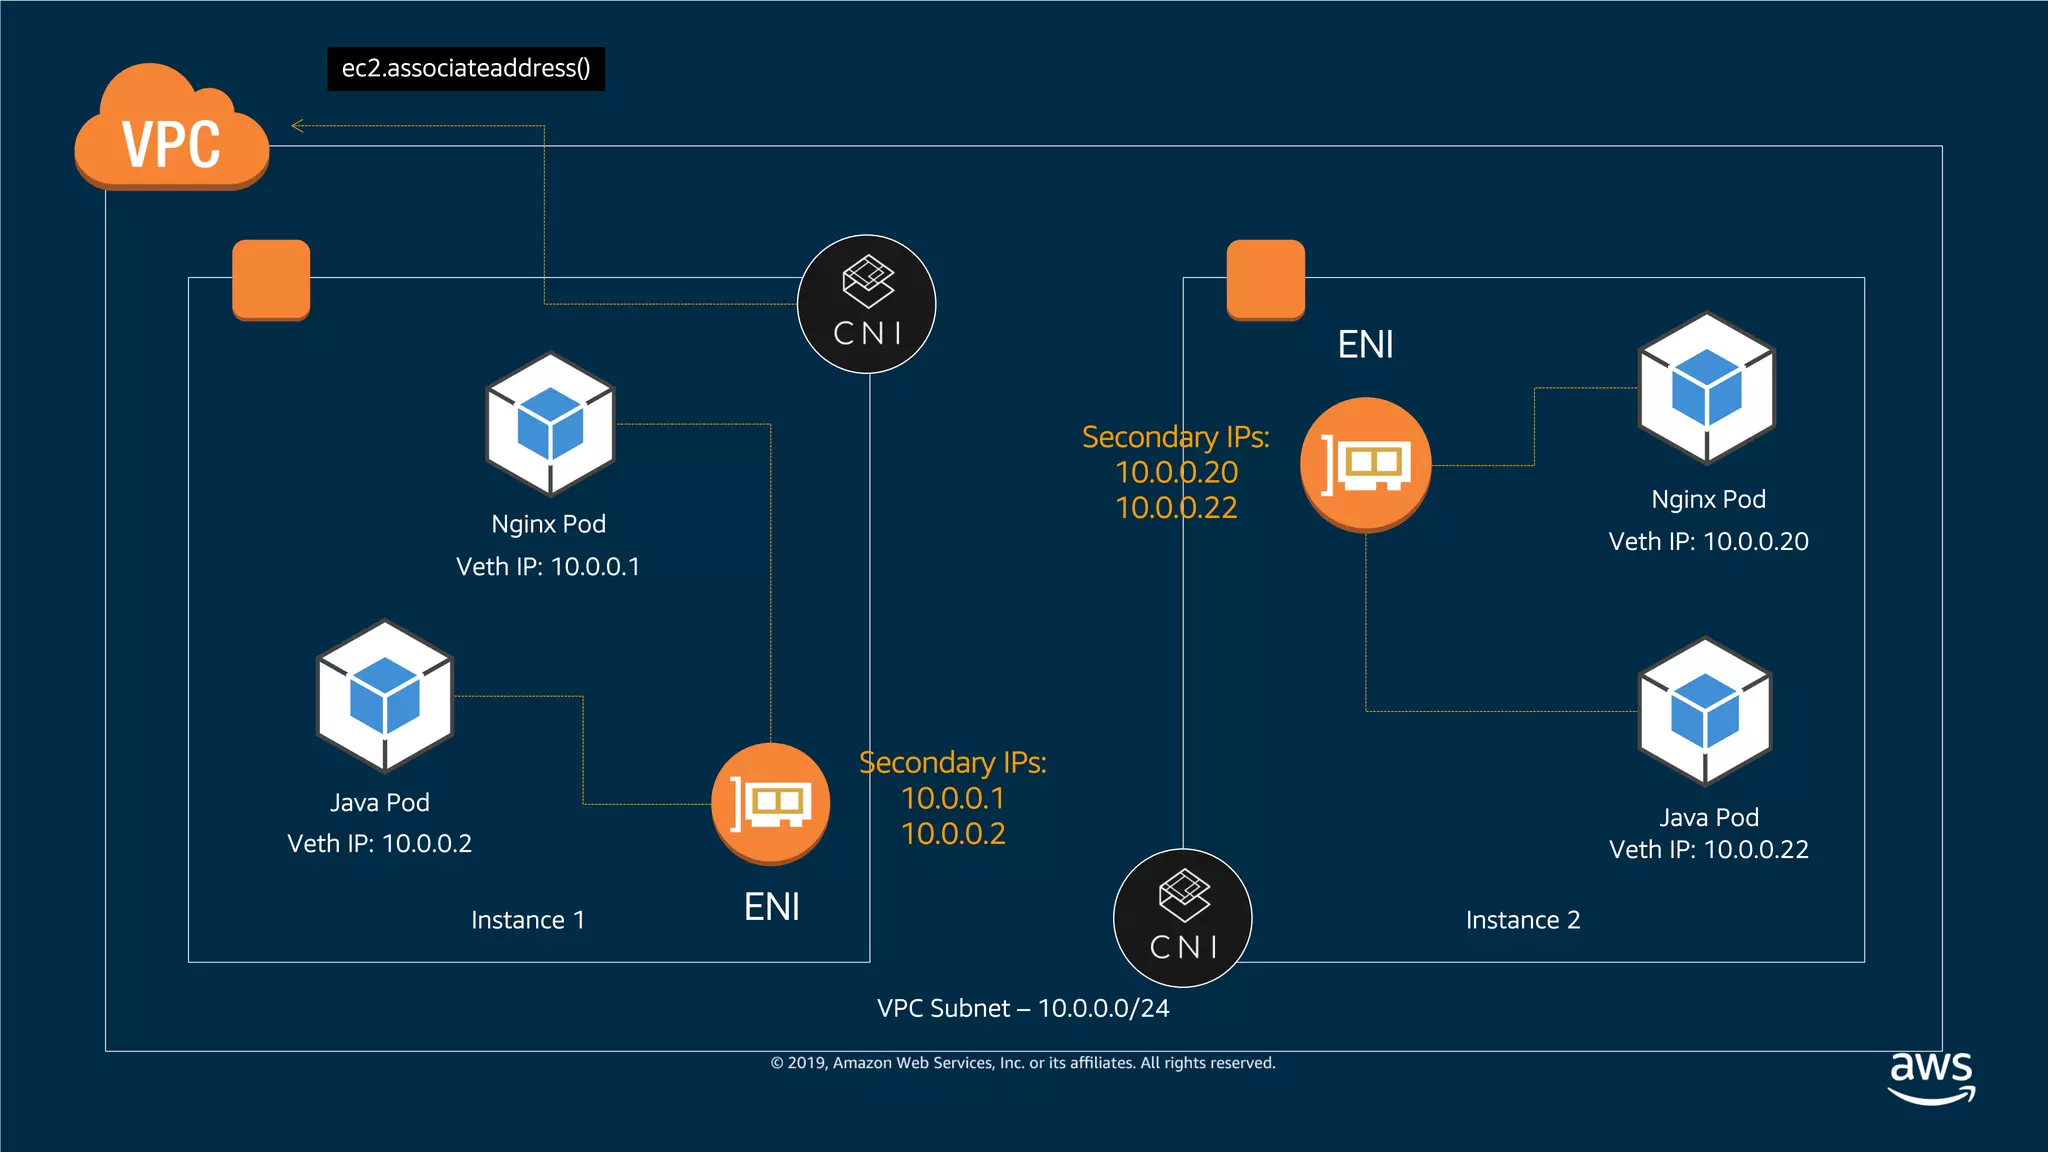
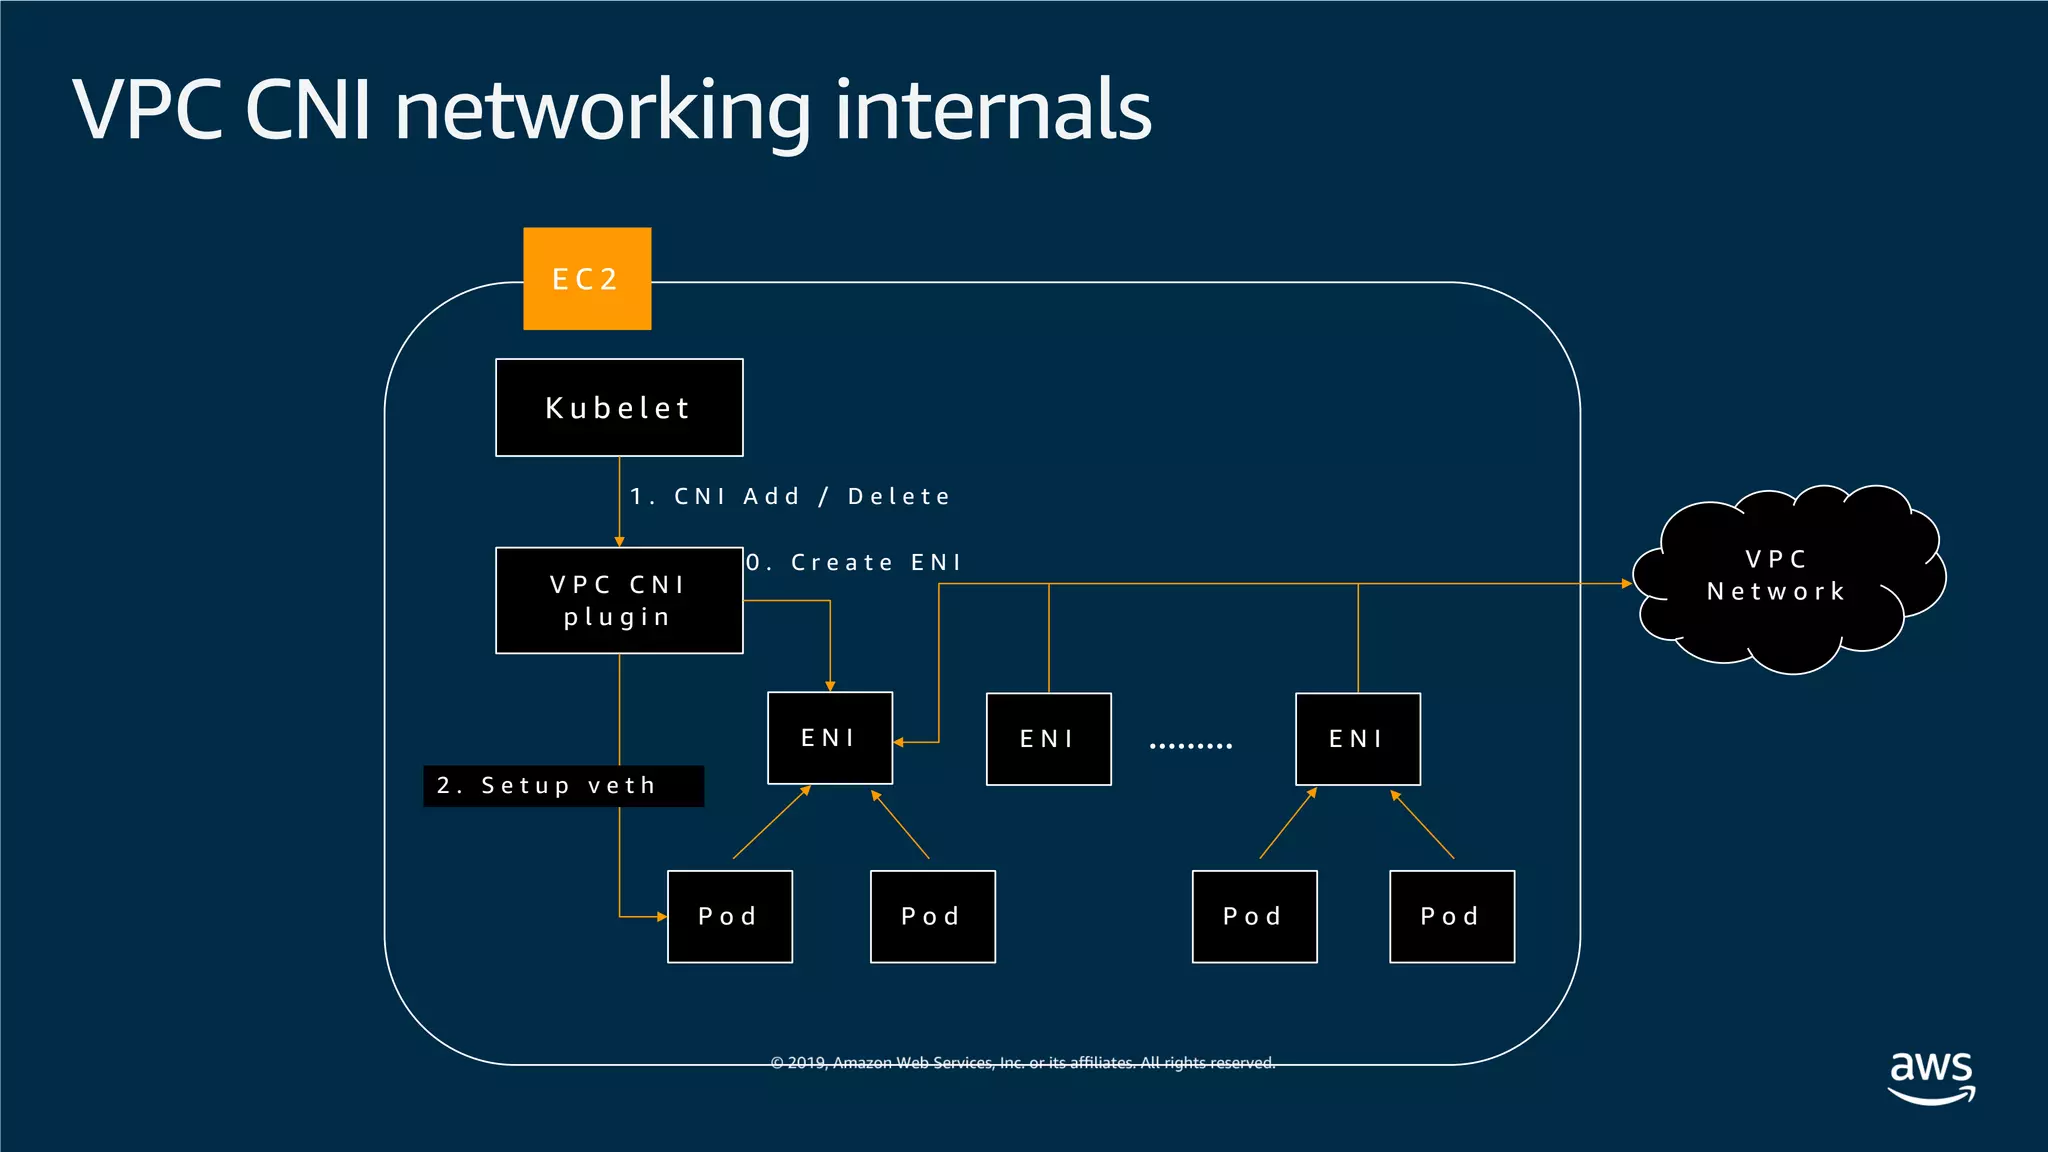
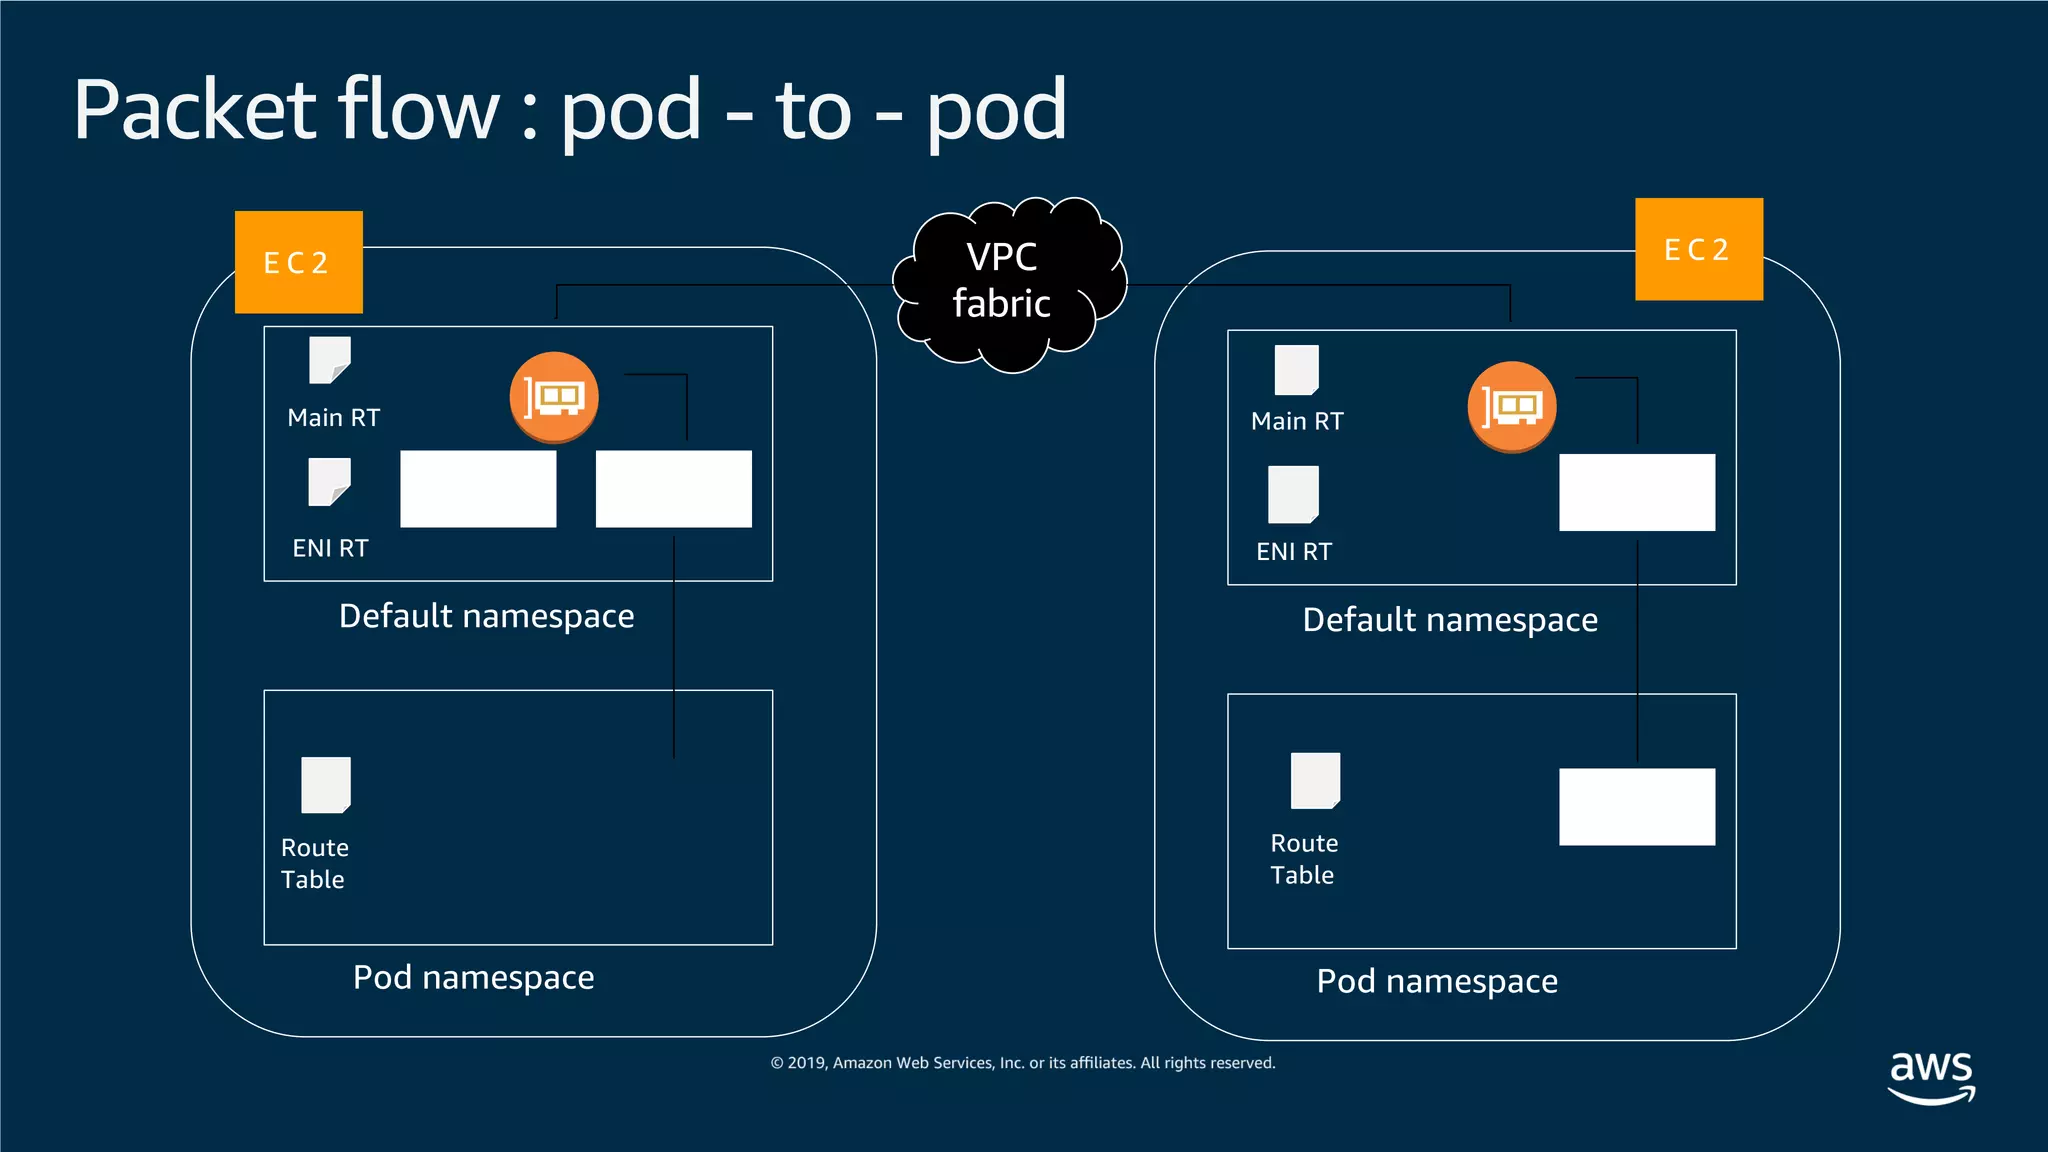
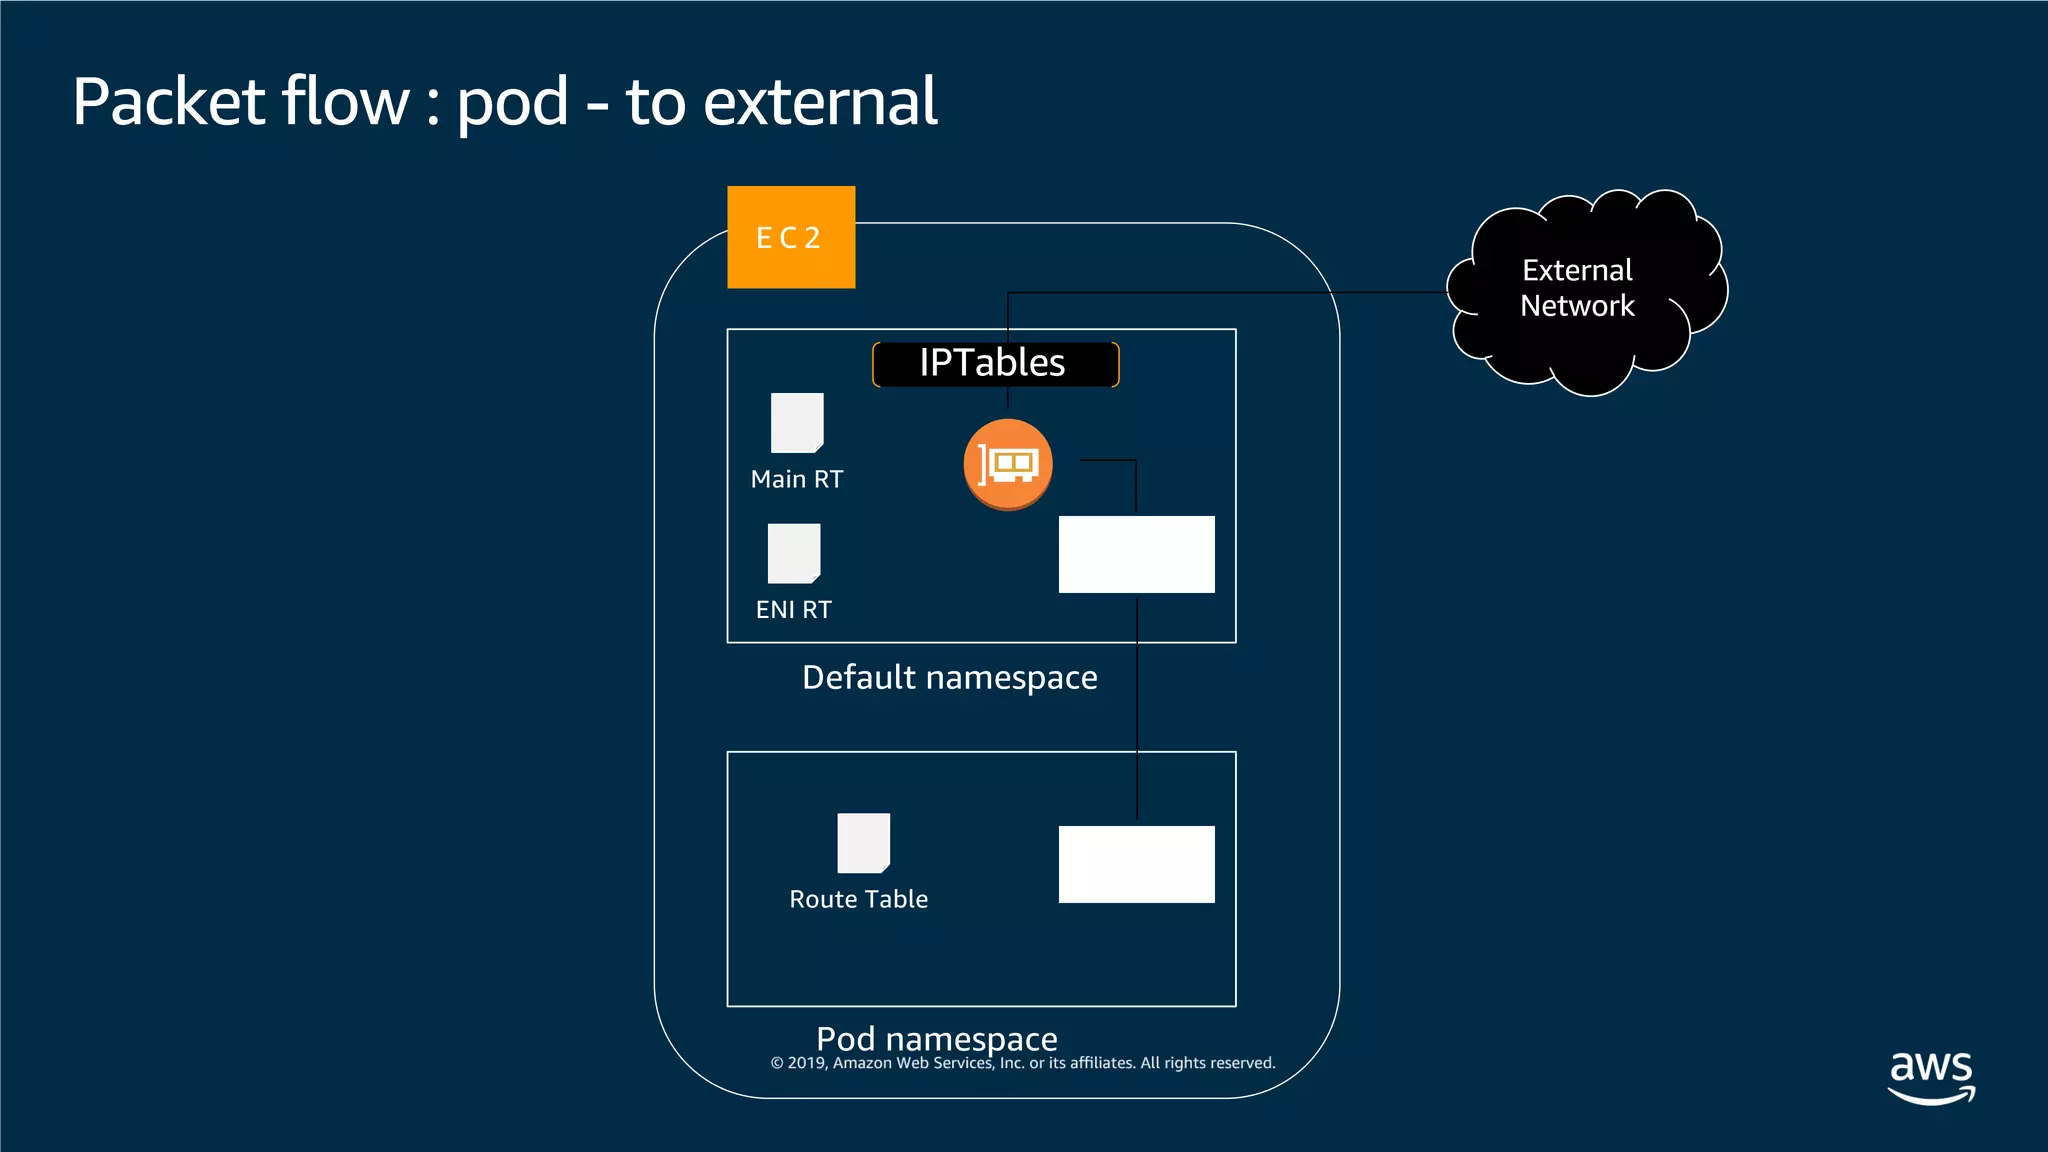
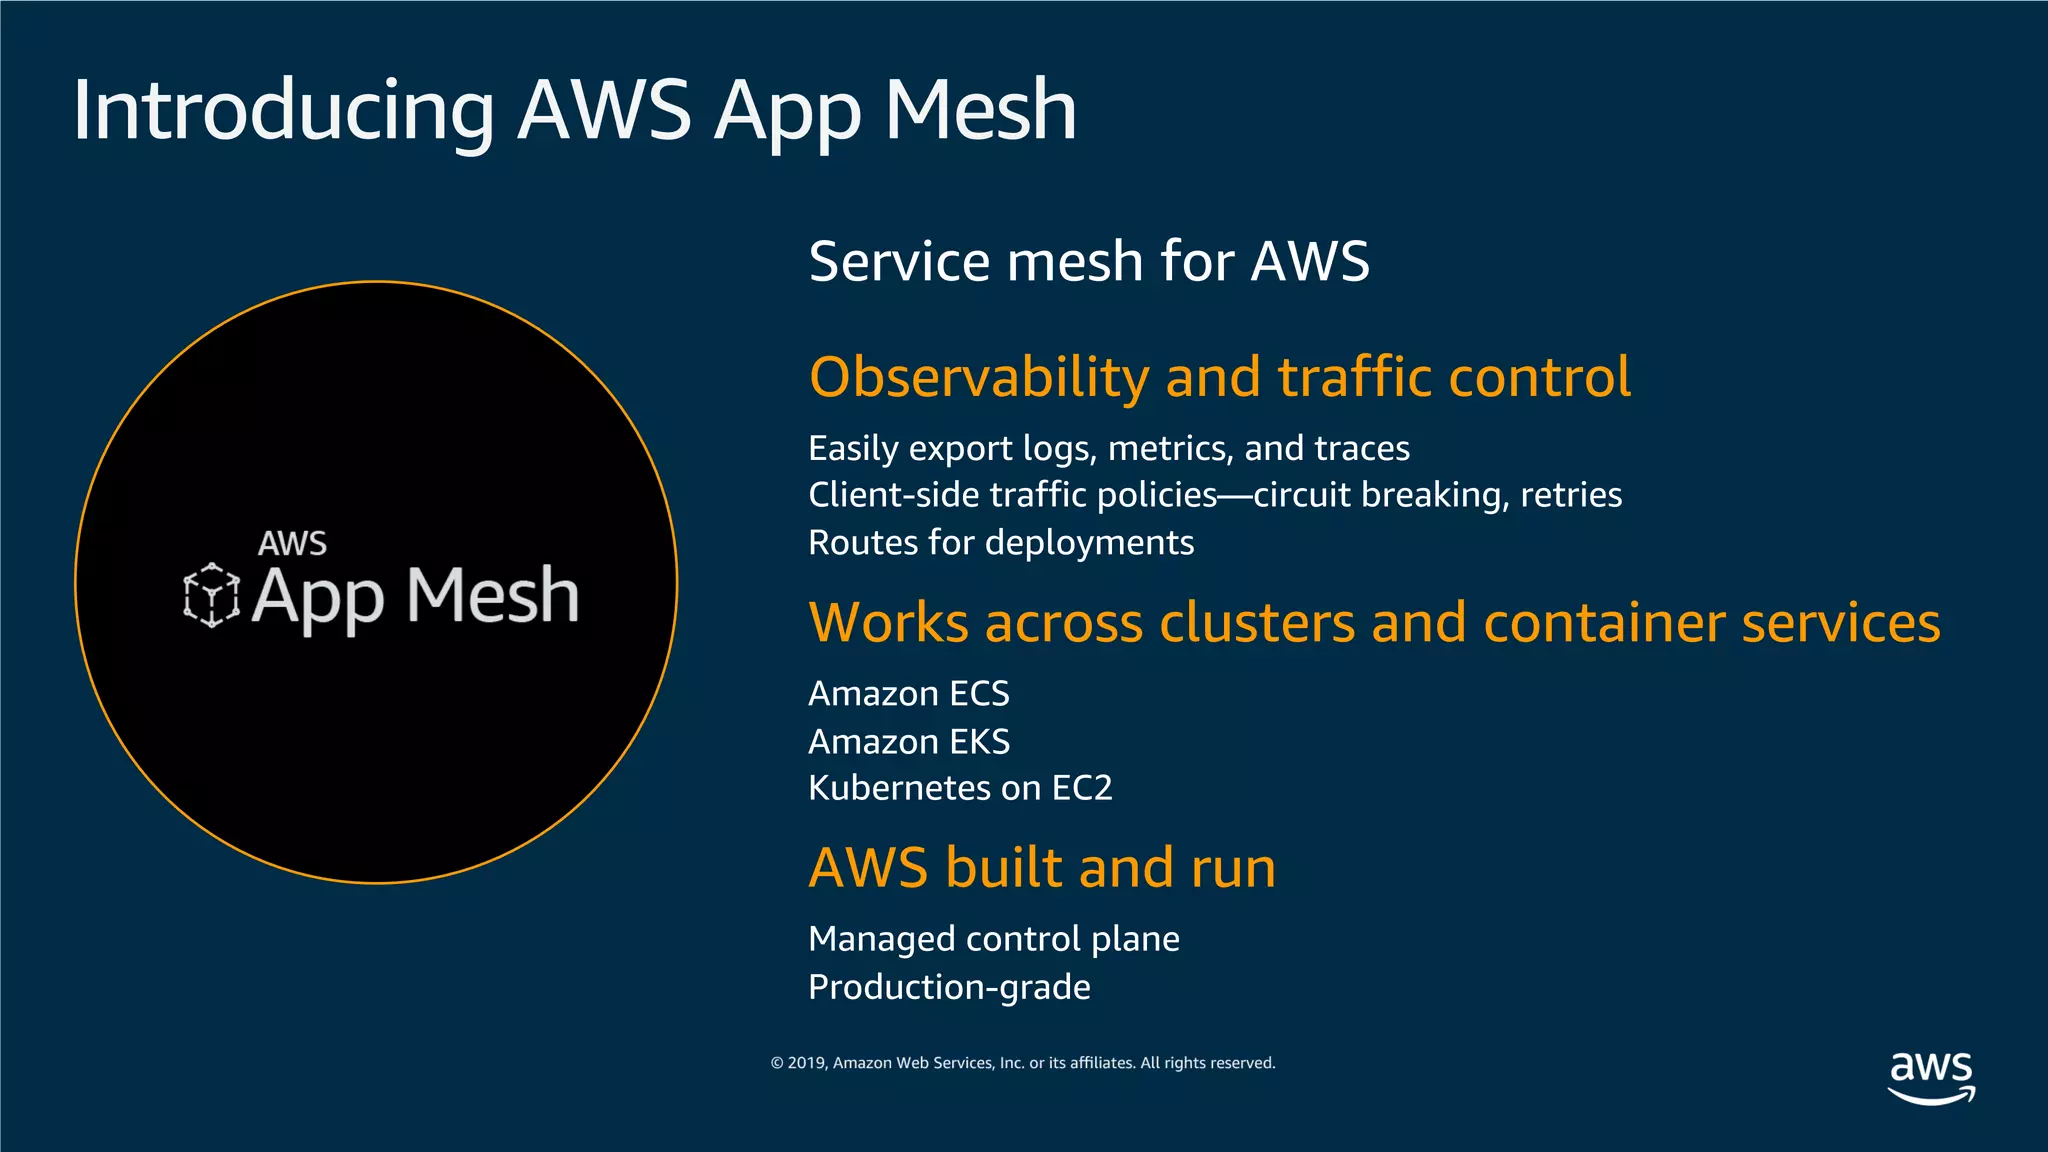
This document provides an overview of an Amazon EKS hands-on workshop. It introduces the workshop agenda which includes deploying example microservices, logging with Elasticsearch Fluentd and Kibana, monitoring with Prometheus and Grafana, and continuous integration/continuous delivery using GitOps with Weave Flux. Key concepts covered are Kubernetes pods, services, deployments, container networking with CNI plugins, observability tools, and CI/CD approaches.


![[AWS Container Service] Getting Started with Kubernetes on AWS](https://cdn.slidesharecdn.com/ss_thumbnails/200gettingstartedwithkubernetesonaws-190326085832-thumbnail.jpg?width=600ounds&width=560&fit=bounds)


![[AWS Dev Day] 앱 현대화 | DevOps 개발자가 되기 위한 쿠버네티스 핵심 활용 예제 알아보기 - 정영준 AWS 솔루션즈 아키...](https://cdn.slidesharecdn.com/ss_thumbnails/appmodernizationdevopsshealth-190930044249-thumbnail.jpg?width=600ounds&width=560&fit=bounds)


![[D3T1S01] Gen AI를 위한 Amazon Aurora 활용 사례 방법](https://cdn.slidesharecdn.com/ss_thumbnails/d3t1s01genaiamazonaurora-240702042912-516e67f4-thumbnail.jpg?width=600ounds&width=560&fit=bounds)
![[D3T1S06] Neptune Analytics with Vector Similarity Search](https://cdn.slidesharecdn.com/ss_thumbnails/d3t1s06neptuneanalyticsvectorsilimliaritysearch-240702042912-94c41309-thumbnail.jpg?width=600ounds&width=560&fit=bounds)
![[D3T1S03] Amazon DynamoDB design puzzlers](https://cdn.slidesharecdn.com/ss_thumbnails/d3t1s03amazondynamodbdesignpuzzlers-240702042912-ad6df881-thumbnail.jpg?width=600ounds&width=560&fit=bounds)
![[D3T1S04] Aurora PostgreSQL performance monitoring and troubleshooting by use...](https://cdn.slidesharecdn.com/ss_thumbnails/d3t1s04aurorapostgresqlperformancemonitoringandtroubleshooting-240702042912-5df626e3-thumbnail.jpg?width=600ounds&width=560&fit=bounds)
![[D3T1S07] AWS S3 - 클라우드 환경에서 데이터베이스 보호하기](https://cdn.slidesharecdn.com/ss_thumbnails/d3t1s07-240702042911-cb134cd6-thumbnail.jpg?width=600ounds&width=560&fit=bounds)
![[D3T1S05] Aurora 혼합 구성 아키텍처를 사용하여 예상치 못한 트래픽 급증 대응하기](https://cdn.slidesharecdn.com/ss_thumbnails/d3t1s05aurora-240702042911-c7f3f22d-thumbnail.jpg?width=600ounds&width=560&fit=bounds)
![[D3T1S02] Aurora Limitless Database Introduction](https://cdn.slidesharecdn.com/ss_thumbnails/d3t1s02auroralimitlessdatabaseintroduction-240702042911-cb5552b7-thumbnail.jpg?width=600ounds&width=560&fit=bounds)
![[D3T2S01] Amazon Aurora MySQL 메이저 버전 업그레이드 및 Amazon B/G Deployments 실습](https://cdn.slidesharecdn.com/ss_thumbnails/d3t2s01amazonaurorabluegreendeployment-240702042226-3ae36566-thumbnail.jpg?width=600ounds&width=560&fit=bounds)
![[D3T2S03] Data&AI Roadshow 2024 - Amazon DocumentDB 실습](https://cdn.slidesharecdn.com/ss_thumbnails/d3t2s03documentdbhandson-240702042224-047bbc2c-thumbnail.jpg?width=600ounds&width=560&fit=bounds)


![[Keynote] 슬기로운 AWS 데이터베이스 선택하기 - 발표자: 강민석, Korea Database SA Manager, WWSO, A...](https://cdn.slidesharecdn.com/ss_thumbnails/d3s01aws-230704014400-3eeae447-thumbnail.jpg?width=600ounds&width=560&fit=bounds)


![UiPath Automation Suite Installation (Hands-On) [2/3]](https://cdn.slidesharecdn.com/ss_thumbnails/automationsuitecommunitysession2-251015095633-a6d862f1-thumbnail.jpg?width=600ounds&width=560&fit=bounds)


