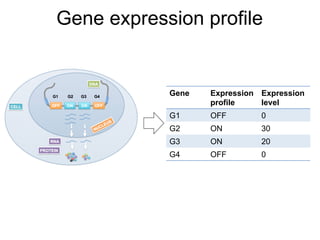
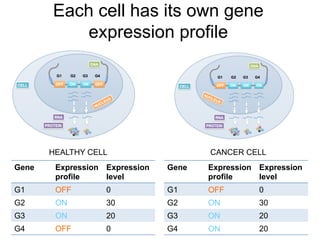
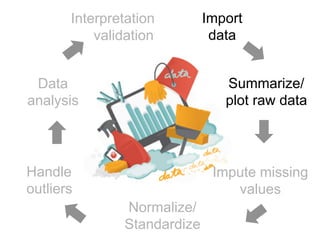
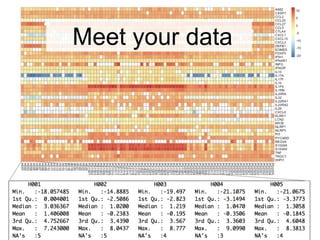
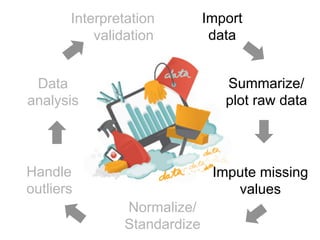
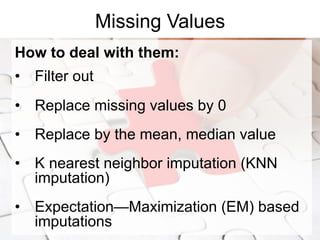
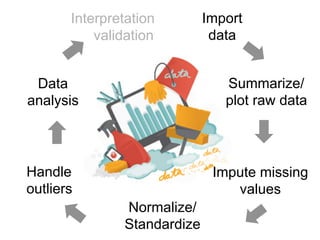
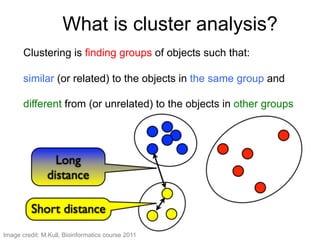
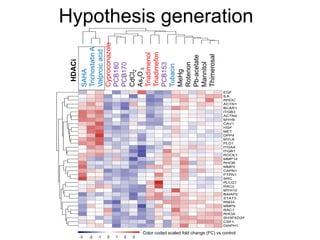
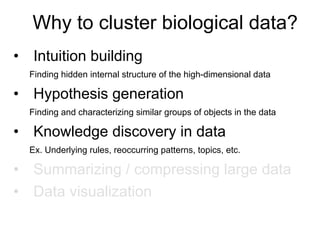
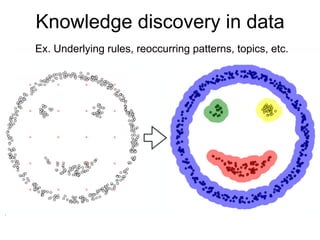
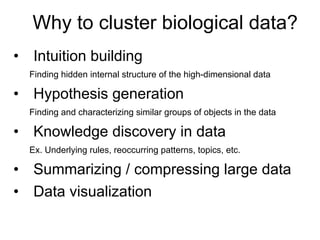
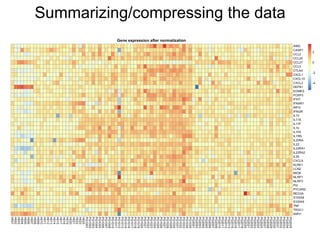
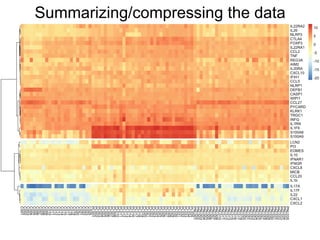
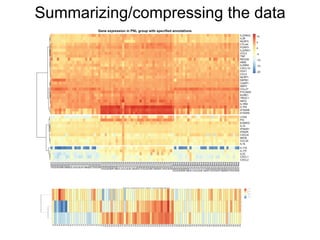
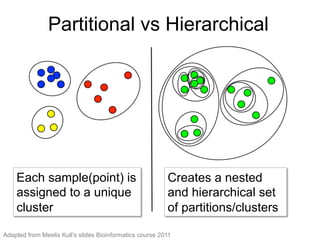
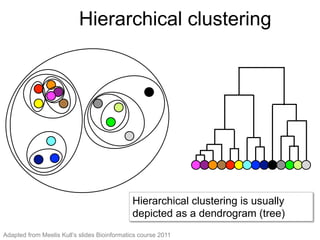
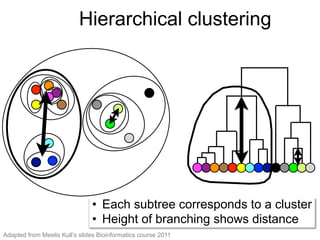
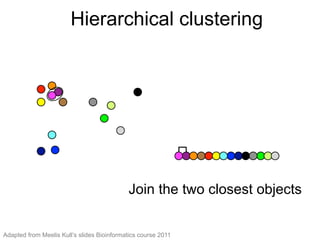
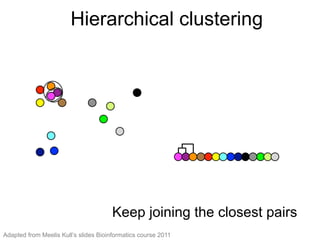
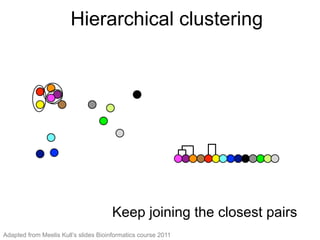
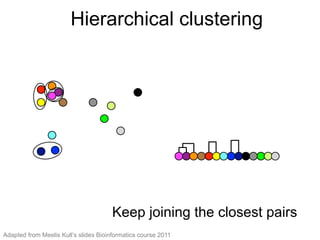
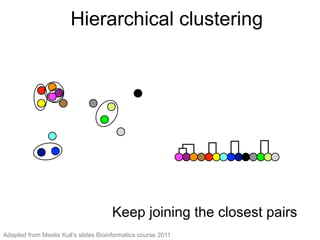
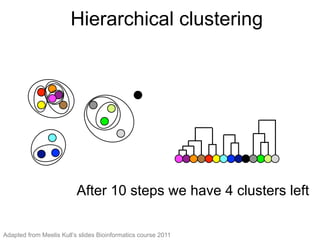
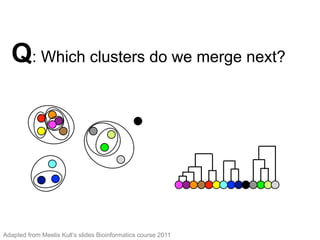
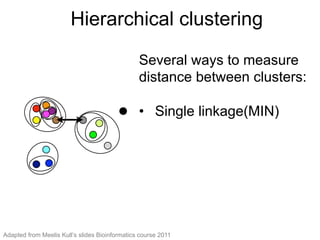
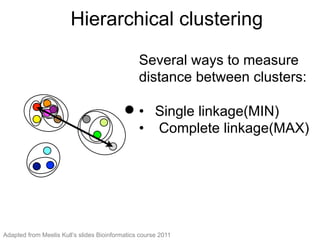
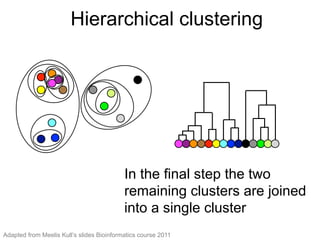
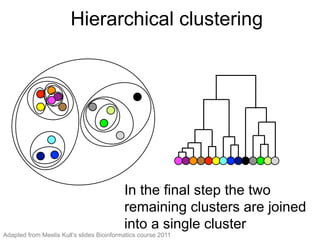
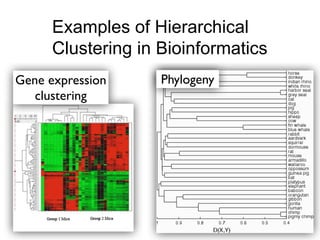
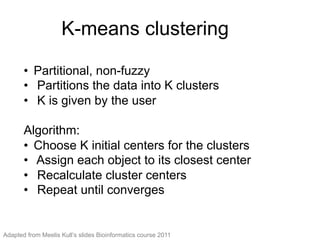
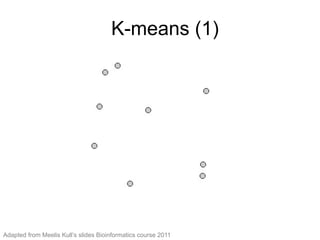
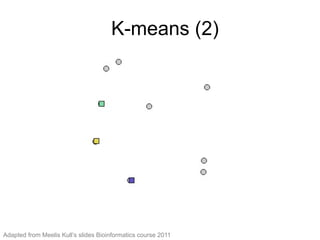
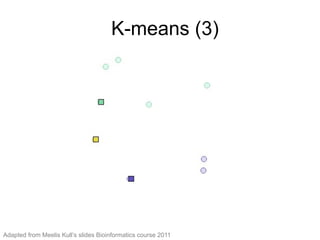
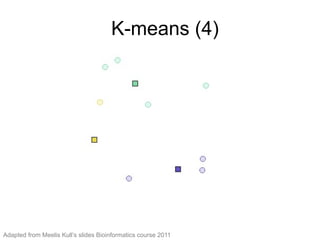
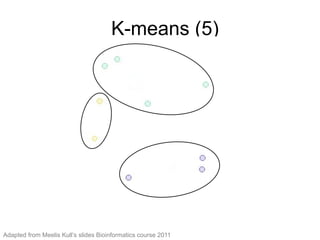
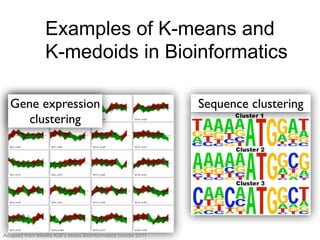
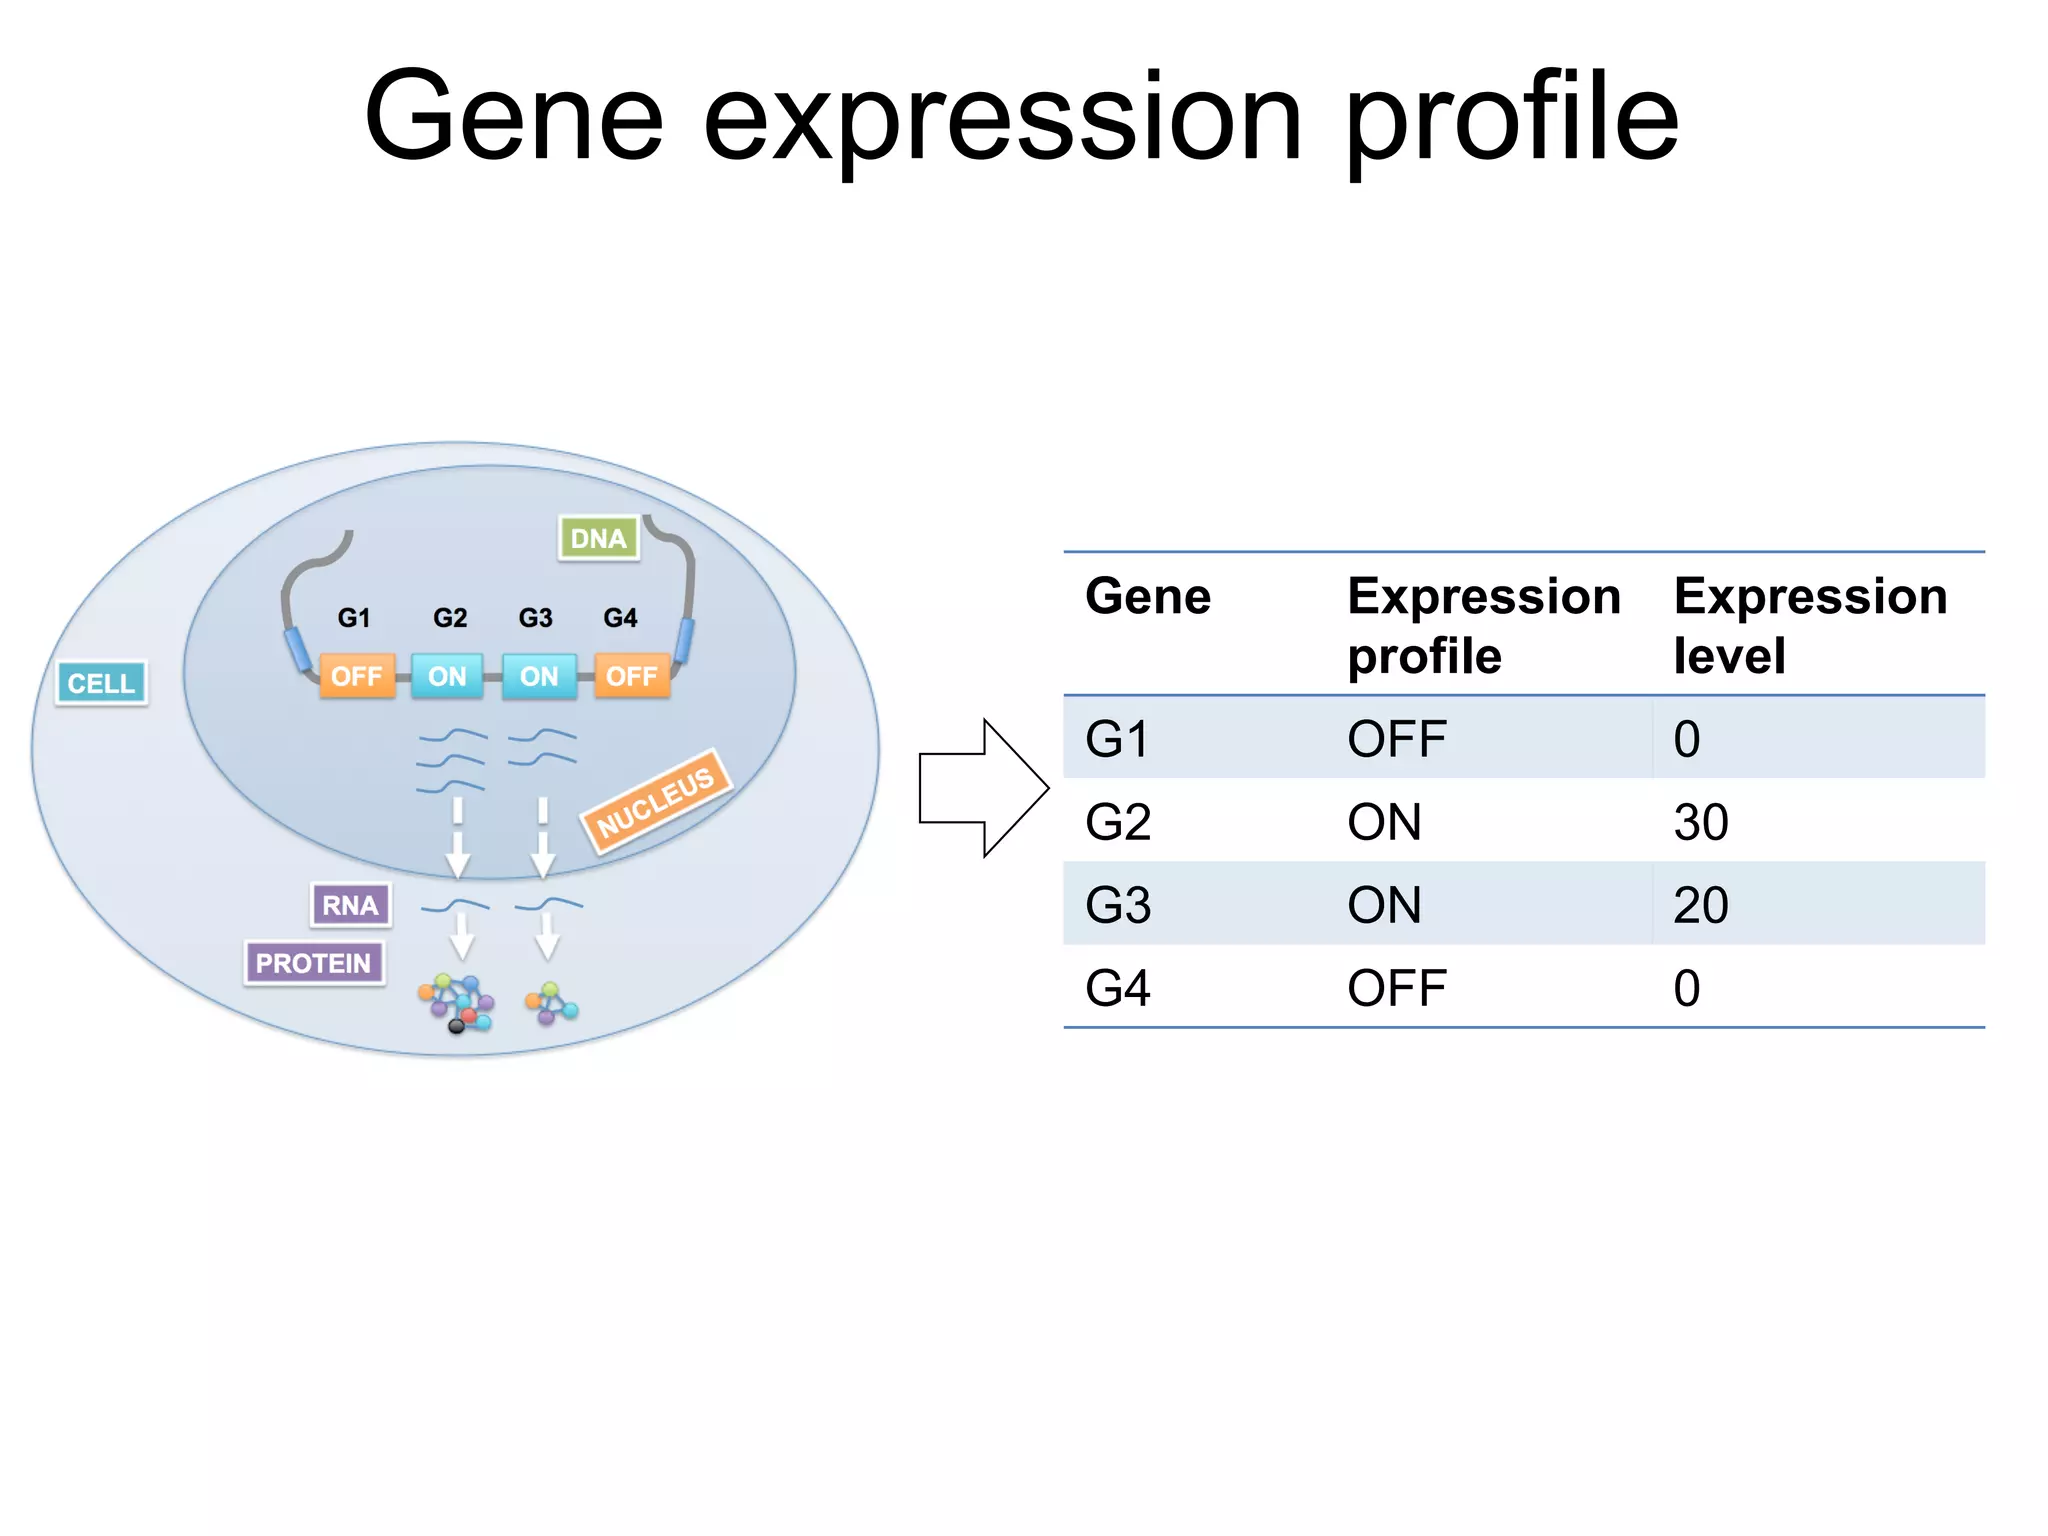
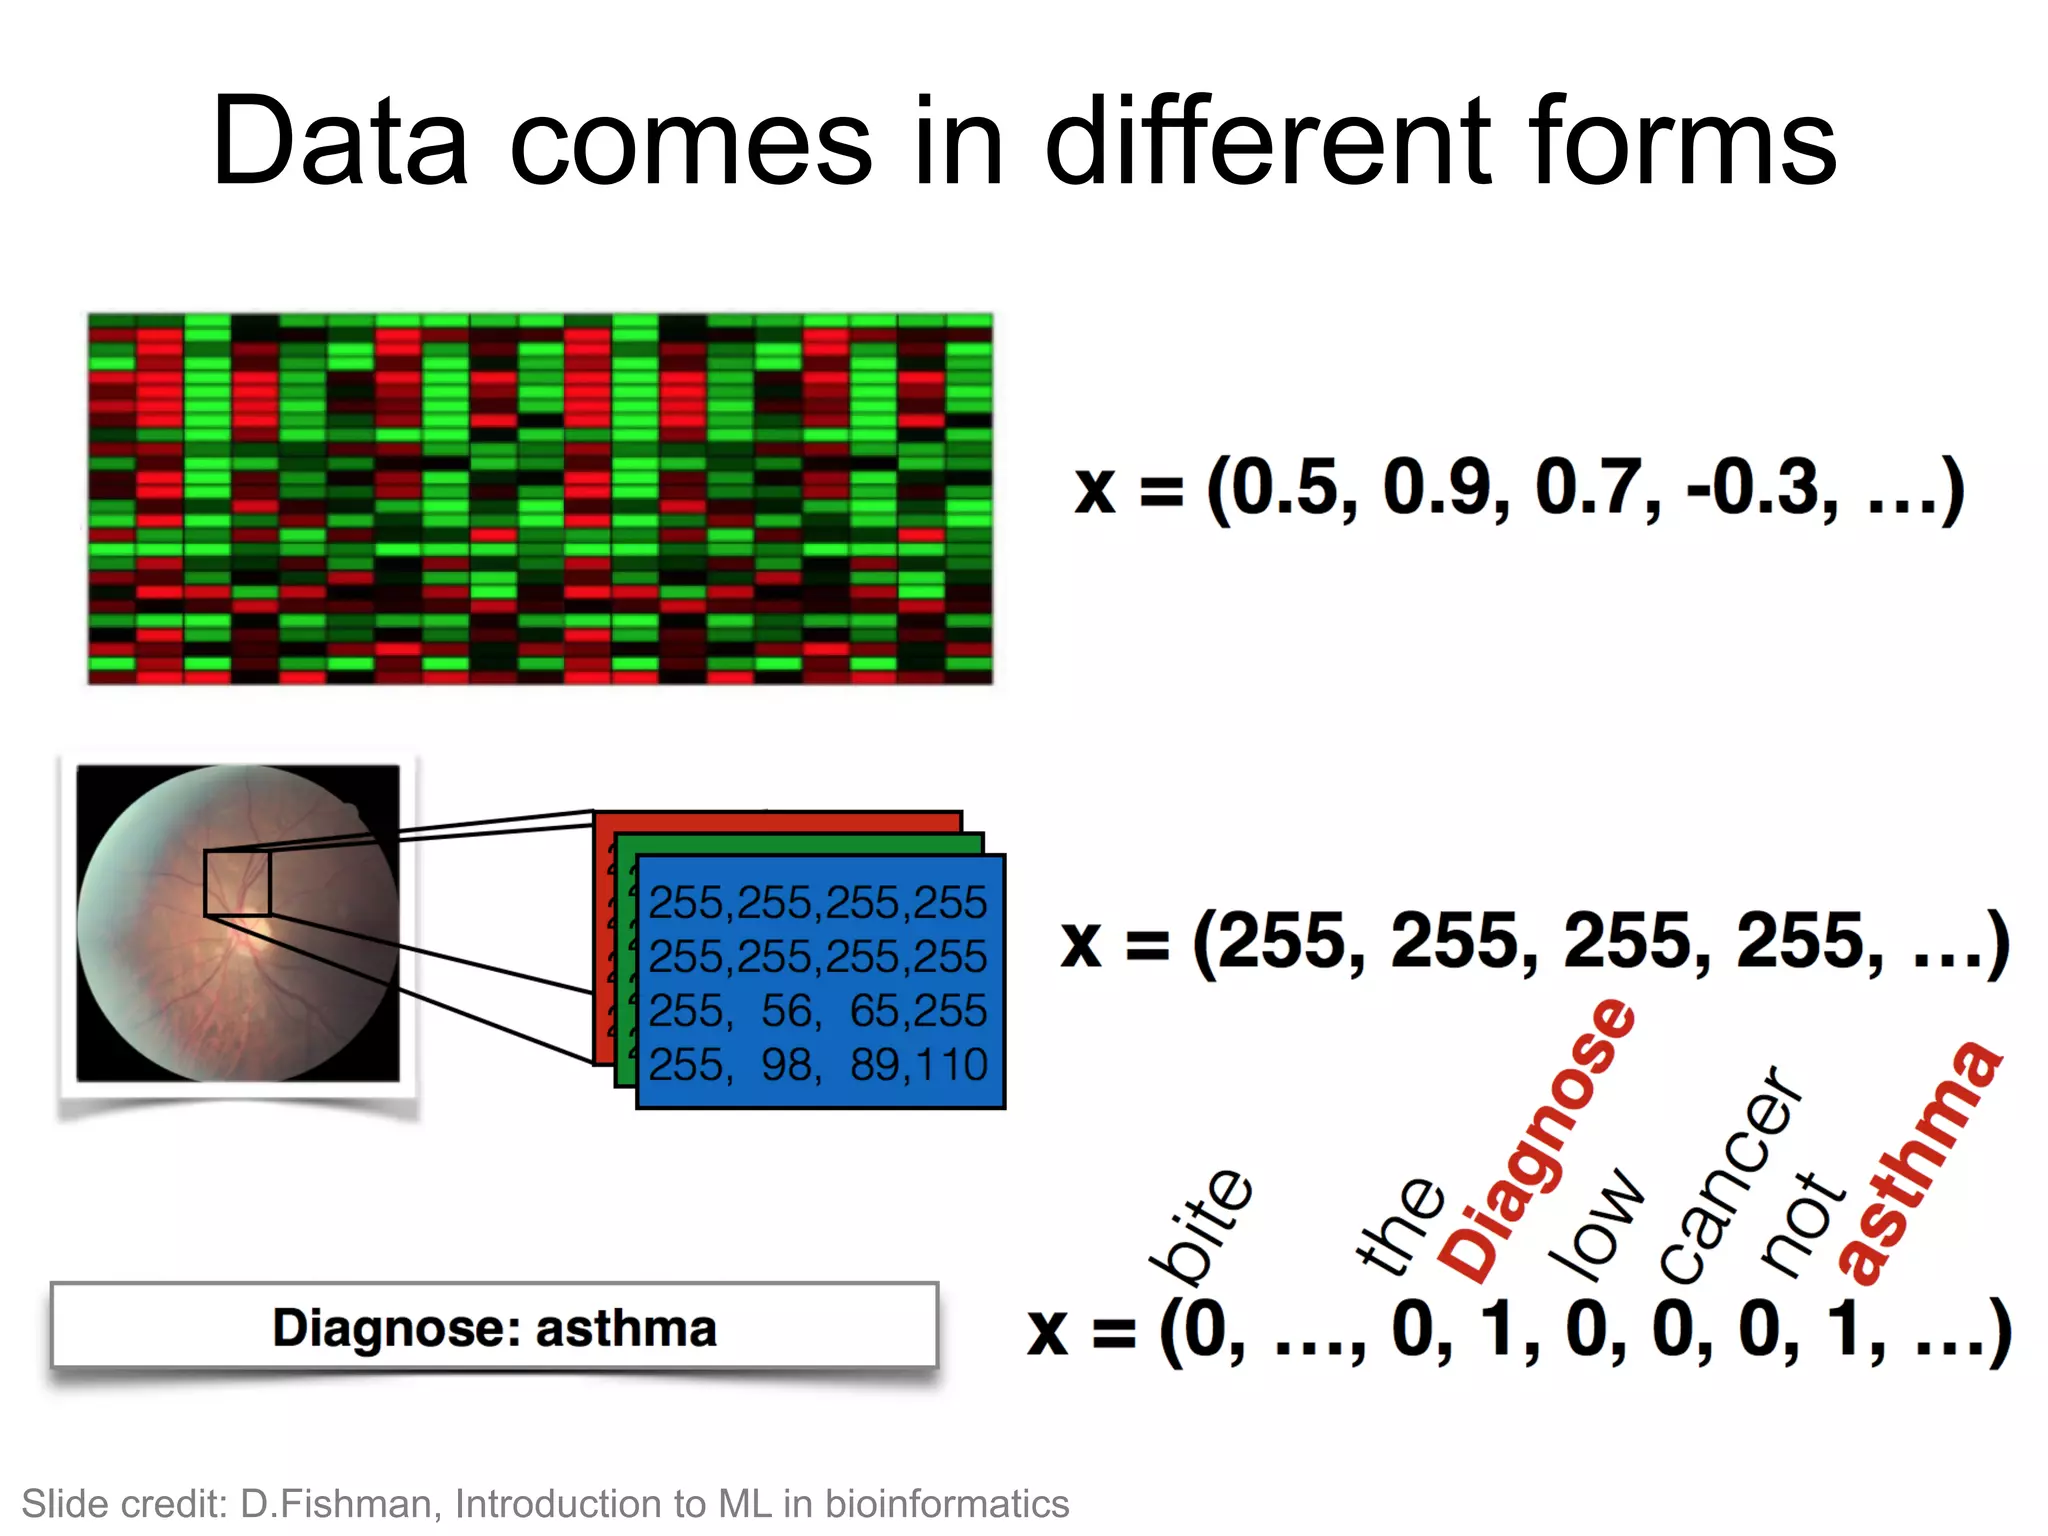
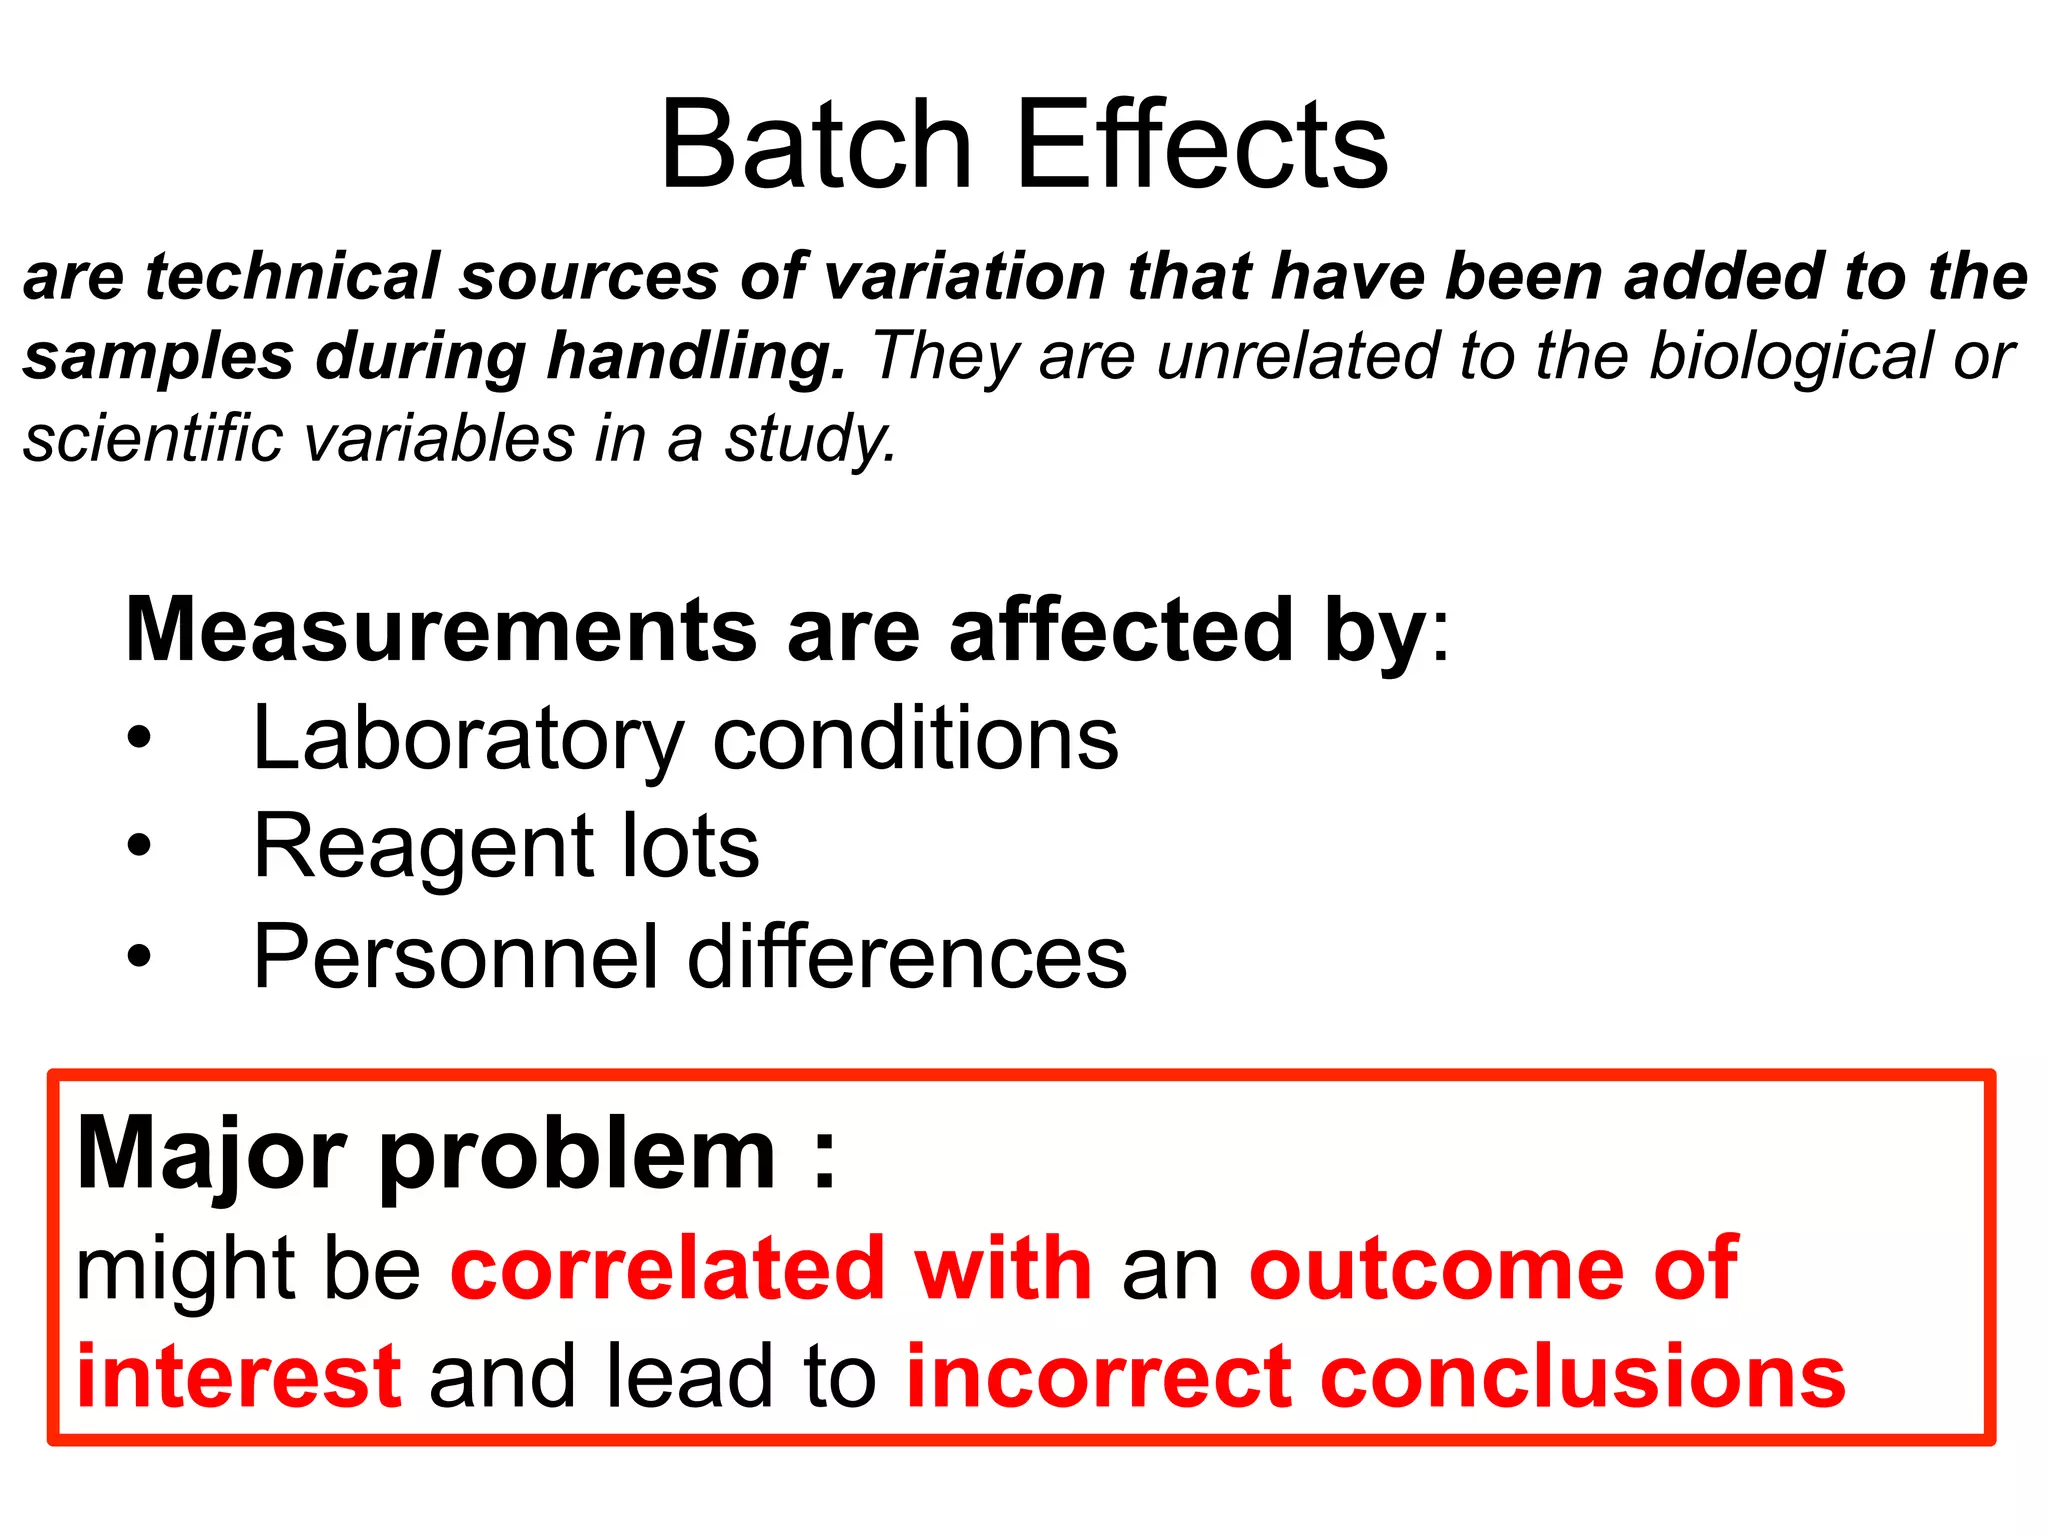
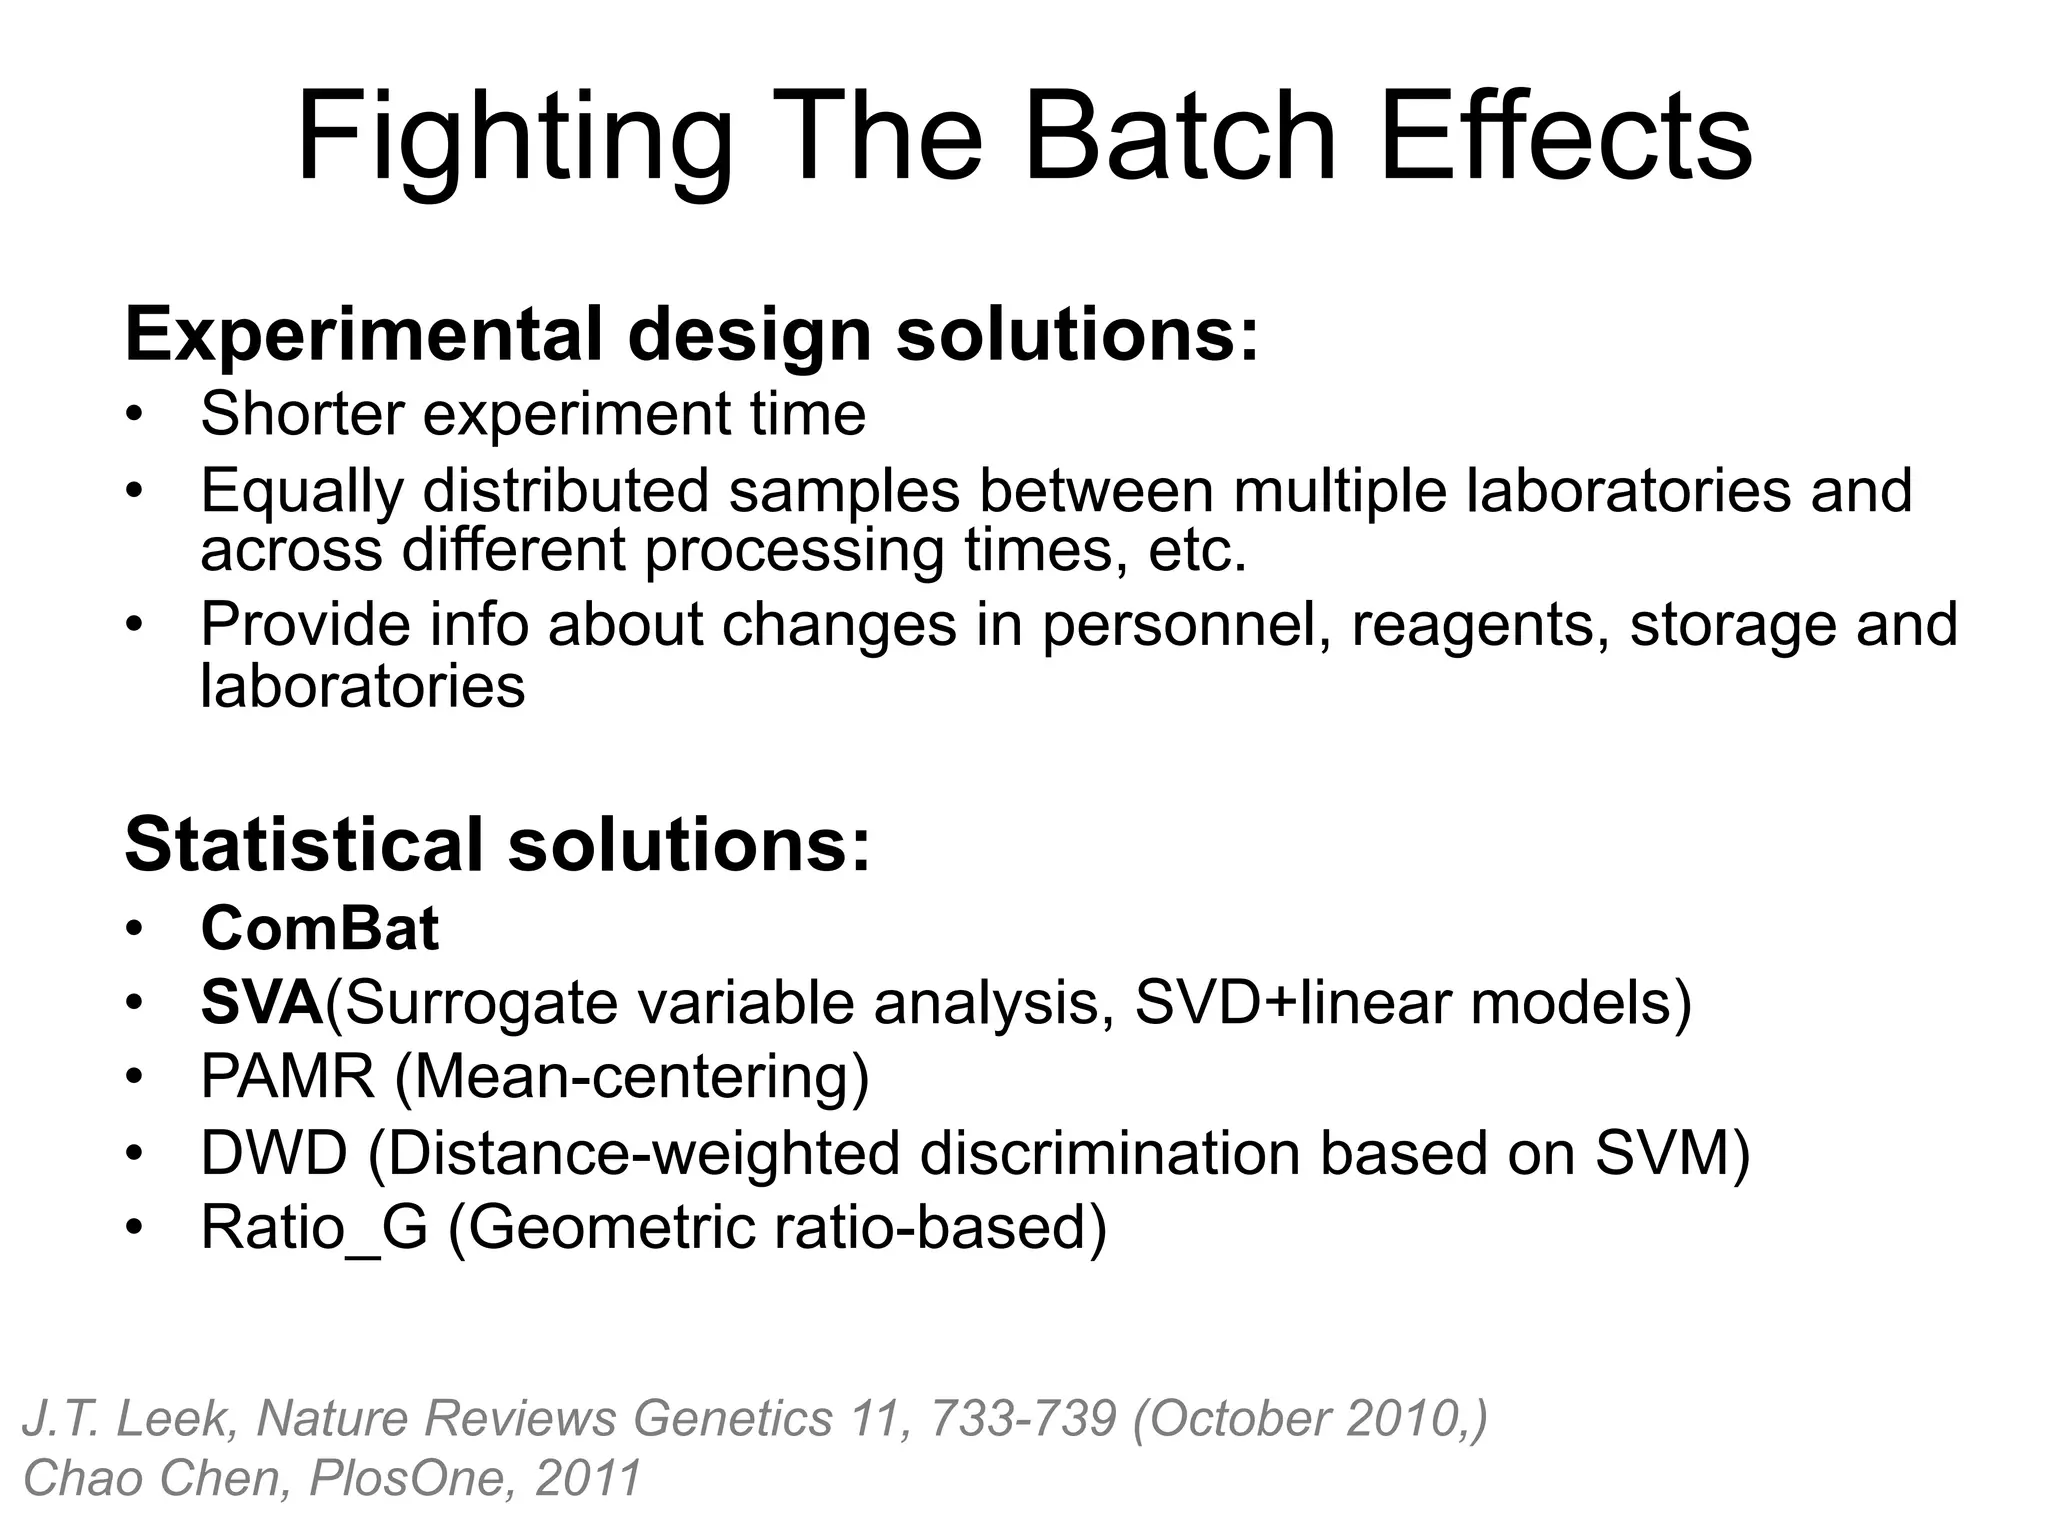
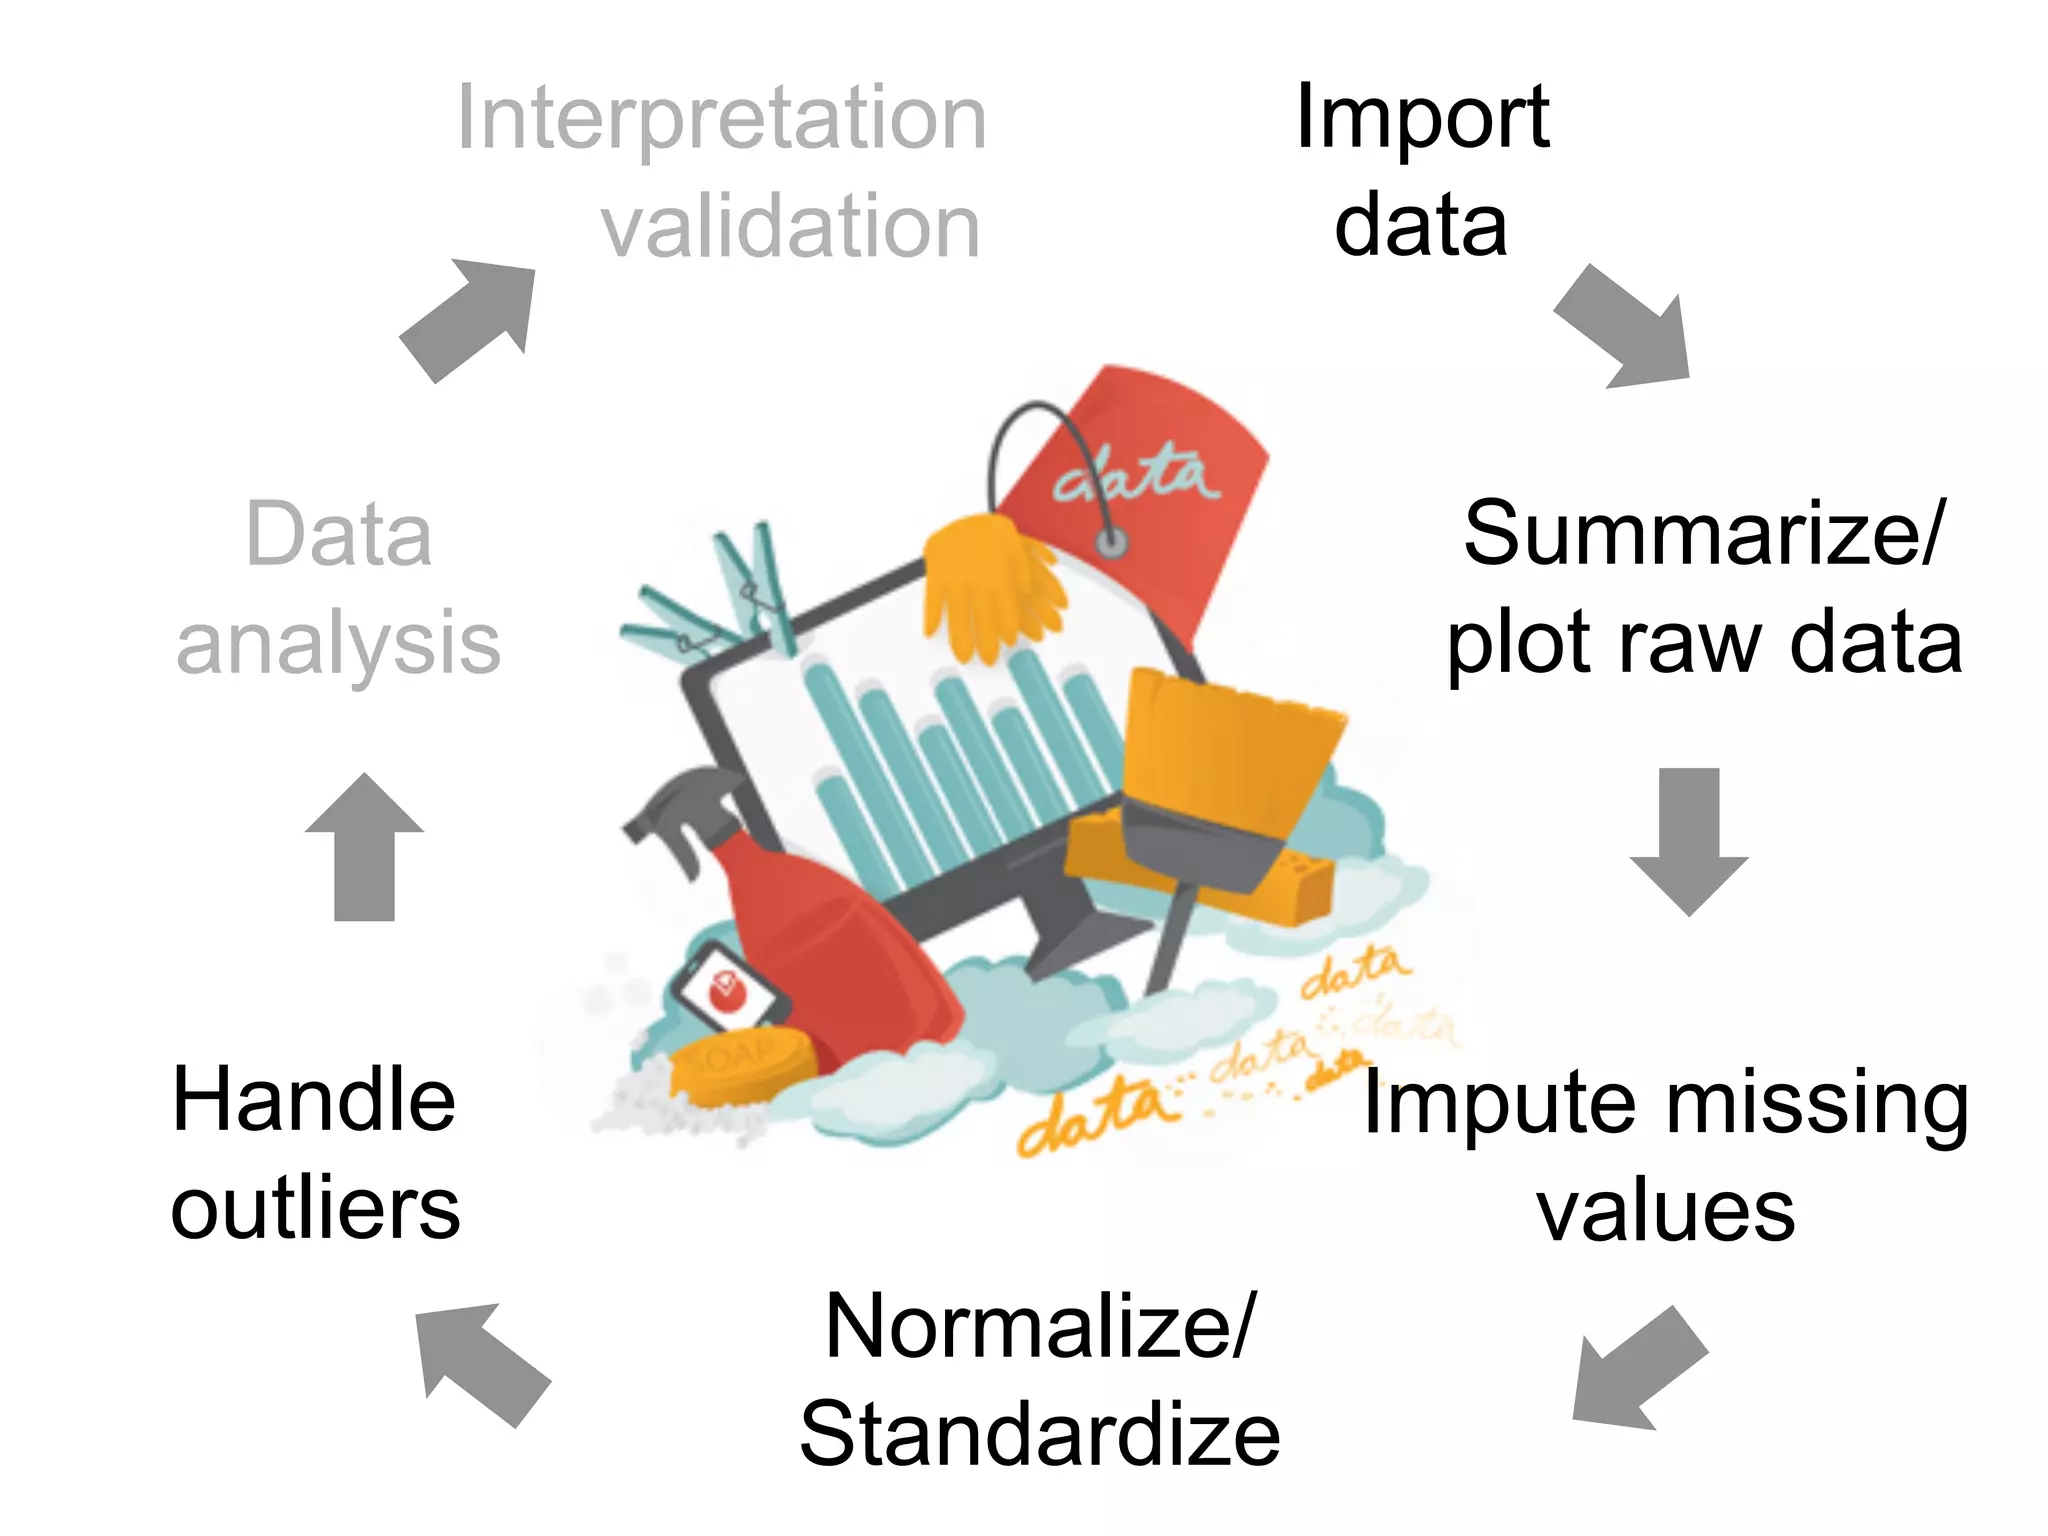
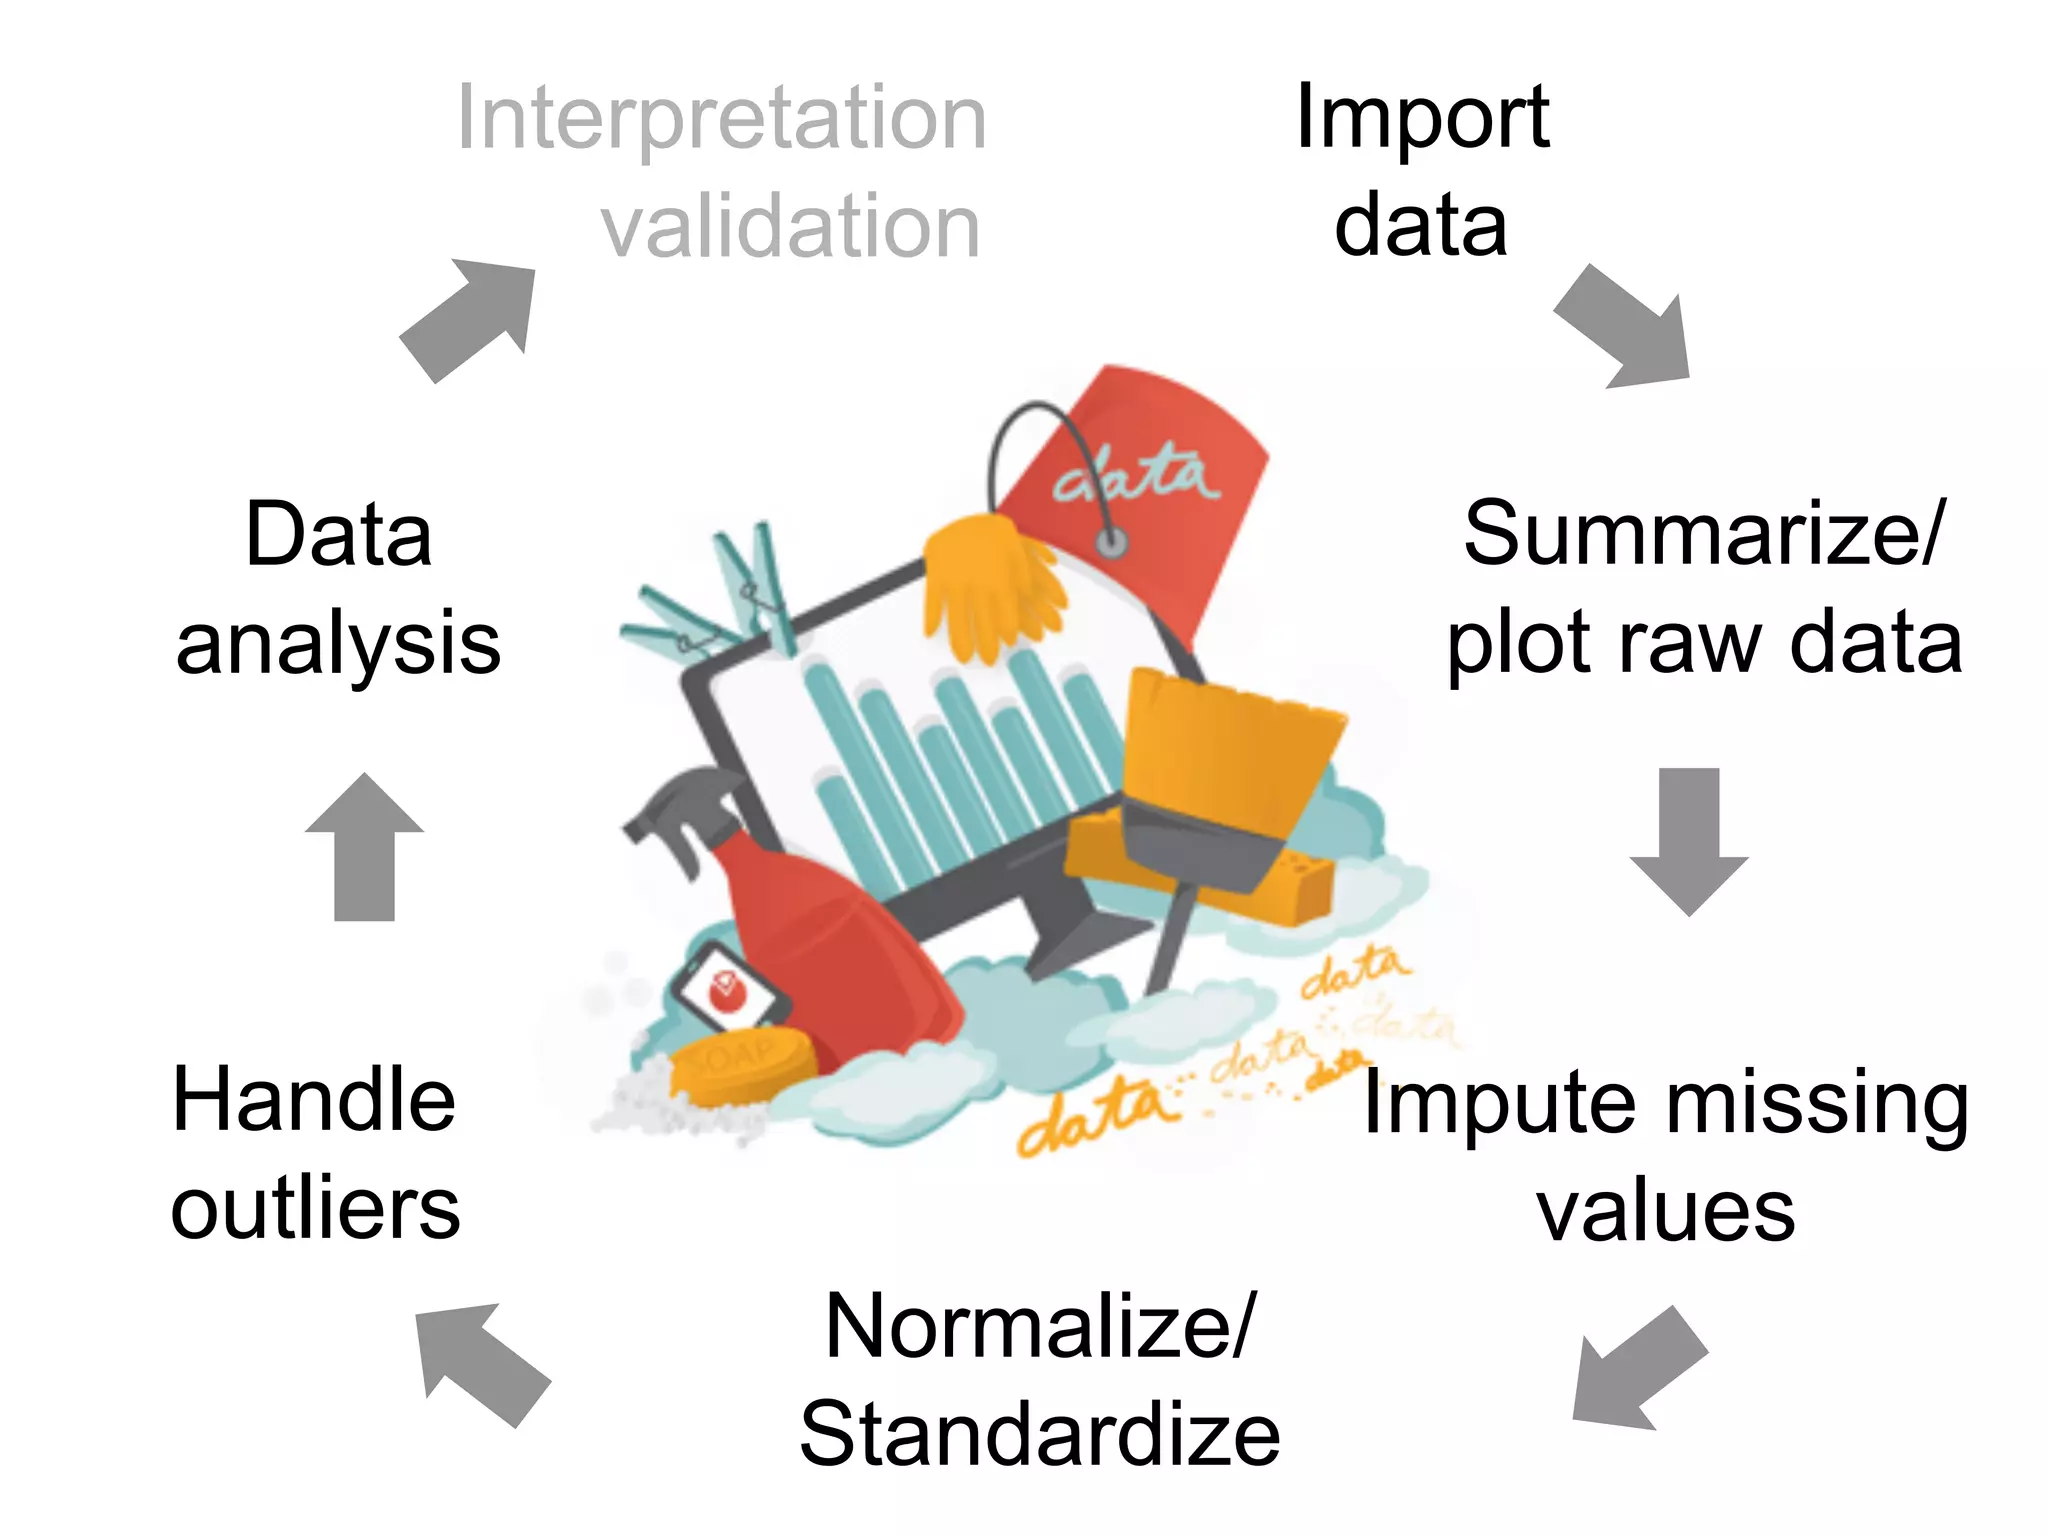
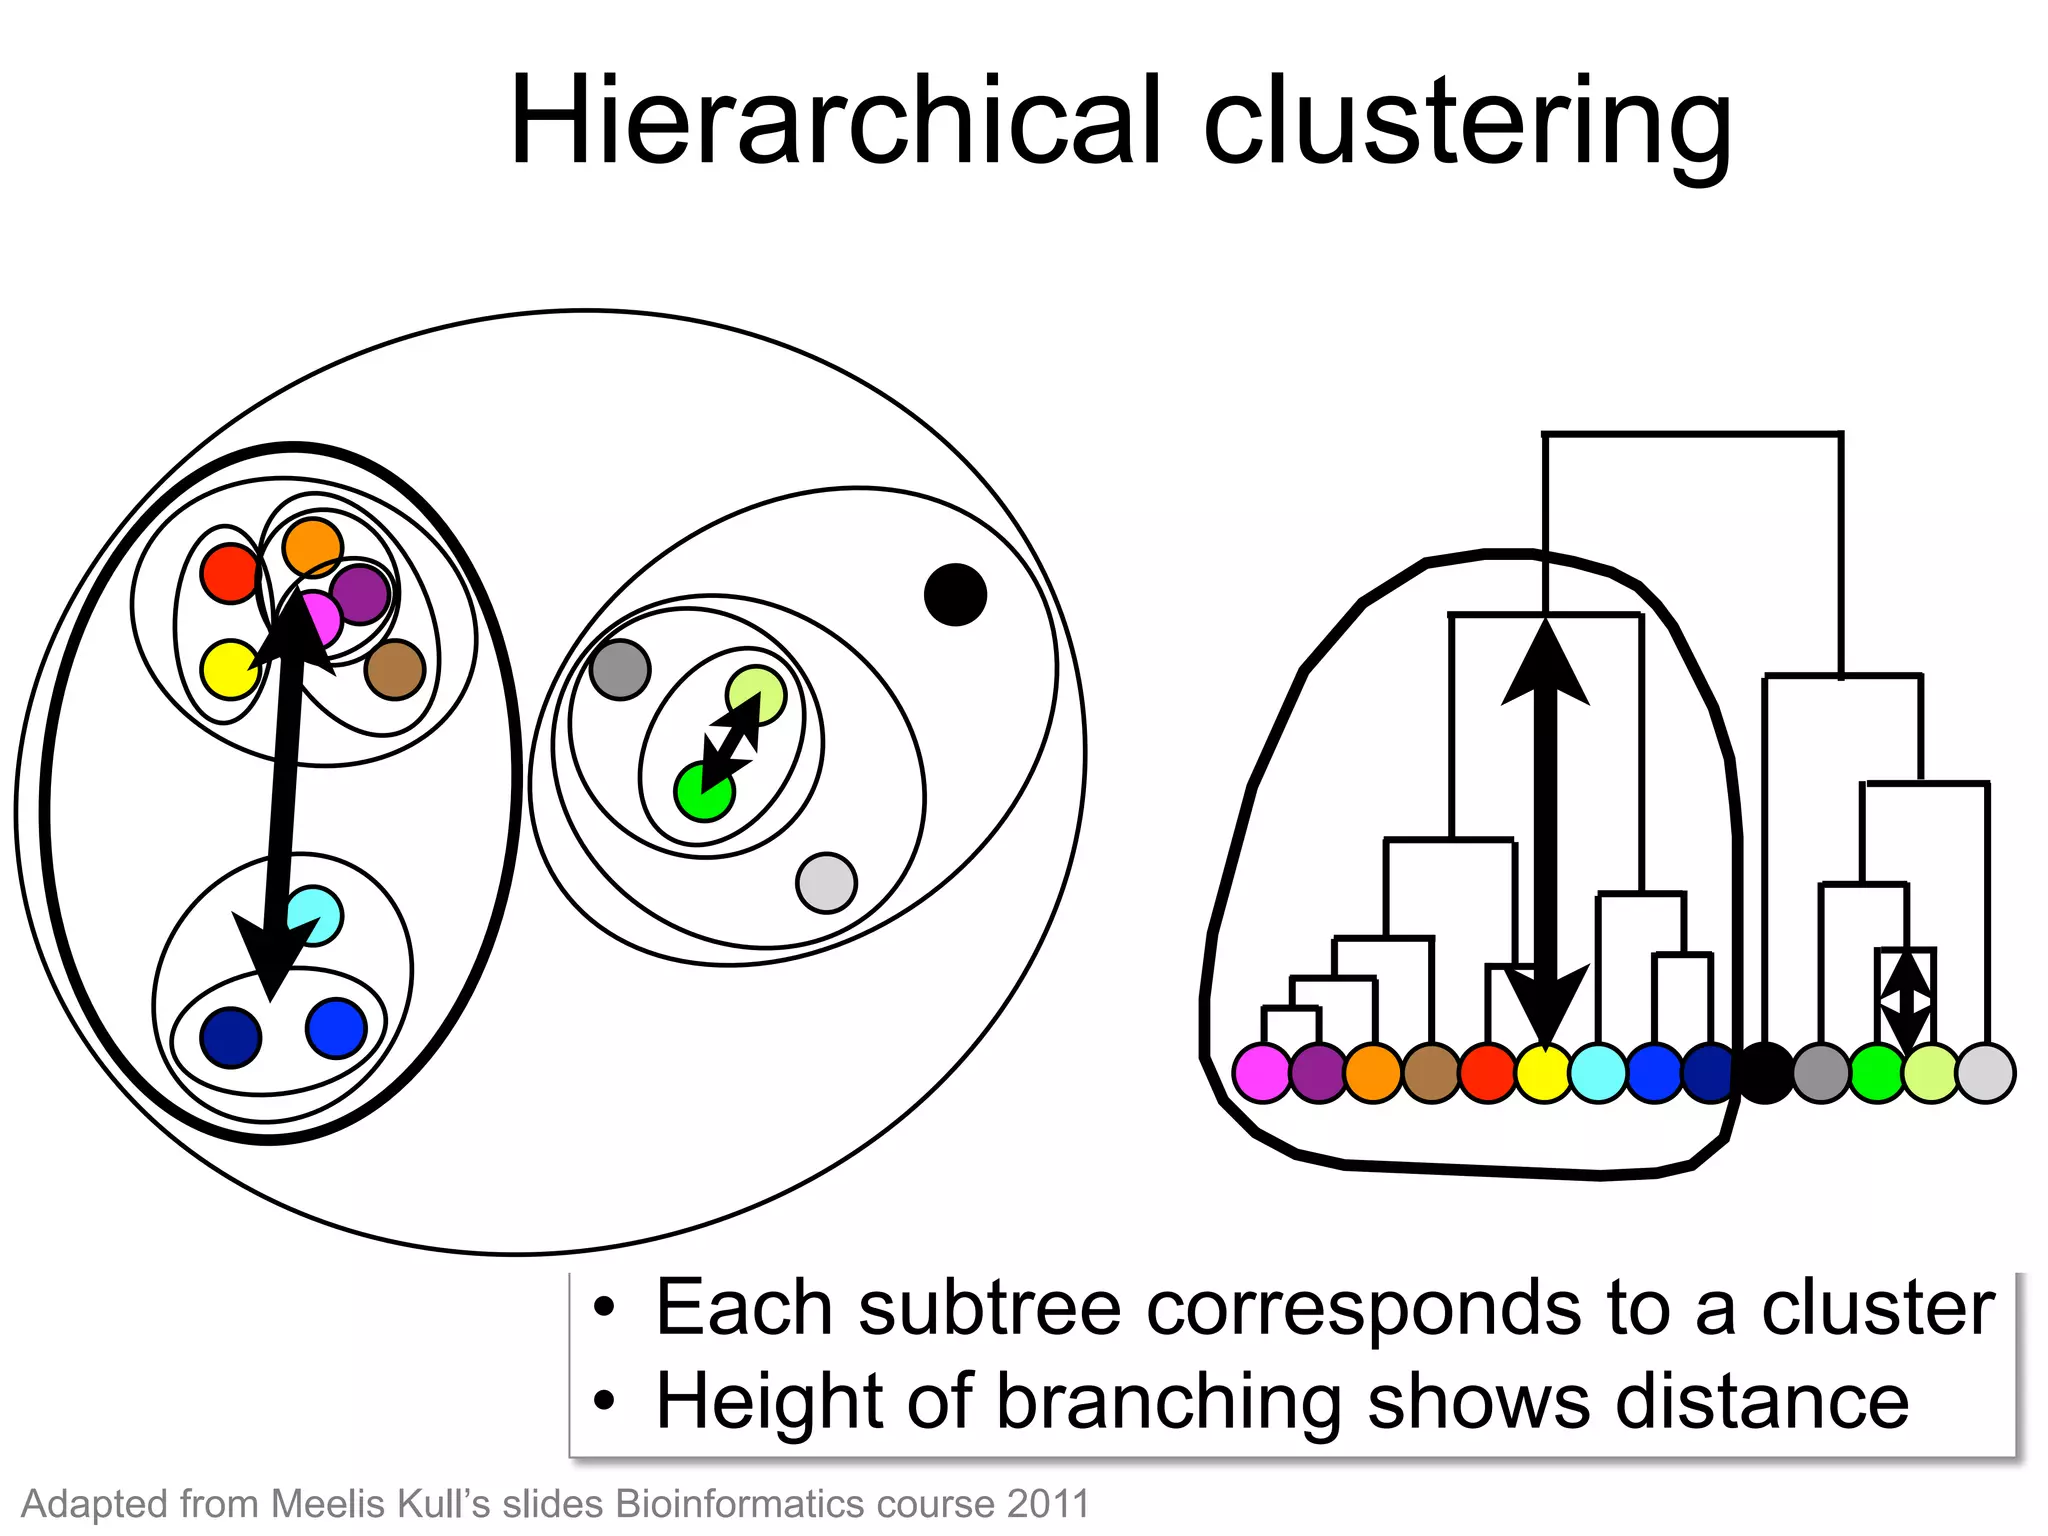
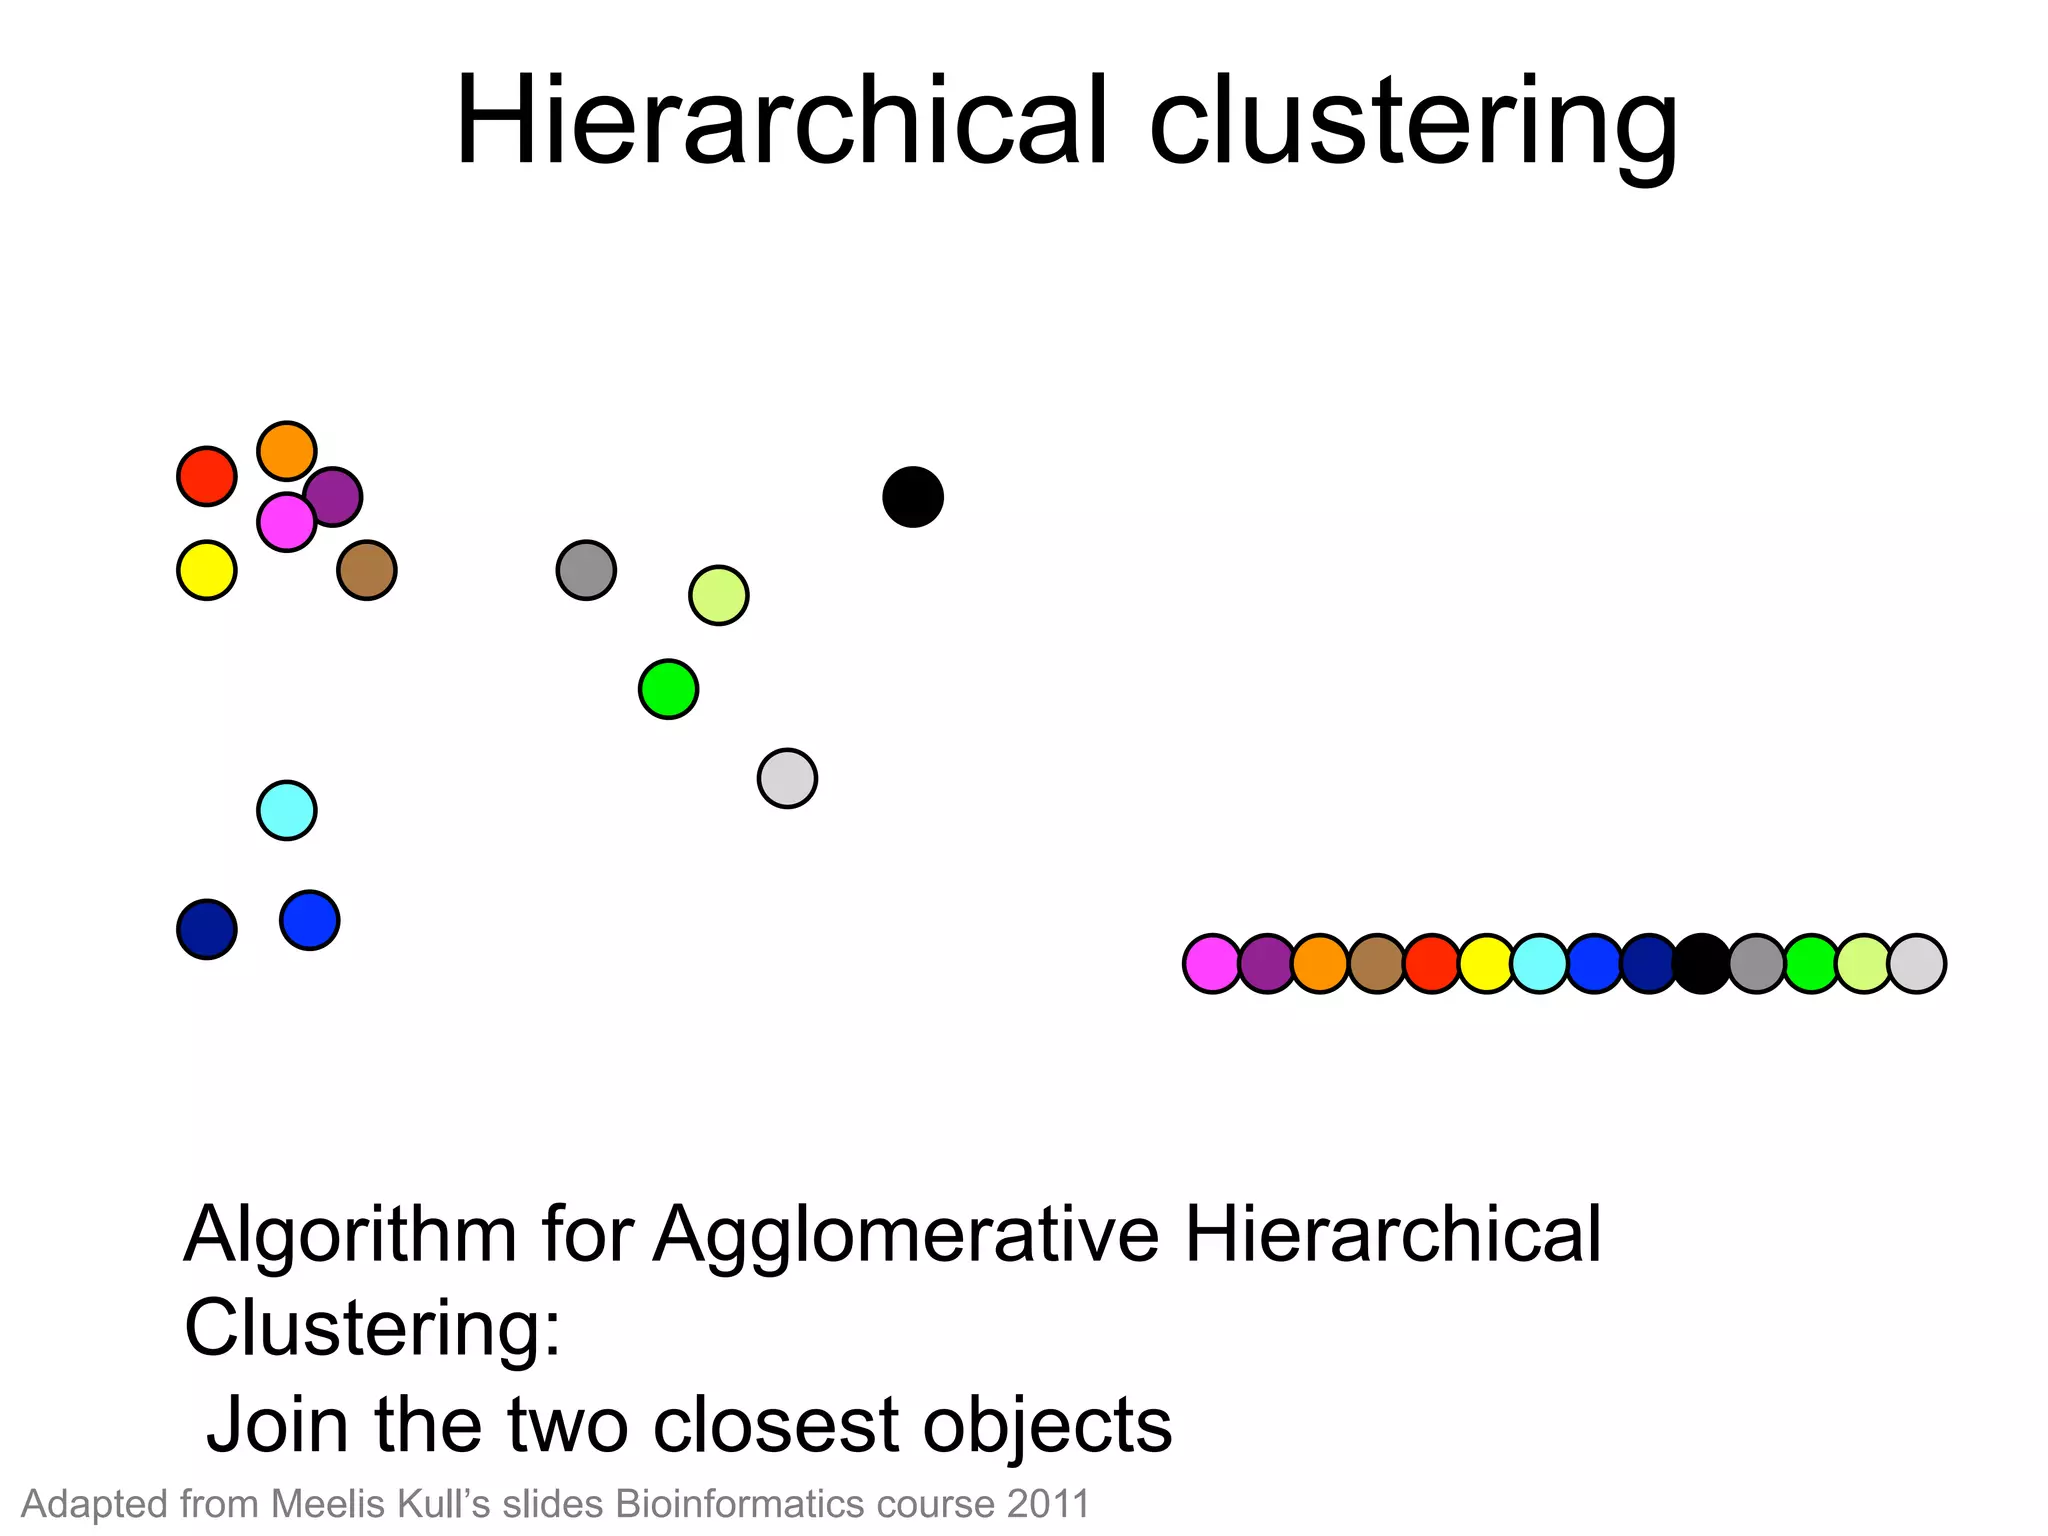
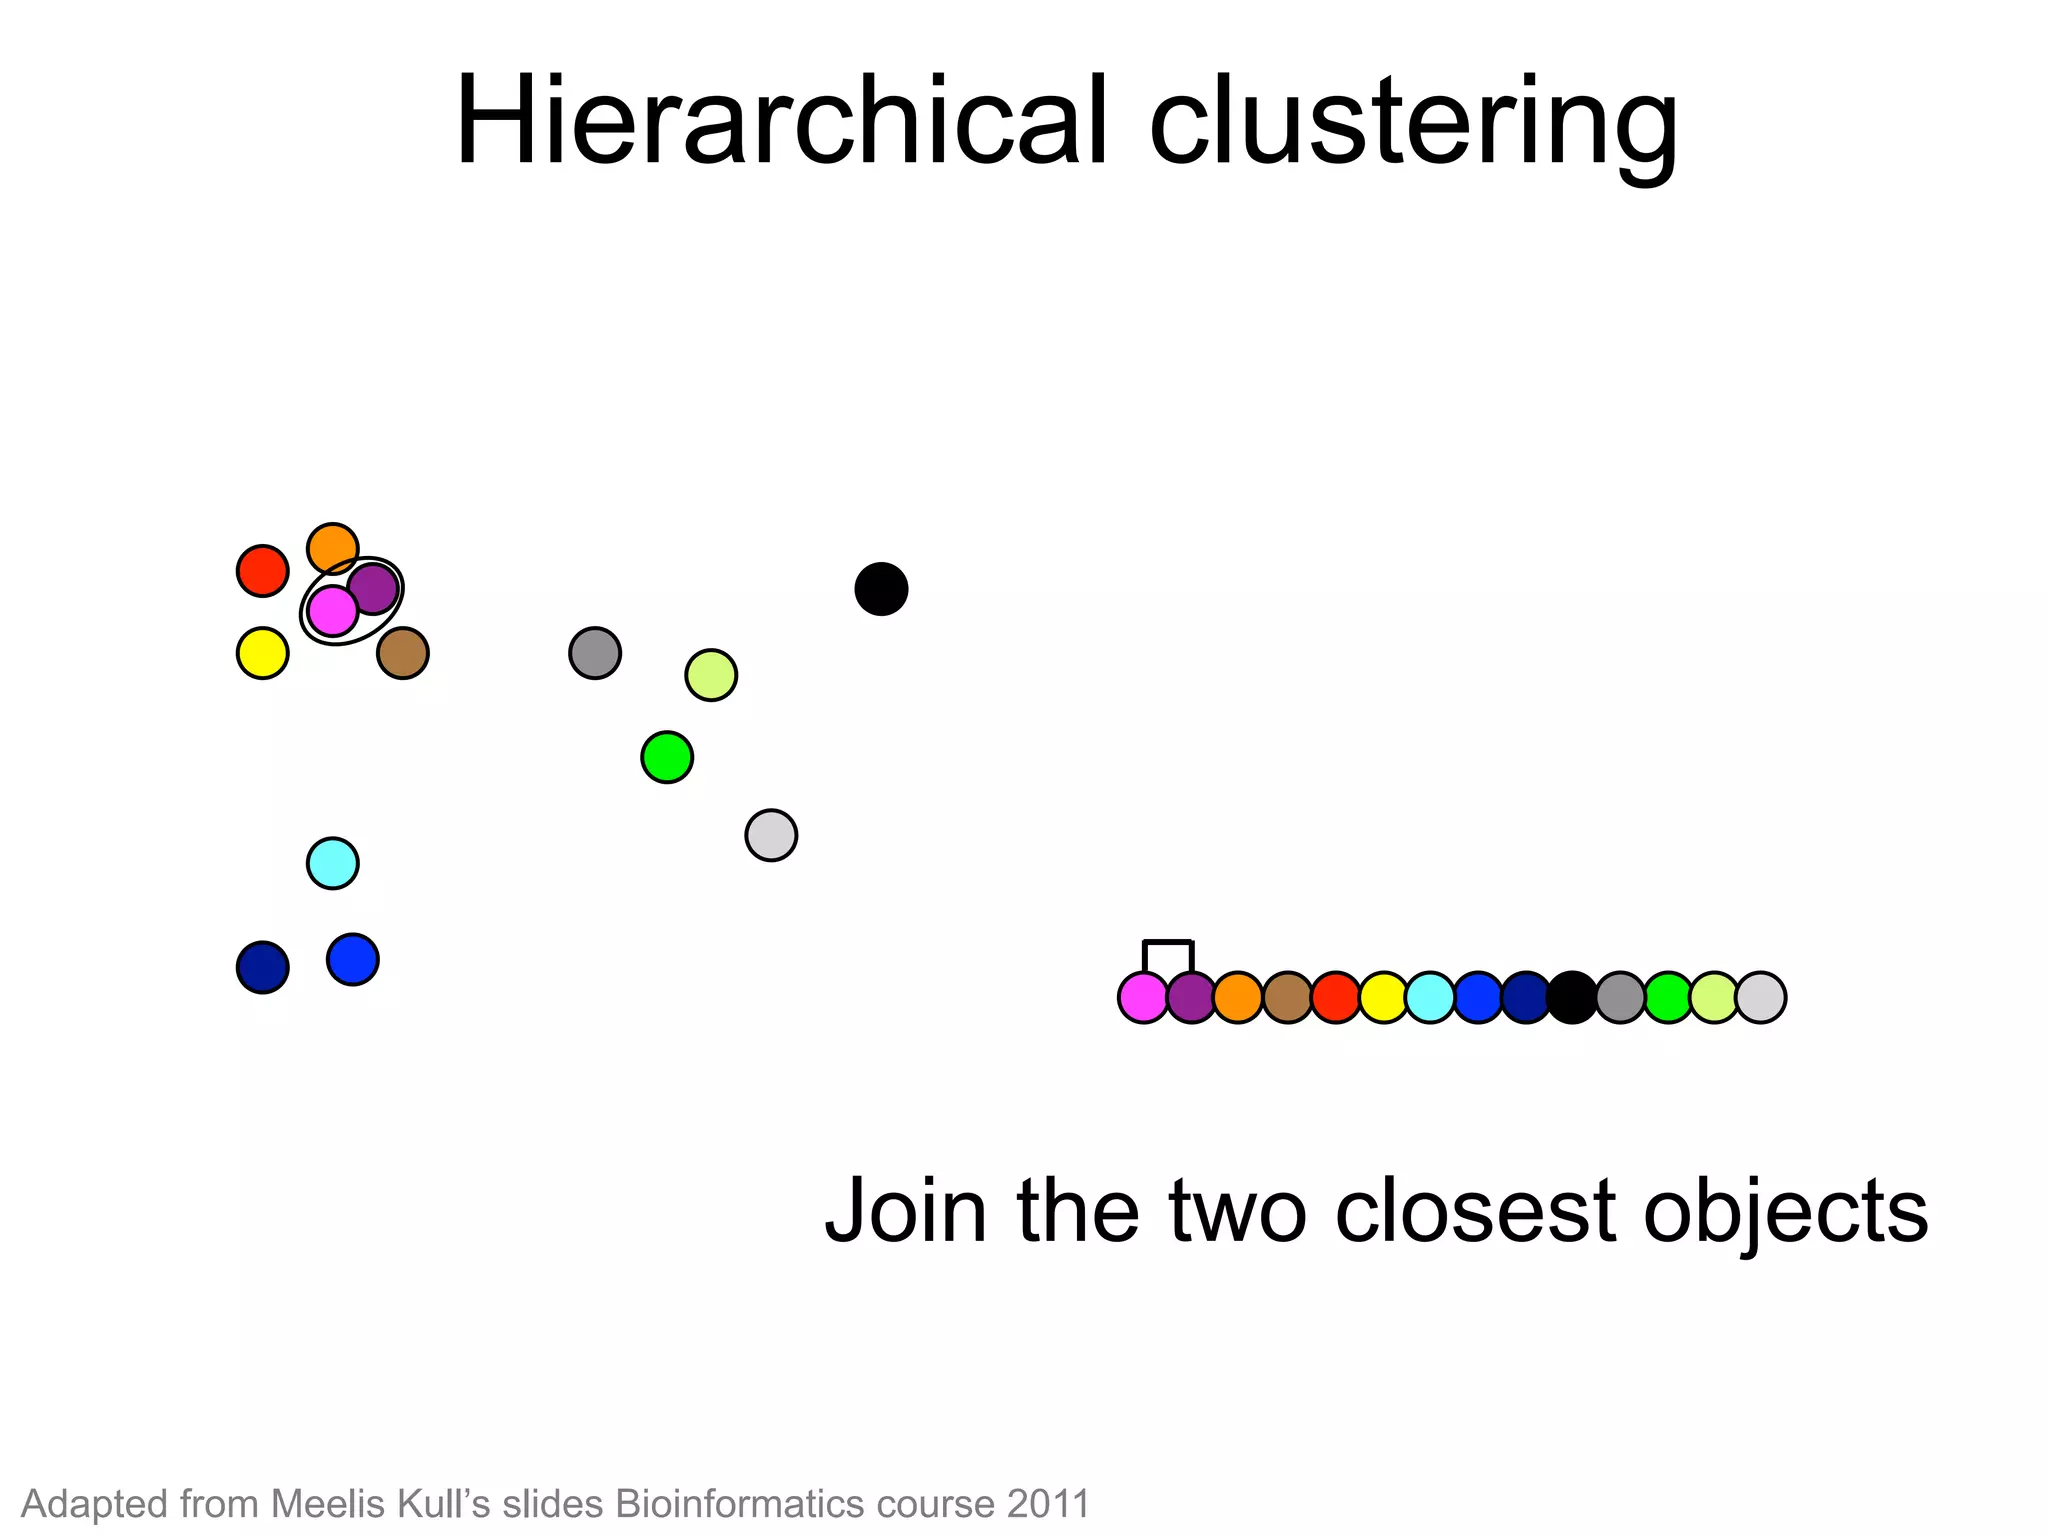
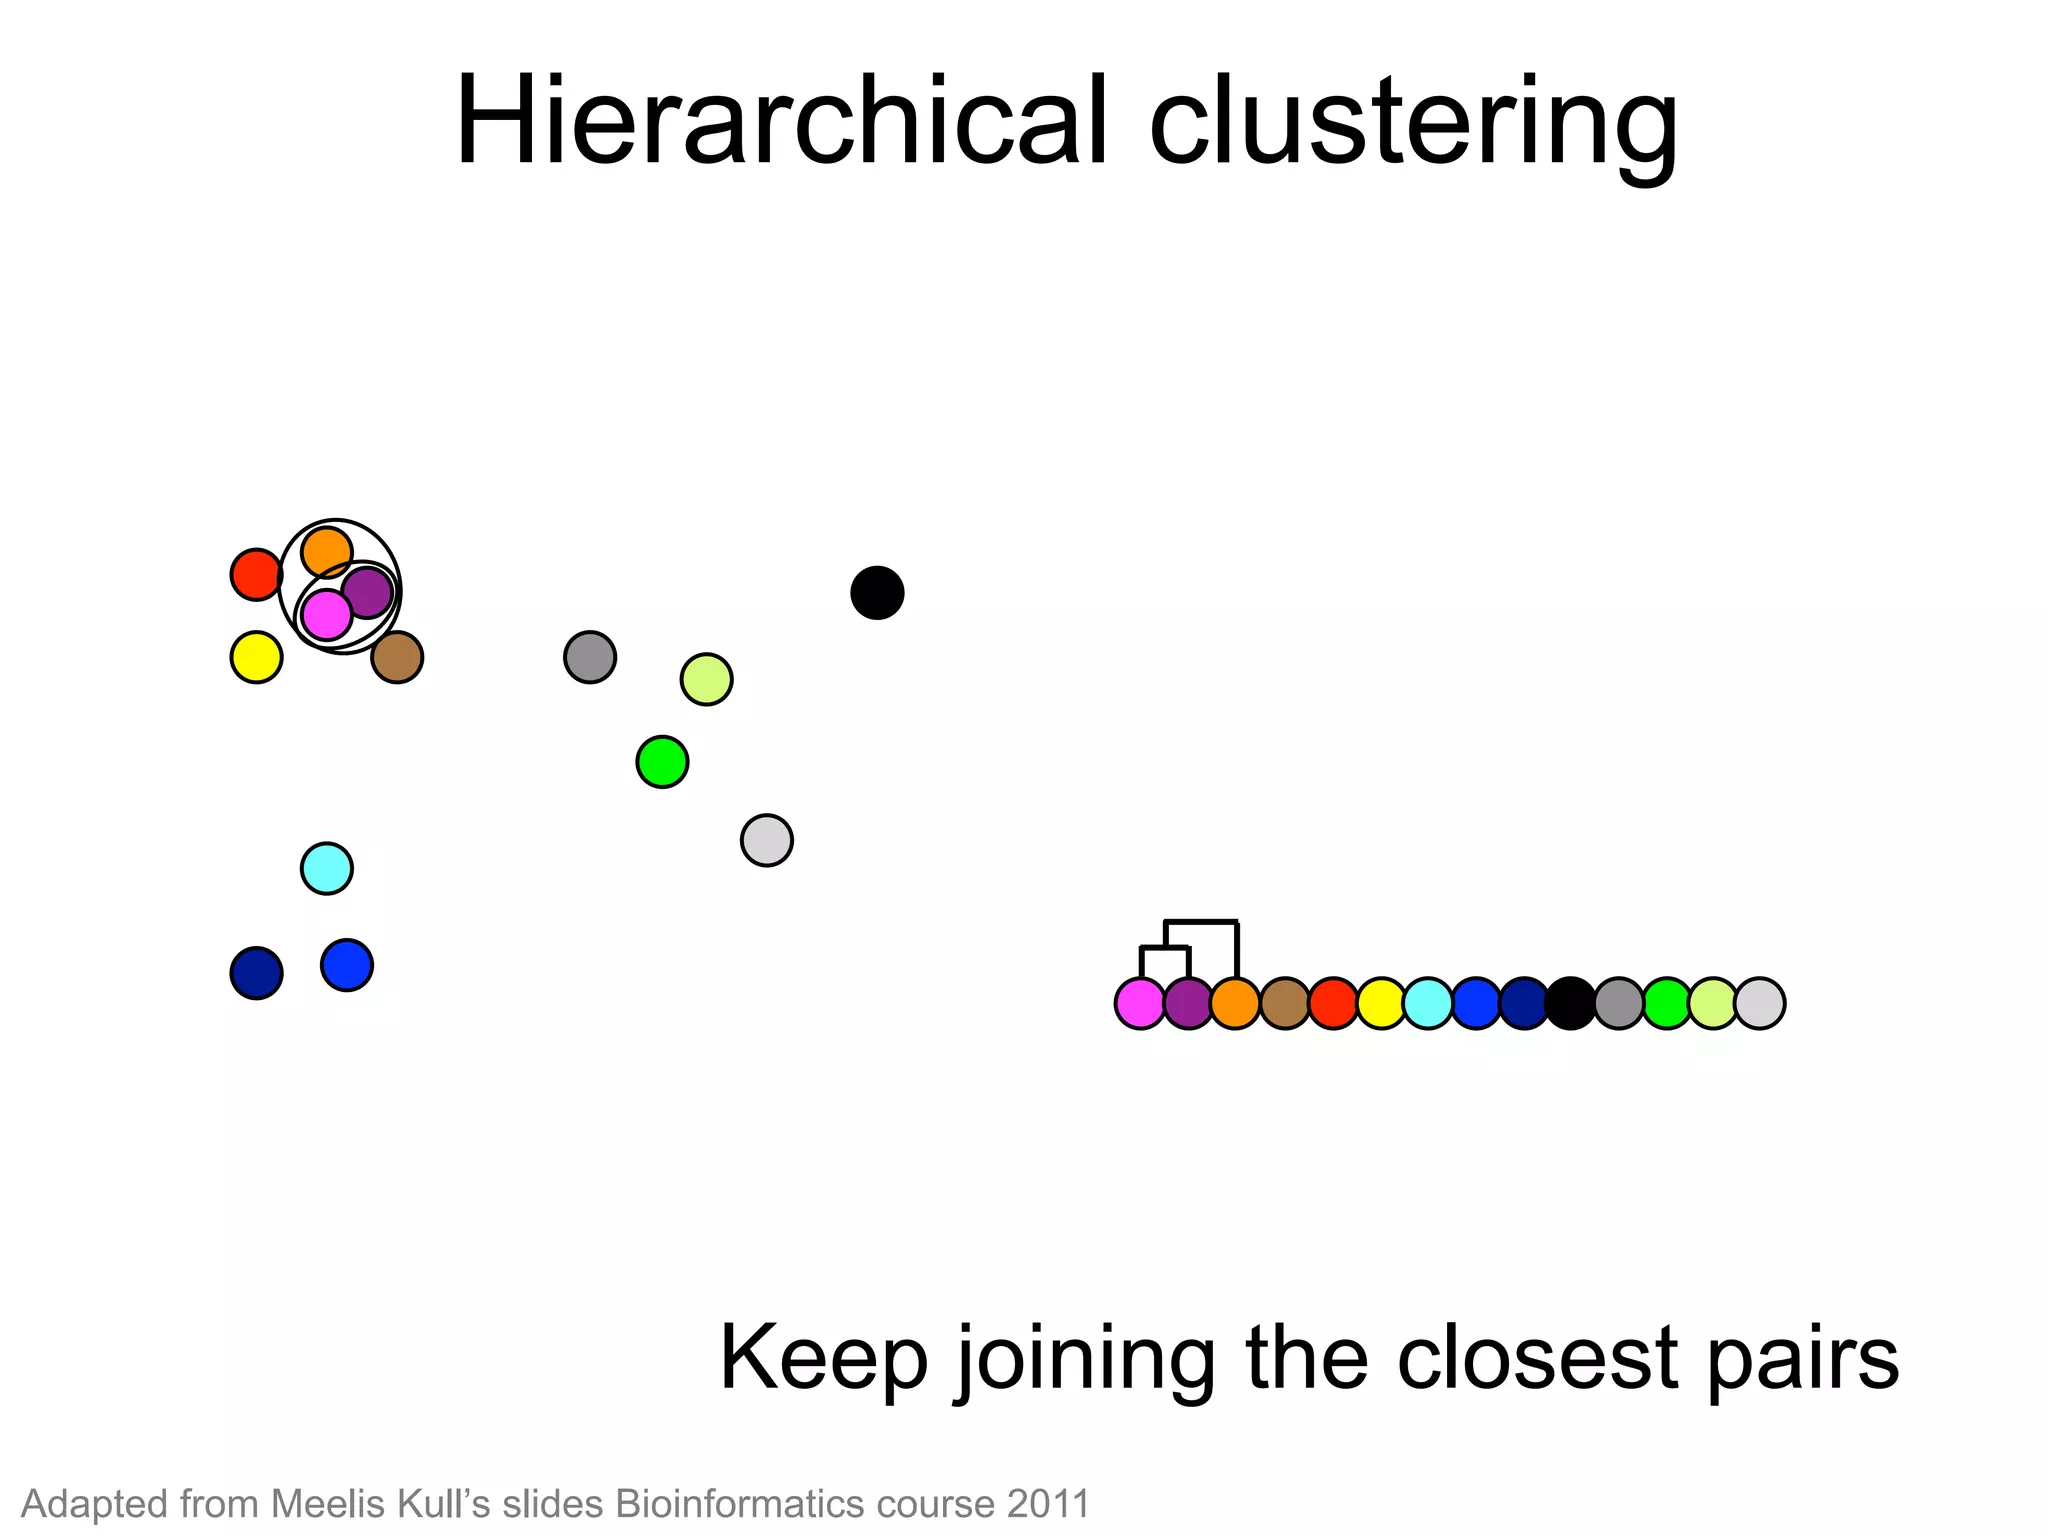
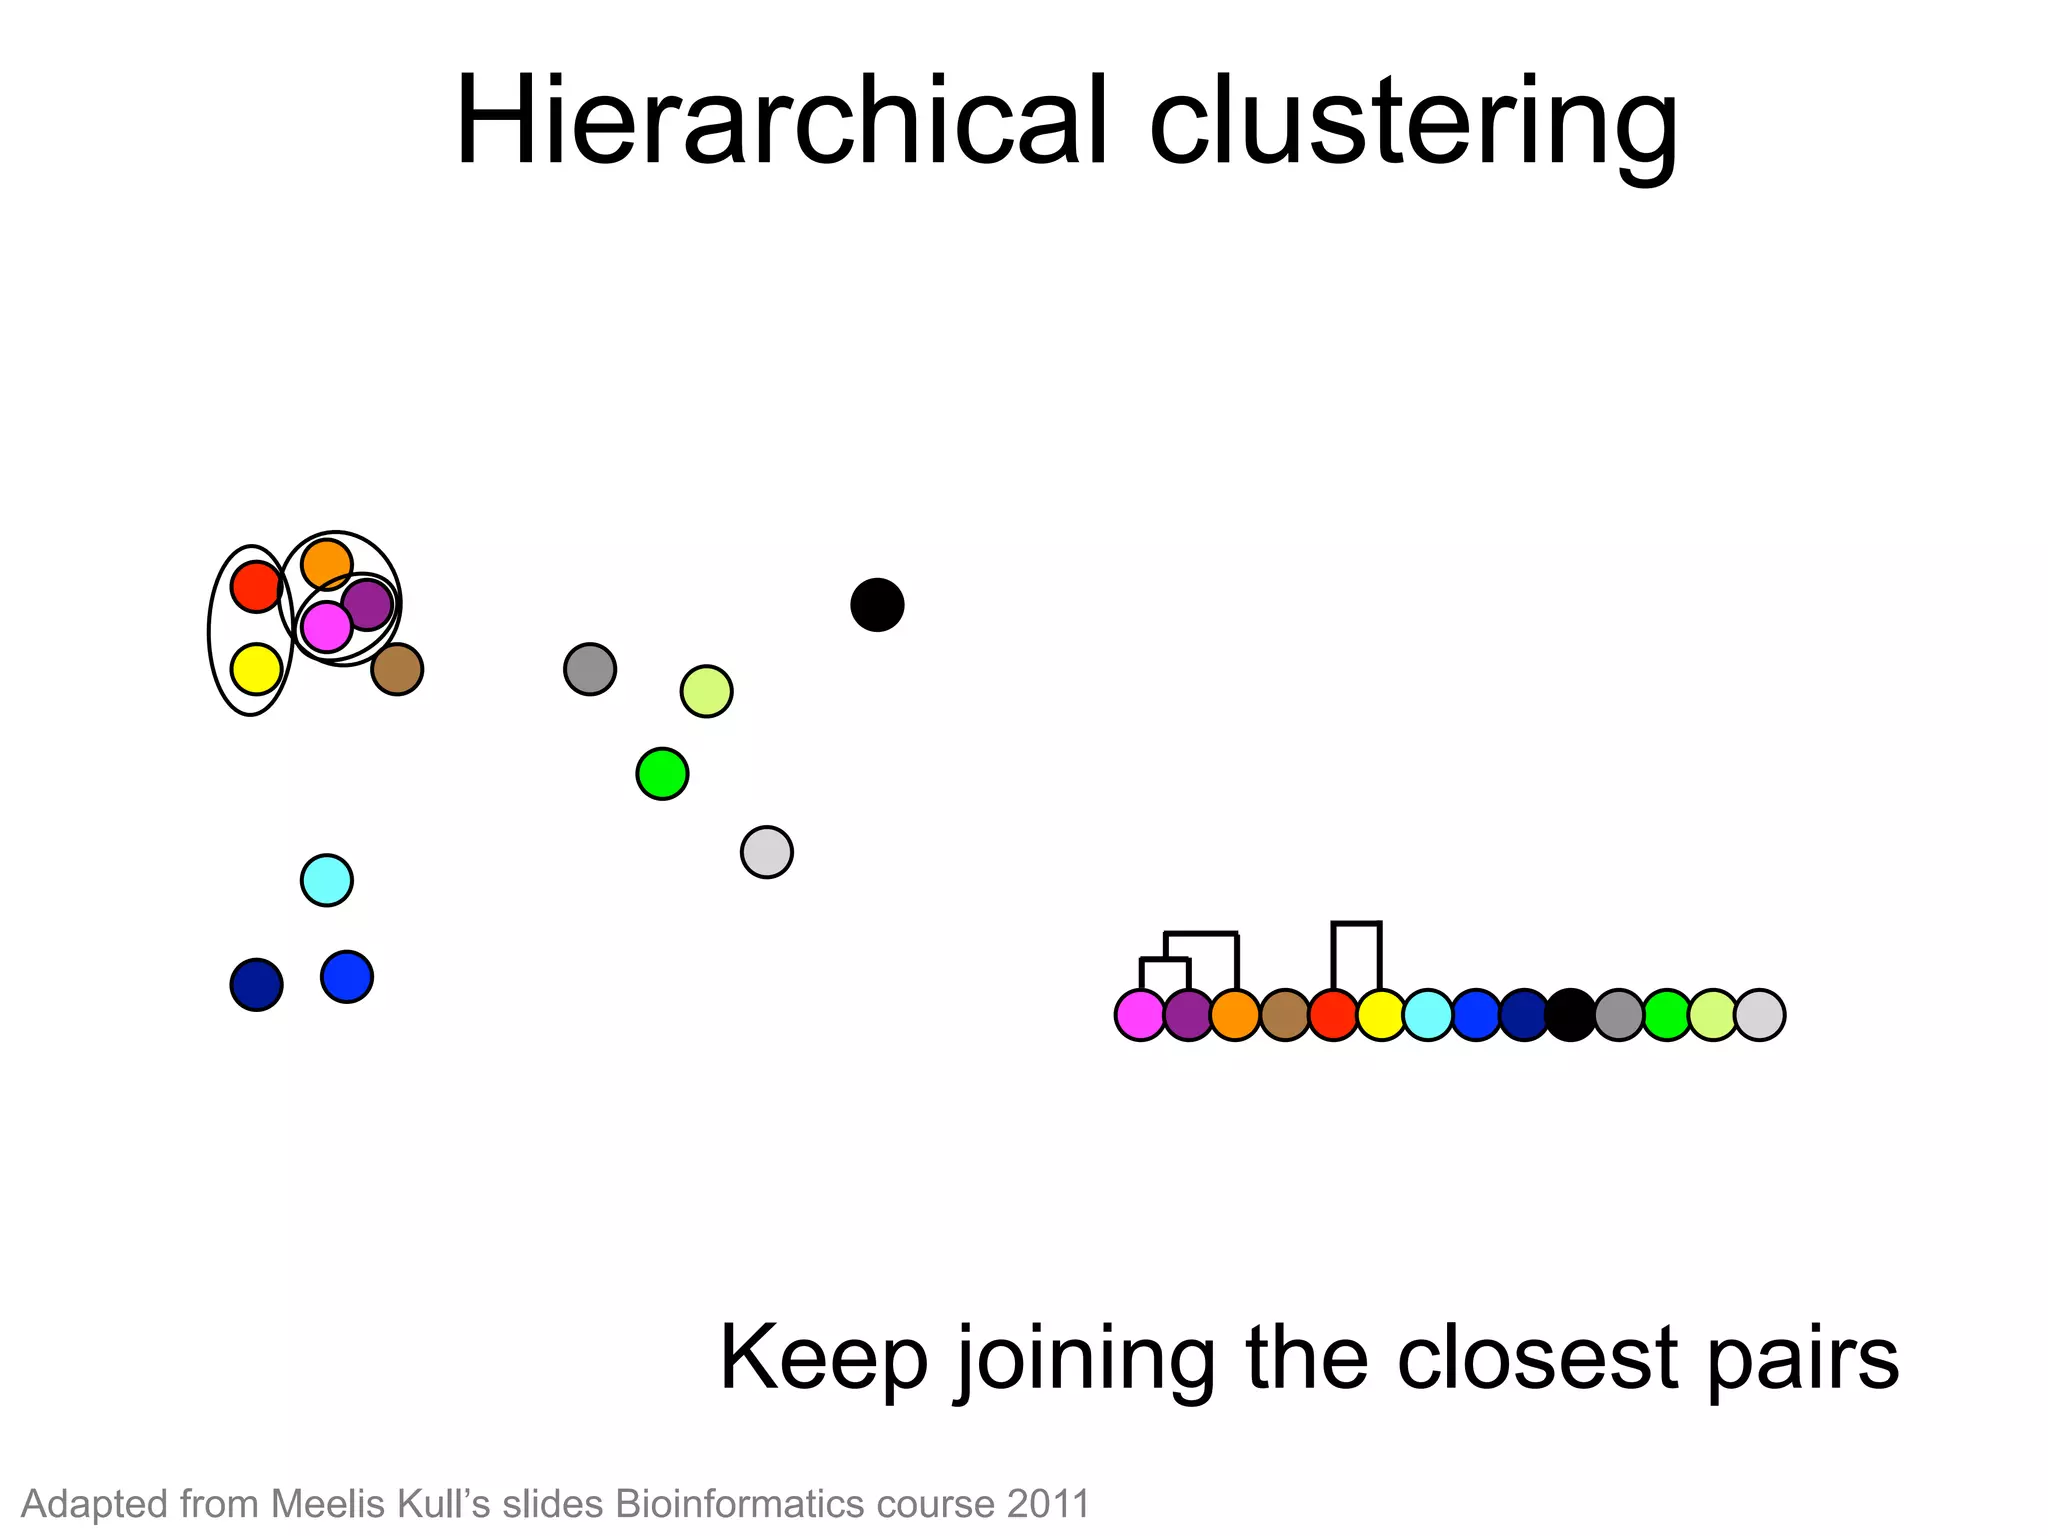
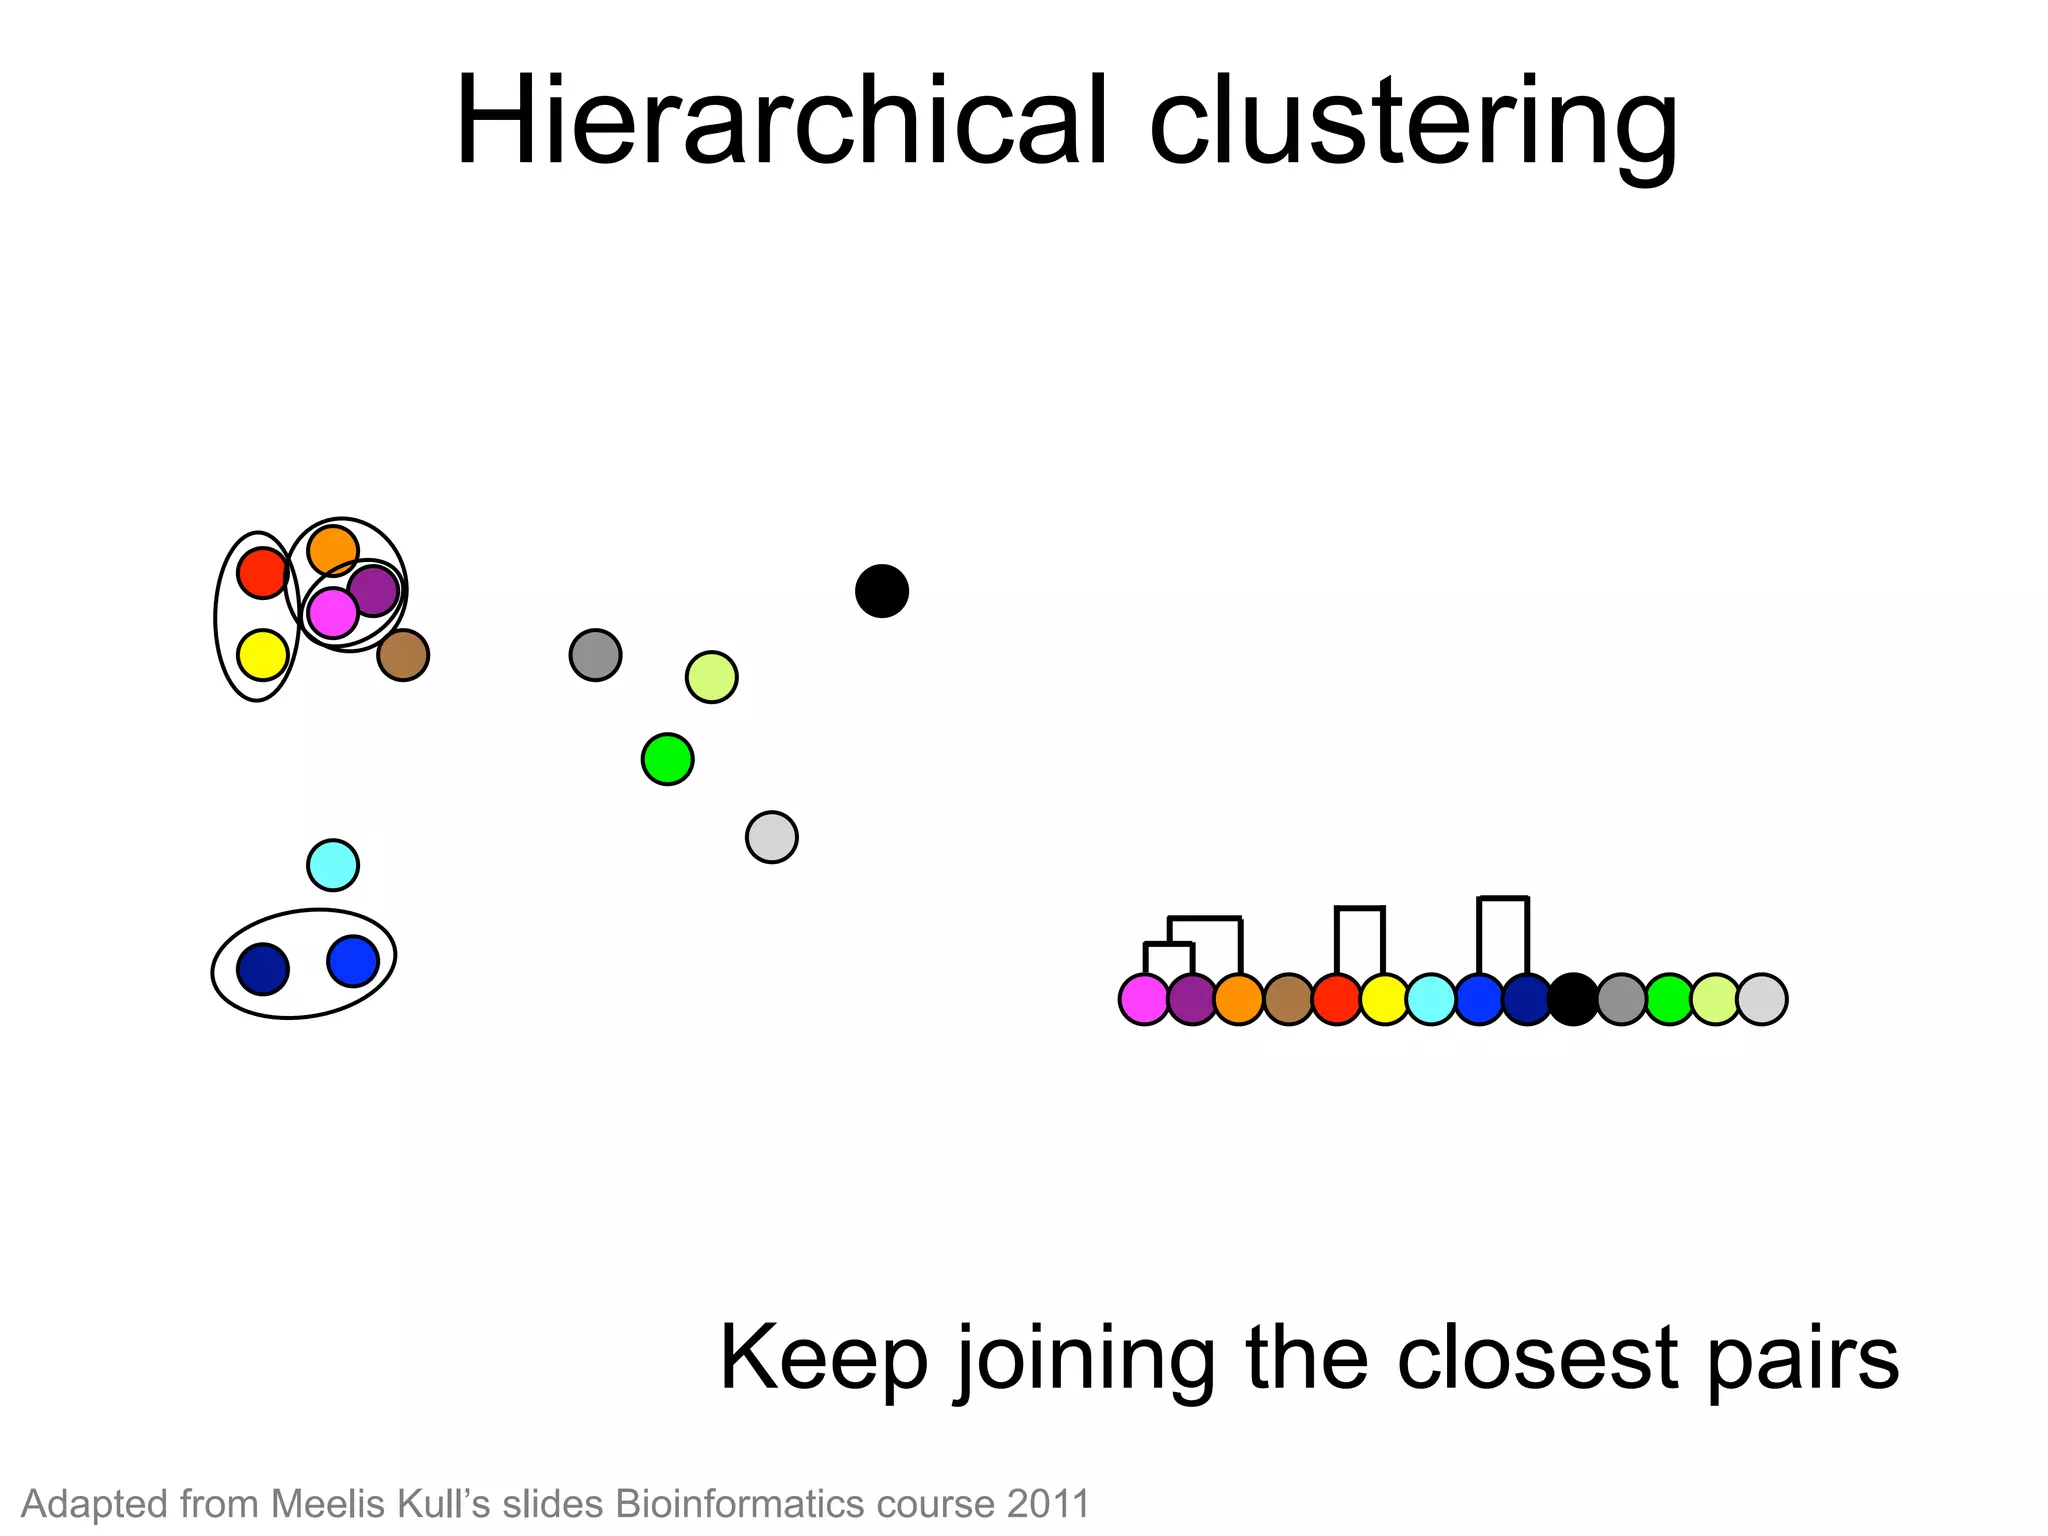
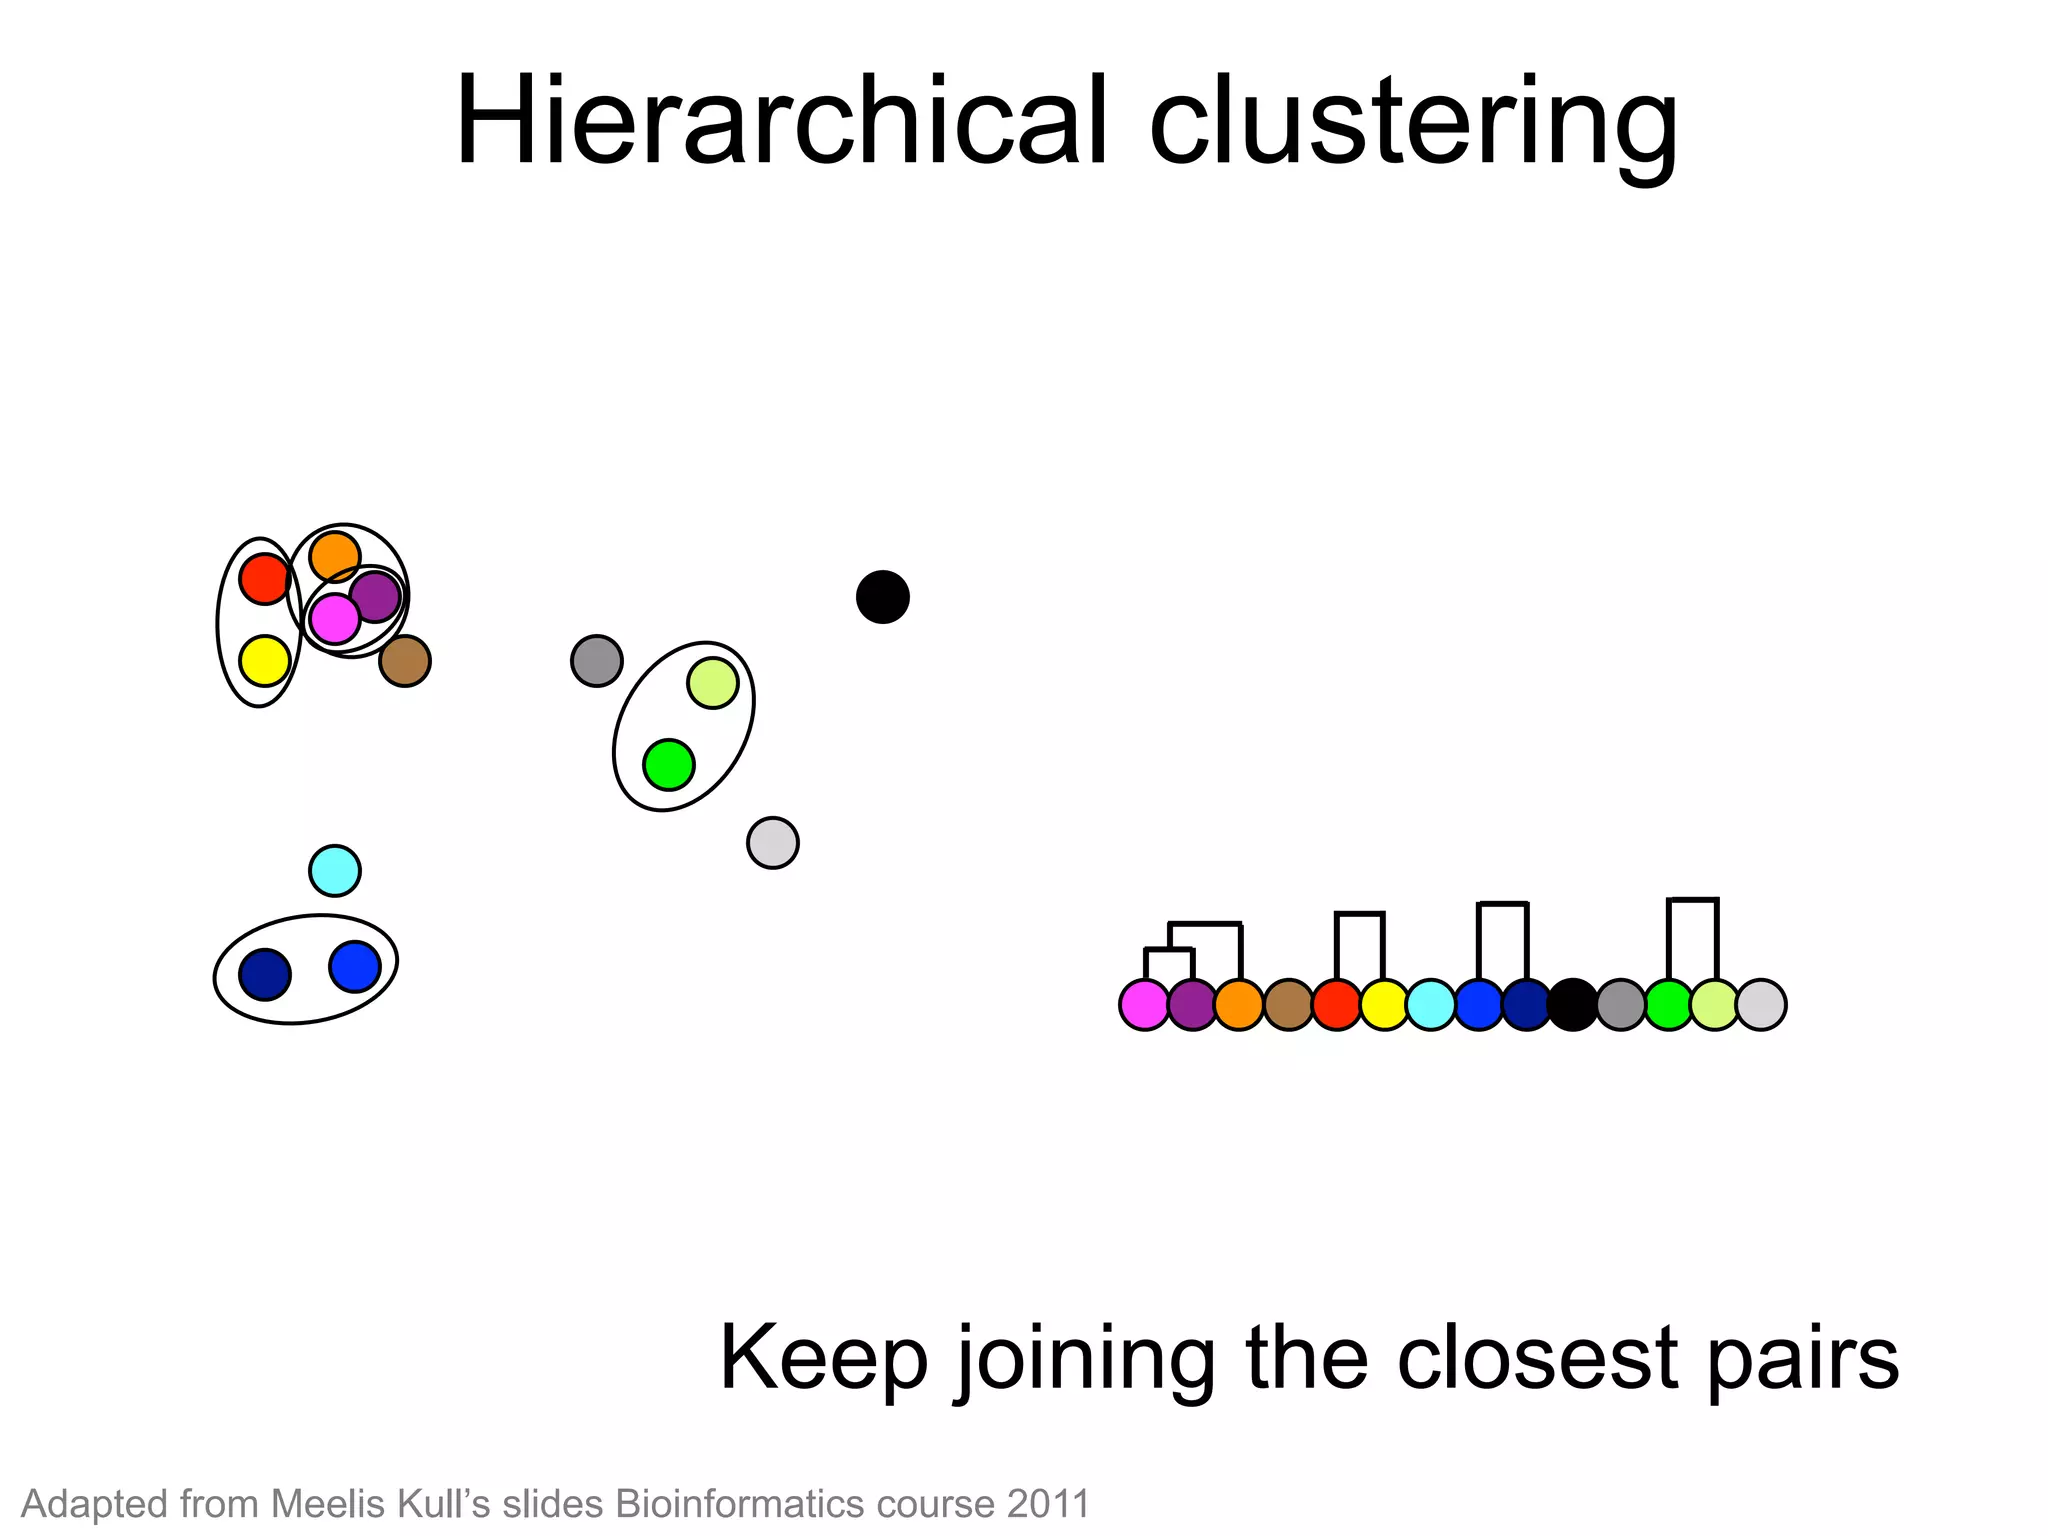
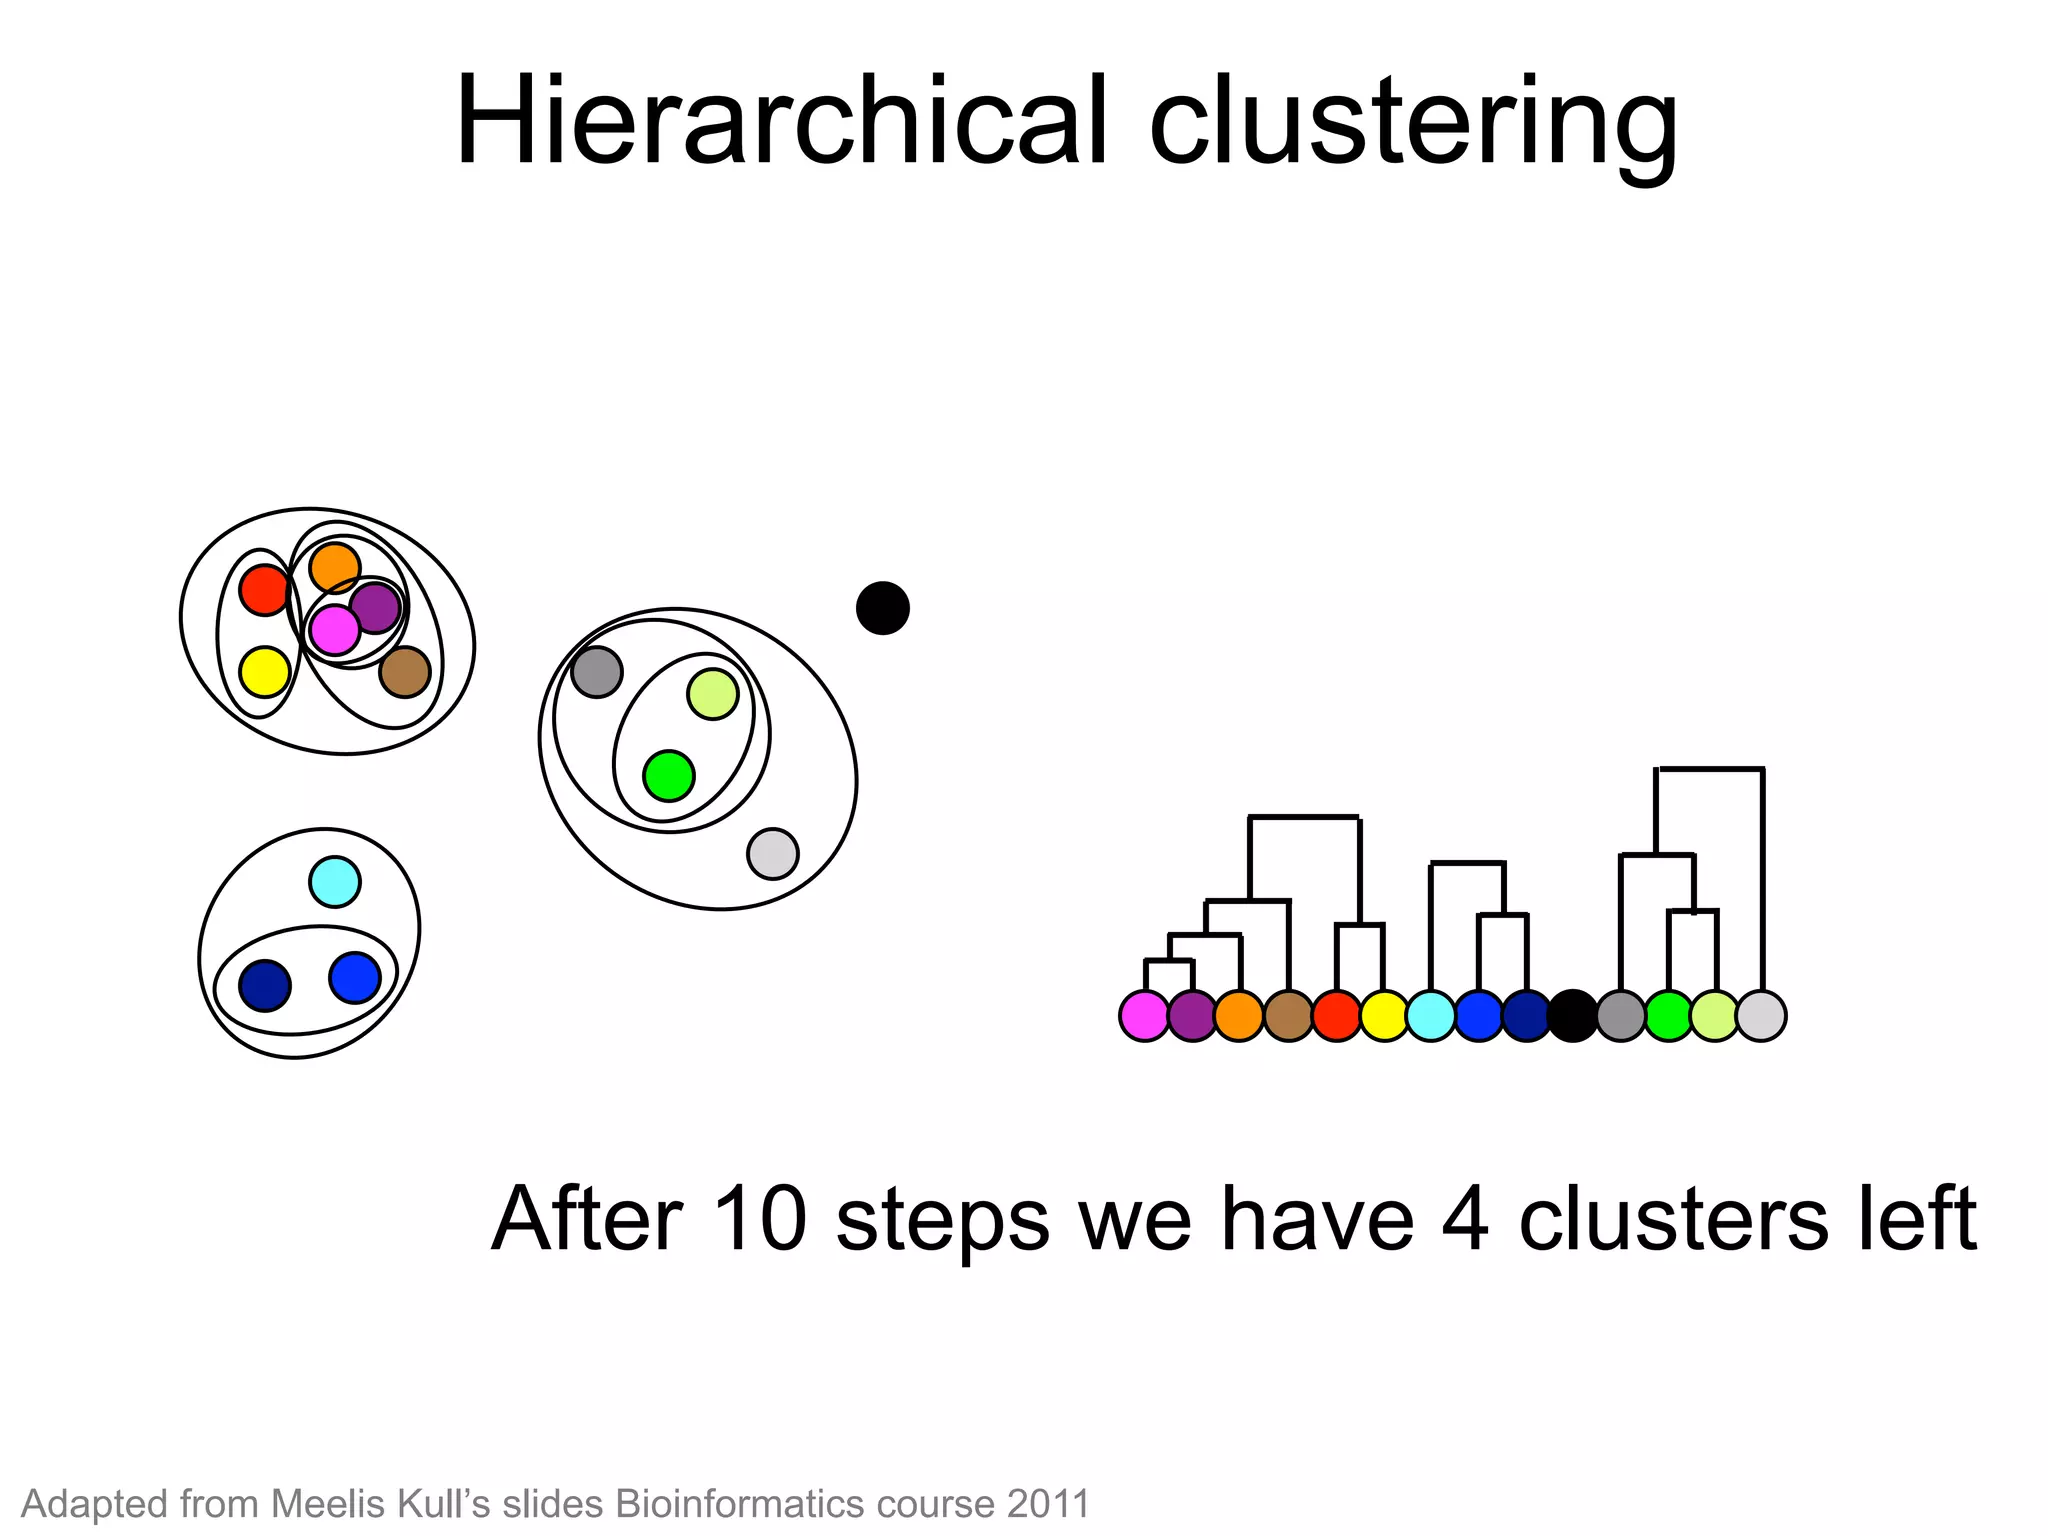
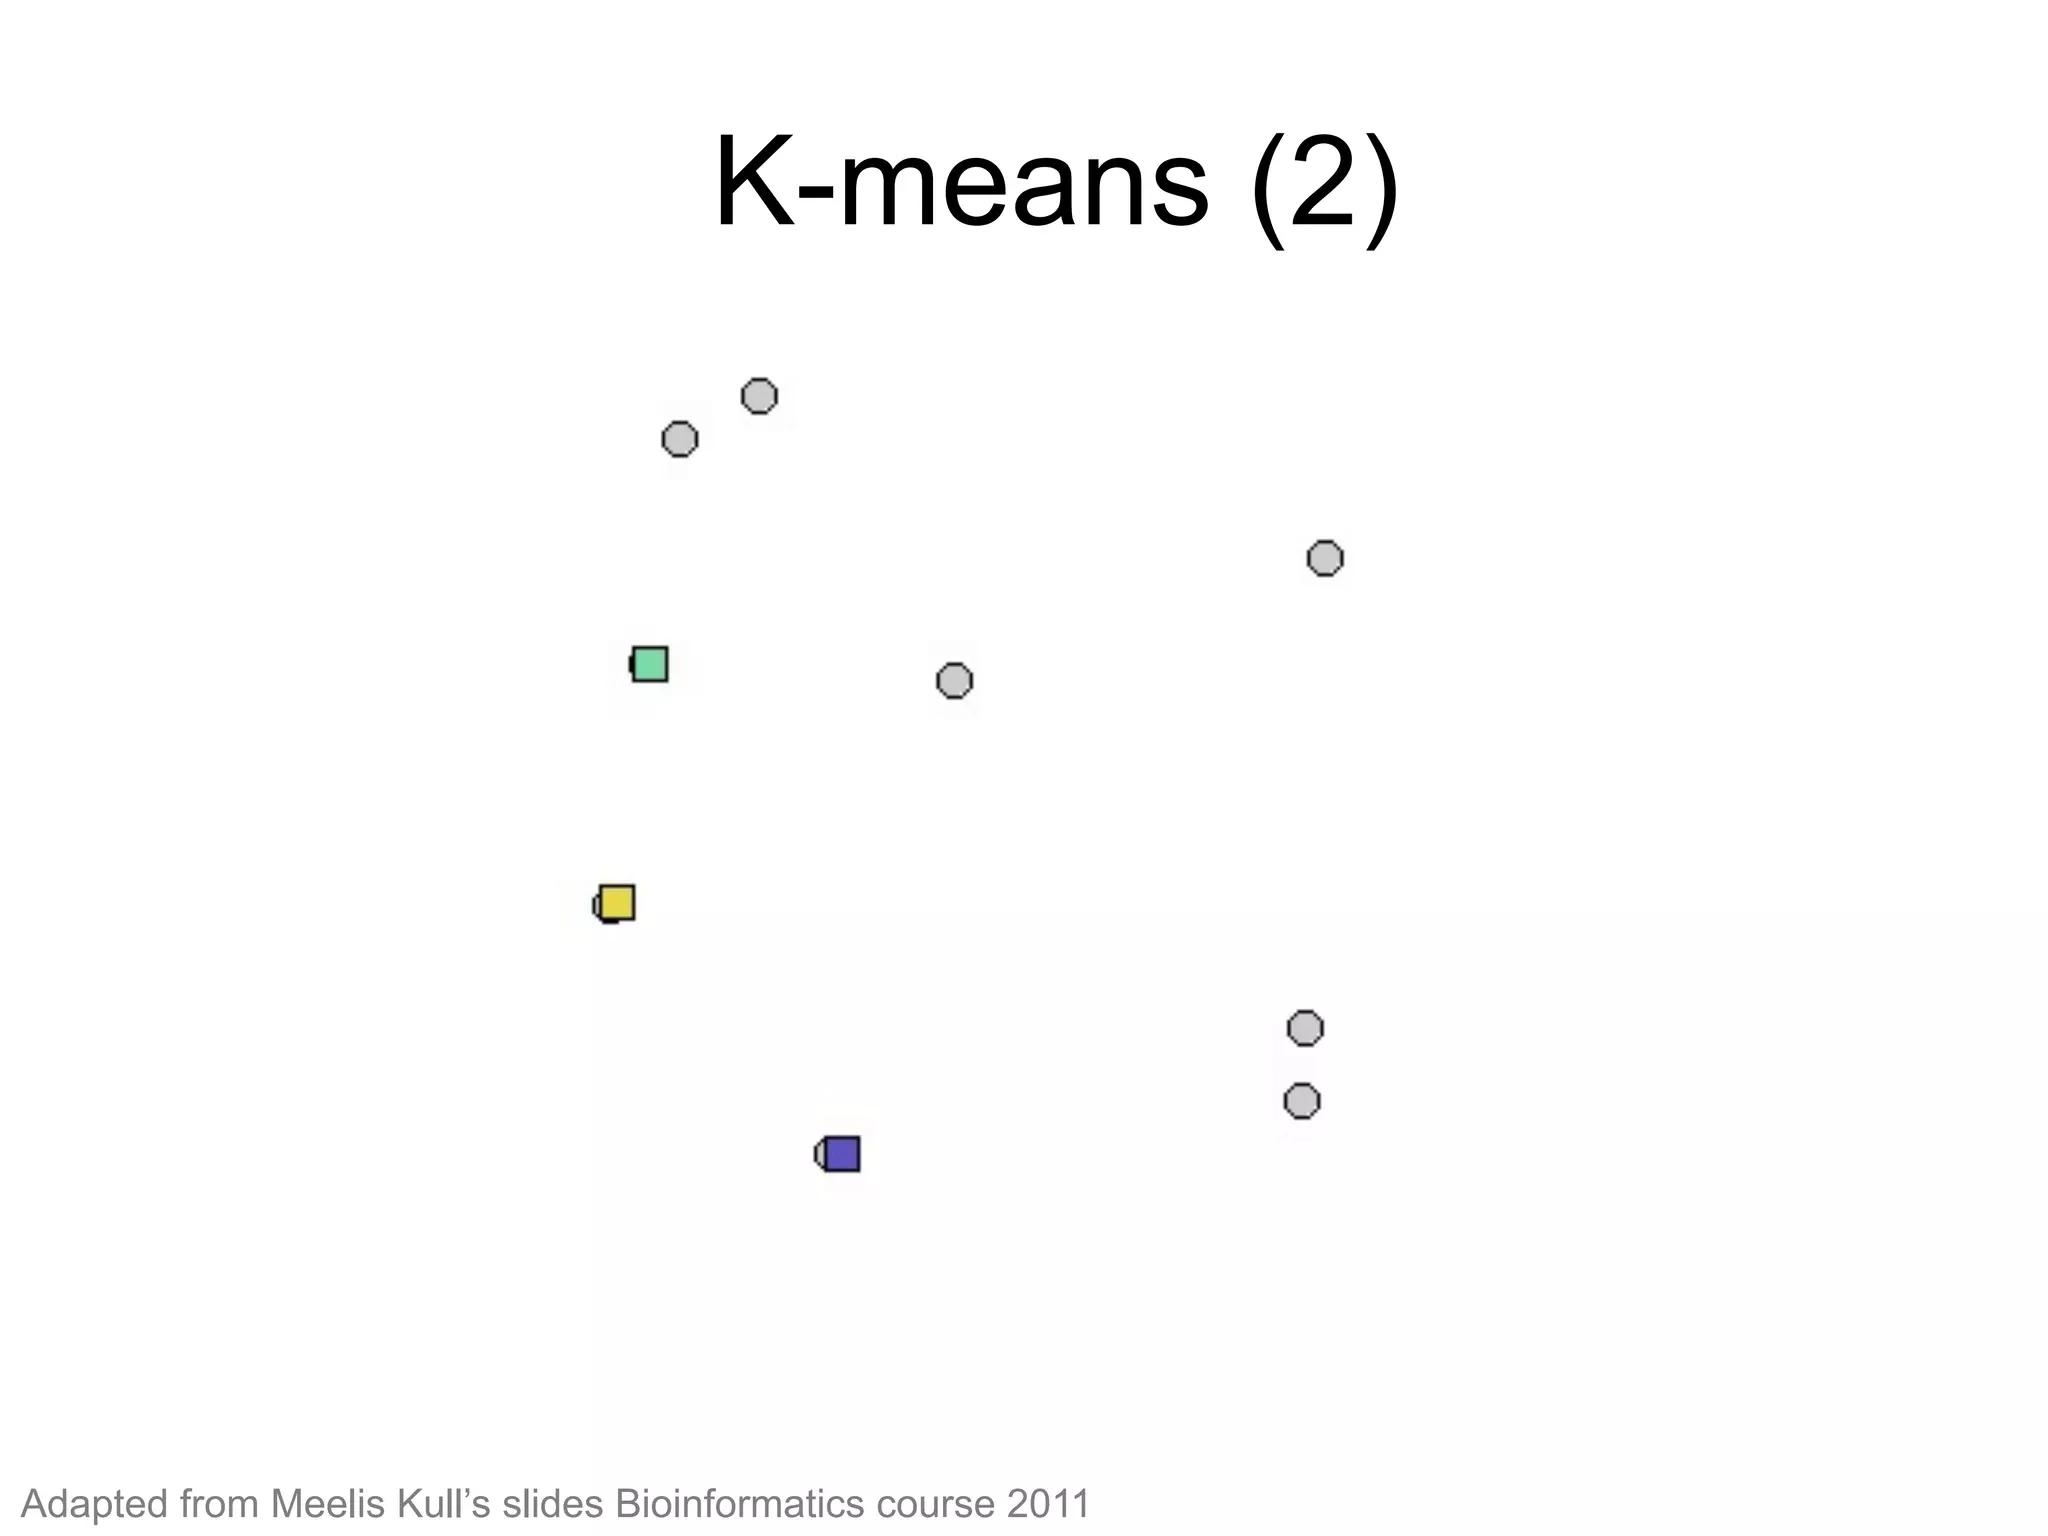
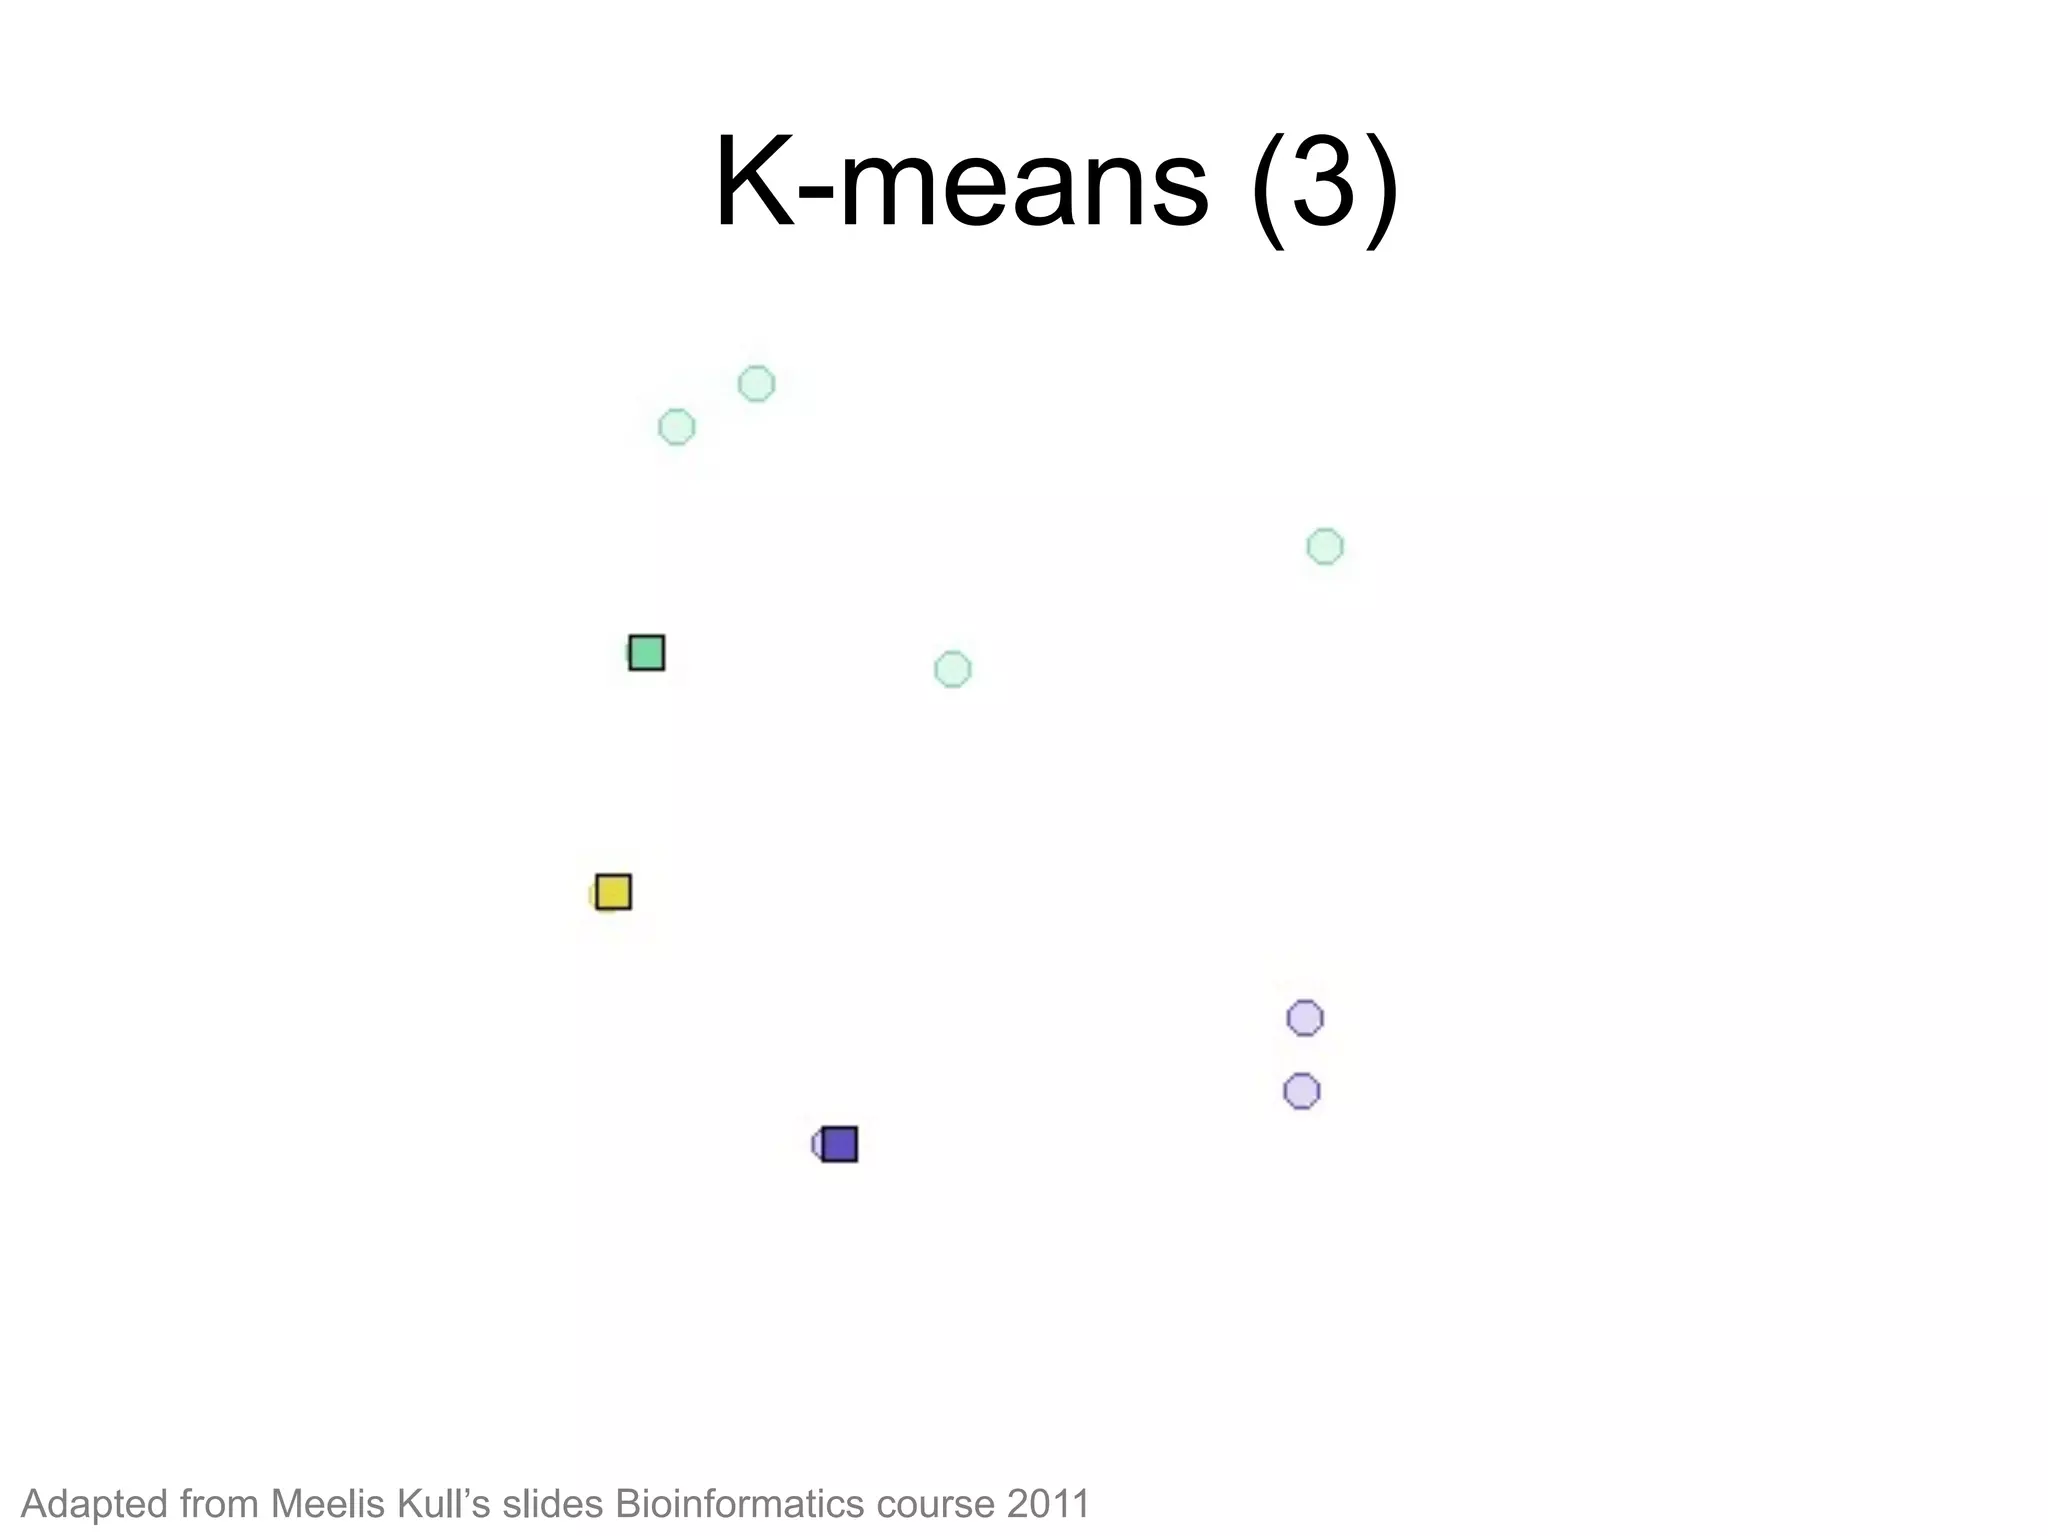
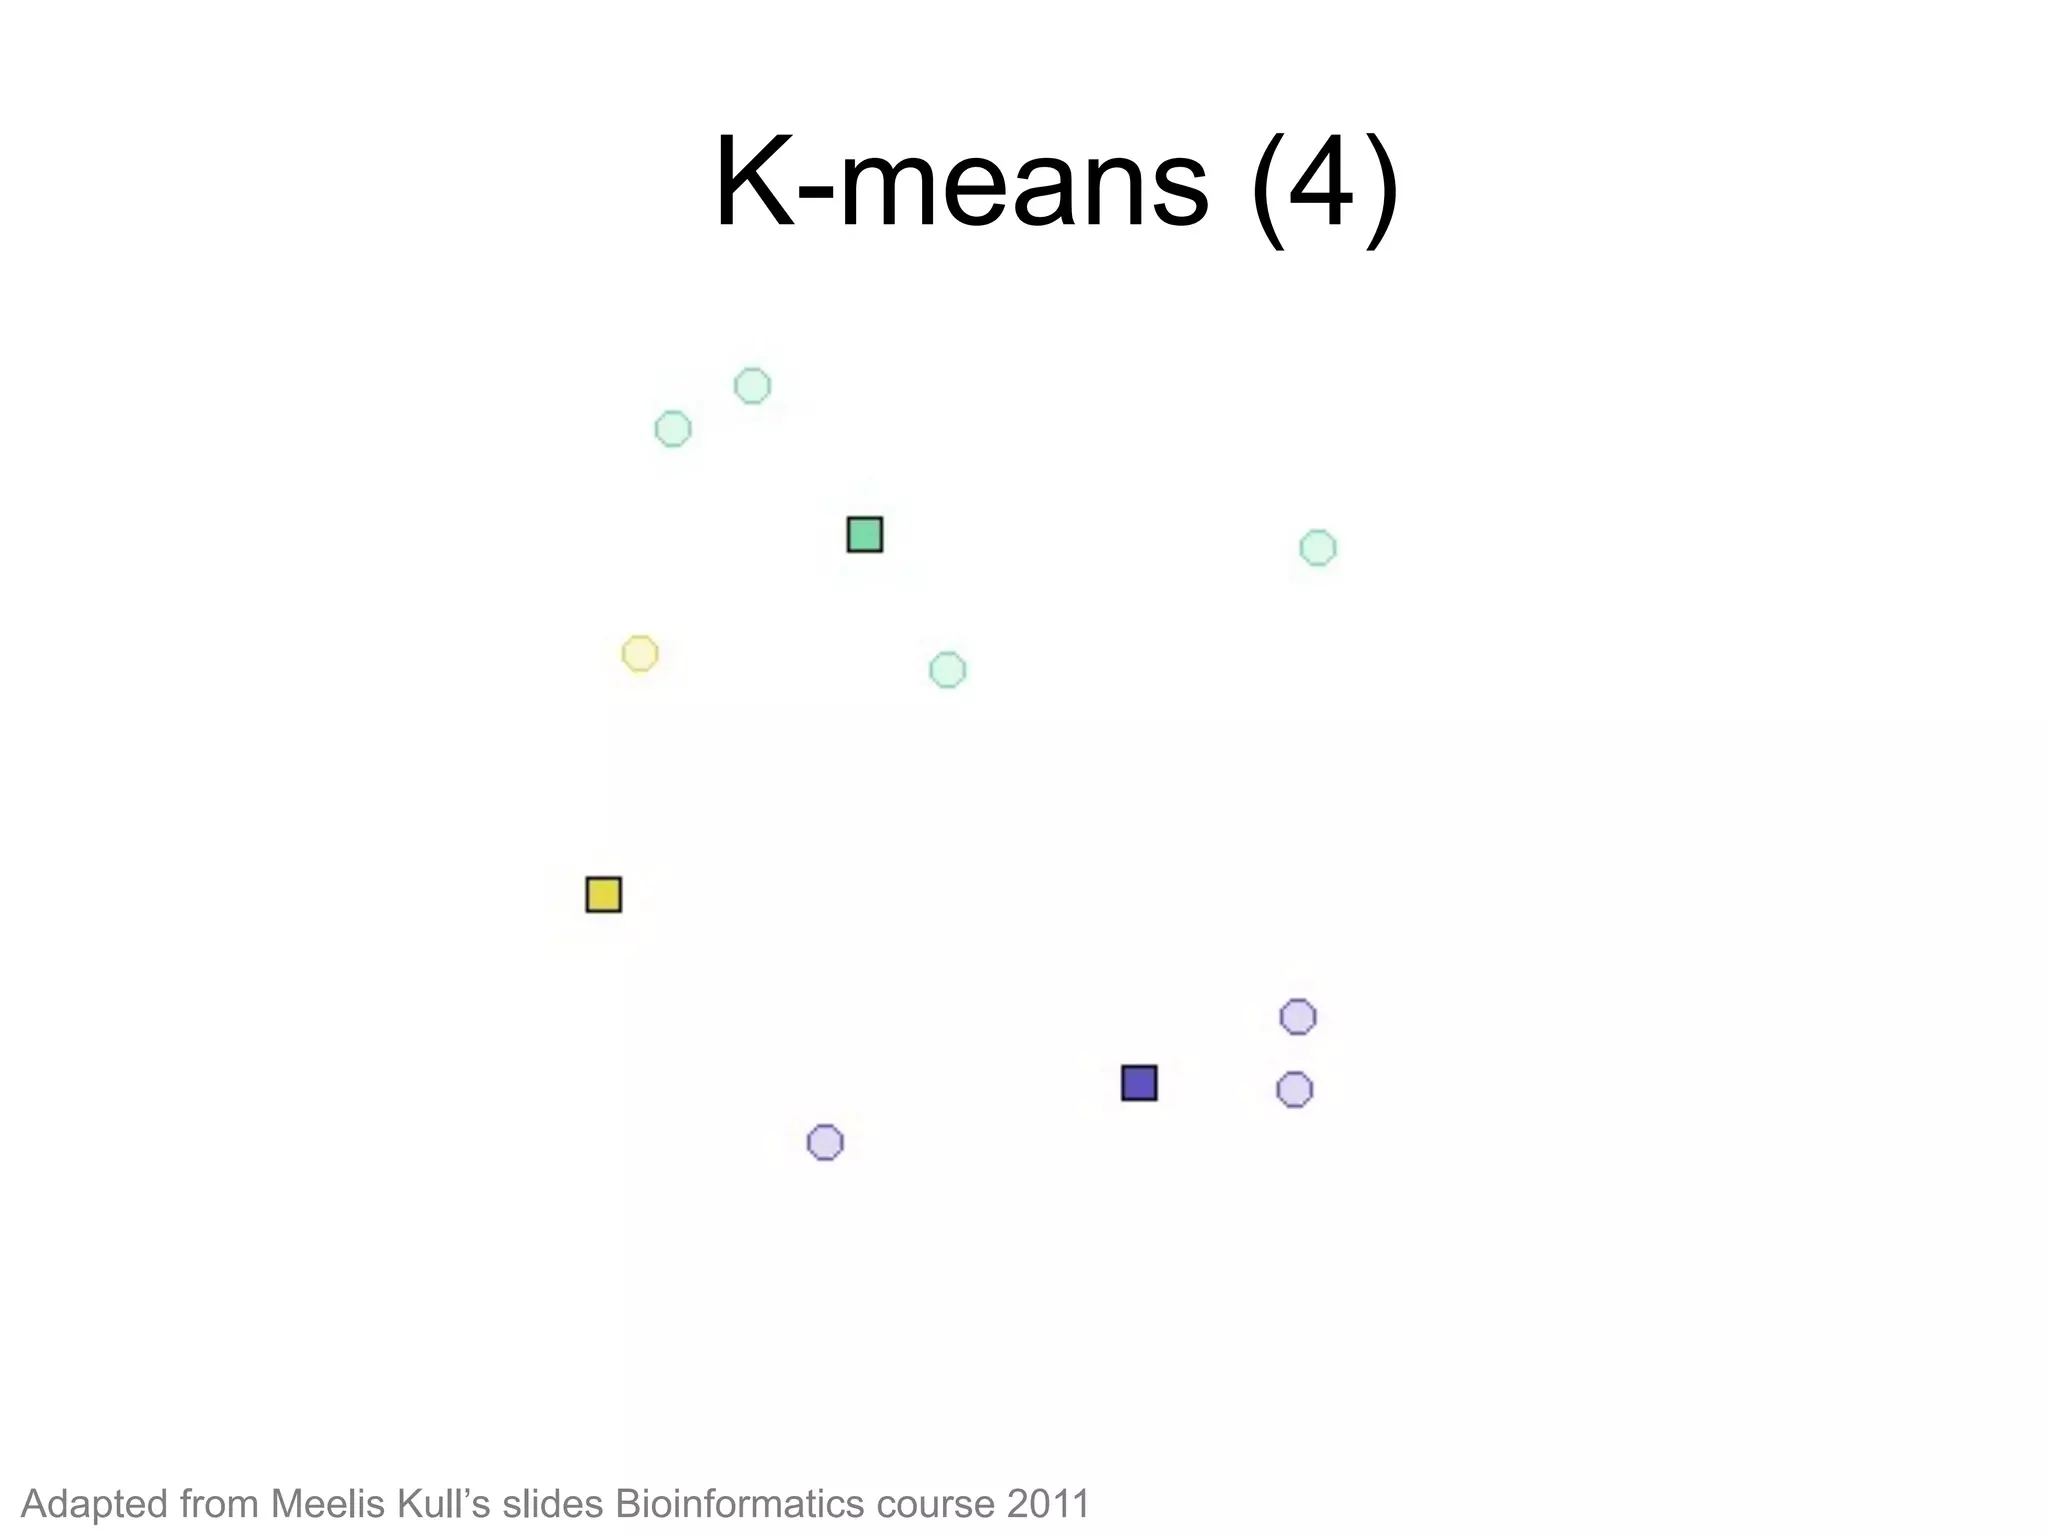
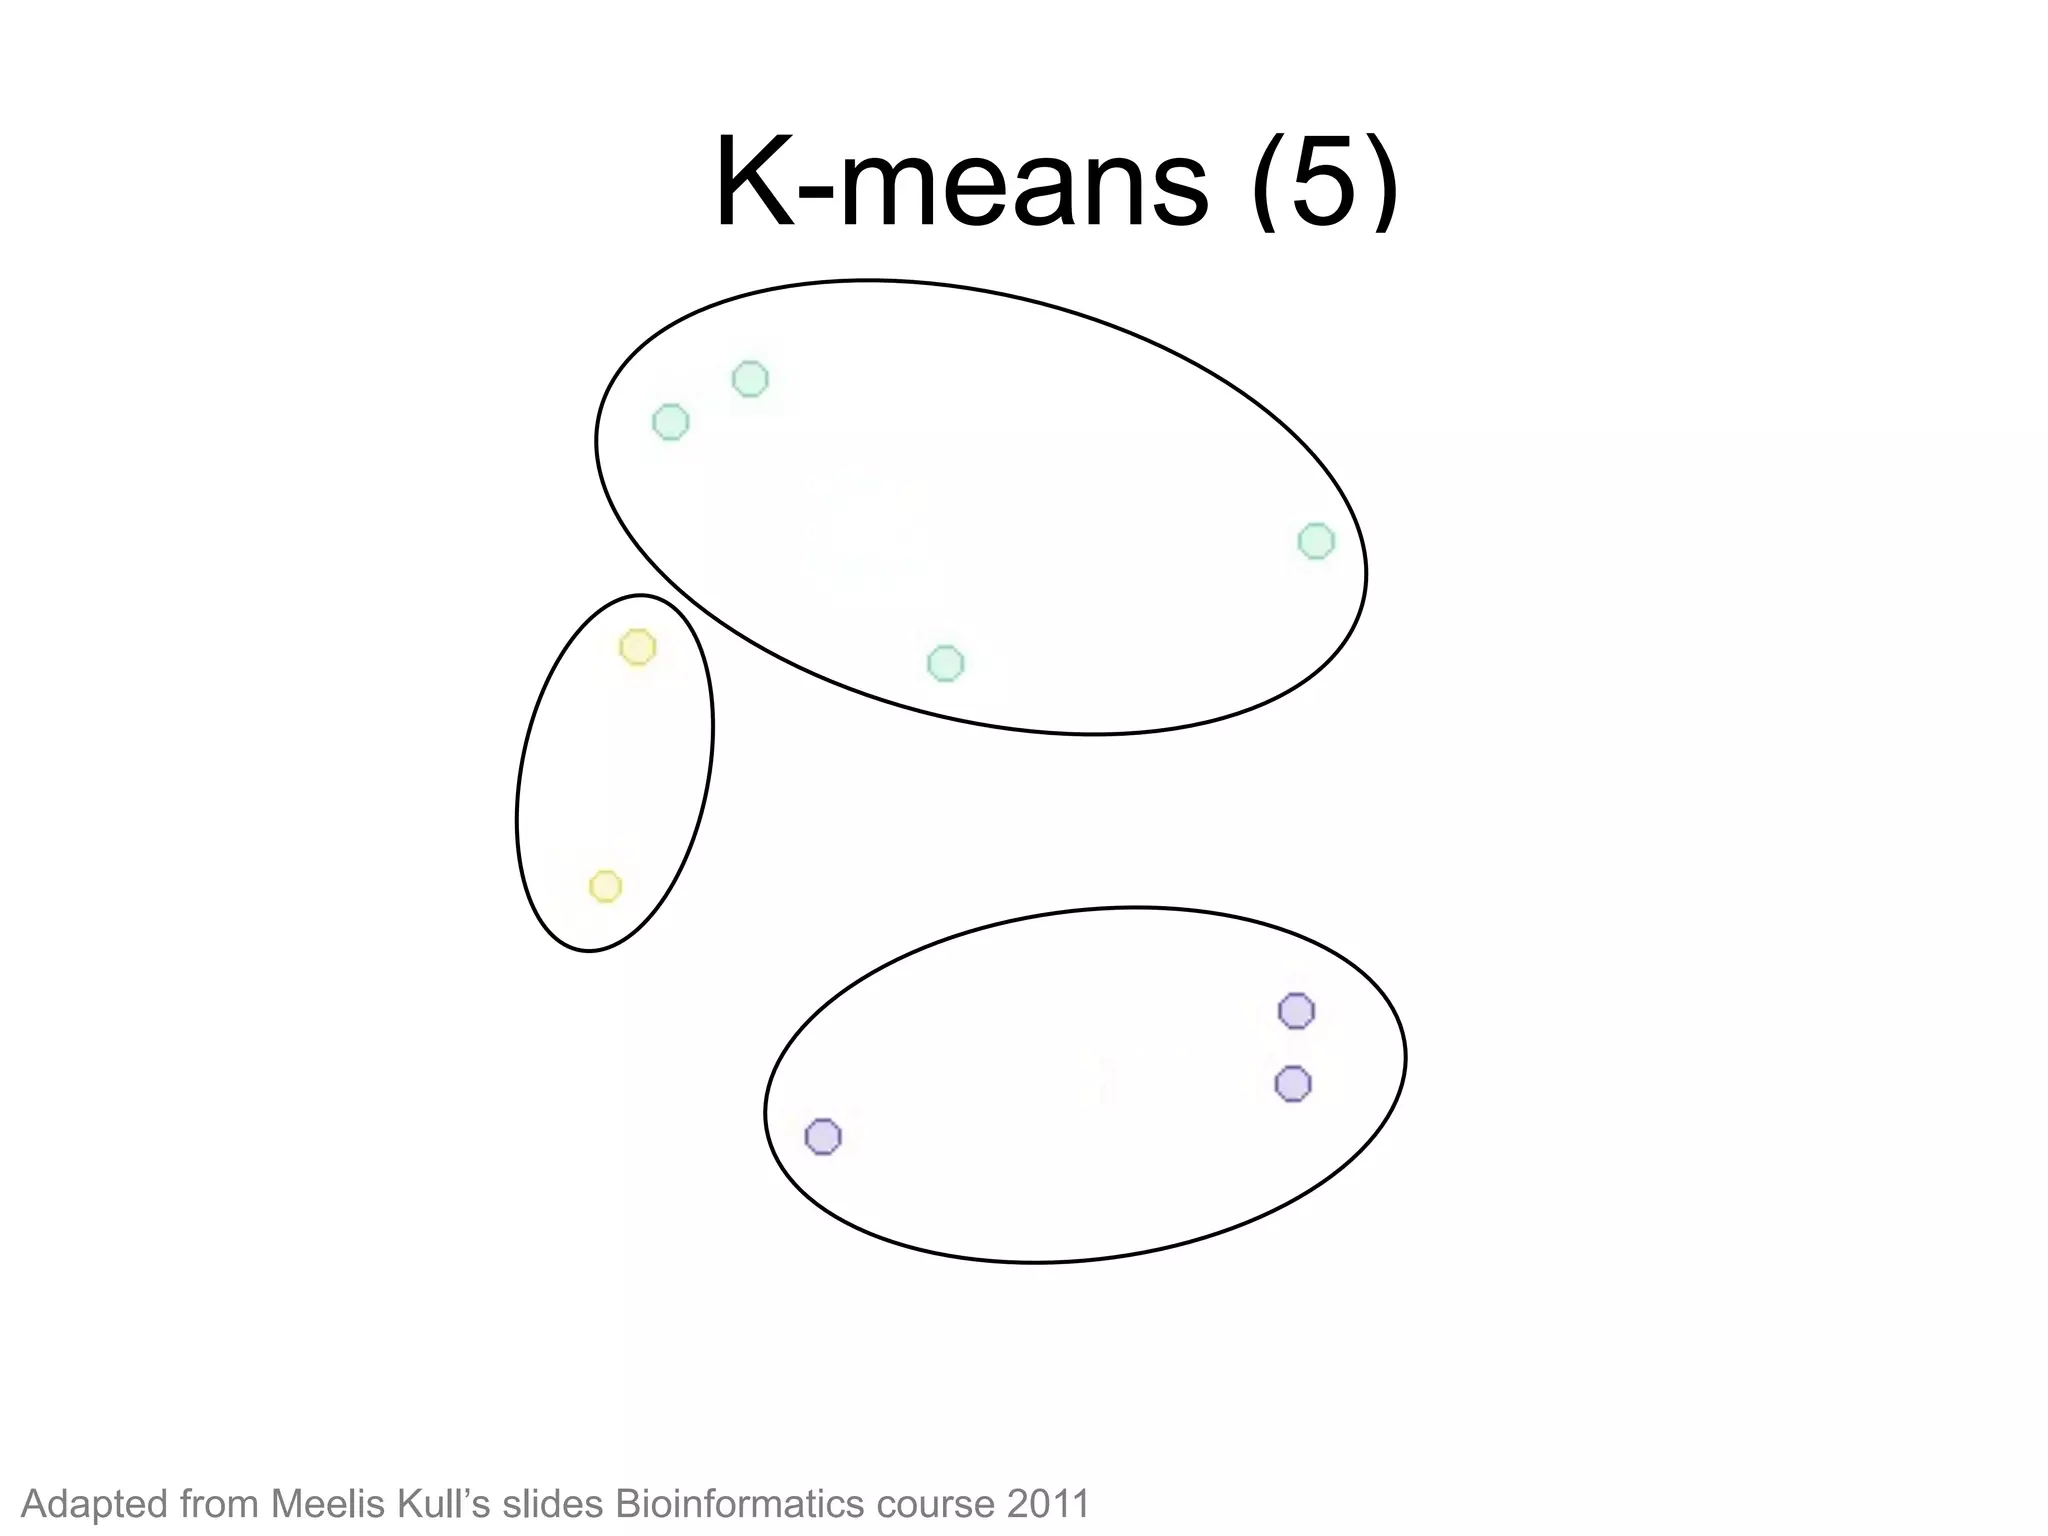
KEMBAR78
Basics of Data Analysis in Bioinformatics | PDF
Basics of Data Analysis
in Bioinformatics
Elena Sügis
elena.sugis@ut.ee
Bioinformatics MTAT.03.239, 2016
??
?
VSVS
Questions we ask
Questions we ask
Questions we ask
https://siteman.wustl.edu/glossary/cdr0000046470/
1014 cells in
human body
23 000 genes
23 pairs of
chromosomes
3 billion pairs
Central dogma
What is DNA?
What is the difference
between DNA and RNA?
Image credit: Genome Research Limited
100 000 different proteins
23 000 genes
Measuring levels of gene expression
CELL
DNA
ON ONOFF
RNA
PROTEIN
OFF
G1 G2 G3 G4
Gene products
carry out cellular
function
v
Gene expression profile
Gene Expression
profile
Expression
level
G1 OFF 0
G2 ON 30
G3 ON 20
G4 OFF 0
Each cell has its own gene
expression profile
Gene Expression
profile
Expression
level
G1 OFF 0
G2 ON 30
G3 ON 20
G4 OFF 0
Gene Expression
profile
Expression
level
G1 OFF 0
G2 ON 30
G3 ON 20
G4 ON 20
HEALTHY CELL CANCER CELL
Applying our knowledge
VS
Experiments
How we did it
Science
knowledgeexperimenthypothesis analysis
v v v
How we do it
lots of
experiments
v
analysis
Science
knowledge
hypothesis
v
v
Data comes in different forms
Slide credit: D.Fishman, Introduction to ML in bioinformatics
Data ≠ Knowledge
Slide credit: D.Fishman, Introduction to ML in bioinformatics
R. Matthiesen (ed.), Bioinformatics Methods in Clinical Research, Methods in Molecular Biology 593,
DOI 10.1007/978-1-60327-194-3 2, © Humana Press, a part of Springer Science+Business Media, LLC 2010
Adopted from P.Vincent http://videolectures.net/deeplearning2015_vincent_machine_learning/
What is the main ingredient?
Adopted from P.Vincent http://videolectures.net/deeplearning2015_vincent_machine_learning/
Simple data analysis pipeline
Data Black Magic Result
high quality data machine learning
method
awesome result
Simple data analysis pipeline
Data Black Magic Result
poor quality data machine learning
method
not so
awesome result
Data Preprocessing
Clean
Massage your data
80 %
Interpretation
Impute missing
values
Normalize/
Standardize
Handle
outliers
Data
analysis
Import
datavalidation
?
Interpretation
Summarize/
plot raw data
Impute missing
values
Normalize/
Standardize
Handle
outliers
Data
analysis
Import
datavalidation
Meet your data
Interpretation
Summarize/
plot raw data
Impute missing
values
Normalize/
Standardize
Handle
outliers
Data
analysis
Import
datavalidation
Missing Values
Origins:
•  Malfunctioning measurement equipment
•  Very low intensity signal
•  Deleted due to inconsistency with other recorded
data
•  Data removed/not entered by mistake
Missing Values
How to deal with them:
•  Filter out
•  Replace missing values by 0
•  Replace by the mean, median value
•  K nearest neighbor imputation (KNN
imputation)
•  Expectation—Maximization (EM) based
imputations
k-nearest neighbors
Image credit: Wikipedia
KNN
•  We are given a gene expression matrix M
•  Let X=(x1, x2, …, xi, …, xn) be a vector in the matrix M
with a missing value at xi at the dimension i
•  Find in the gene expression data matrix matrix vectors
X1 , X2 , …, Xk , such that they are the k closest
vectors to X in M (with a chosen distance measure)
among the vectors that do not have a missing value at
dimension i
•  Replace the missing value xi with the mean (or
median) of X1 i, X2 i, …, Xk i , i.e., mean (median) of
the values at dimension i of vectors X1 , X2 , …, Xk
KNN
Healthy people Patients
Gene expression matrix
Imputed missing values
Healthy people Patients
Gene expression matrix
Interpretation
Summarize/
plot raw data
Impute missing
values
Normalize/
Standardize
Handle
outliers
Data
analysis
Import
datavalidation
Technical vs Biological
Normalization & Standardization
Objective:
adjust measurements so that they can be appropriately
compared among samples
Key ideas:
•  Remove technological biases
•  Make samples comparable
Methods:
•  Z-scores (centering and scaling)
•  Logarithmization
•  Quantile normalization
•  Linear model based normalization
Z-scores
Centering a variable is subtracting the mean of the variable
from each data point so that the new variable's mean is 0.
Scaling a variable is multiplying each data point by a
constant in order to alter the range of the data.
where:
µ is the mean of the population.
σ is the standard deviation of the population.
z =
x −µ
σ
transforms the data by a linear projection onto
a lower-dimensional space that preserves as
much data variation as possible
Principal Component Analysis
Objective:
Reduce dimensionality while preserving as much variance as possible
http://setosa.io/ev/principal-component-analysis/
Visualize normalized data
Groups
Healthy
Patients group1
Patients group2
Visual inspection after normalization
Visual Inspection. PCA
Highlight groups
Patients
Healthy people
Arrrgh!!!
Why aren’t you
together ?!?!
Visual Inspection. PCA
Color by experiment/dataset/day
DAY1
DAY2
Batch Effects
Measurements are affected by:
•  Laboratory conditions
•  Reagent lots
•  Personnel differences
are technical sources of variation that have been added to the
samples during handling. They are unrelated to the biological or
scientific variables in a study.
Major problem :
might be correlated with an outcome of
interest and lead to incorrect conclusions
Fighting The Batch Effects
Experimental design solutions:
•  Shorter experiment time
•  Equally distributed samples between multiple laboratories and
across different processing times, etc.
•  Provide info about changes in personnel, reagents, storage and
laboratories
Statistical solutions:
•  ComBat
•  SVA(Surrogate variable analysis, SVD+linear models)
•  PAMR (Mean-centering)
•  DWD (Distance-weighted discrimination based on SVM)
•  Ratio_G (Geometric ratio-based)
J.T. Leek, Nature Reviews Genetics 11, 733-739 (October 2010,)
Chao Chen, PlosOne, 2011
Interpretation
Summarize/
plot raw data
Impute missing
values
Normalize/
Standardize
Handle
outliers
Data
analysis
Import
datavalidation
Outliers Detection
Interquartile range
outlier
Image credit: Wikipedia
Interpretation
Summarize/
plot raw data
Impute missing
values
Normalize/
Standardize
Handle
outliers
Data
analysis
Import
datavalidation
IF YOU TORTURE
THE DATA
LONG ENOUGH
IT WILL CONFESS
TO ANYTHING
Ronald Coase, Economist, Nobel Prize winner
Clustering is finding groups of objects such that:
similar (or related) to the objects in the same group and
different from (or unrelated) to the objects in other groups
What is cluster analysis?
Image credit: M.Kull, Bioinformatics course 2011
Properties
•  Classes/labels for each instance are
derived only from the data
•  For that reason, cluster analysis is referred
to as unsupervised classification
•  Intuition building
Finding hidden internal structure of the high-dimensional data
•  Hypothesis generation
Finding and characterizing similar groups of objects in the data
•  Knowledge discovery in data
Ex. Underlying rules, reoccurring patterns, topics, etc.
•  Summarizing / compressing large data
•  Data visualization
Why to cluster biological data?
Intuition building
cardiopulmonary
/metabolic
disorders
neurological
diseases
sensory
conditions
cerebral
vascular
accident
cancer
http://bmcgeriatr.biomedcentral.com/articles/10.1186/1471-2318-11-45
•  Intuition building
Finding hidden internal structure of the high-dimensional data
•  Hypothesis generation
Finding and characterizing similar groups of objects in the data
•  Knowledge discovery in data
Ex. Underlying rules, reoccurring patterns, topics, etc.
•  Summarizing / compressing large data
•  Data visualization
Why to cluster biological data?
Hypothesis generation
SAHA
Trichosta
Valproic
Cyproco
PC80
PC70
CdC
AO3
Triadime
Triadime
PC53
Tubacin
CH3HgC
Rotenon
Pb.aceta
Mannitol
Thimero
EGF
ILK
RHOC
ACTN1
BCAR1
ITGB3
ACTN4
MYH9
CAV1
HGF
MET
DPP4
MYLK
PLD1
ITGA4
ITGB1
ROCK1
MMP14
RHOB
MMP2
CAPN1
PTPN1
SRC
PLCG1
RAC2
MYH10
BAIAP2
STAT3
RND3
MMP9
RAC1
RHOA
SH3PXD2A
CSF1
DIAPH1
-3
-2
-1
0
1
2
3
SAHA
TrichostatinA
Valproicacid
Cyproconazole
PCB180
PCB170
CdCl2
As2O3
Triadimenol
Triadimefon
PCB153
Tubacin
MeHg
Rotenon
Pb-acetate
Mannitol
Thimerosal
SAHA
Trichostatin.A
Valproic.acid
Cyproconazole
PC80
PC70
CdC
AO3
Triadimenol
Triadimefon
PC53
Tubacin
CH3HgCl
Rotenon
Pb.acetate
Mannitol
Thimerosal
EGF
ILK
RHOC
ACTN1
BCAR1
ITGB3
ACTN4
MYH9
CAV1
HGF
MET
DPP4
MYLK
PLD1
ITGA4
ITGB1
ROCK1
MMP14
RHOB
MMP2
CAPN1
PTPN1
SRC
PLCG1
RAC2
MYH10
BAIAP2
STAT3
RND3
MMP9
RAC1
RHOA
SH3PXD2A
CSF1
DIAPH1
-3
-2
-1
0
1
2
3
HDACi
EGF
ILK
RHOC
ACTN1
BCAR1
ITGB3
ACTN4
MYH9
CAV1
HGF
MET
DPP4
MYLK
PLD1
ITGA4
ITGB1
ROCK1
MMP14
RHOB
MMP2
CAPN1
PTPN1
SRC
PLCG1
RAC2
MYH10
BAIAP2
STAT3
-3
-2
-1
0
1
2
3
-3 -2 -1 0 1 2 3
Color coded scaled fold change (FC) vs control
•  Intuition building
Finding hidden internal structure of the high-dimensional data
•  Hypothesis generation
Finding and characterizing similar groups of objects in the data
•  Knowledge discovery in data
Ex. Underlying rules, reoccurring patterns, topics, etc.
•  Summarizing / compressing large data
•  Data visualization
Why to cluster biological data?
Knowledge discovery in data
Ex. Underlying rules, reoccurring patterns, topics, etc.
•  Intuition building
Finding hidden internal structure of the high-dimensional data
•  Hypothesis generation
Finding and characterizing similar groups of objects in the data
•  Knowledge discovery in data
Ex. Underlying rules, reoccurring patterns, topics, etc.
•  Summarizing / compressing large data
•  Data visualization
Why to cluster biological data?
Summarizing/compressing the data
Partitional vs Hierarchical
Creates a nested
and hierarchical set
of partitions/clusters
Each sample(point) is
assigned to a unique
cluster
Adapted from Meelis Kull’s slides Bioinformatics course 2011
Fuzzy vs Non-Fuzzy
Fuzzy vs Non-Fuzzy
Each object belongs to each
cluster with some weight
(the weight can be zero)
Each object belongs to
exactly one cluster
Each object belongs to
each cluster with some
weight
Each object belongs to
exactly one cluster
Adapted from Meelis Kull’s slides Bioinformatics course 2011
Hierarchical clusteringHierarchical clustering
Hierarchical clustering is usually
depicted as a dendrogram (tree)
Hierarchical clustering is usually
depicted as a dendrogram (tree)
Adapted from Meelis Kull’s slides Bioinformatics course 2011
•  Each subtree corresponds to a cluster
•  Height of branching shows distance
Hierarchical clustering
• Each subtree corresponds to a cluste
• Height of branching shows distance
Hierarchical clustering
Adapted from Meelis Kull’s slides Bioinformatics course 2011
Hierarchical clustering (0)
Algorithm for Agglomerative
Hierarchical Clustering:
Join the two closest objects
Algorithm for Agglomerative Hierarchical
Clustering:
Join the two closest objects
Hierarchical clustering
Adapted from Meelis Kull’s slides Bioinformatics course 2011
Join the two closest objects
Hierarchical clustering (1)
Join the two closest objects
Hierarchical clustering
Adapted from Meelis Kull’s slides Bioinformatics course 2011
Keep joining the closest pairs
Hierarchical clustering (2)
Keep joining the closest pairs
Hierarchical clustering
Adapted from Meelis Kull’s slides Bioinformatics course 2011
Hierarchical clustering (3)
Keep joining the closest pairs
Hierarchical clustering
Adapted from Meelis Kull’s slides Bioinformatics course 2011
Hierarchical clustering (4)
Keep joining the closest pairs
Hierarchical clustering
Adapted from Meelis Kull’s slides Bioinformatics course 2011
Hierarchical clustering (5)
Keep joining the closest pairs
Hierarchical clustering
Adapted from Meelis Kull’s slides Bioinformatics course 2011
Hierarchical clustering (10)
After 10 steps we have
4 clusters left
After 10 steps we have 4 clusters left
Hierarchical clustering
Adapted from Meelis Kull’s slides Bioinformatics course 2011
Q: Which clusters do we merge next?Hierarchical clustering (10)
After 10 steps we have
4 clusters leftAdapted from Meelis Kull’s slides Bioinformatics course 2011
Hierarchical clustering (10)
Several ways to measure distance
between clusters:
• Single linkage (MIN)
Several ways to measure
distance between clusters:
•  Single linkage(MIN)
Hierarchical clustering
Adapted from Meelis Kull’s slides Bioinformatics course 2011
Hierarchical clustering (10)
Several ways to measure distance
between clusters:
• Single linkage (MIN)
• Complete linkage (MAX)
Several ways to measure
distance between clusters:
•  Single linkage(MIN)
•  Complete linkage(MAX)
Hierarchical clustering
Adapted from Meelis Kull’s slides Bioinformatics course 2011
Hierarchical clustering (10)
Several ways to measure distance
between clusters:
• Single linkage (MIN)
• Complete linkage (MAX)
• Average linkage
• Weighted
• Unweighted
• ...
Several ways to measure
distance between clusters:
•  Single linkage (MIN)
•  Complete linkage (MAX)
•  Average linkage
•  Weighted
•  Unweighted ...
•  Ward’s method
Hierarchical clustering
Hierarchical clustering (11)
In this example and at this stage
we have the same result as in
partitional clustering
In this example and at this
stage we have the same result
as in partitional clustering
Hierarchical clustering
Adapted from Meelis Kull’s slides Bioinformatics course 2011
Hierarchical clustering (12)
In the final step the two
remaining clusters are joined into
a single cluster
In the final step the two
remaining clusters are joined
into a single cluster
Hierarchical clustering
Adapted from Meelis Kull’s slides Bioinformatics course 2011
Hierarchical clustering (13)
In the final step the two
remaining clusters are joined into
a single cluster
In the final step the two
remaining clusters are joined
into a single cluster
Hierarchical clustering
Adapted from Meelis Kull’s slides Bioinformatics course 2011
Examples of Hierarchical
Clustering in Bioinformatics
Examples of Hierarchical
Clustering in Bioinformatics
PhylogenyGene expression
clustering
K-means clustering
•  Partitional, non-fuzzy
•  Partitions the data into K clusters
•  K is given by the user
Algorithm:
•  Choose K initial centers for the clusters
•  Assign each object to its closest center
•  Recalculate cluster centers
•  Repeat until converges
Adapted from Meelis Kull’s slides Bioinformatics course 2011
K-means (1)
K-means (1)
Adapted from Meelis Kull’s slides Bioinformatics course 2011
K-means (2)
K-means (2)
Adapted from Meelis Kull’s slides Bioinformatics course 2011
K-means (3)
K-means (3)
Adapted from Meelis Kull’s slides Bioinformatics course 2011
K-means (4)
K-means (4)
Adapted from Meelis Kull’s slides Bioinformatics course 2011
K-means (5)
K-means (6)
Adapted from Meelis Kull’s slides Bioinformatics course 2011
Elbow method
Estimate the number of clusters
K-means clustering summary
•  One of the fastest clustering algorithms
•  Therefore very widely used
•  Sensitive to the choice of initial centers
•  many algorithms to choose initial centers
cleverly
•  Assumes that the mean can be calculated
•  can be used on vector data
•  cannot be used on sequences
(what is the mean of A and T?)
K-medoids clustering
•  The same as K-means, except that the center
is required to be at an object
•  Medoid - an object which has minimal total
distance to all other objects in its cluster
•  Can be used on more complex data, with any
distance measure
•  Slower than K-means
Adapted from Meelis Kull’s slides Bioinformatics course 2011
K-medoids (1)K-medoids (1)
Adapted from Meelis Kull’s slides Bioinformatics course 2011
K-medoids (2)K-medoids (2)
K-medoids (3)K-medoids (3)
K-medoids (4)K-medoids (4)
K-medoids (5)
K-medoids (5)
K-medoids (6)K-medoids (6)
K-medoids (7)K-medoids (7)
K-medoids (8)K-medoids (8)
K-medoids (9)K-medoids (9)
Examples of K-means and
K-medoids in Bioinformatics
Gene expression
clustering
Sequence clustering
Examples of K-means and
K-medoids in Bioinformatics
Adapted from Meelis Kull’s slides Bioinformatics course 2011
Distance measuresDistance measures
Distance of vectors and
• Euclidean distance
• Manhattan distance
• Correlation distance
Distance of sequences and
• Hamming distance => 3
• Levenshtein distance
x = (x1, . . . , xn) y = (y1, . . . , yn)
d(x, y) =
v
u
u
t
nX
i=1
(xi yi)
2
d(x, y) =
nX
i=1
|xi yi|
d(x, y) = 1 r(x, y)
is Pearson
correlation coefficient
r(x, y)
ACCTTG TACCTG
ACCTTG
TACCTG
.ACCTTG
TACC.TG
=> 2
Adapted from Meelis Kull’s slides Bioinformatics course 2011
Interpretation
Summarize/
plot raw data
Impute missing
values
Normalize/
Standardize
Handle
outliers
Data
analysis
Import
datavalidation
Put it into words & Discover
Gene ontology
•  Molecular Function - elemental activity or task
• Biological Process - broad objective or goal
• Cellular Component - location or complex
What found genes are doing
112#
Genes with
known
function x
Your gene
list
?
Functional enrichment statistics
Slide credit: Priit Adler ELIXIR-EE tools course 2016
113#
Genes with
known
function x
Your gene
list
?
Does your gene list includes more genes with function x
than expected by random chance?
Functional enrichment statistics
Slide credit: Priit Adler ELIXIR-EE tools course 2016
114#
Genes with
known
function x
Your gene
list
?
Does your gene list includes more genes with function x
than expected by random chance?
p =
Functional enrichment statistics
Slide credit: Priit Adler ELIXIR-EE tools course 2016
g:Profiler toolset
http://biit.cs.ut.ee/gprofiler
115#
J. Reimand, M. Kull, H. Peterson, J. Hansen, J. Vilo: g:Profiler - a web-based toolset for functional
profiling of gene lists from large-scale experiments (2007) NAR 35 W193-W200
Jüri Reimand, Tambet Arak, Priit Adler, Liis Kolberg, Sulev Reisberg, Hedi Peterson, Jaak Vilo:
g:Profiler -- a web server for functional interpretation of gene lists (2016 update) Nucleic Acids
Research 2016; doi: 10.1093/nar/gkw199
Slide credit: Priit Adler ELIXIR-EE tools course 2016
Reading#the#output#
Statistics
Your genes
50 GO:0034660
ncRNA metabolic process
475 genes
10
Slide credit: Priit Adler ELIXIR-EE tools course 2016
Functional annotations & Significance
statistical significance of having drawn a sample consisting of a specific number of
k successes out of n total draws from a population of size N containing K
successes.
Cluster annotation
GOsummaries
https://www.bioconductor.org/packages/release/bioc/html/GOsummaries.html
Practice time!

Basics of Data Analysis in Bioinformatics