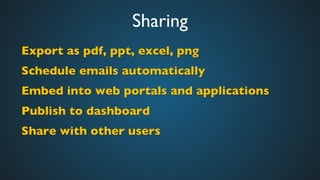
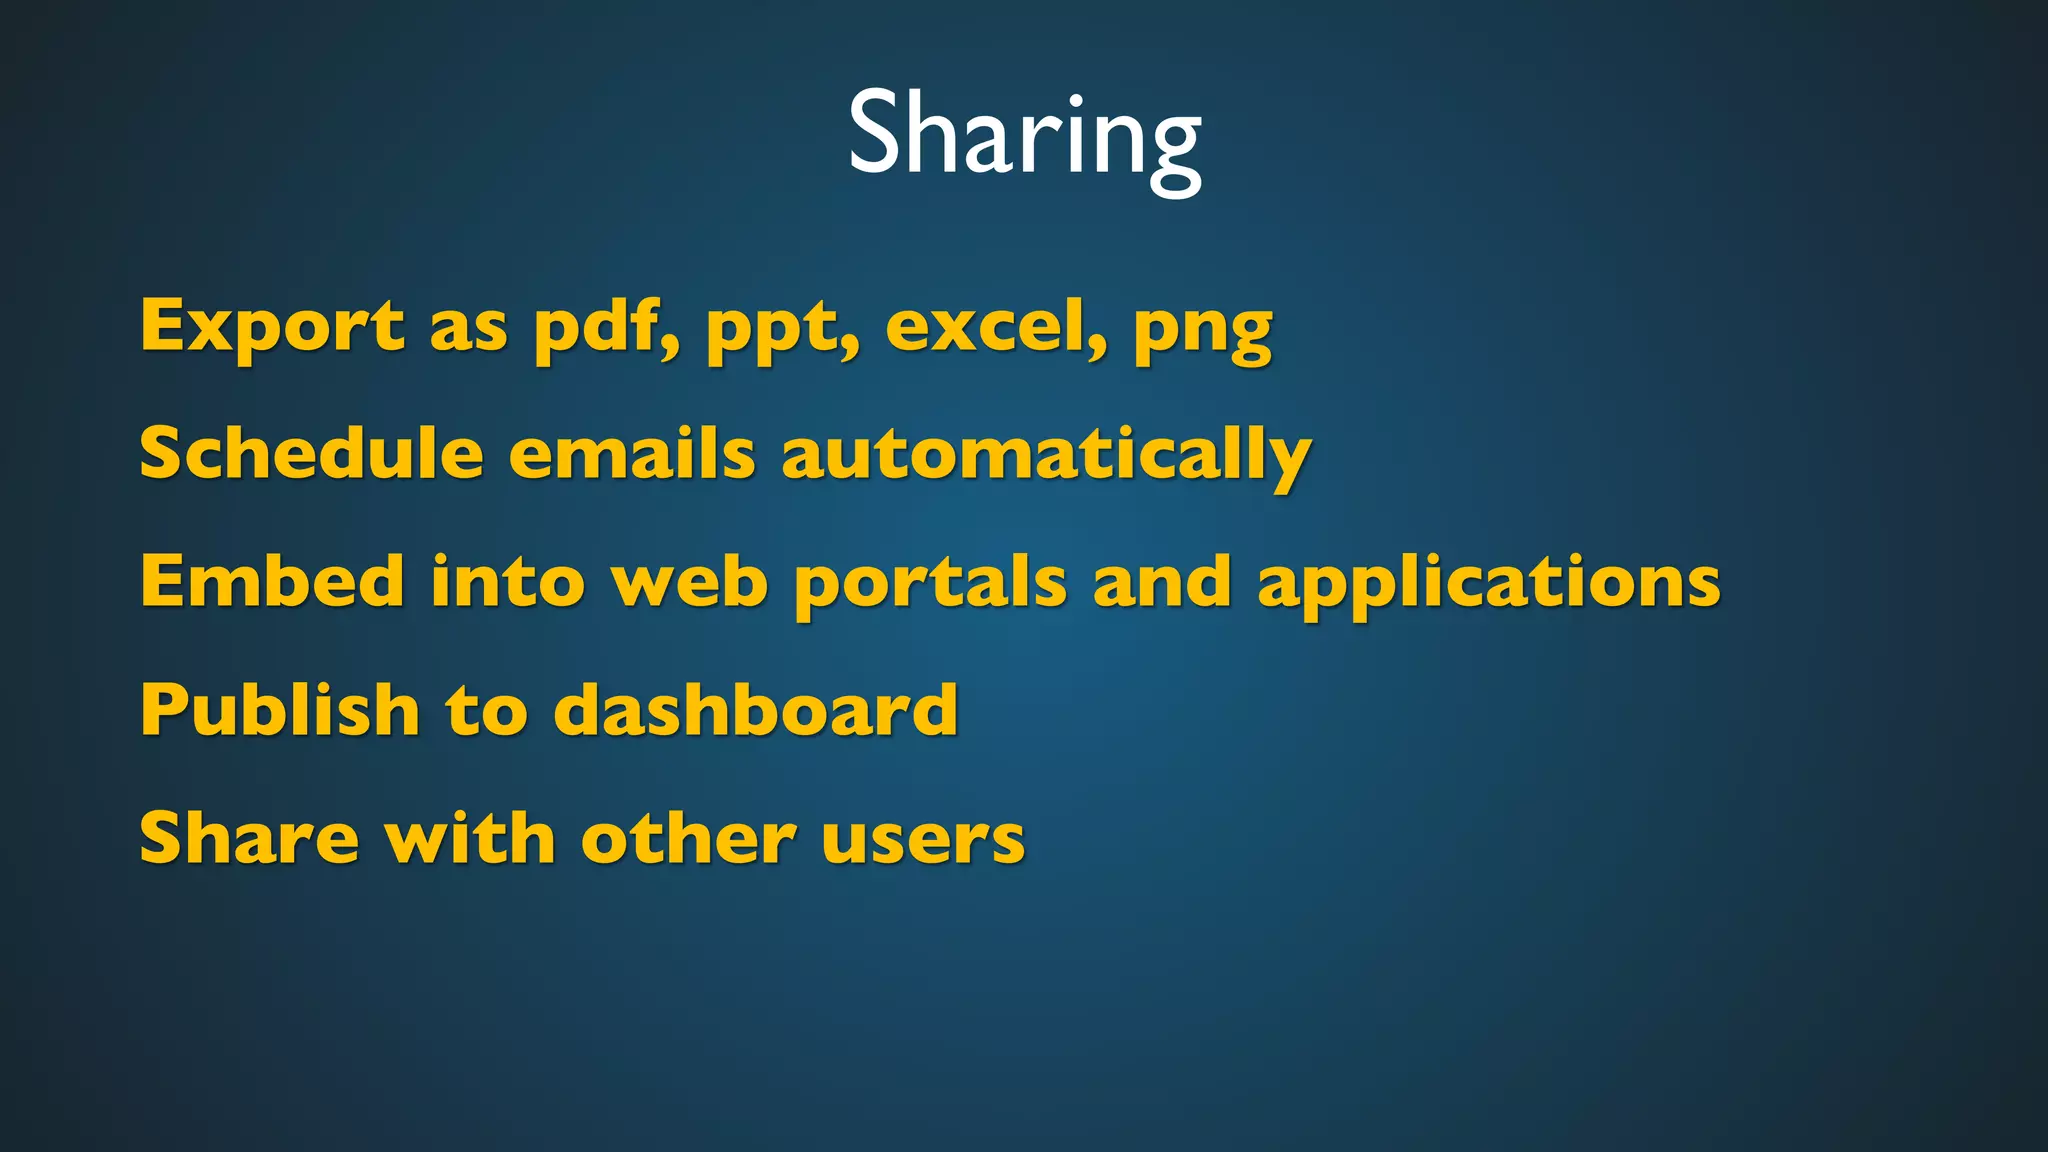
Download as PDF, PPTX


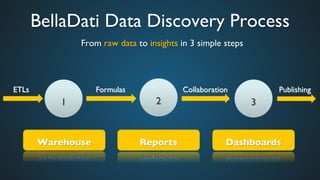
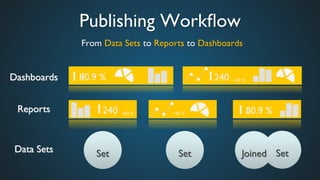

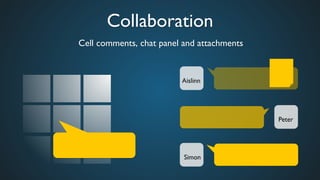

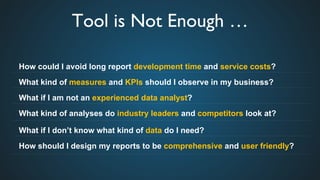
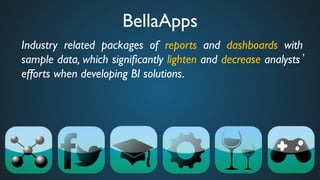
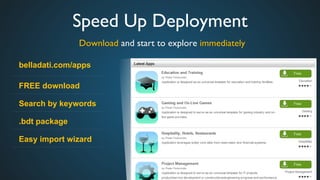
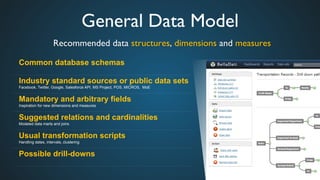


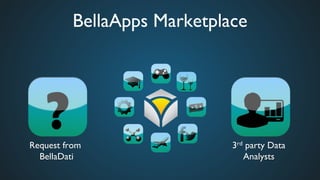
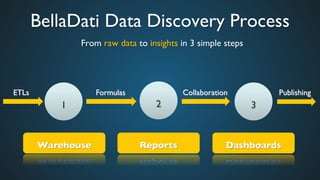


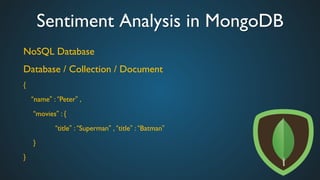
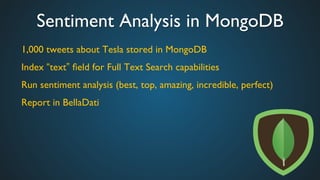
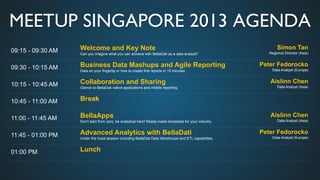


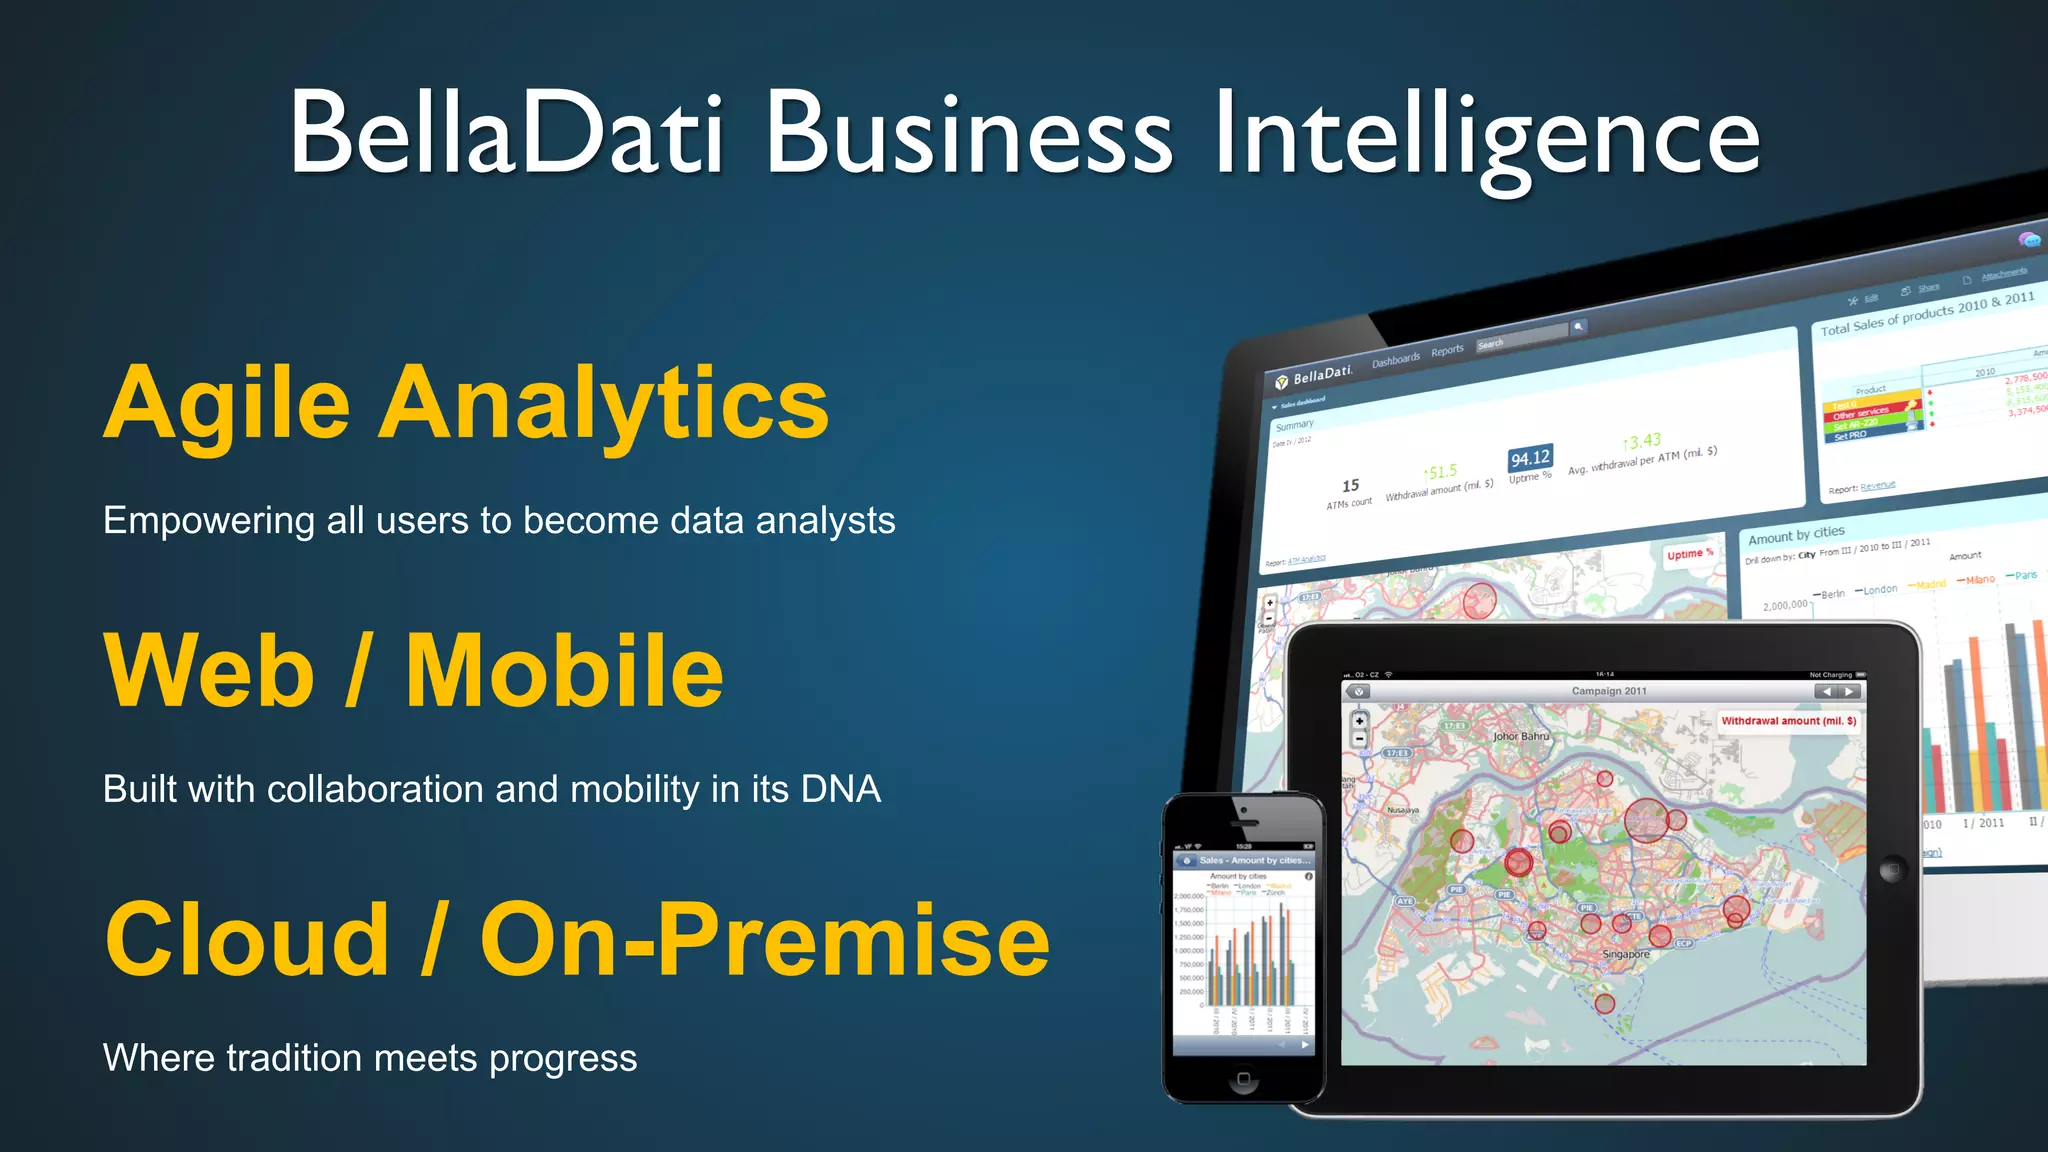
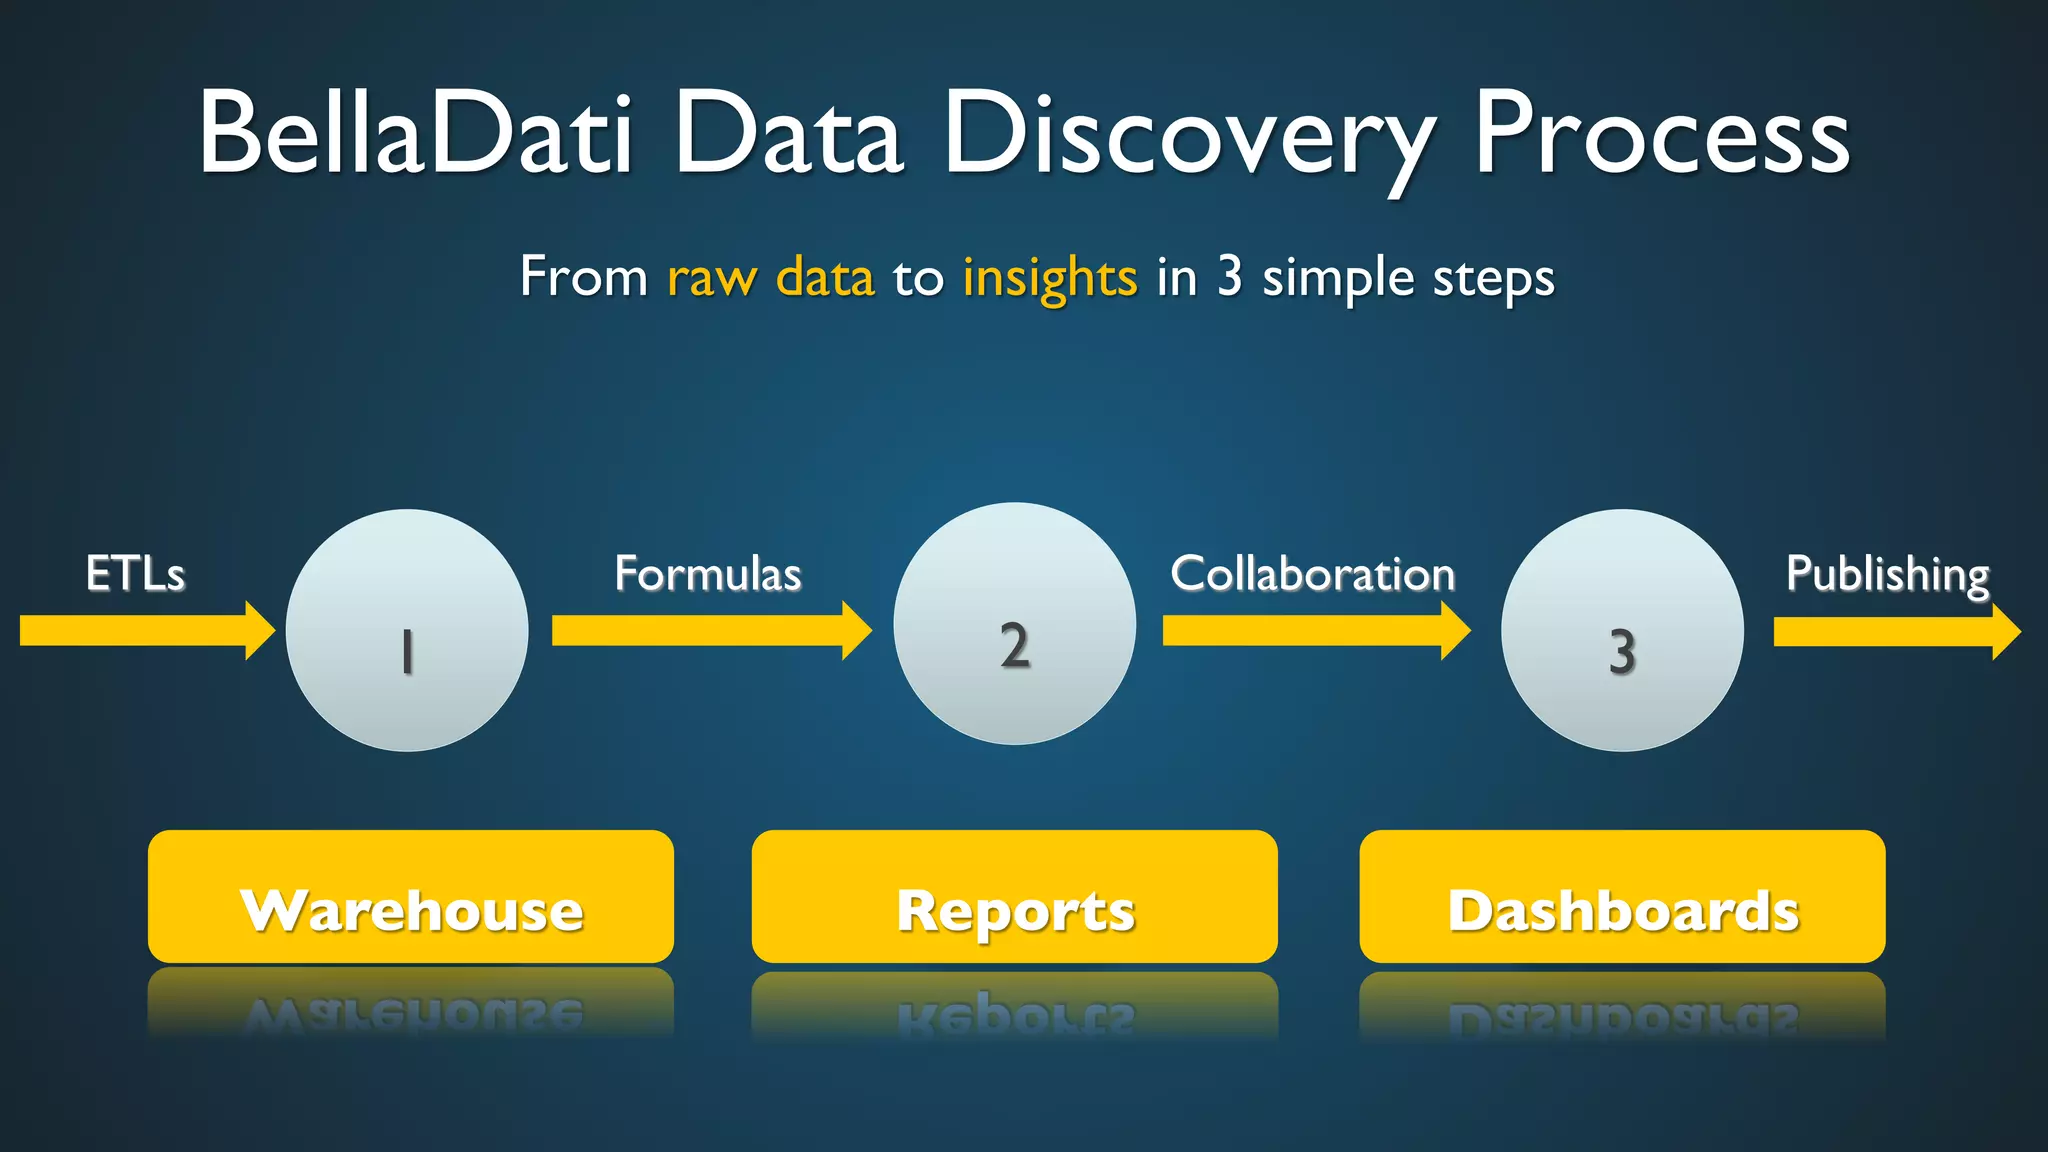
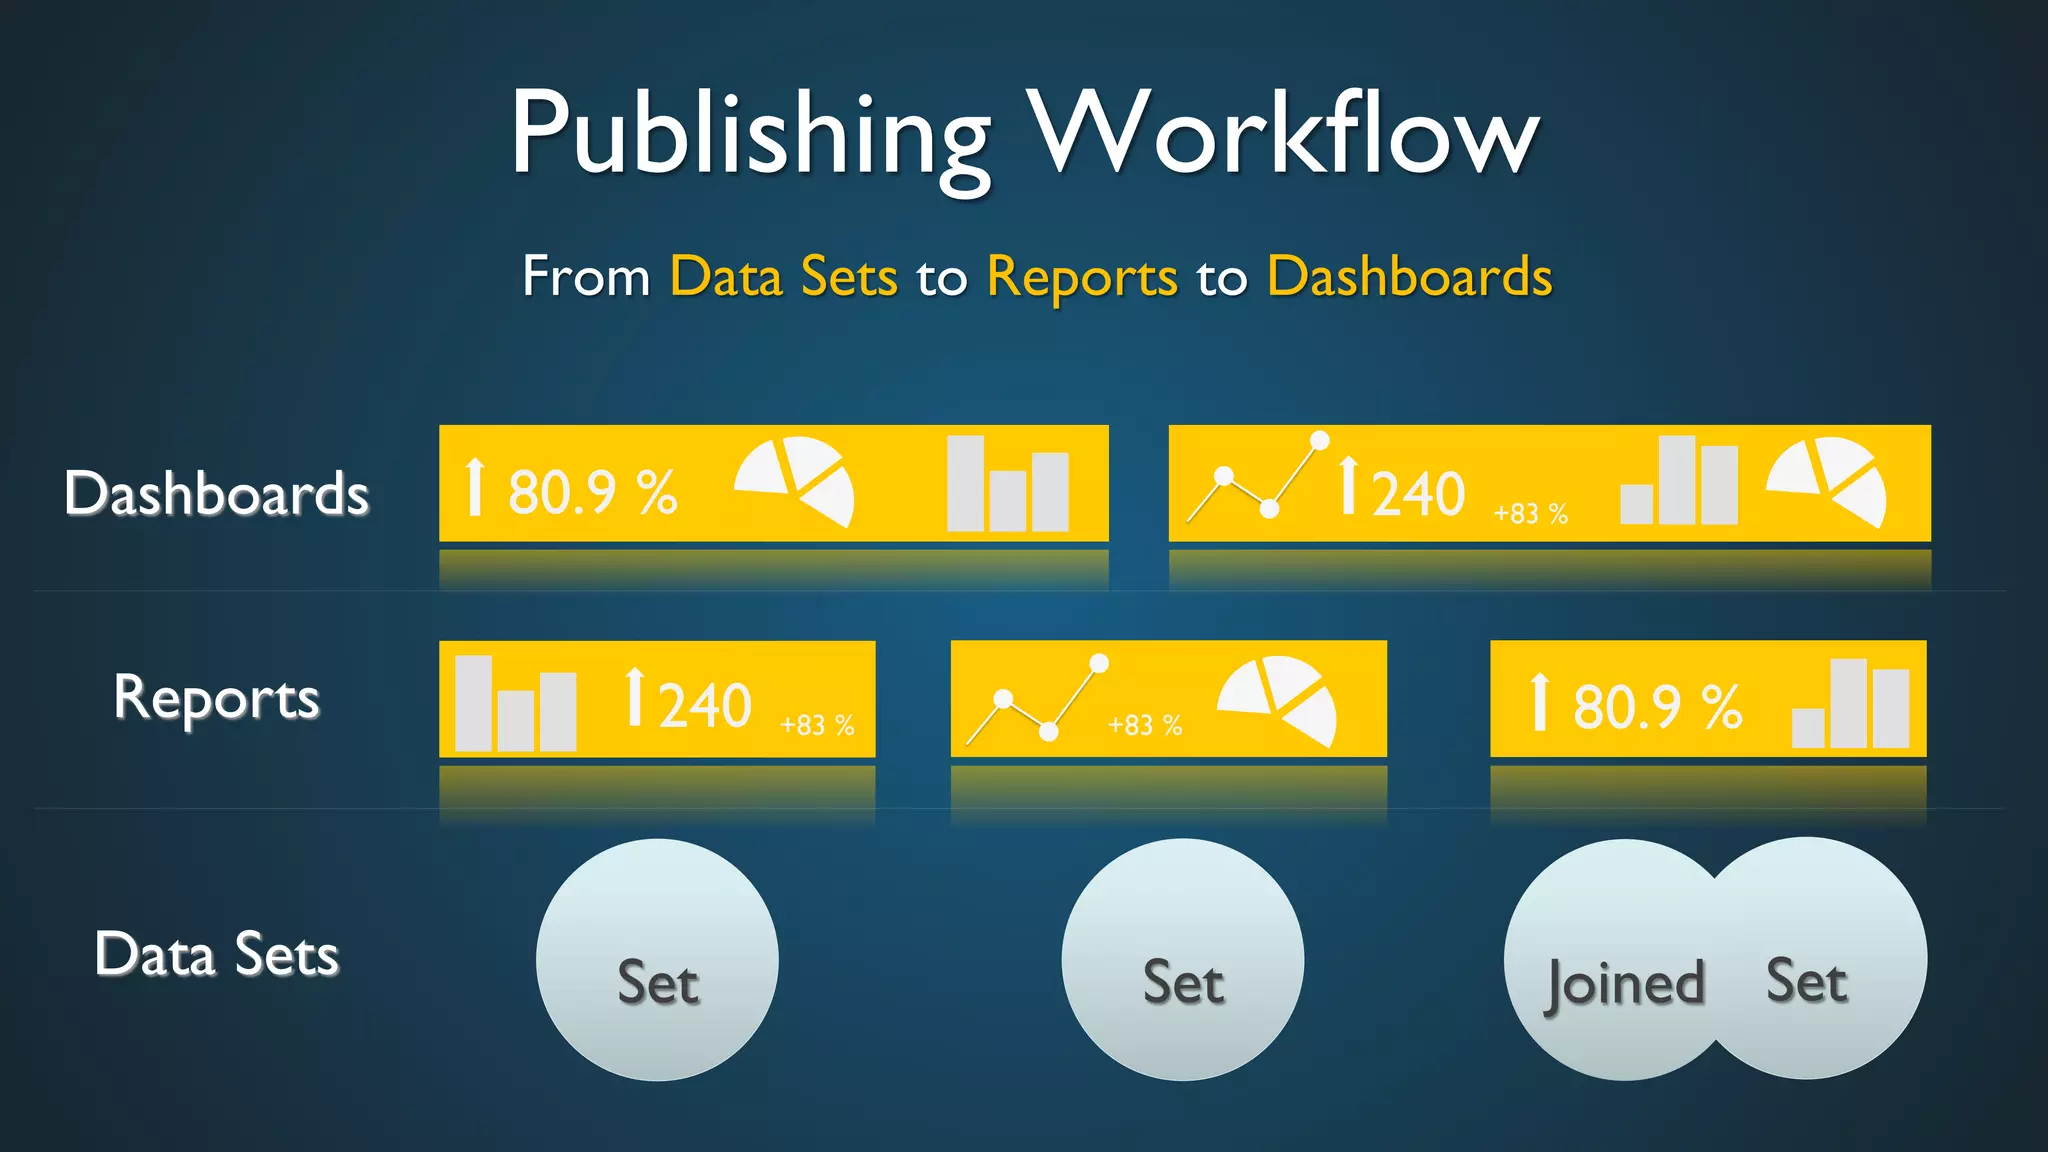


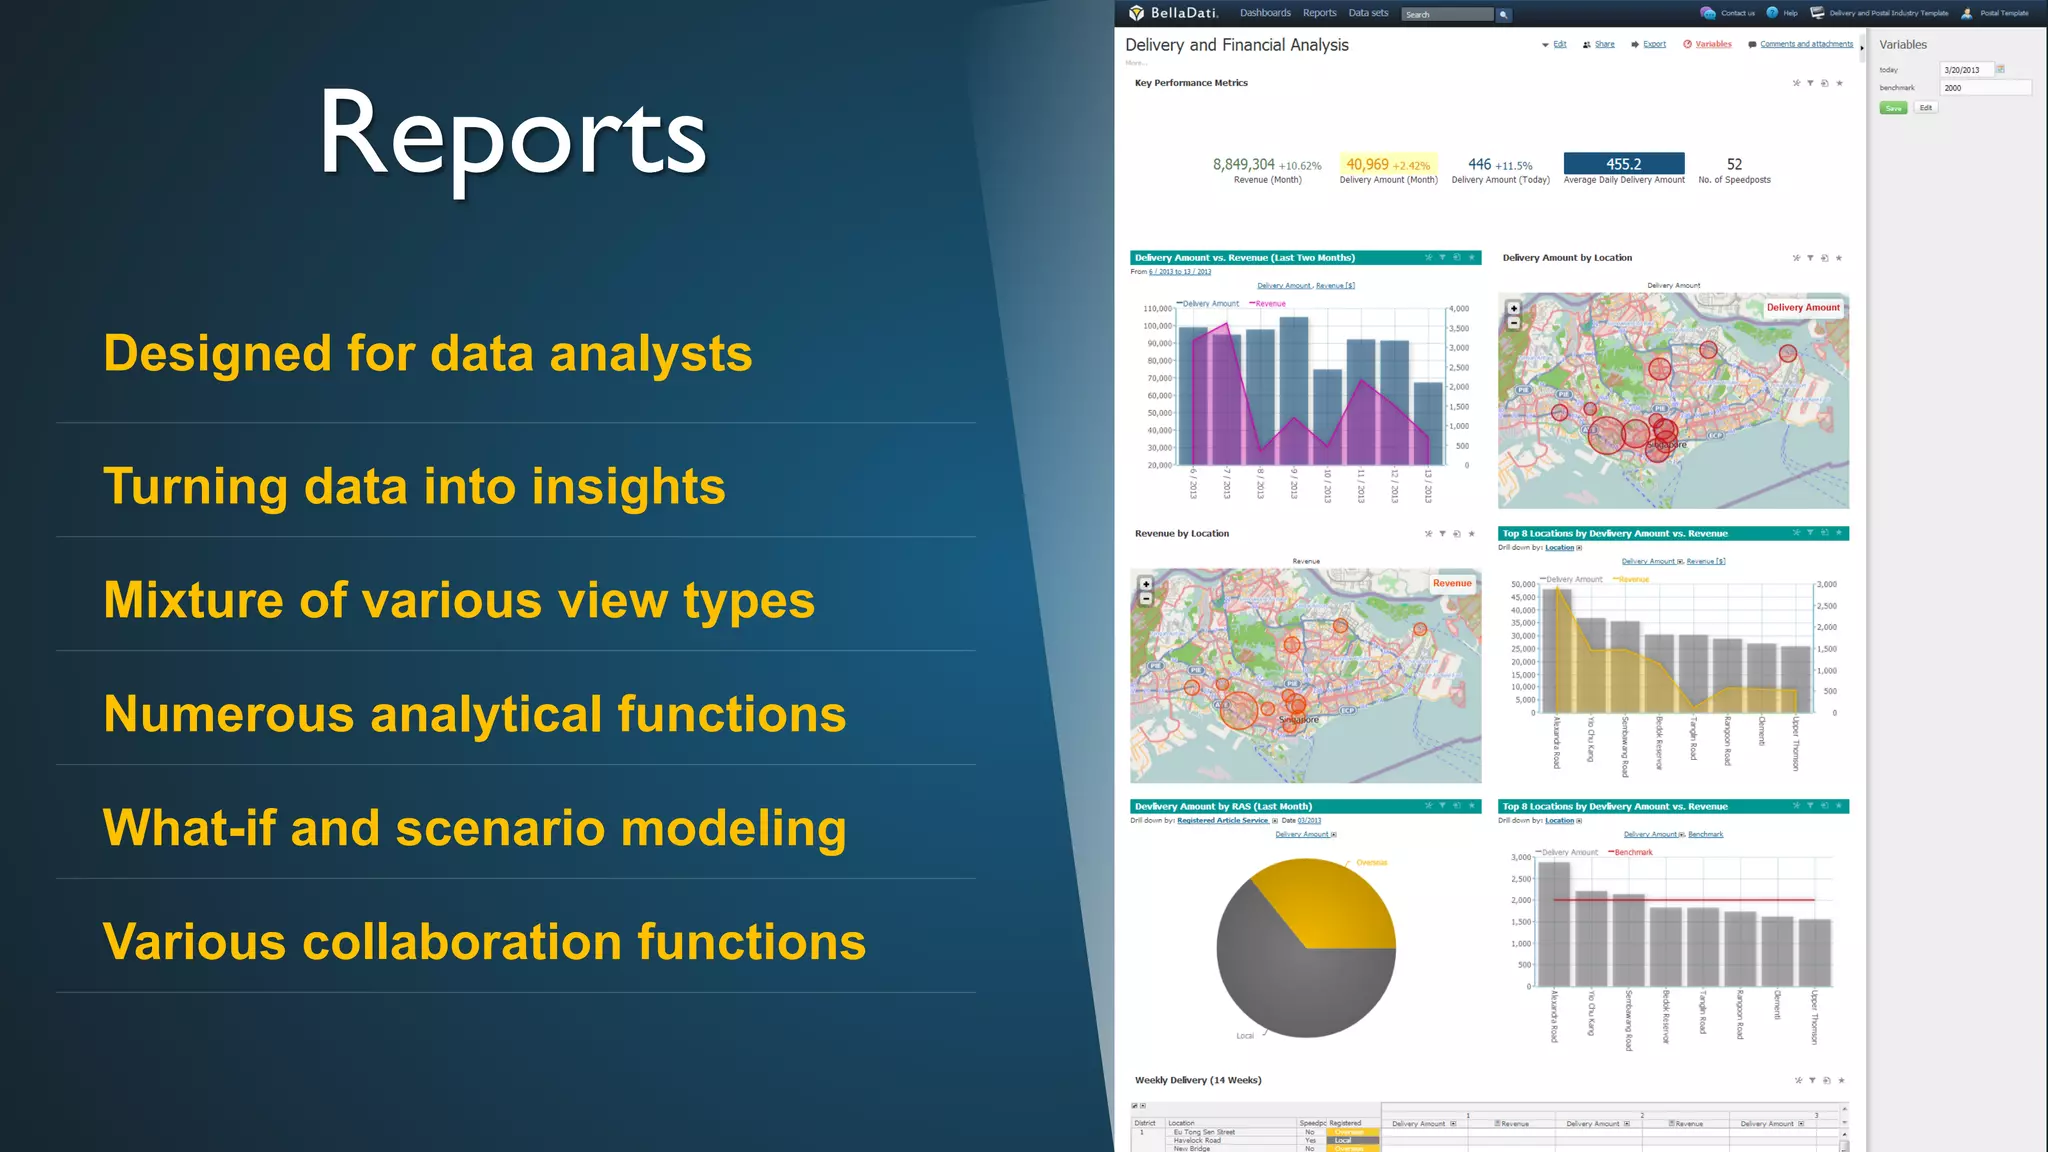

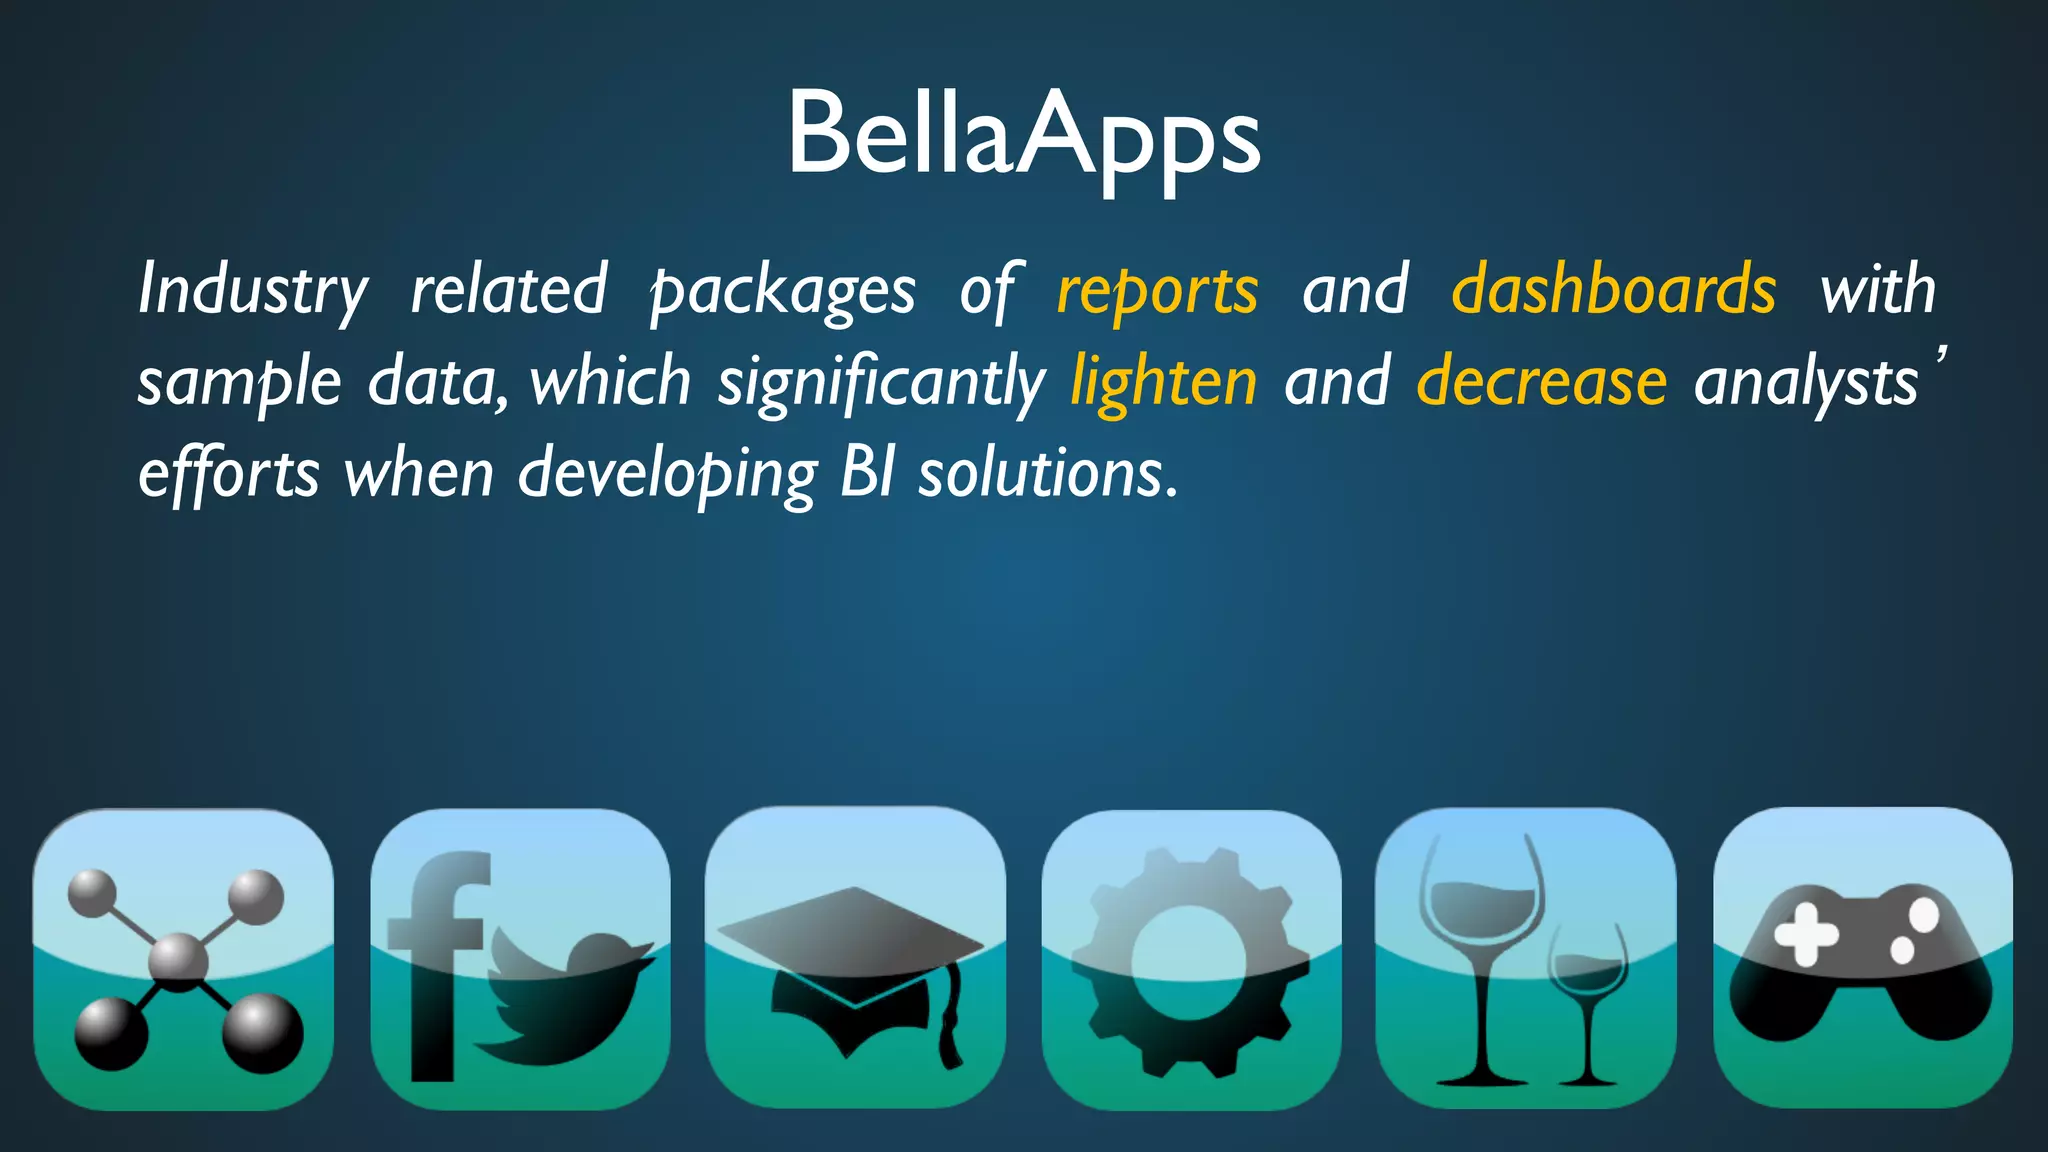
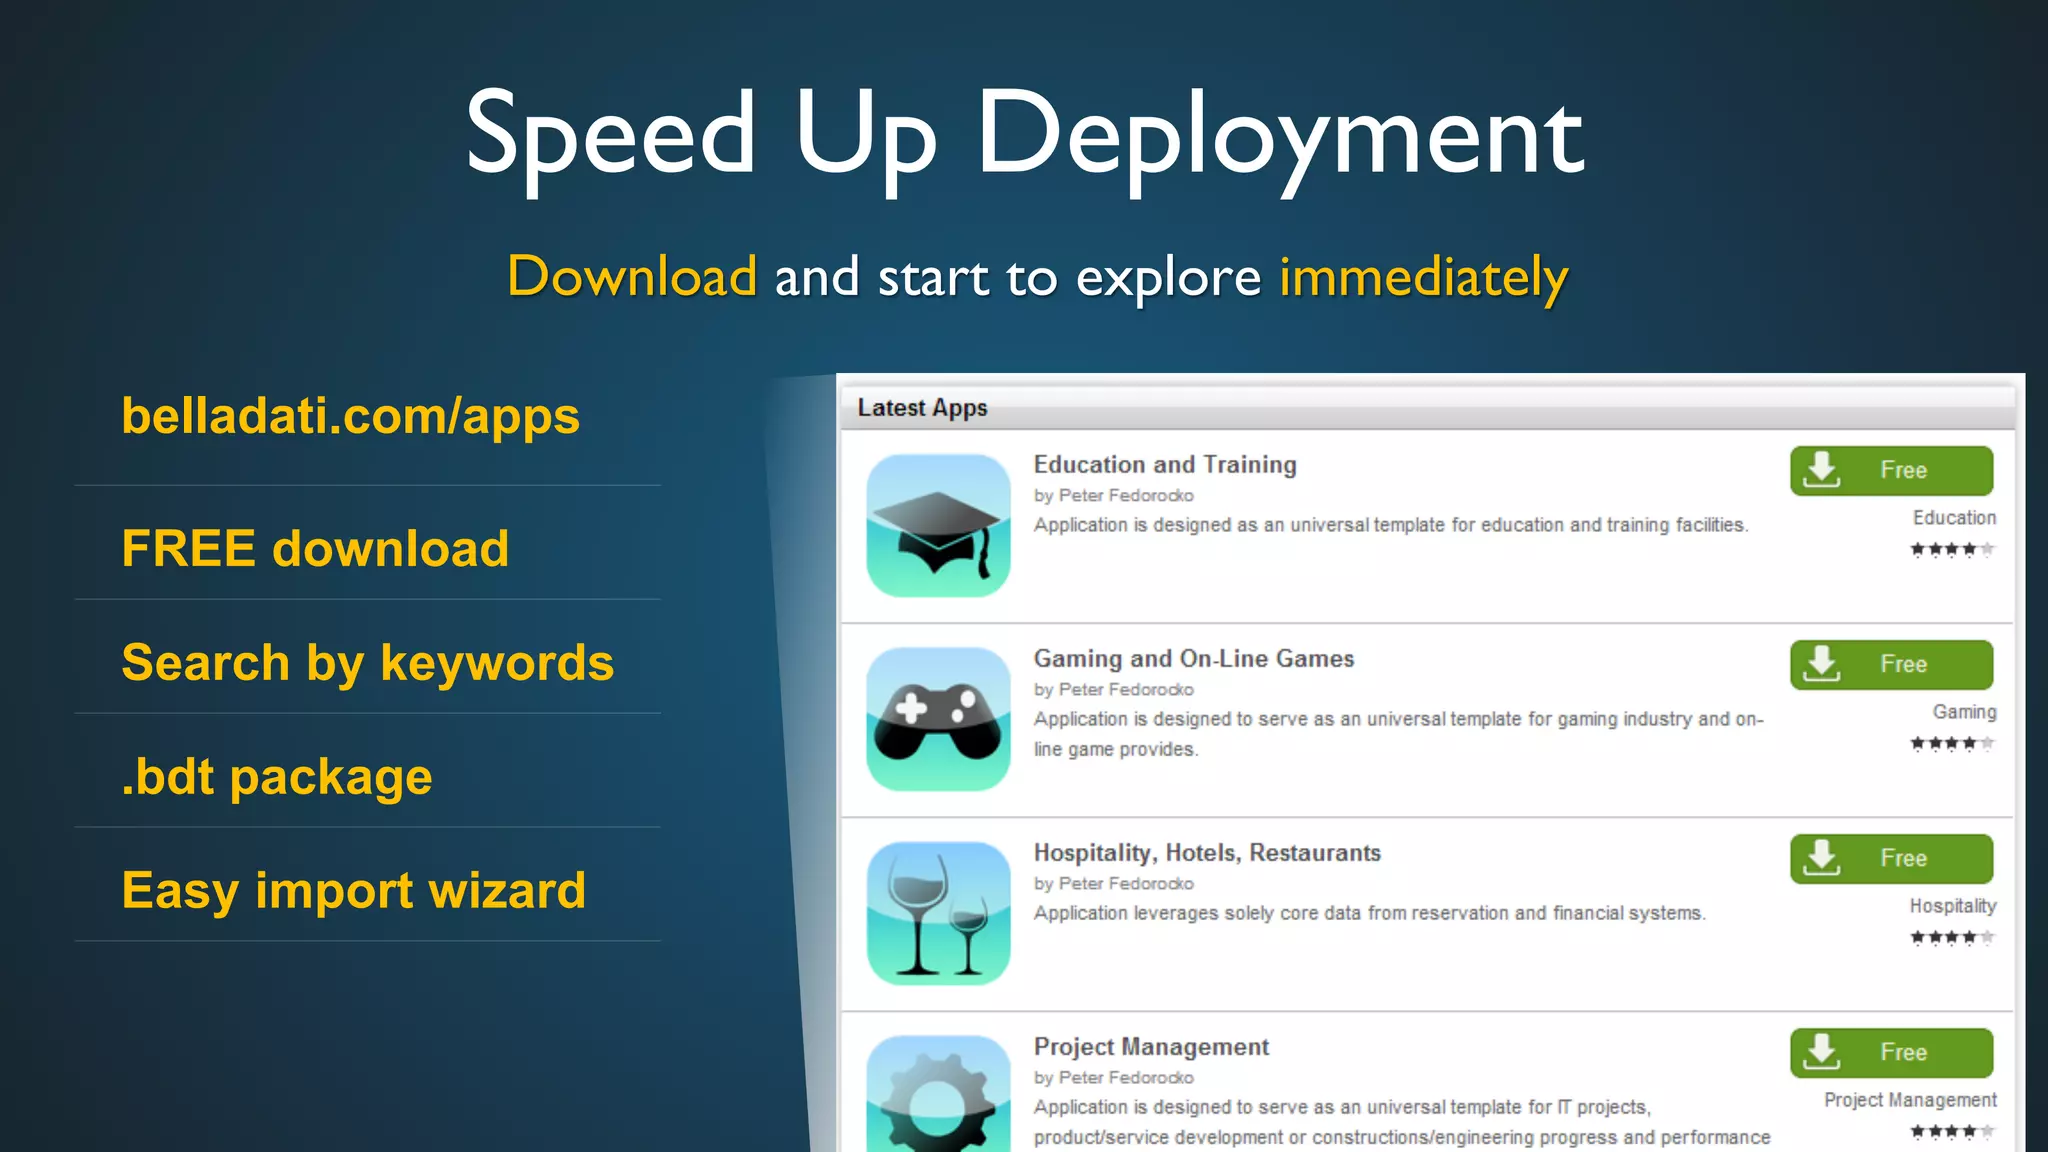
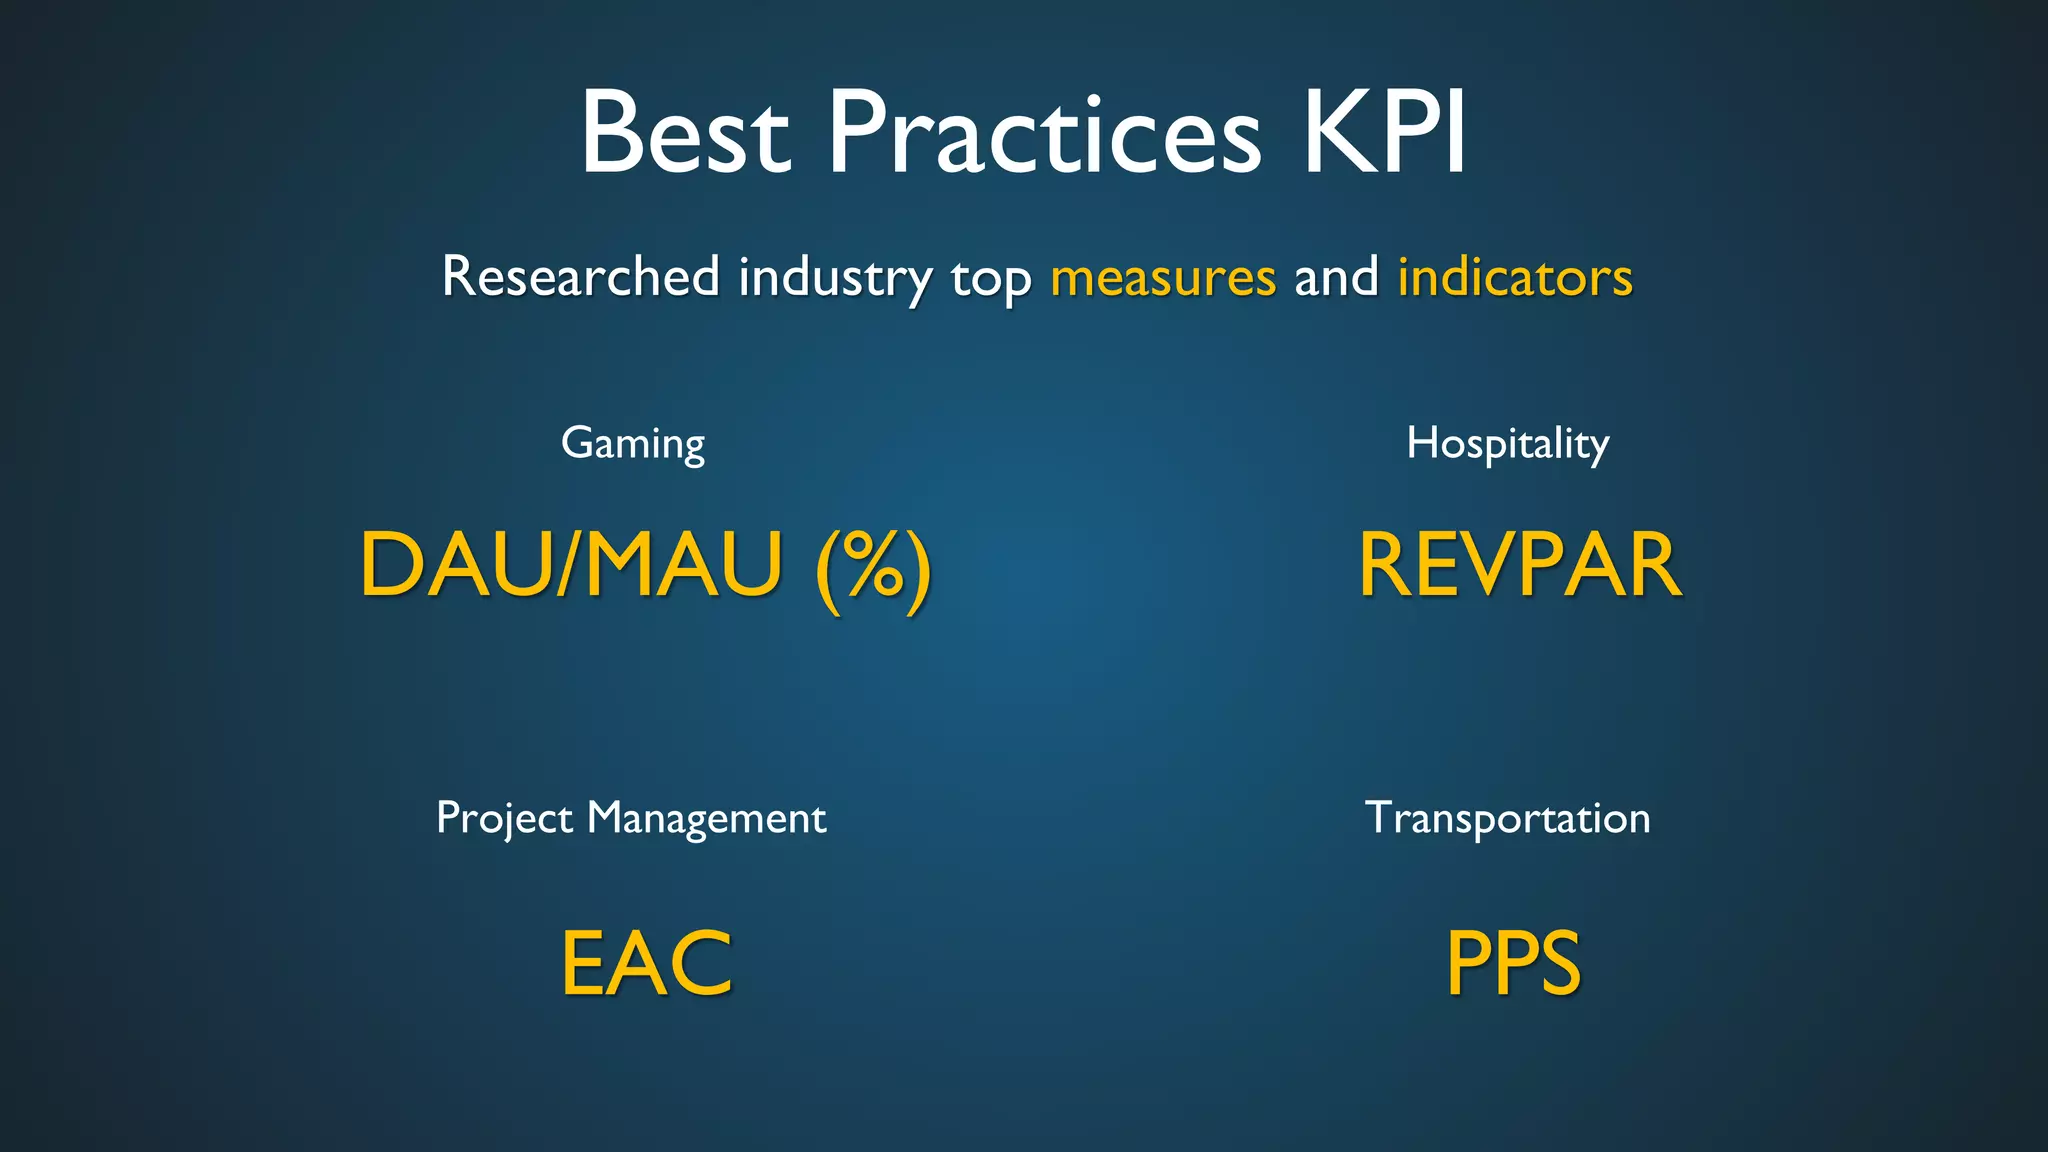

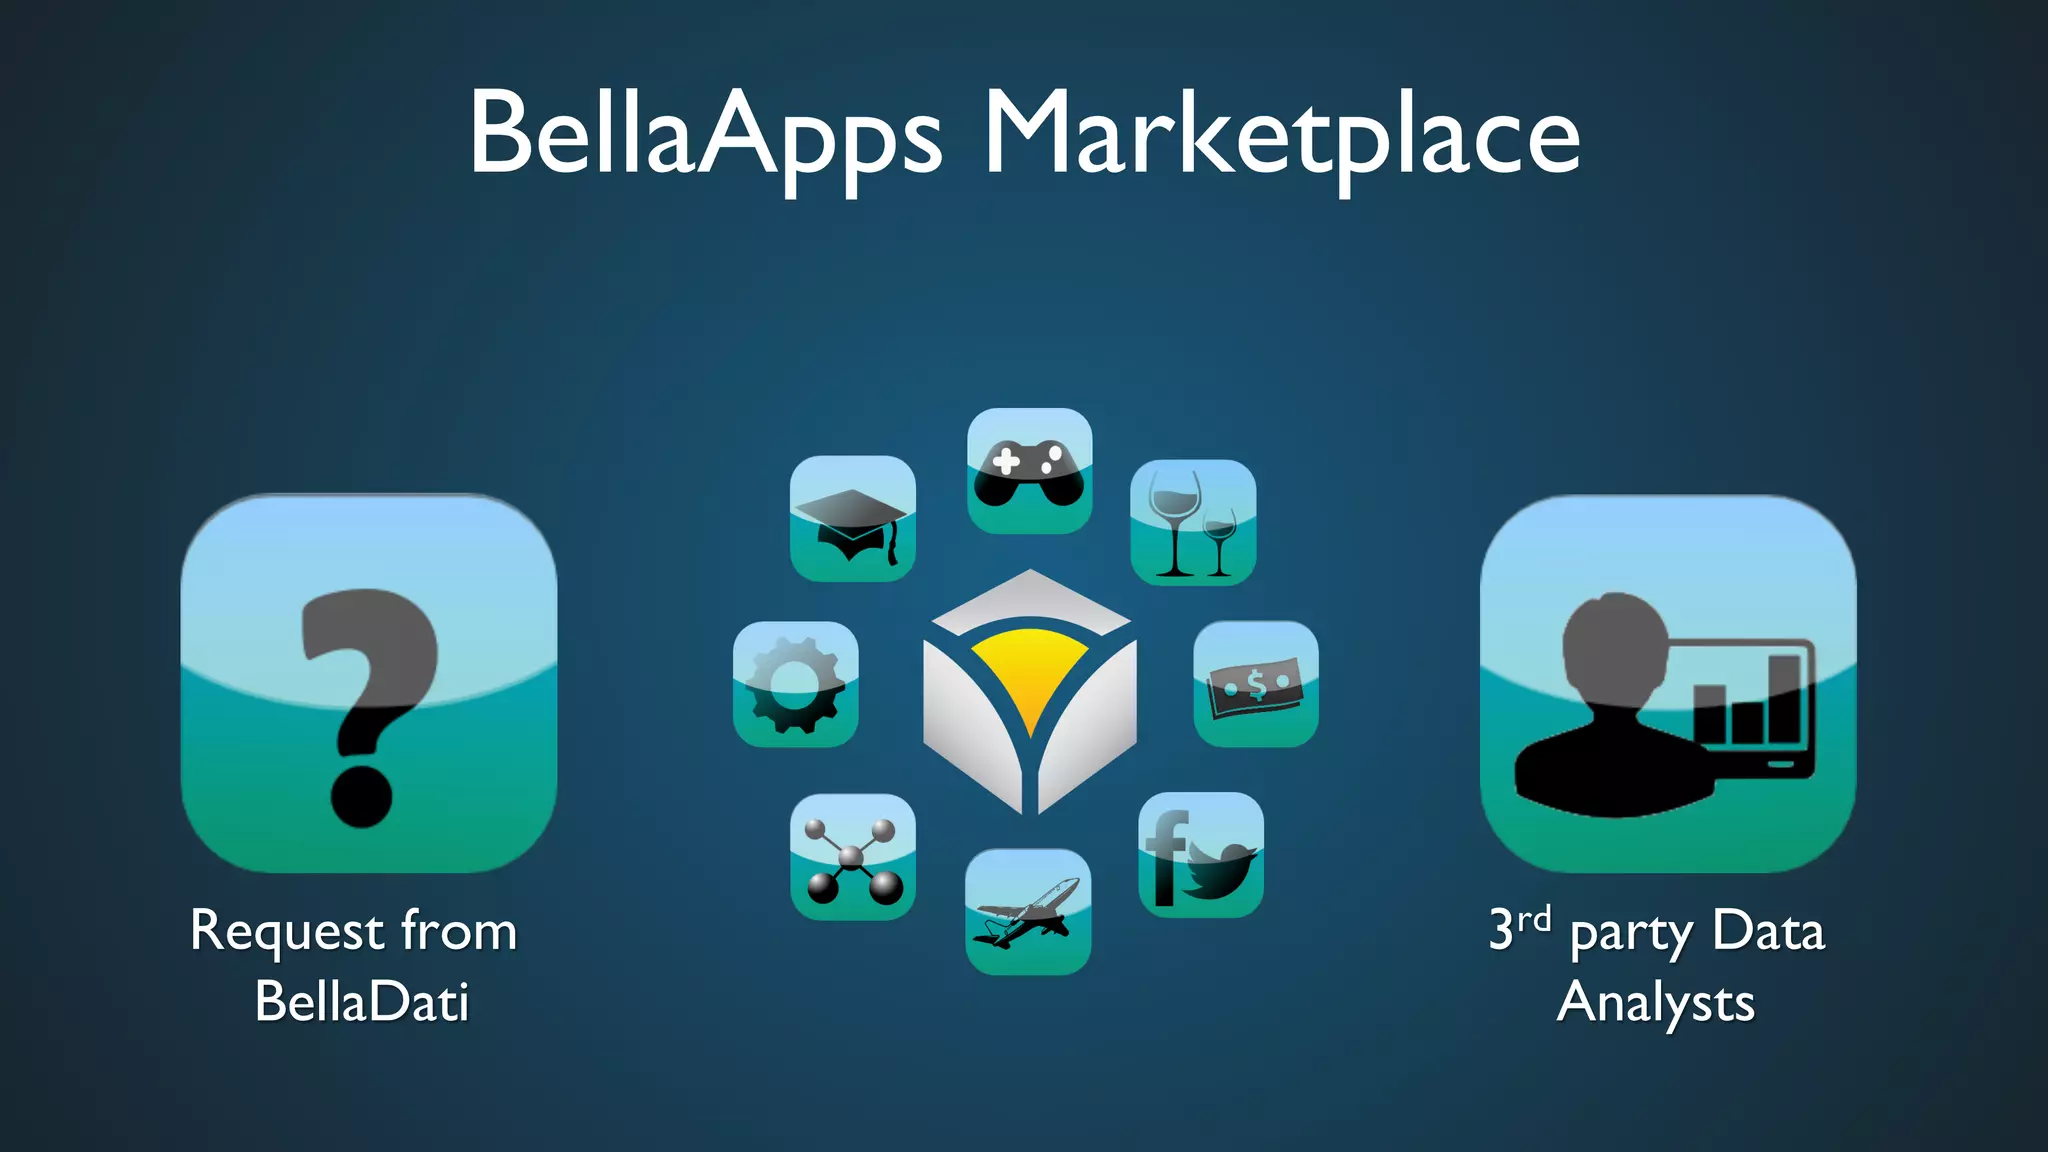
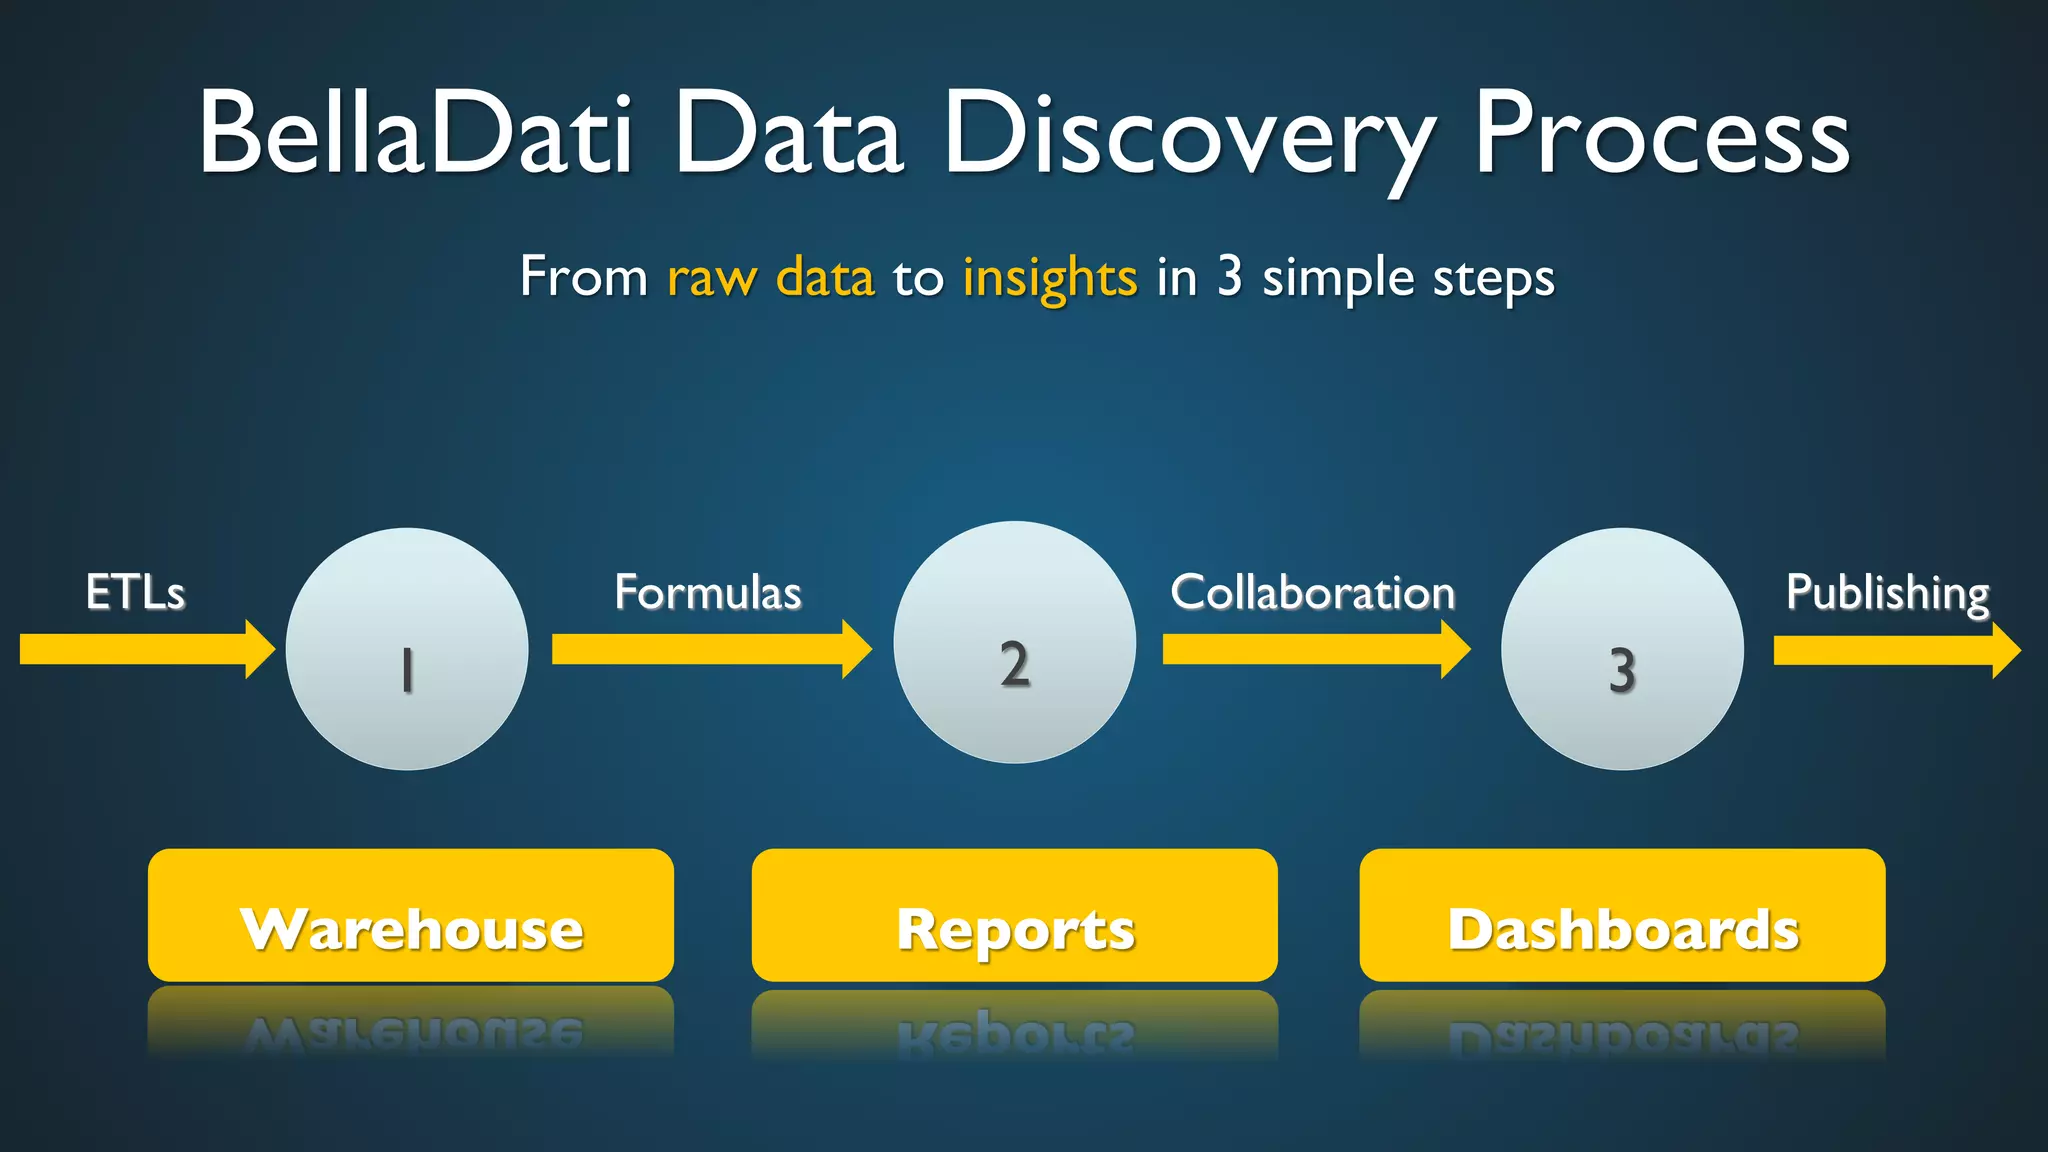
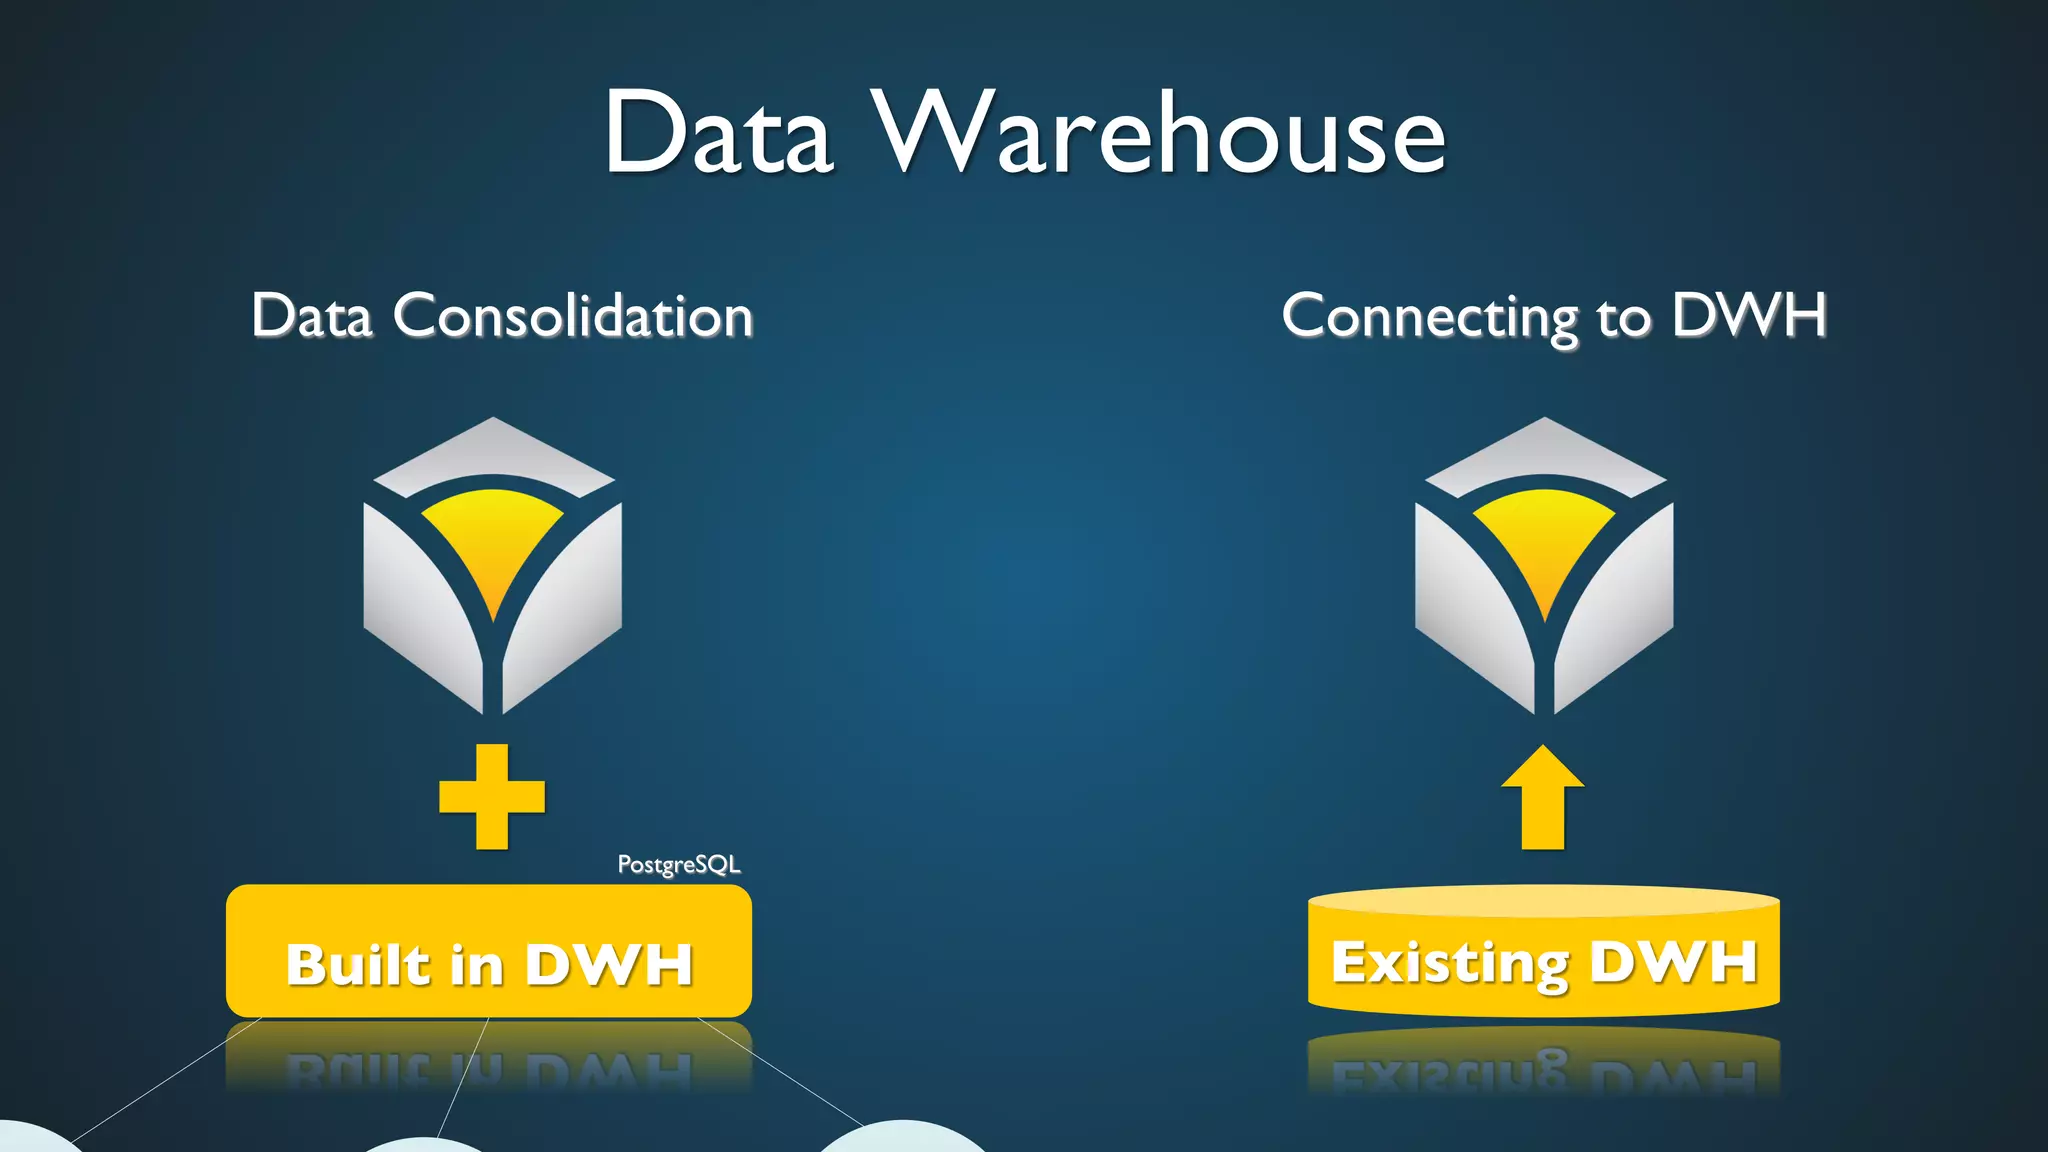
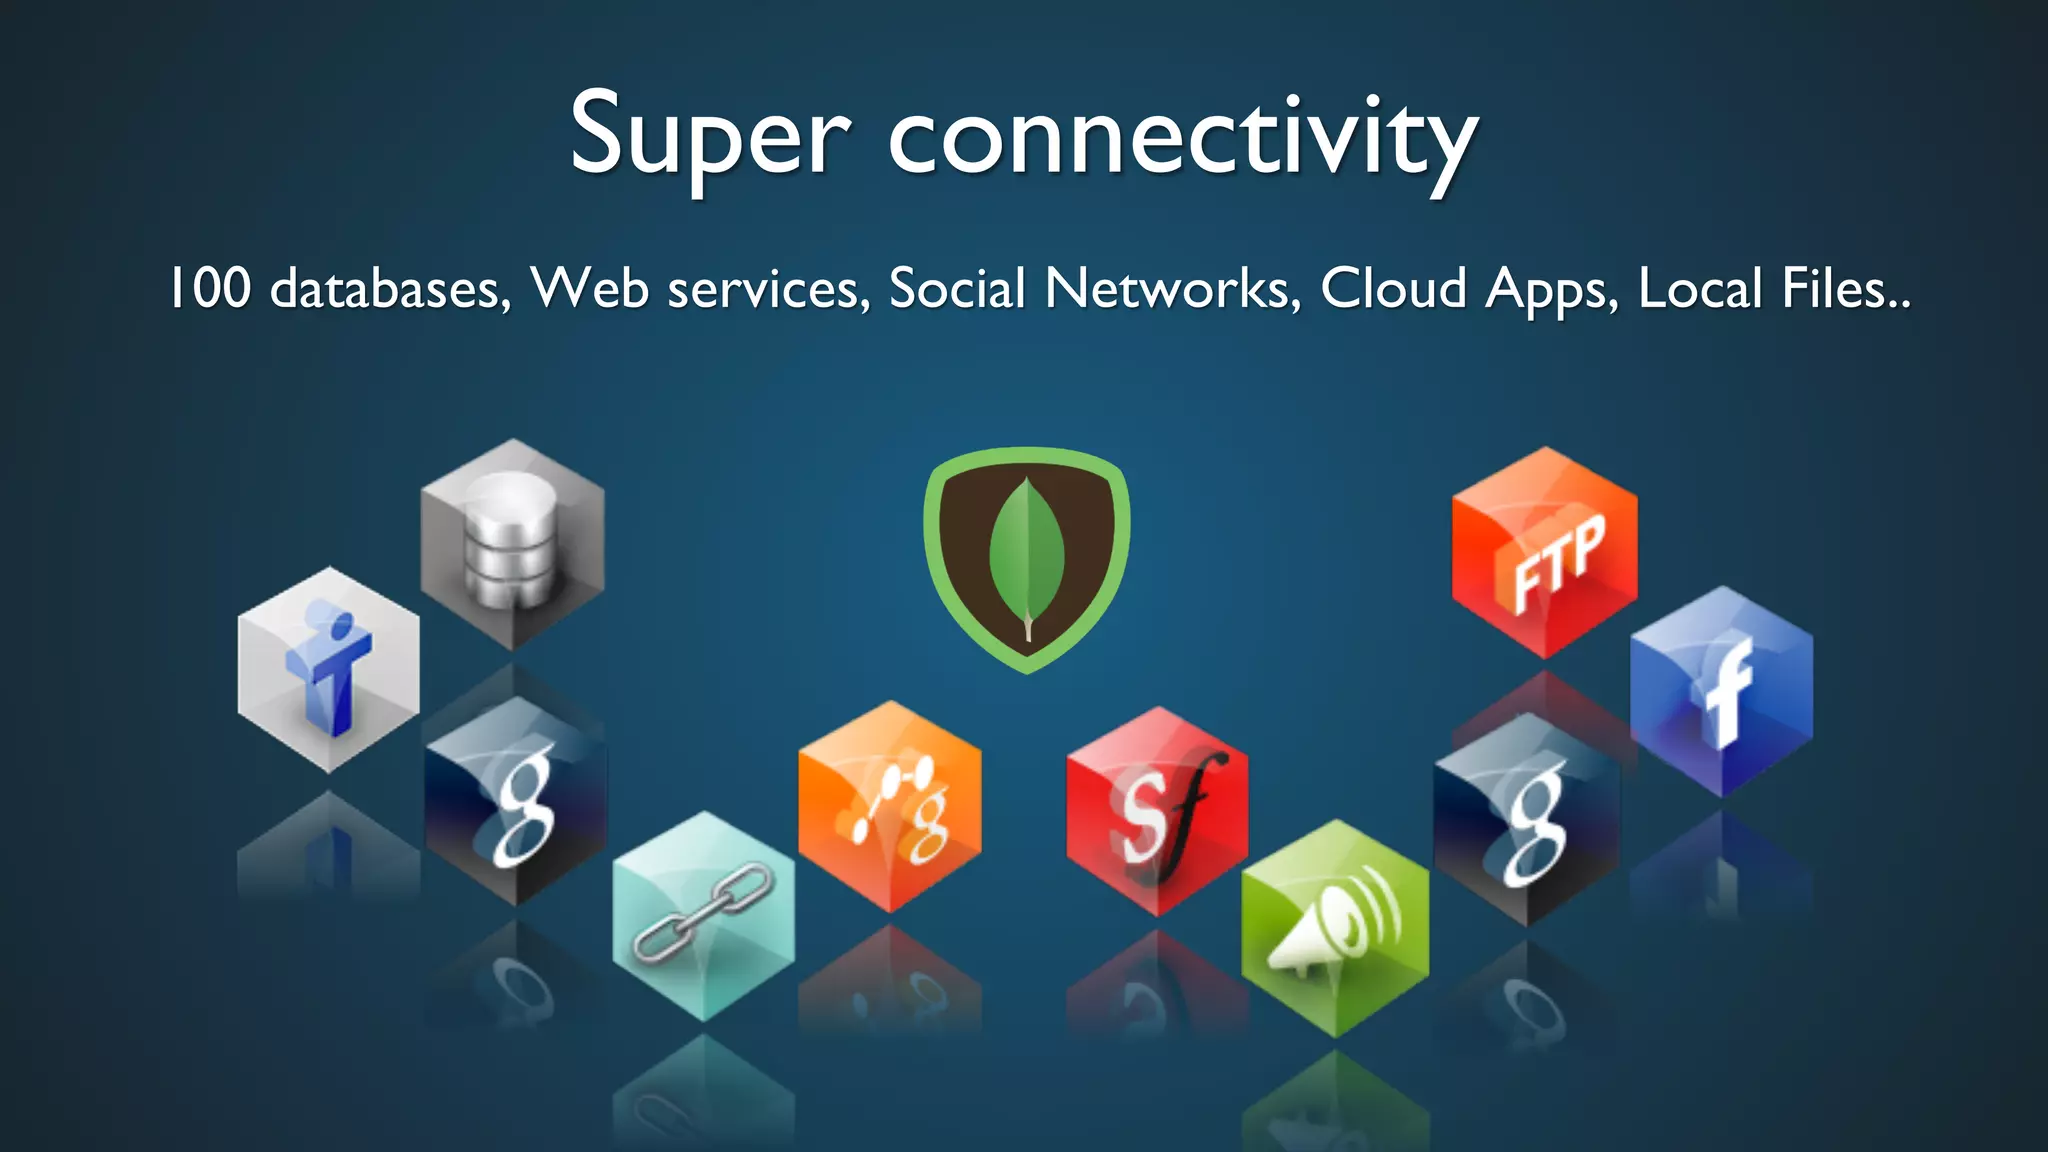

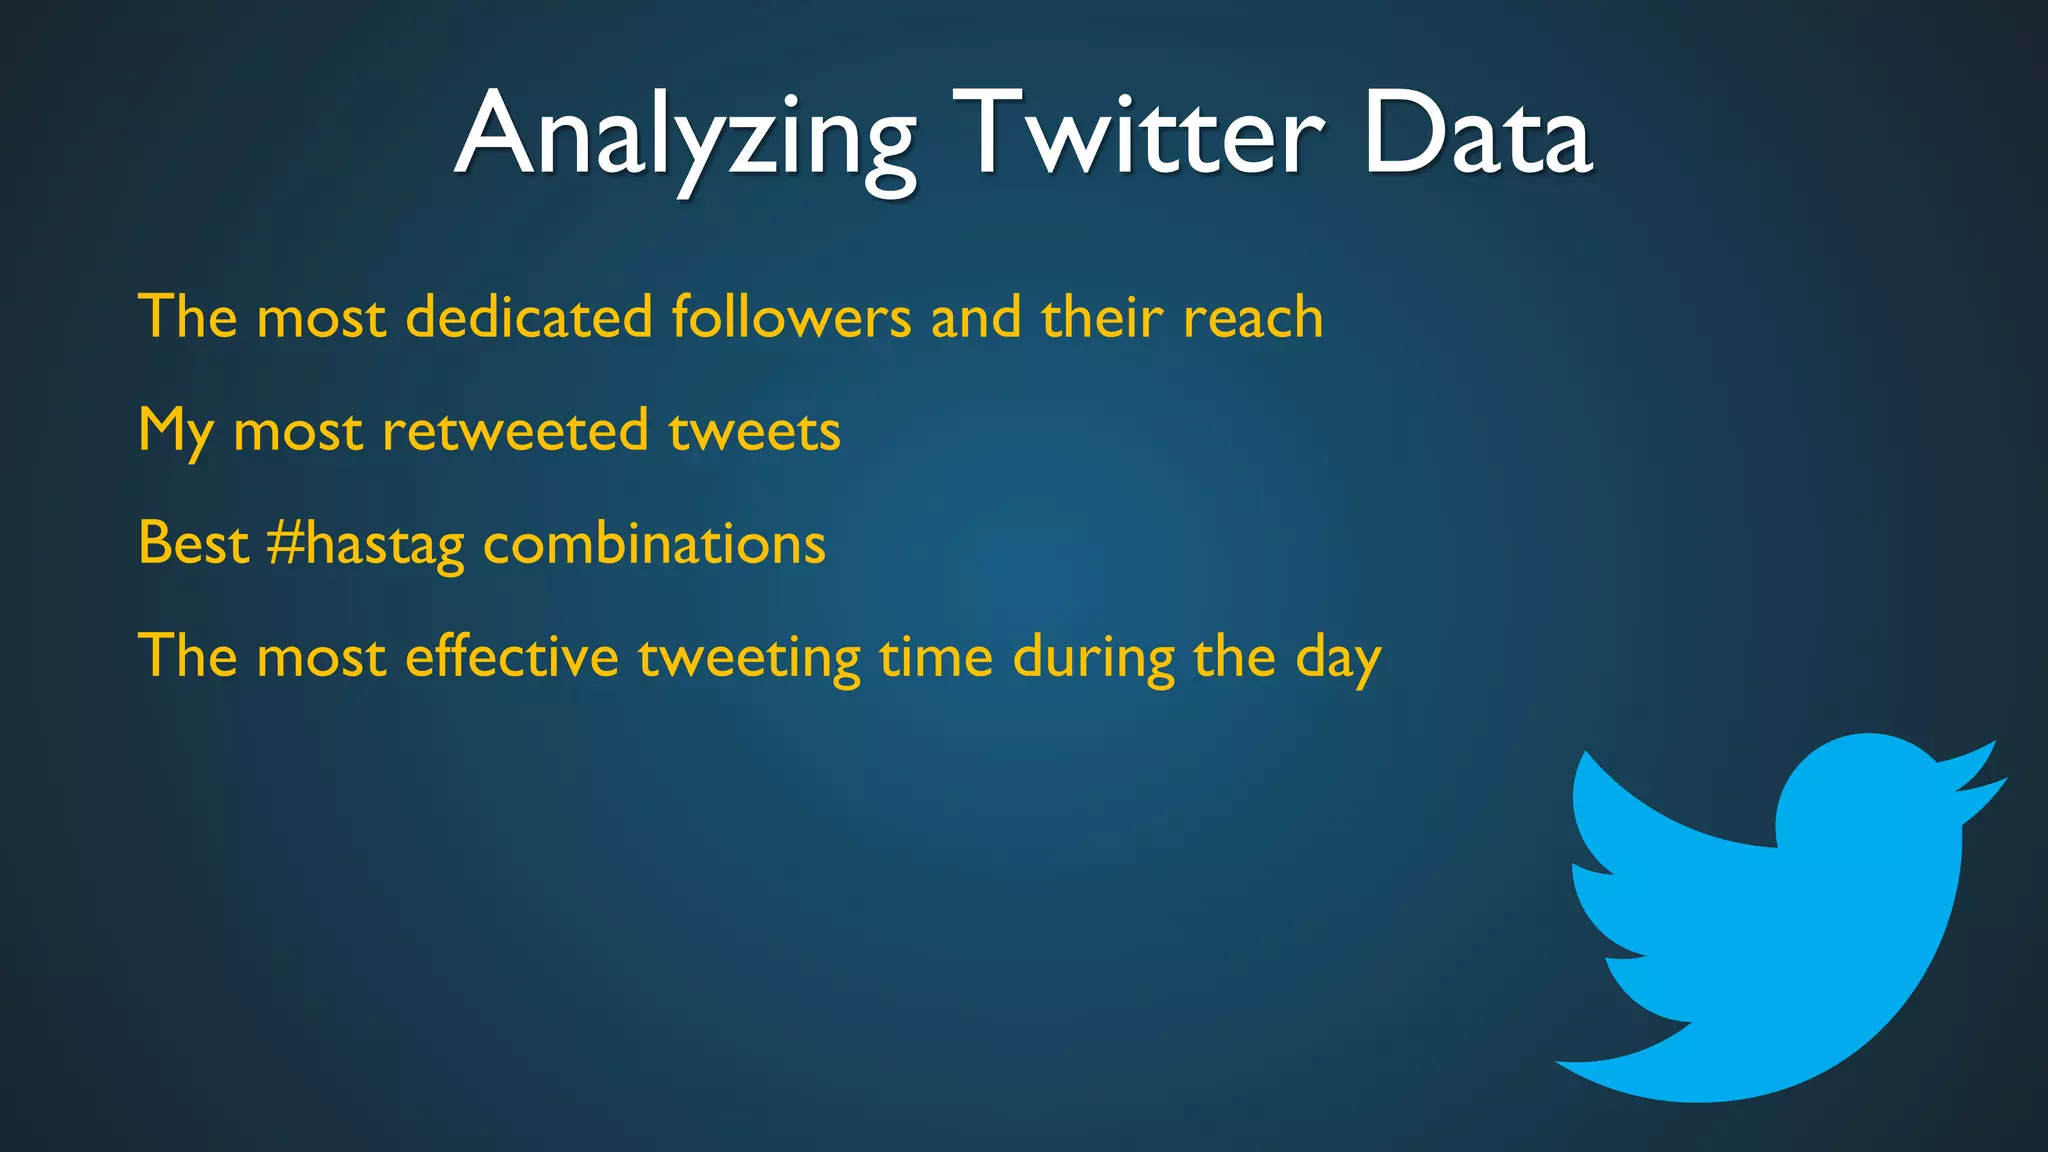
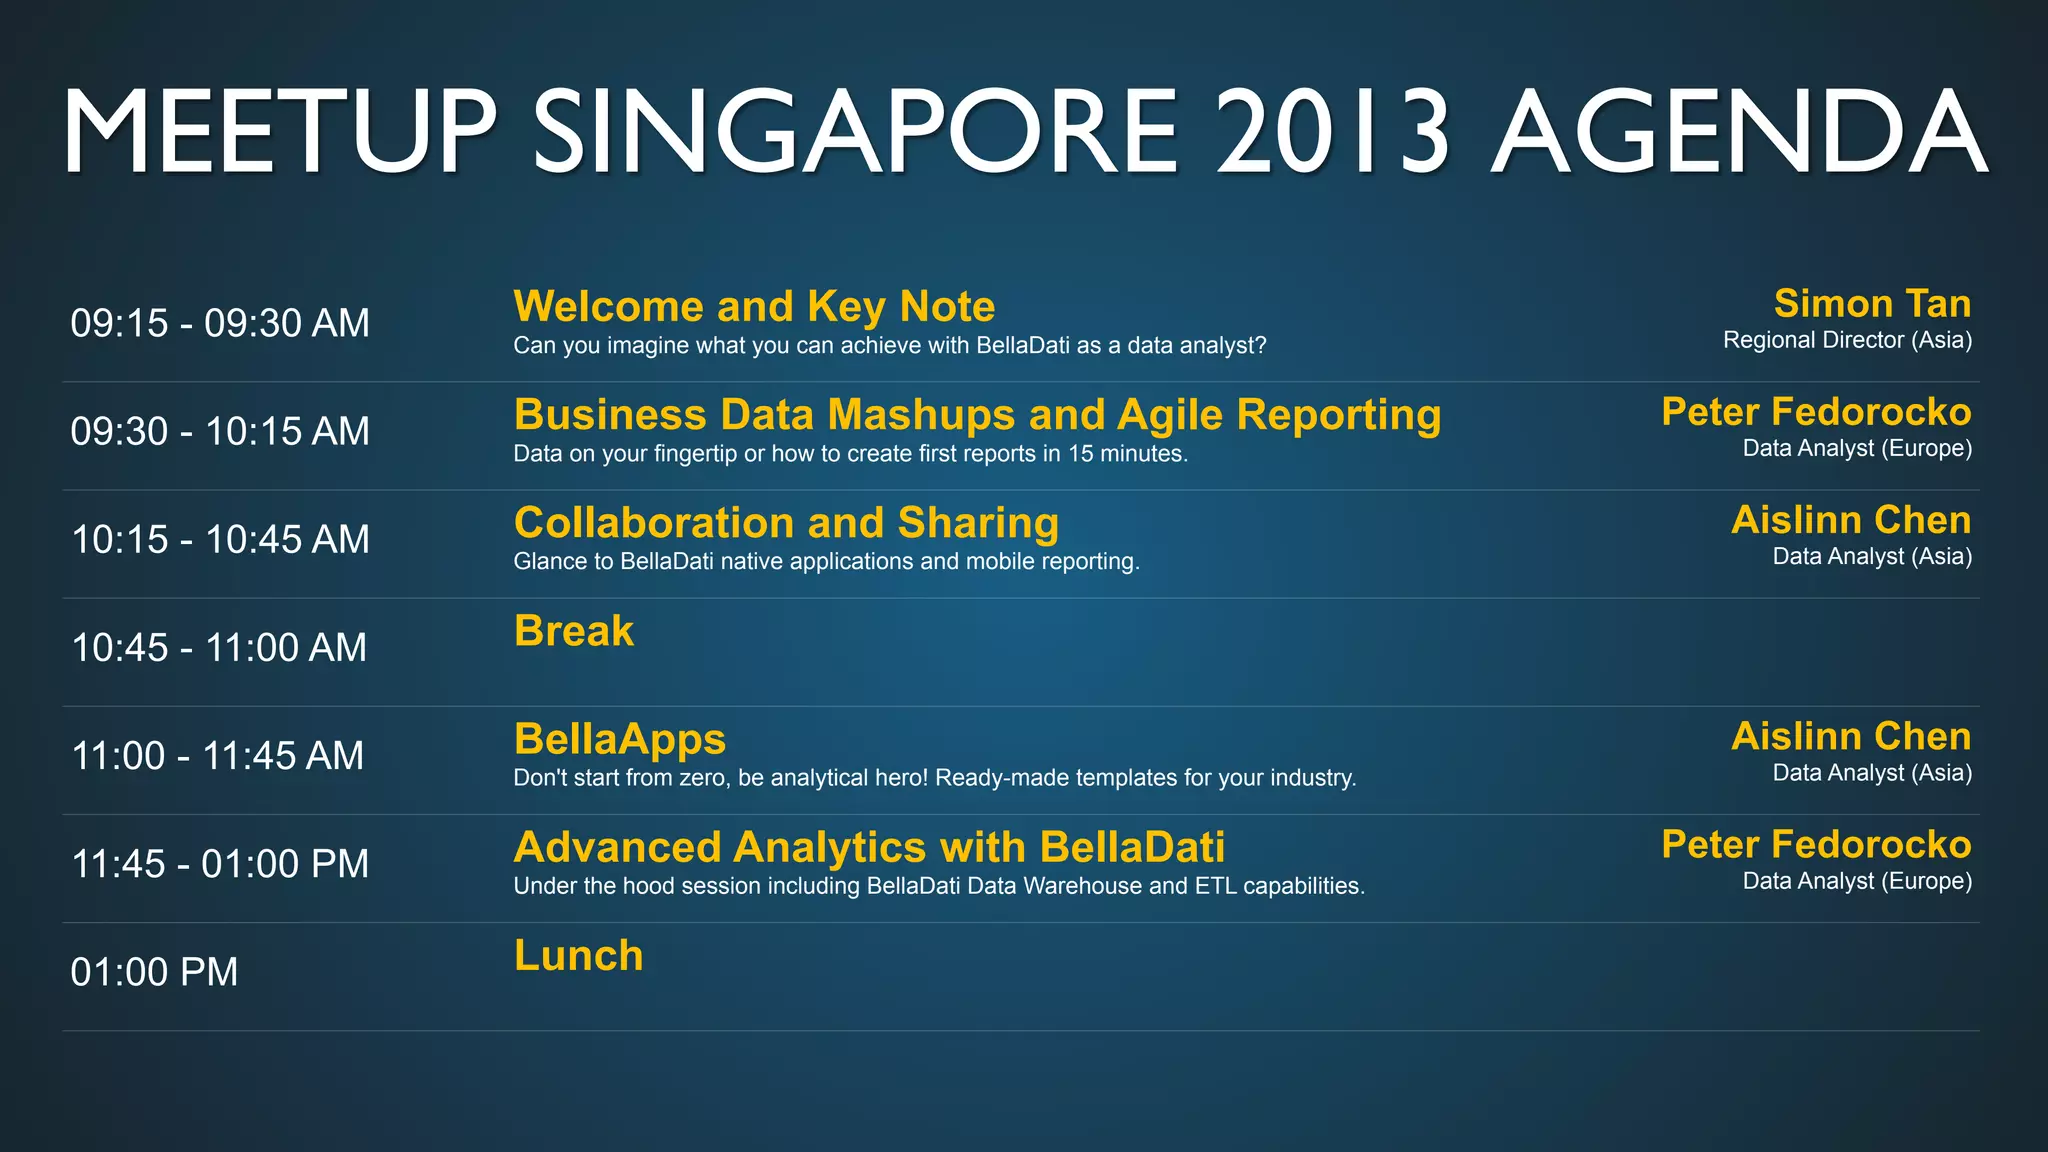

The meetup agenda outlines presentations on using BellaDati's agile analytics and reporting tool. The morning sessions cover creating quick reports, collaboration features, and industry-specific app templates. The afternoon advanced analytics session with Peter Fedorocko highlights BellaDati's integrated data warehouse, ETL scripts, and capabilities for analyzing Twitter, MongoDB, and other data sources.


![UiPath Automation Suite Installation (Hands-On) [2/3]](https://cdn.slidesharecdn.com/ss_thumbnails/automationsuitecommunitysession2-251015095633-a6d862f1-thumbnail.jpg?width=600ounds&width=560&fit=bounds)


