Downloaded 420 times


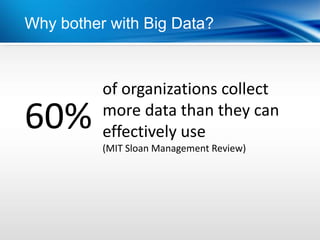

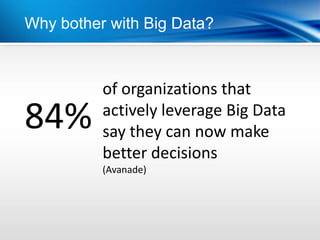


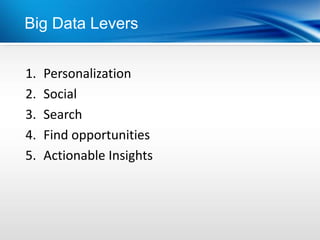

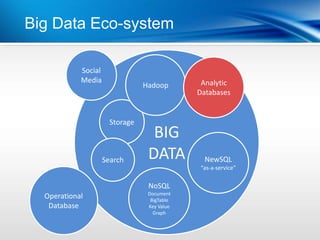
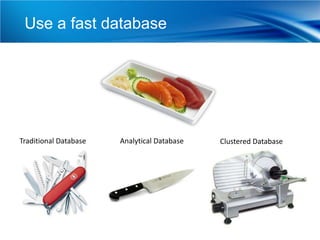


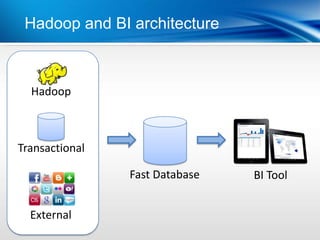

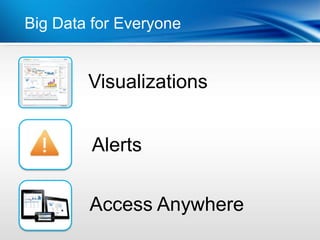
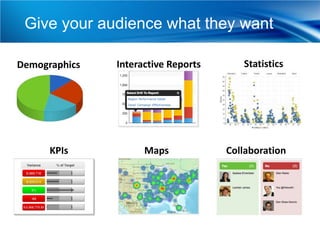

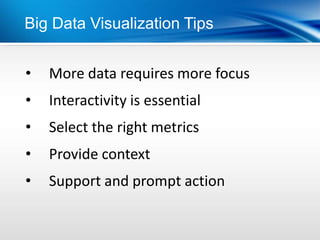


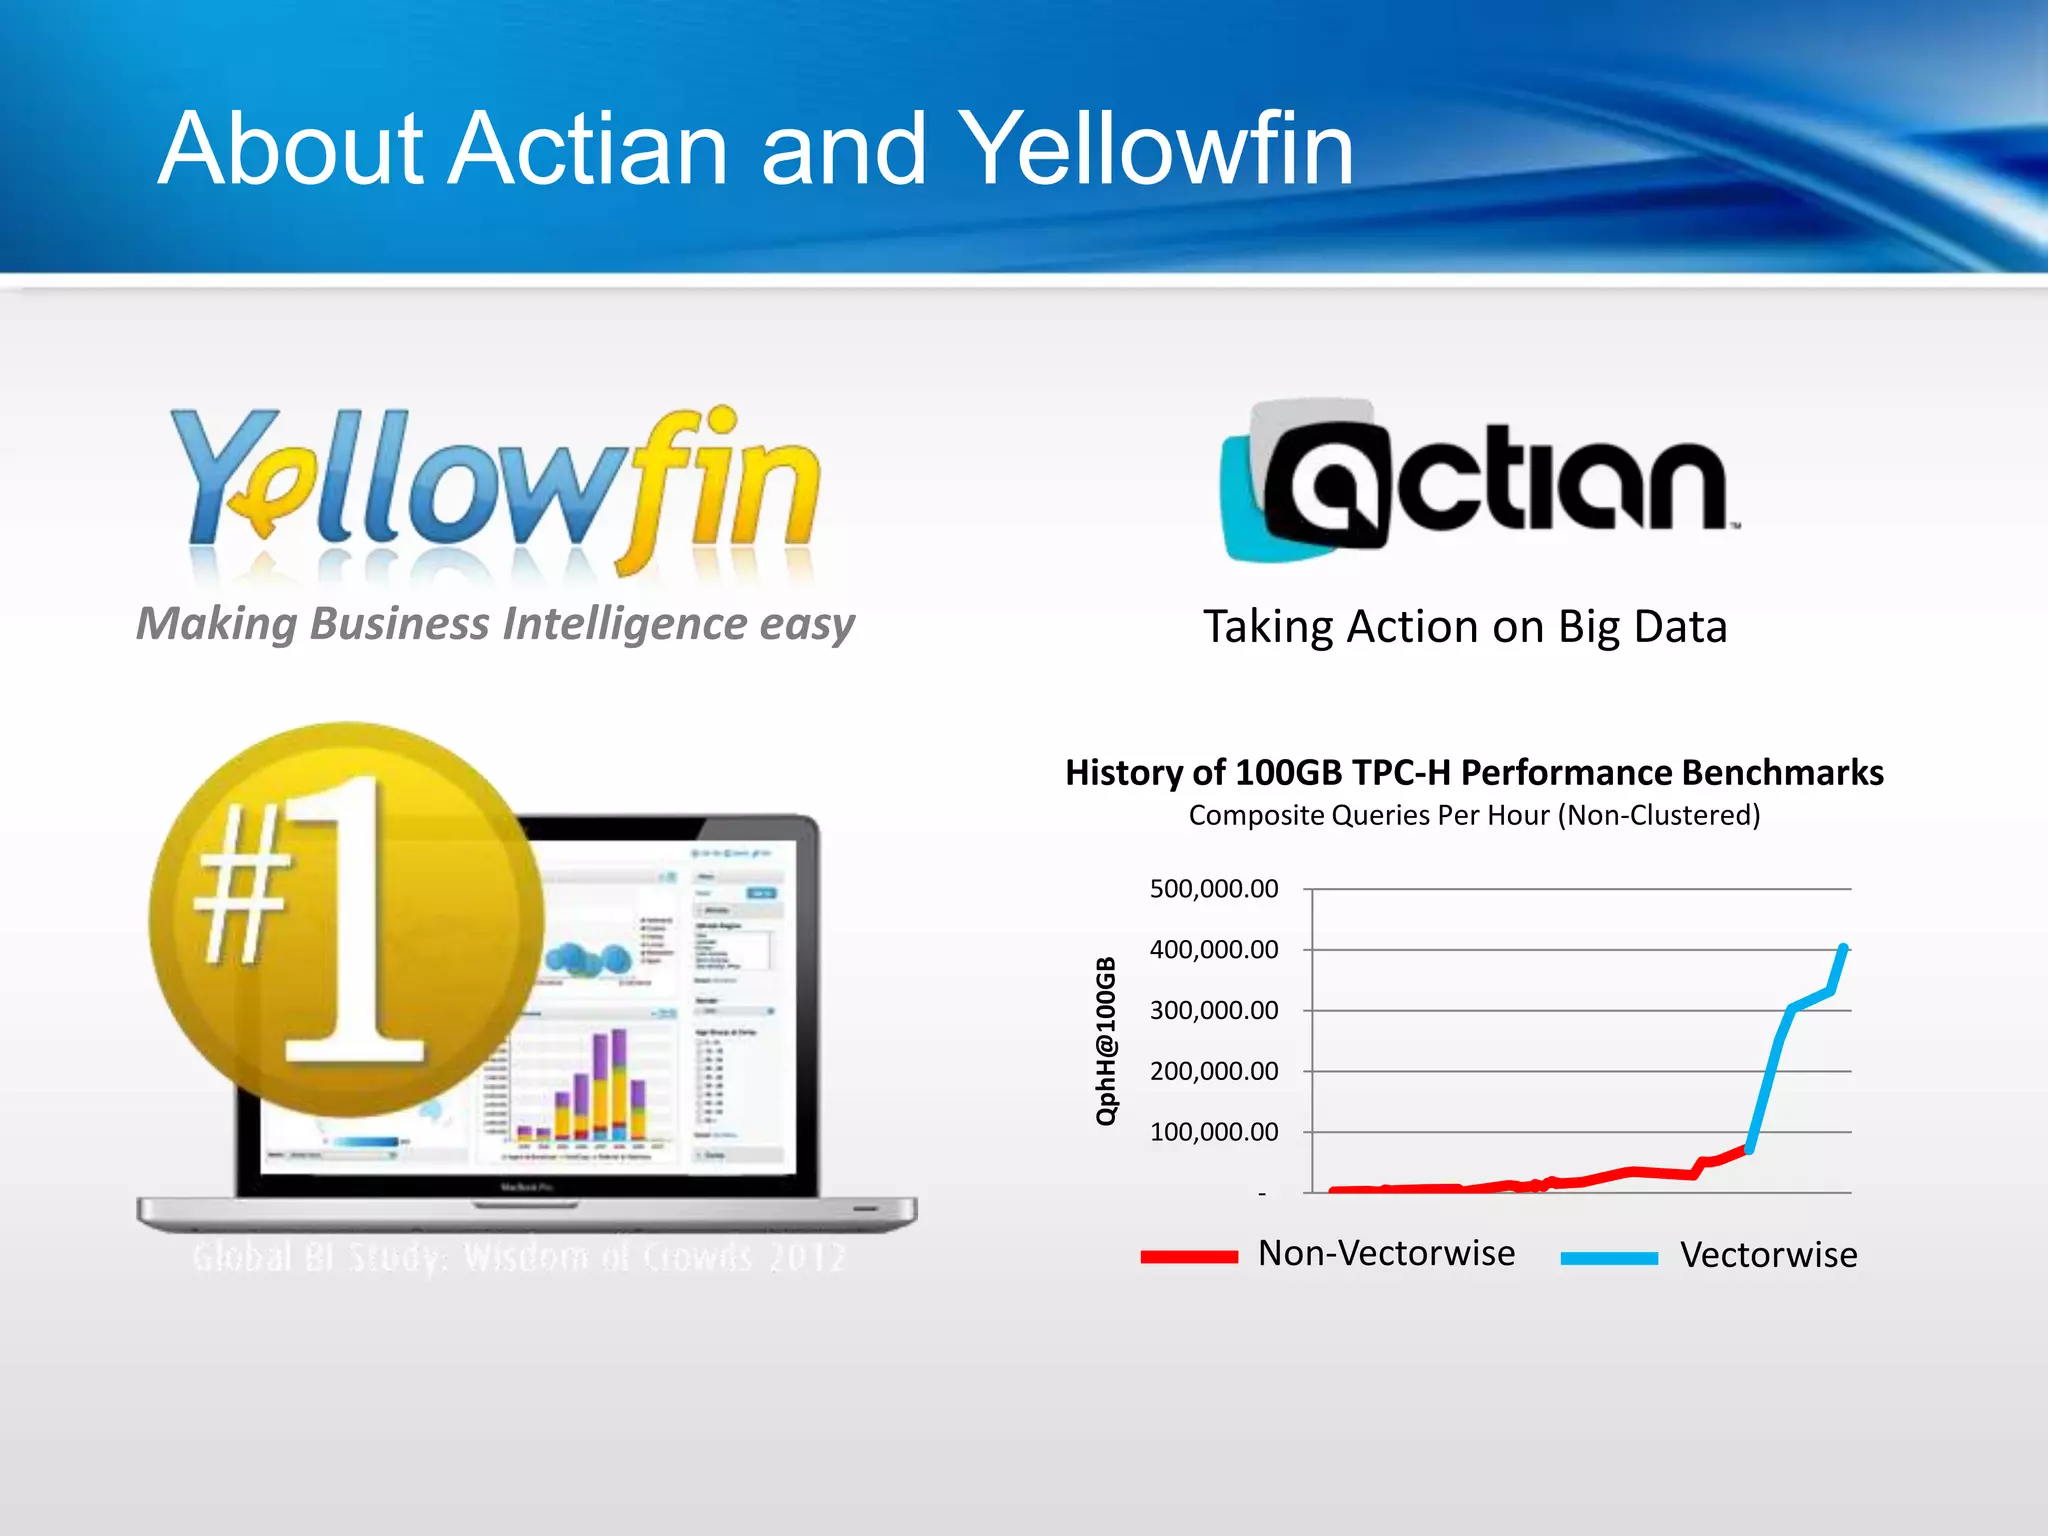


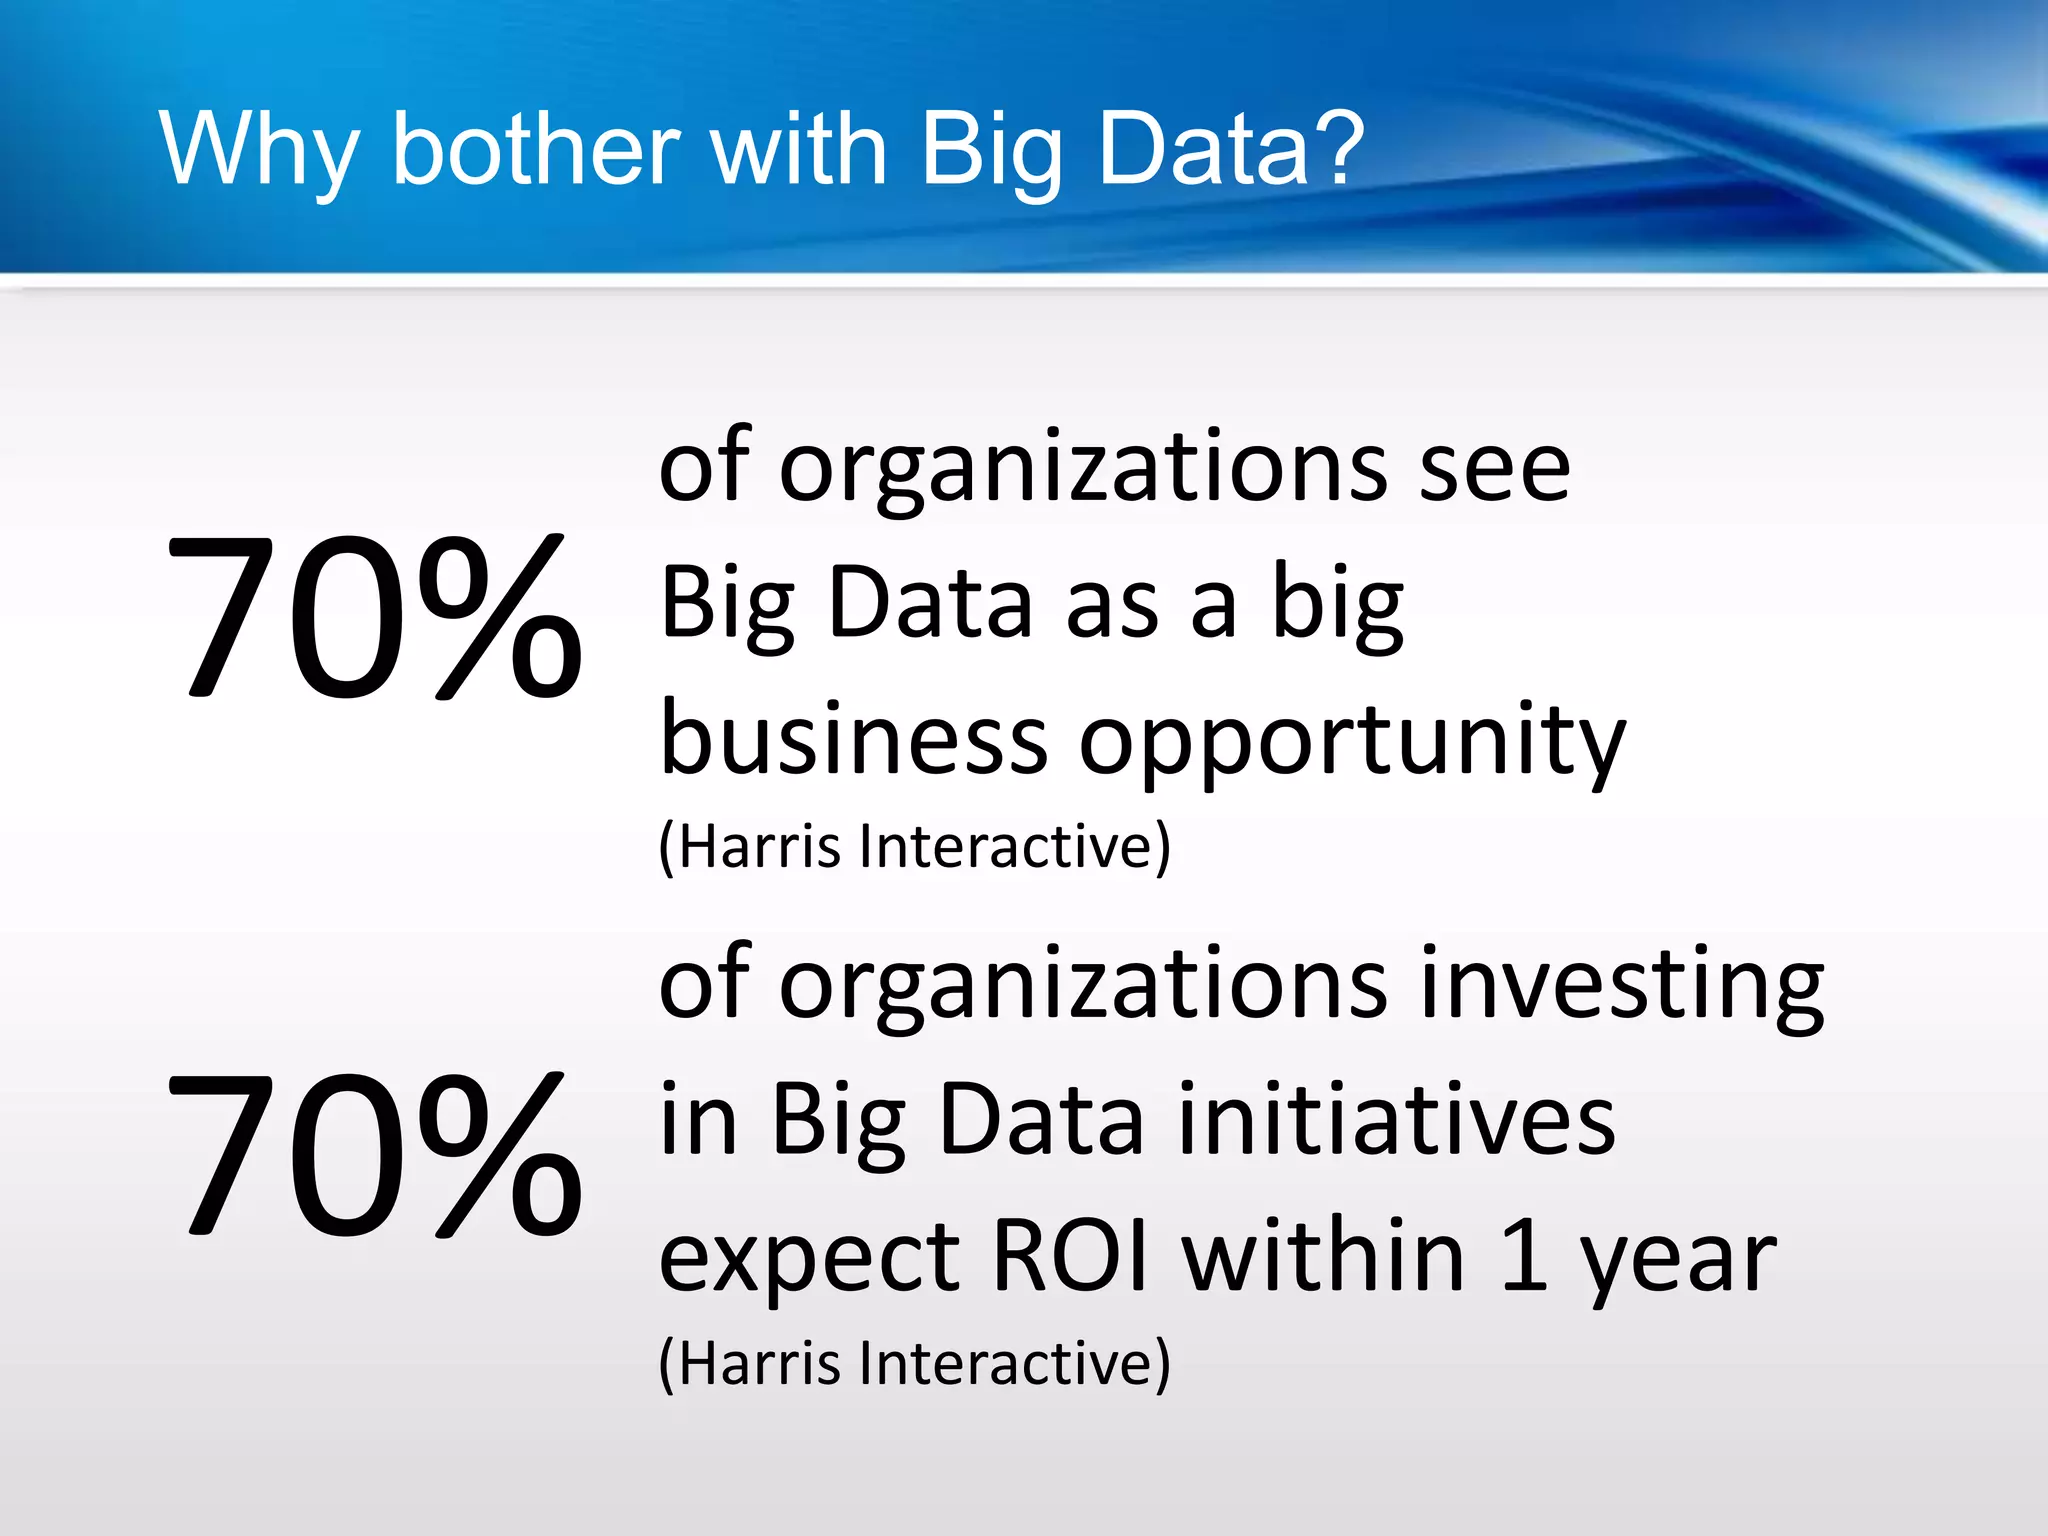
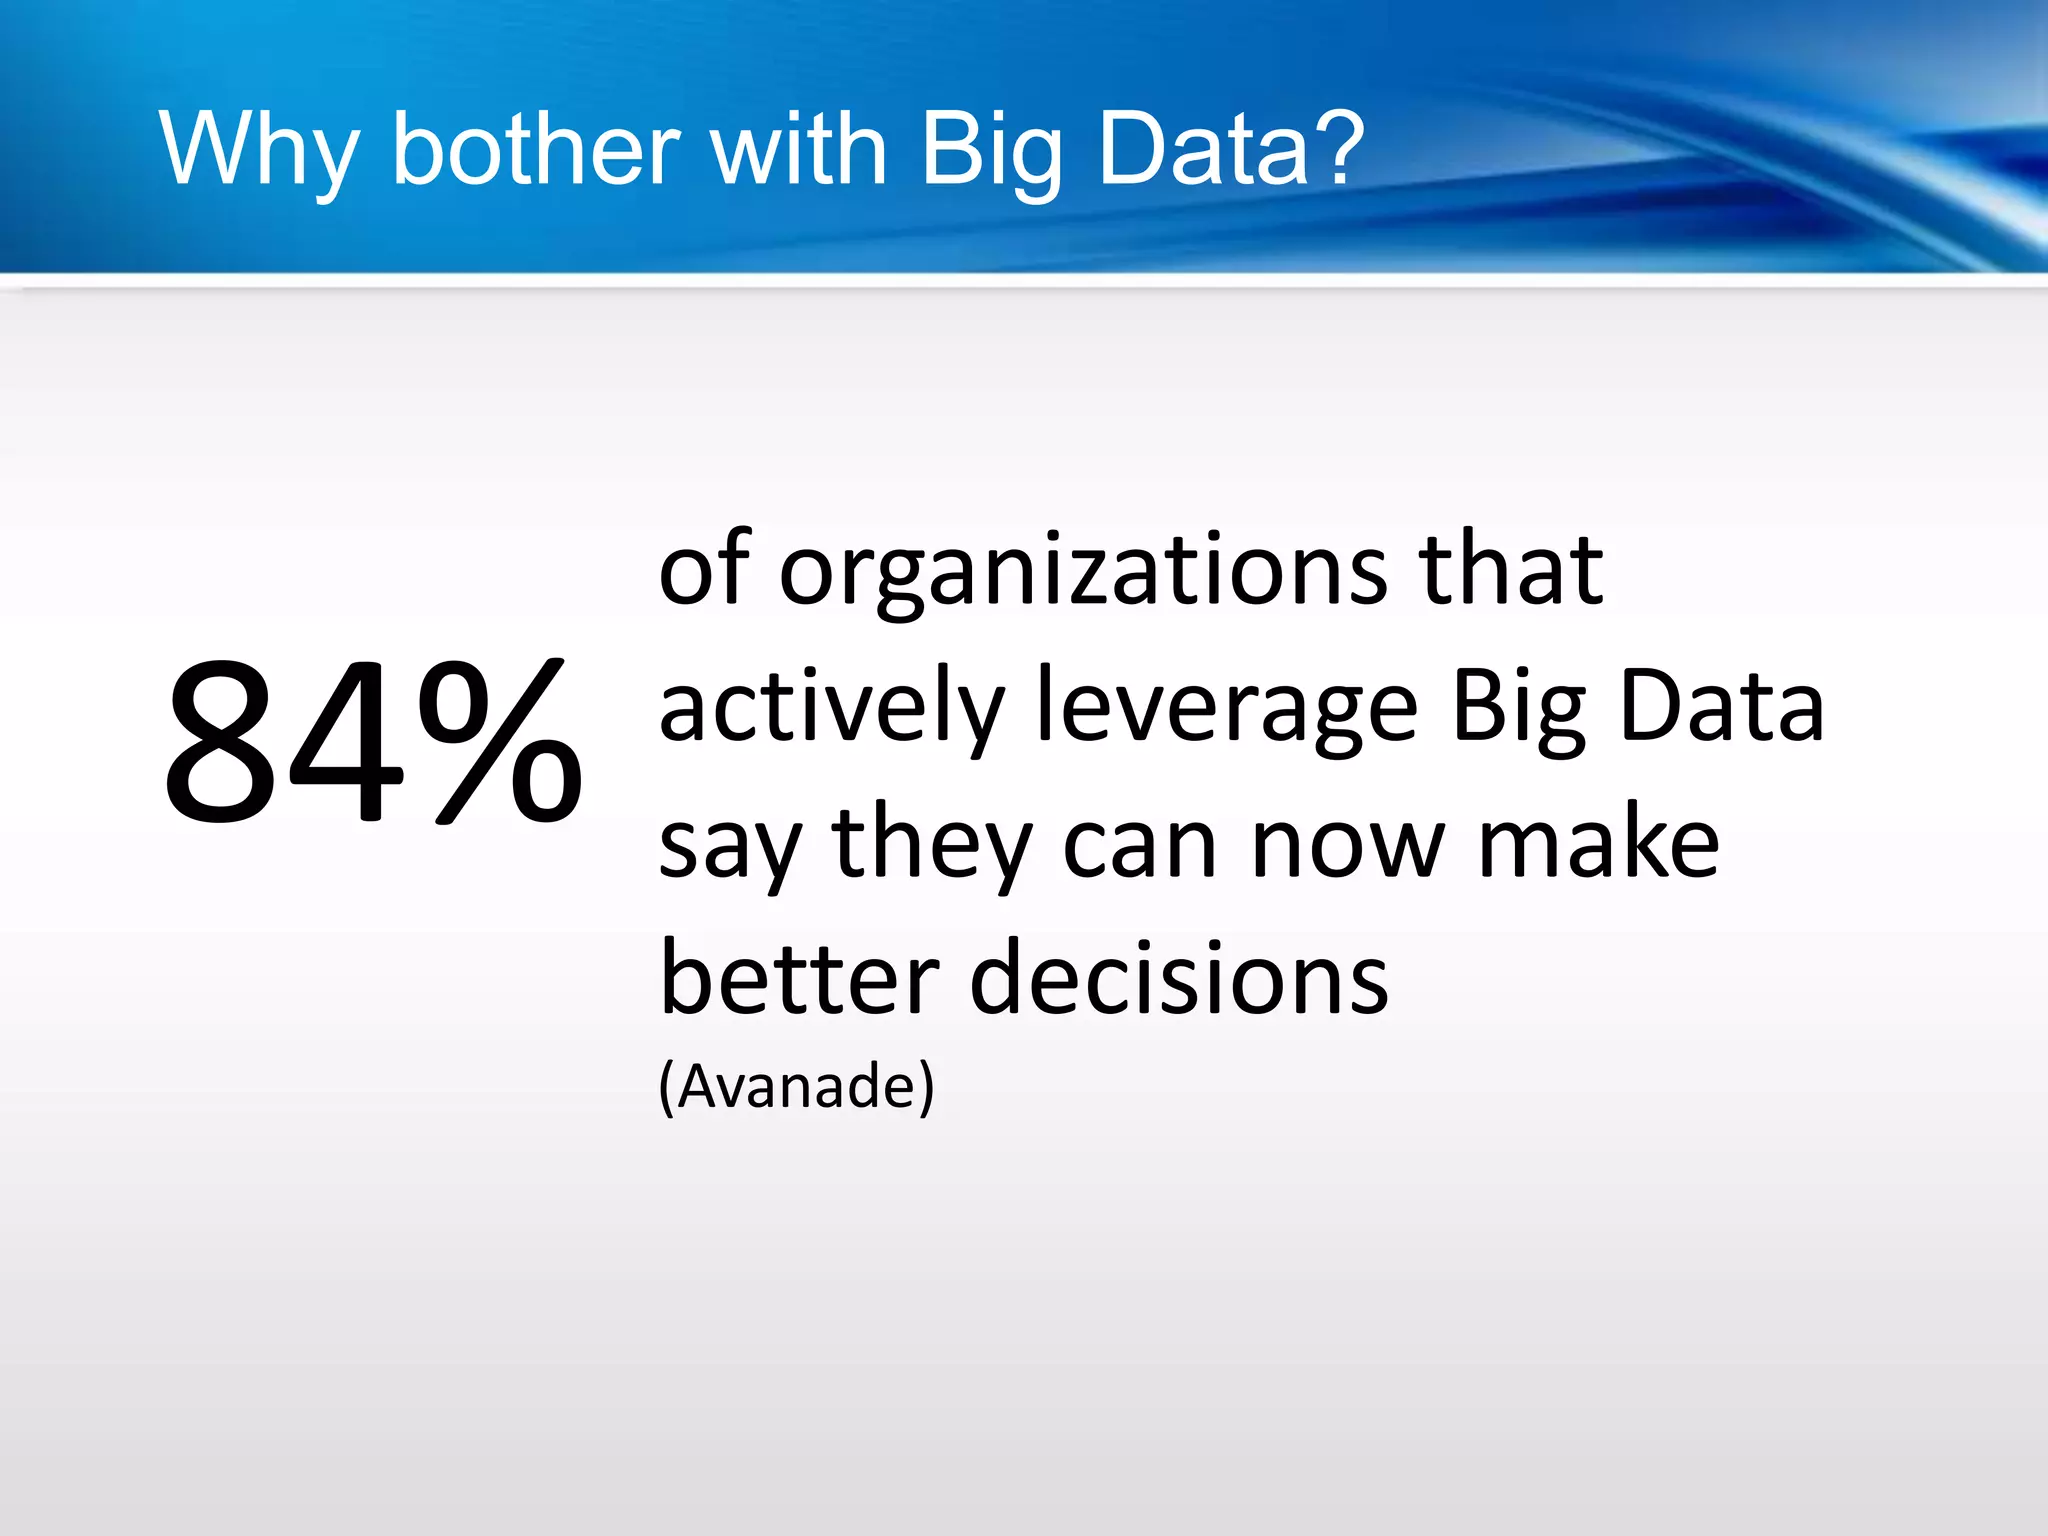


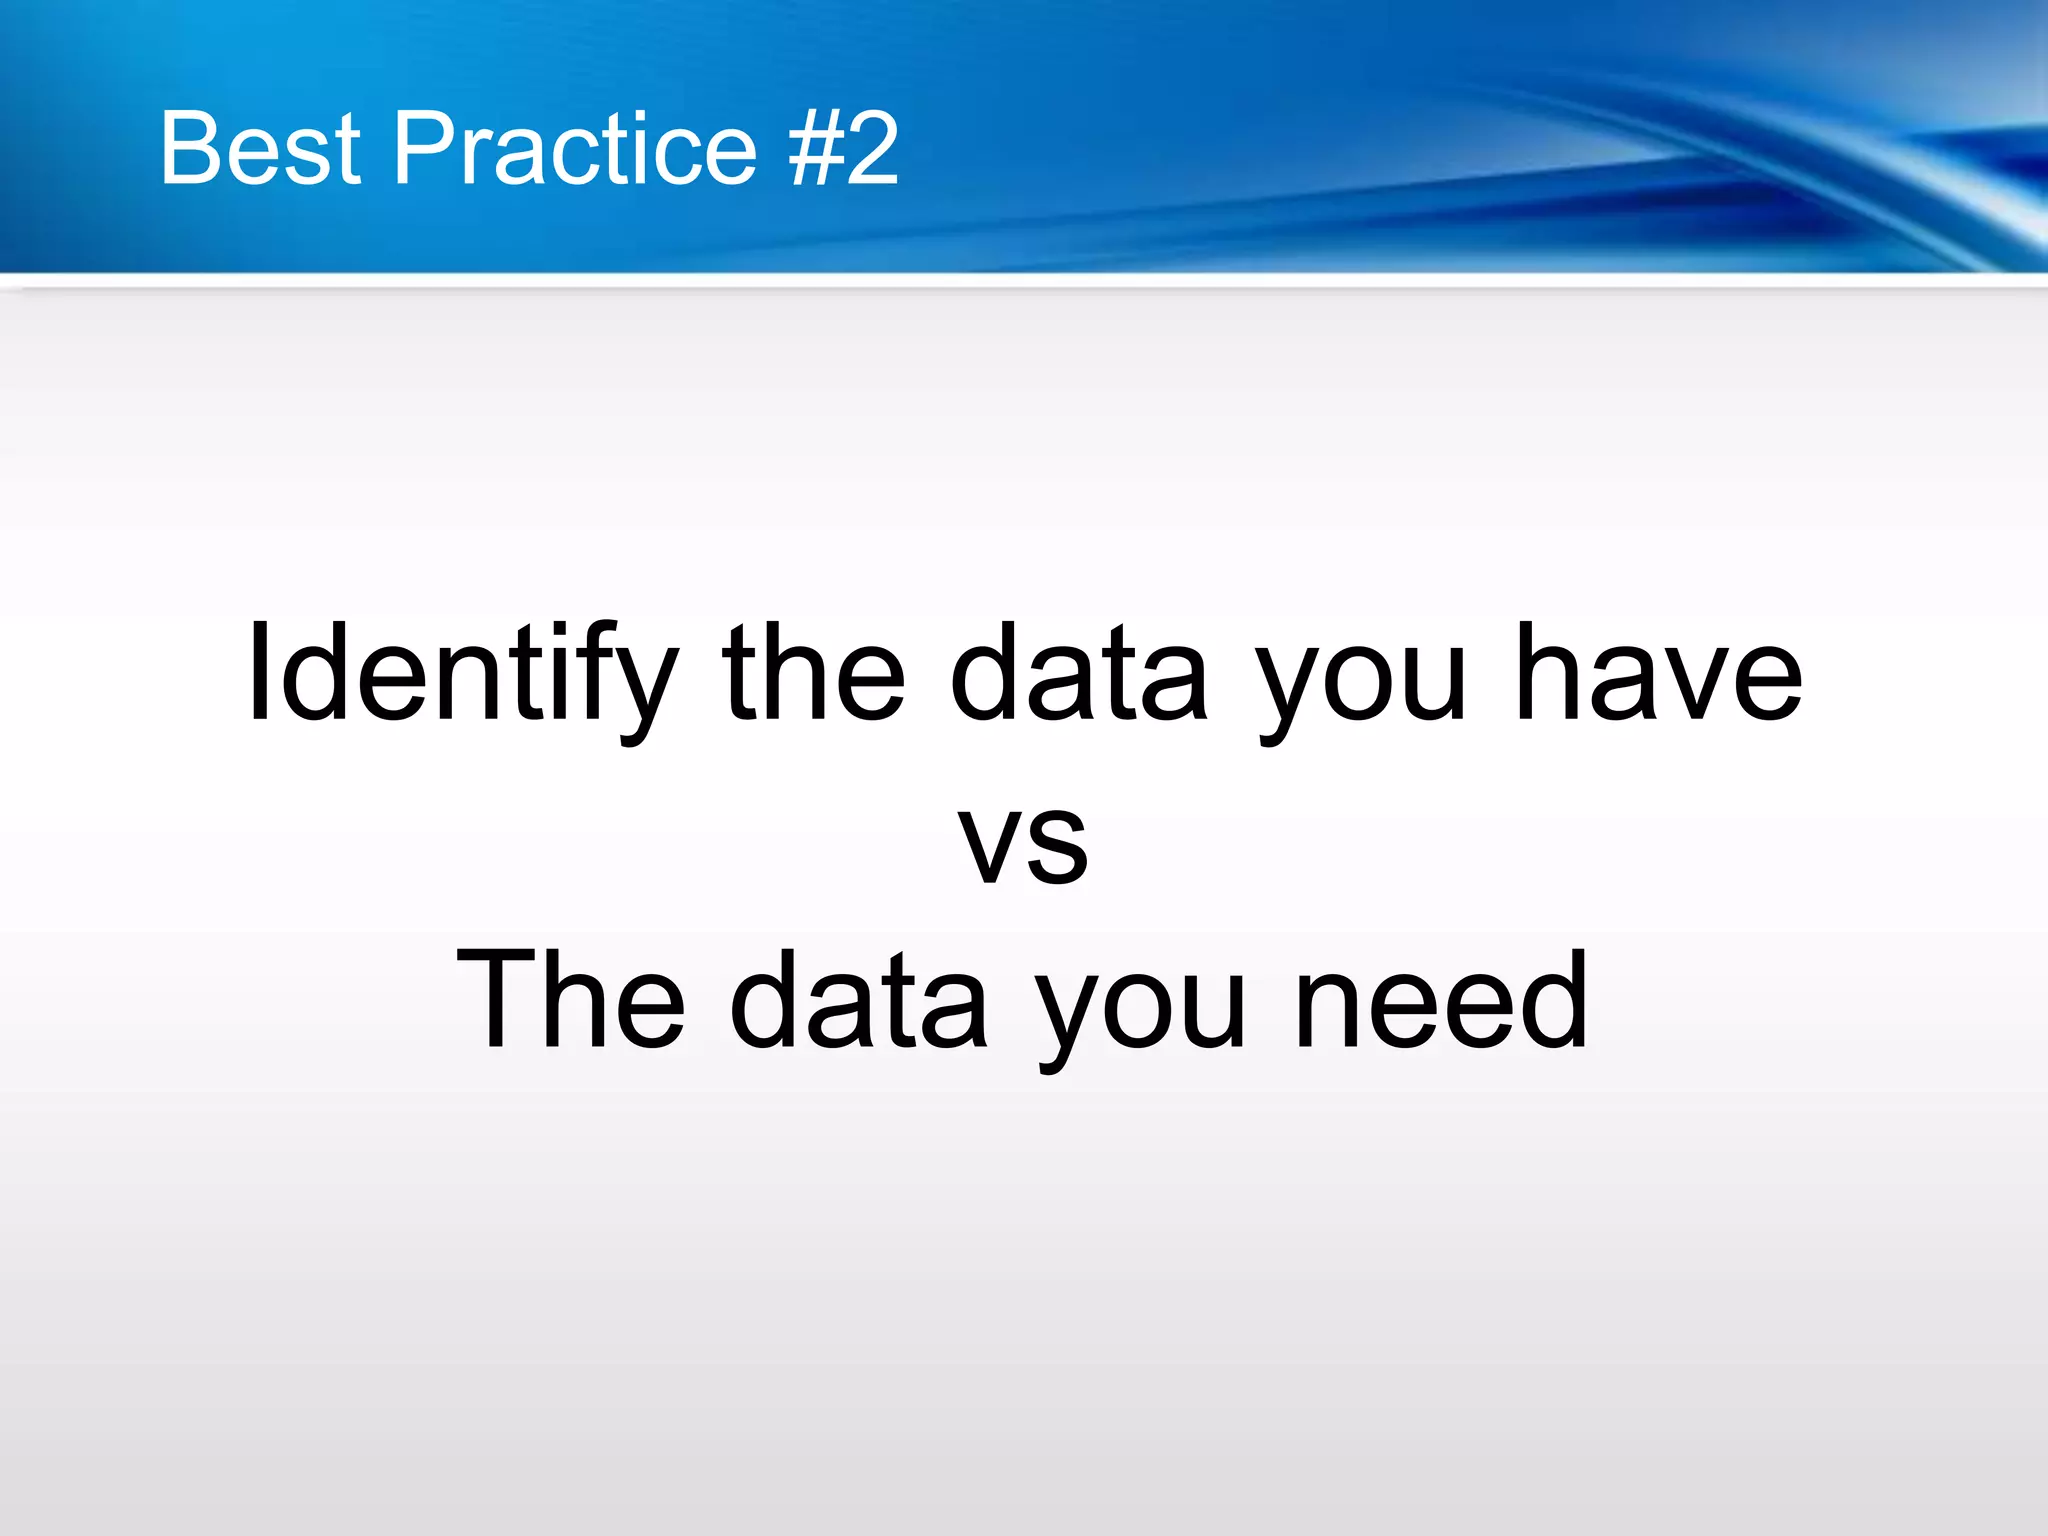


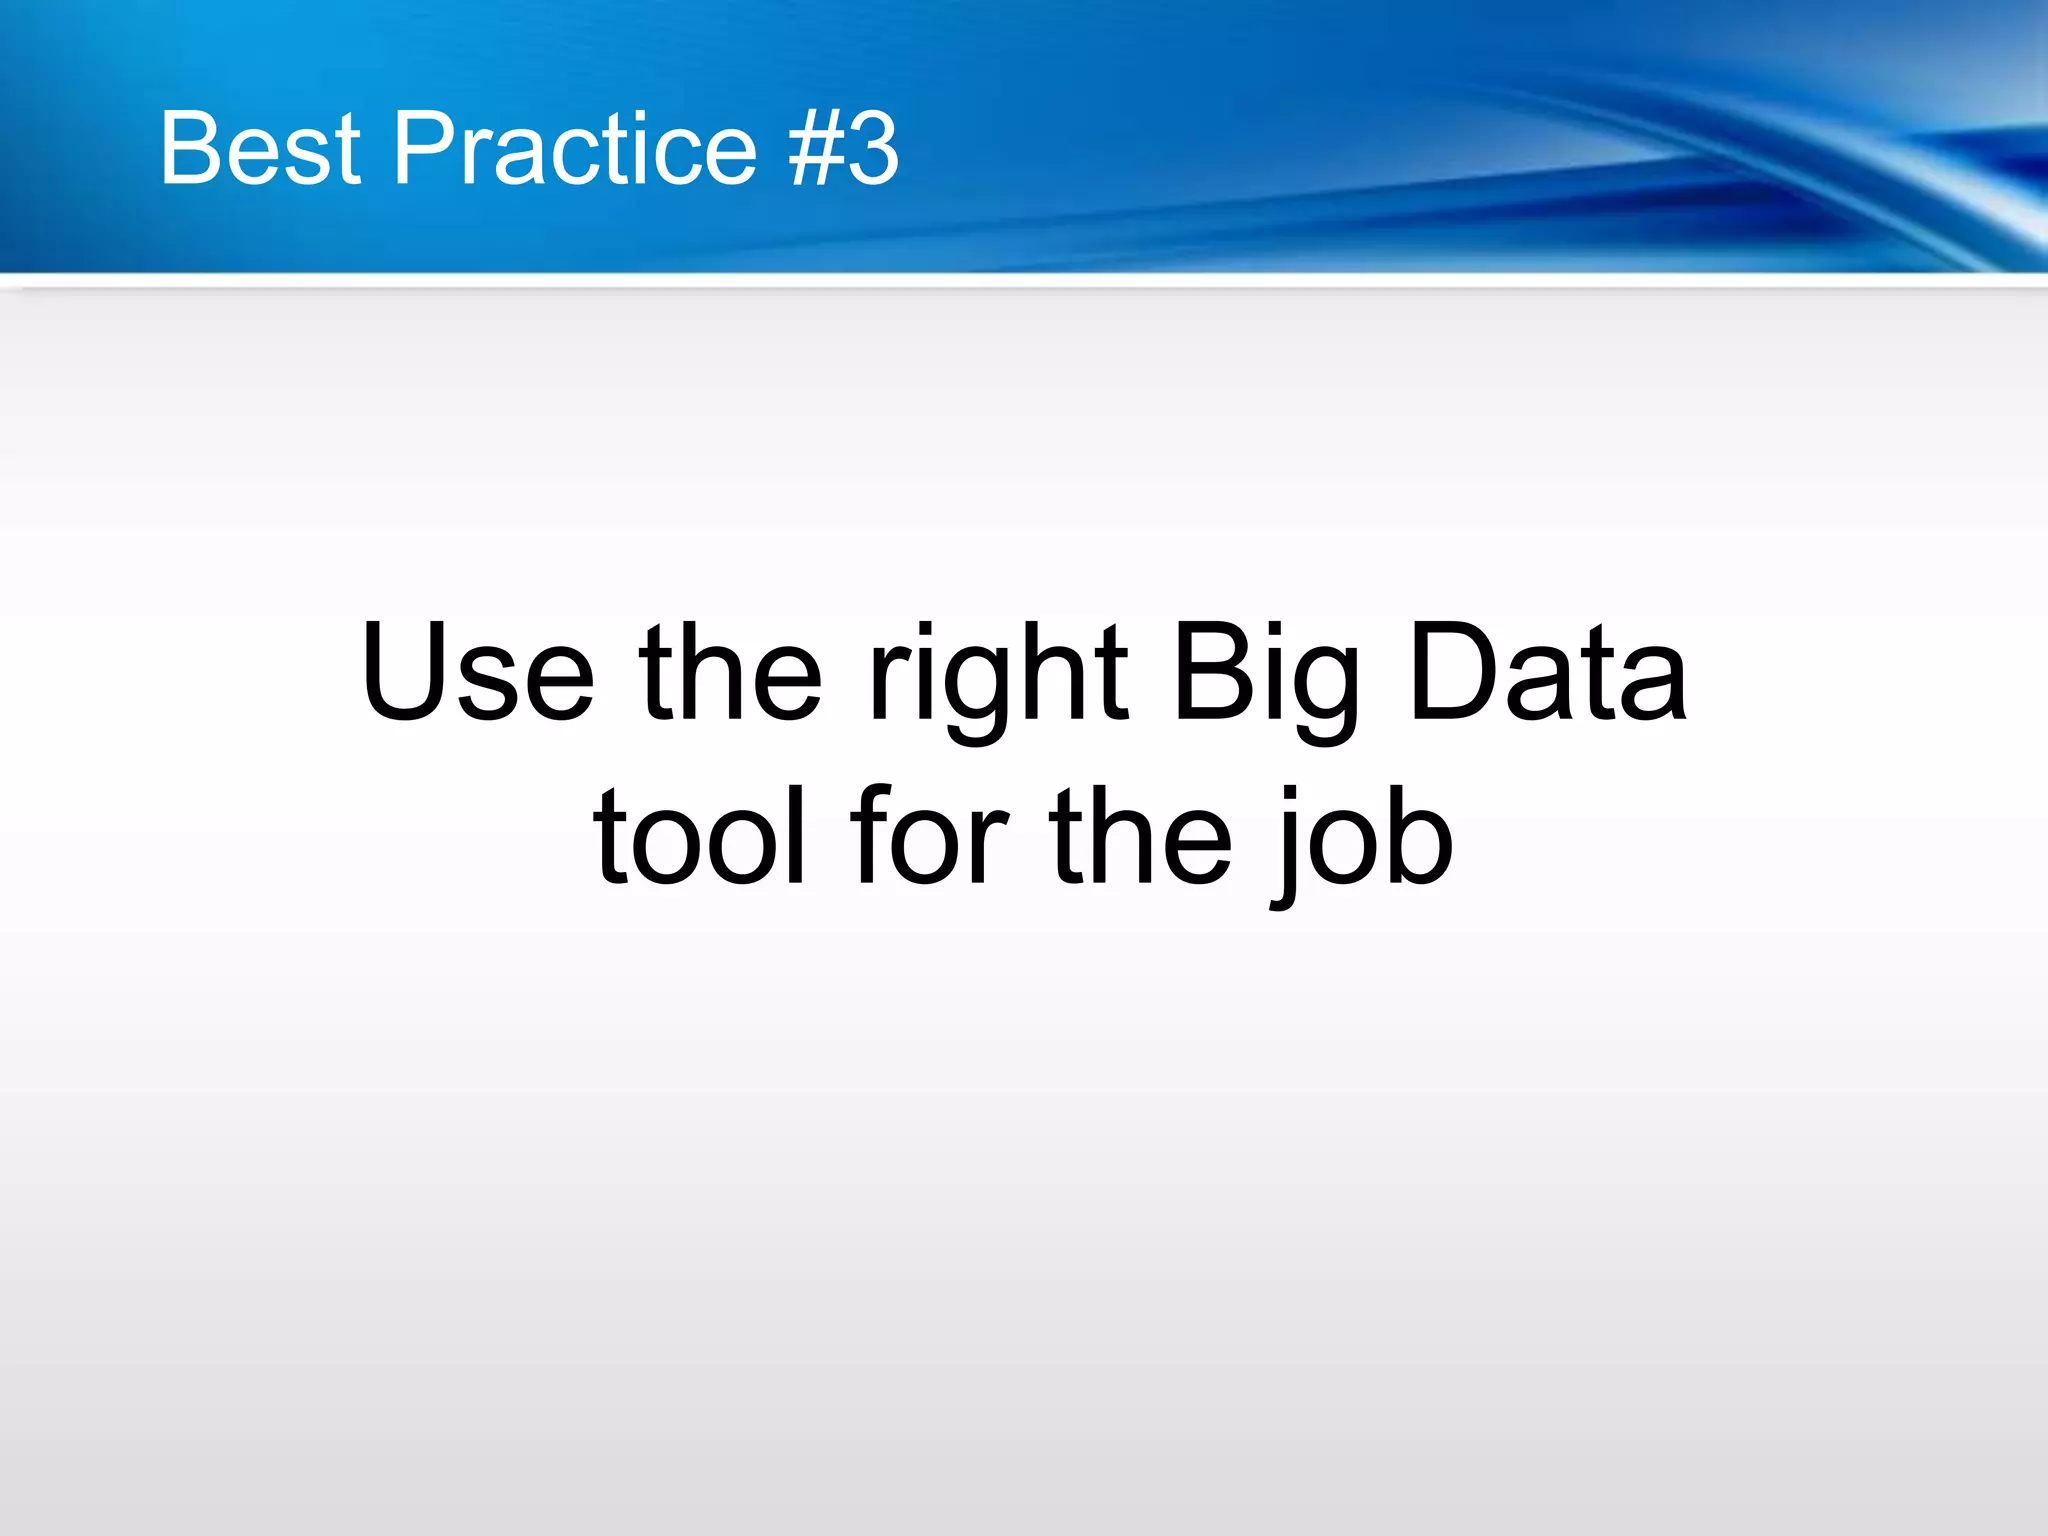


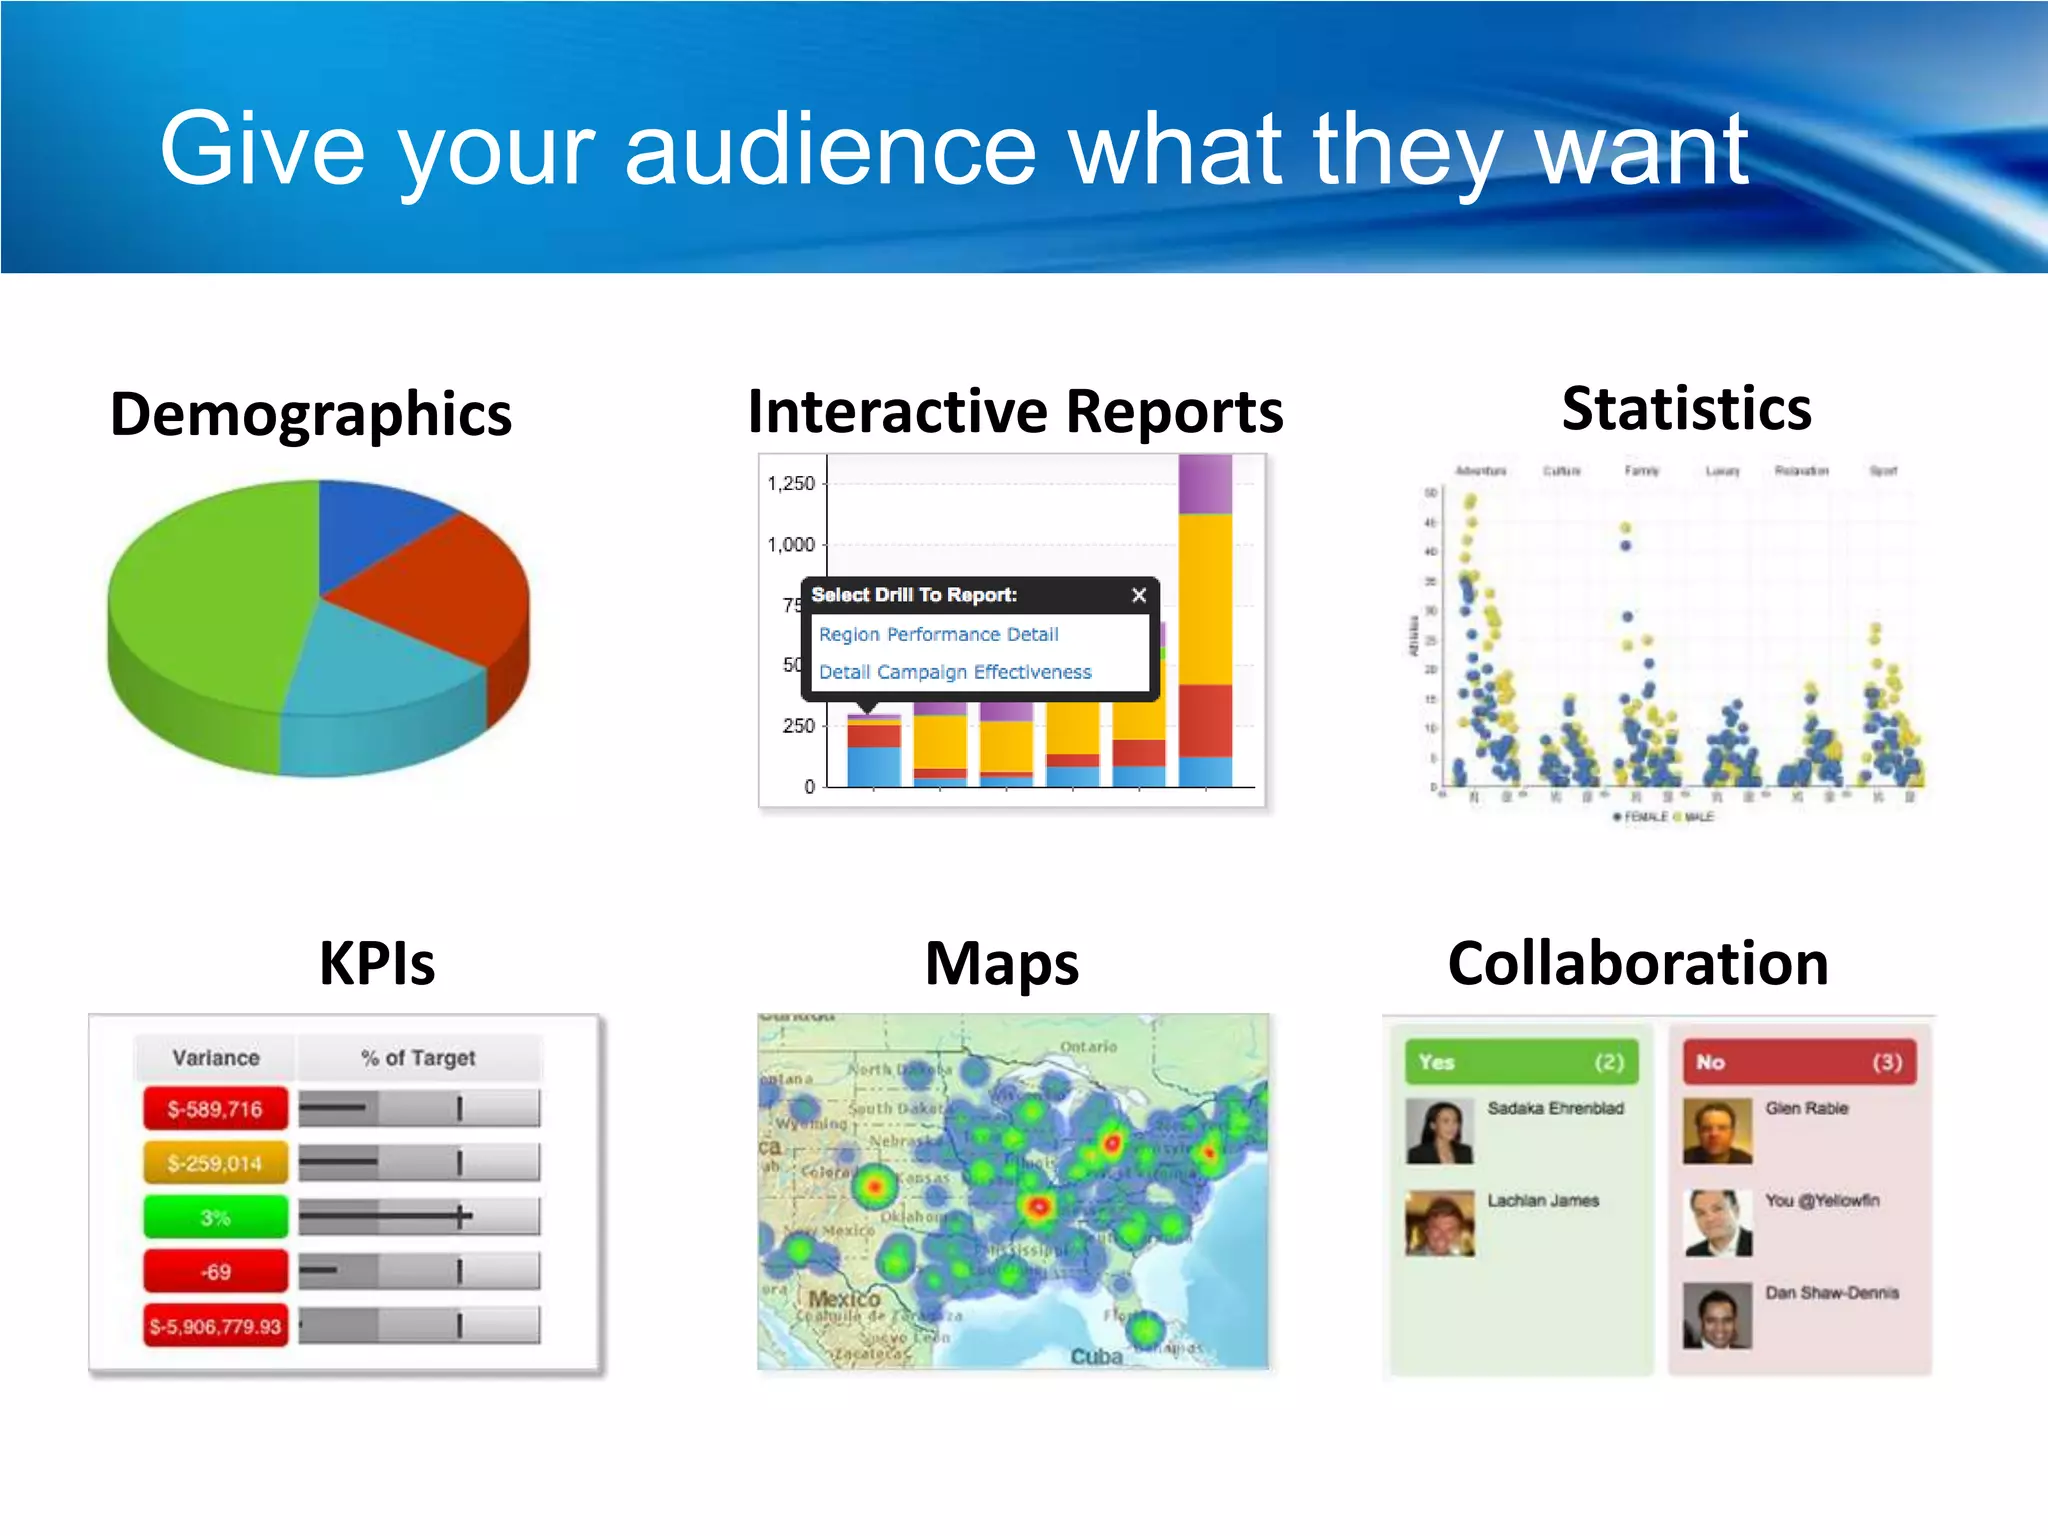
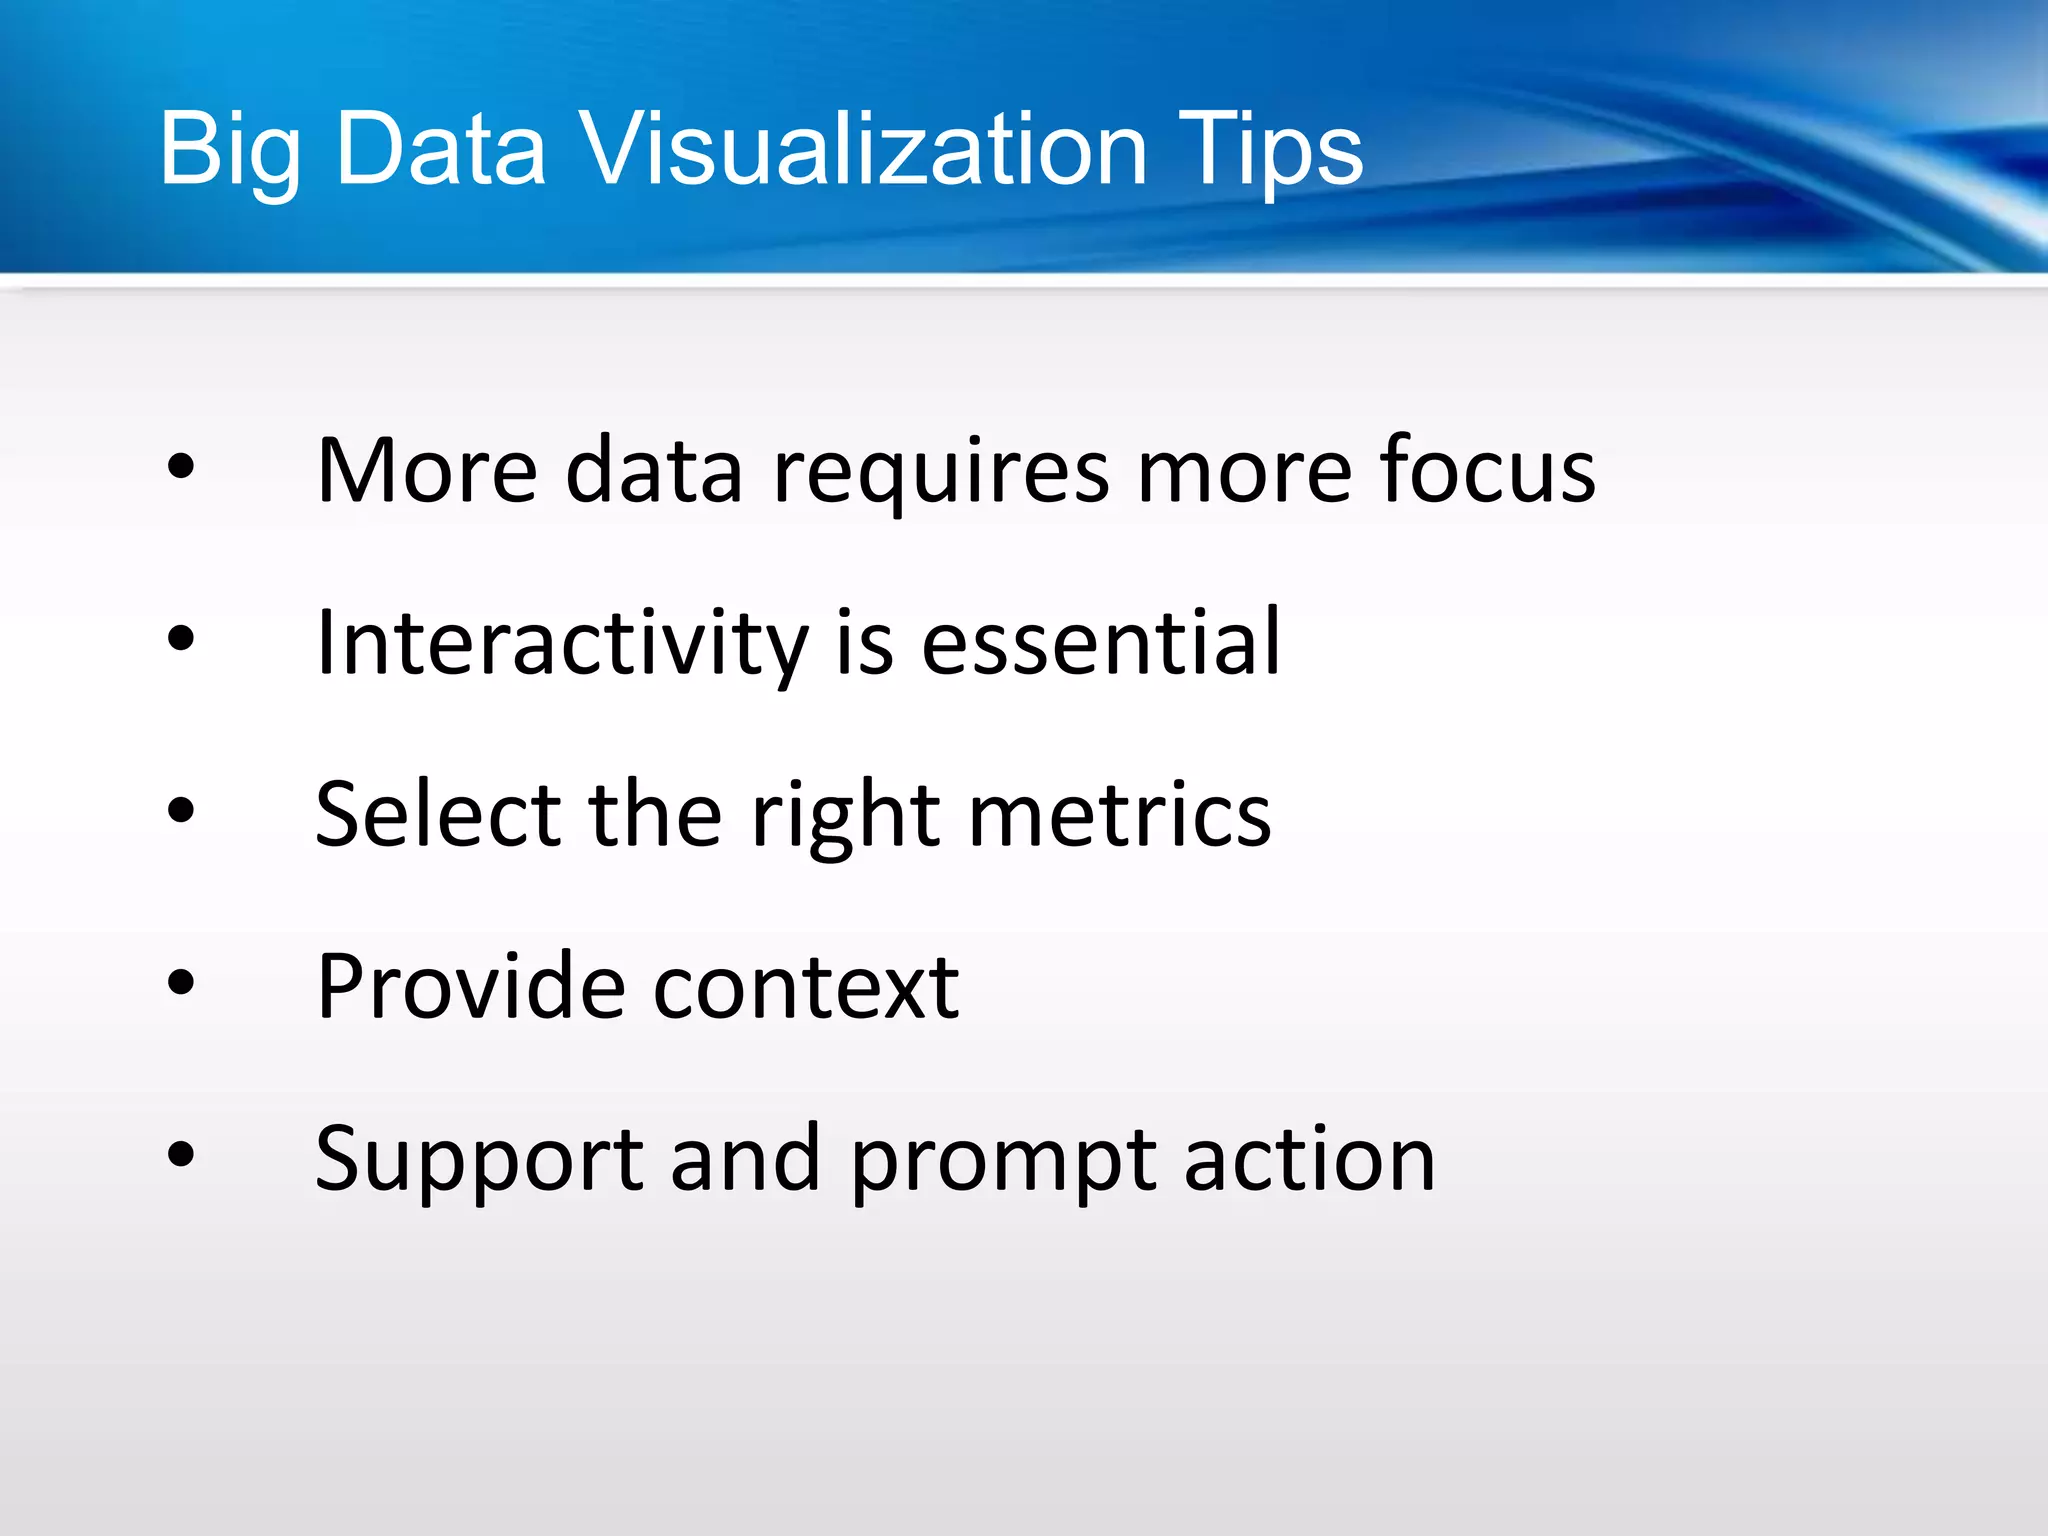

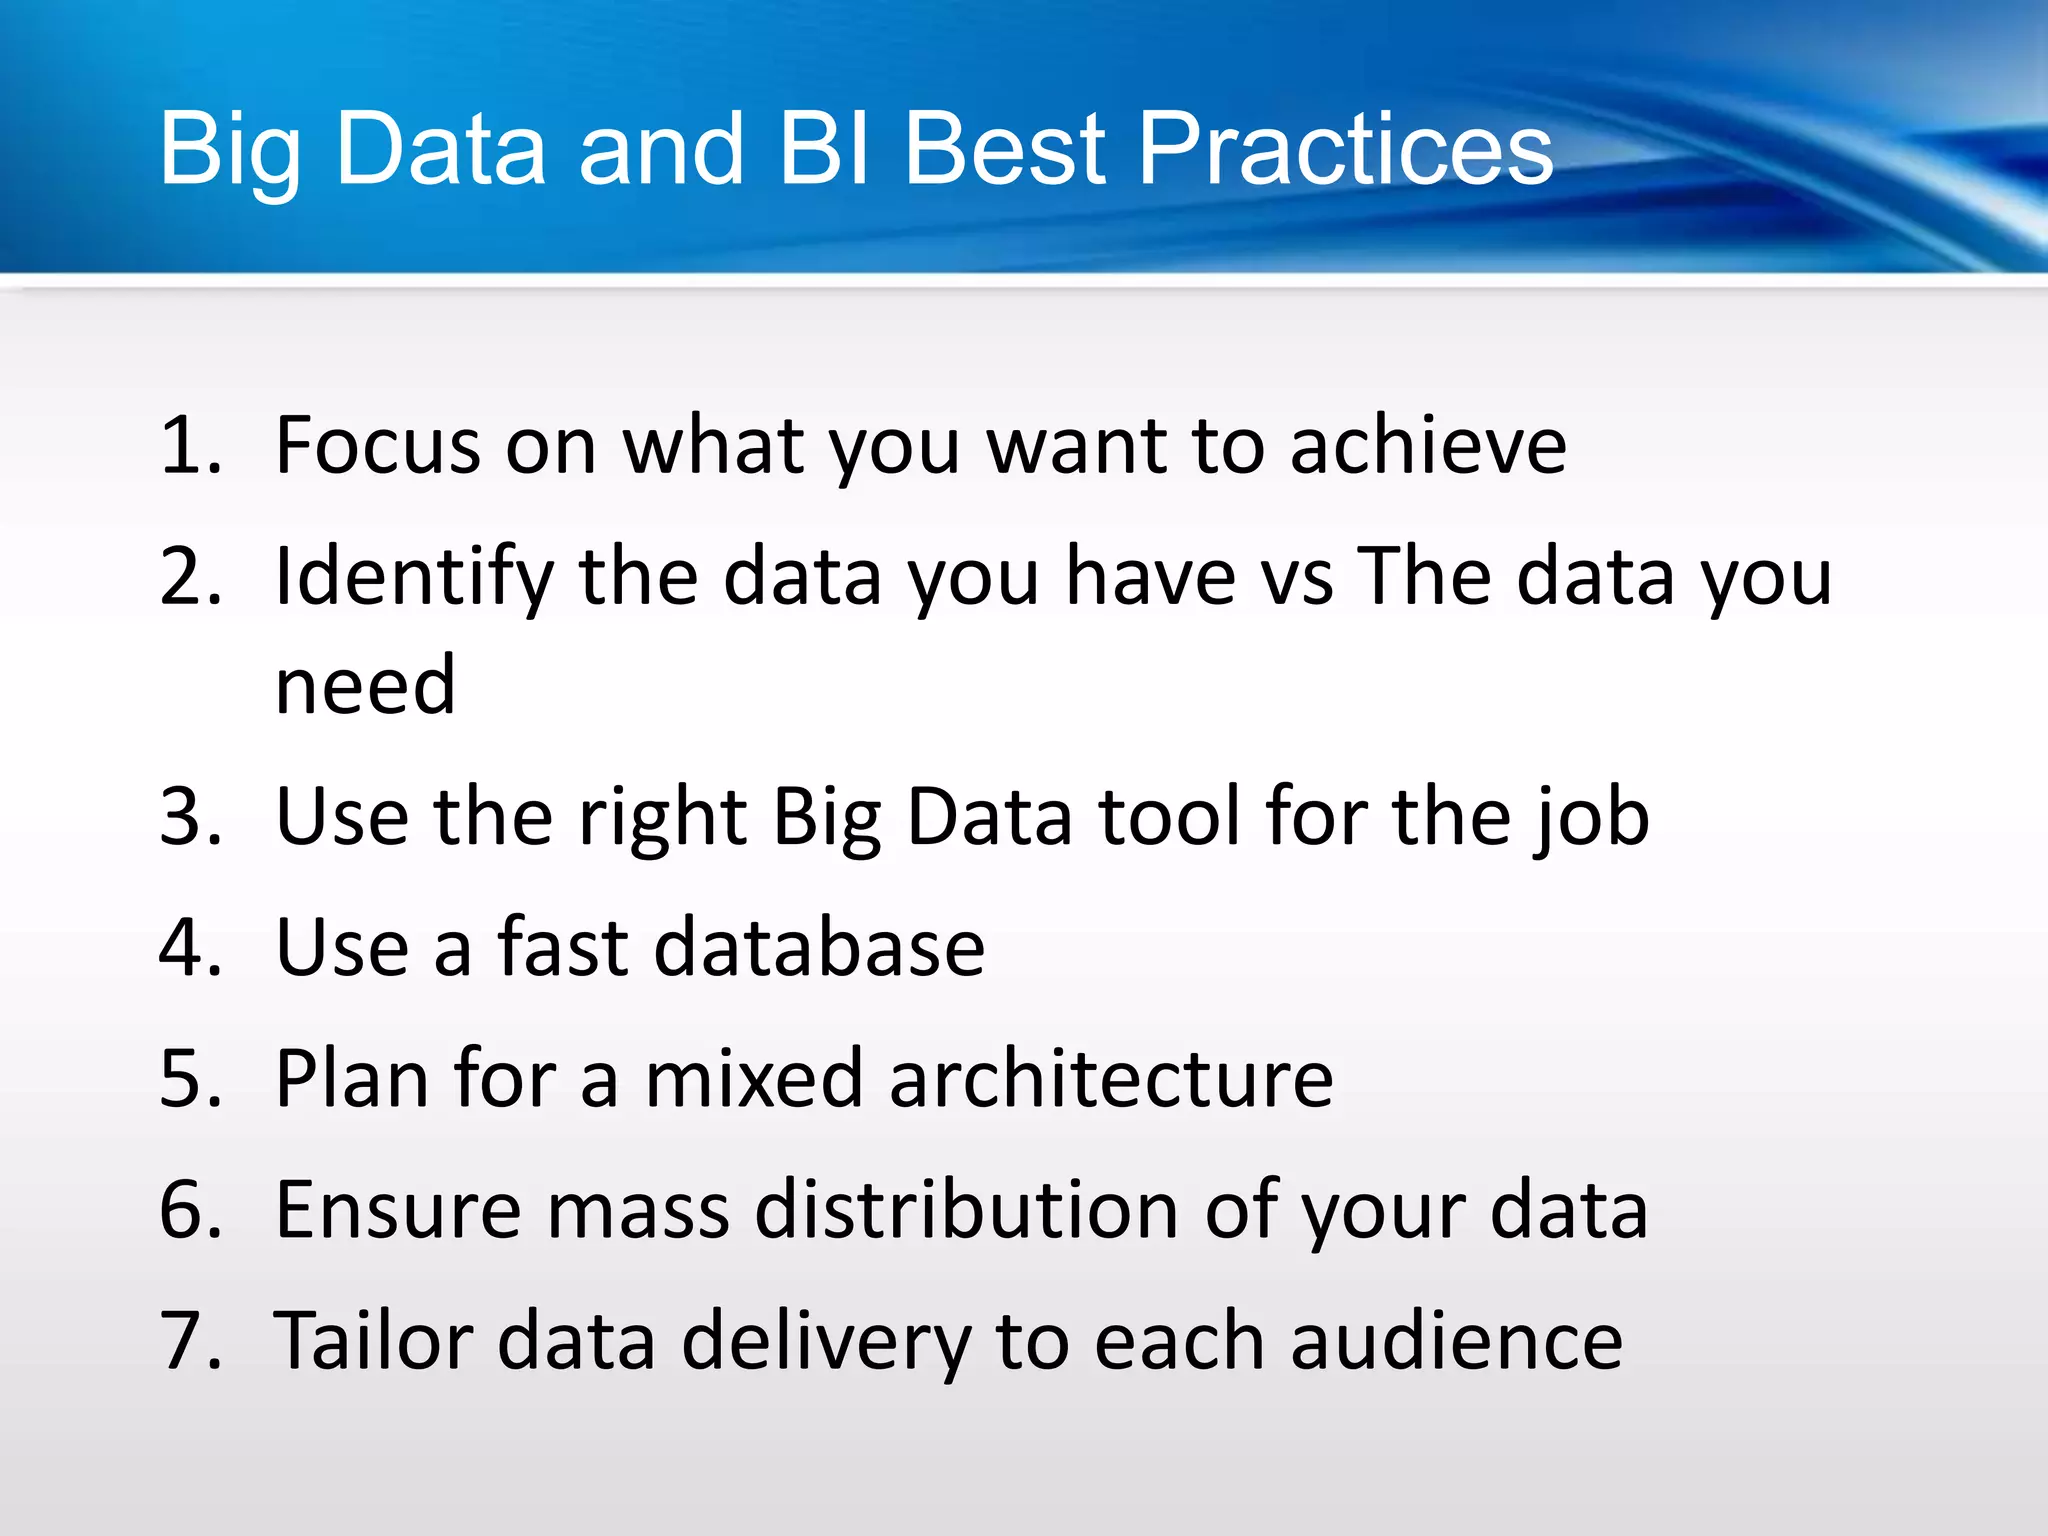


The document outlines best practices for utilizing big data and business intelligence effectively, emphasizing the need to focus on desired outcomes and assess data requirements. Key practices include using appropriate tools, ensuring fast database performance, and tailoring data delivery to various audiences. The presentation highlights the growing significance of big data in decision-making and the opportunity for organizations to leverage it for improved outcomes.


