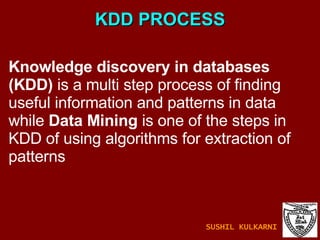
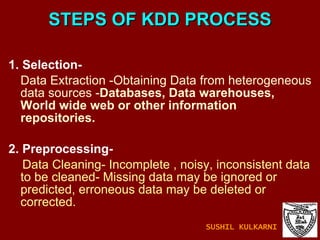
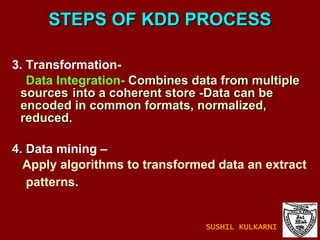
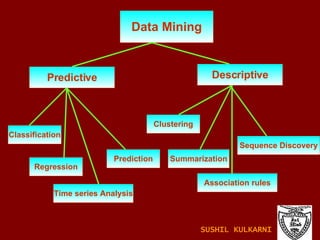
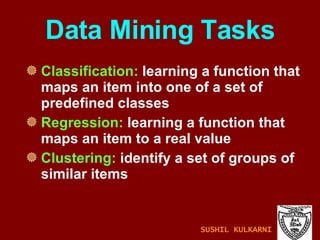
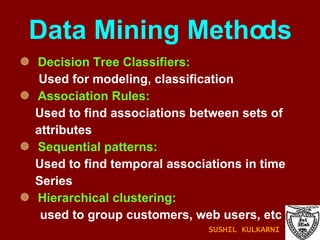
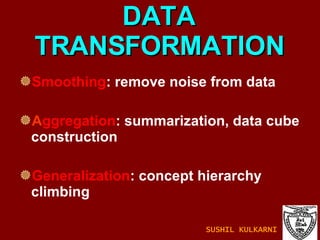
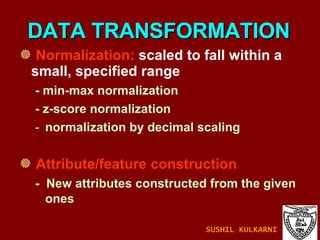
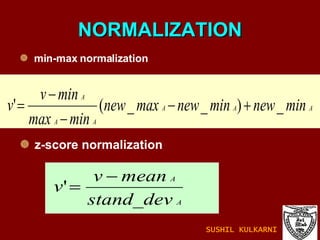
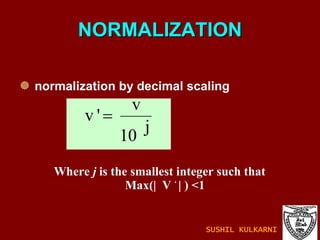
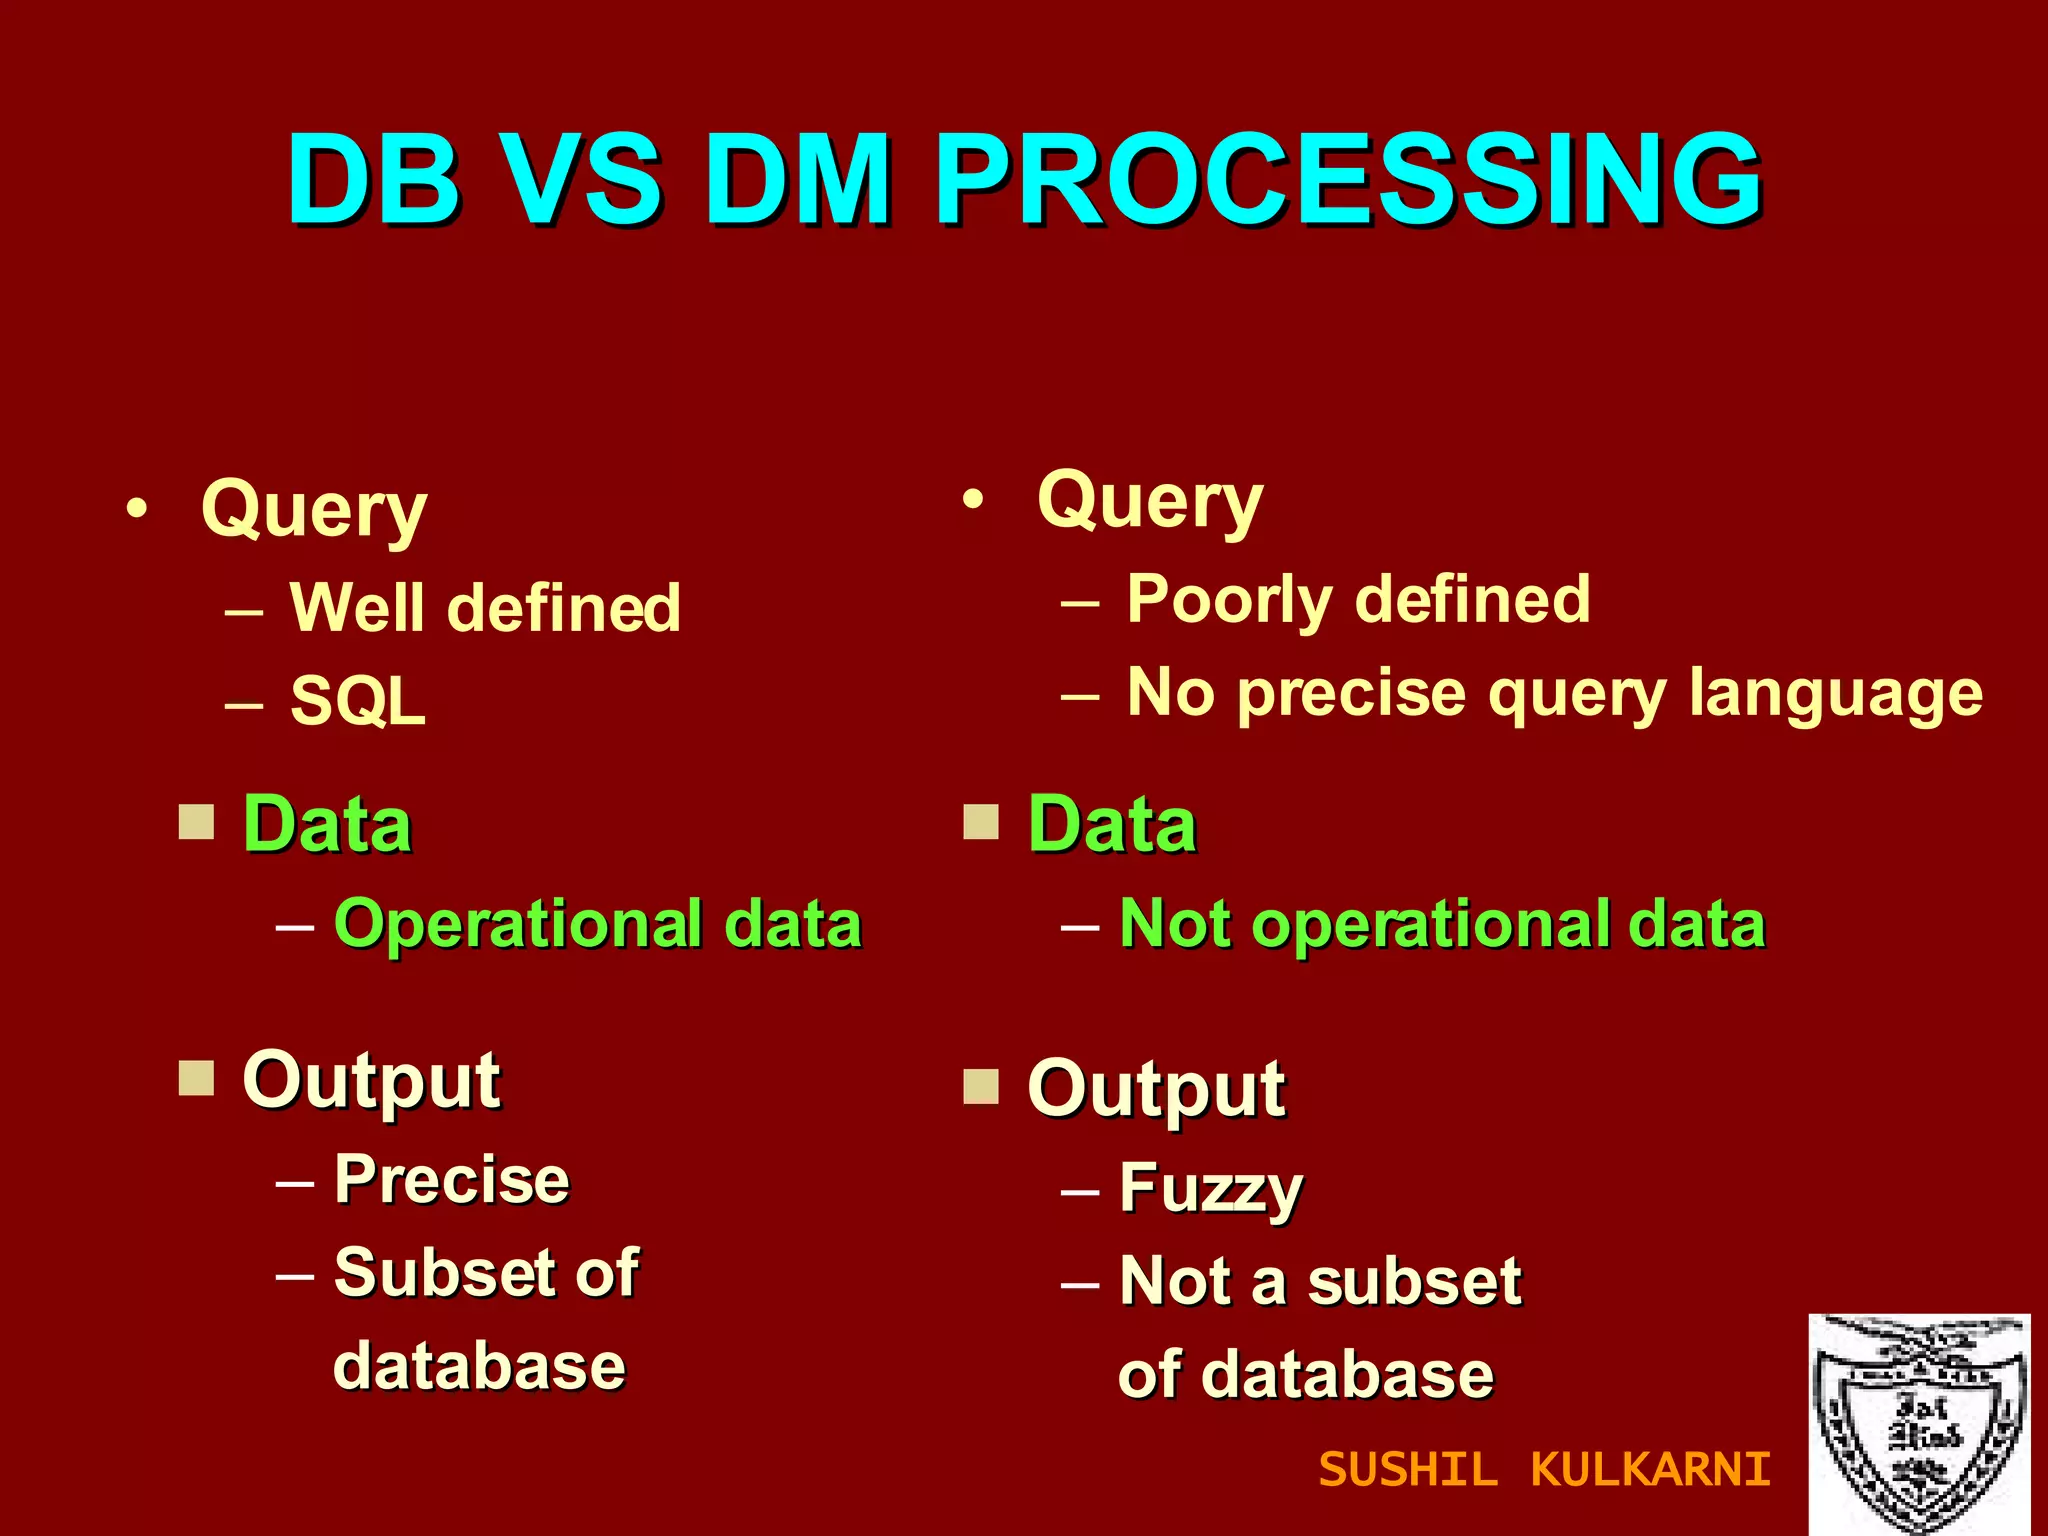
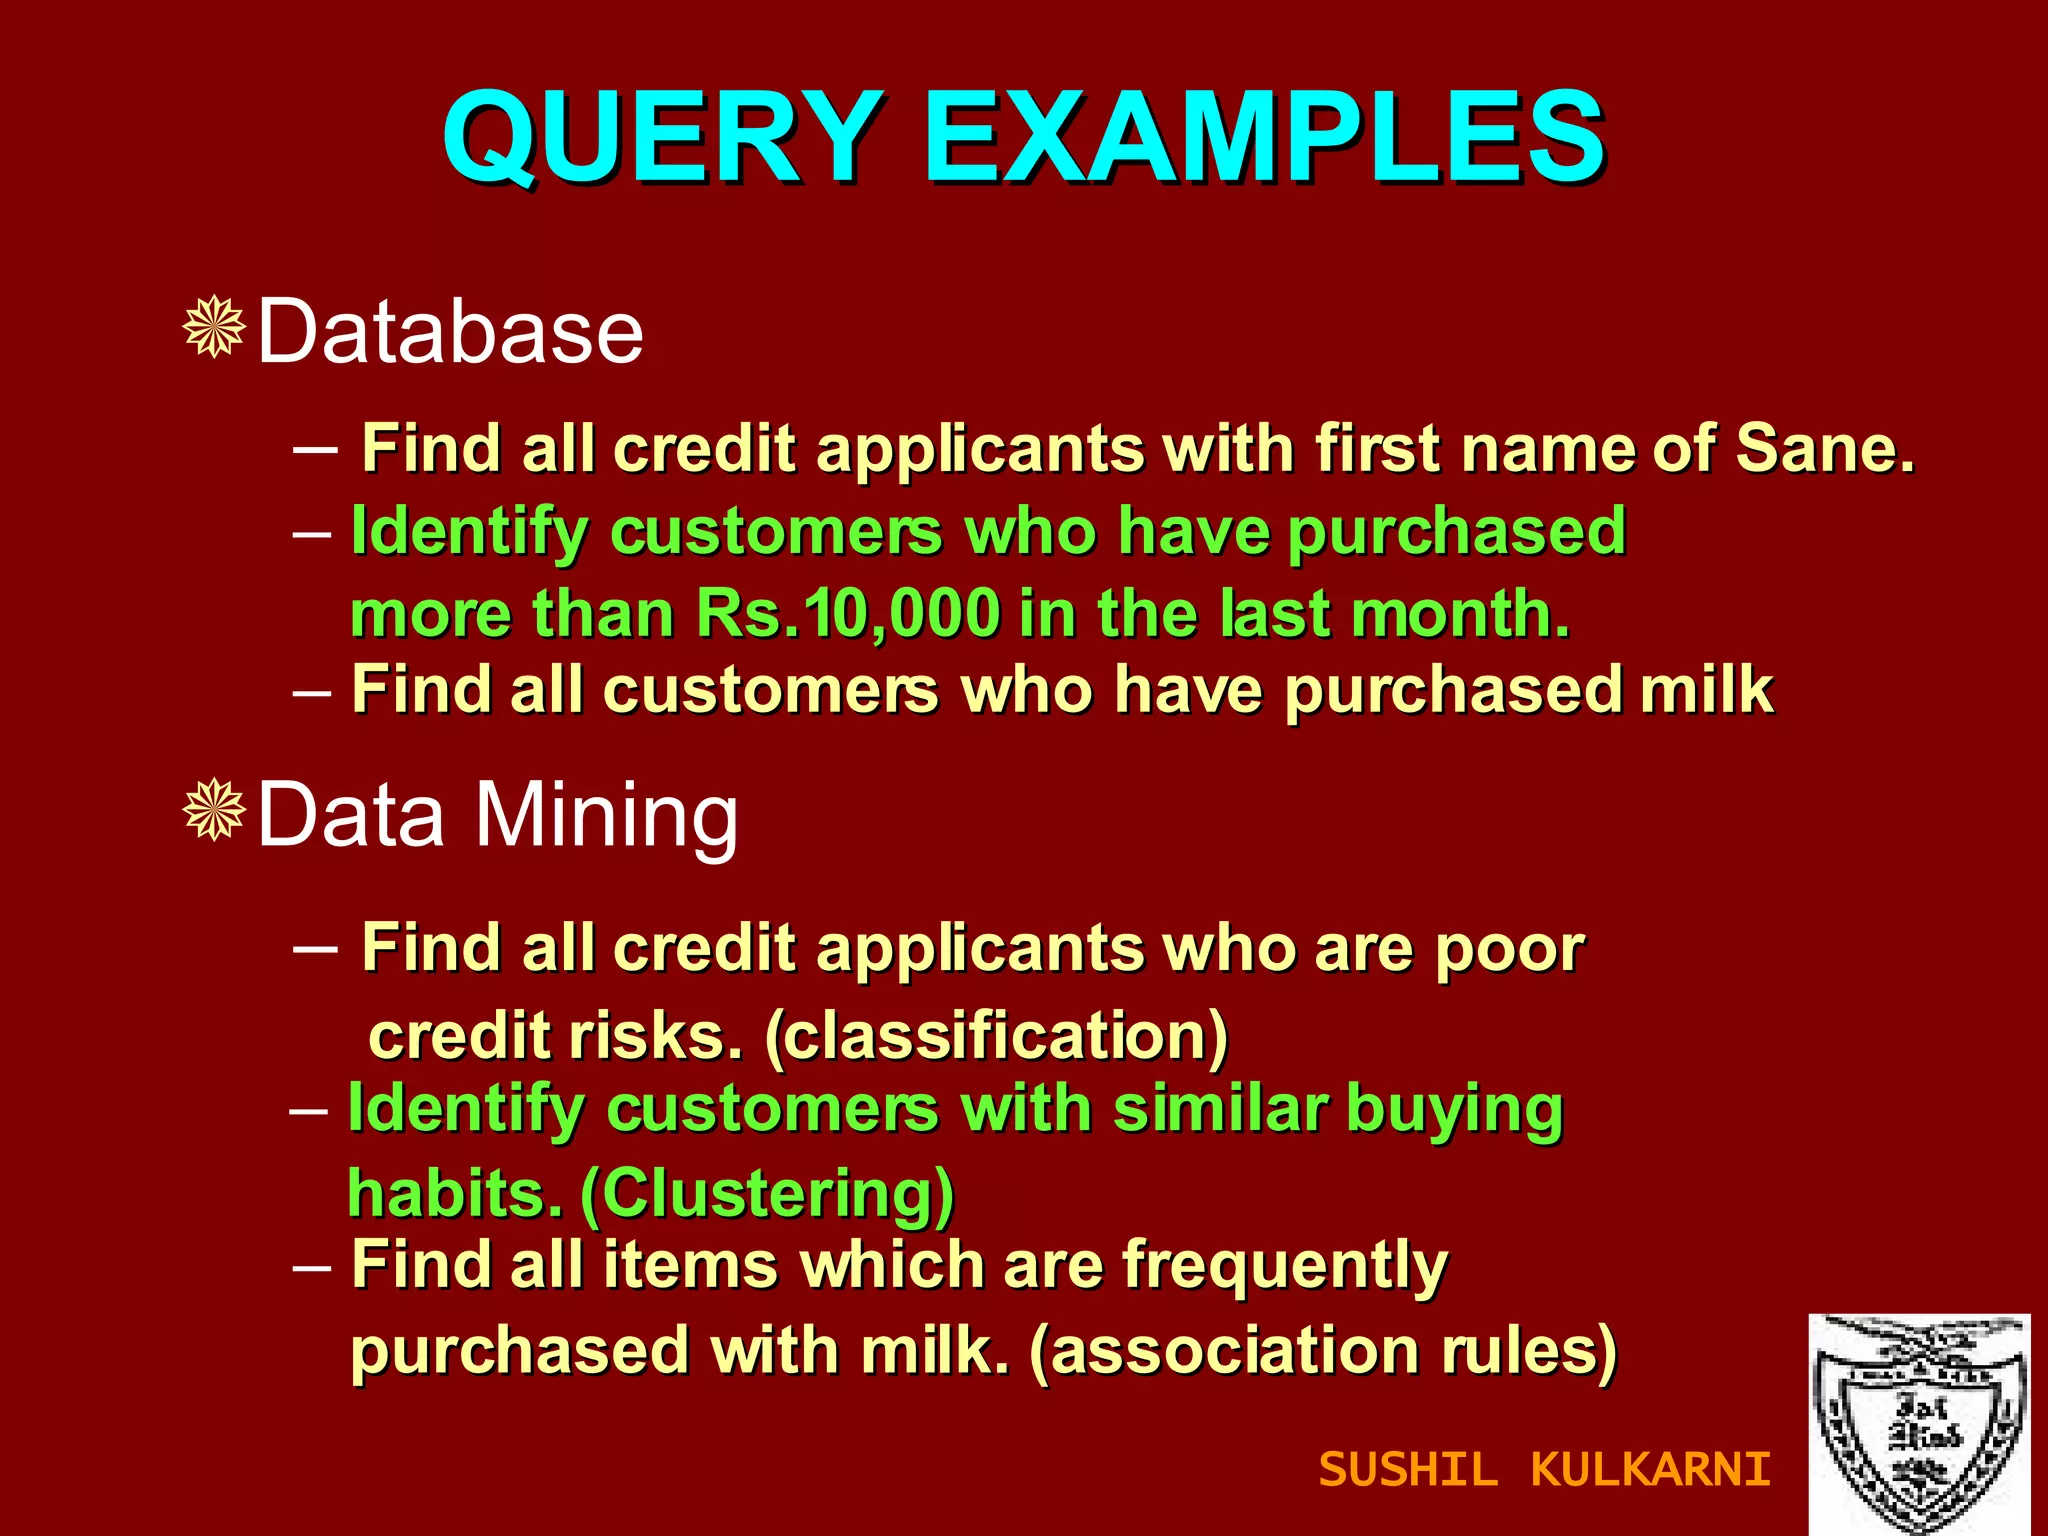
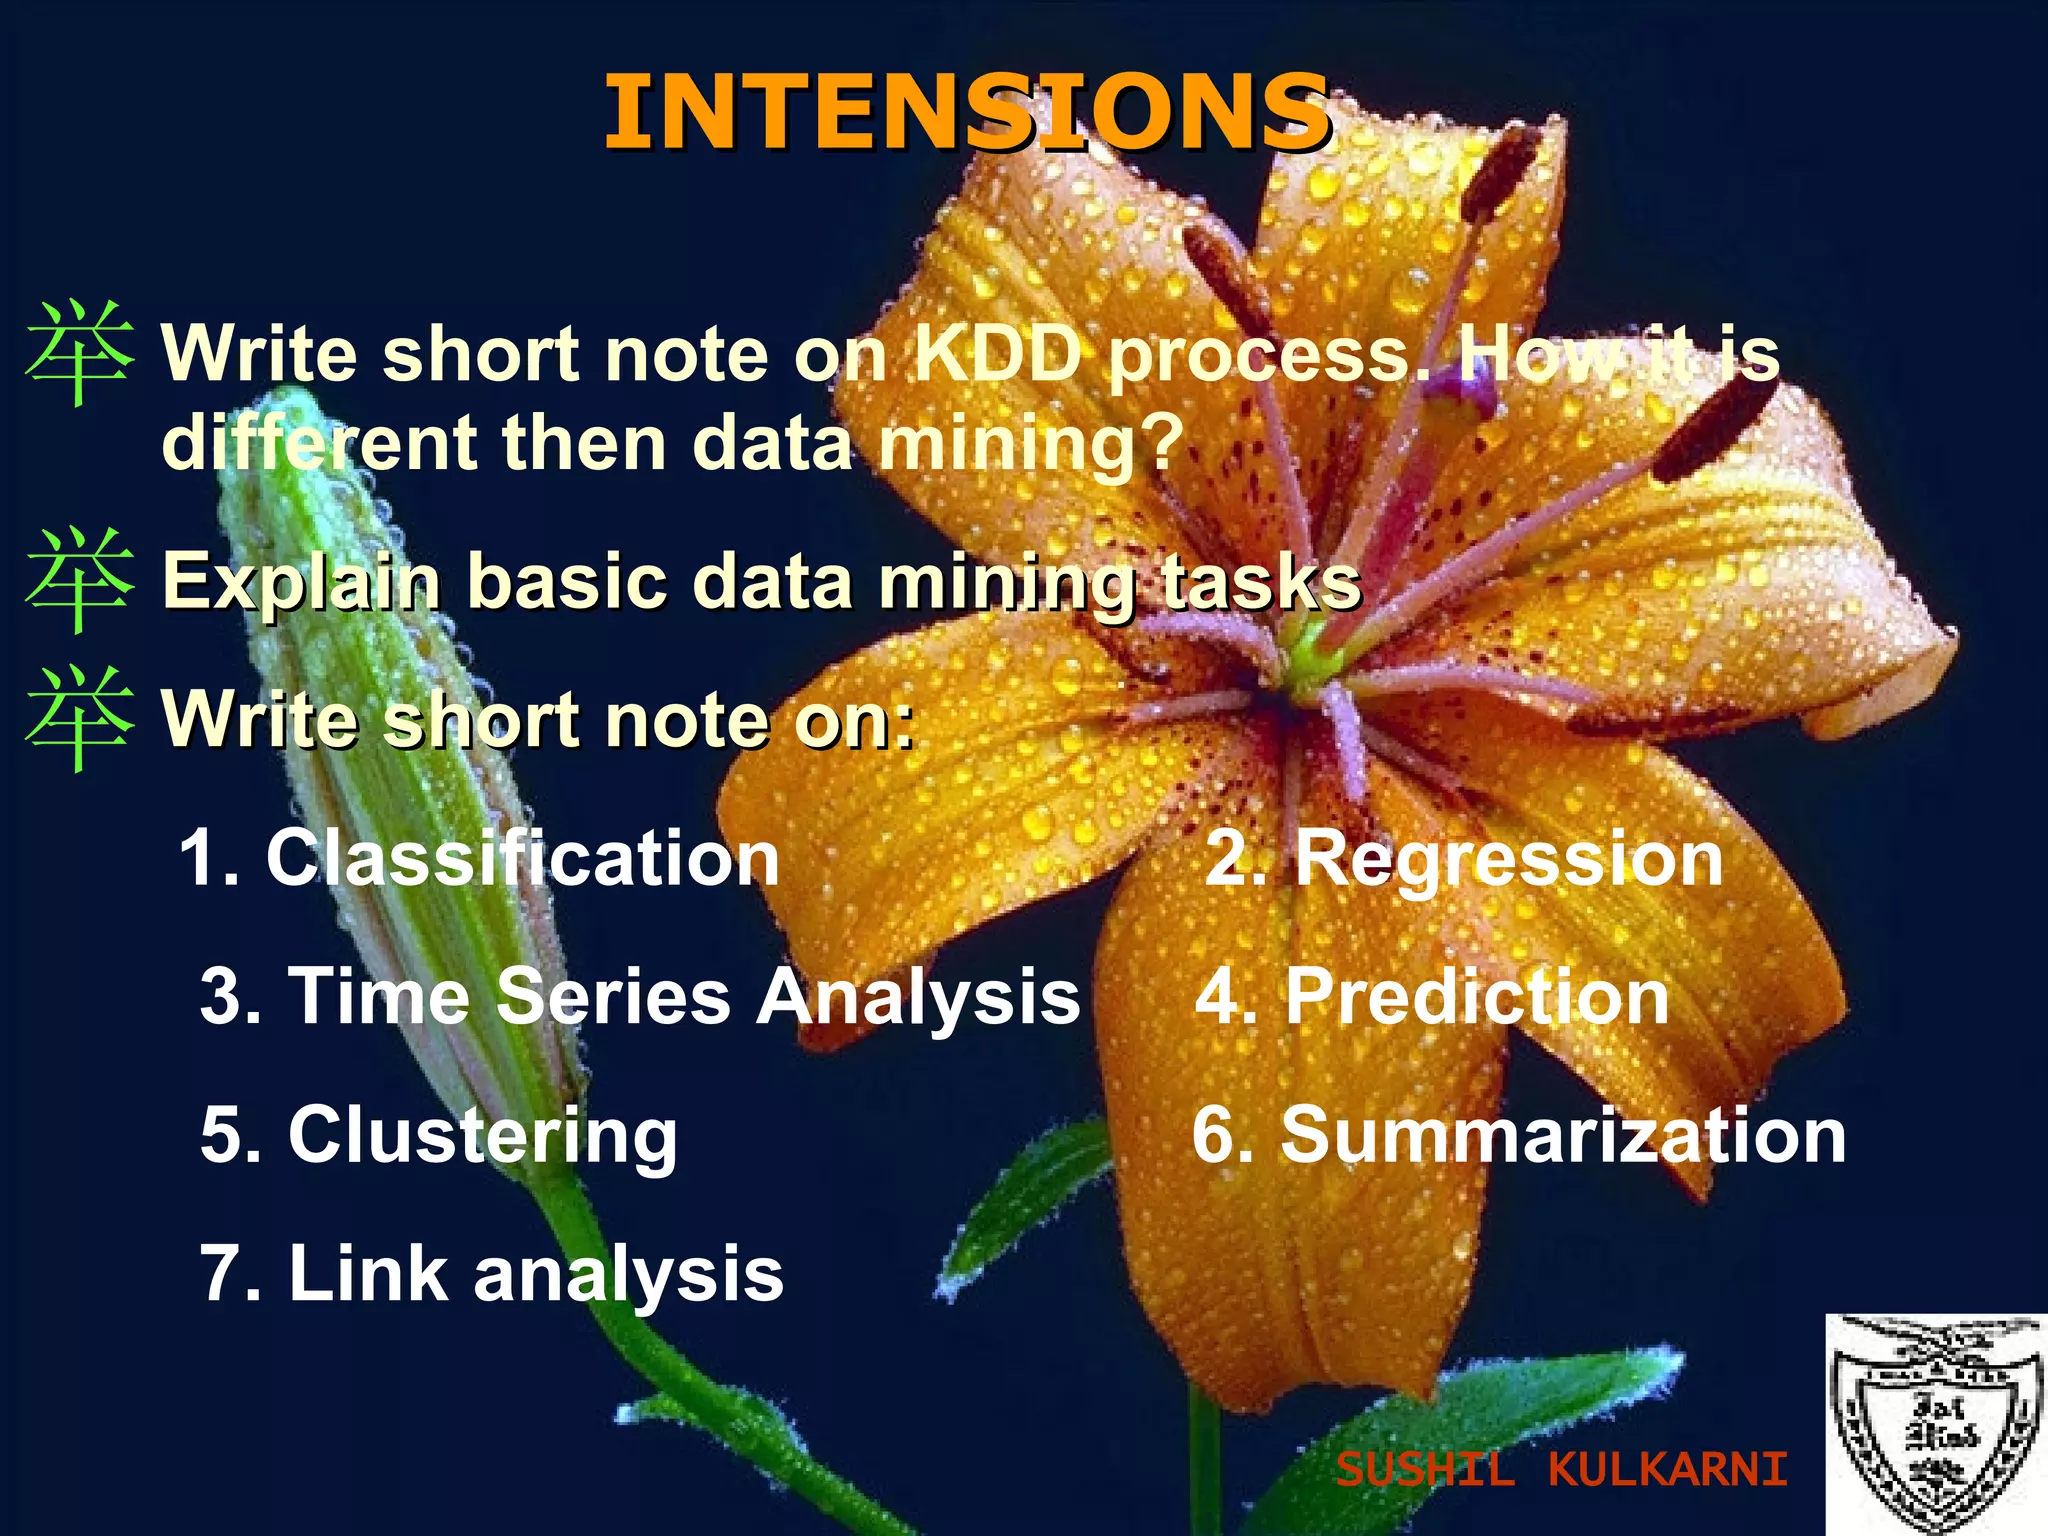
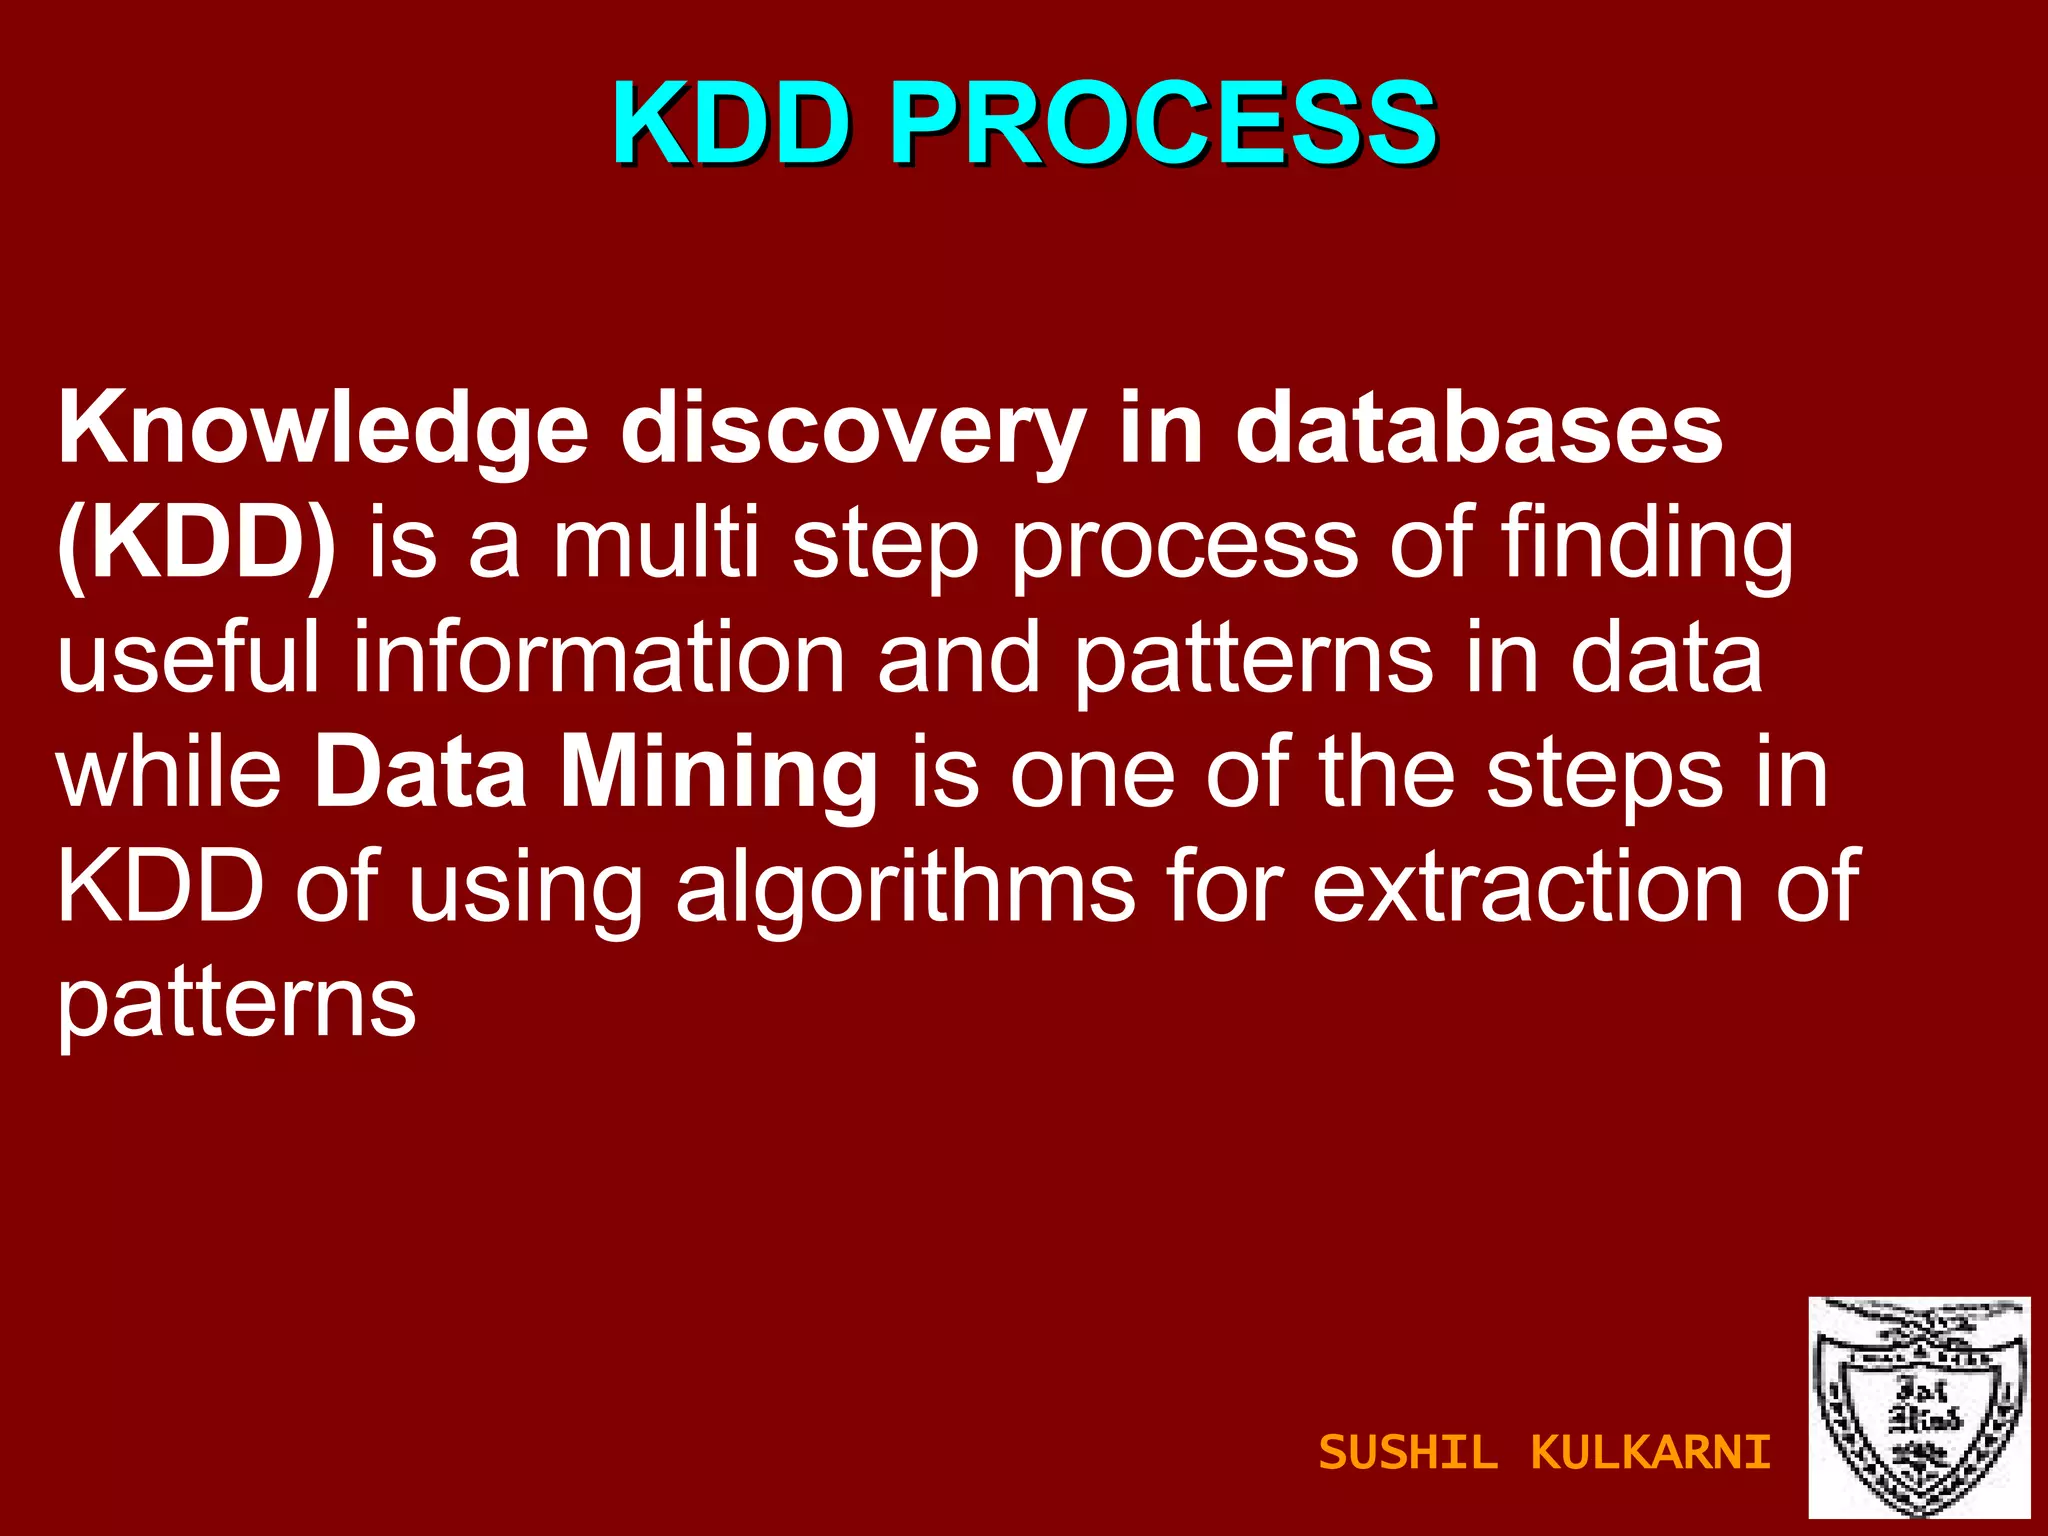
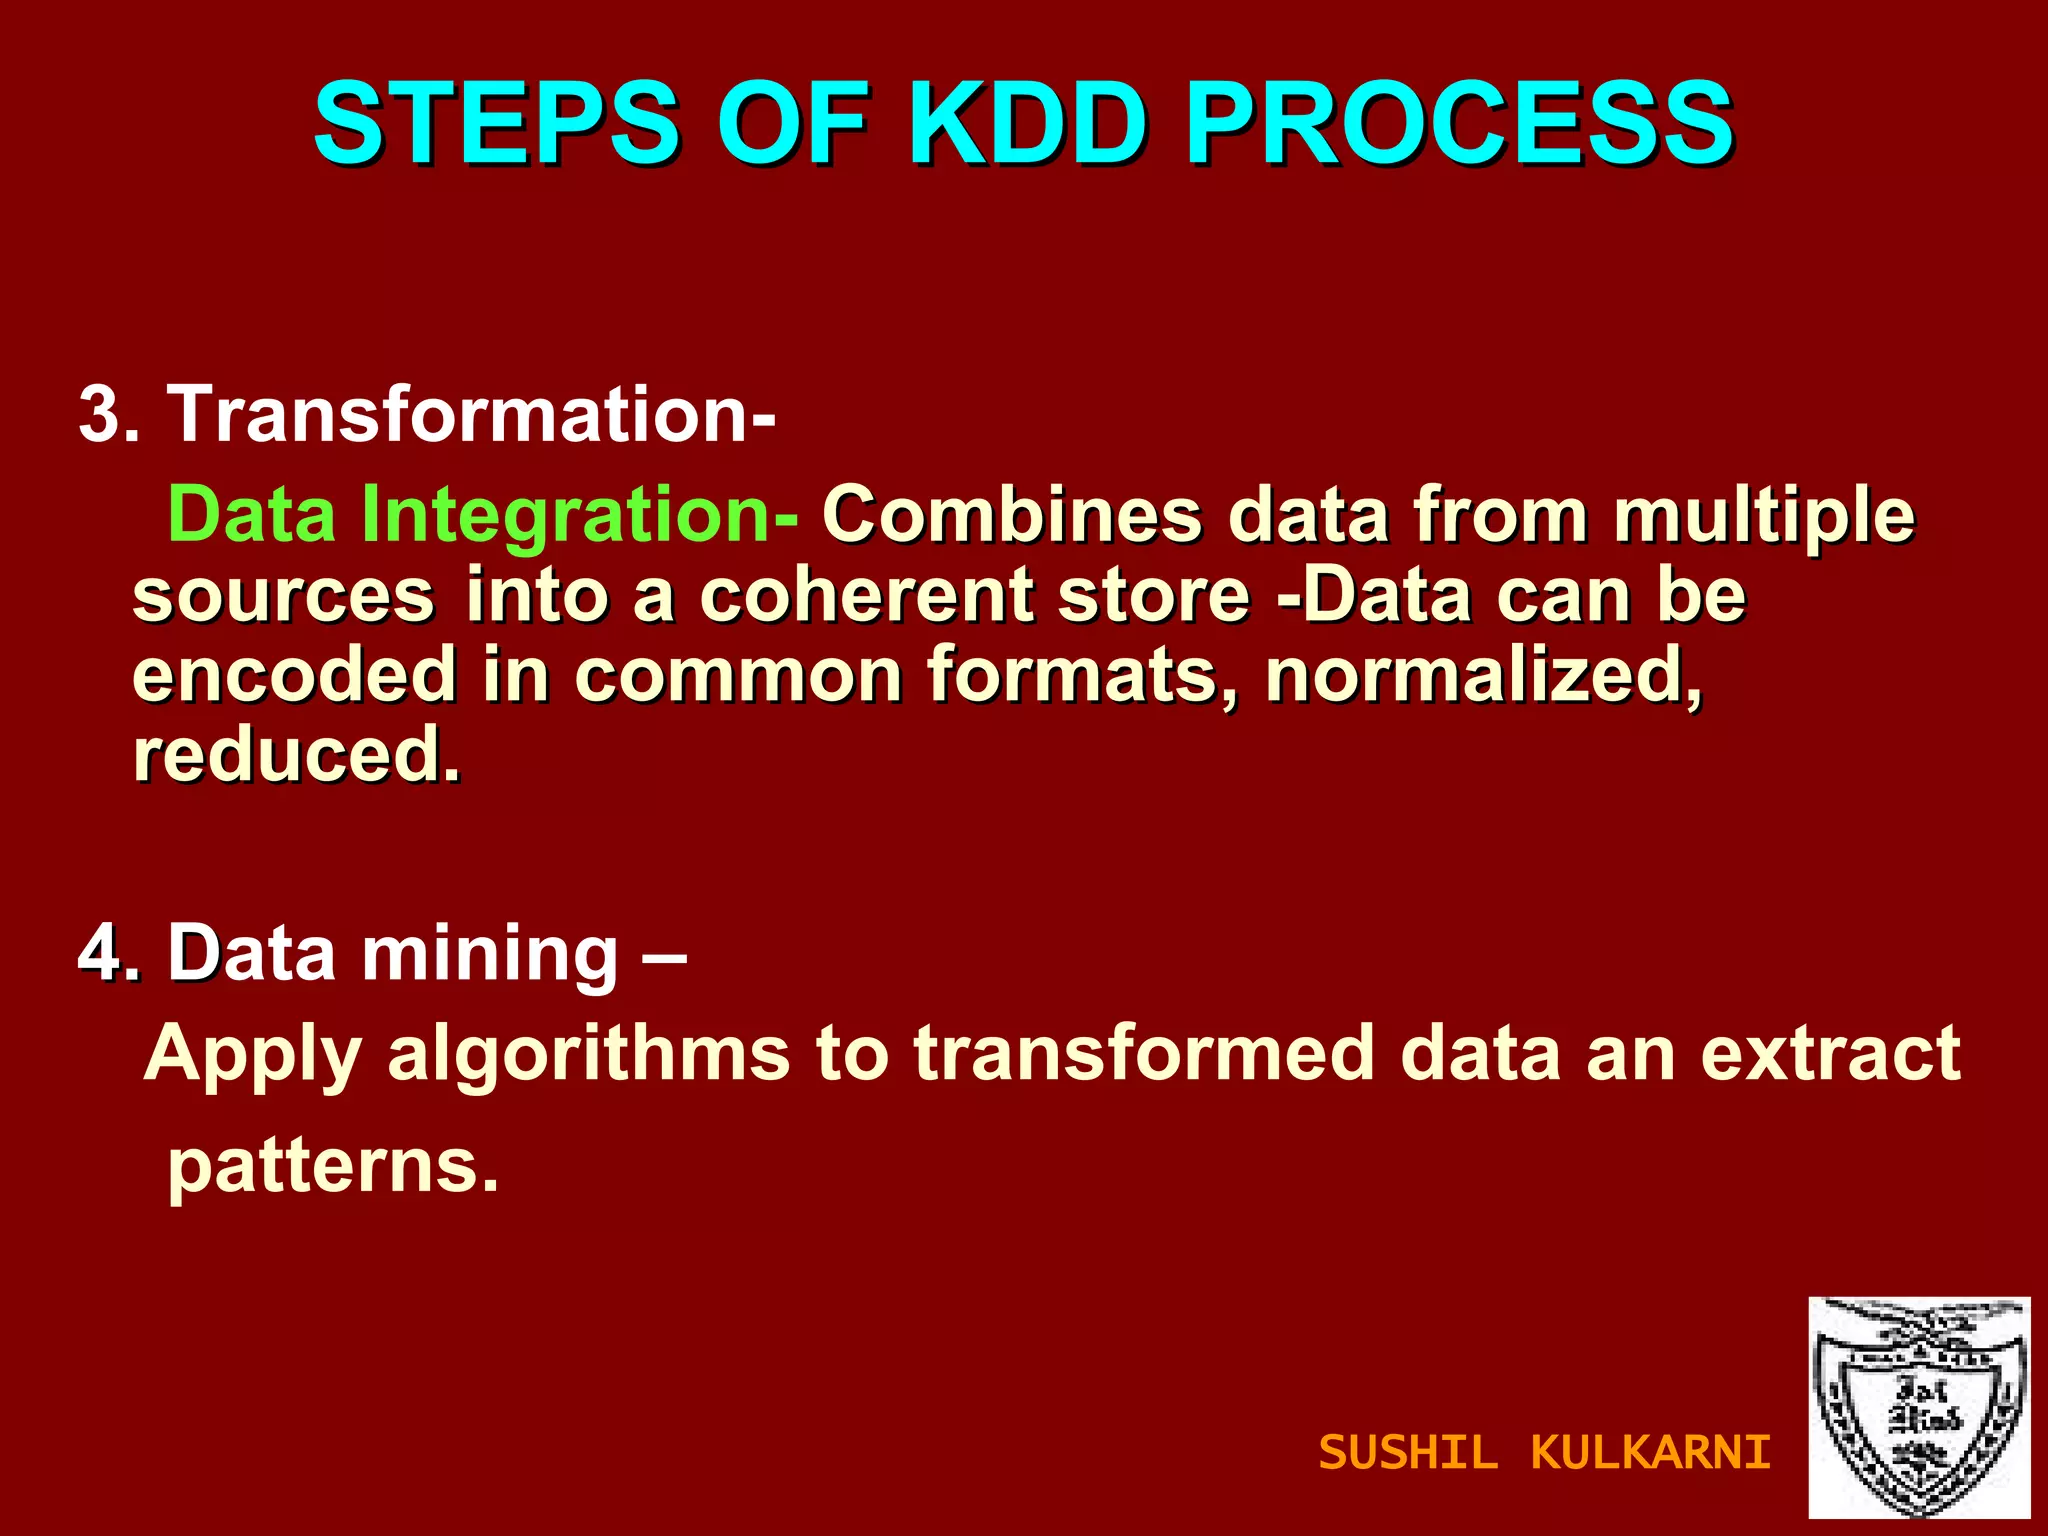
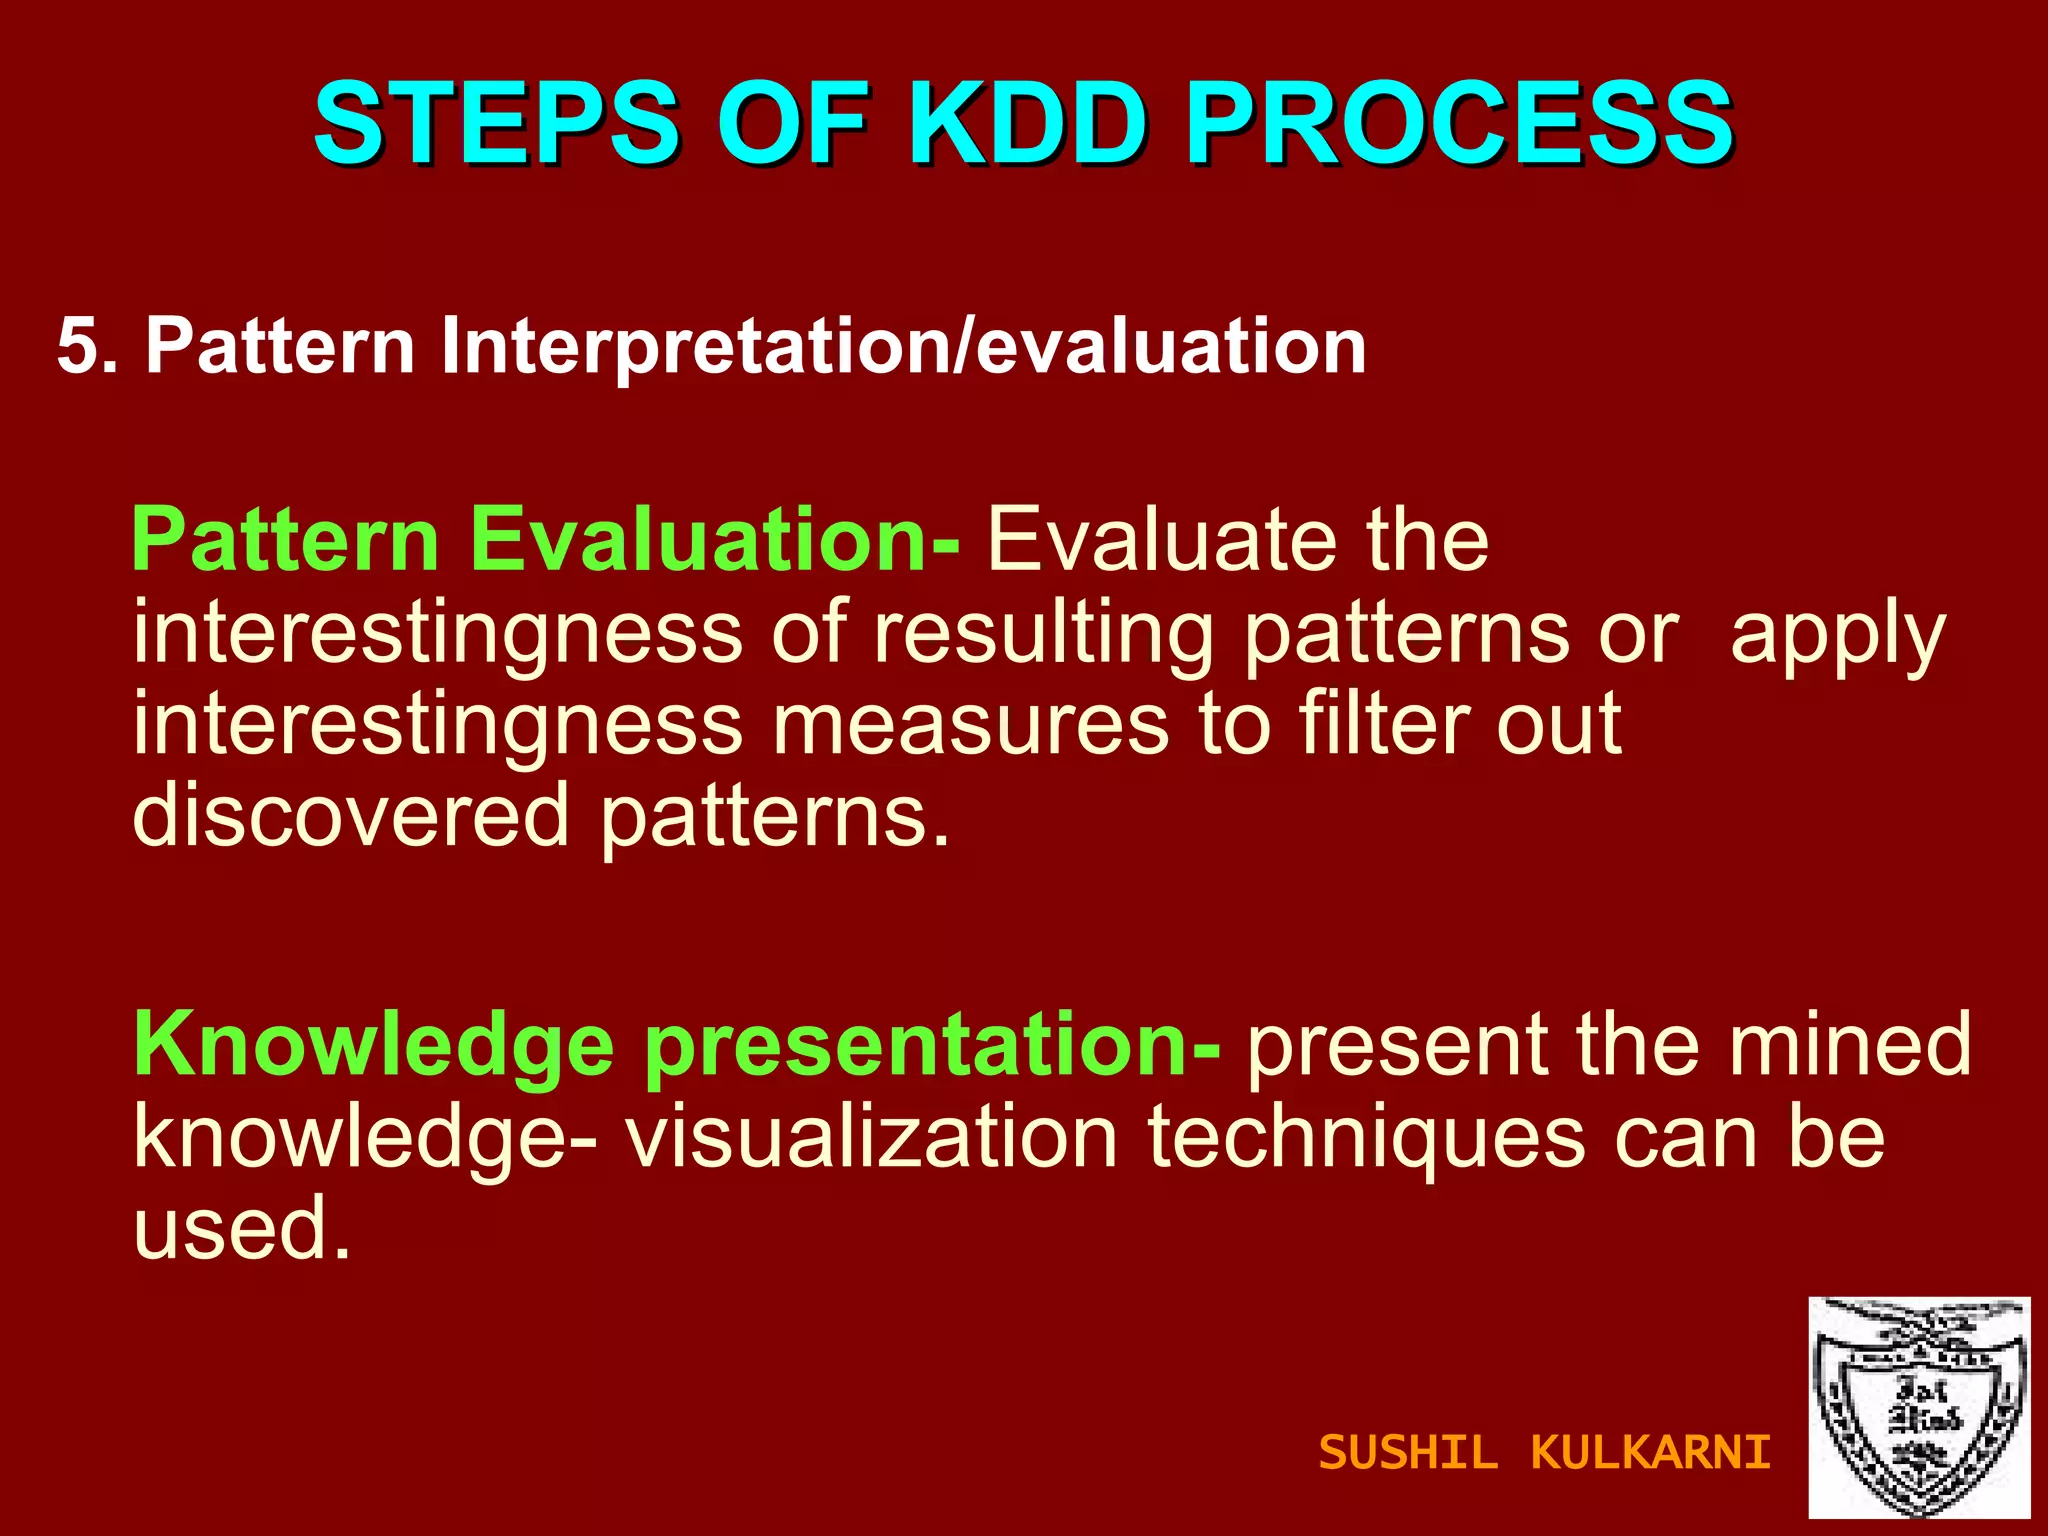
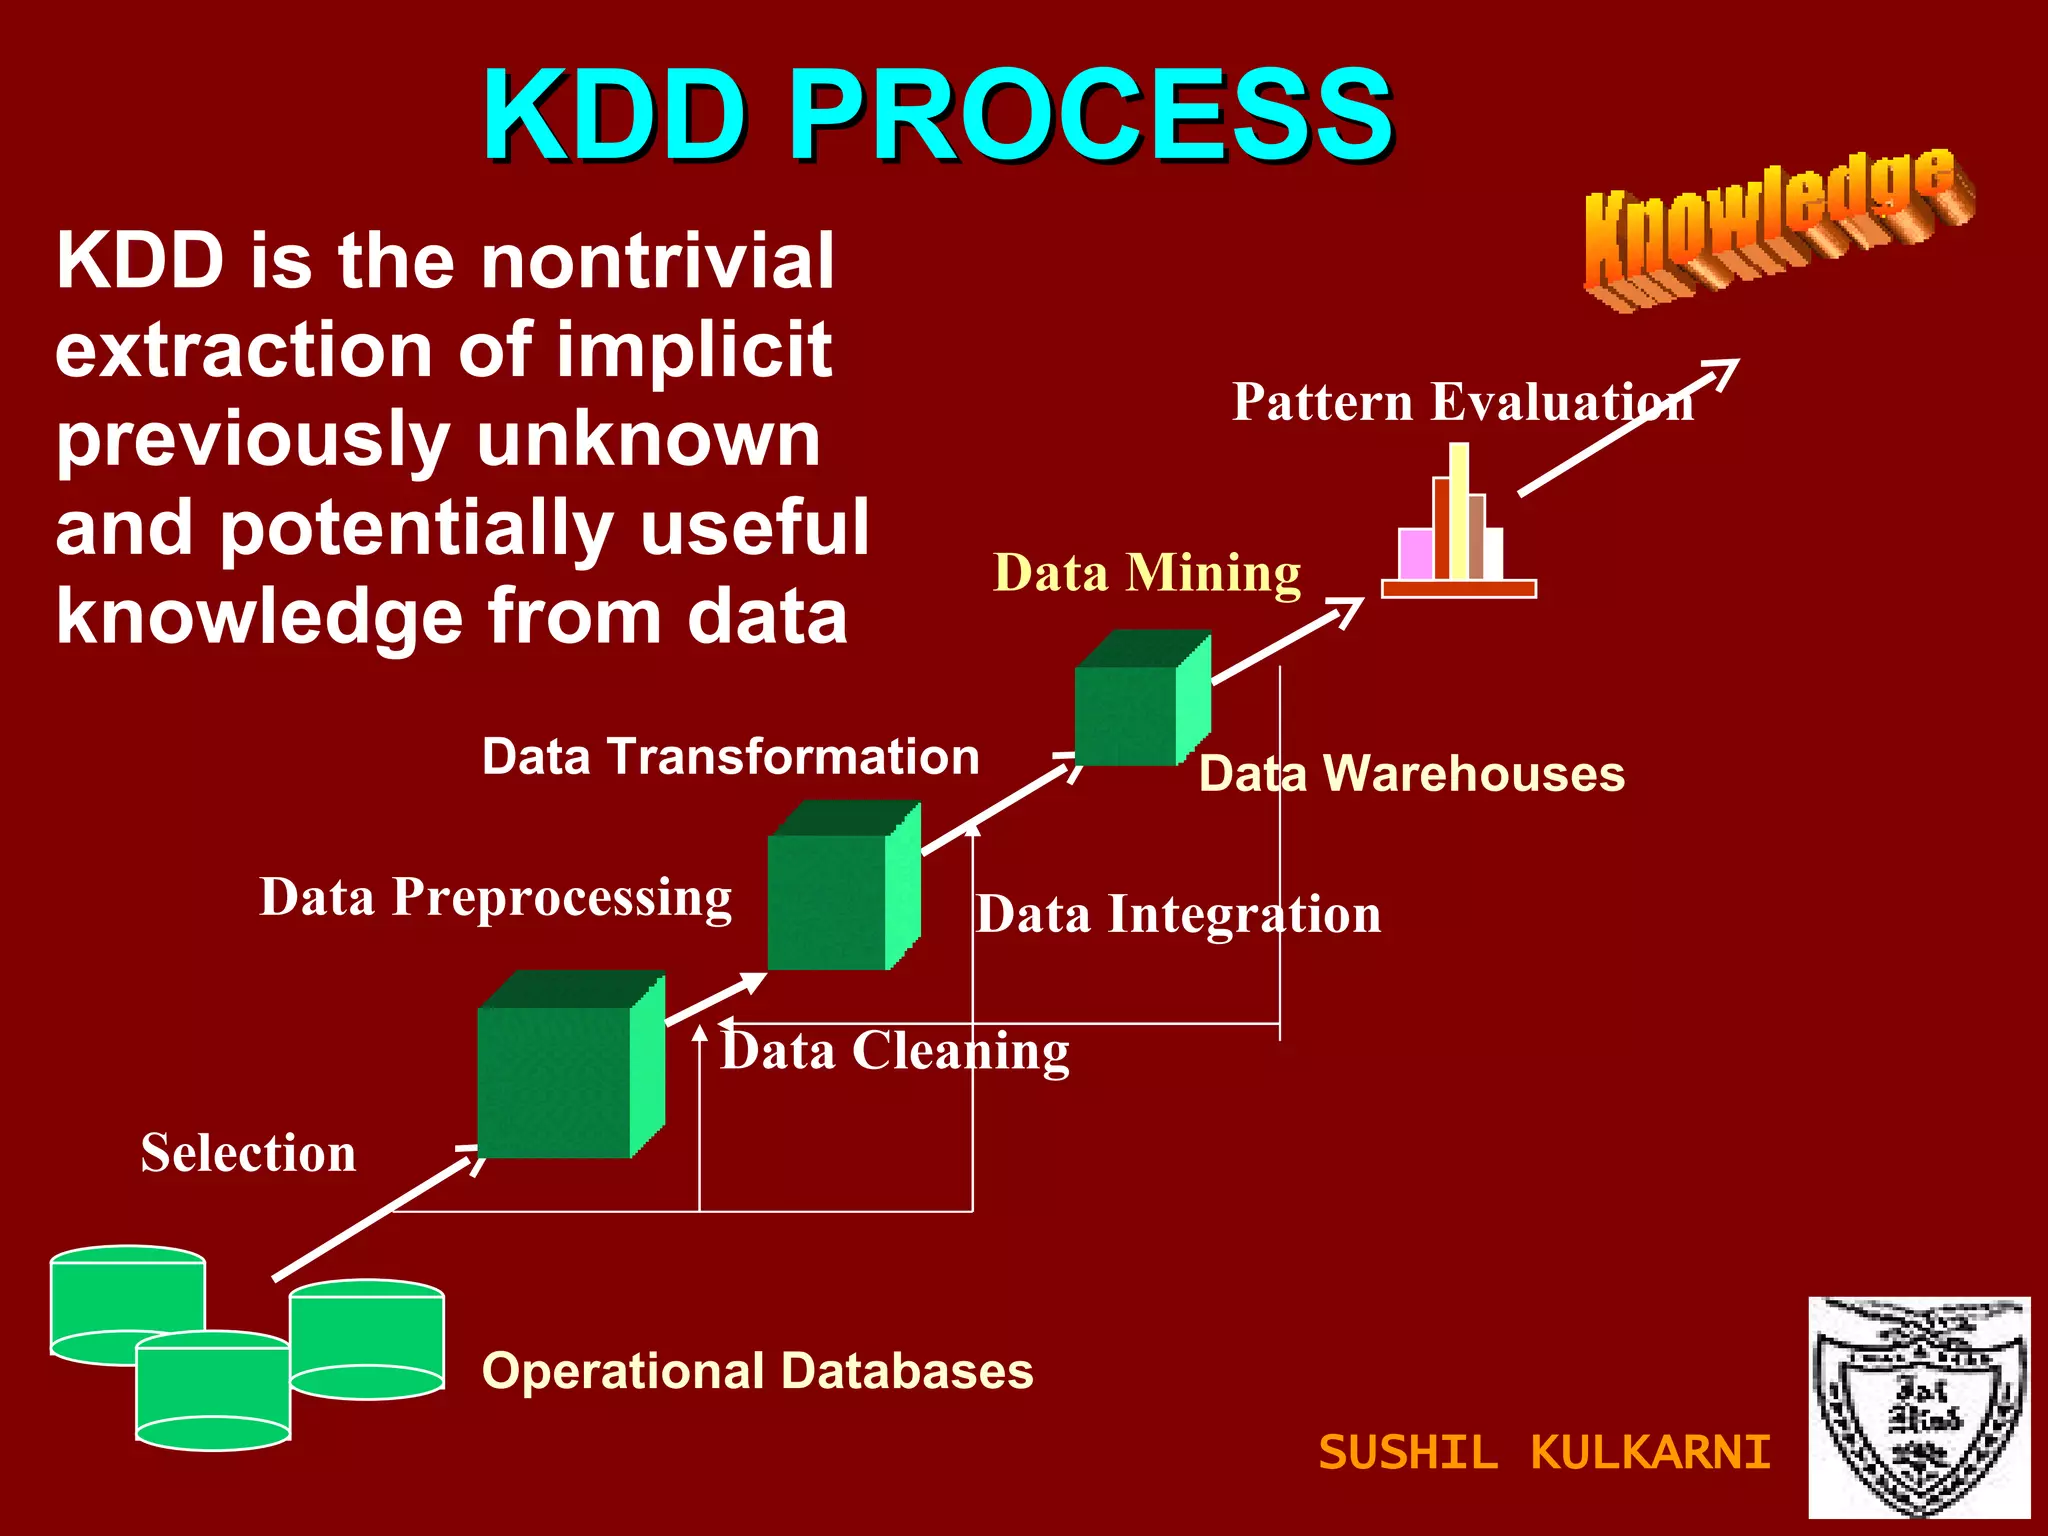
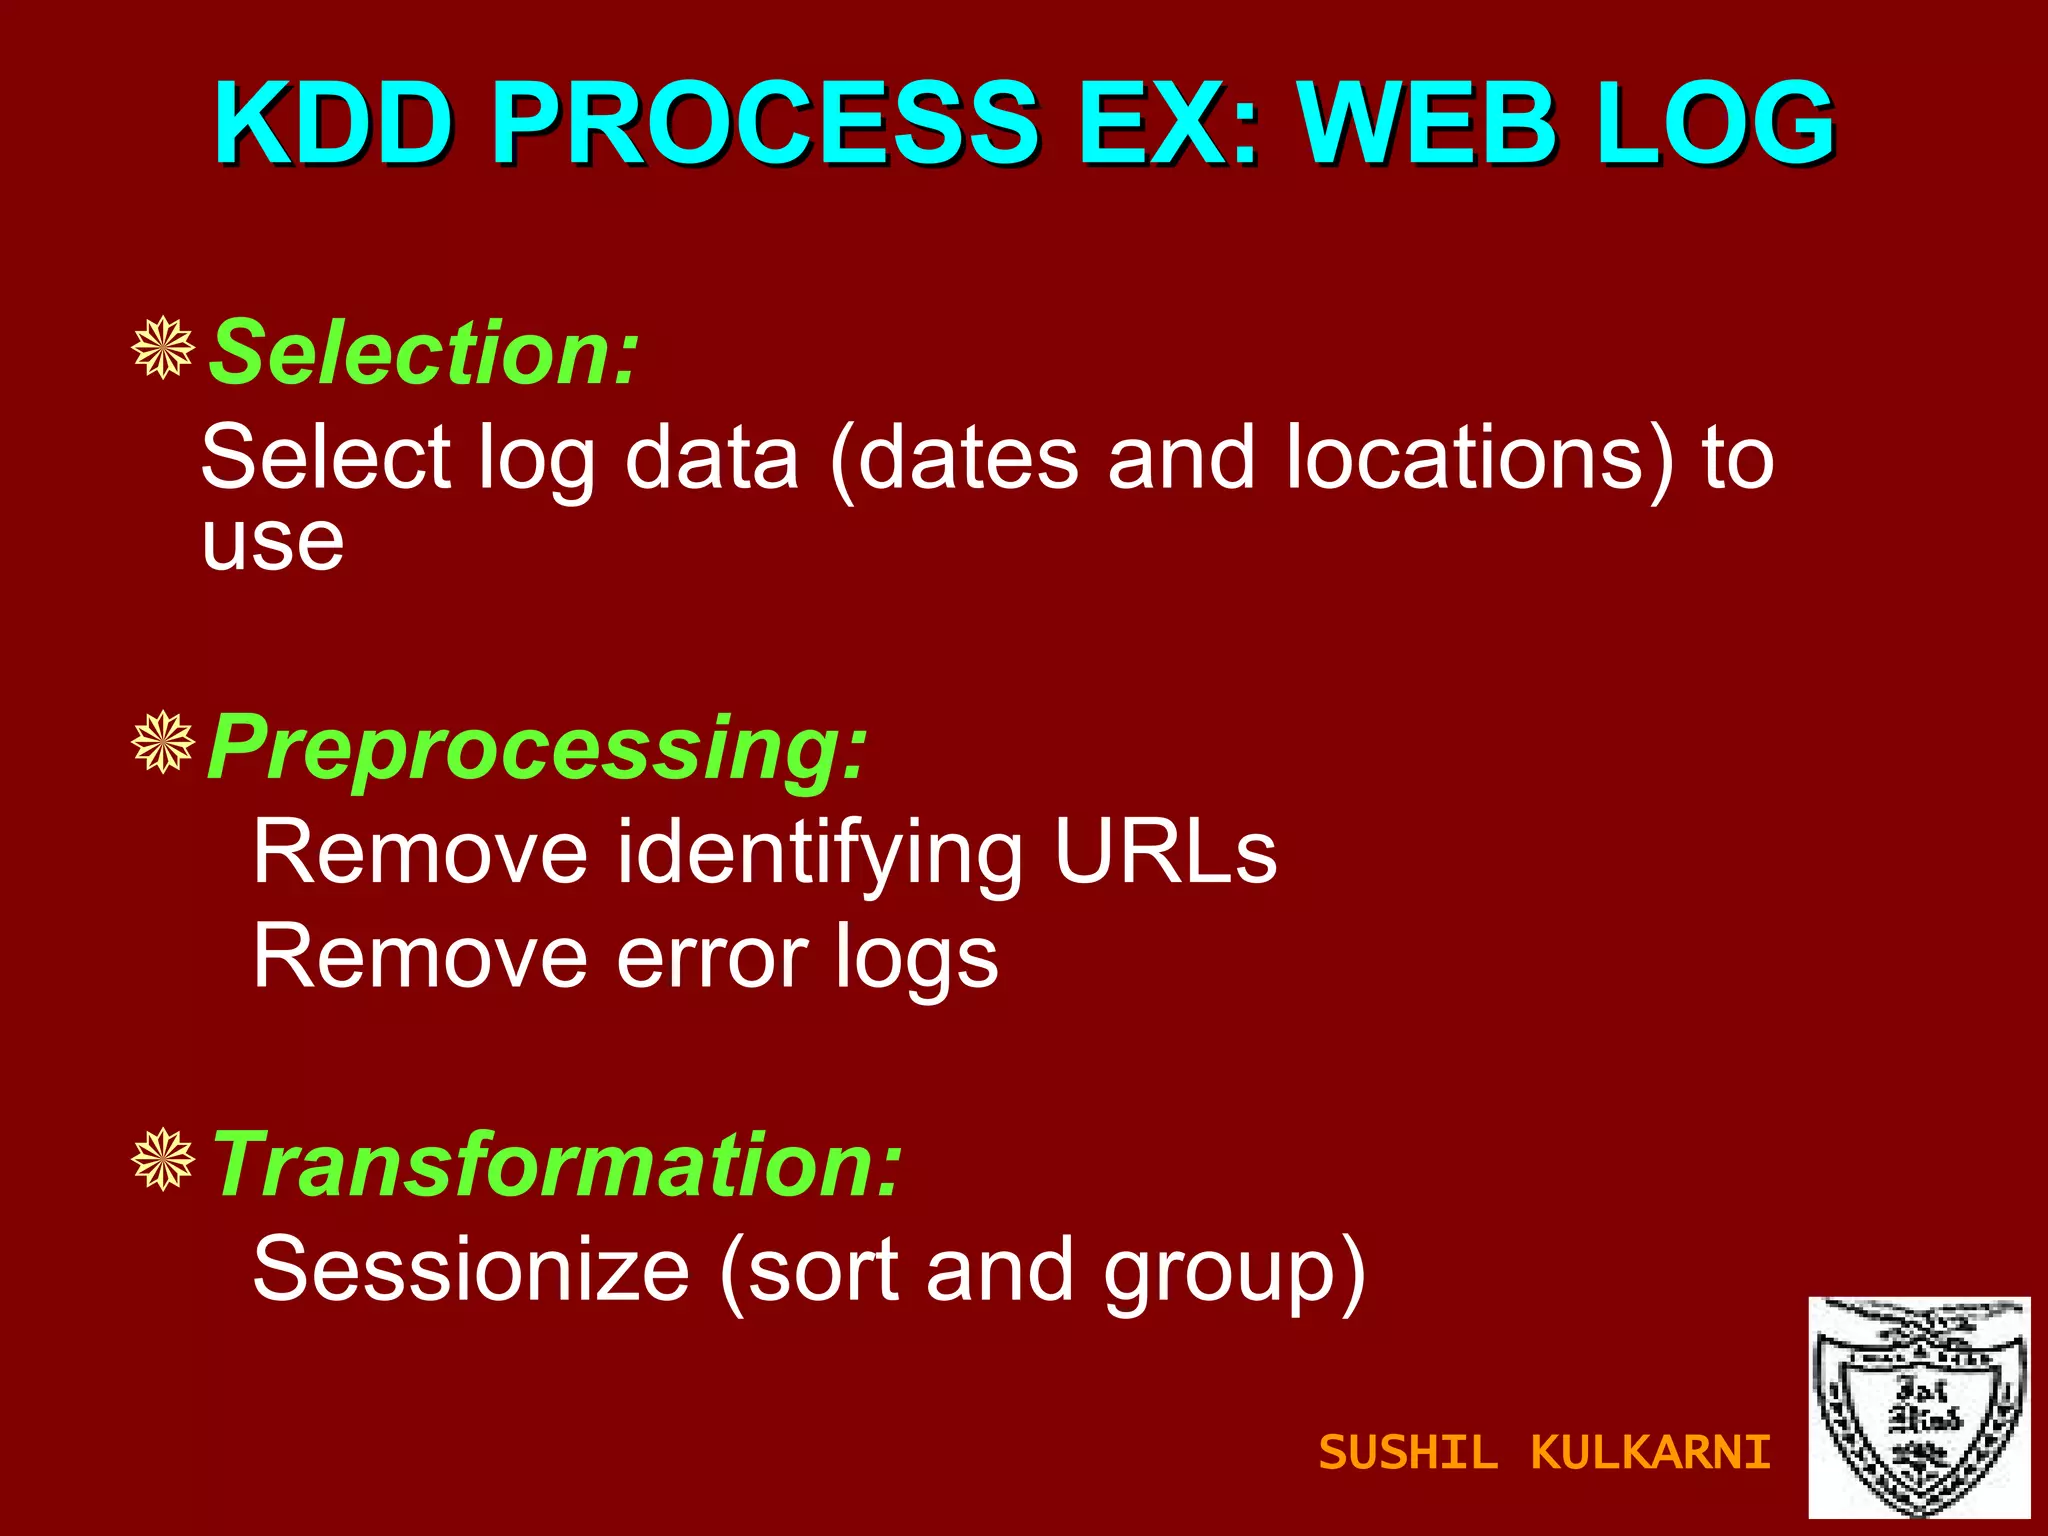
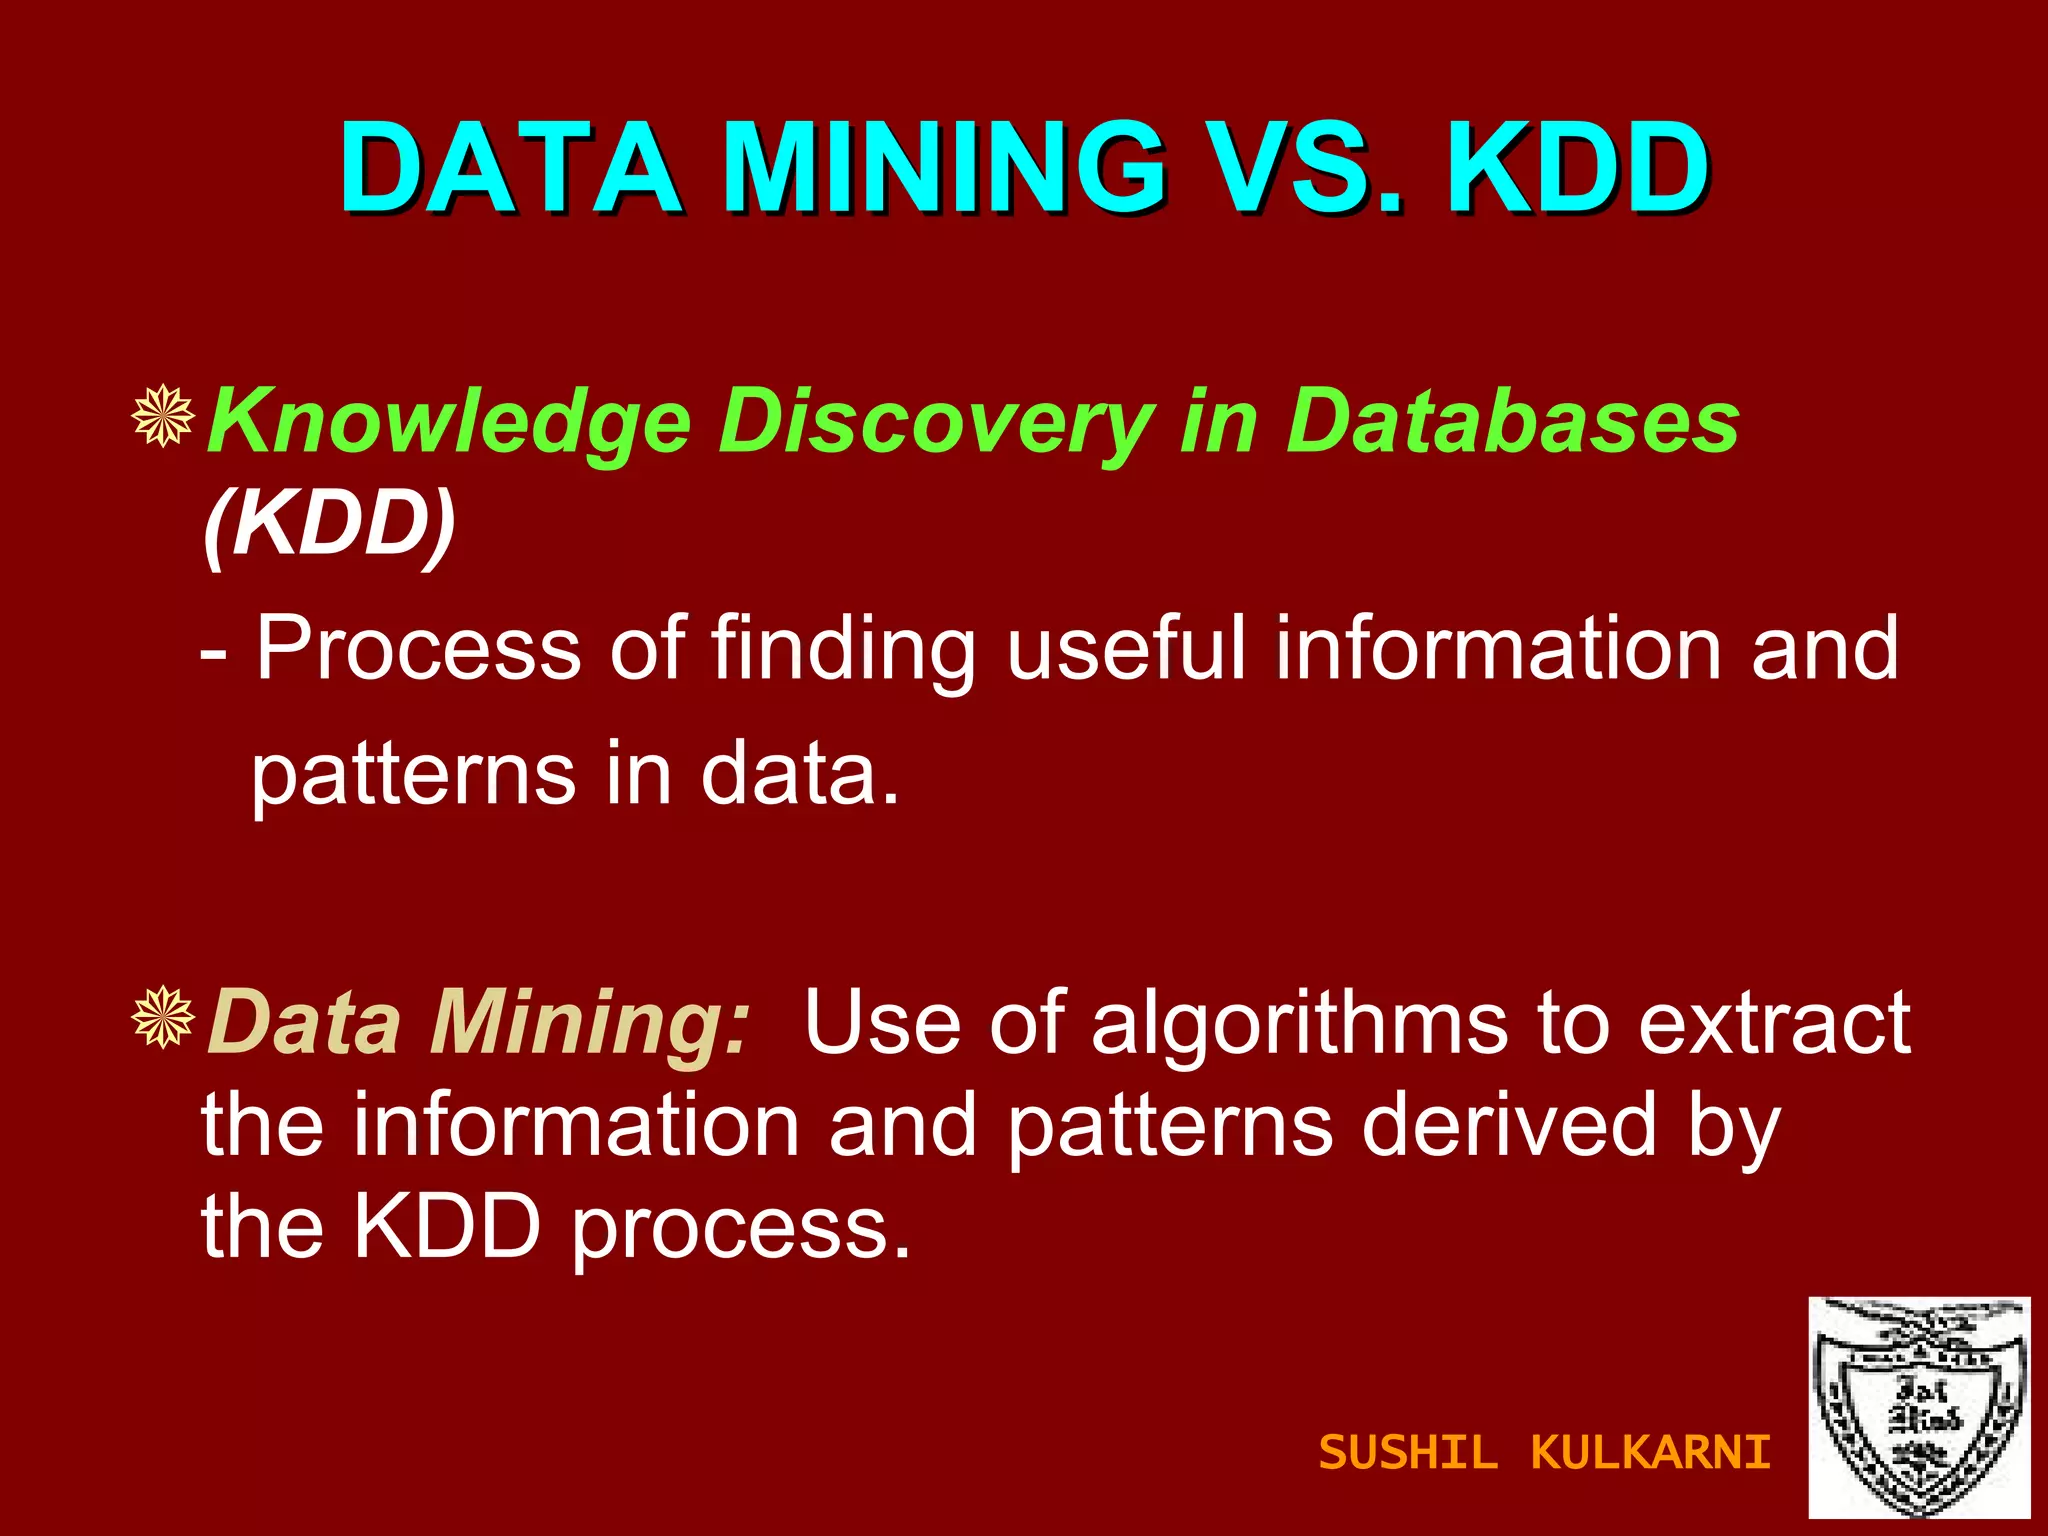
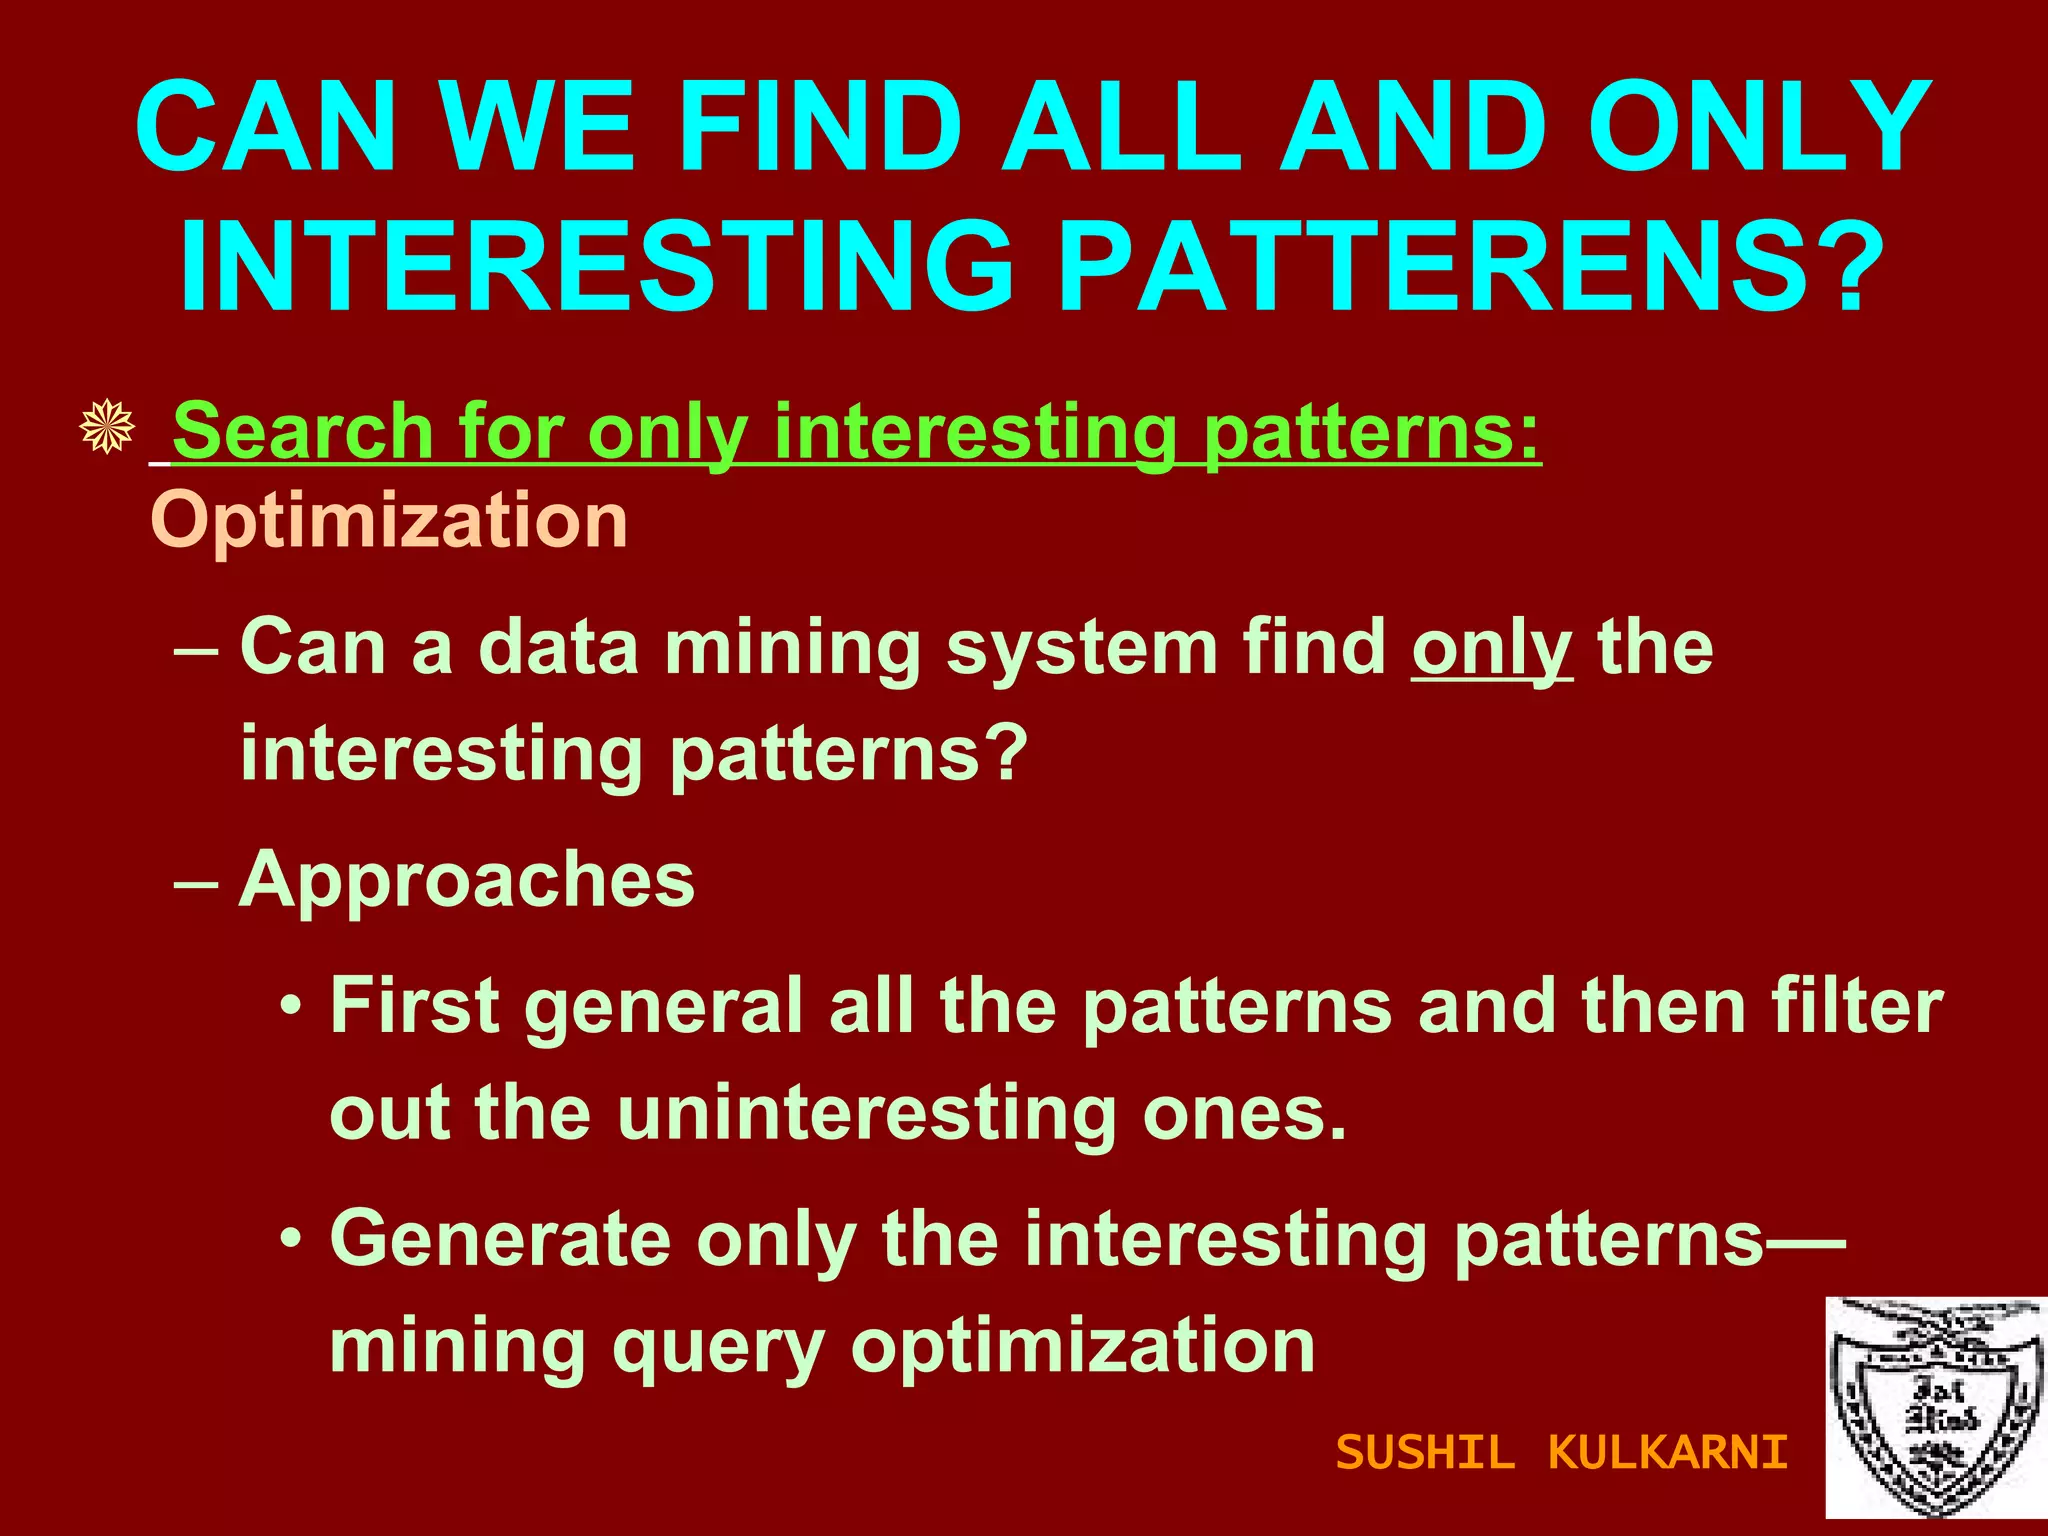
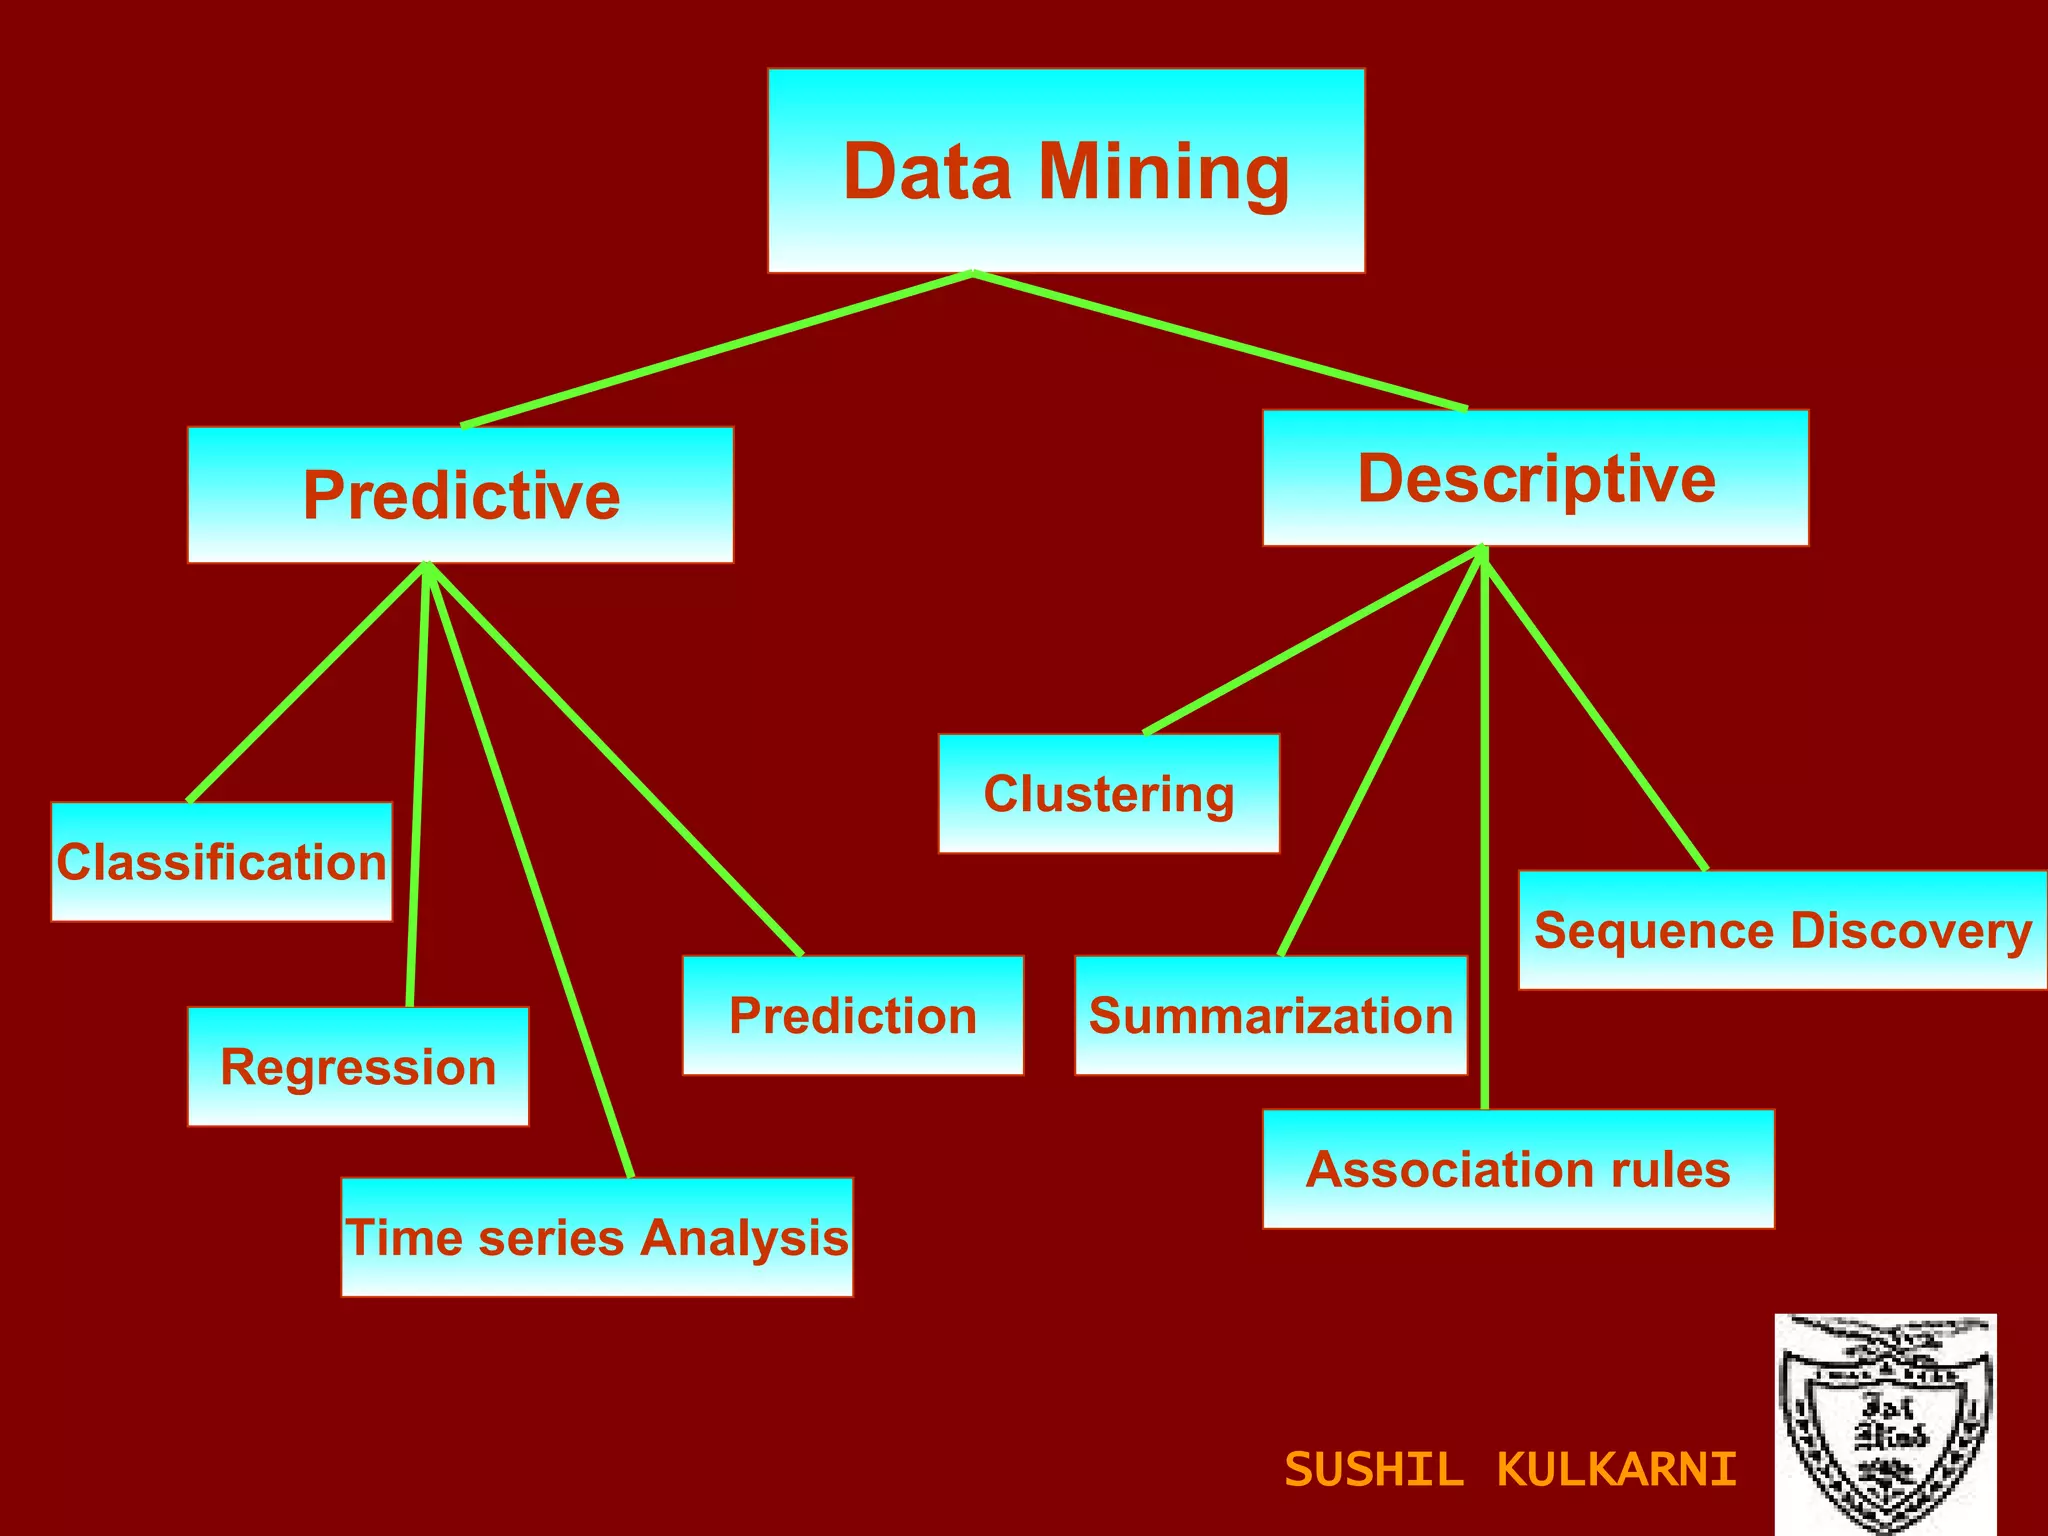
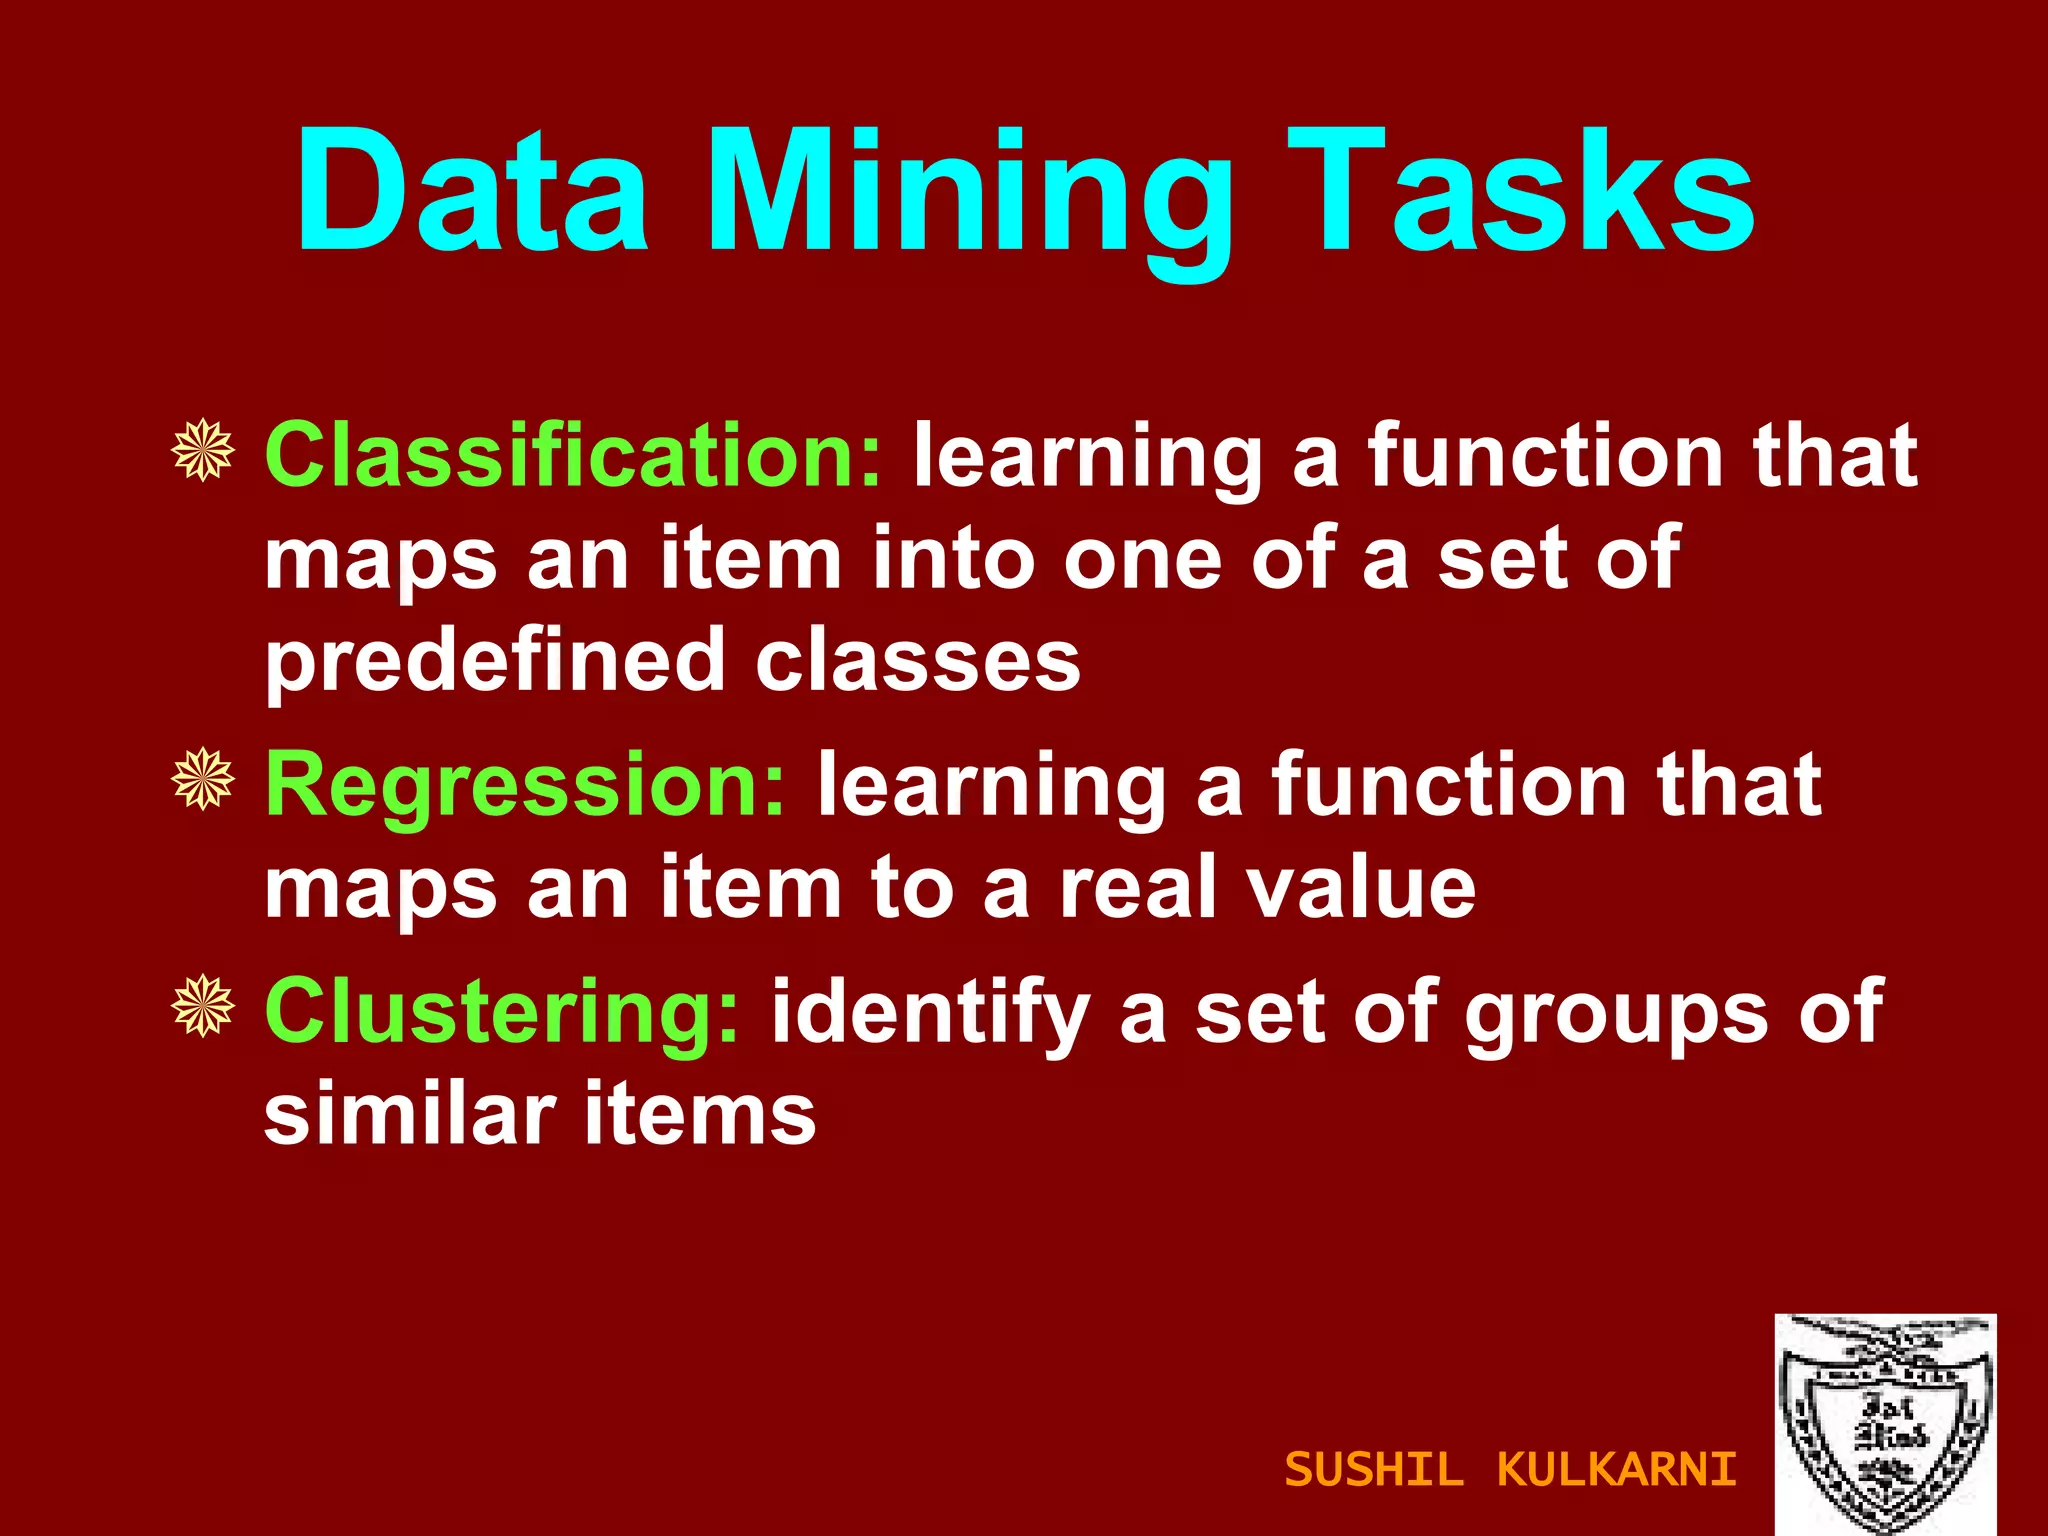
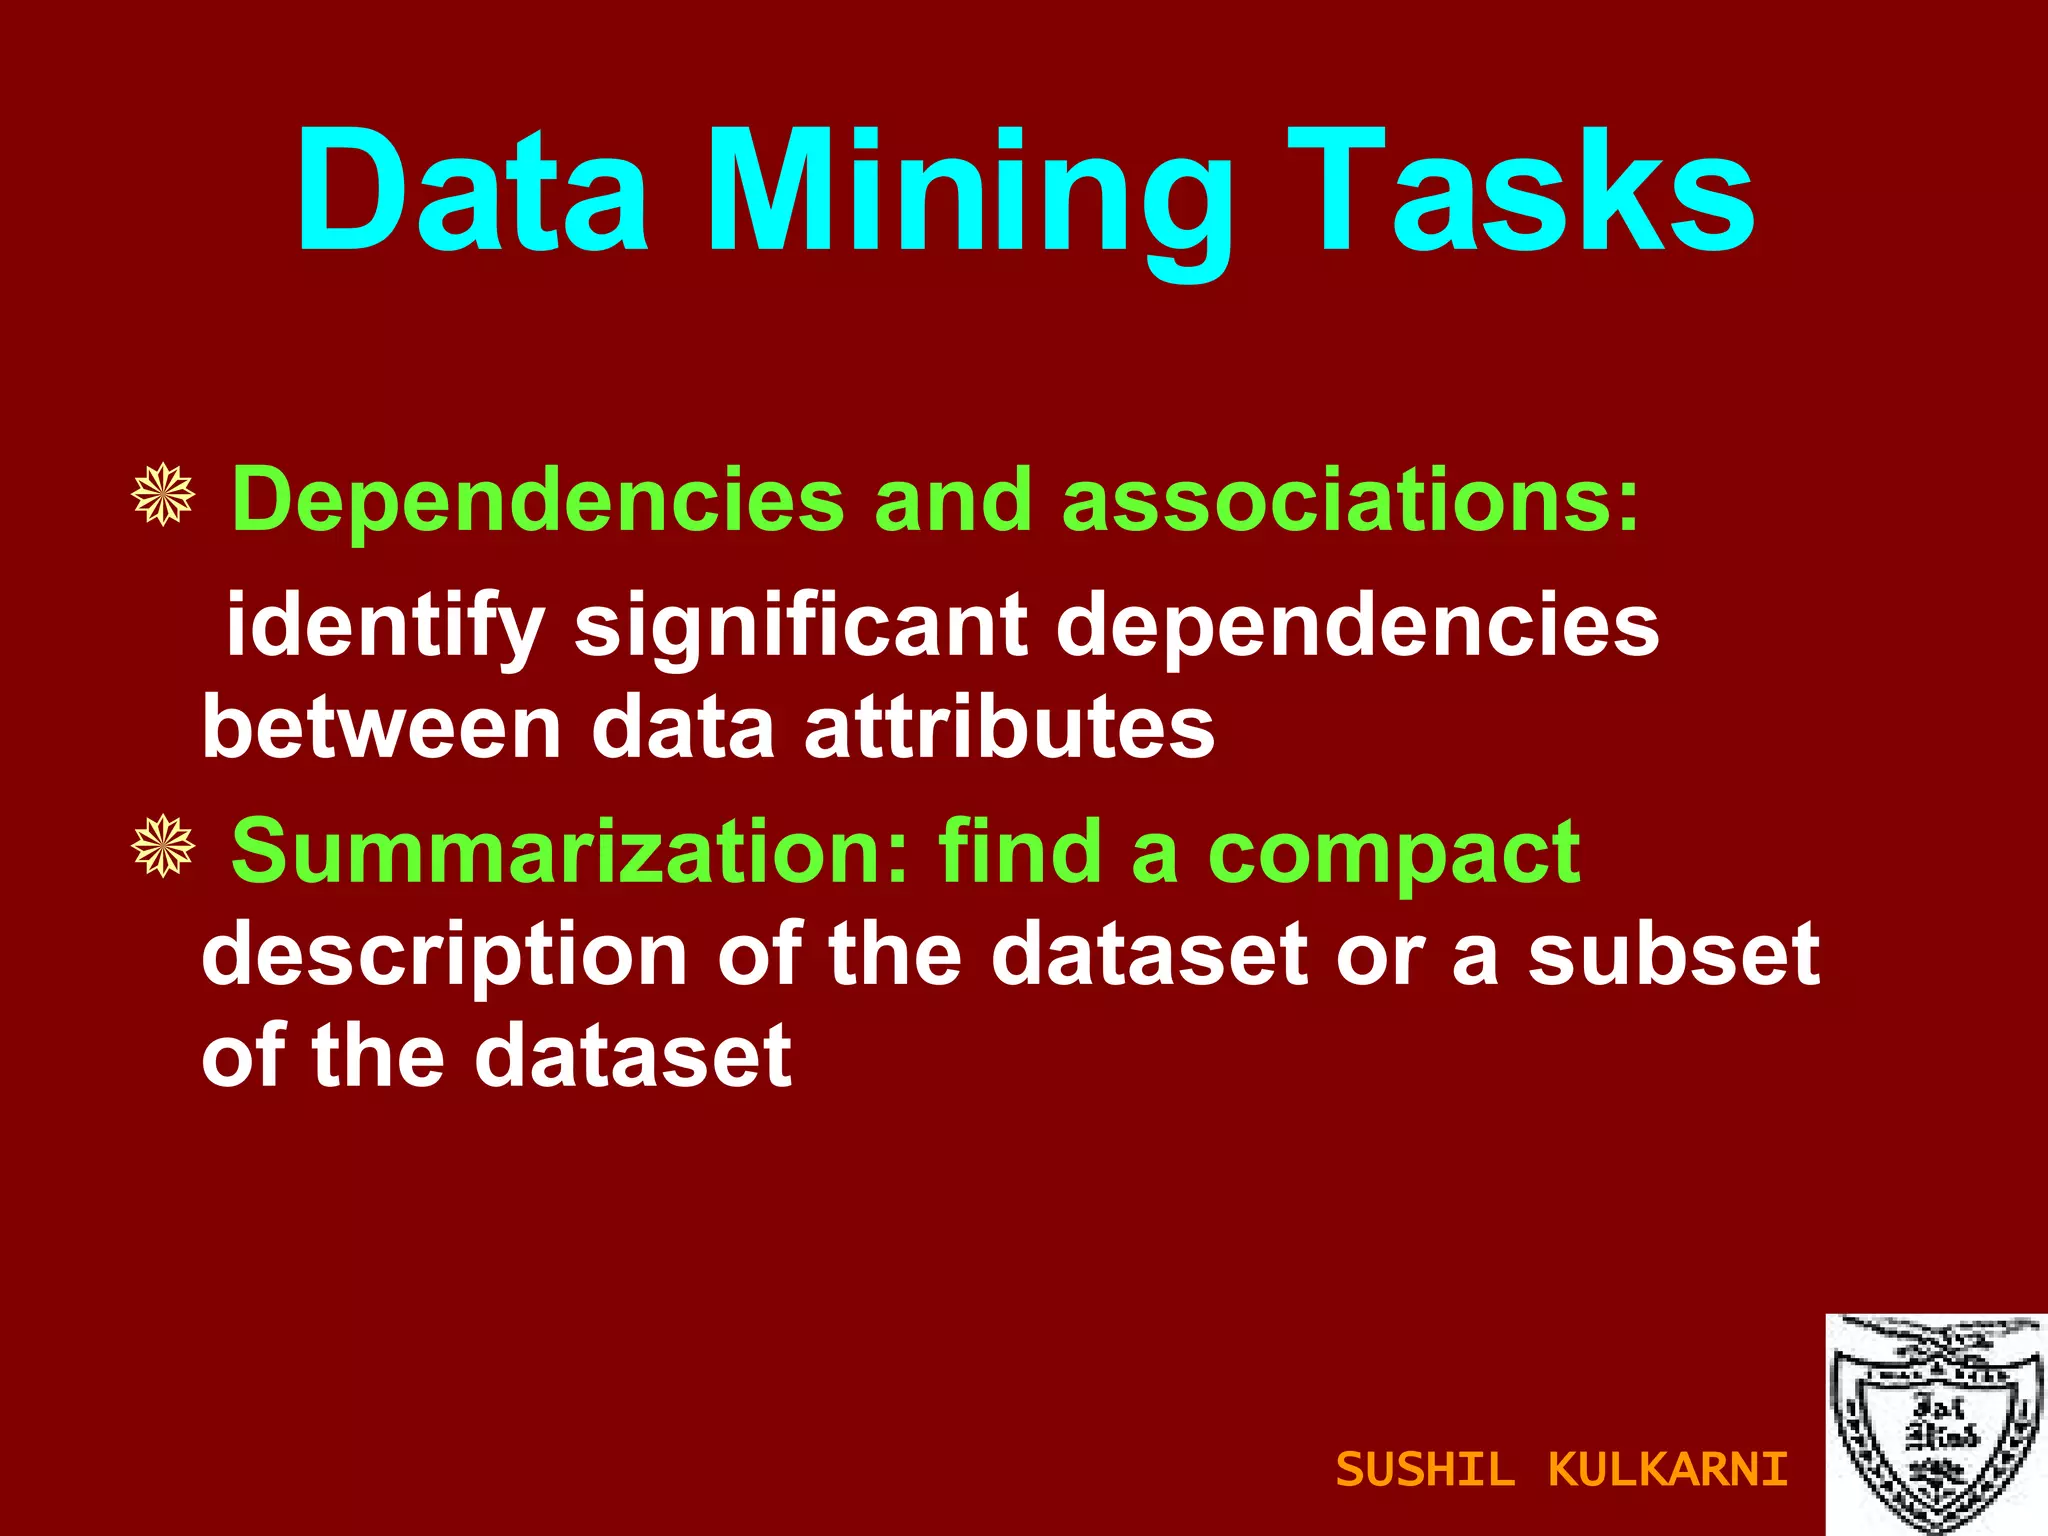
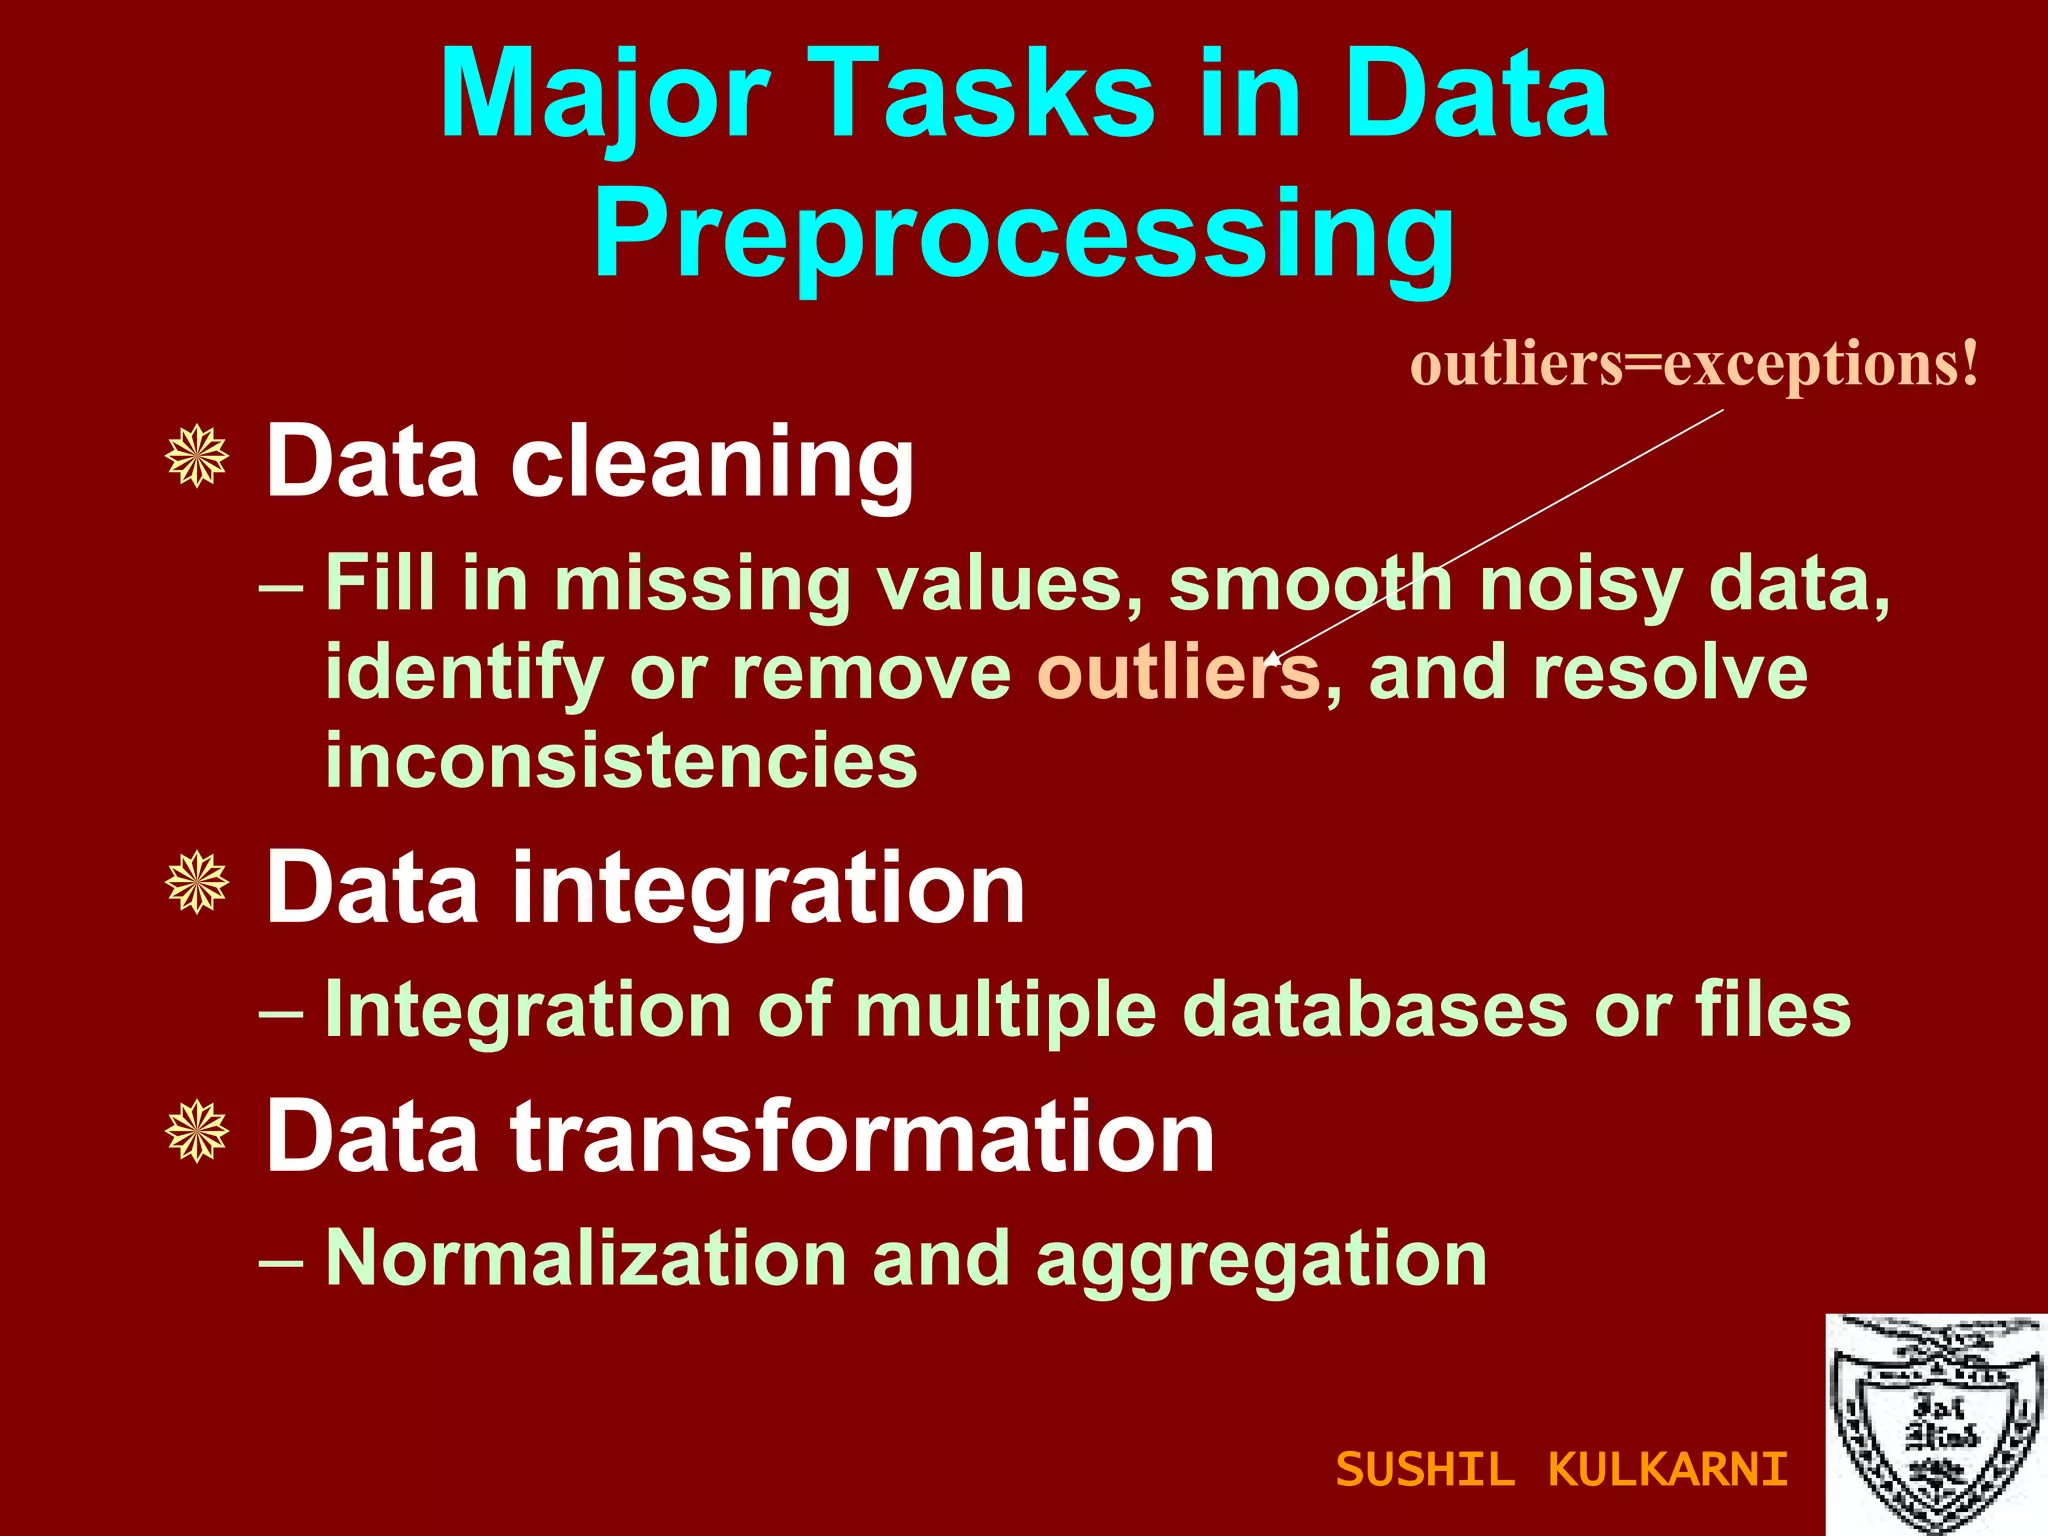
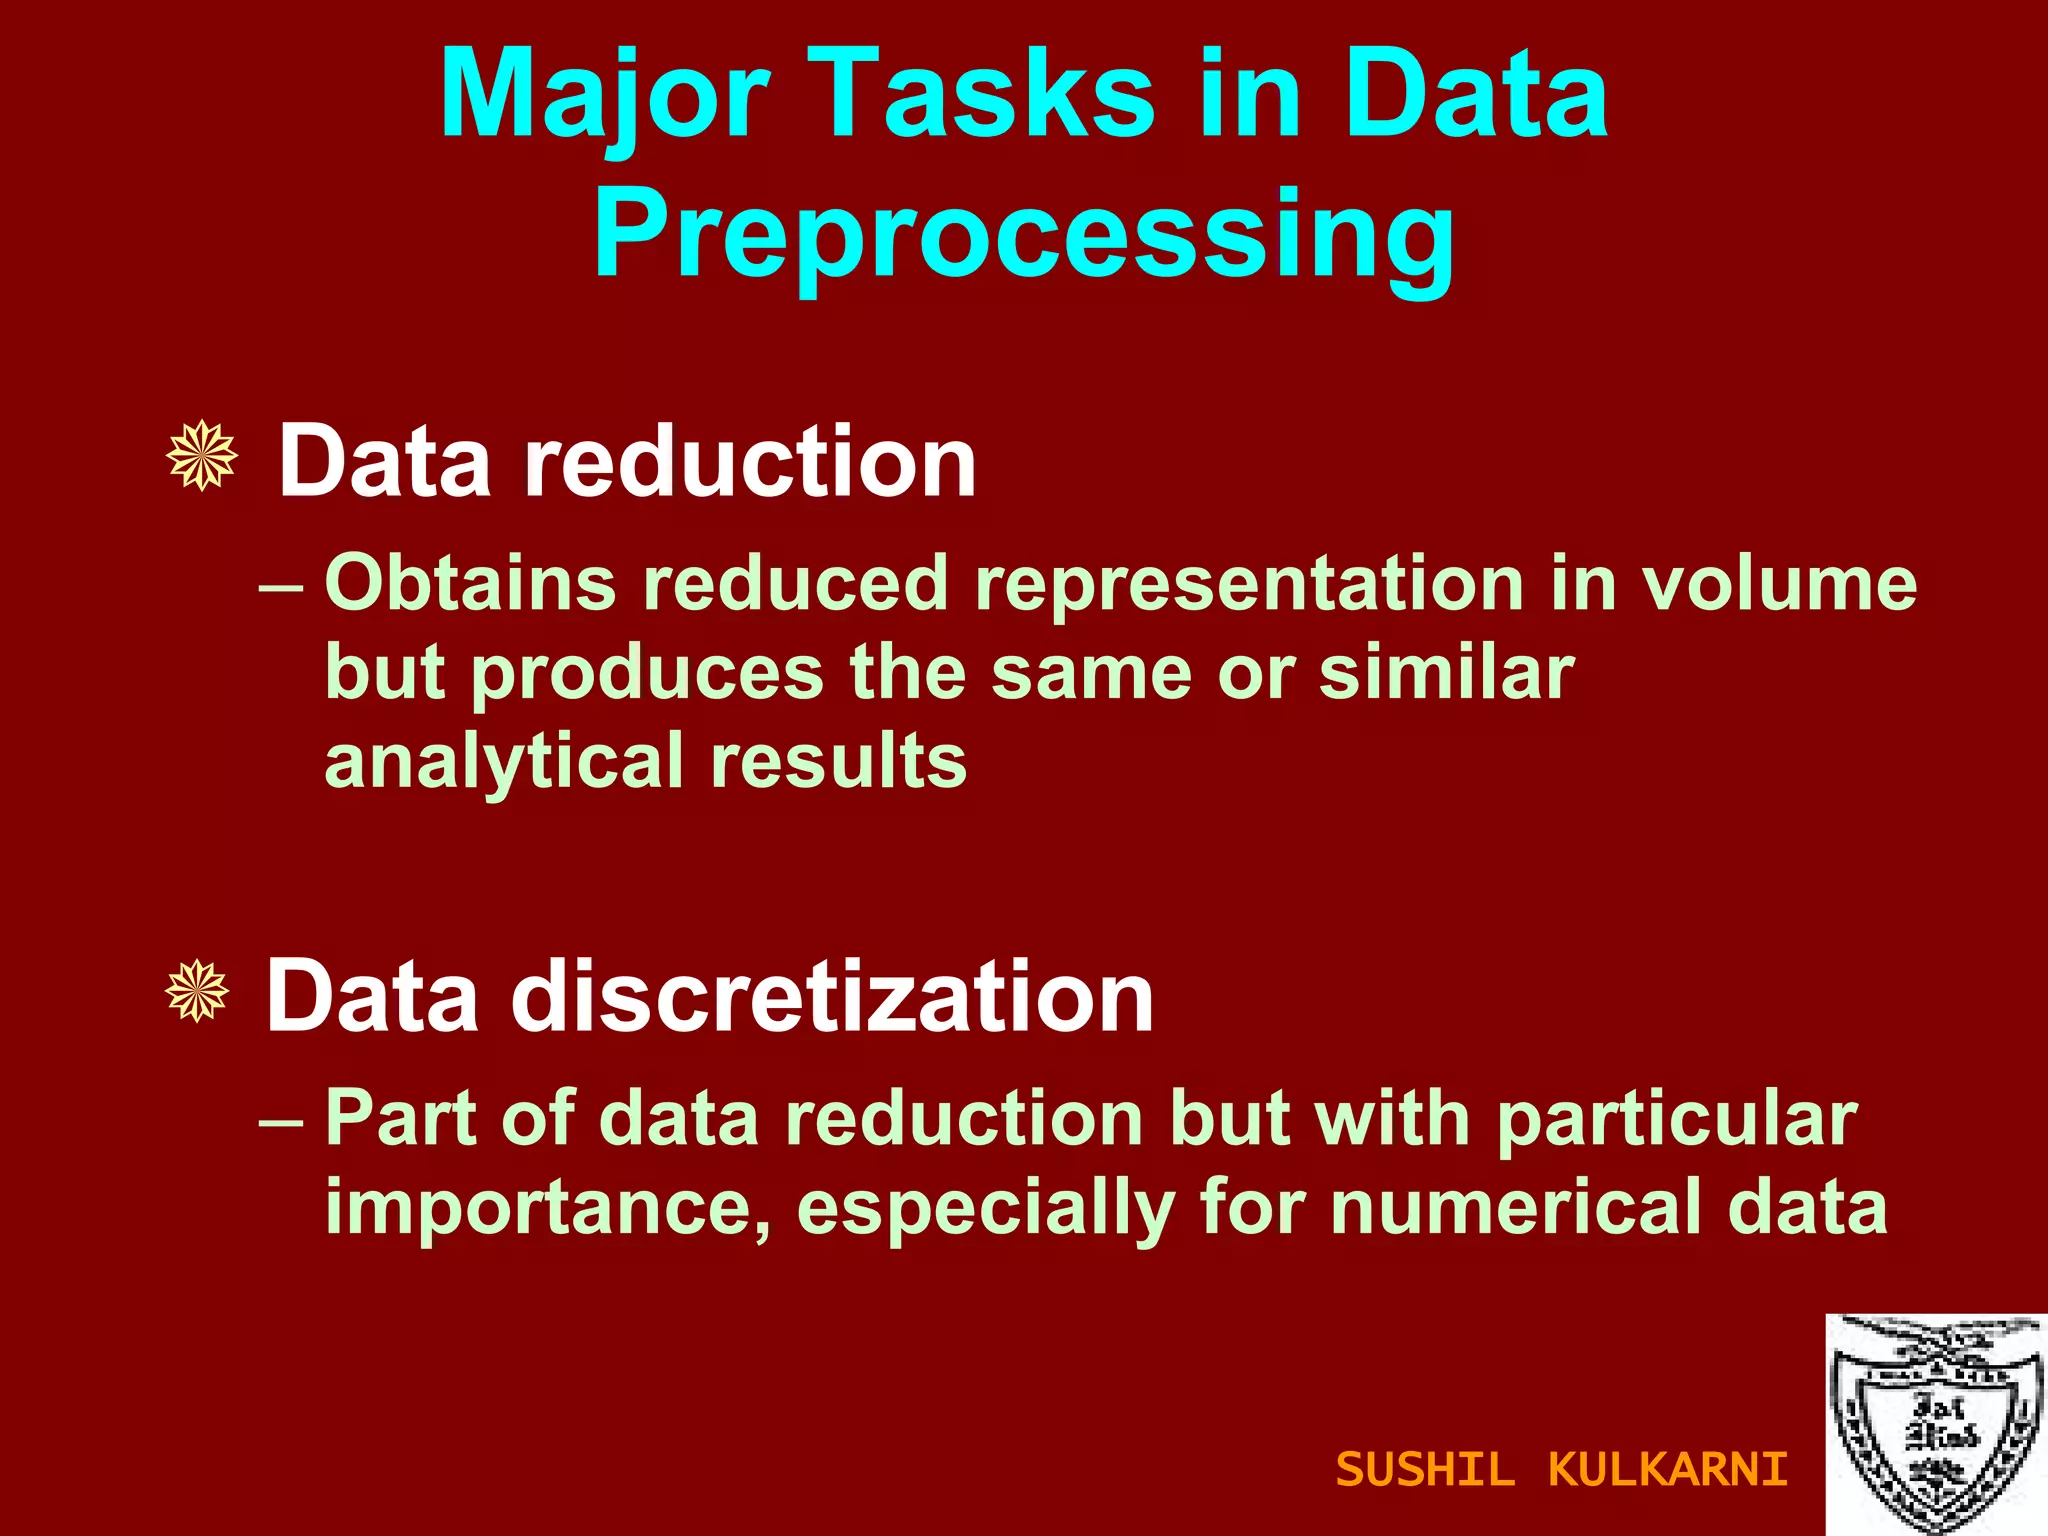
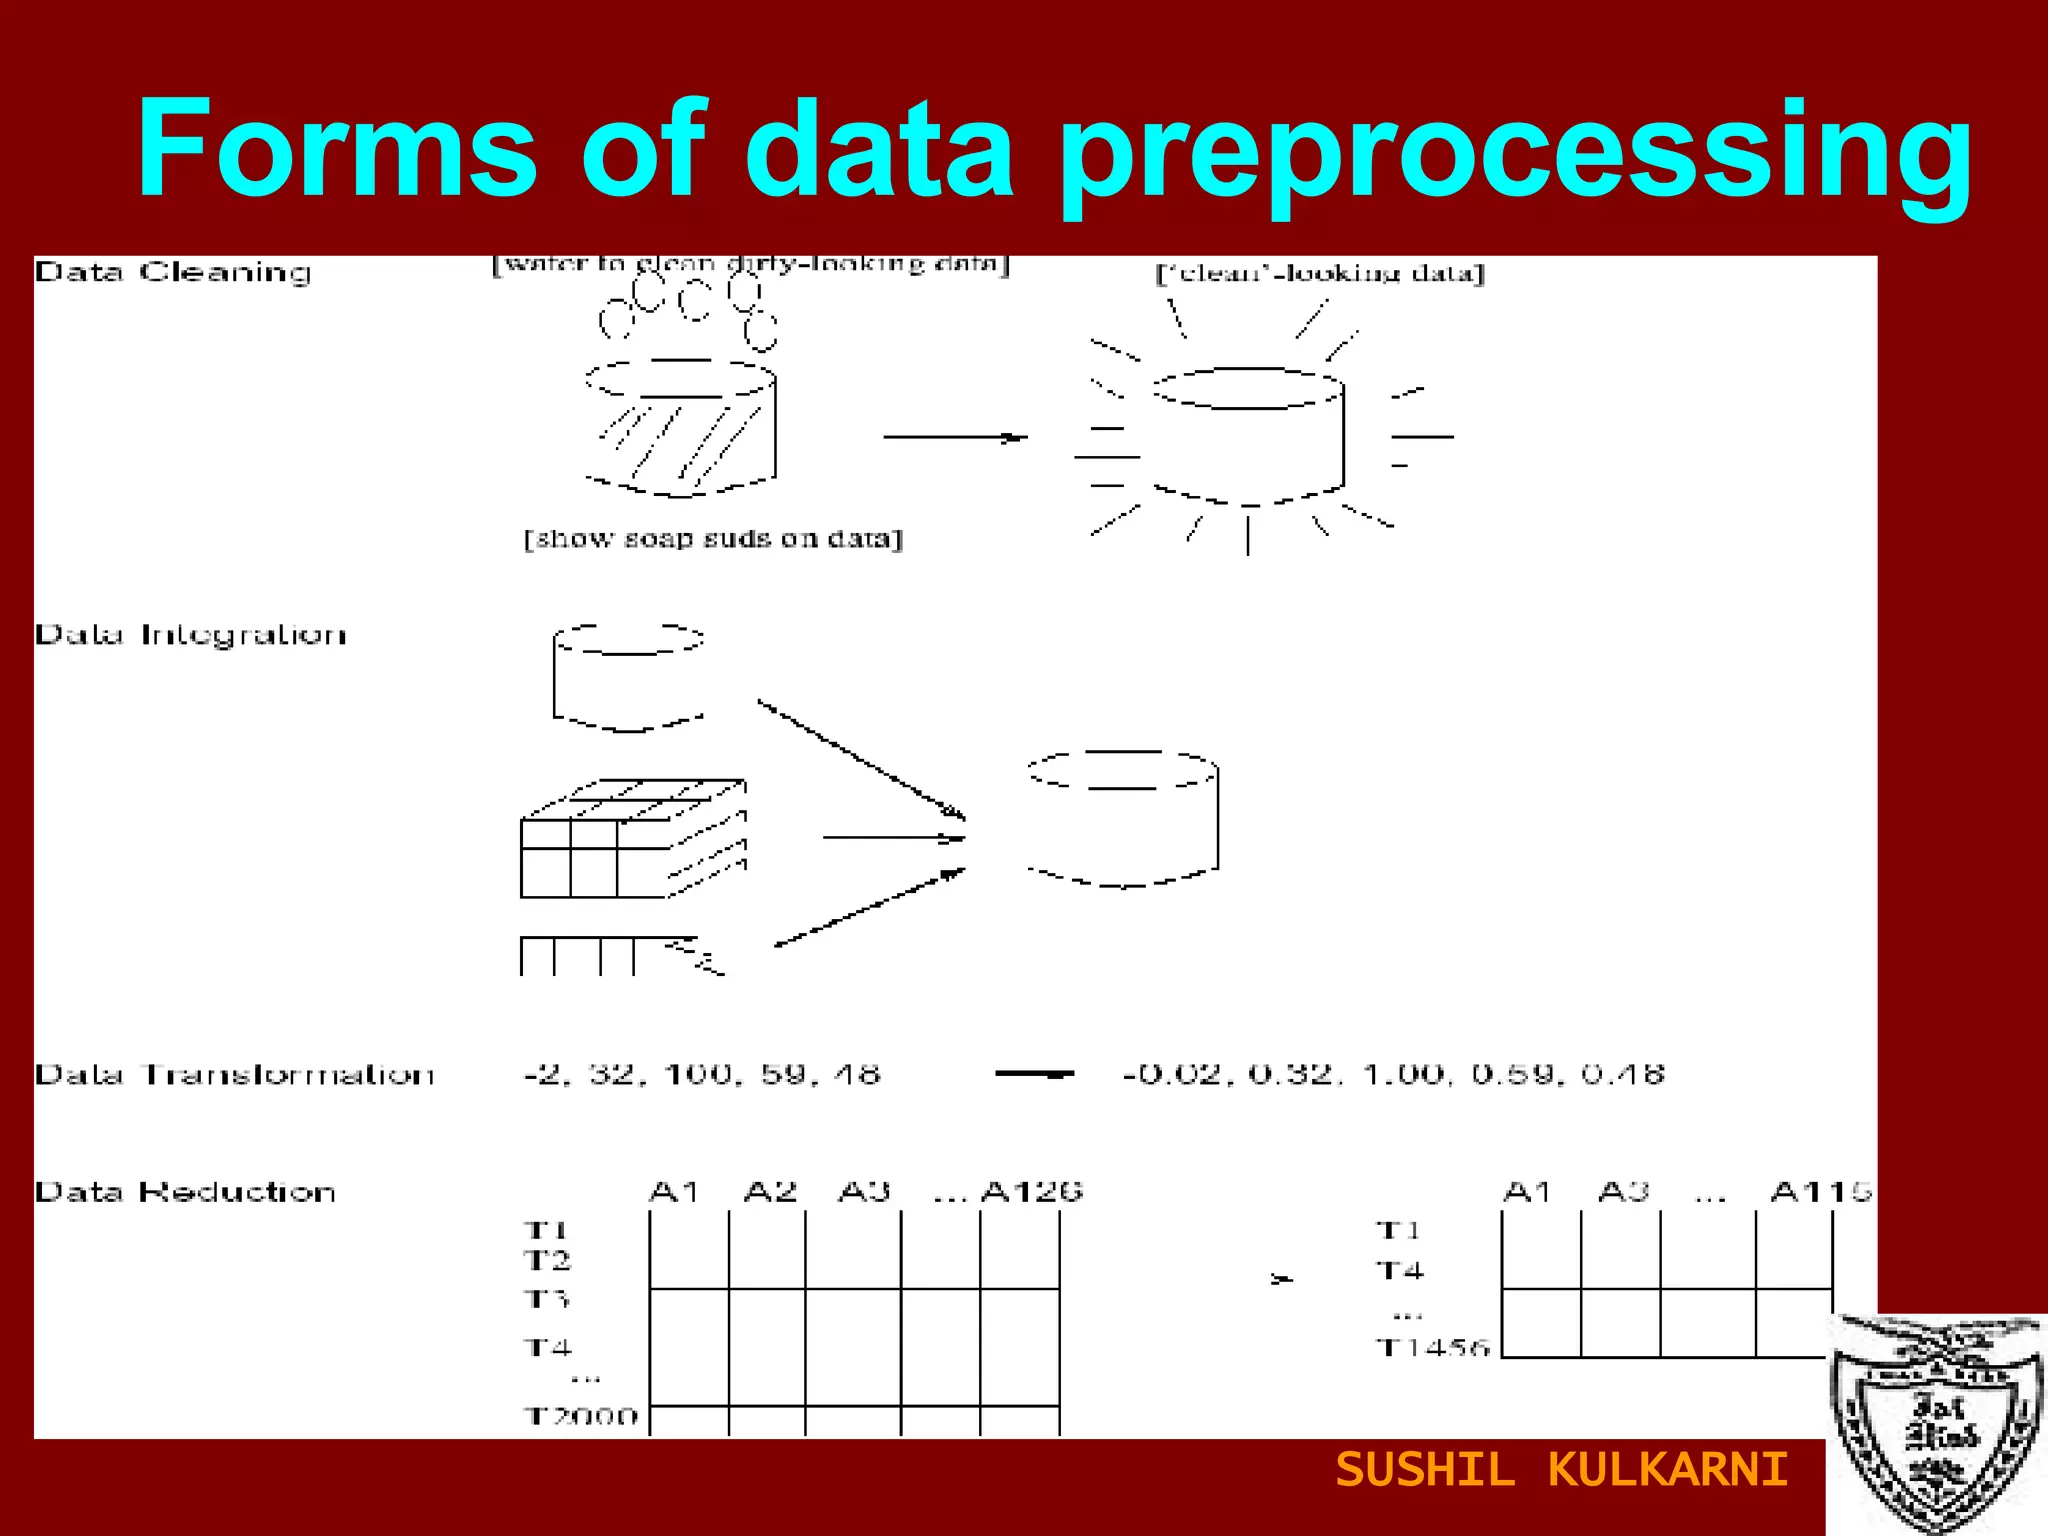
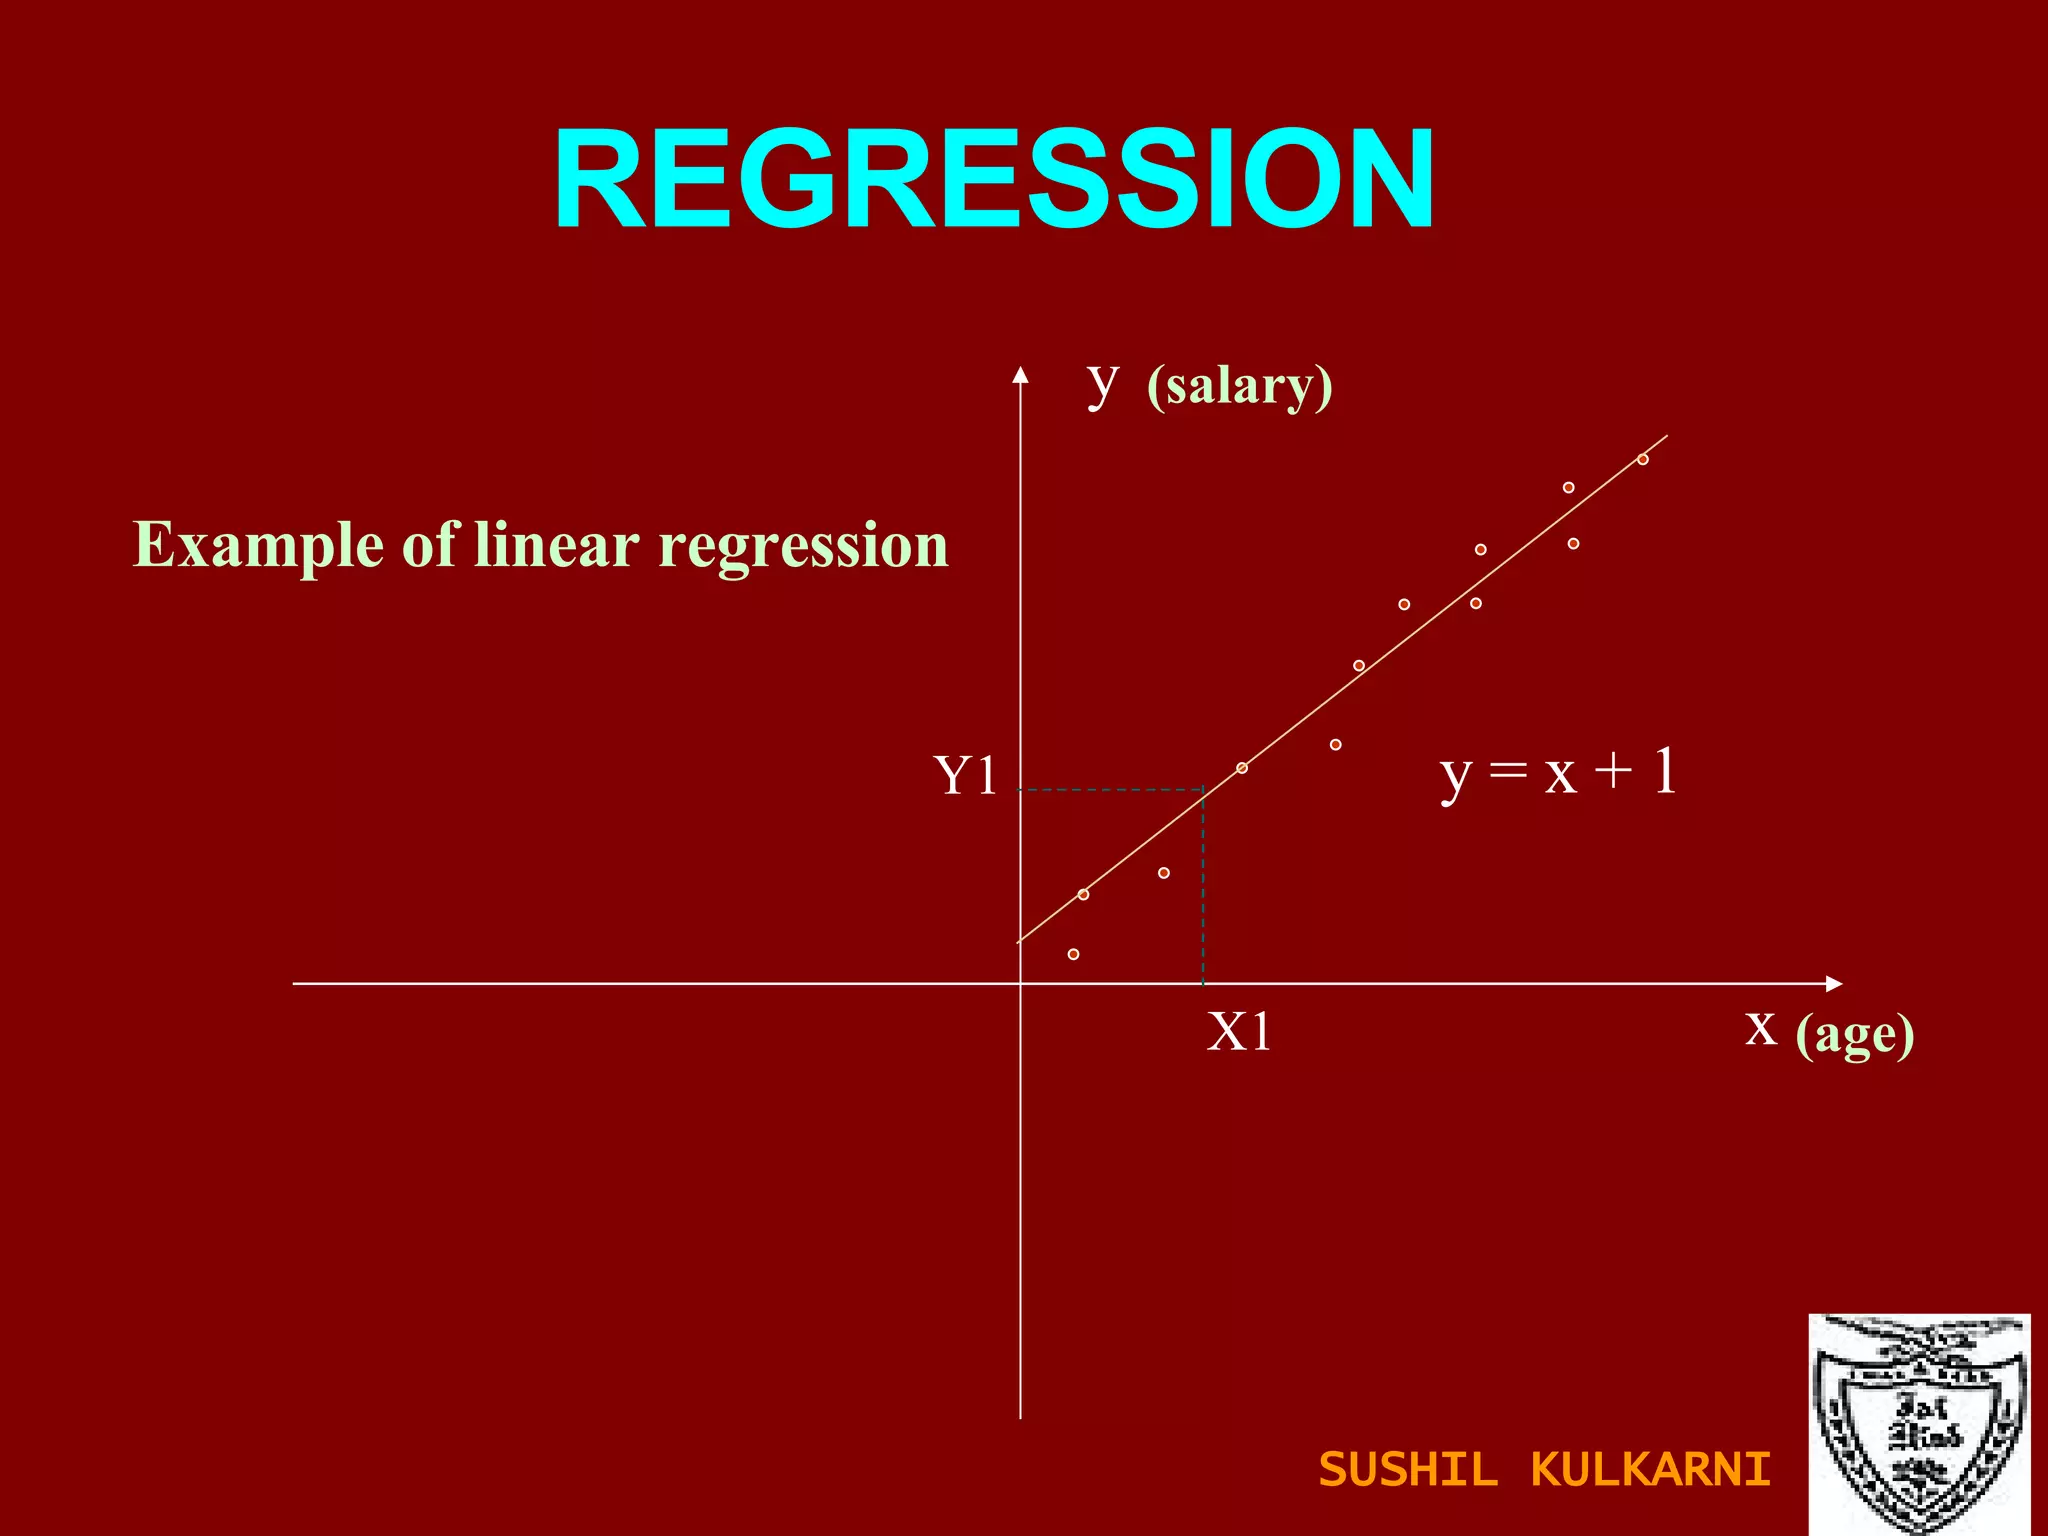
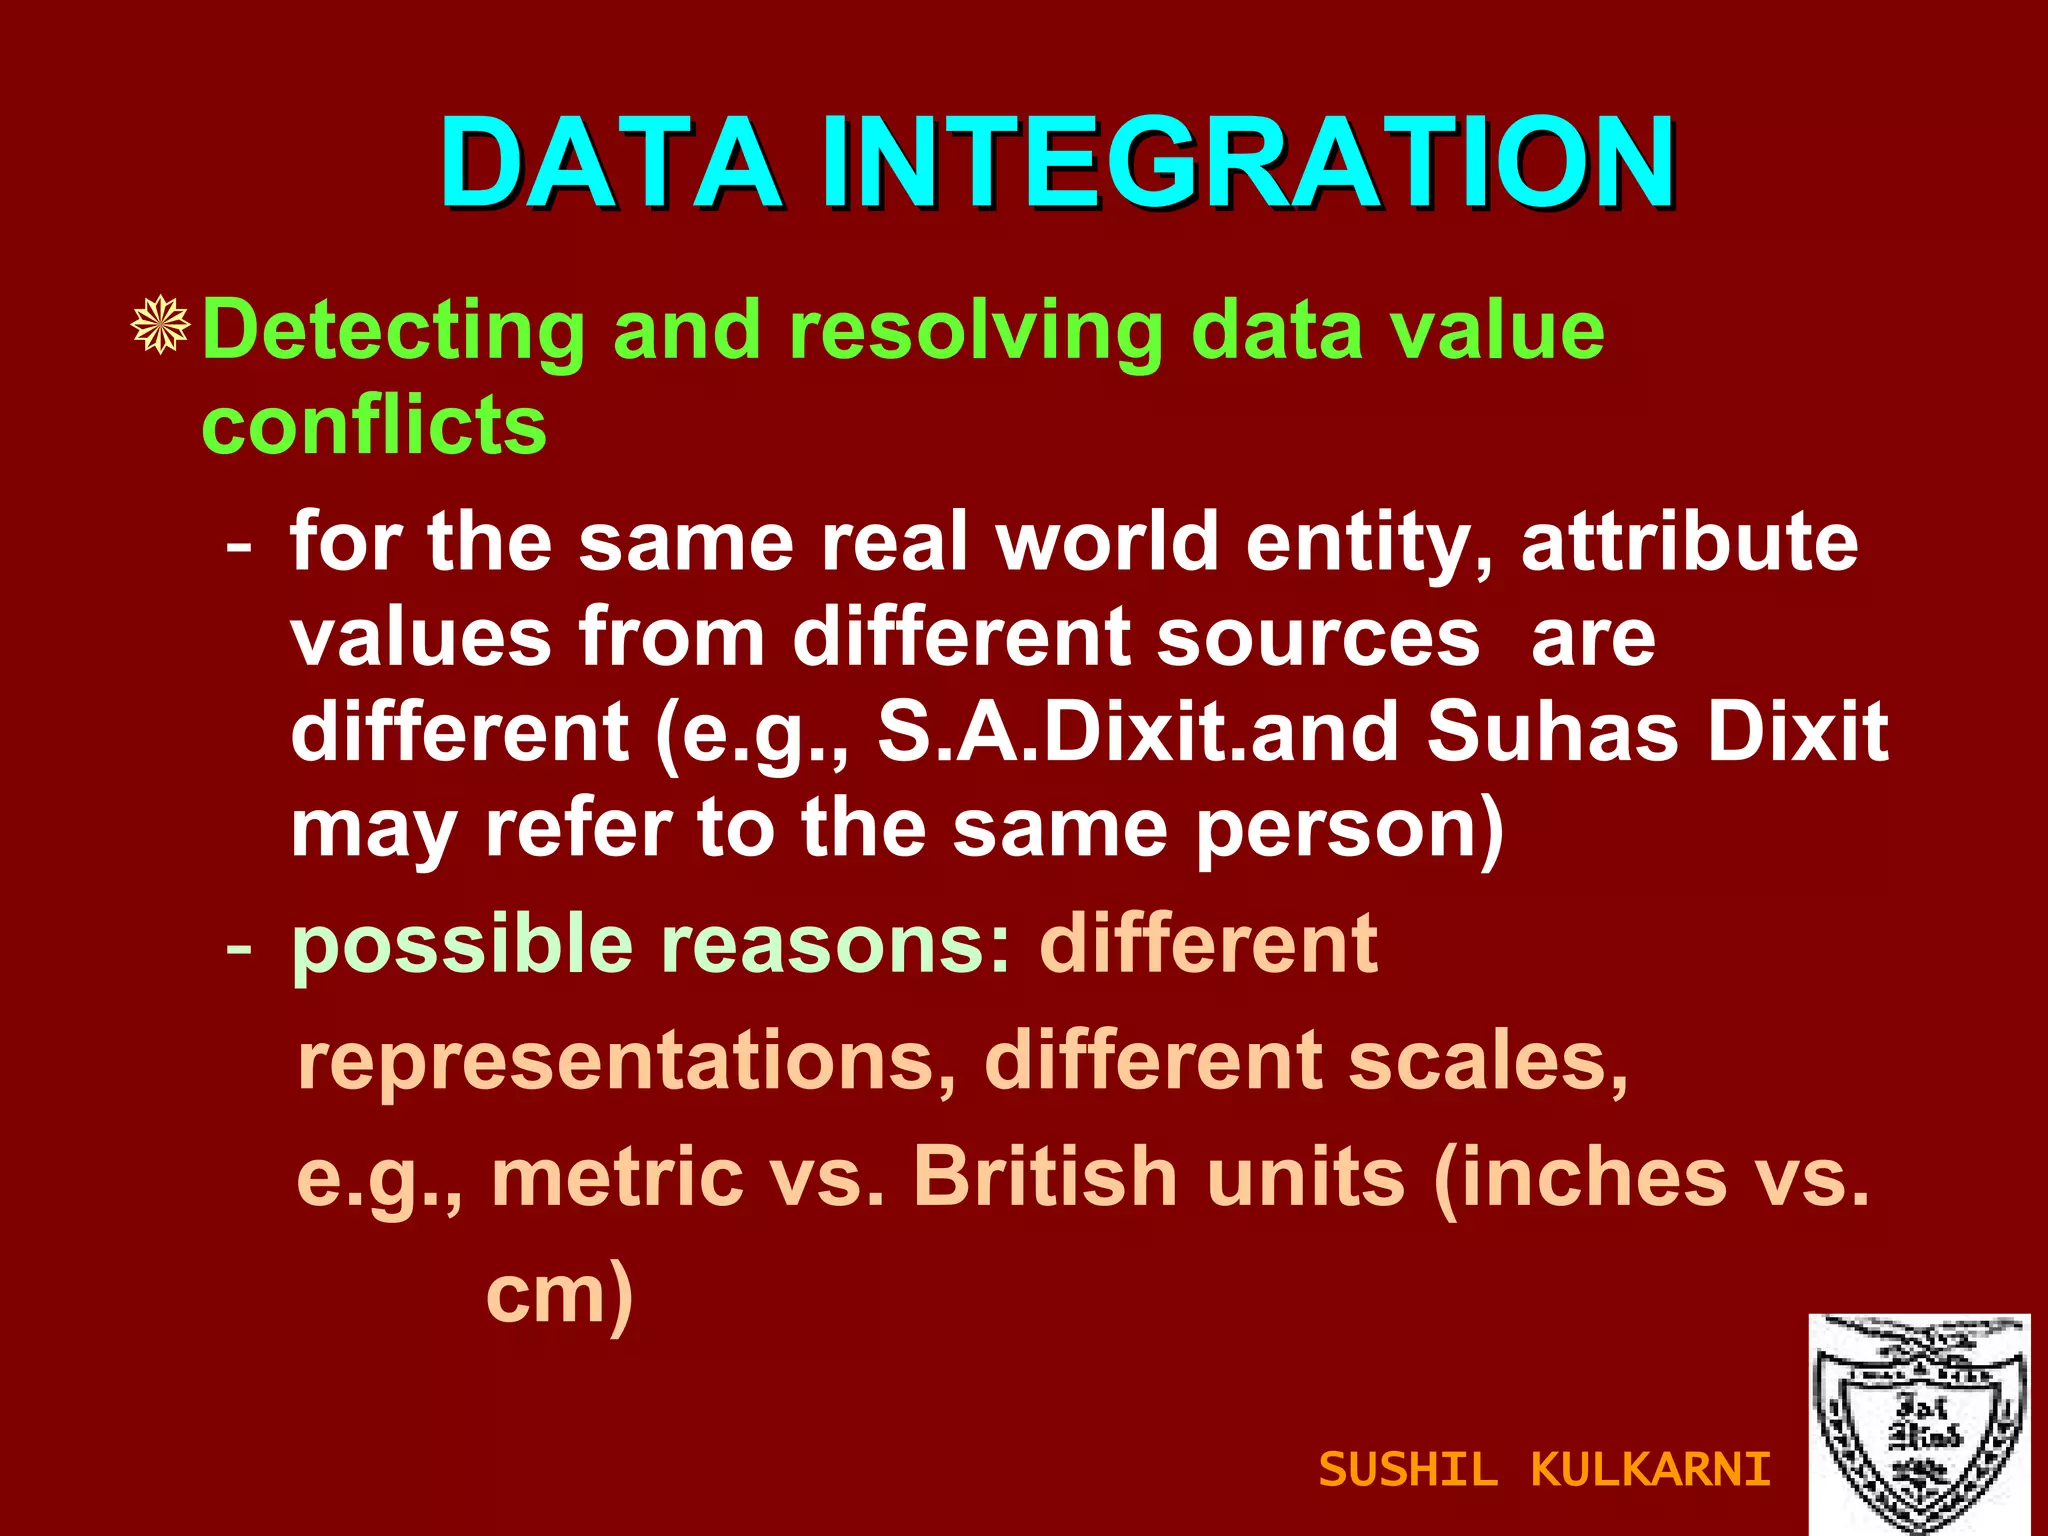
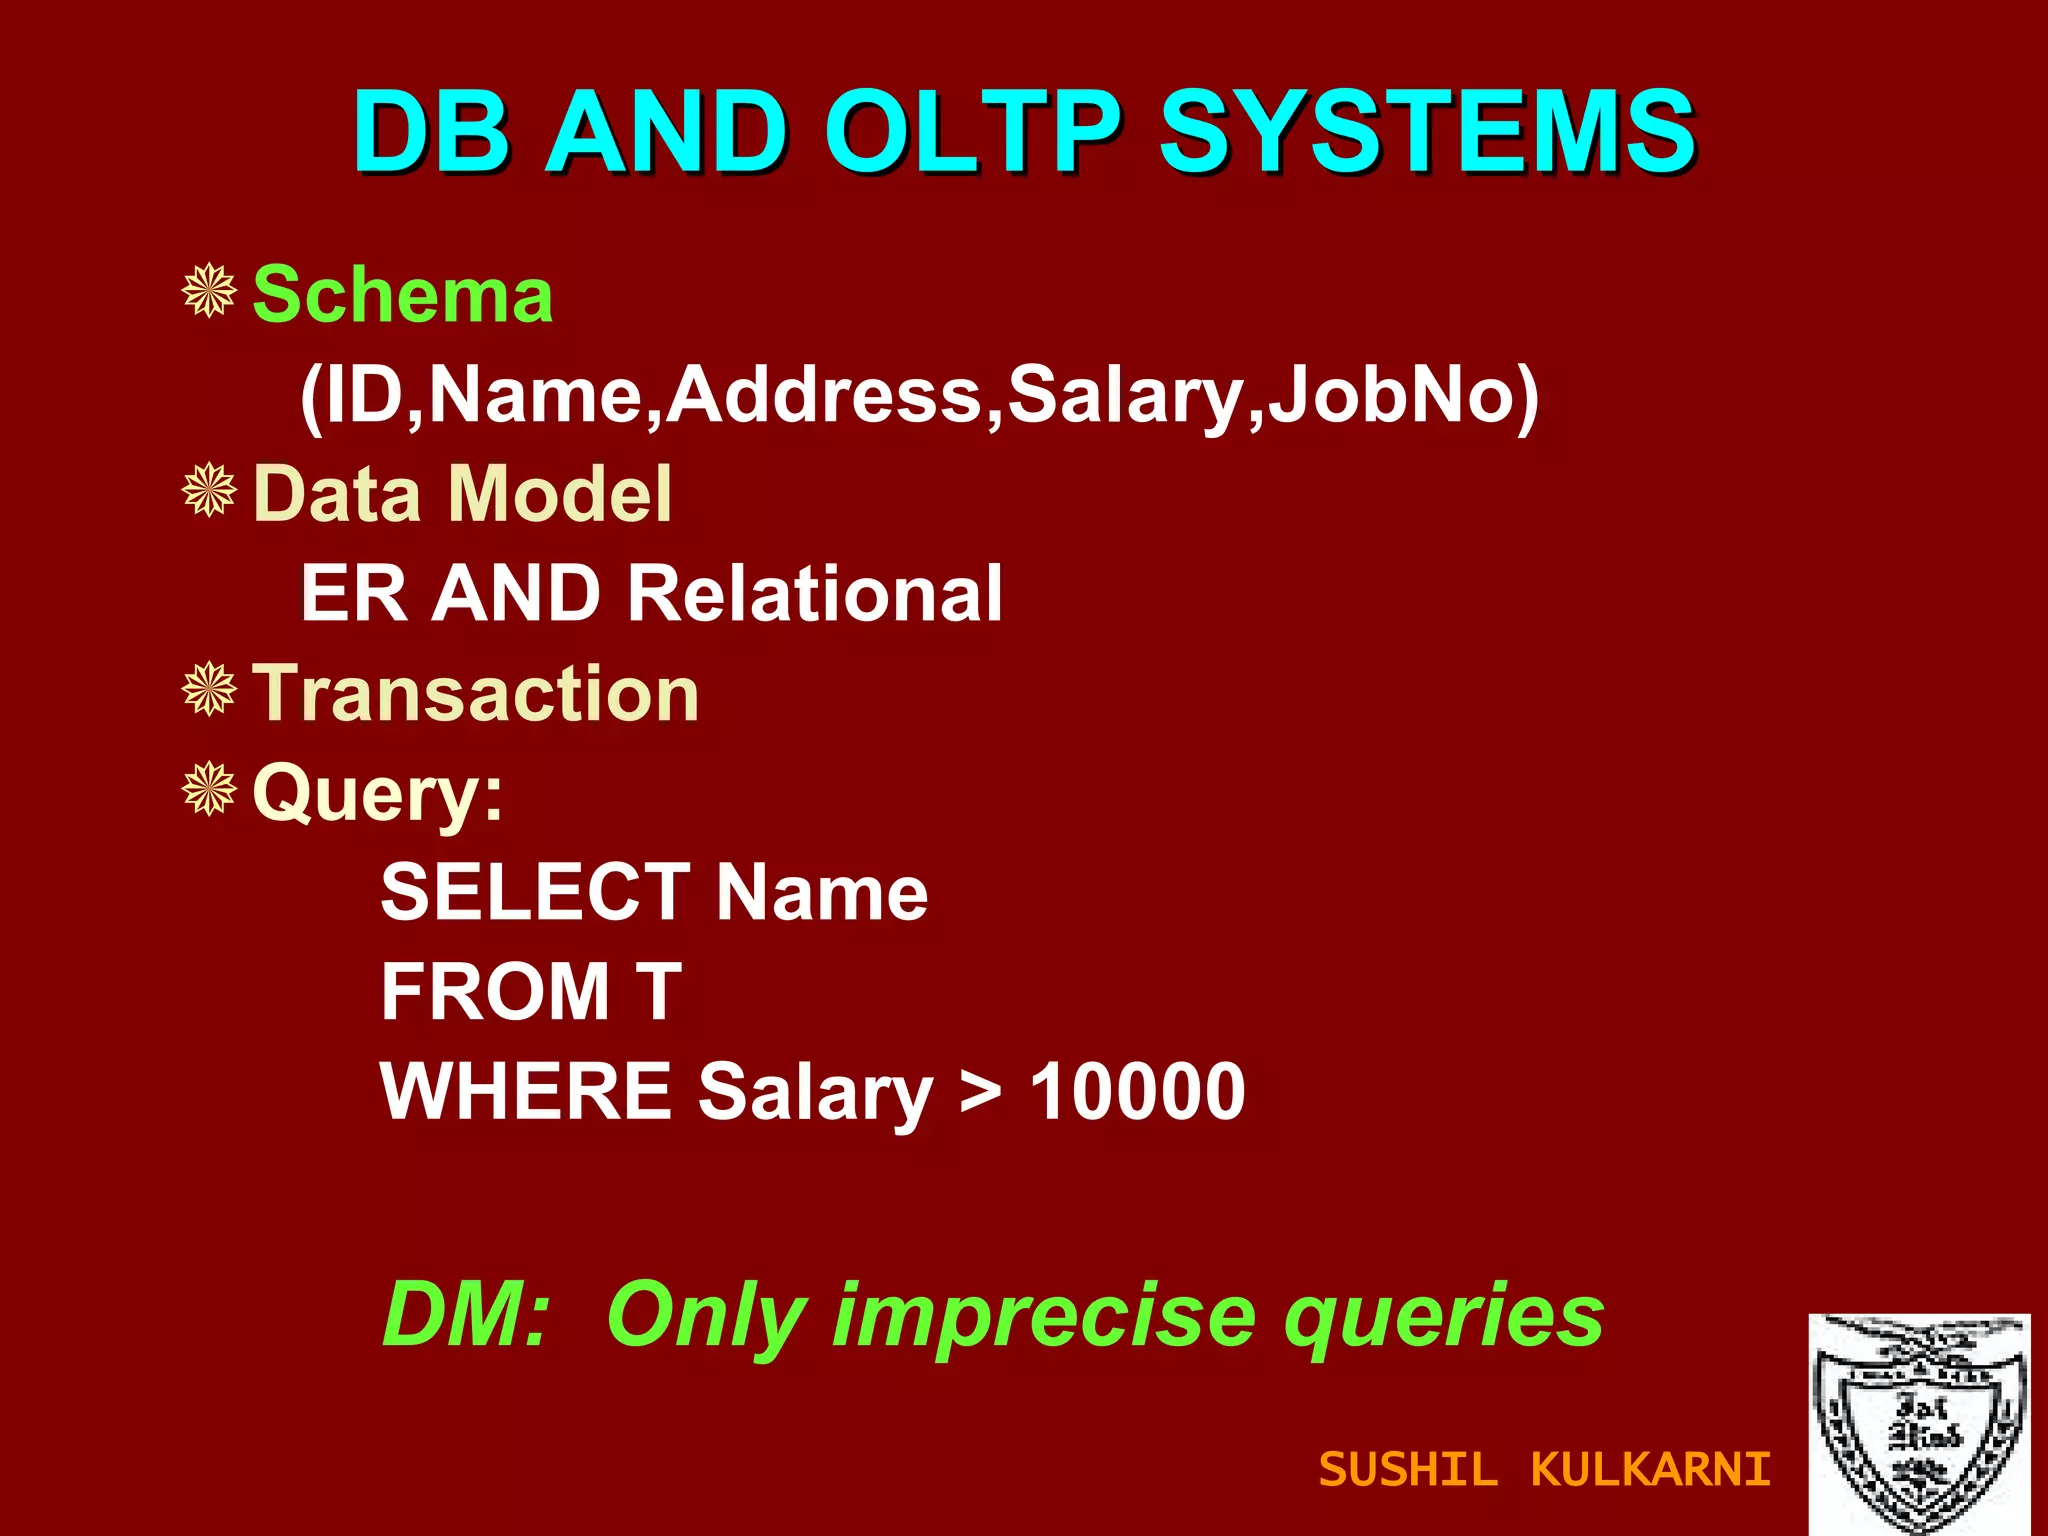
The document discusses data mining and knowledge discovery in databases (KDD). It defines data mining and describes some common data mining tasks like classification, regression, clustering, and summarization. It also explains the KDD process which involves data selection, preprocessing, transformation, mining and interpretation. Data preprocessing tasks like data cleaning, integration and reduction are discussed. Methods for handling missing, noisy and inconsistent data are also covered.


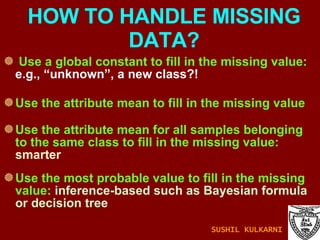


![SMOOTHING USING BINNING METHODS Sorted data for price (in Rs): 4, 8, 9, 15, 21, 21, 24, 25, 26, 28, 29, 34 Partition into ( equi-depth ) bins: - Bin 1: 4, 8, 9, 15 - Bin 2: 21, 21, 24, 25 - Bin 3: 26, 28, 29, 34 Smoothing by bin means: - Bin 1: 9, 9, 9, 9 - Bin 2: 23, 23, 23, 23 - Bin 3: 29, 29, 29, 29 Smoothing by bin boundaries: [4,15],[21,25],[26,34] - Bin 1: 4, 4, 4, 15 - Bin 2: 21, 21, 25, 25 - Bin 3: 26, 26, 26, 34 SUSHIL KULKARNI](https://image.slidesharecdn.com/ch1introdm-1224940313790886-8/85/Ch-1-Intro-to-Data-Mining-73-320.jpg)


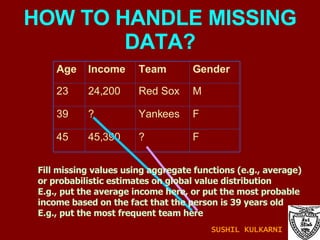
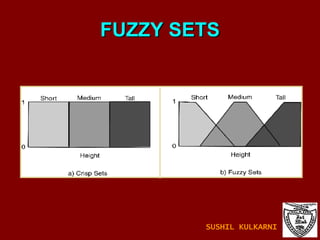
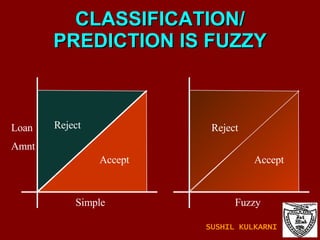
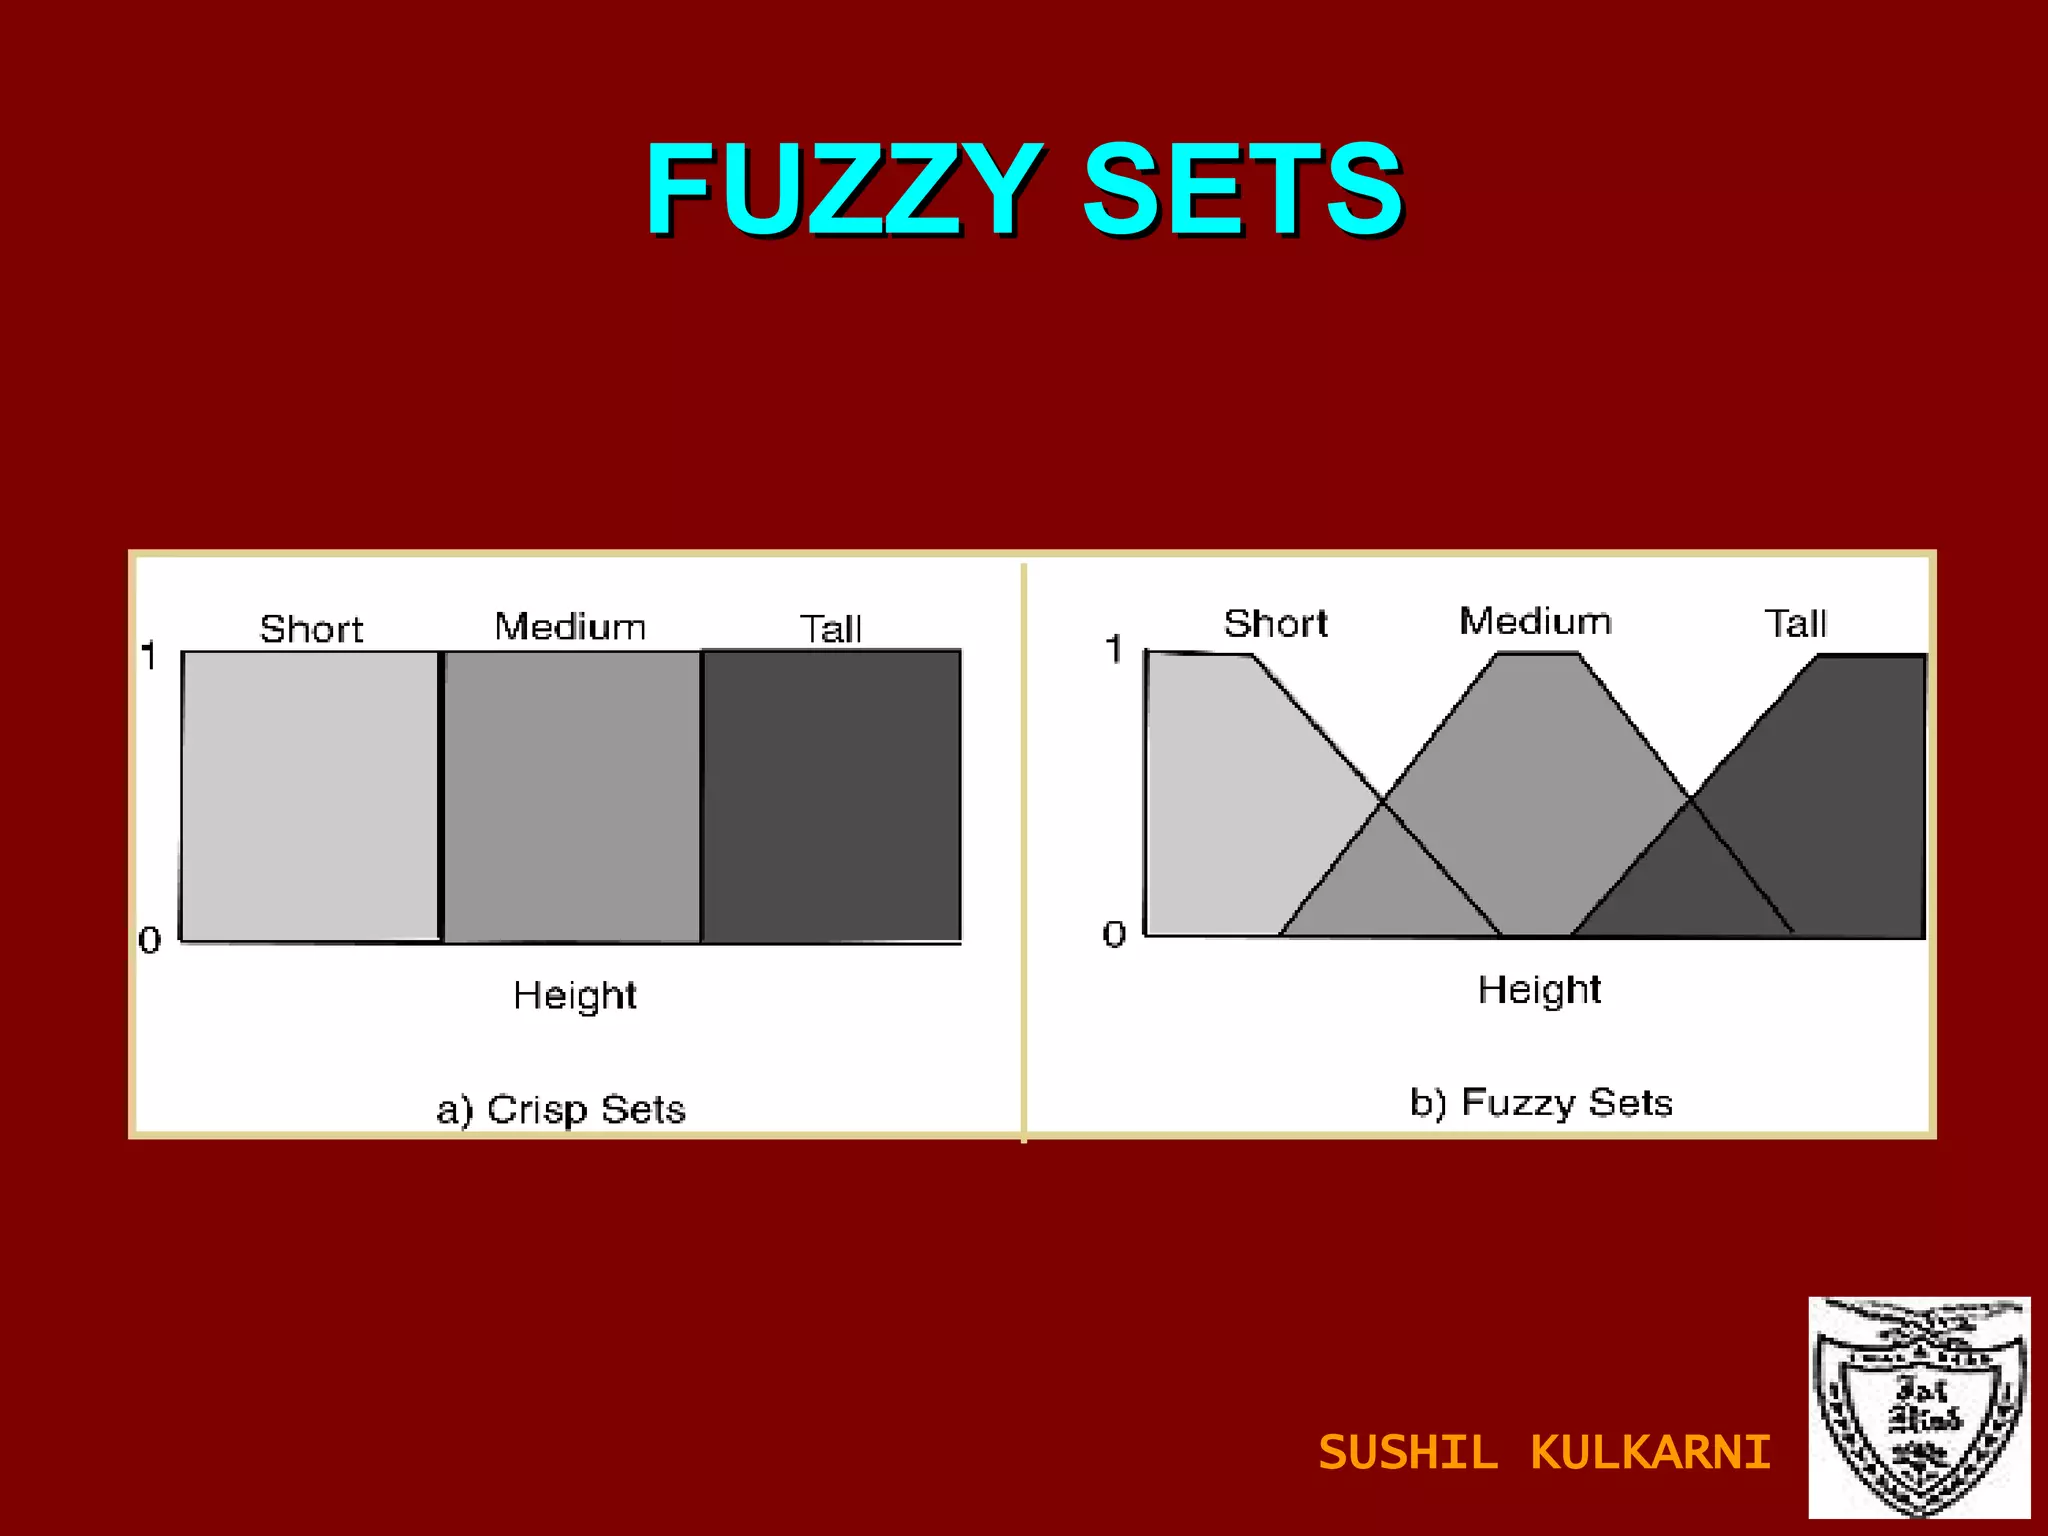
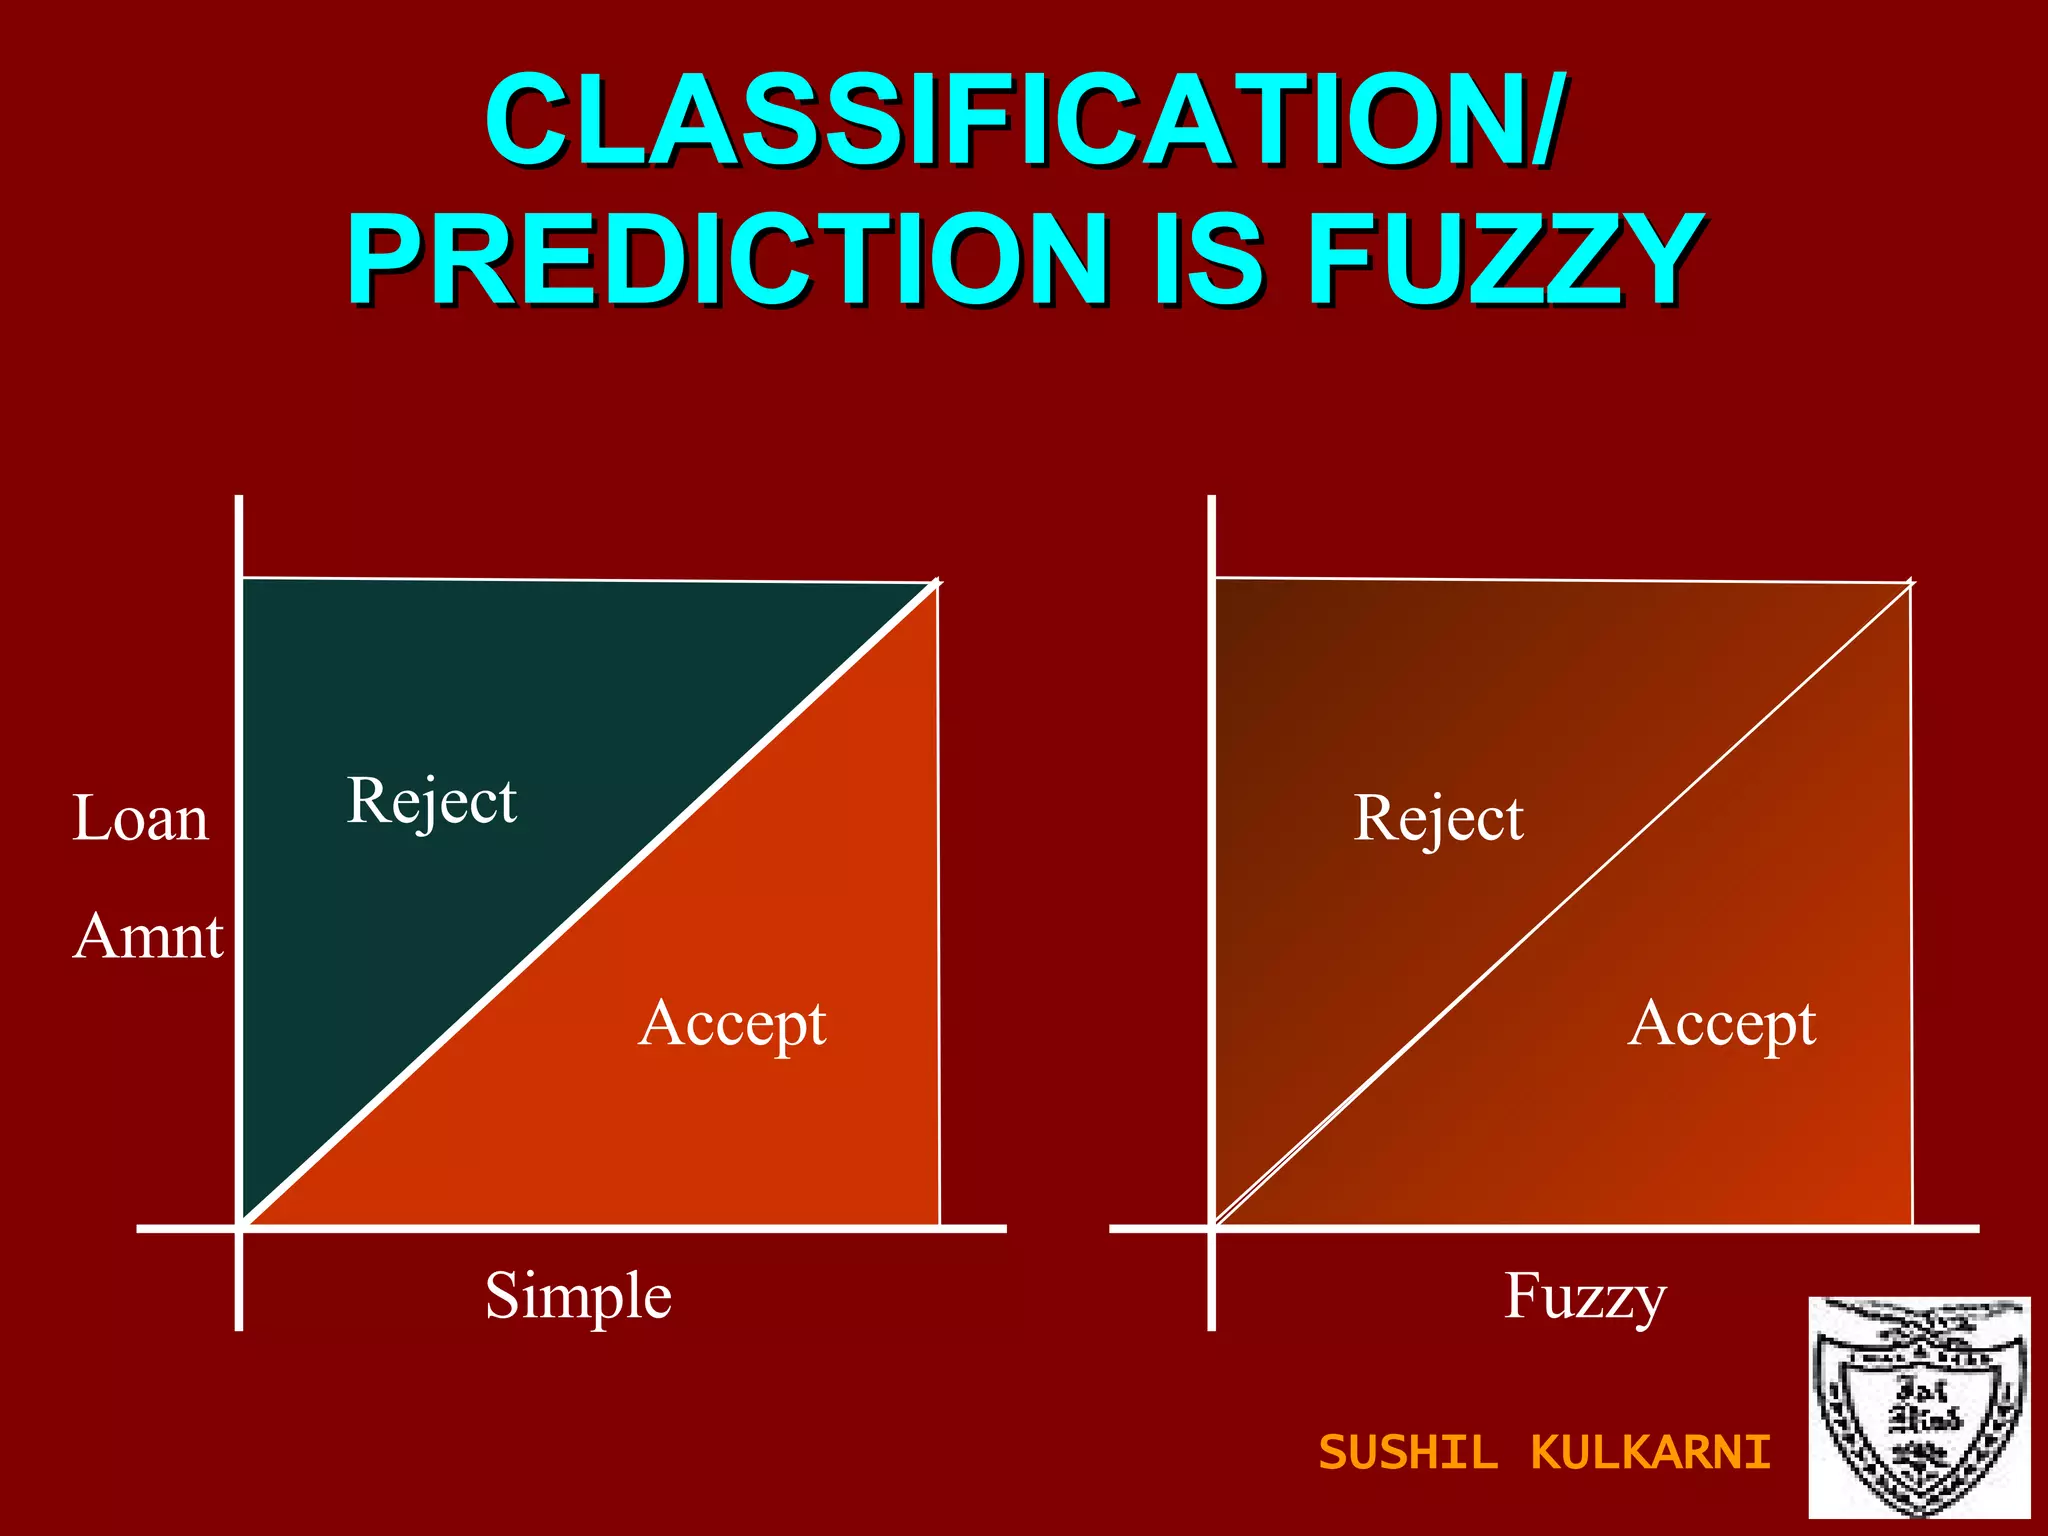
![FUZZY SETS AND LOGIC Fuzzy Set: Set membership function is a real valued function with output in the range [0,1]. f(x): Probability x is in F. 1-f(x): Probability x is not in F. Example: T = {x | x is a person and x is tall} Let f(x) be the probability that x is tall. Here f is the membership function DM: Prediction and classification are fuzzy. SUSHIL KULKARNI](https://image.slidesharecdn.com/ch1introdm-1224940313790886-8/85/Ch-1-Intro-to-Data-Mining-122-320.jpg)

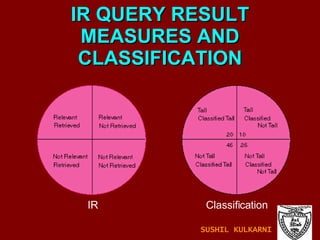


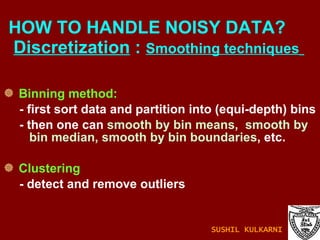
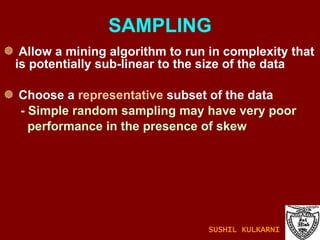
![SMOOTHING USING BINNING METHODS Sorted data for price (in Rs): 4, 8, 9, 15, 21, 21, 24, 25, 26, 28, 29, 34 Partition into ( equi-depth ) bins: - Bin 1: 4, 8, 9, 15 - Bin 2: 21, 21, 24, 25 - Bin 3: 26, 28, 29, 34 Smoothing by bin means: - Bin 1: 9, 9, 9, 9 - Bin 2: 23, 23, 23, 23 - Bin 3: 29, 29, 29, 29 Smoothing by bin boundaries: [4,15],[21,25],[26,34] - Bin 1: 4, 4, 4, 15 - Bin 2: 21, 21, 25, 25 - Bin 3: 26, 26, 26, 34 SUSHIL KULKARNI](https://image.slidesharecdn.com/ch1introdm-1224940313790886-8/75/Ch-1-Intro-to-Data-Mining-73-2048.jpg)


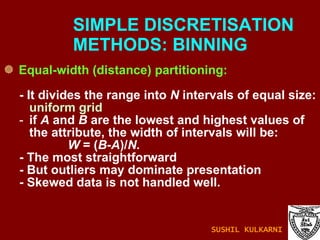
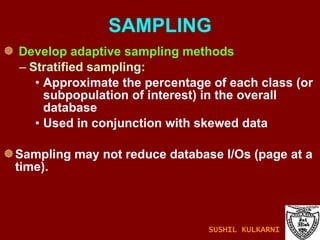
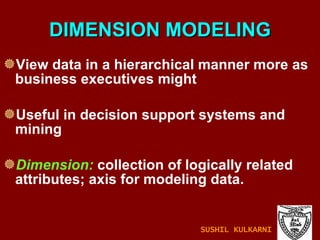
![FUZZY SETS AND LOGIC Fuzzy Set: Set membership function is a real valued function with output in the range [0,1]. f(x): Probability x is in F. 1-f(x): Probability x is not in F. Example: T = {x | x is a person and x is tall} Let f(x) be the probability that x is tall. Here f is the membership function DM: Prediction and classification are fuzzy. SUSHIL KULKARNI](https://image.slidesharecdn.com/ch1introdm-1224940313790886-8/75/Ch-1-Intro-to-Data-Mining-122-2048.jpg)


![UiPath Automation Suite Installation (Hands-On) [2/3]](https://cdn.slidesharecdn.com/ss_thumbnails/automationsuitecommunitysession2-251015095633-a6d862f1-thumbnail.jpg?width=600ounds&width=560&fit=bounds)