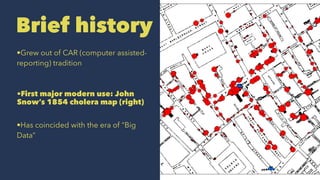
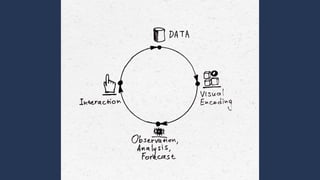
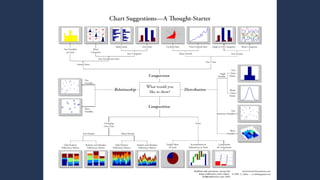
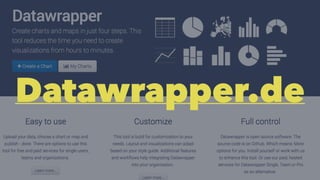
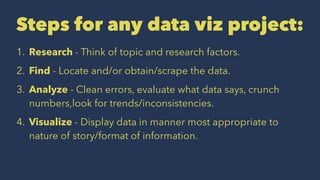
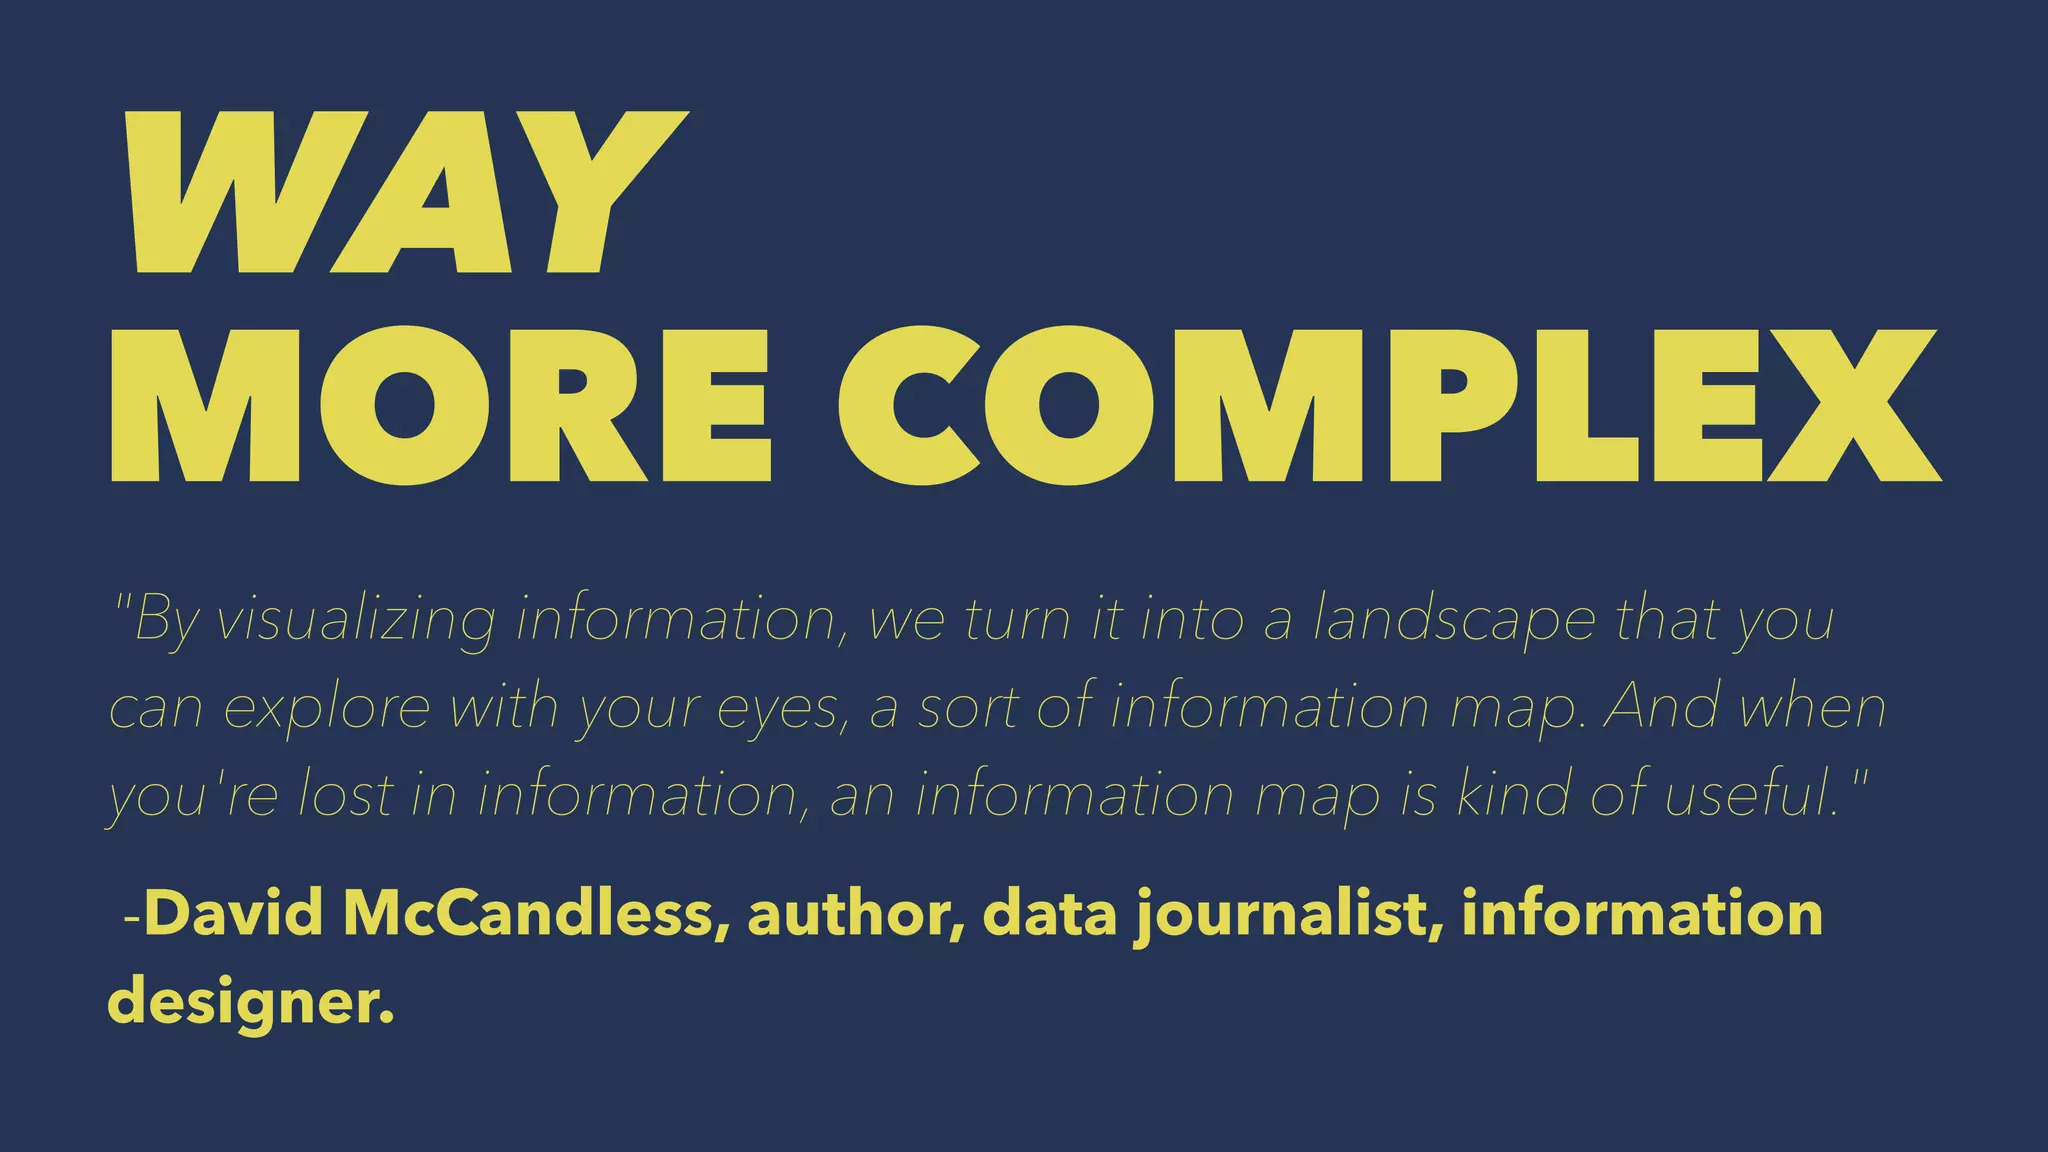
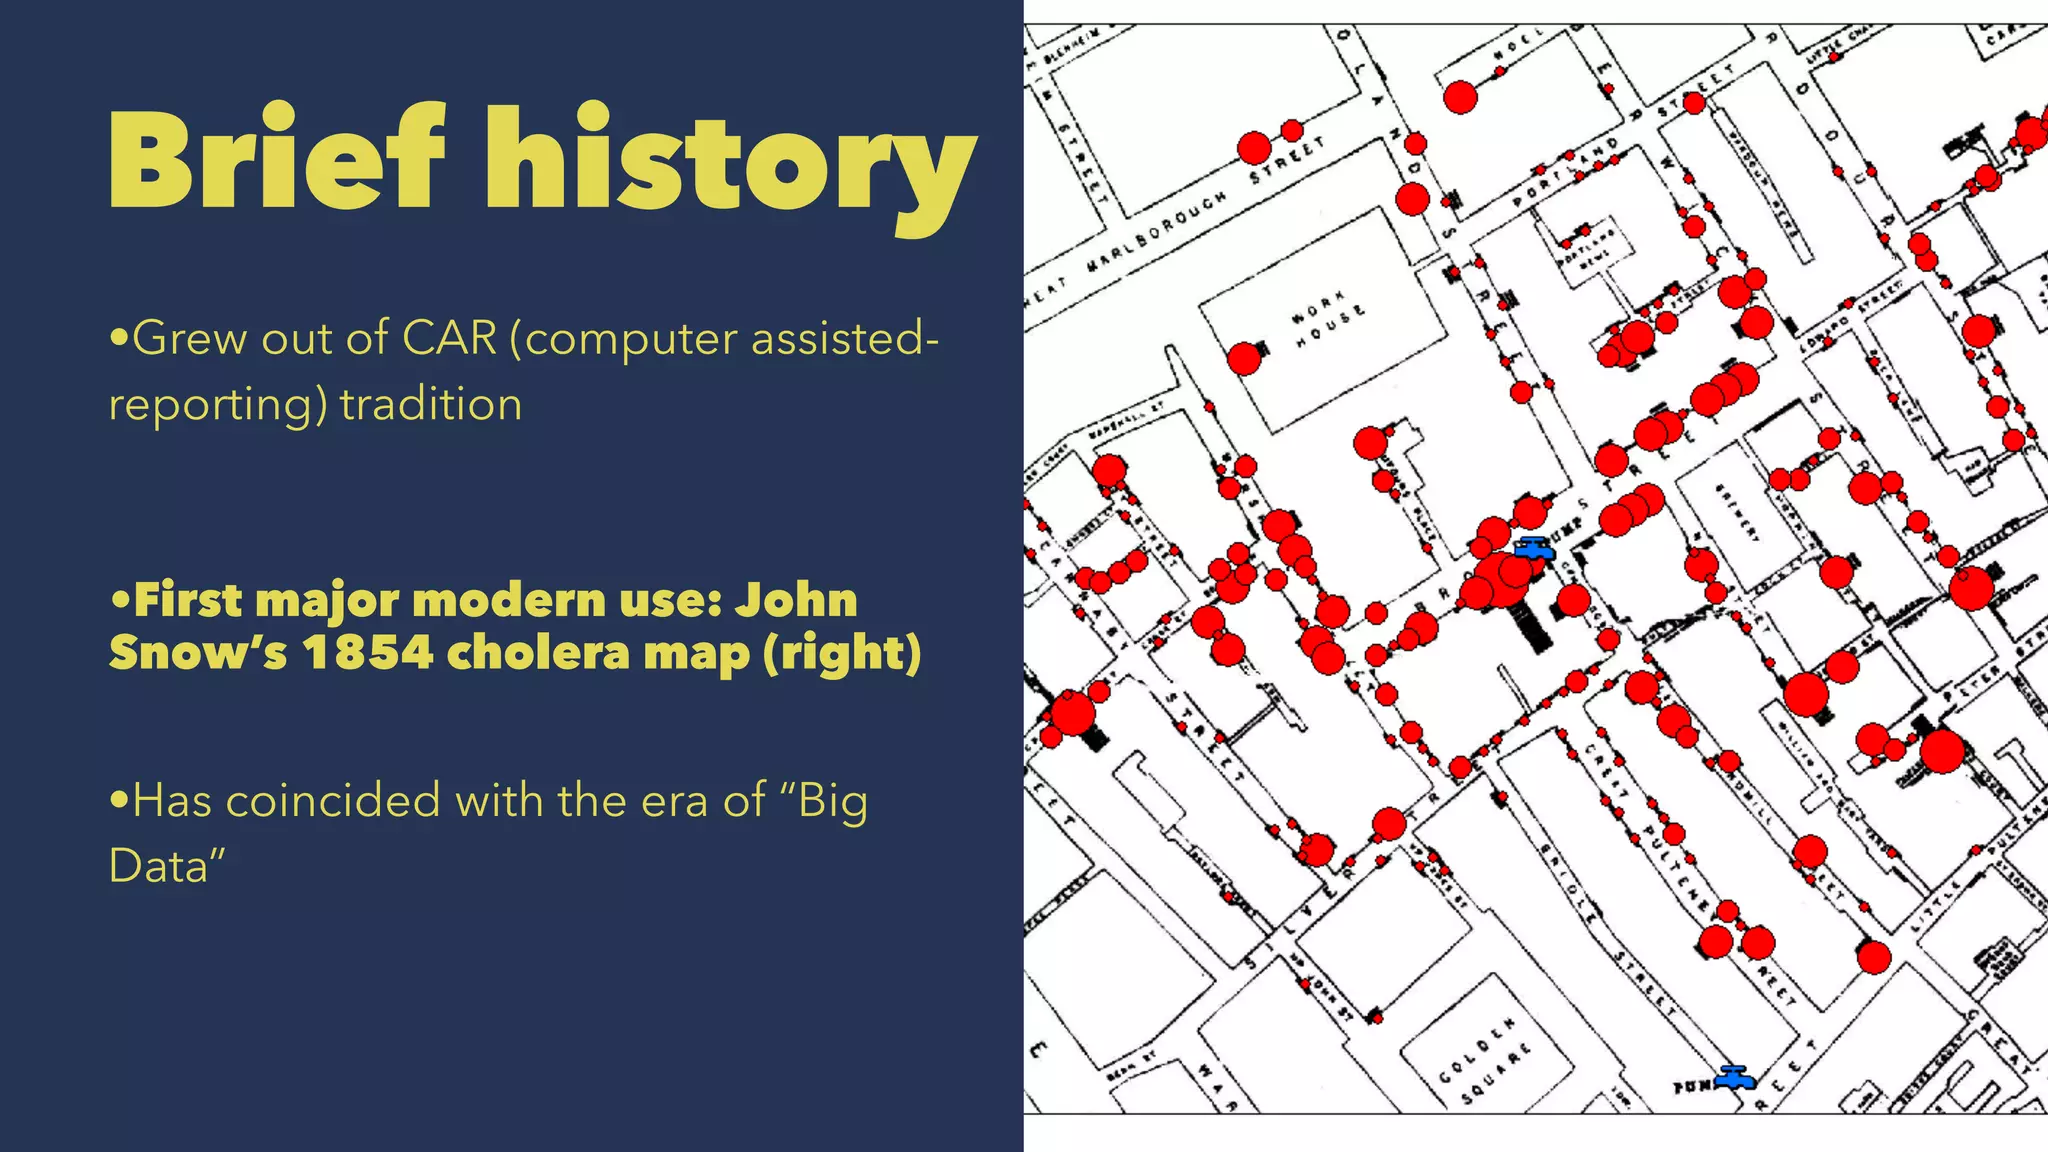
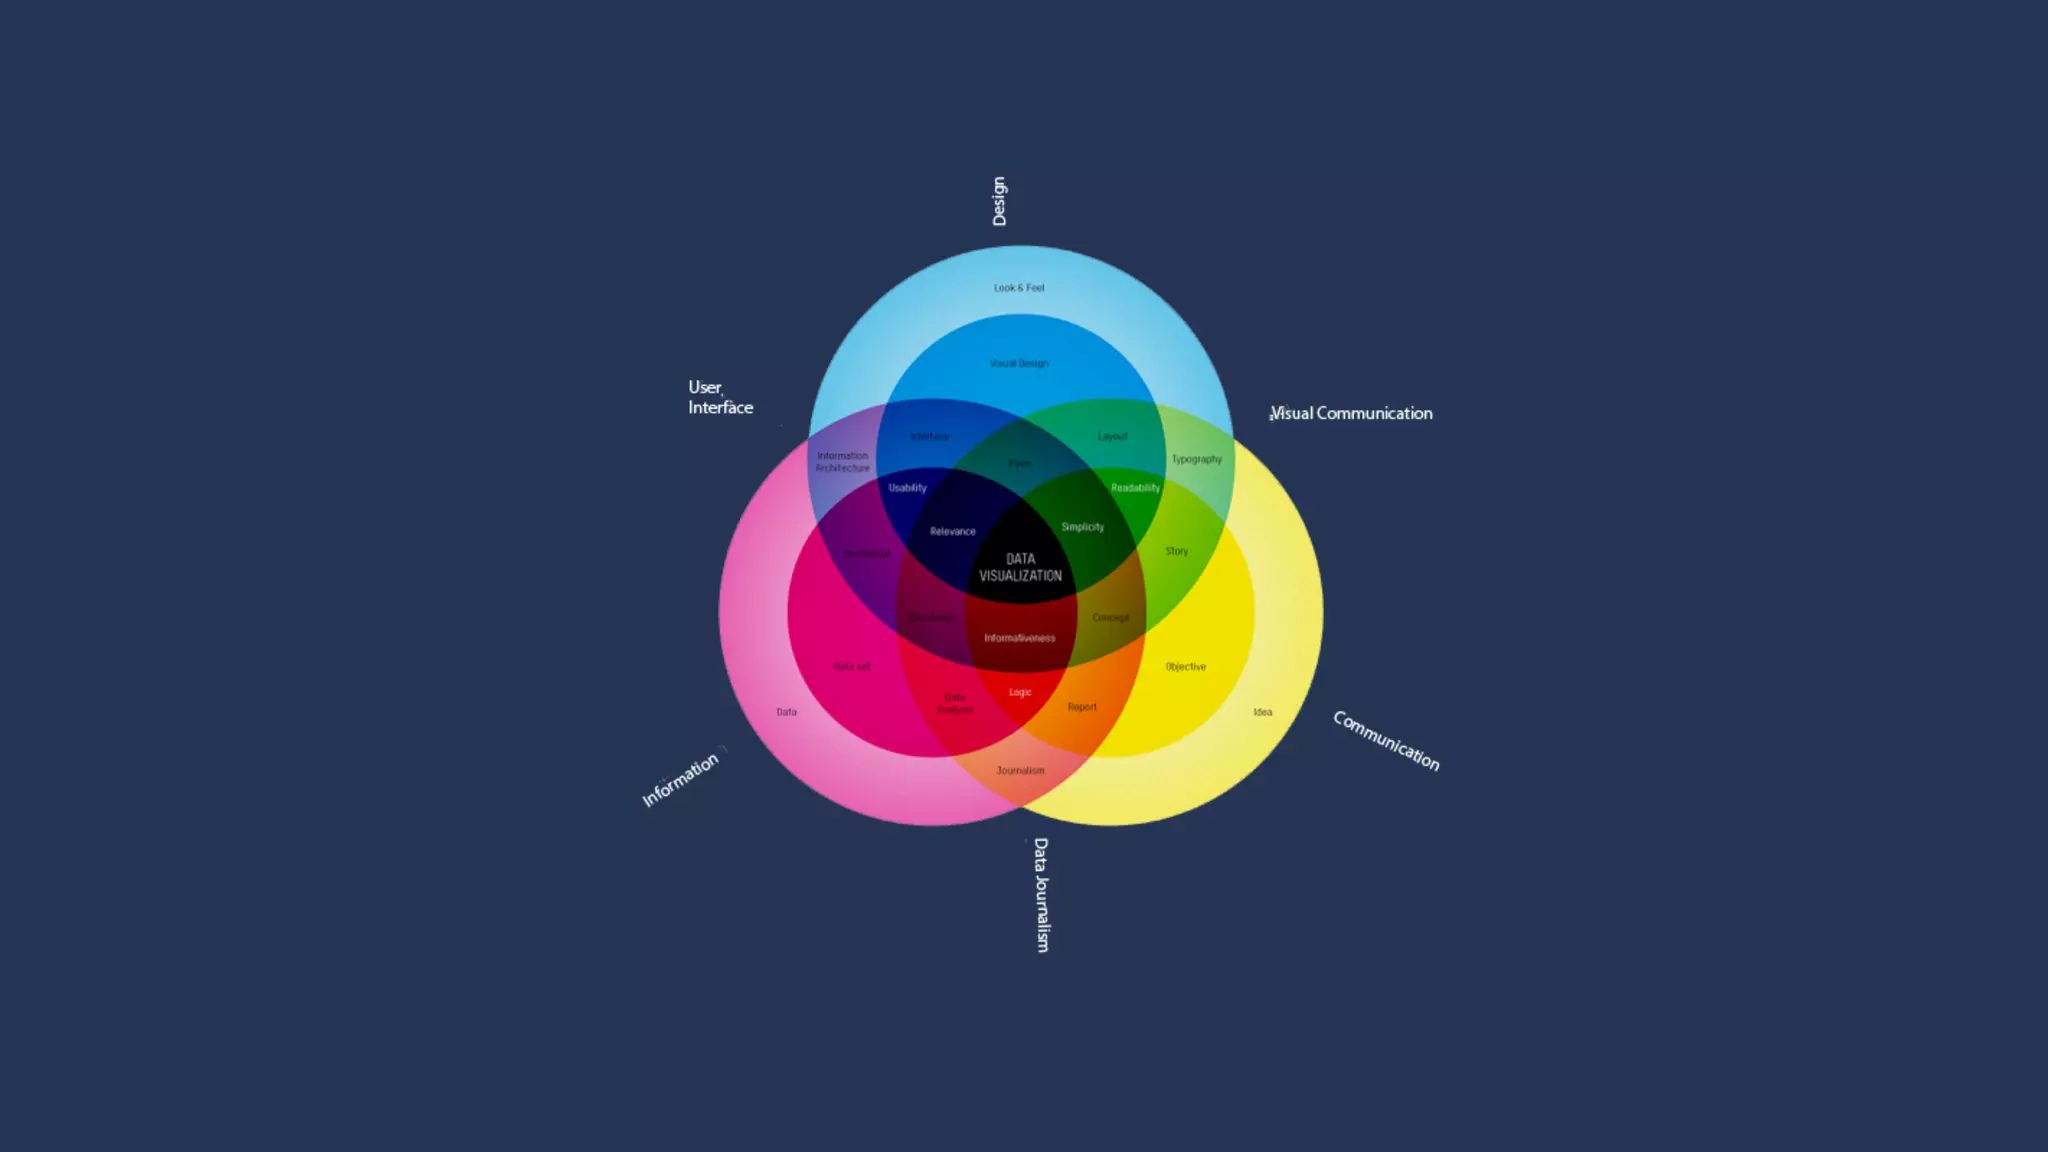
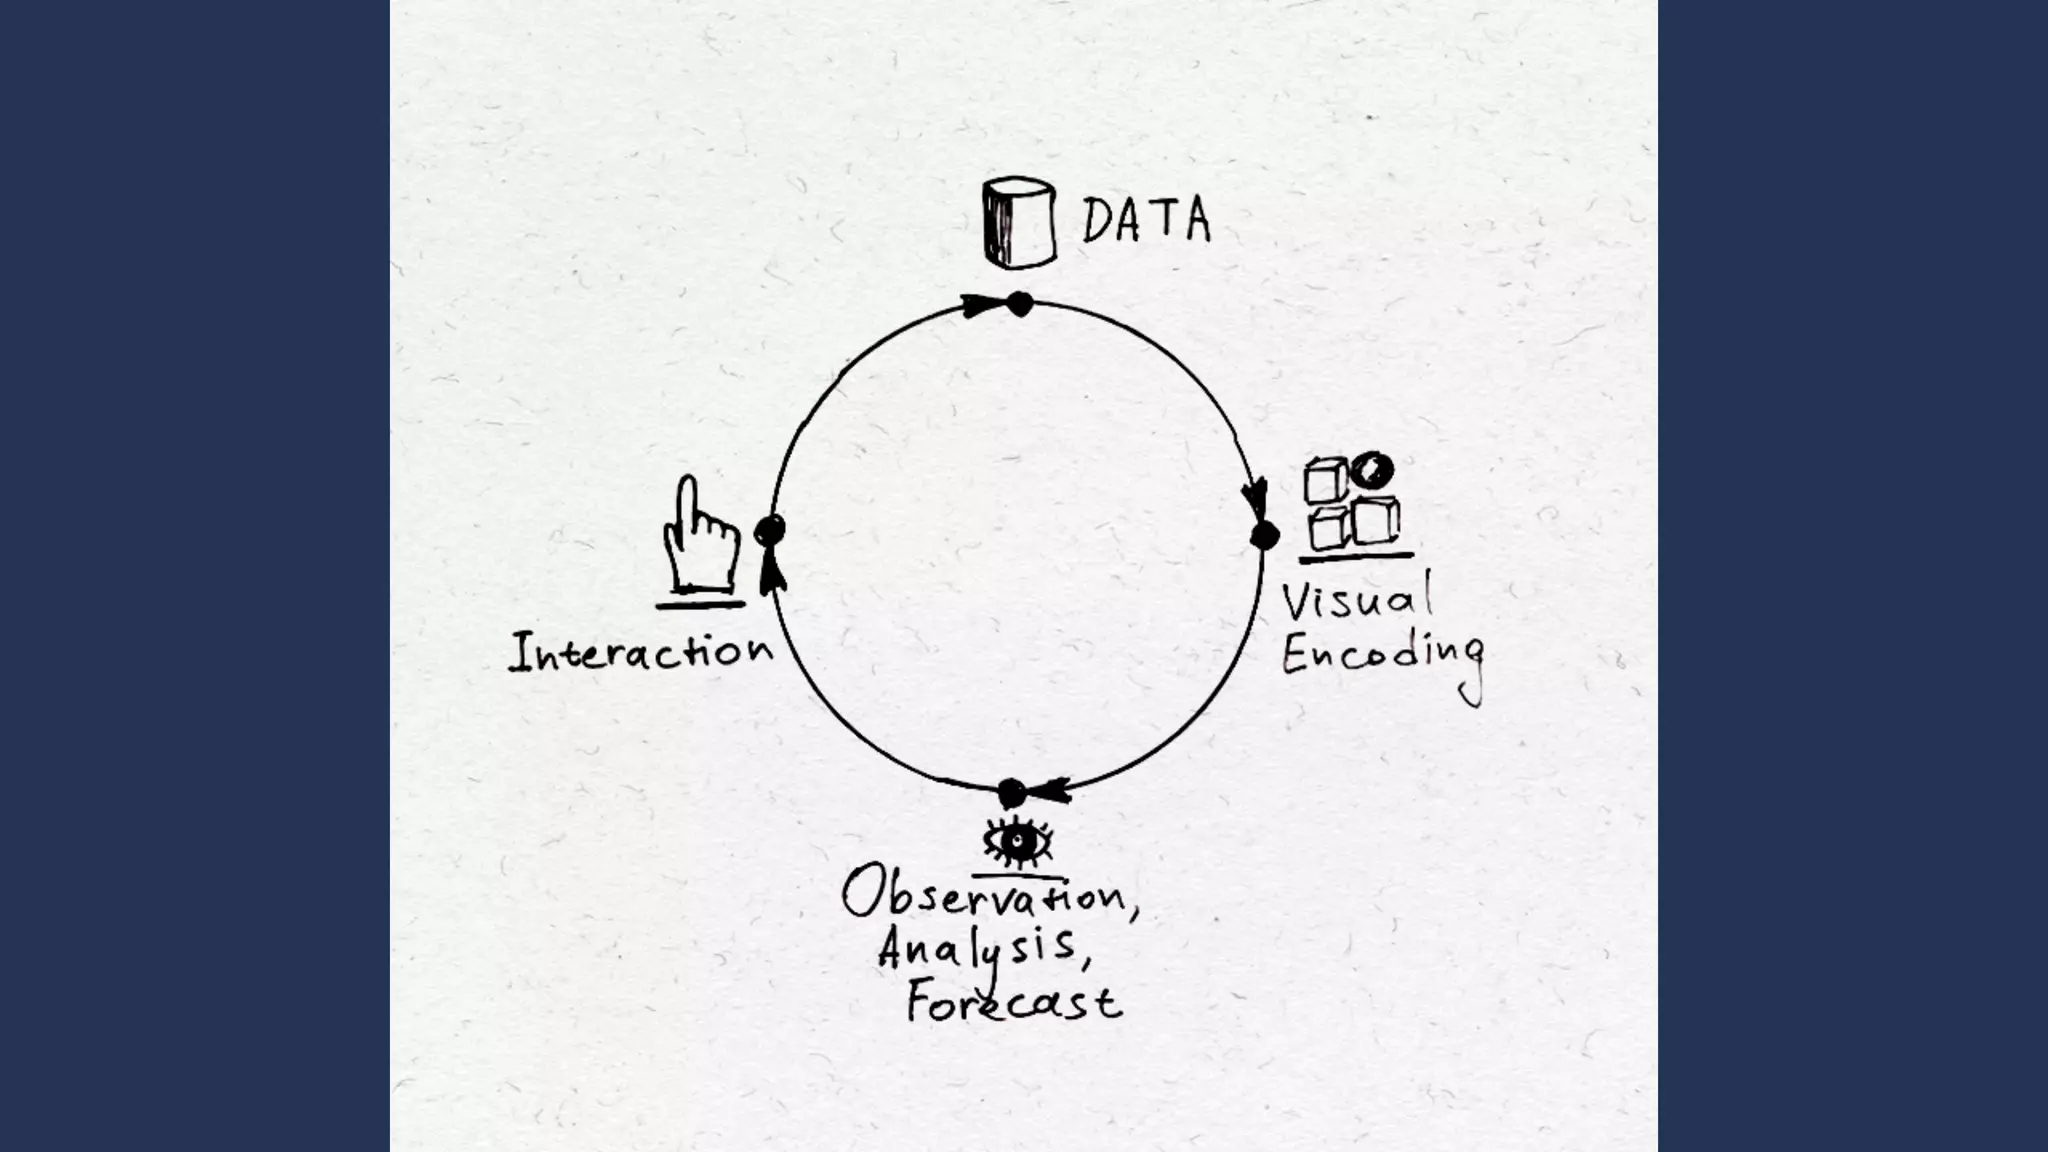
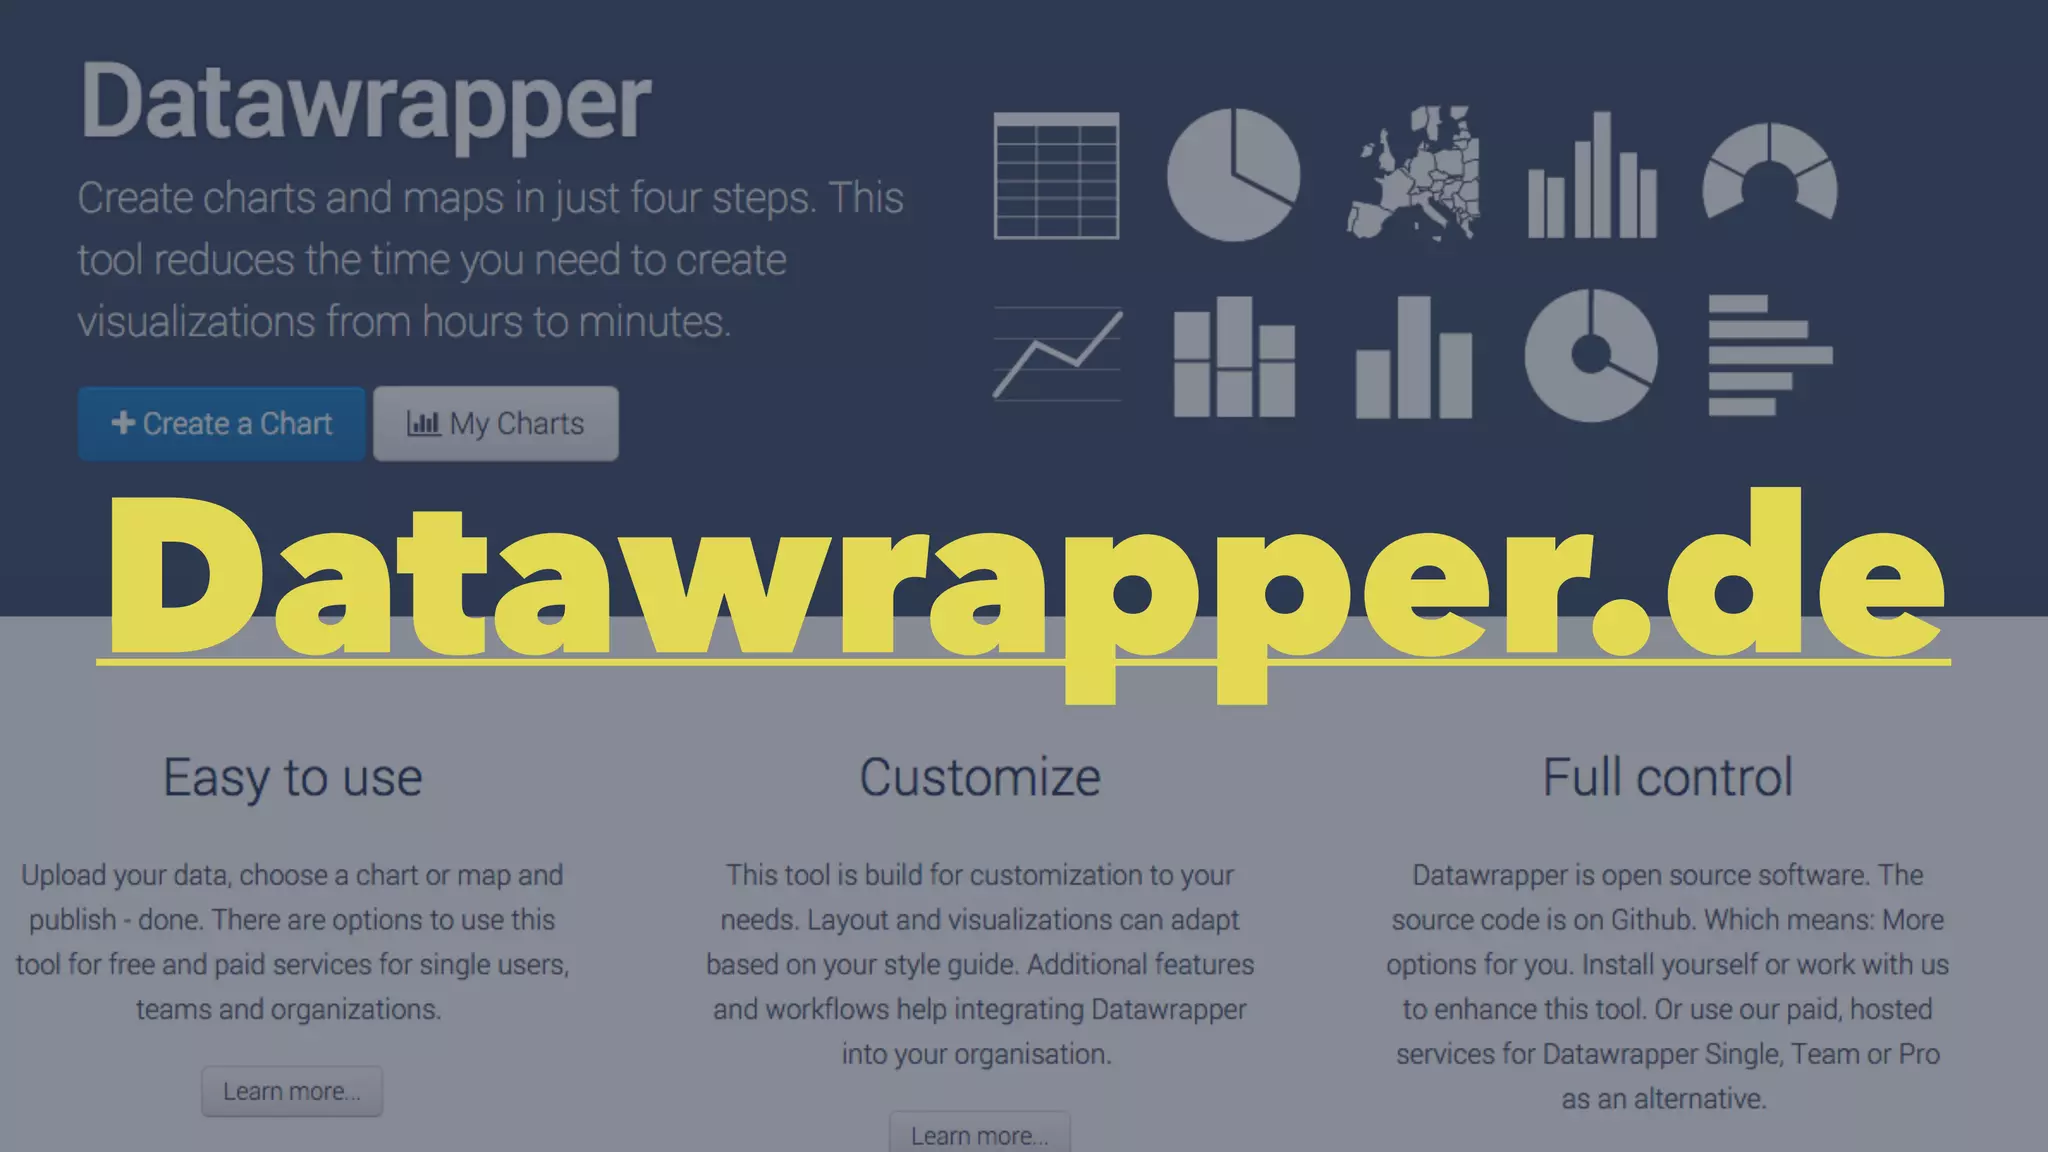
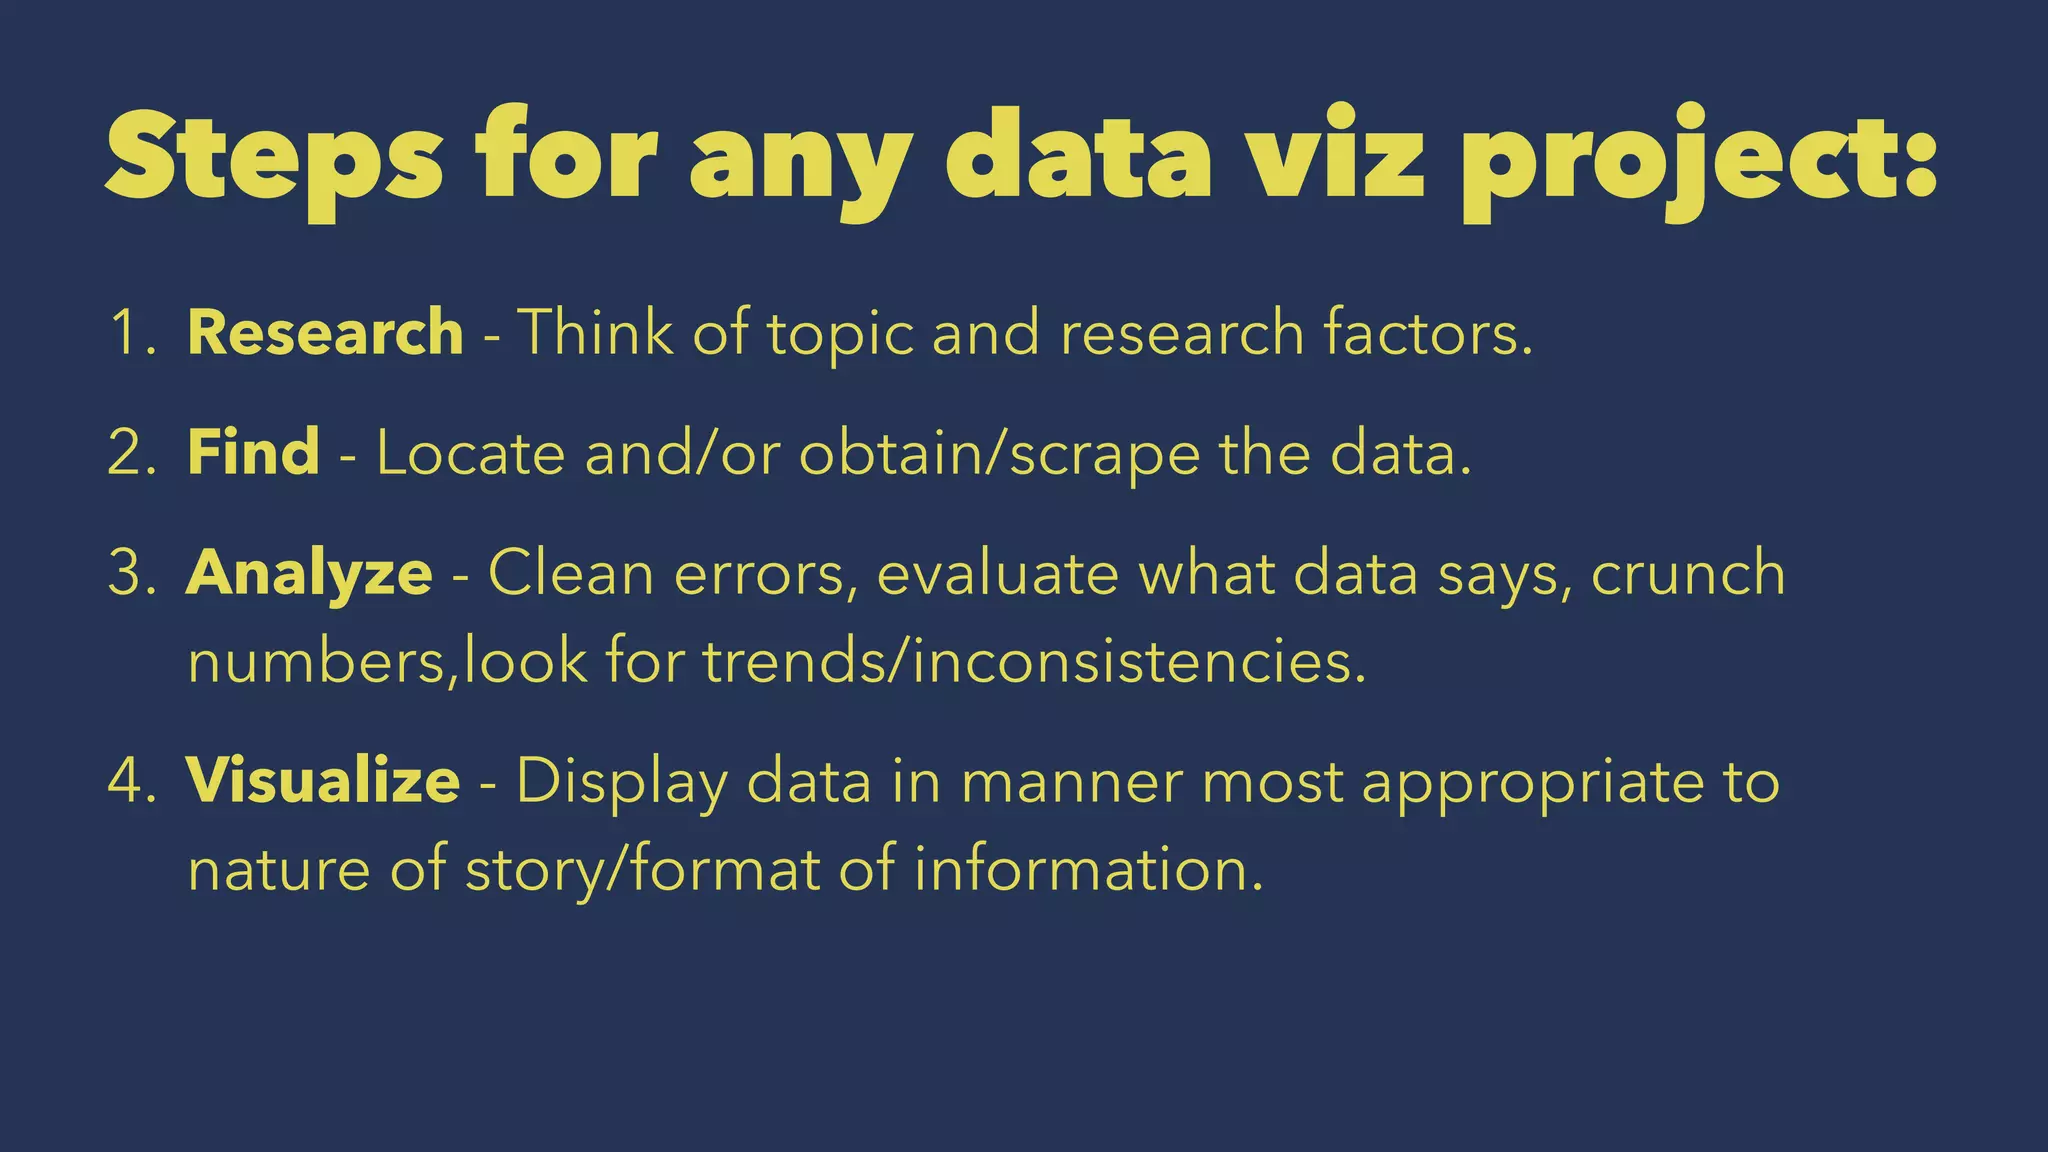
KEMBAR78
Data Visualization for Non-Programmers | PDF
DATA VIZ 101:
Tools , tricks, tips...
...and more for non-programmers and deadline-chasers
What isdata visualization?
Simplest answer = graphical display of information
WAY
MORE COMPLEX
"By visualizing information, we turn it into a landscape that you
can explore with your eyes, a sort of information map. And when
you're lost in information, an information map is kind of useful."
-David McCandless, author, data journalist, information
designer.
"The greatest value of a picture is when it forces
us to notice what we never expected to see."
-John Tukey
"When information was scarce, most of our efforts were devoted
to hunting and gathering. Now that information is abundant,
processing is more important."
-Phillip Meyer, journalist and professor at UNC, Chapel Hill
Uses• Get a bird's eye view of "Big Data" information overload
• Discover hidden insights
• Highlight outliers visually
• Understand patterns and trends instantly and visually
Characteristics... of data viz
• Data itself is the story; standalone narrative (often coupled
w/ text).
• Interactive, communicative, visual.
• Ranges from simple (charts) to complex (database-driven
applications).
• Both a technique and a format.
Infographics ≠
data visualization
Have different connotations
(Although many, including Alberto Cairo, information design
legend, defend the term 'infographic' in its original sense)
Infographics tend to be...
Hard to read
Overly artsy
Distracting from data.
"He's 243
percent baby
boomer!"
Example of "chartjunk"
What's wrong here?
Brief history
•Grew out of CAR (computer assisted-
reporting) tradition
•First major modern use: John
Snow’s 1854 cholera map (right)
•Has coincided with the era of “Big
Data”
"There's a strand of the data viz world that argues that everything
could be a bar chart. That's possibly true but also possibly a world
without joy."
-Amanda Cox, New York Times
"Data journalism is the
new punk. Anyone can do
it."
-Simon Rogers, The
Guardian
BUT HOW?!
Free, open-source,
code-free tools
Now, let's take a look
at some...
1.
Datawrapper.de
2.
Timeline.js
3.
CartoDb
Just a few of dozens of tools to
democratize data visualization.
See Edmodo
and links for exhaustive resource list.
Steps for any data viz project:
1. Research - Think of topic and research factors.
2. Find - Locate and/or obtain/scrape the data.
3. Analyze - Clean errors, evaluate what data says, crunch
numbers,look for trends/inconsistencies.
4. Visualize - Display data in manner most appropriate to
nature of story/format of information.
Now, let's visualize a
dataset!
Data Visualization for Non-Programmers

Data Visualization for Non-Programmers

  • 1.
    DATA VIZ 101: Tools, tricks, tips... ...and more for non-programmers and deadline-chasers
  • 2.
    What isdata visualization? Simplestanswer = graphical display of information
  • 3.
    WAY MORE COMPLEX "By visualizinginformation, we turn it into a landscape that you can explore with your eyes, a sort of information map. And when you're lost in information, an information map is kind of useful." -David McCandless, author, data journalist, information designer.
  • 4.
    "The greatest valueof a picture is when it forces us to notice what we never expected to see." -John Tukey
  • 5.
    "When information wasscarce, most of our efforts were devoted to hunting and gathering. Now that information is abundant, processing is more important." -Phillip Meyer, journalist and professor at UNC, Chapel Hill
  • 6.
    Uses• Get abird's eye view of "Big Data" information overload • Discover hidden insights • Highlight outliers visually • Understand patterns and trends instantly and visually
  • 7.
    Characteristics... of dataviz • Data itself is the story; standalone narrative (often coupled w/ text). • Interactive, communicative, visual. • Ranges from simple (charts) to complex (database-driven applications). • Both a technique and a format.
  • 8.
    Infographics ≠ data visualization Havedifferent connotations (Although many, including Alberto Cairo, information design legend, defend the term 'infographic' in its original sense)
  • 9.
    Infographics tend tobe... Hard to read Overly artsy Distracting from data.
  • 10.
  • 11.
  • 13.
    Brief history •Grew outof CAR (computer assisted- reporting) tradition •First major modern use: John Snow’s 1854 cholera map (right) •Has coincided with the era of “Big Data”
  • 16.
    "There's a strandof the data viz world that argues that everything could be a bar chart. That's possibly true but also possibly a world without joy." -Amanda Cox, New York Times
  • 18.
    "Data journalism isthe new punk. Anyone can do it." -Simon Rogers, The Guardian
  • 19.
  • 20.
  • 21.
    Now, let's takea look at some...
  • 22.
  • 23.
  • 24.
  • 25.
  • 26.
  • 27.
  • 28.
    Just a fewof dozens of tools to democratize data visualization. See Edmodo and links for exhaustive resource list.
  • 29.
    Steps for anydata viz project: 1. Research - Think of topic and research factors. 2. Find - Locate and/or obtain/scrape the data. 3. Analyze - Clean errors, evaluate what data says, crunch numbers,look for trends/inconsistencies. 4. Visualize - Display data in manner most appropriate to nature of story/format of information.
  • 30.