See discussions, stats,and author profiles for this publication at:
https://www.researchgate.net/publication/362814047
Mathematics and Statistics Behind Machine Learning
Presentation · August 2022
DOI: 10.13140/RG.2.2.15915.92969
CITATIONS
0
READS
1,465
1 author:
R. C. Mittal
Jaypee Institute of Information Technolog
y
164 PUBLICATIONS 4,039 CITATIONS
SEE PROFILE
All content following this page was uploaded by R. C. Mittal on 20 August
2022.
The user has requested enhancement of the downloaded file.
2.
Mathematics and StatisticsBehind
Machine Learning
R. C. Mittal
Department of Mathematics,
Jaypee Institute of Information Technology
Sector 62 NOIDA (U. P.)
8/20/2022 FDP On Machine Learning 1
3.
8/20/2022 FDP OnMachine Learning 2
Content
s
• Introduction
• Artificial Intelligence
• Machine Learning
• Statistics and Probability in Machine Learning
• Linear Algebra in Machine Learning in Machine Learning
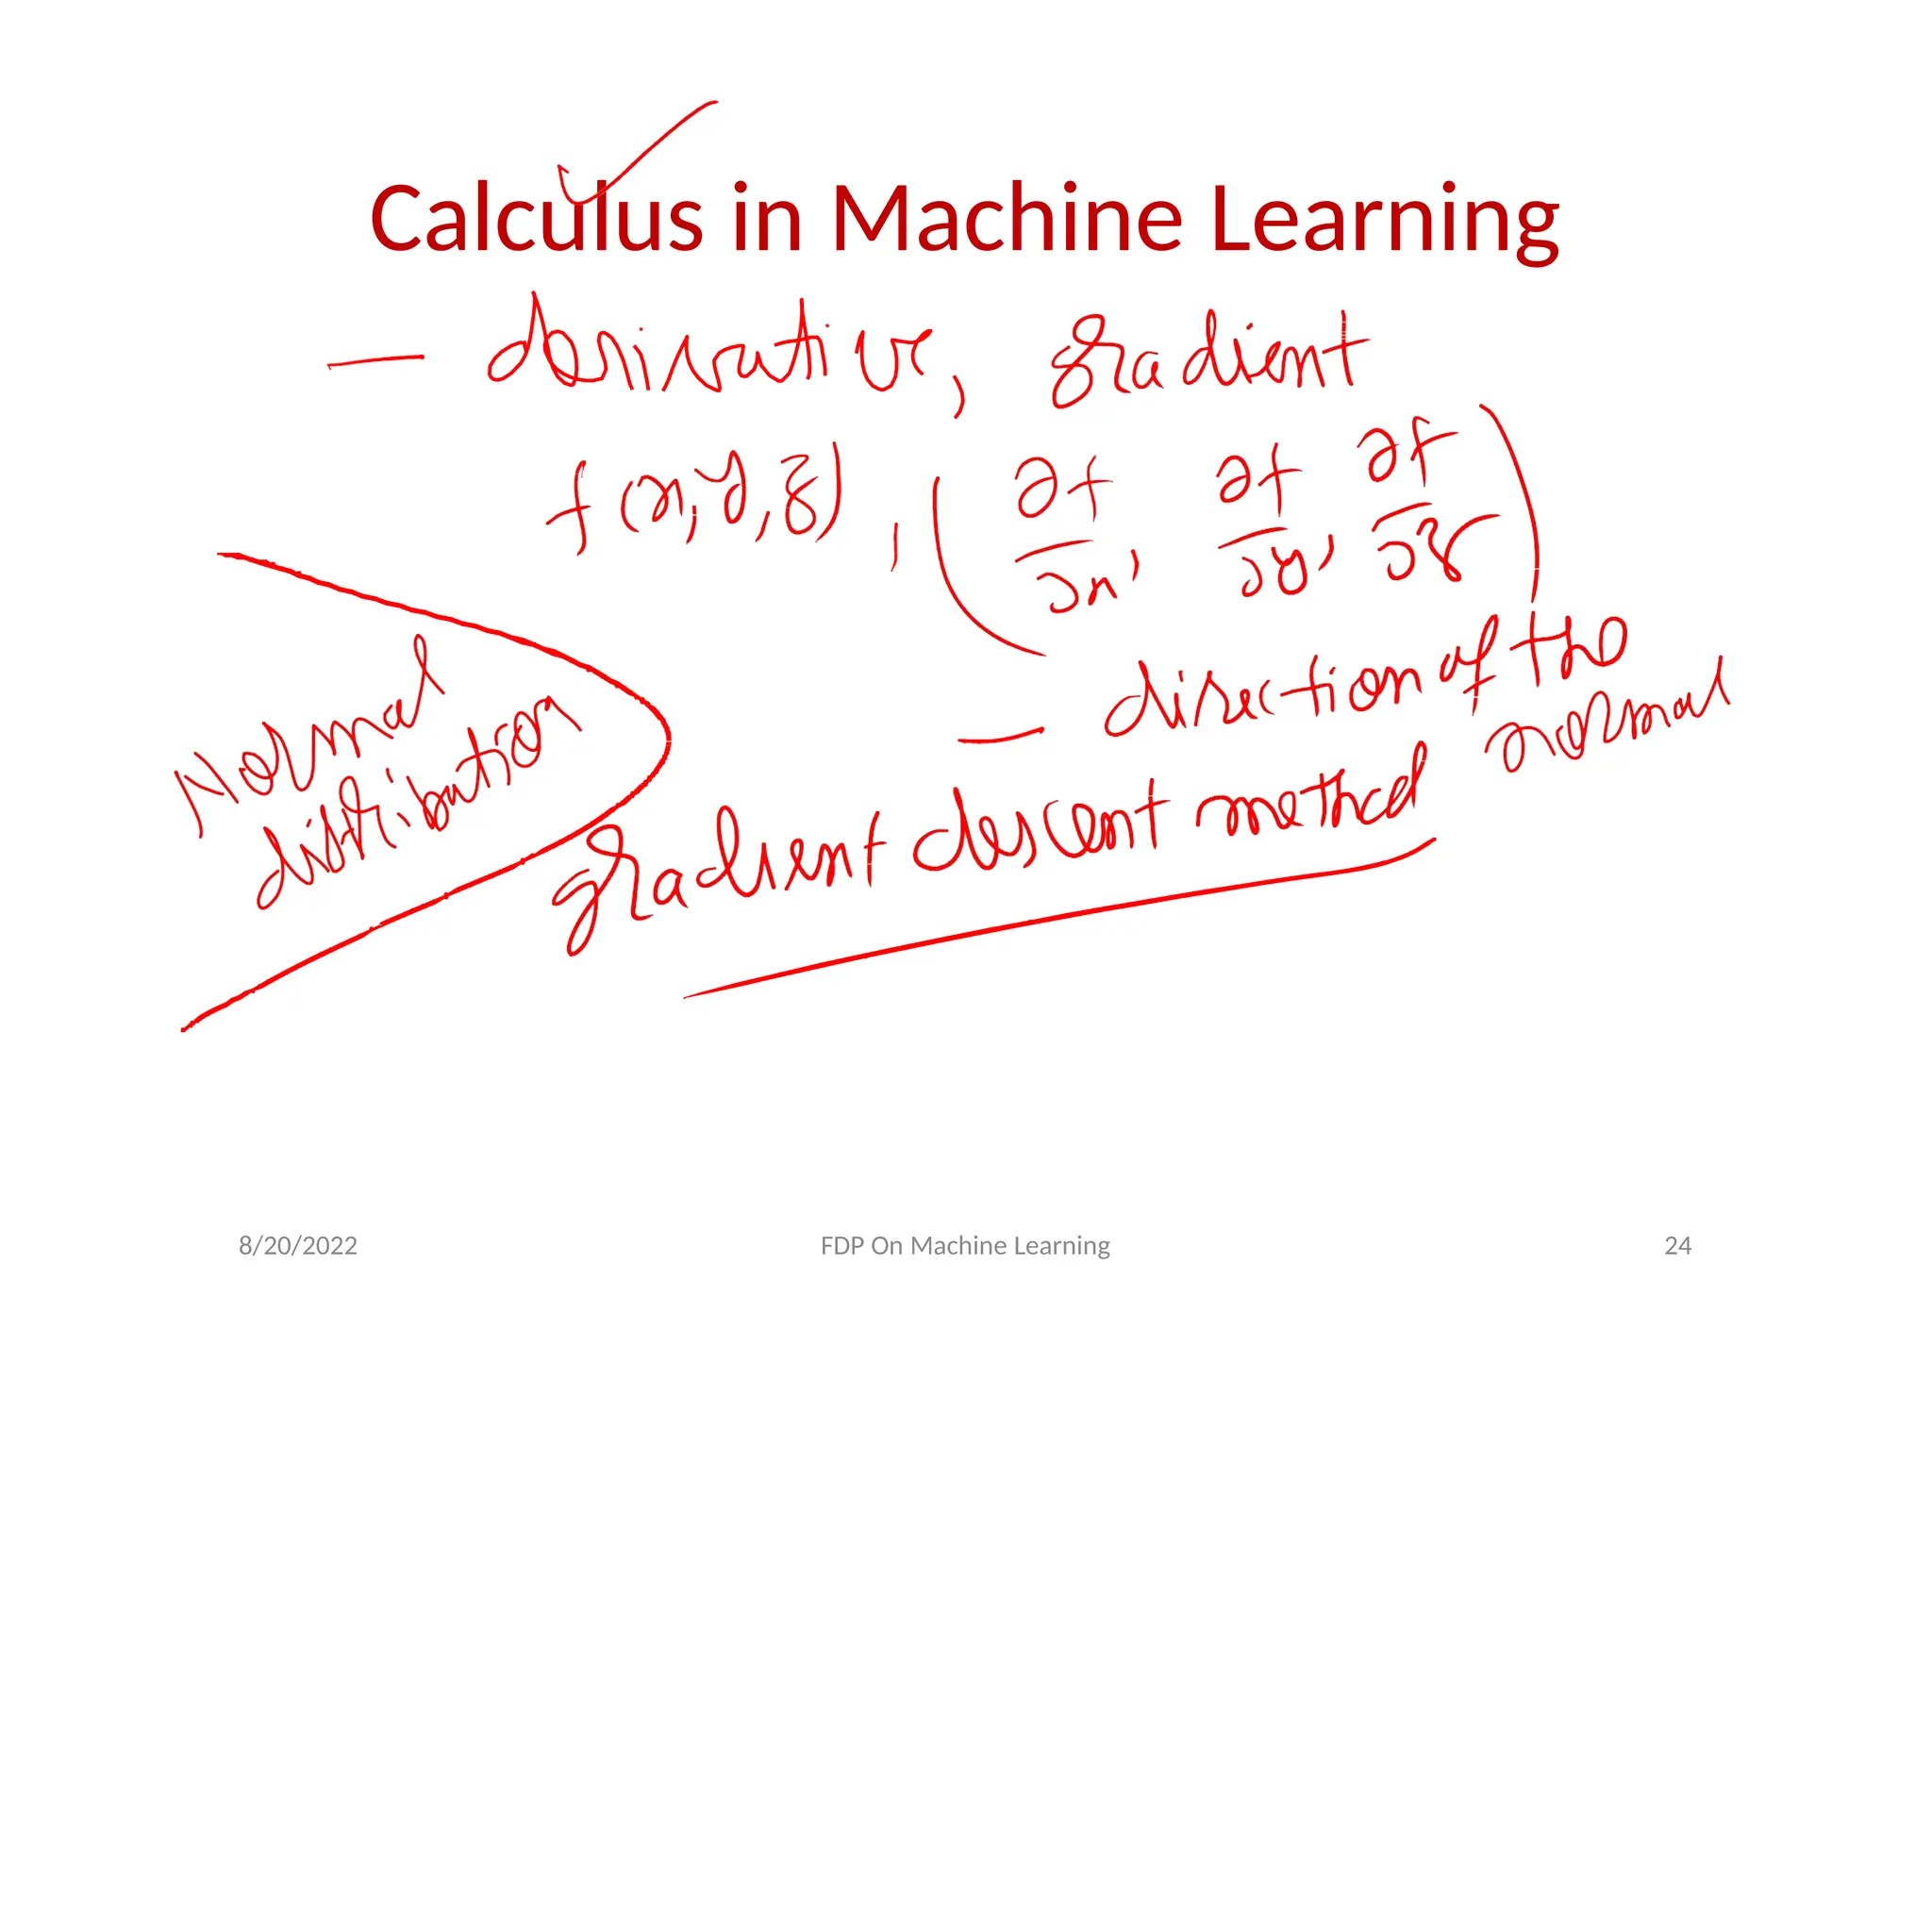
• Calculus in Machine Learning
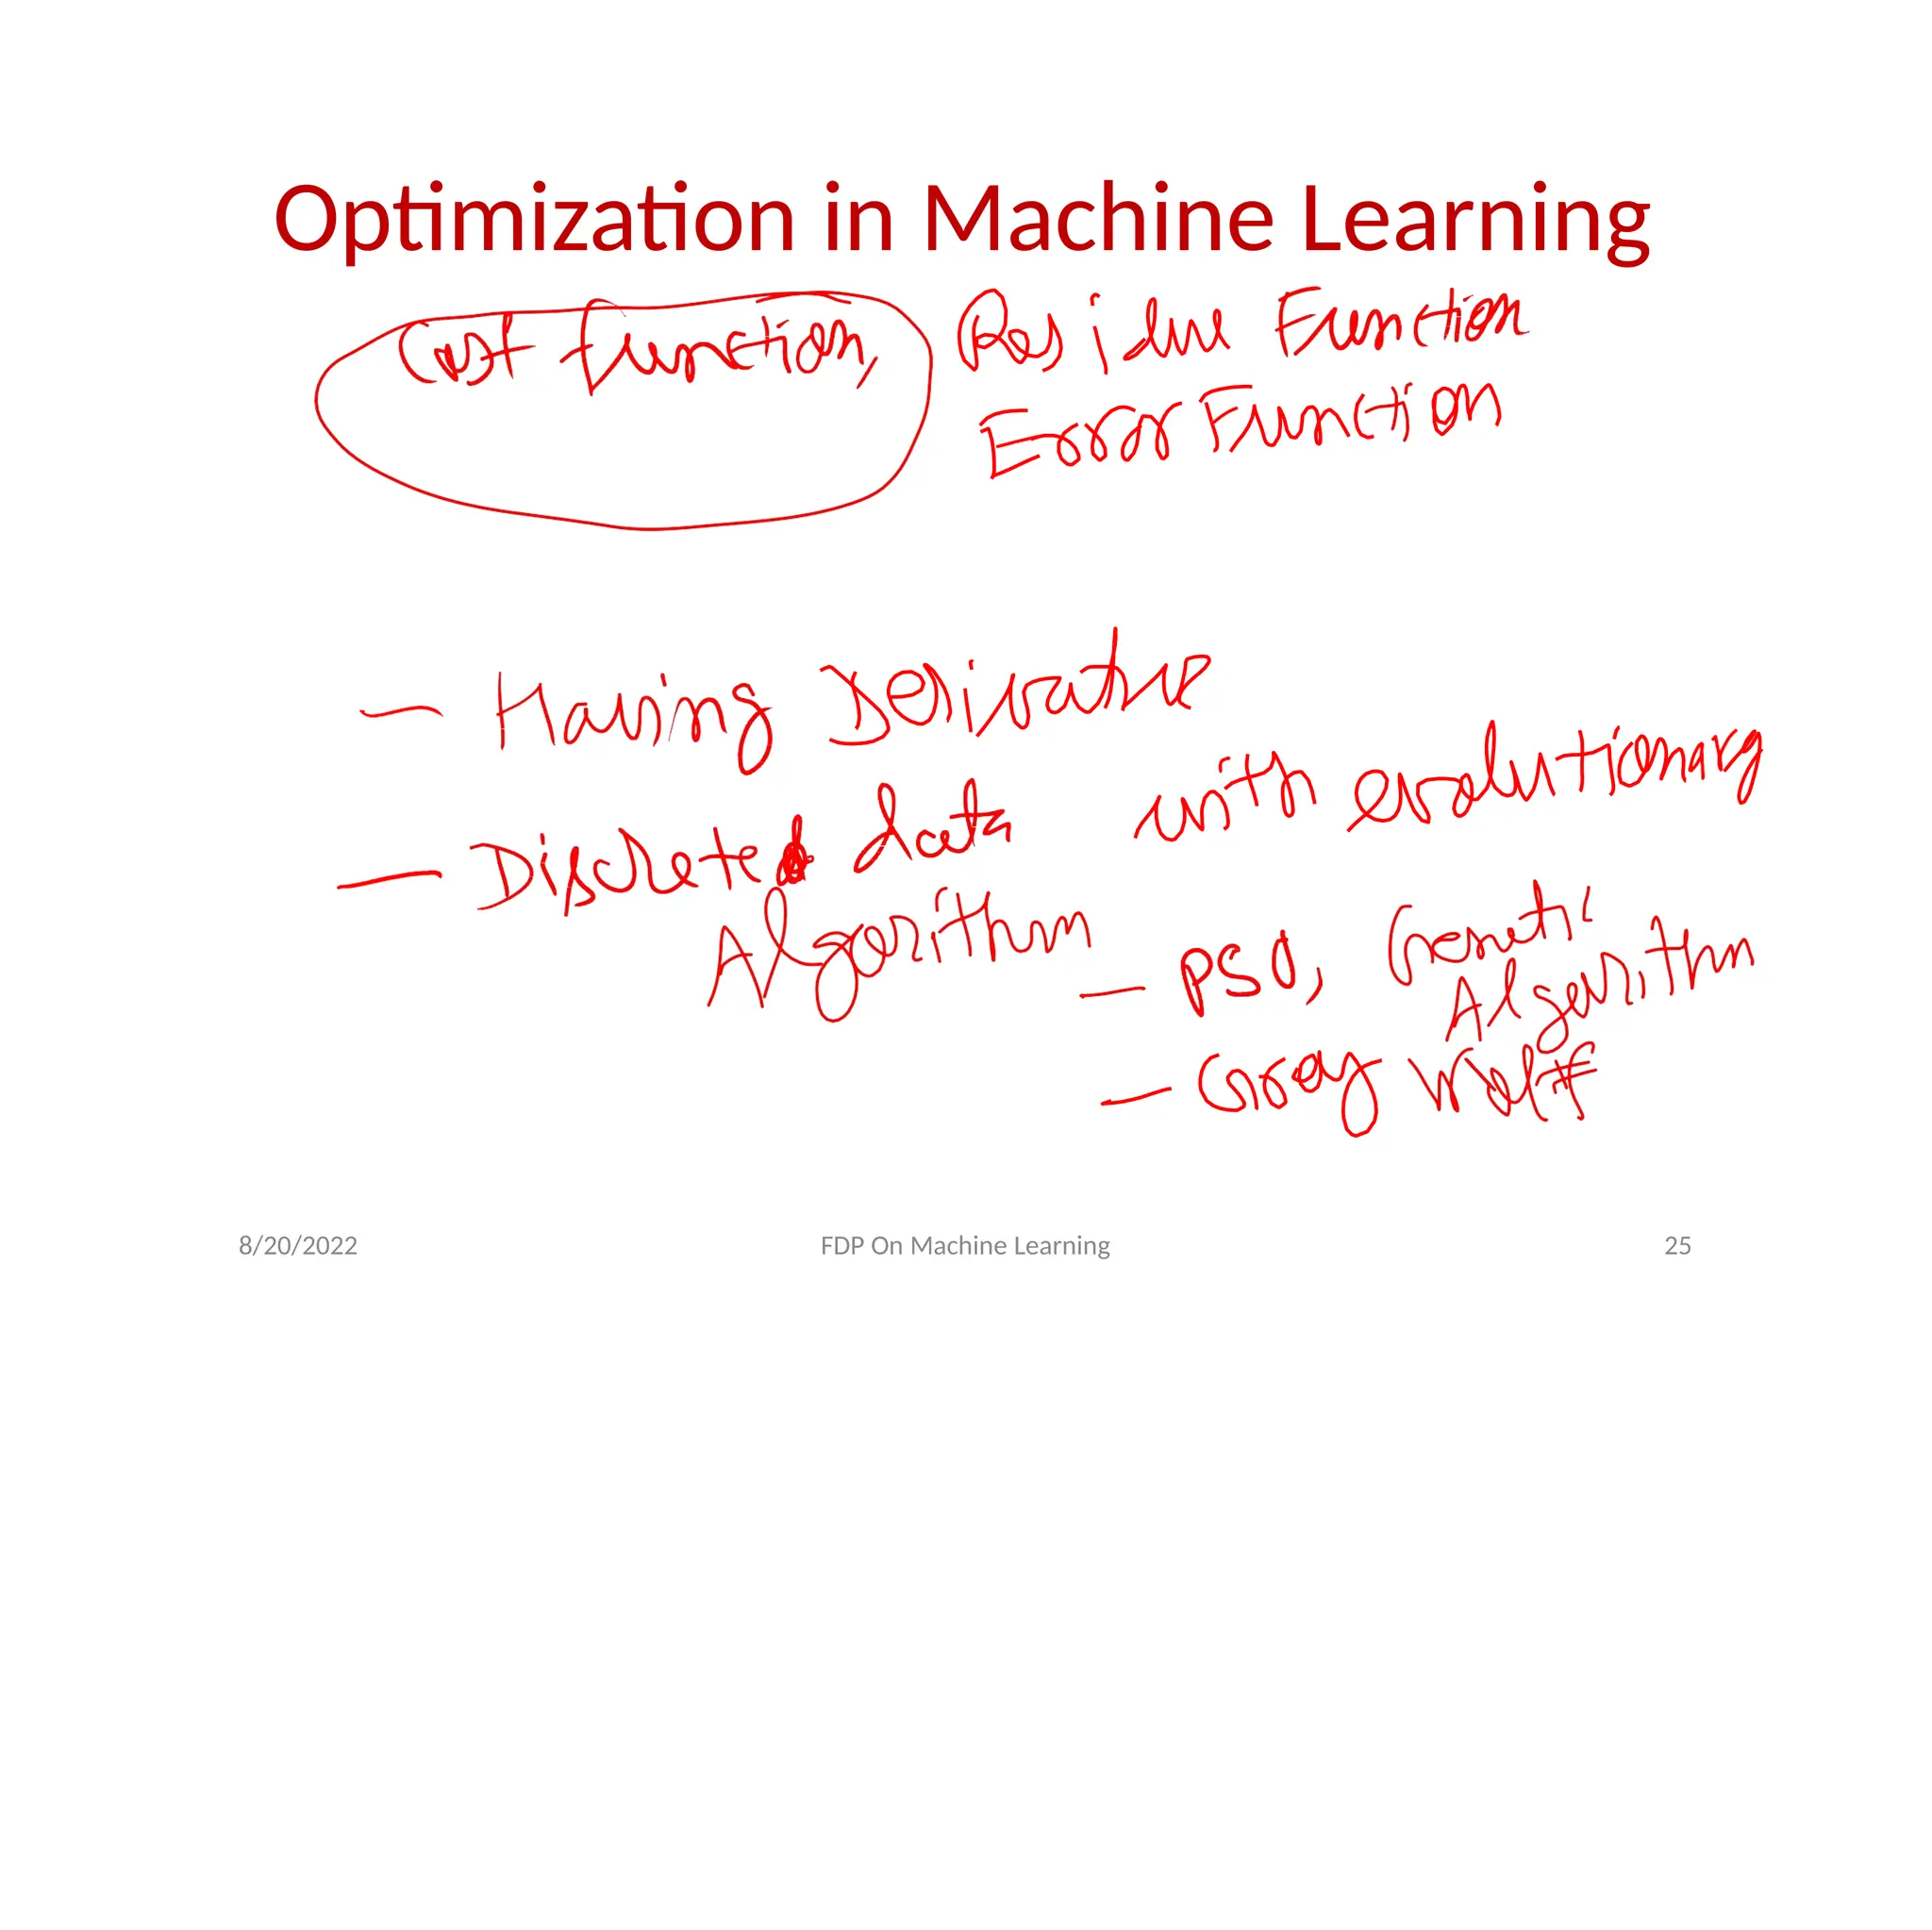
• Optimization in Machine Learning
• Different Machine Learning Models
• References
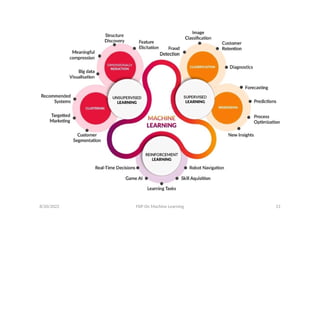
Artificial Intelligence
• Intelligencecan be defined as the ability to learn
new skills and improve it with experience.
• Artificial Intelligence – It is not real intelligence.
The ability has been acquired through the
intelligence of some one else.
The word Artificial Intelligence was first coined
in 1955 by John McCarthy to describe science
and engineering of making intelligent machines.
8/20/2022 FDP On Machine Learning 5
7.
8/20/2022 FDP OnMachine Learning 6
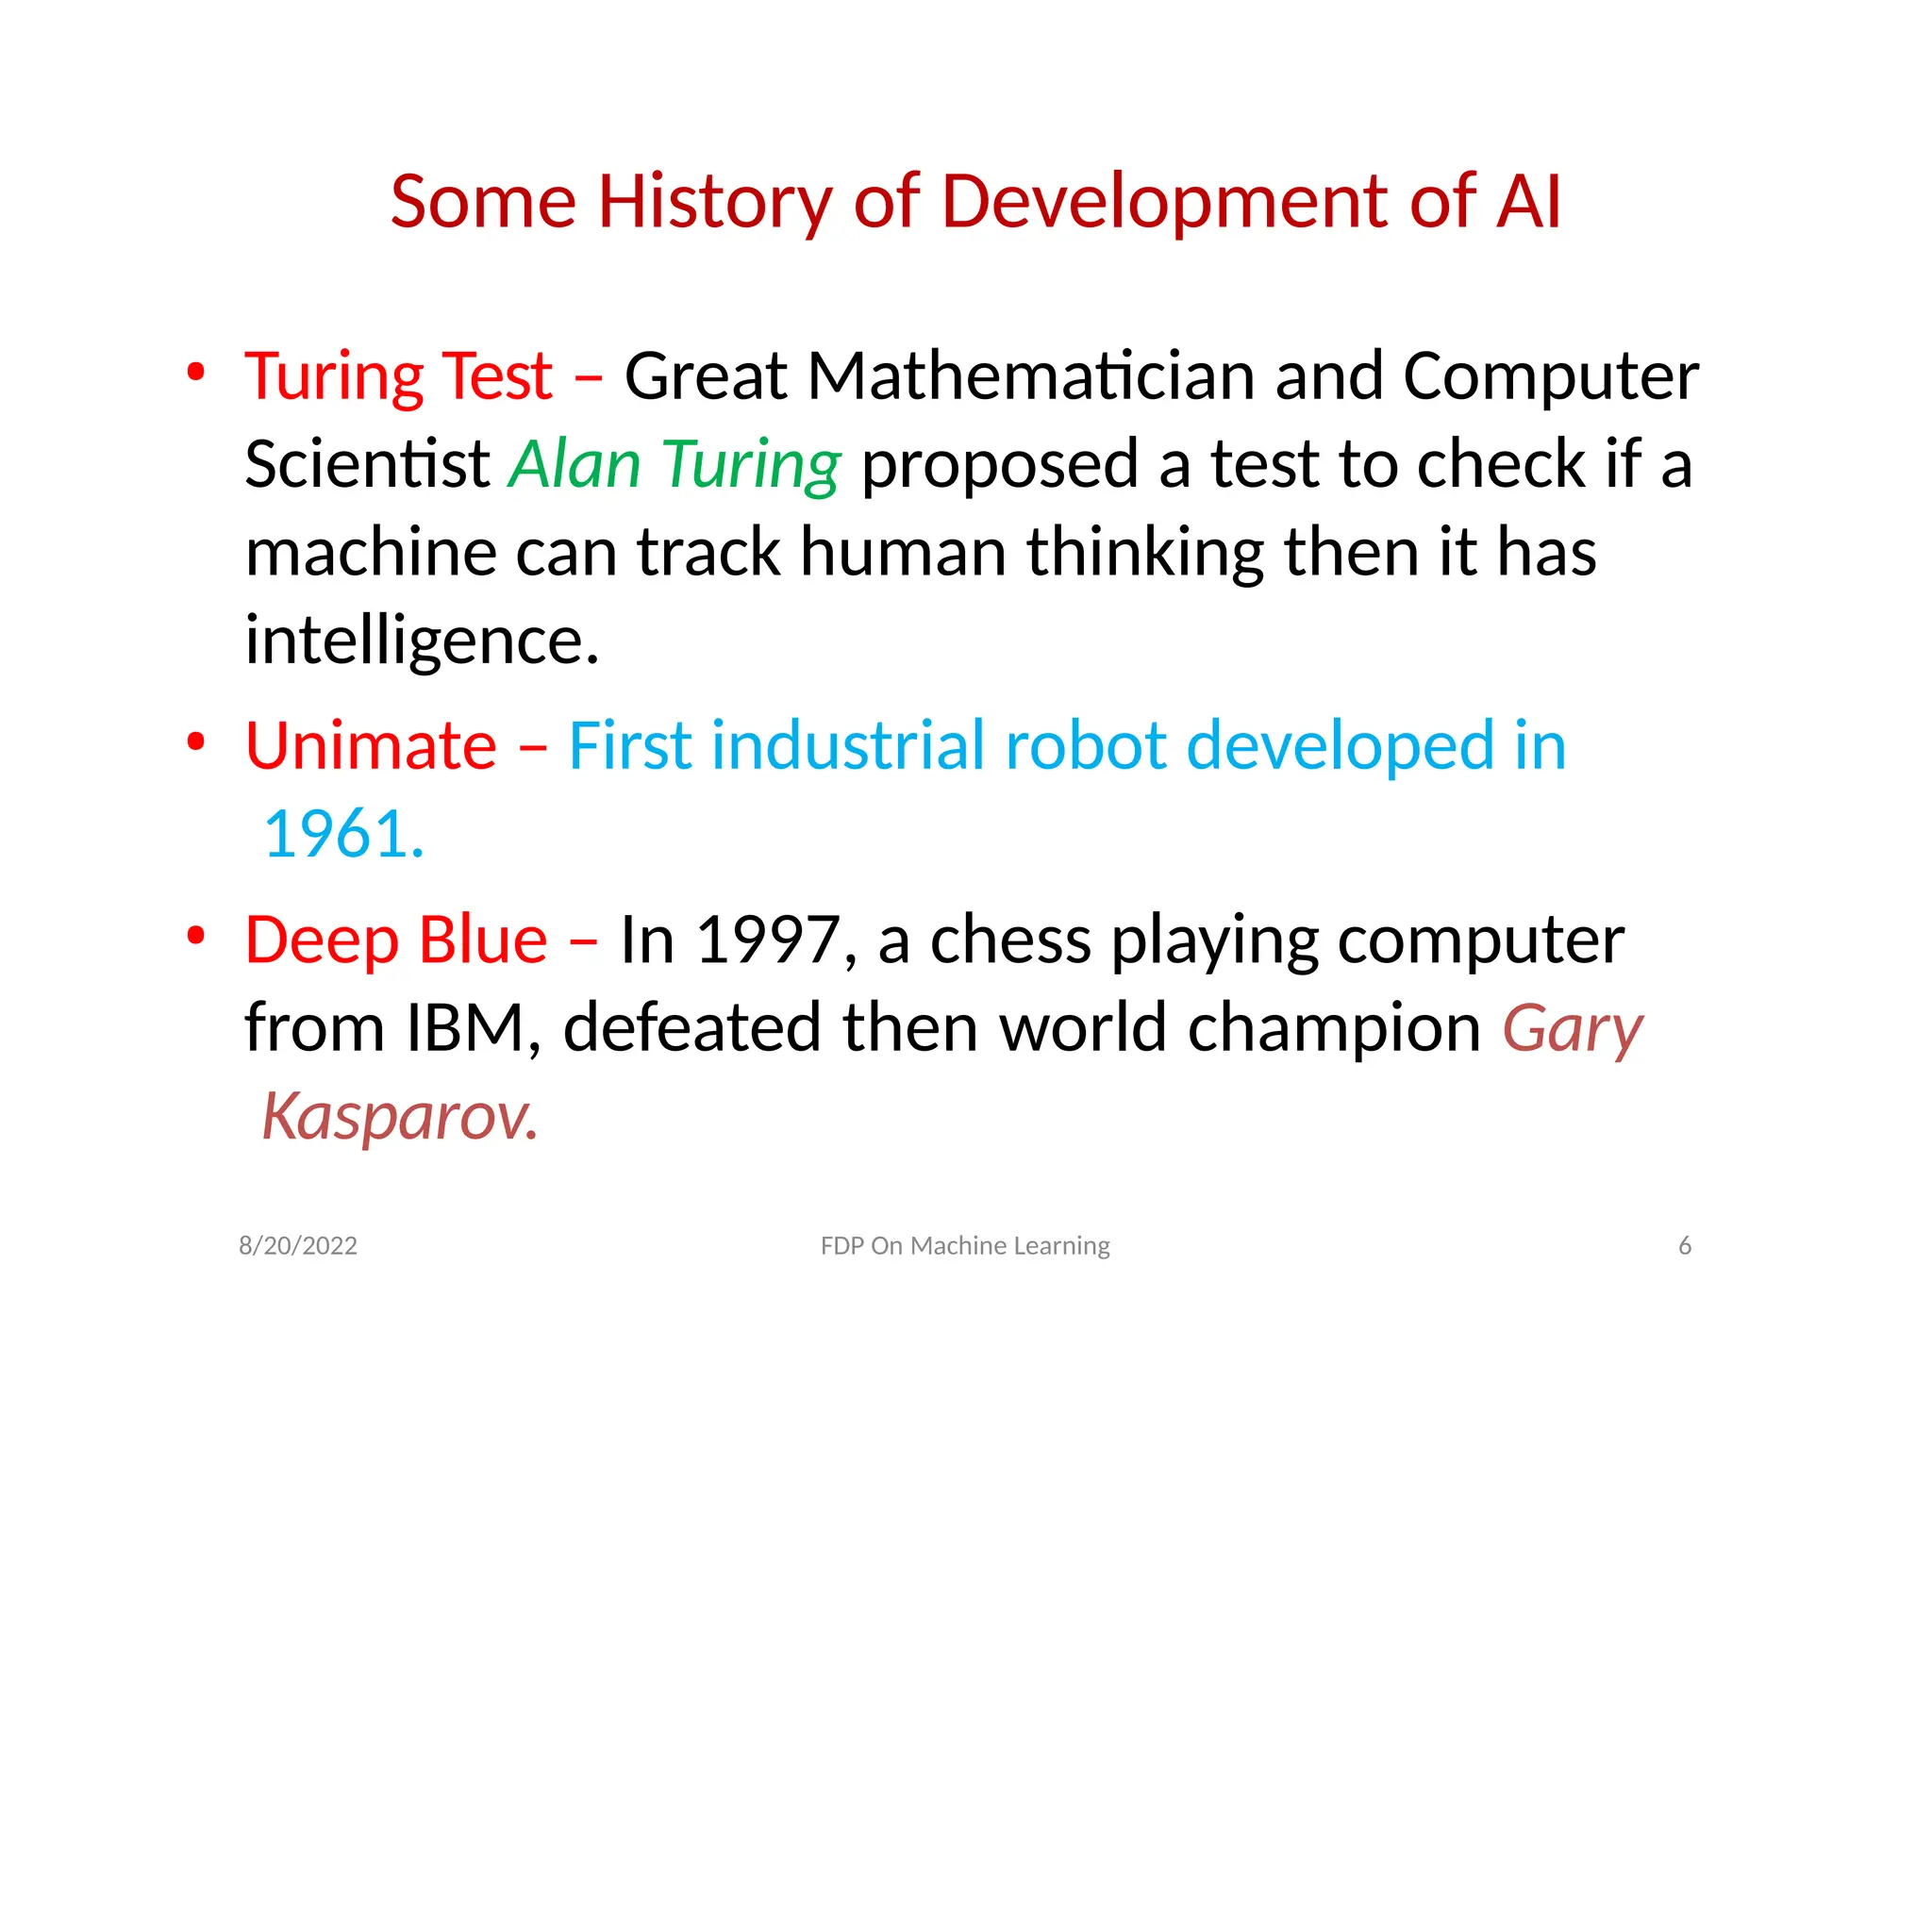
Some History of Development of AI
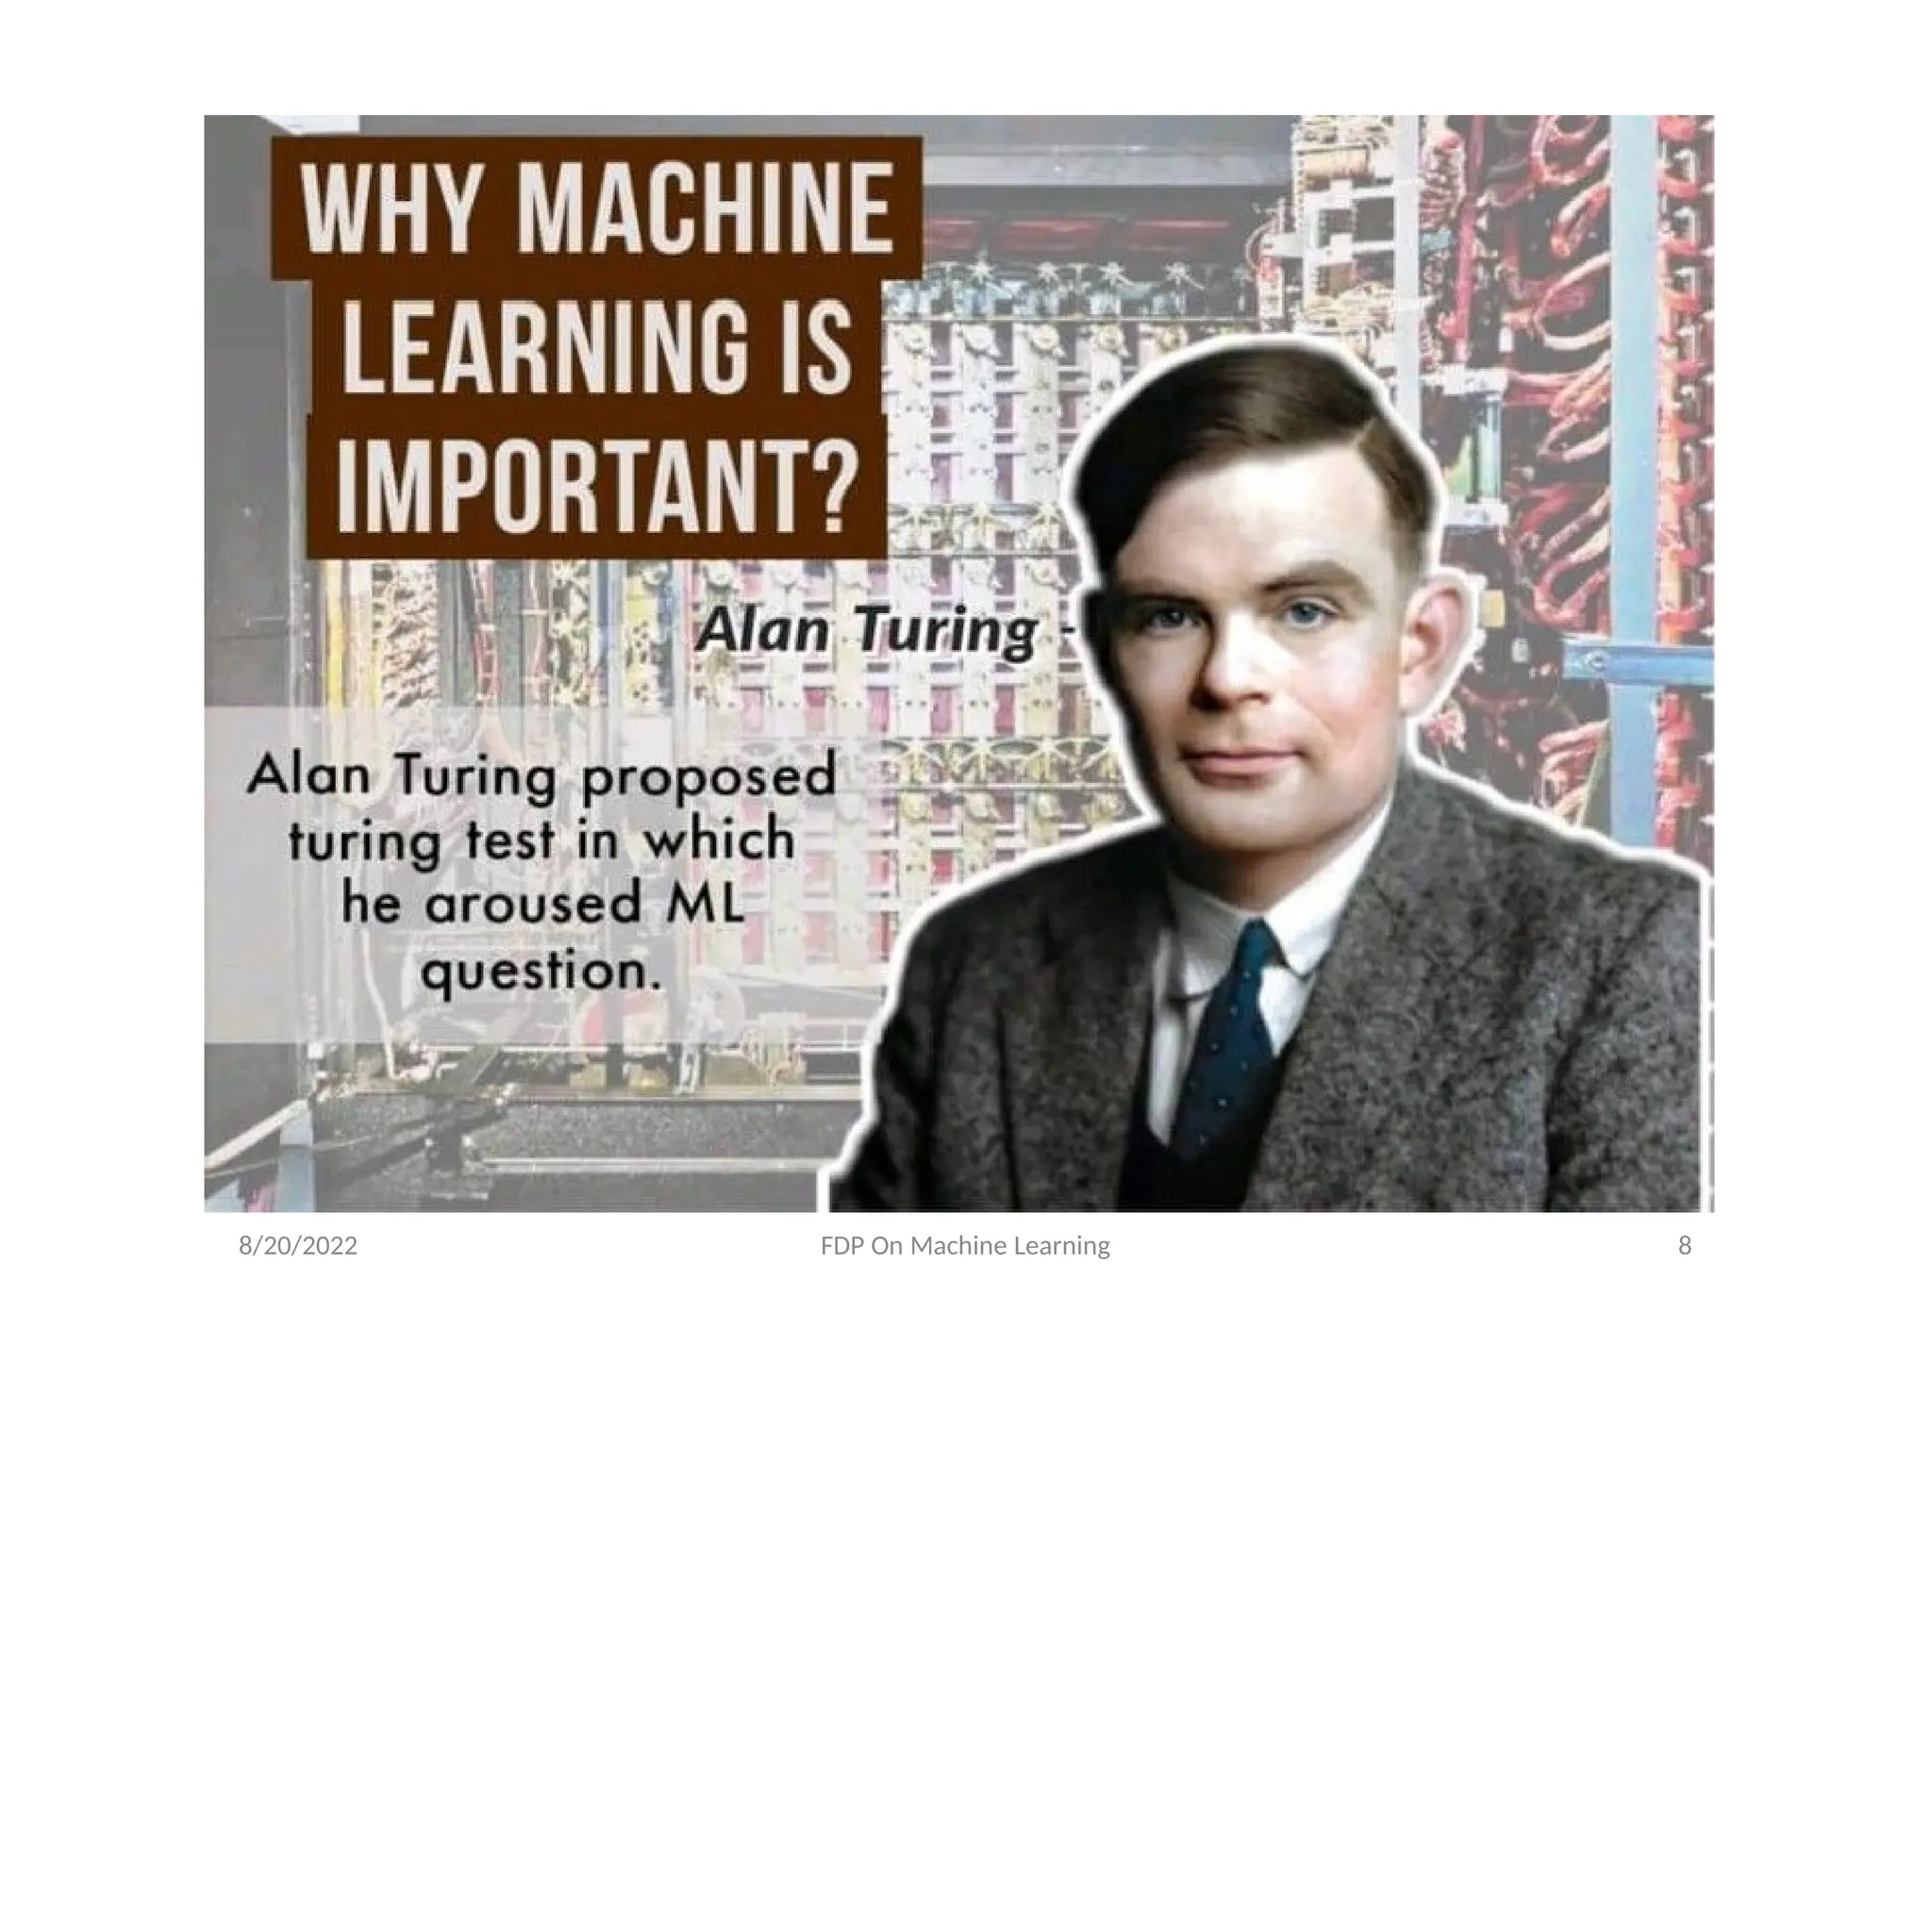
• Turing Test – Great Mathematician and Computer
Scientist Alan Turing proposed a test to check if a
machine can track human thinking then it has
intelligence.
• Unimate – First industrial robot developed in
1961.
• Deep Blue – In 1997, a chess playing computer
from IBM, defeated then world champion Gary
Kasparov.
8.
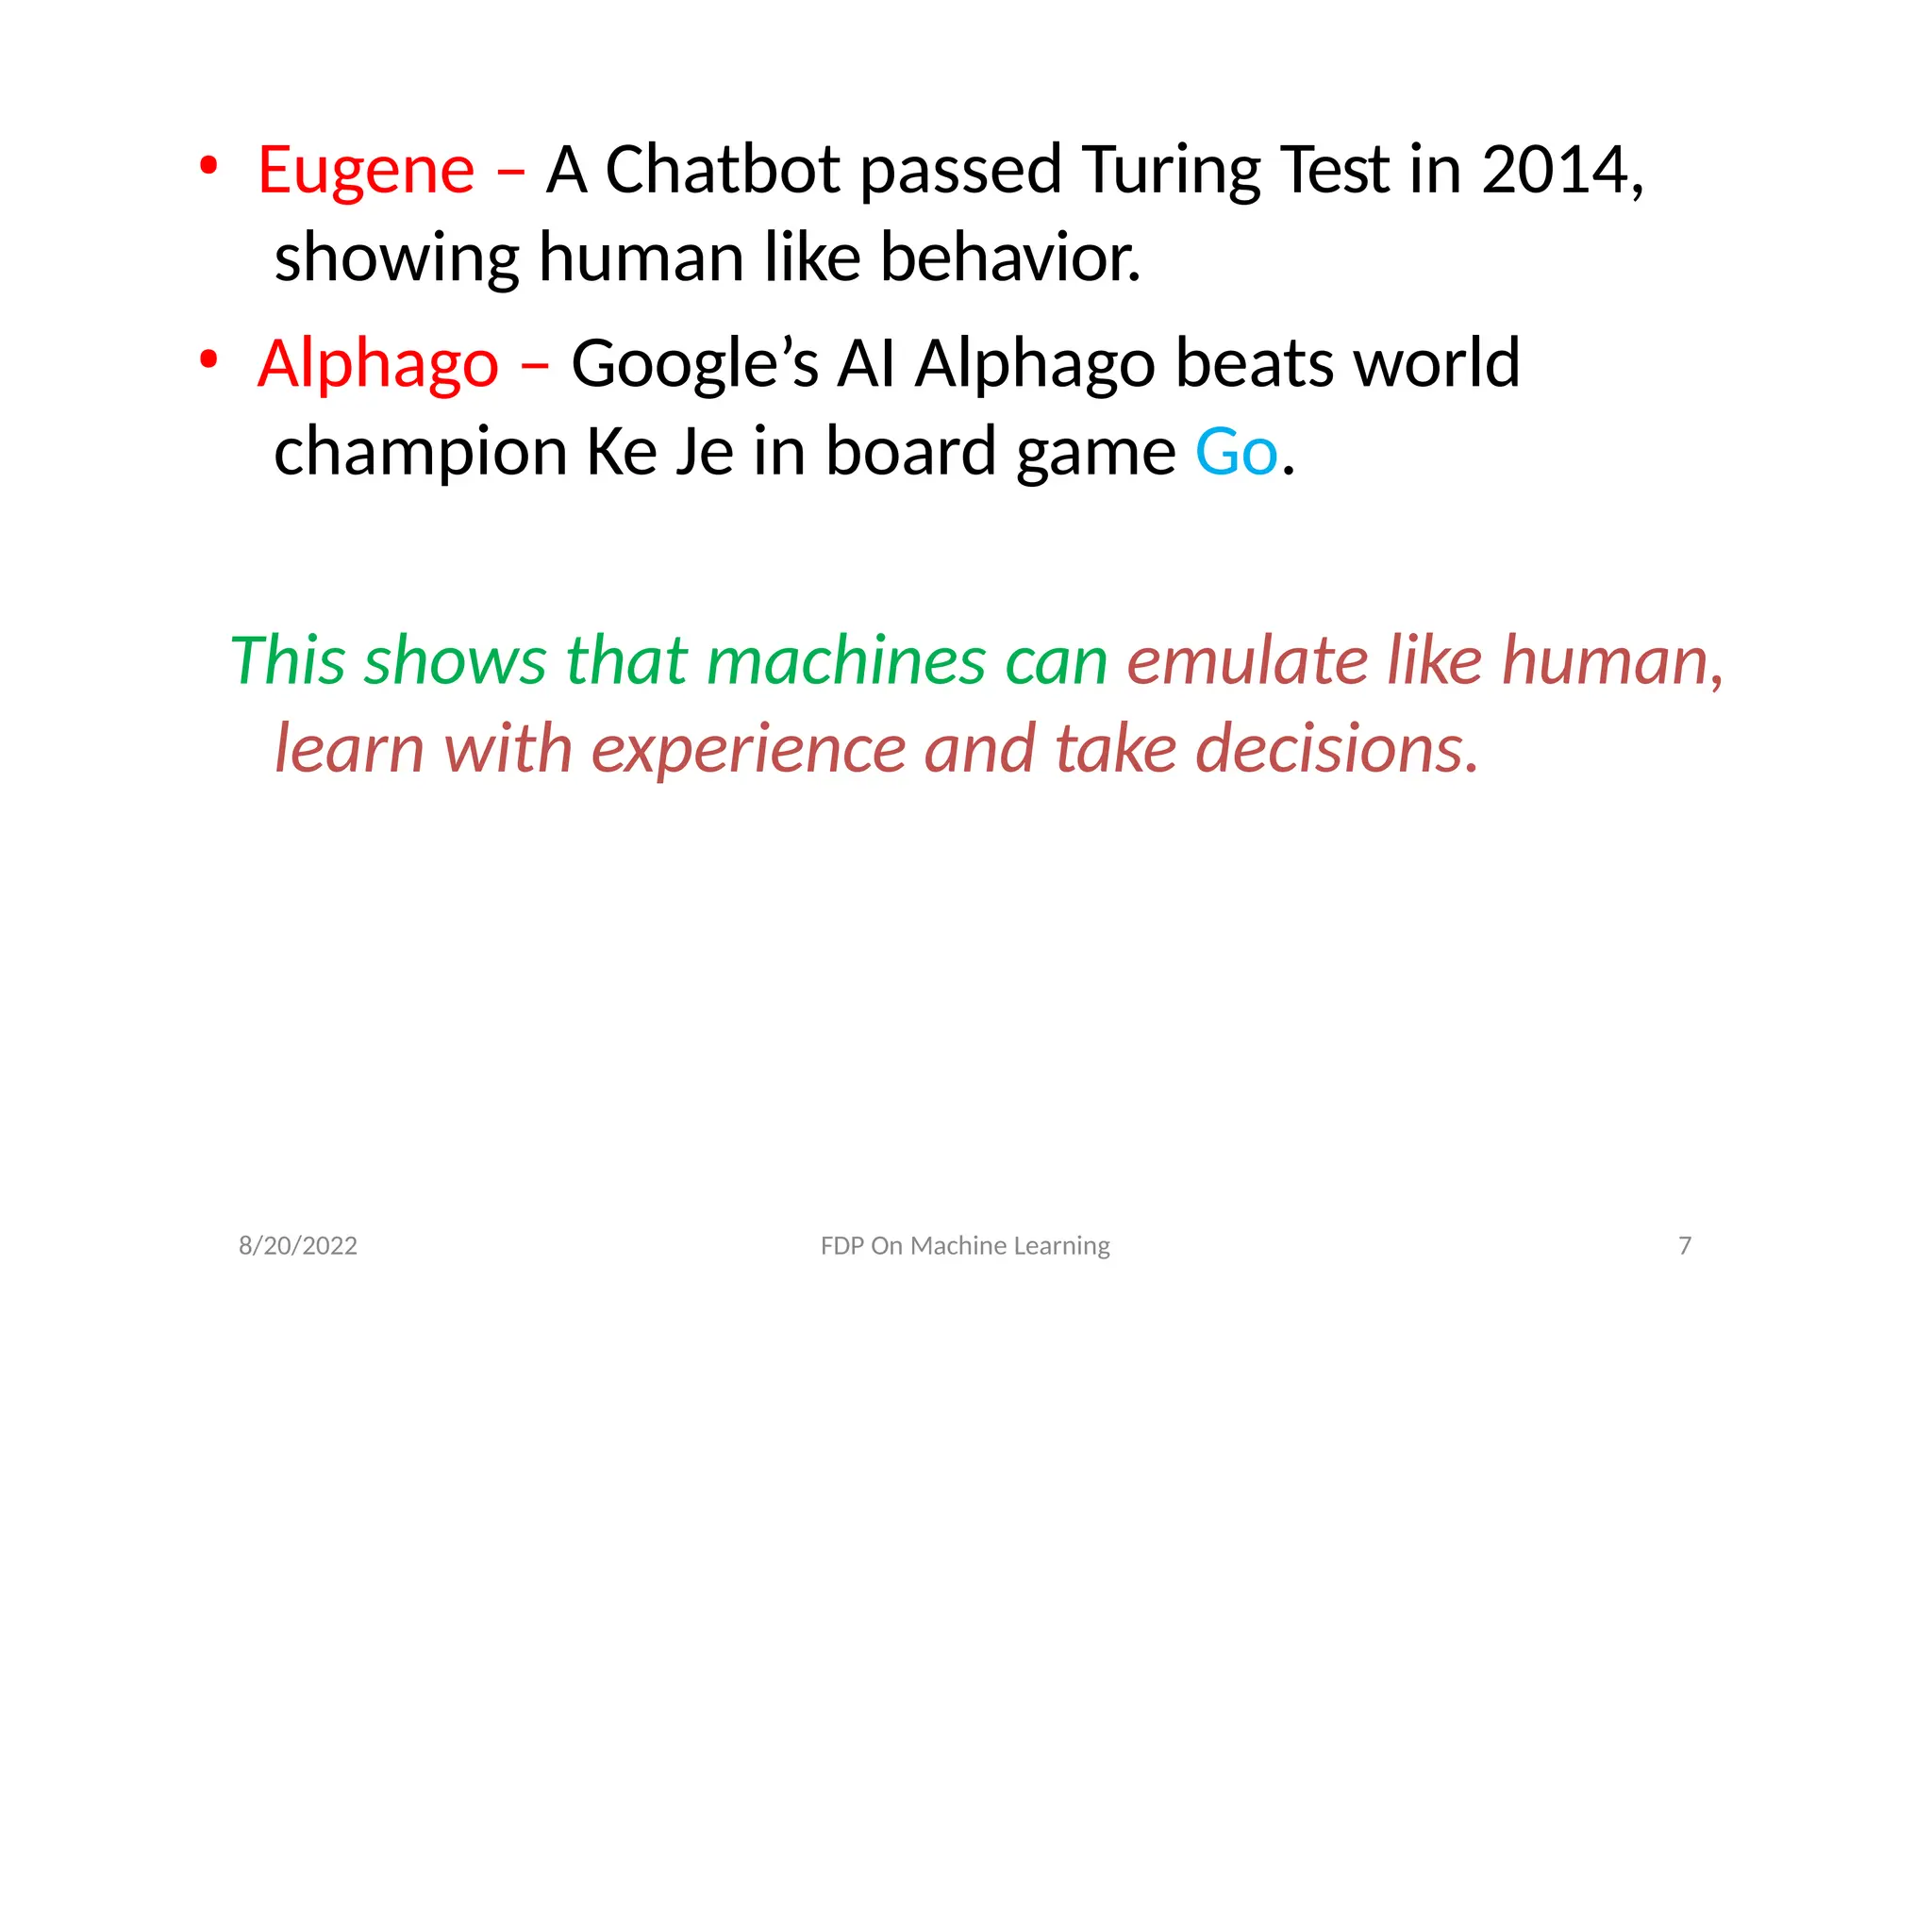
• Eugene –A Chatbot passed Turing Test in 2014,
showing human like behavior.
• Alphago – Google’s AI Alphago beats world
champion Ke Je in board game Go.
This shows that machines can emulate like human,
learn with experience and take decisions.
8/20/2022 FDP On Machine Learning 7
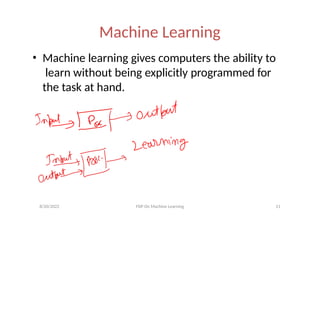
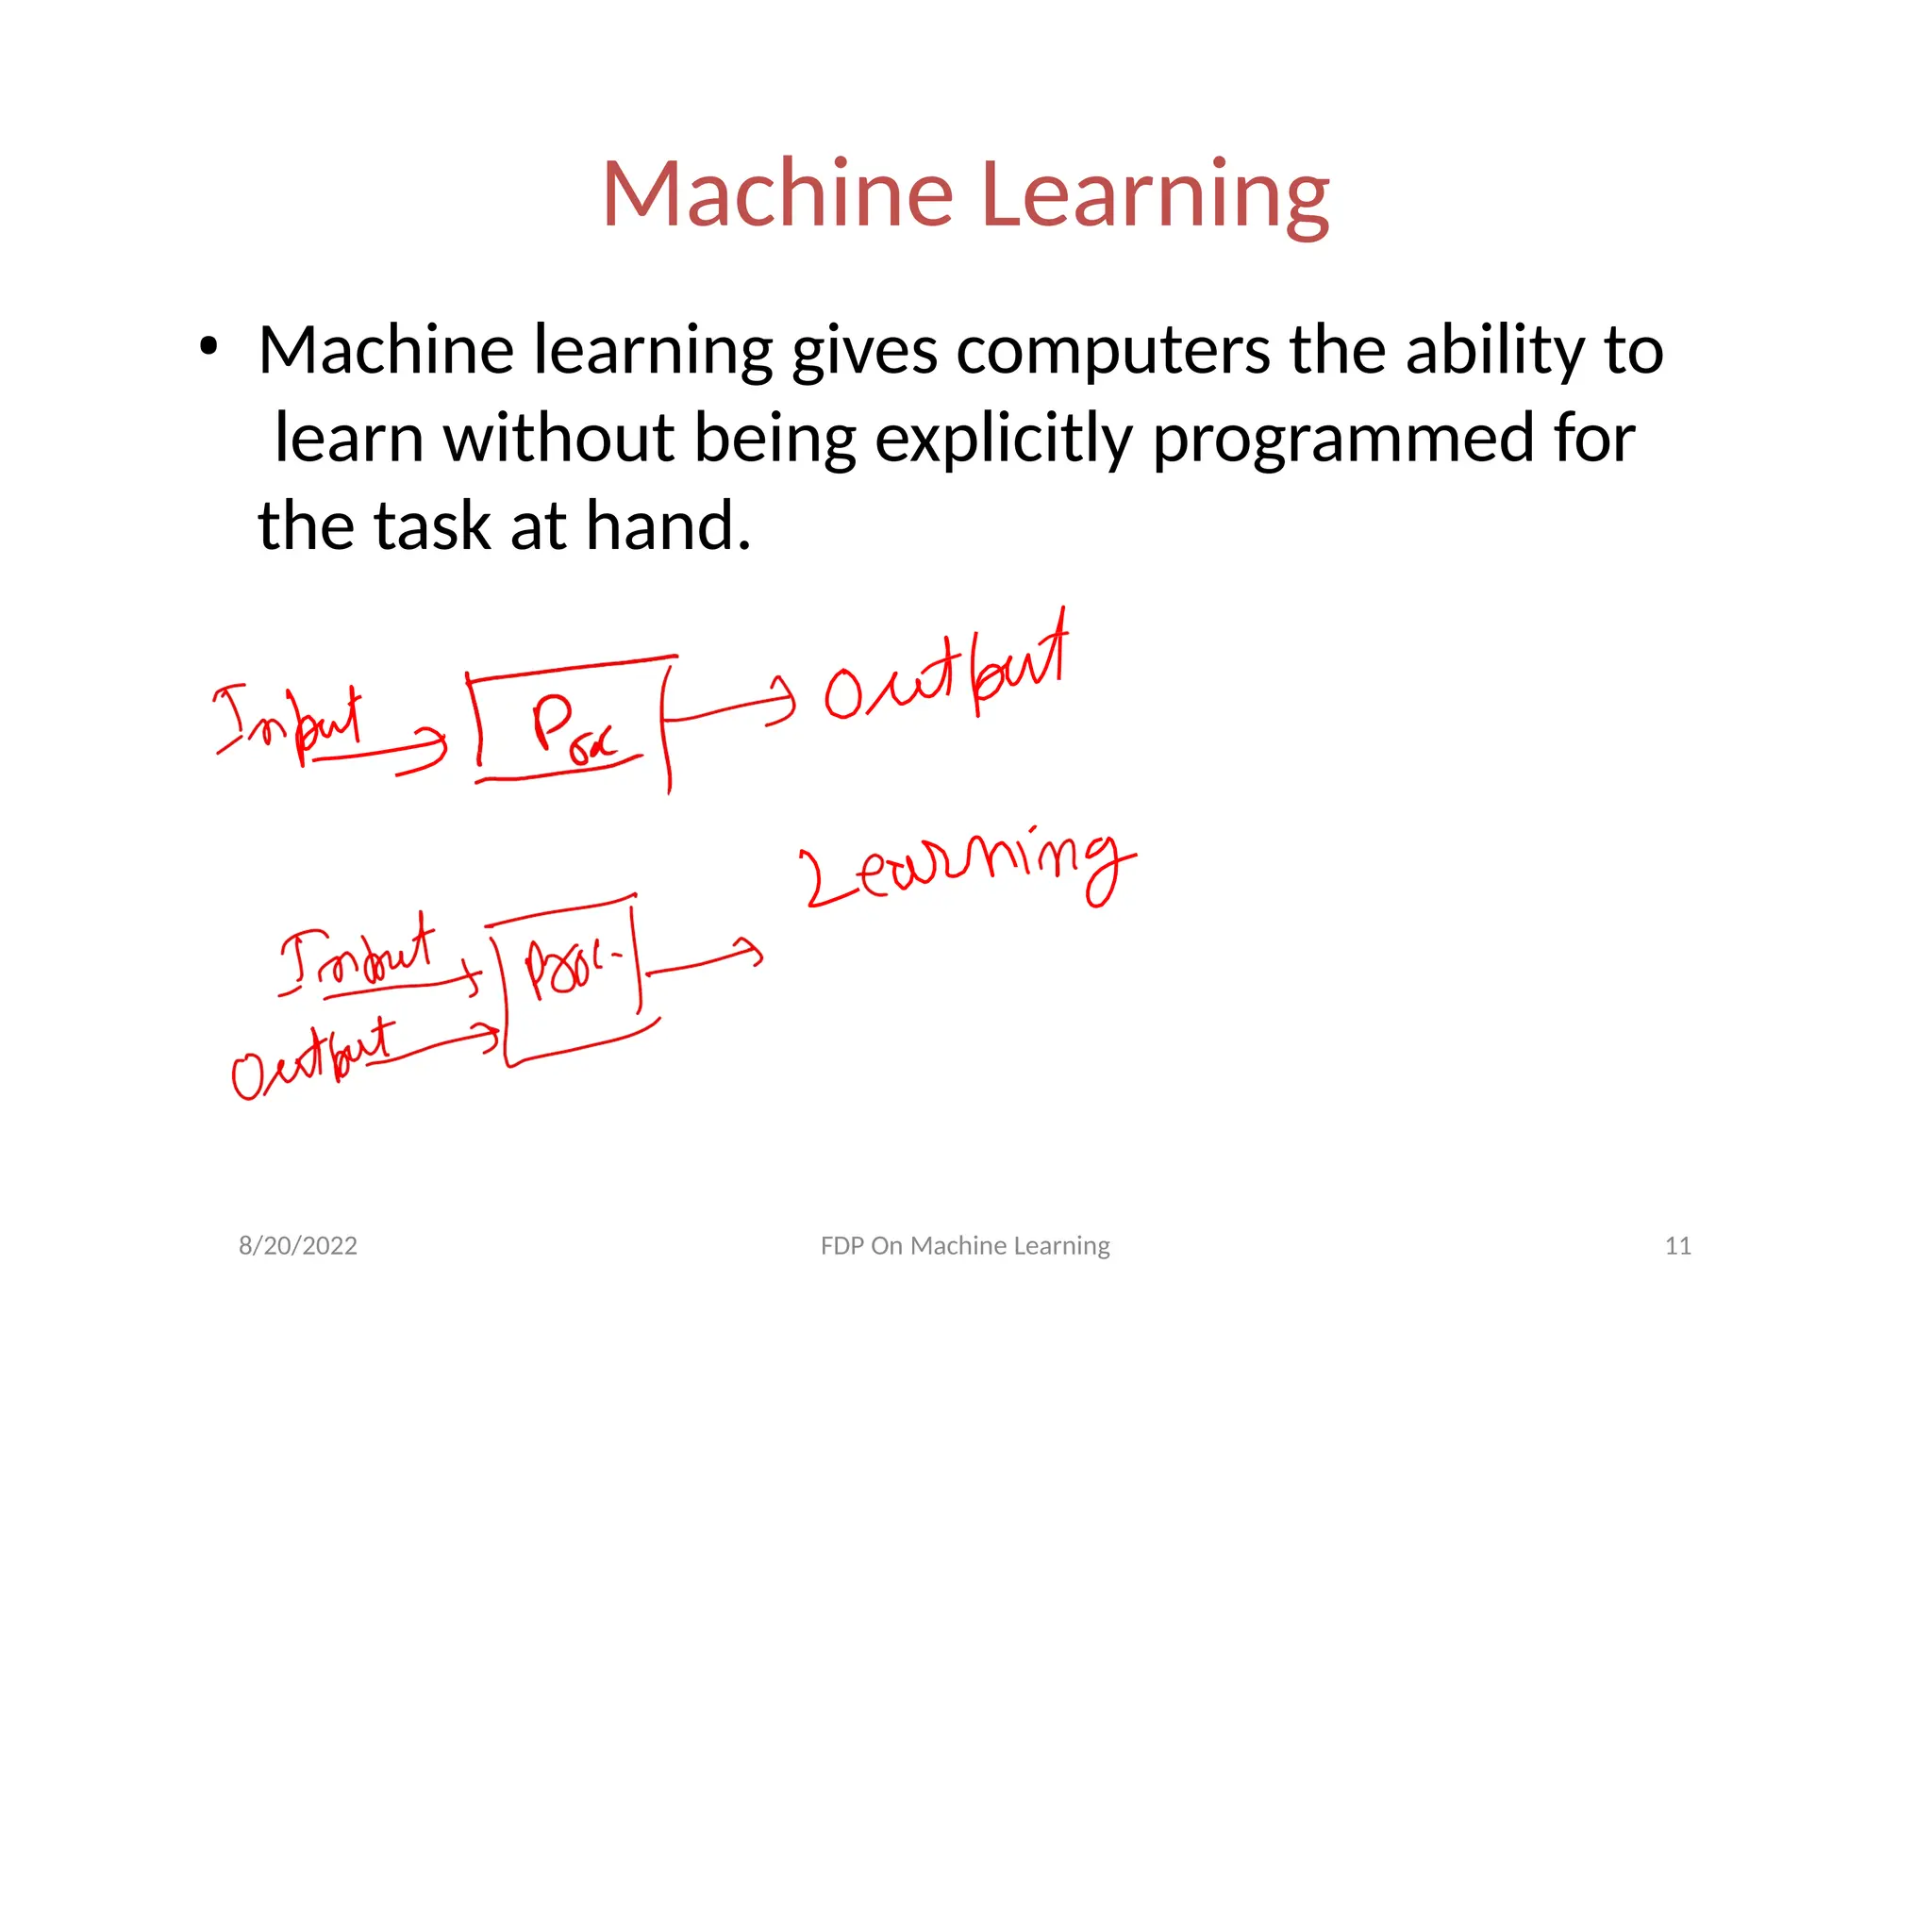
Machine Learning
• Machinelearning gives computers the ability to
learn without being explicitly programmed for
the task at hand.
8/20/2022 FDP On Machine Learning 11
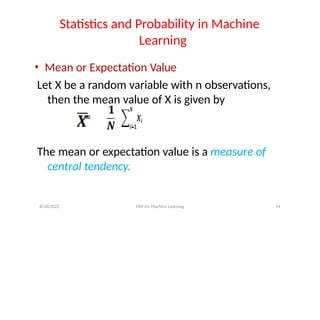
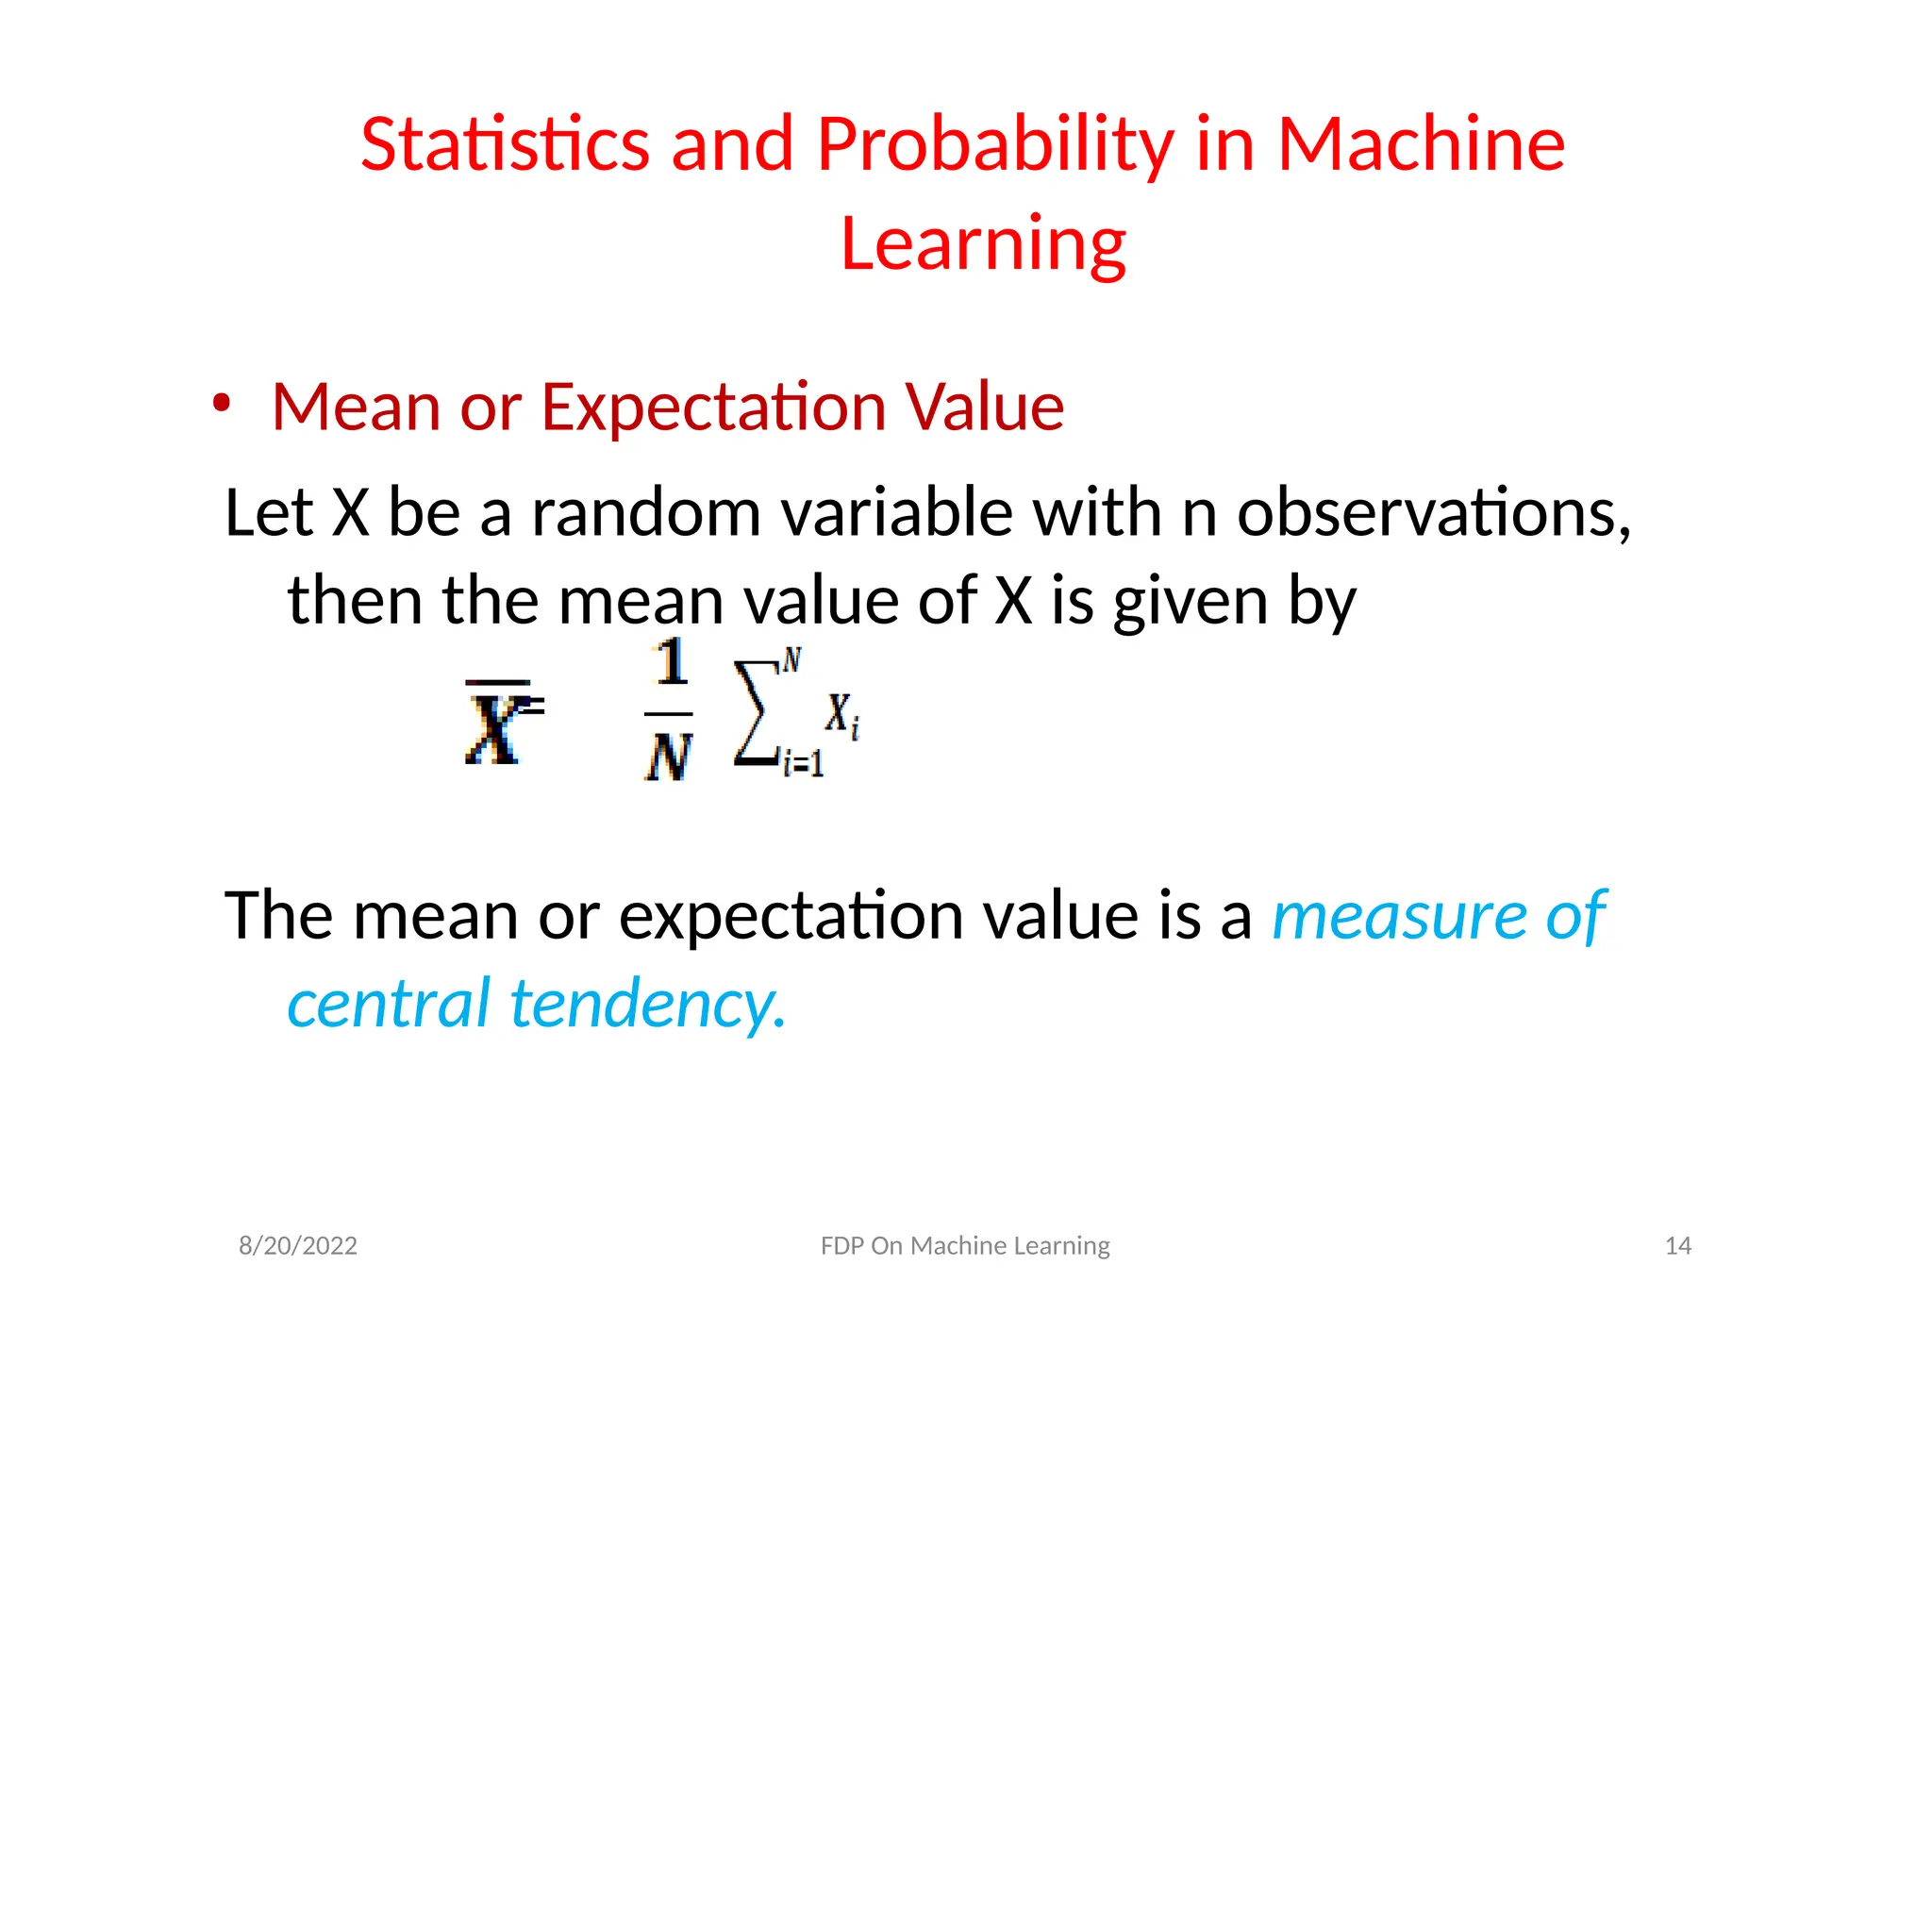
Statistics and Probabilityin Machine
Learning
• Mean or Expectation Value
Let X be a random variable with n observations,
then the mean value of X is given by
=
The mean or expectation value is a measure of
central tendency.
8/20/2022 FDP On Machine Learning 14
16.
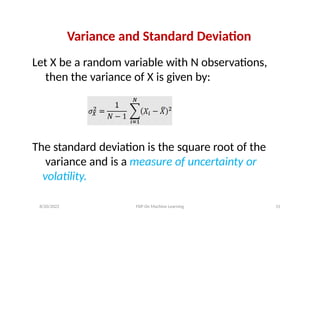
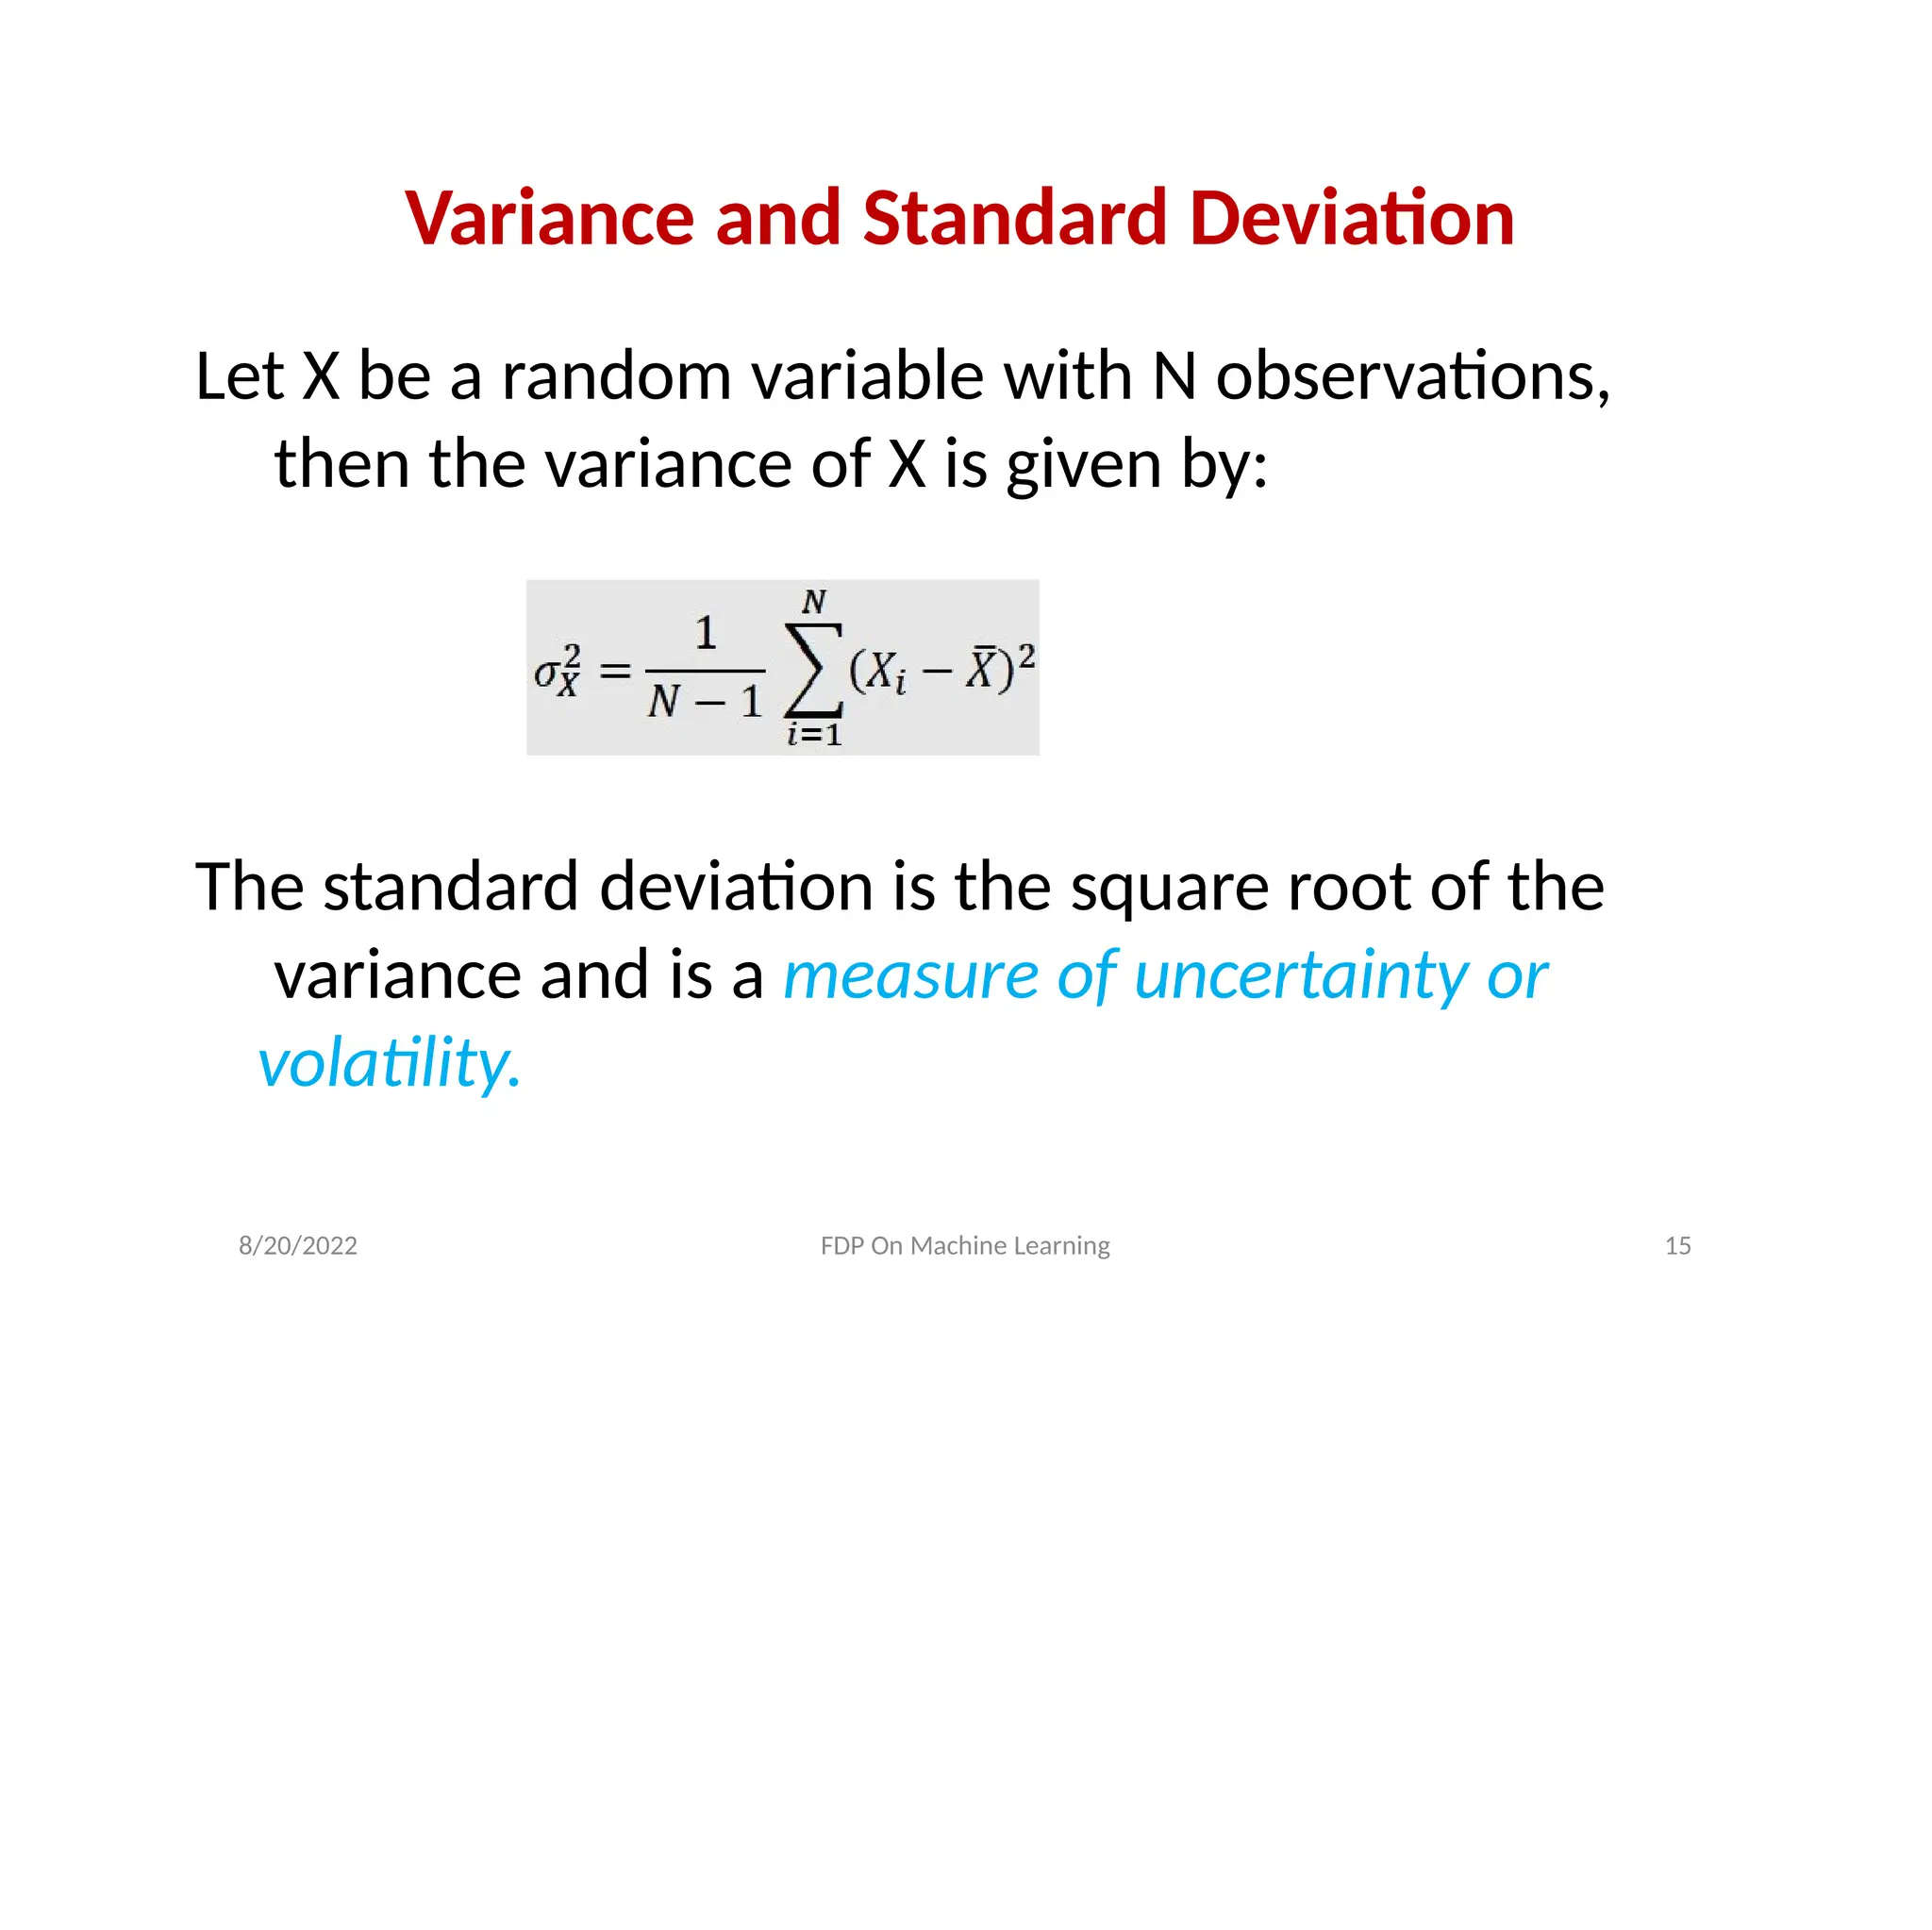
Variance and StandardDeviation
Let X be a random variable with N observations,
then the variance of X is given by:
The standard deviation is the square root of the
variance and is a measure of uncertainty or
volatility.
8/20/2022 FDP On Machine Learning 15
17.
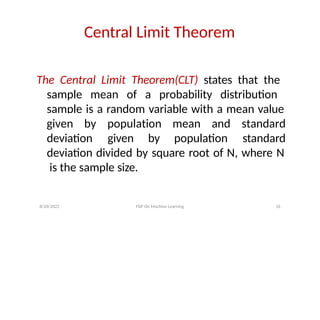
Central Limit Theorem
TheCentral Limit Theorem(CLT) states that the
sample mean of a probability distribution
sample is a random variable with a mean value
deviation given by population
8/20/2022 FDP On Machine Learning 16
given by population mean and standard
standard
deviation divided by square root of N, where N
is the sample size.
18.
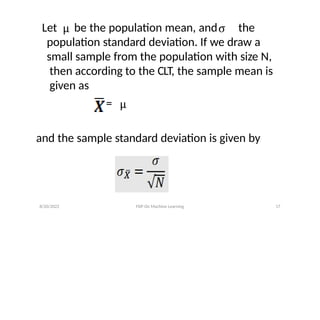
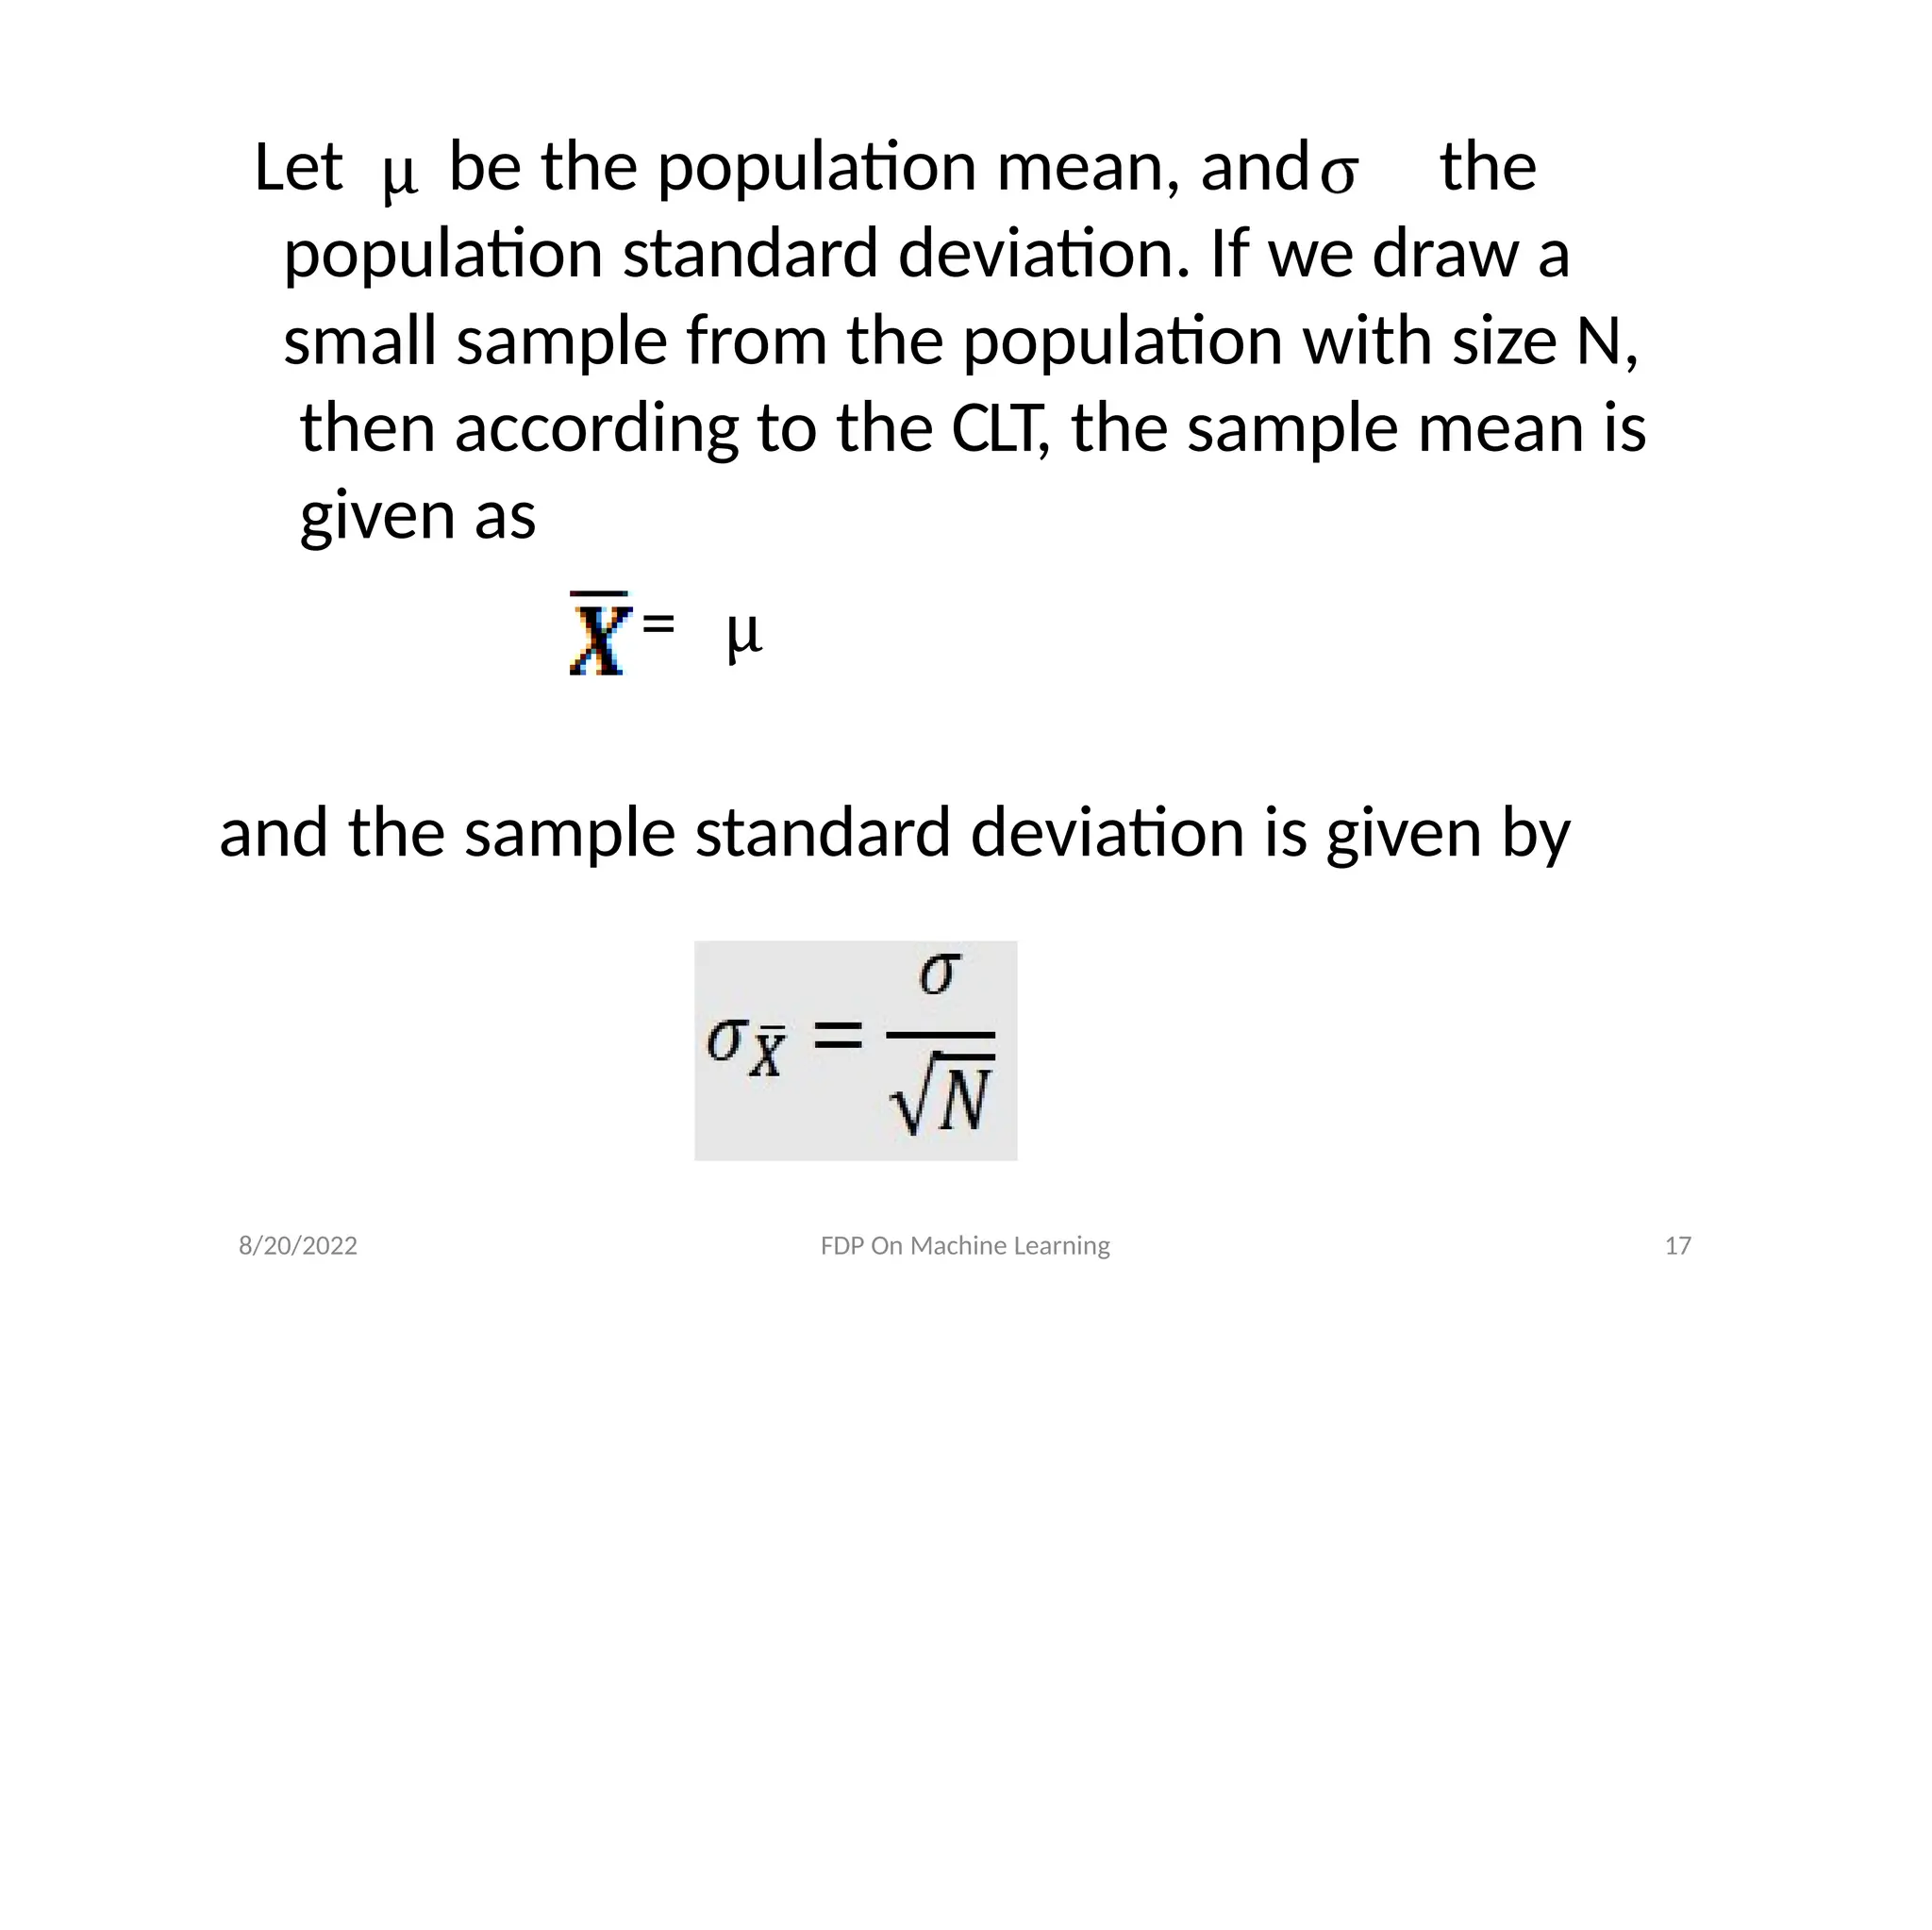
Let be thepopulation mean, and the
population standard deviation. If we draw a
small sample from the population with size N,
then according to the CLT, the sample mean is
given as
=
and the sample standard deviation is given by
8/20/2022 FDP On Machine Learning 17
19.
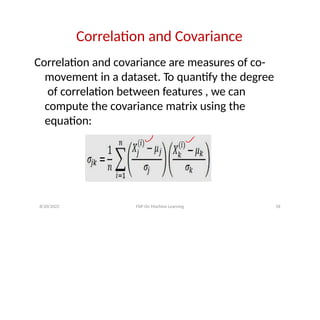
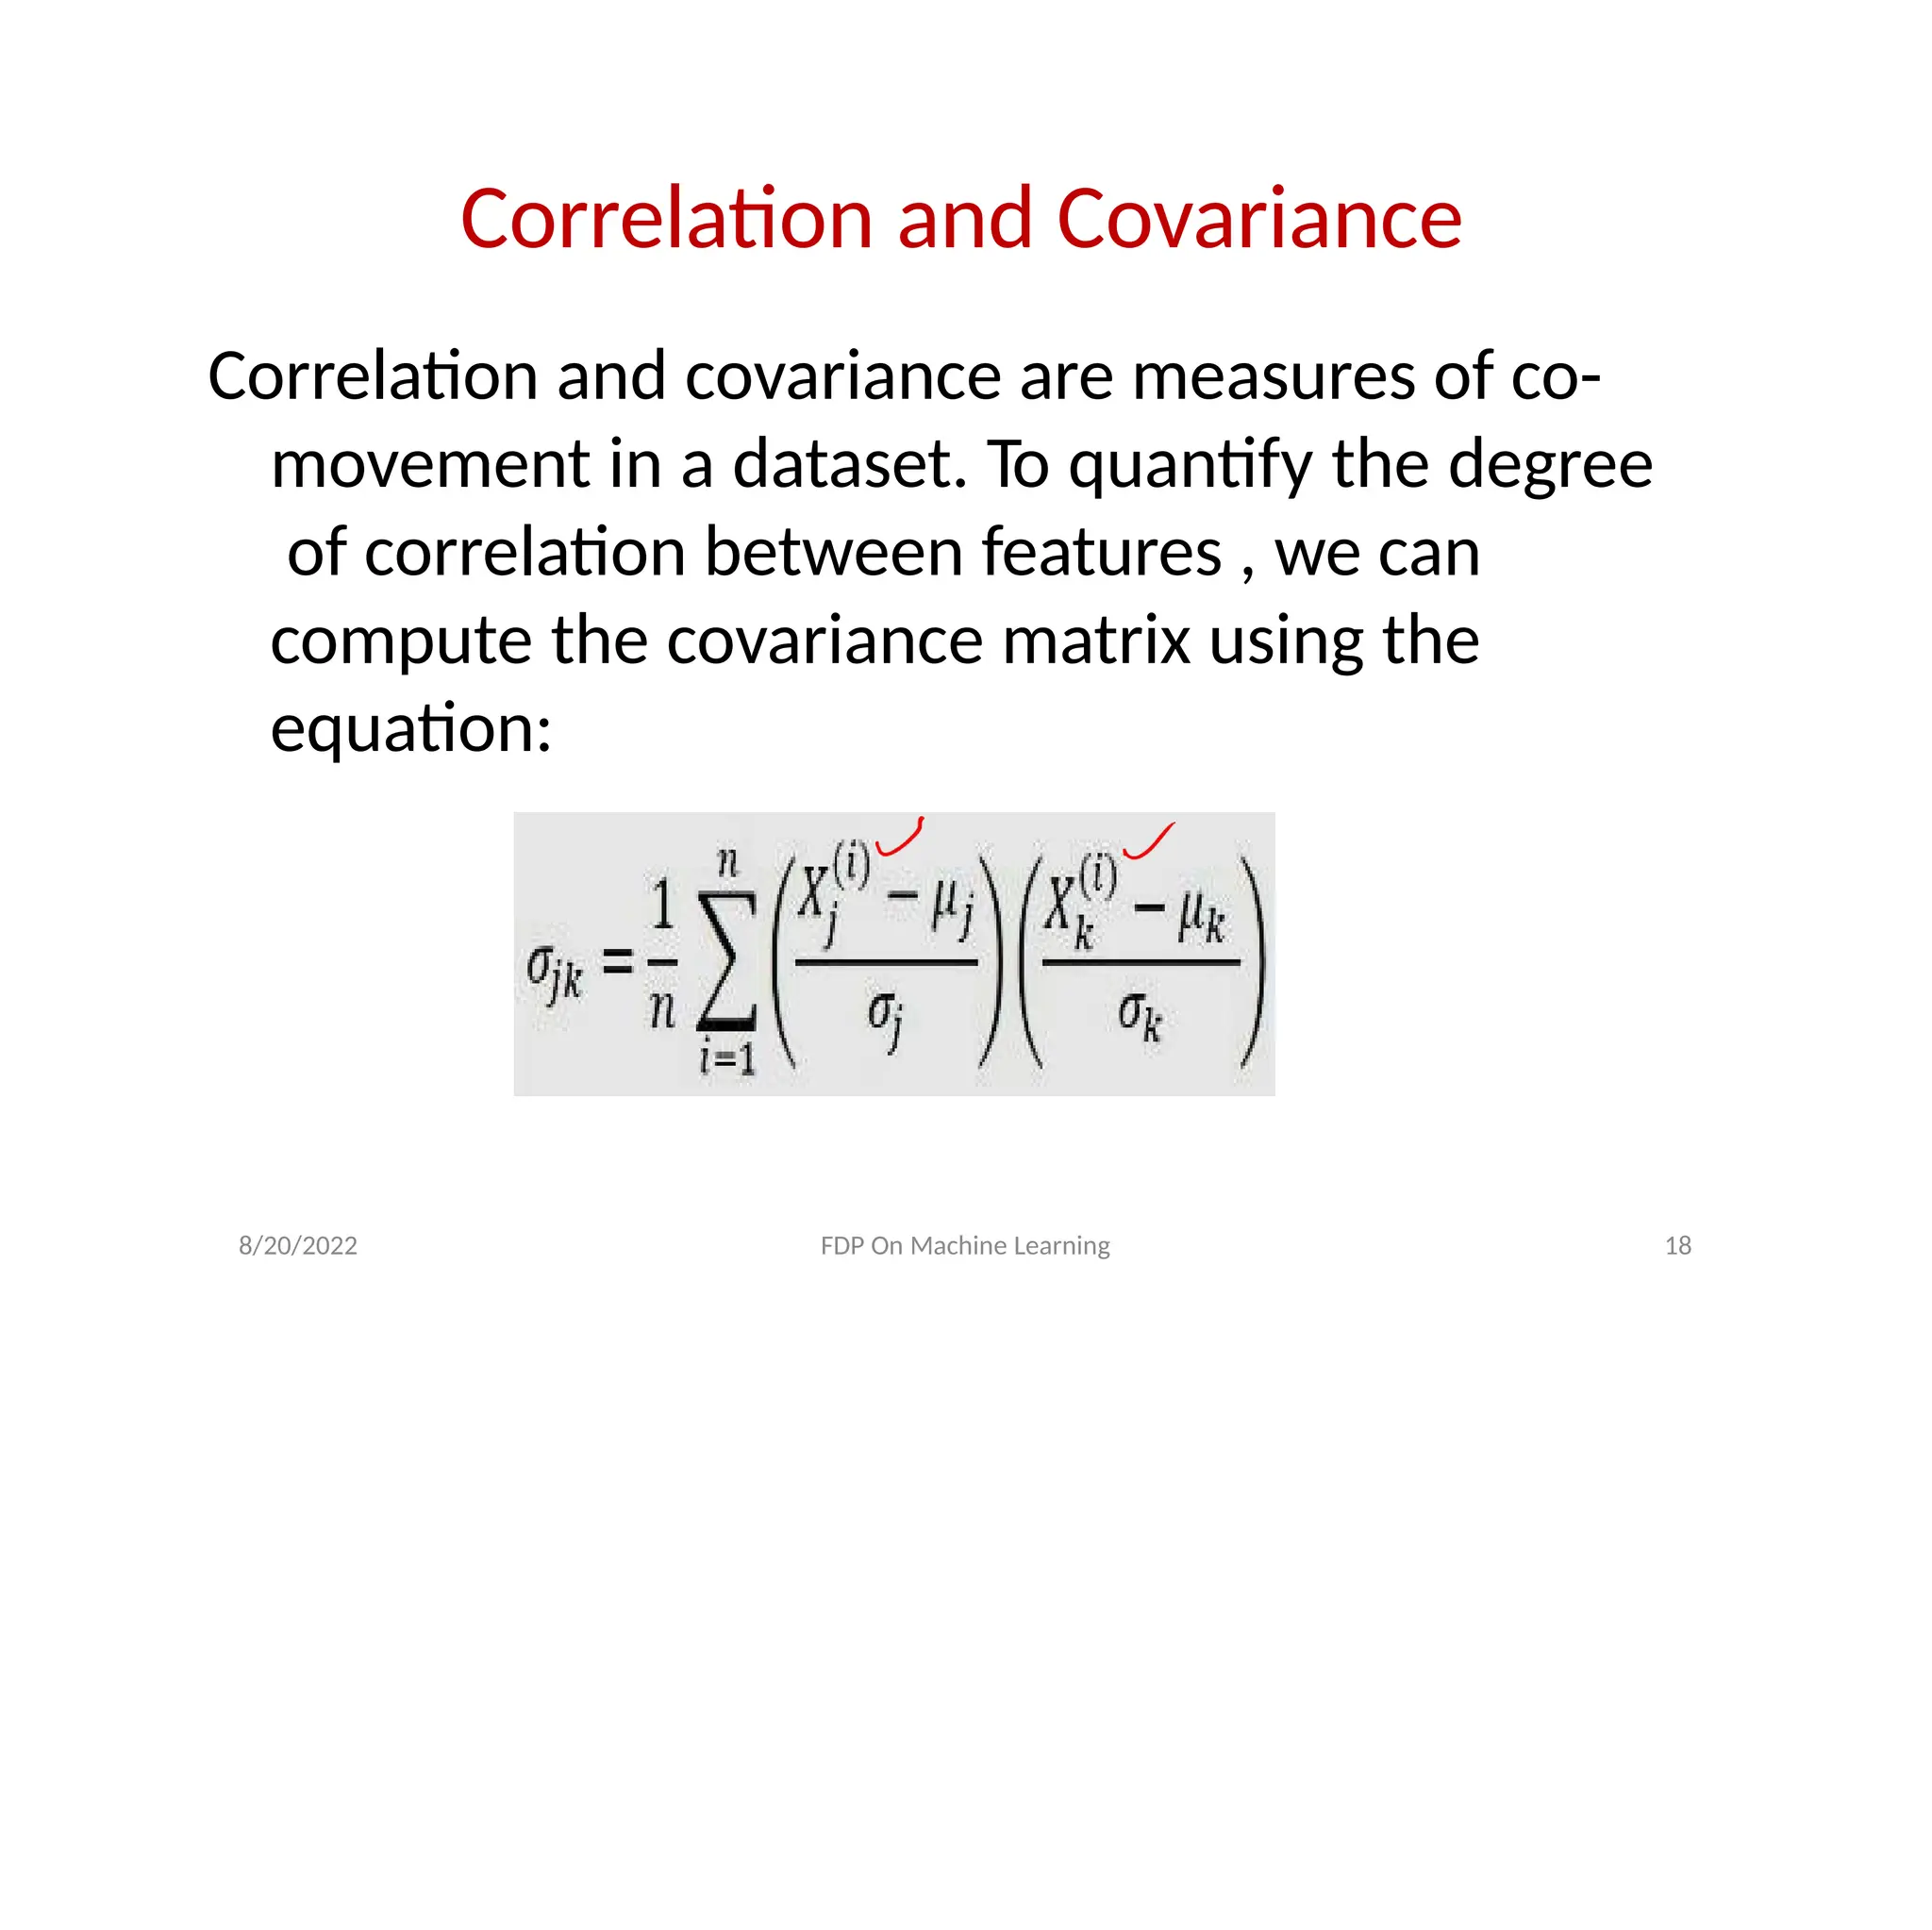
Correlation and Covariance
Correlationand covariance are measures of co-
movement in a dataset. To quantify the degree
of correlation between features , we can
compute the covariance matrix using the
equation:
8/20/2022 FDP On Machine Learning 18
20.
8/20/2022 FDP OnMachine Learning 19
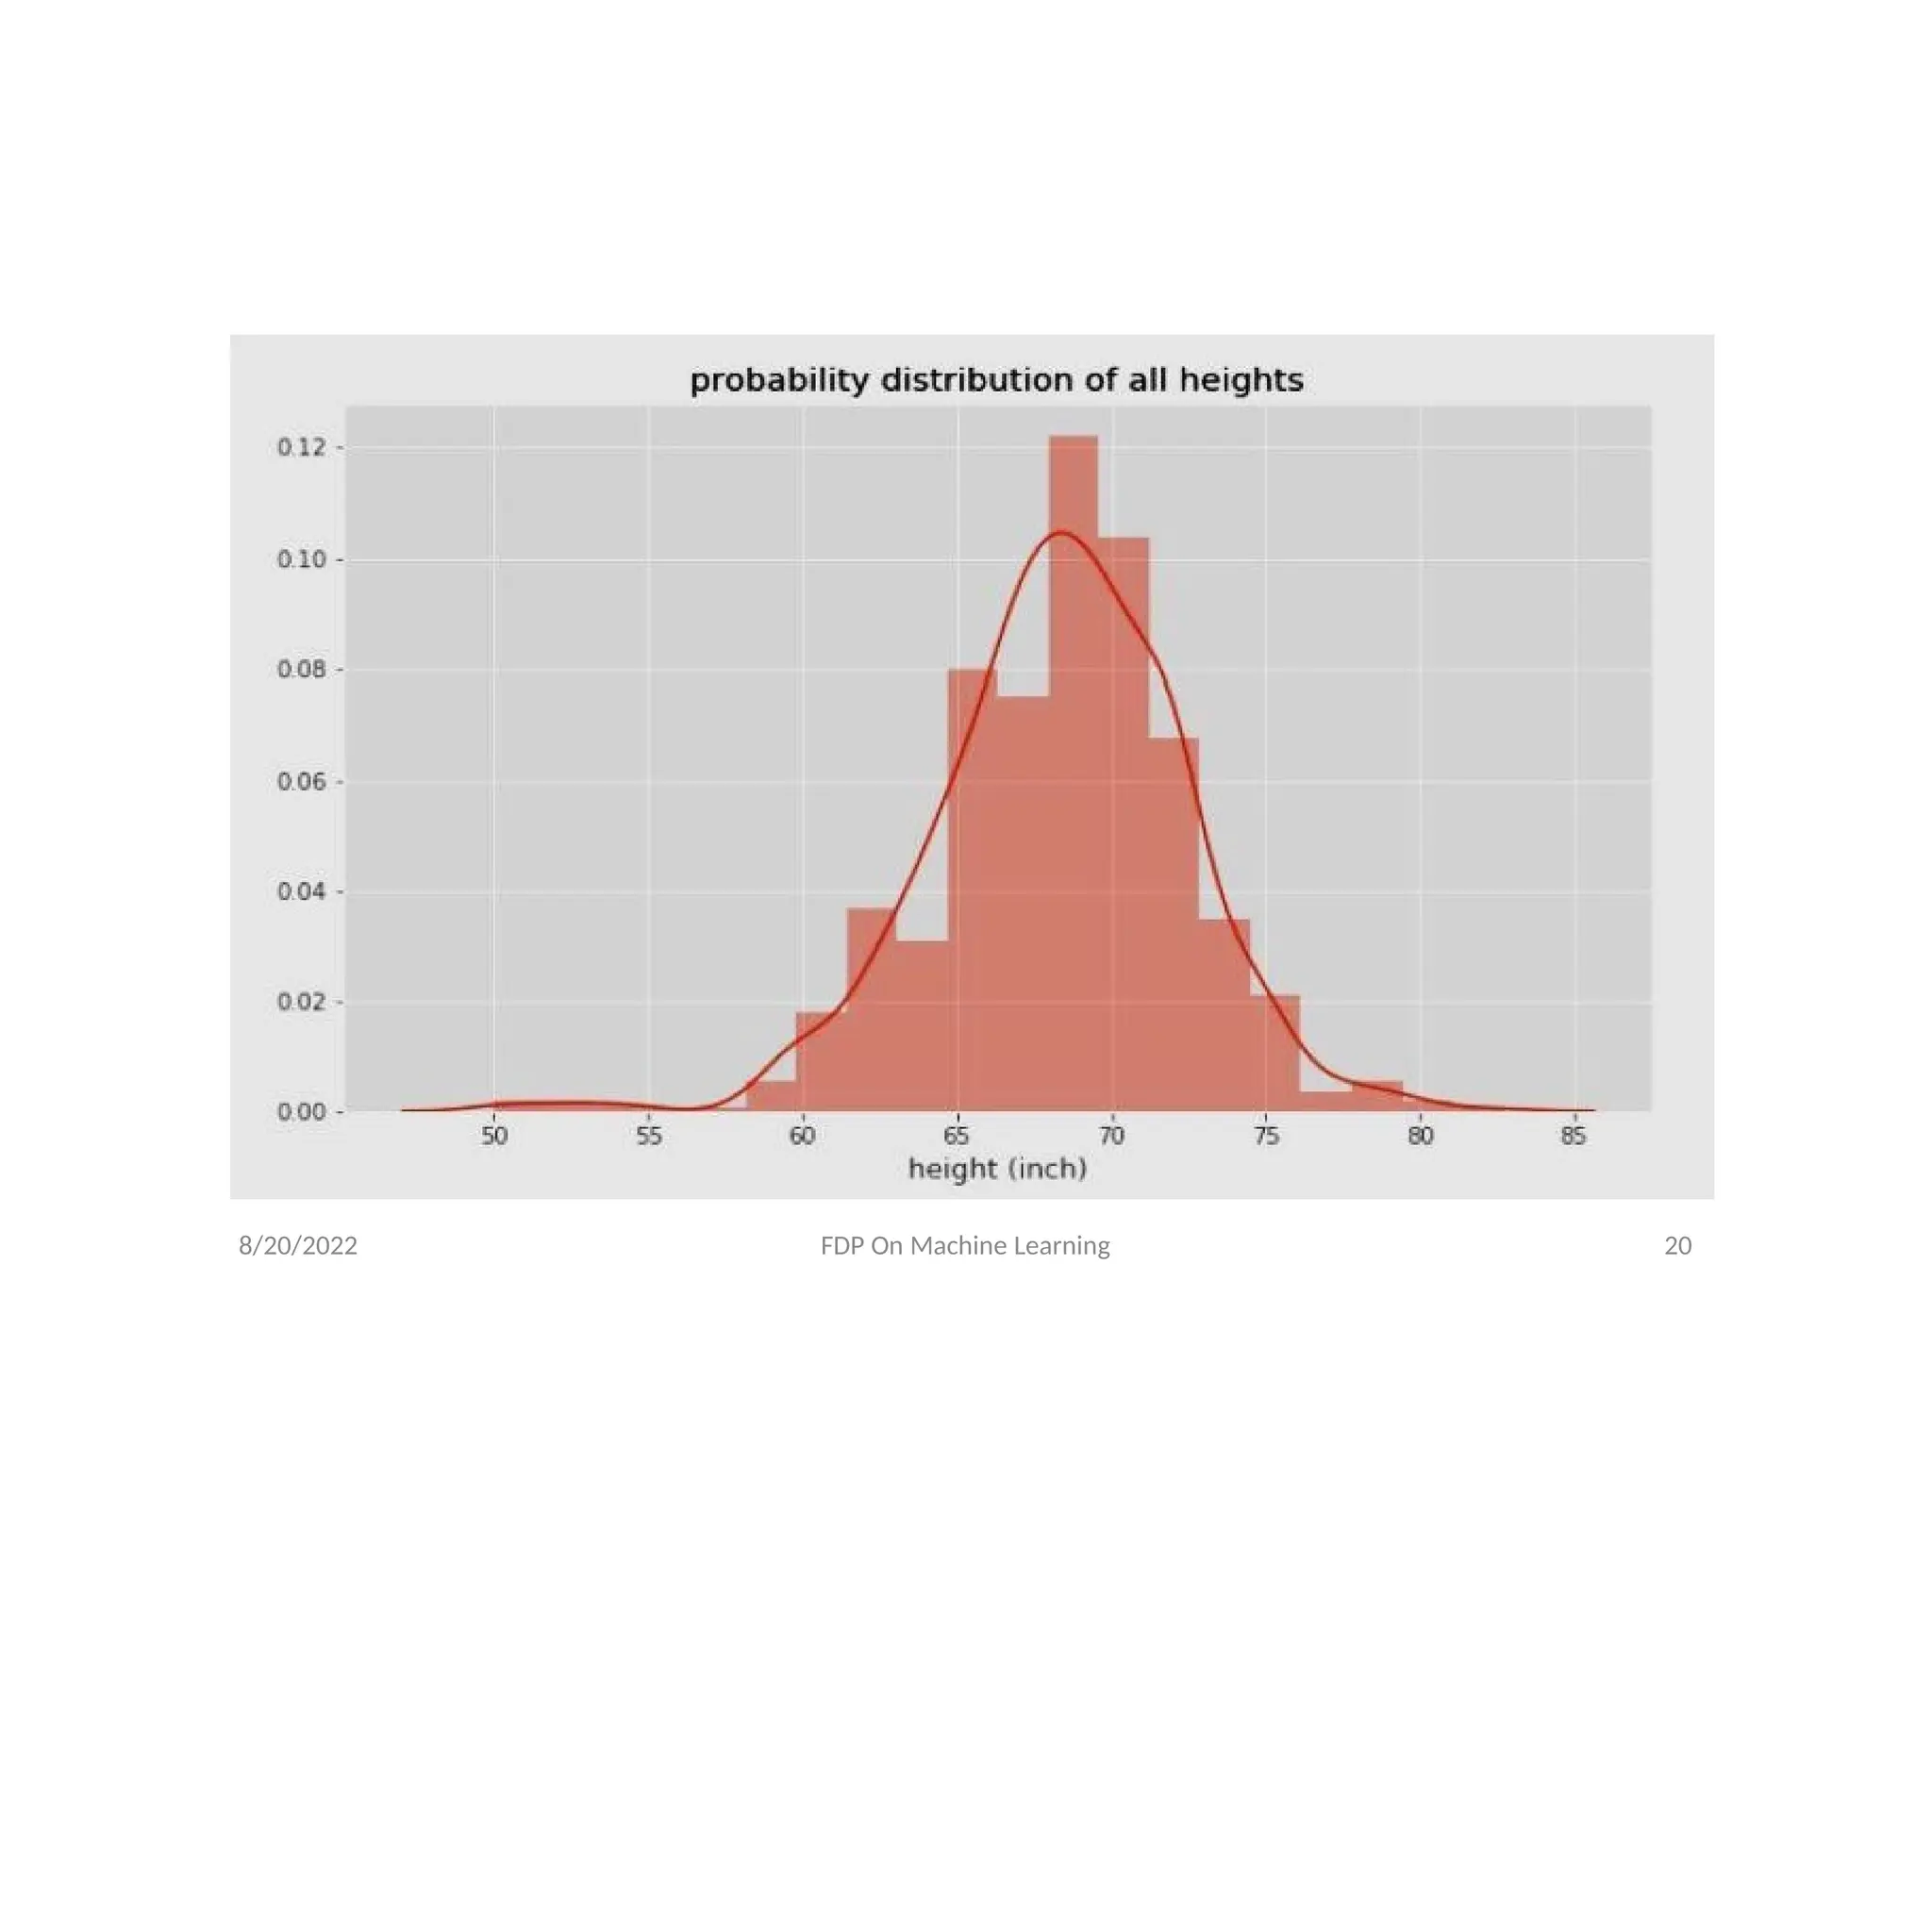
Probability Distribution
Even though we always assume that variables or
features in a data set are normally distributed , it
is important to plot the probability distribution
to visualize how a feature is distributed. For
example, using the heights in a data set , we can
compute the probability distribution of all
heights in the dataset , as shown in Figure on the
next page.
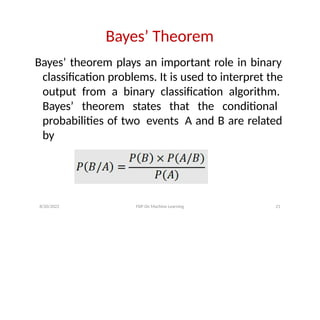
Bayes’ Theorem
Bayes’ theoremplays an important role in binary
classification problems. It is used to interpret the
output from a binary classification algorithm.
Bayes’ theorem states that the conditional
probabilities of two events A and B are related
by
8/20/2022 FDP On Machine Learning 21
23.
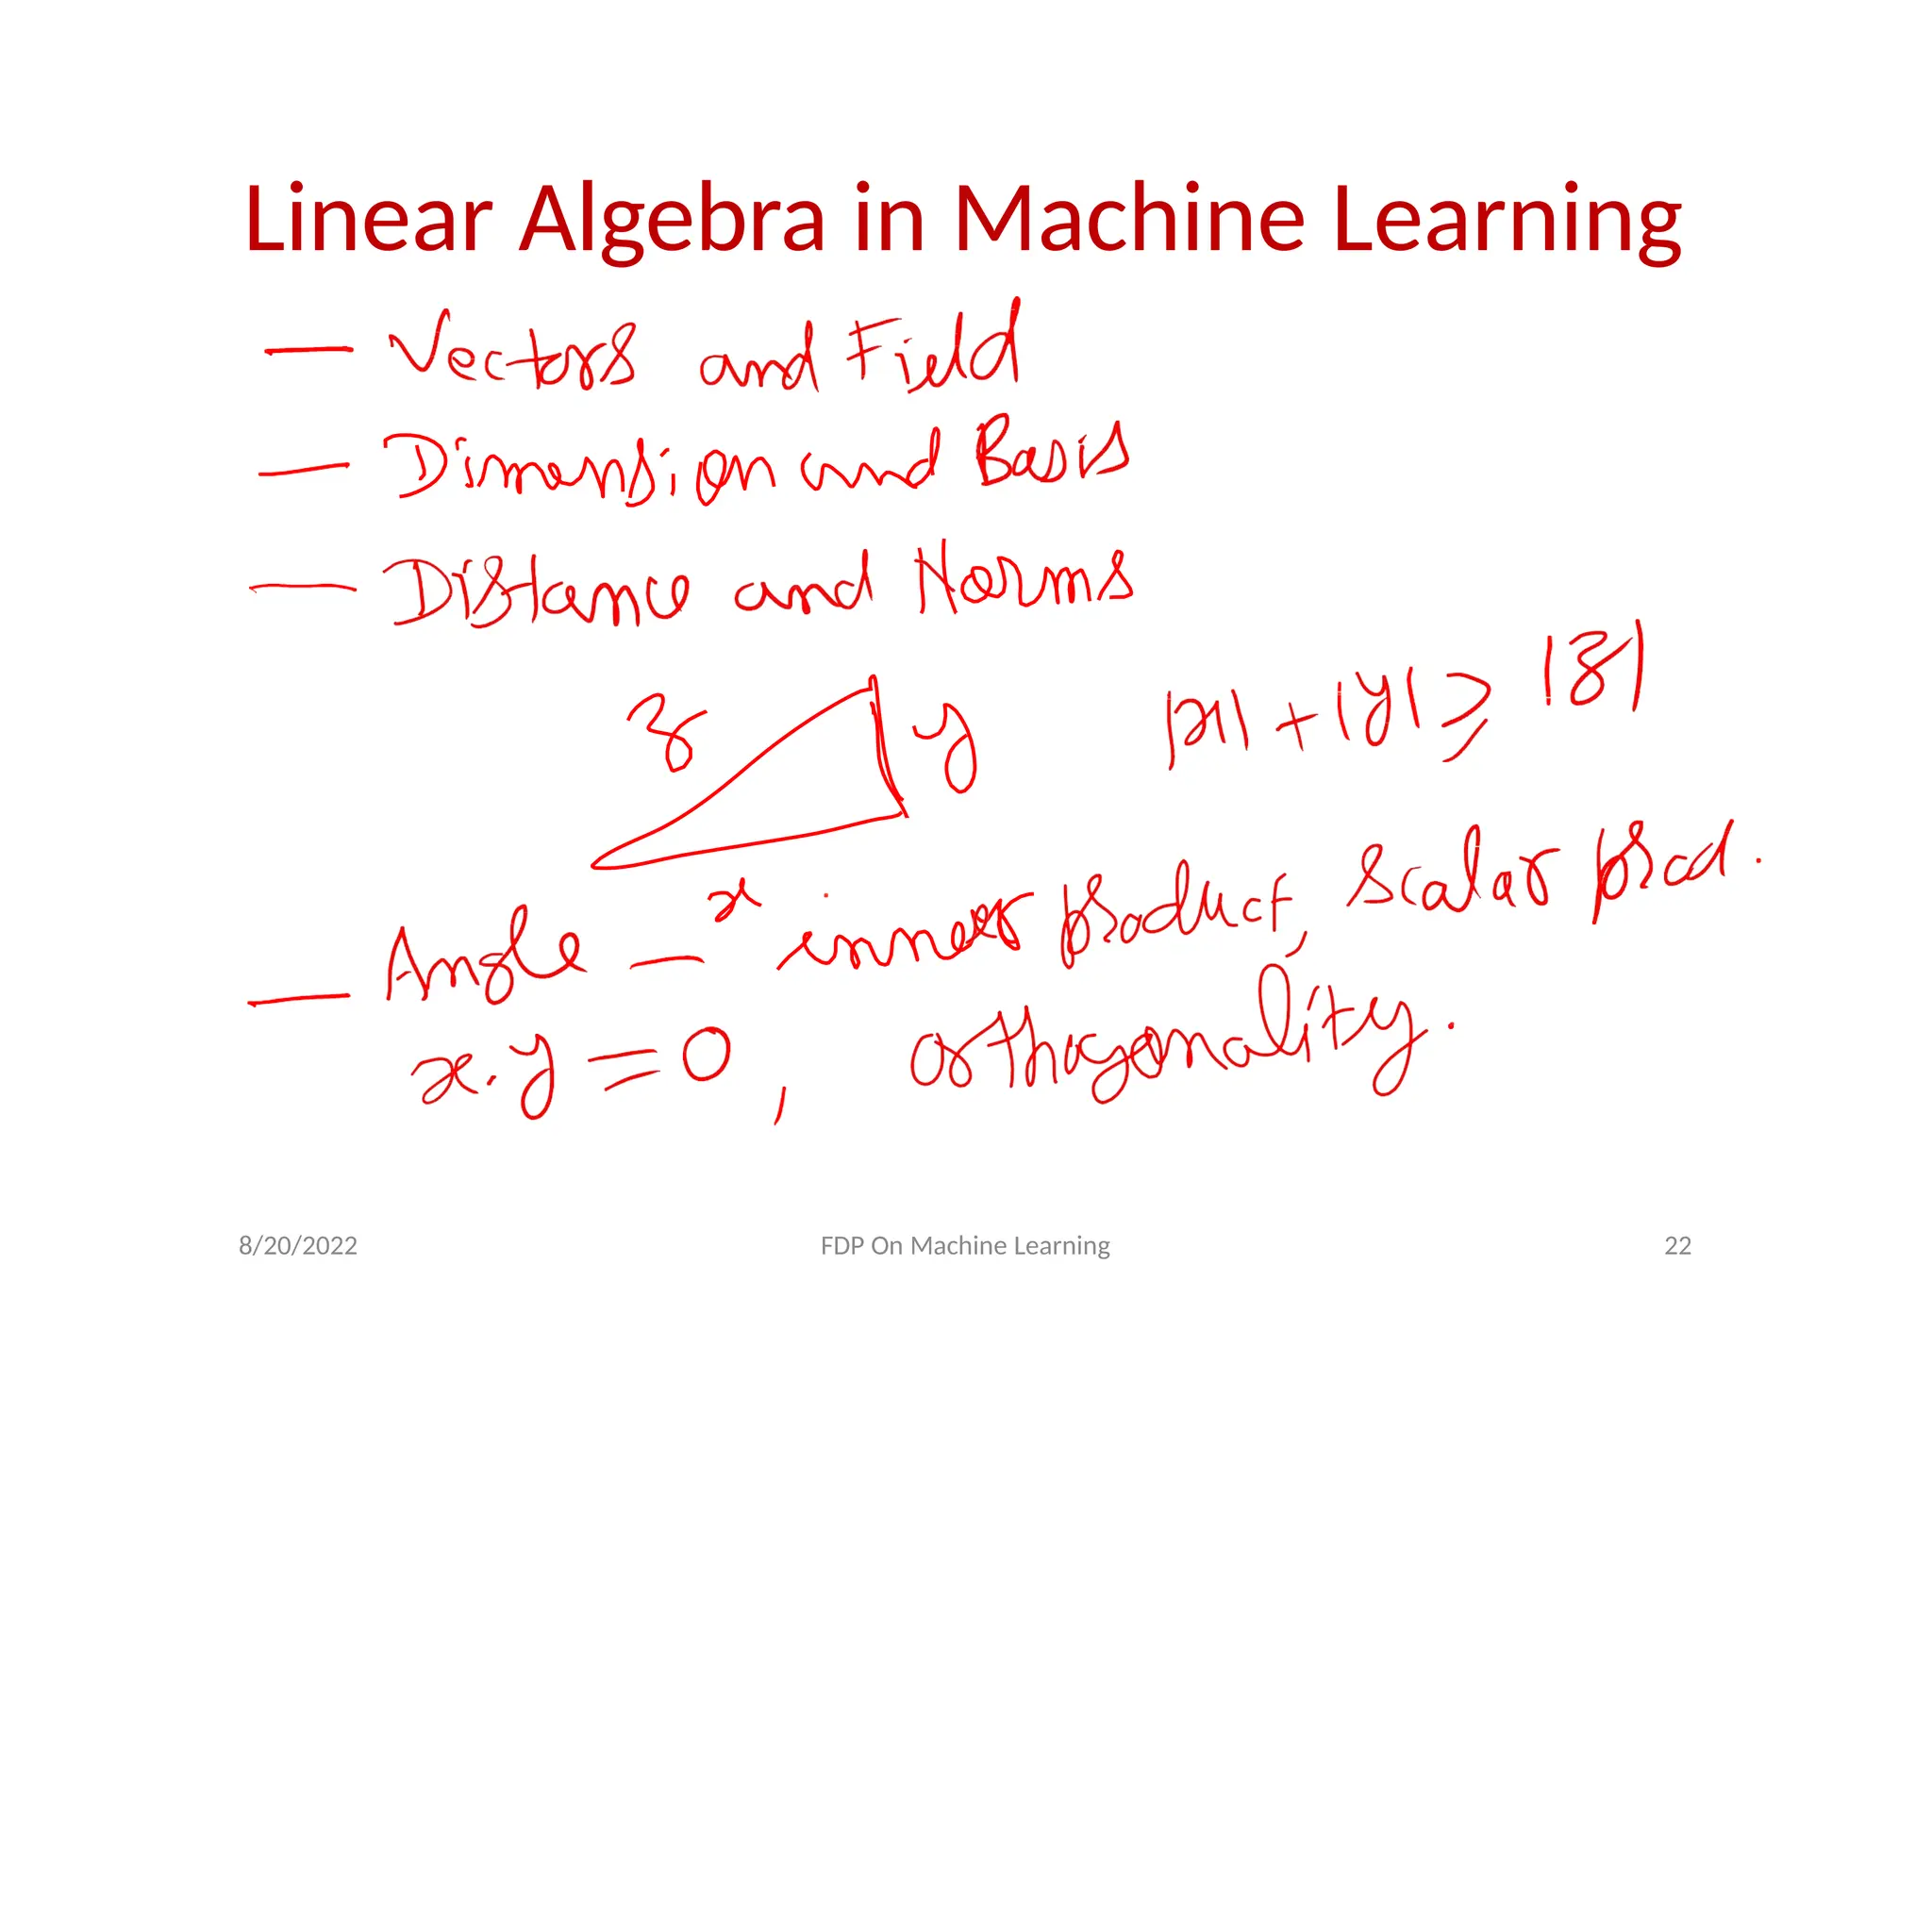
Linear Algebra inMachine Learning
8/20/2022 FDP On Machine Learning 22
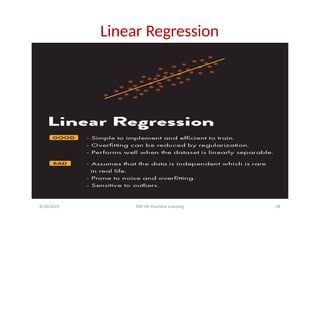
Machine Learning Models
•In machine learning an algorithm learns with
experience and modify itself.
• This is done with the help of giving
obtained output as input.
• Mathematically it is prediction the value of a
depended variable for given values of
independent variables.
• This is accomplished with the help of different
kind of predicting models used for a particular
type of situation.
8/20/2022 FDP On Machine Learning 27
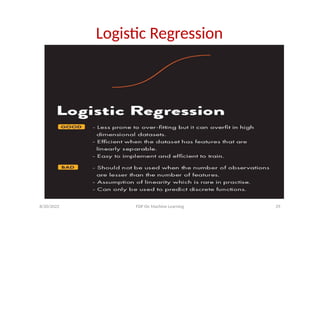
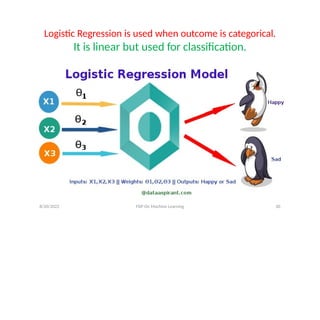
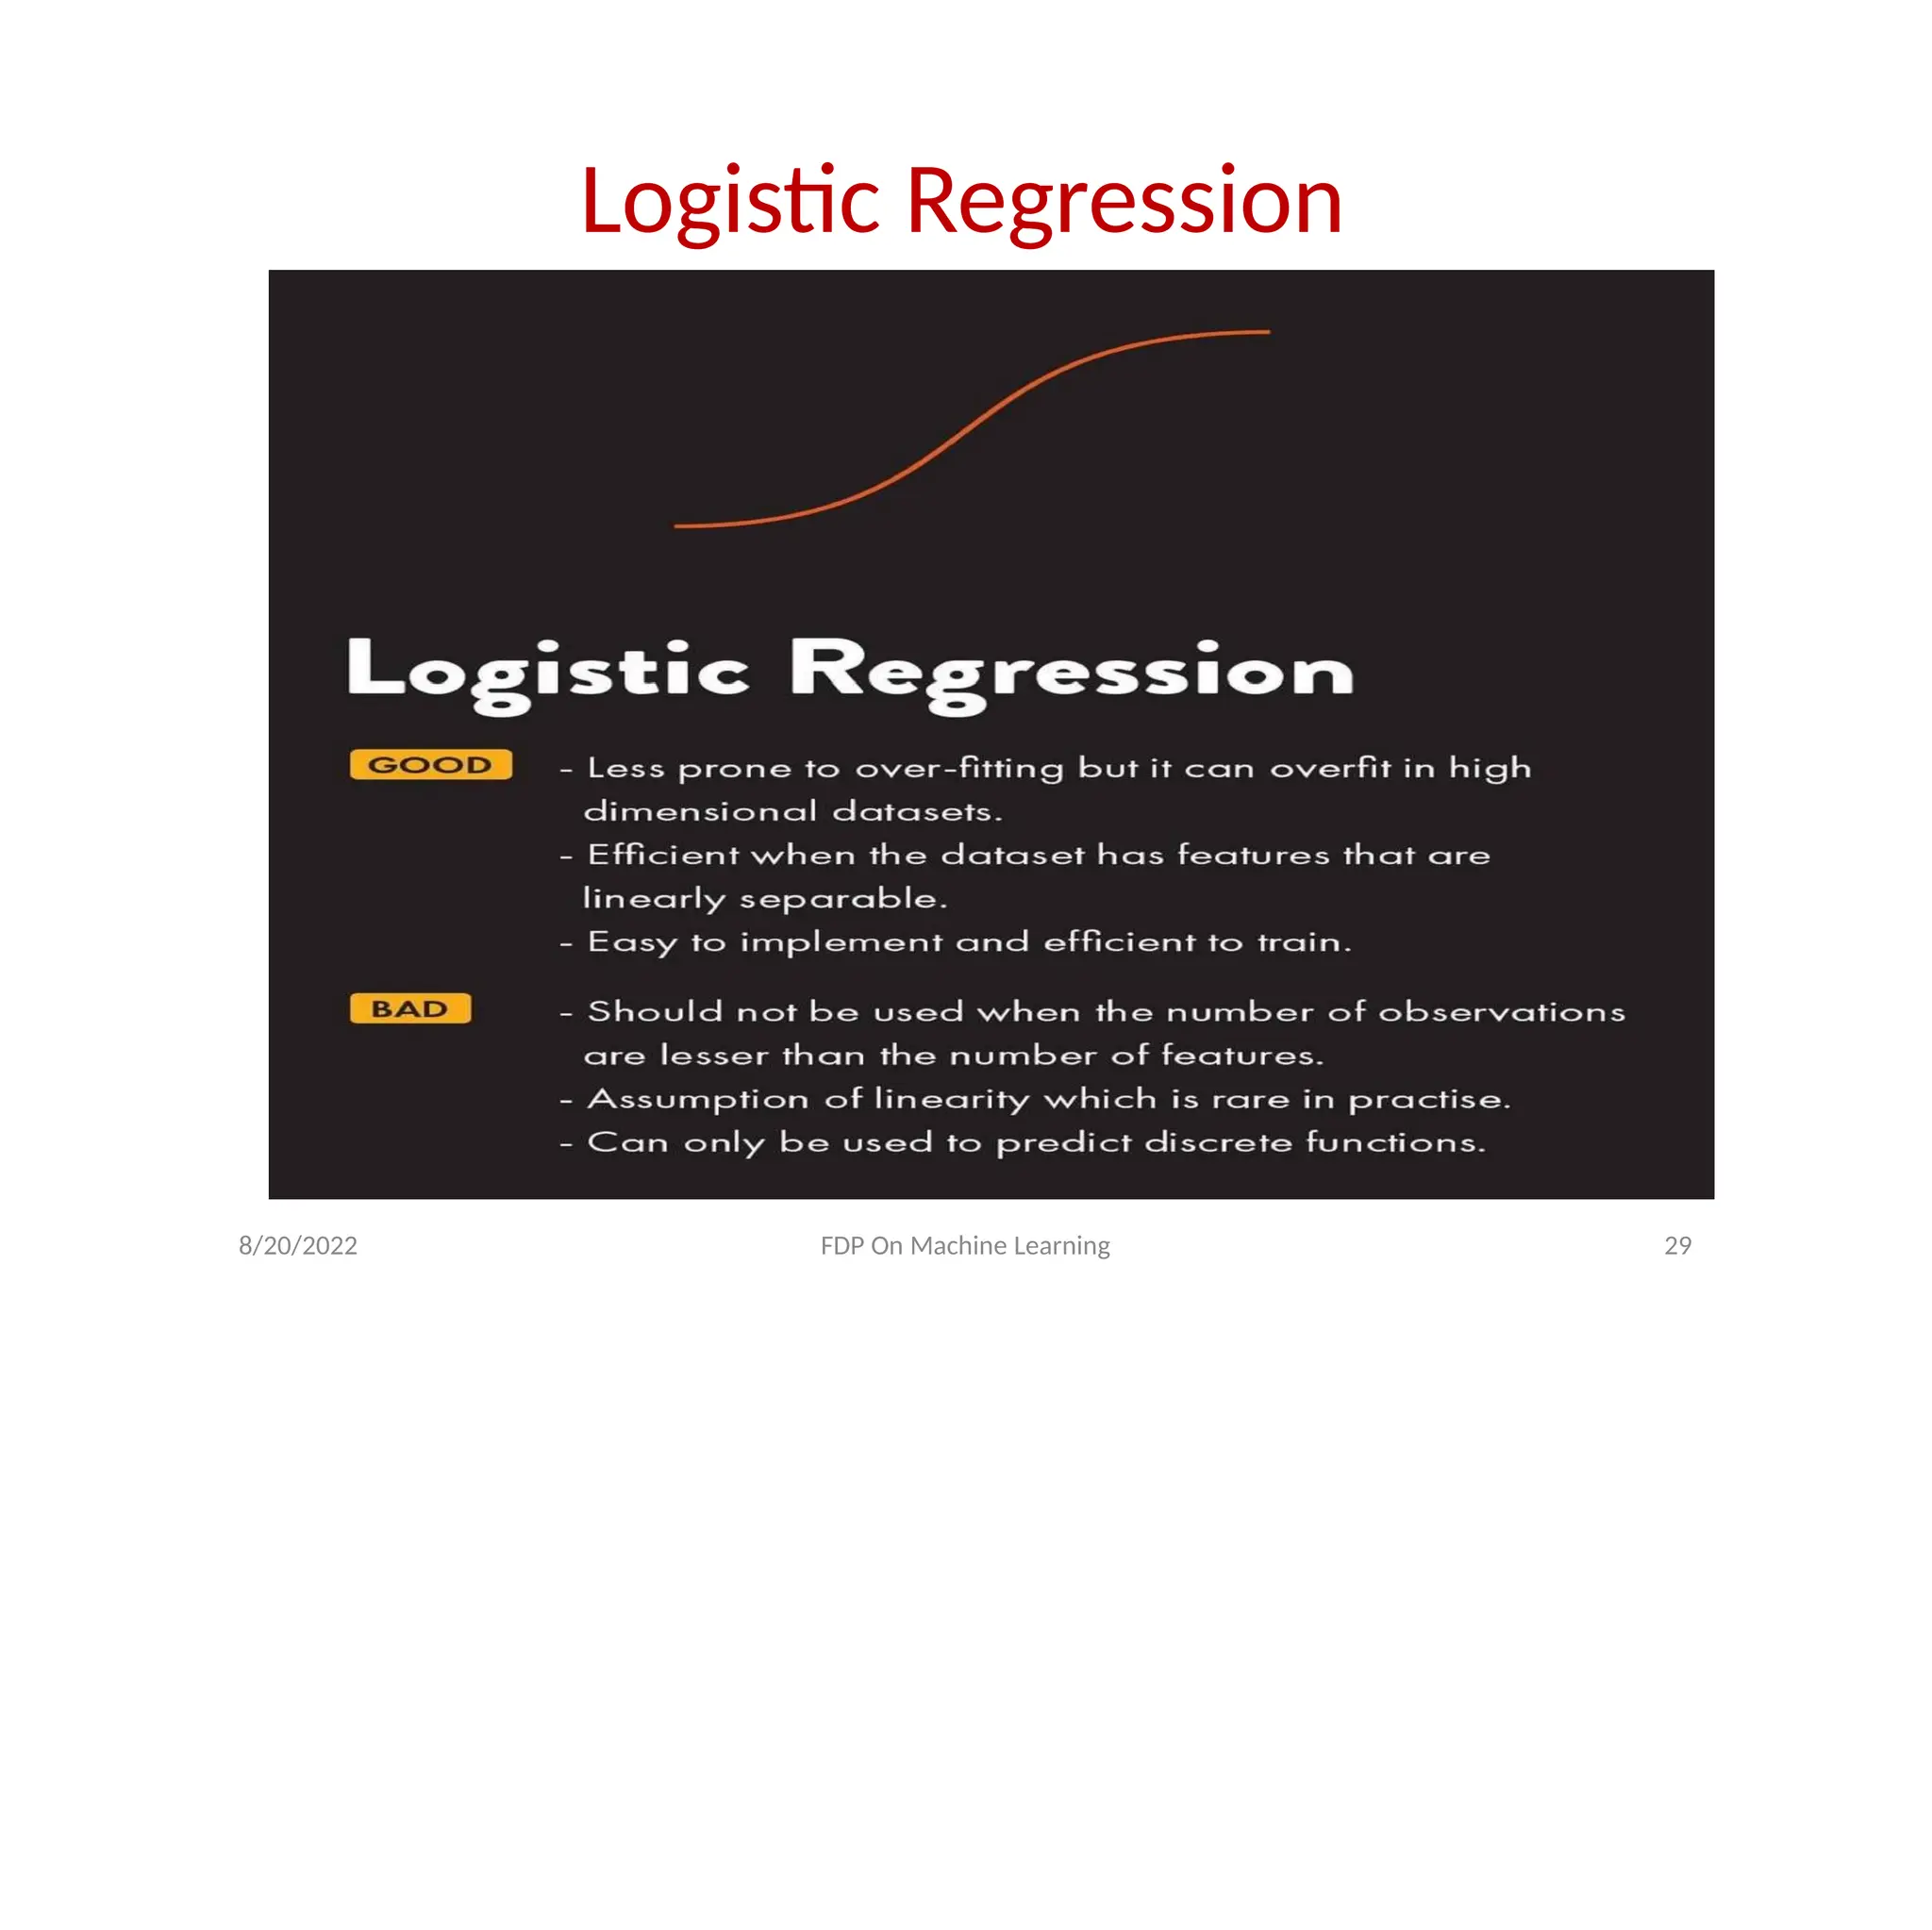
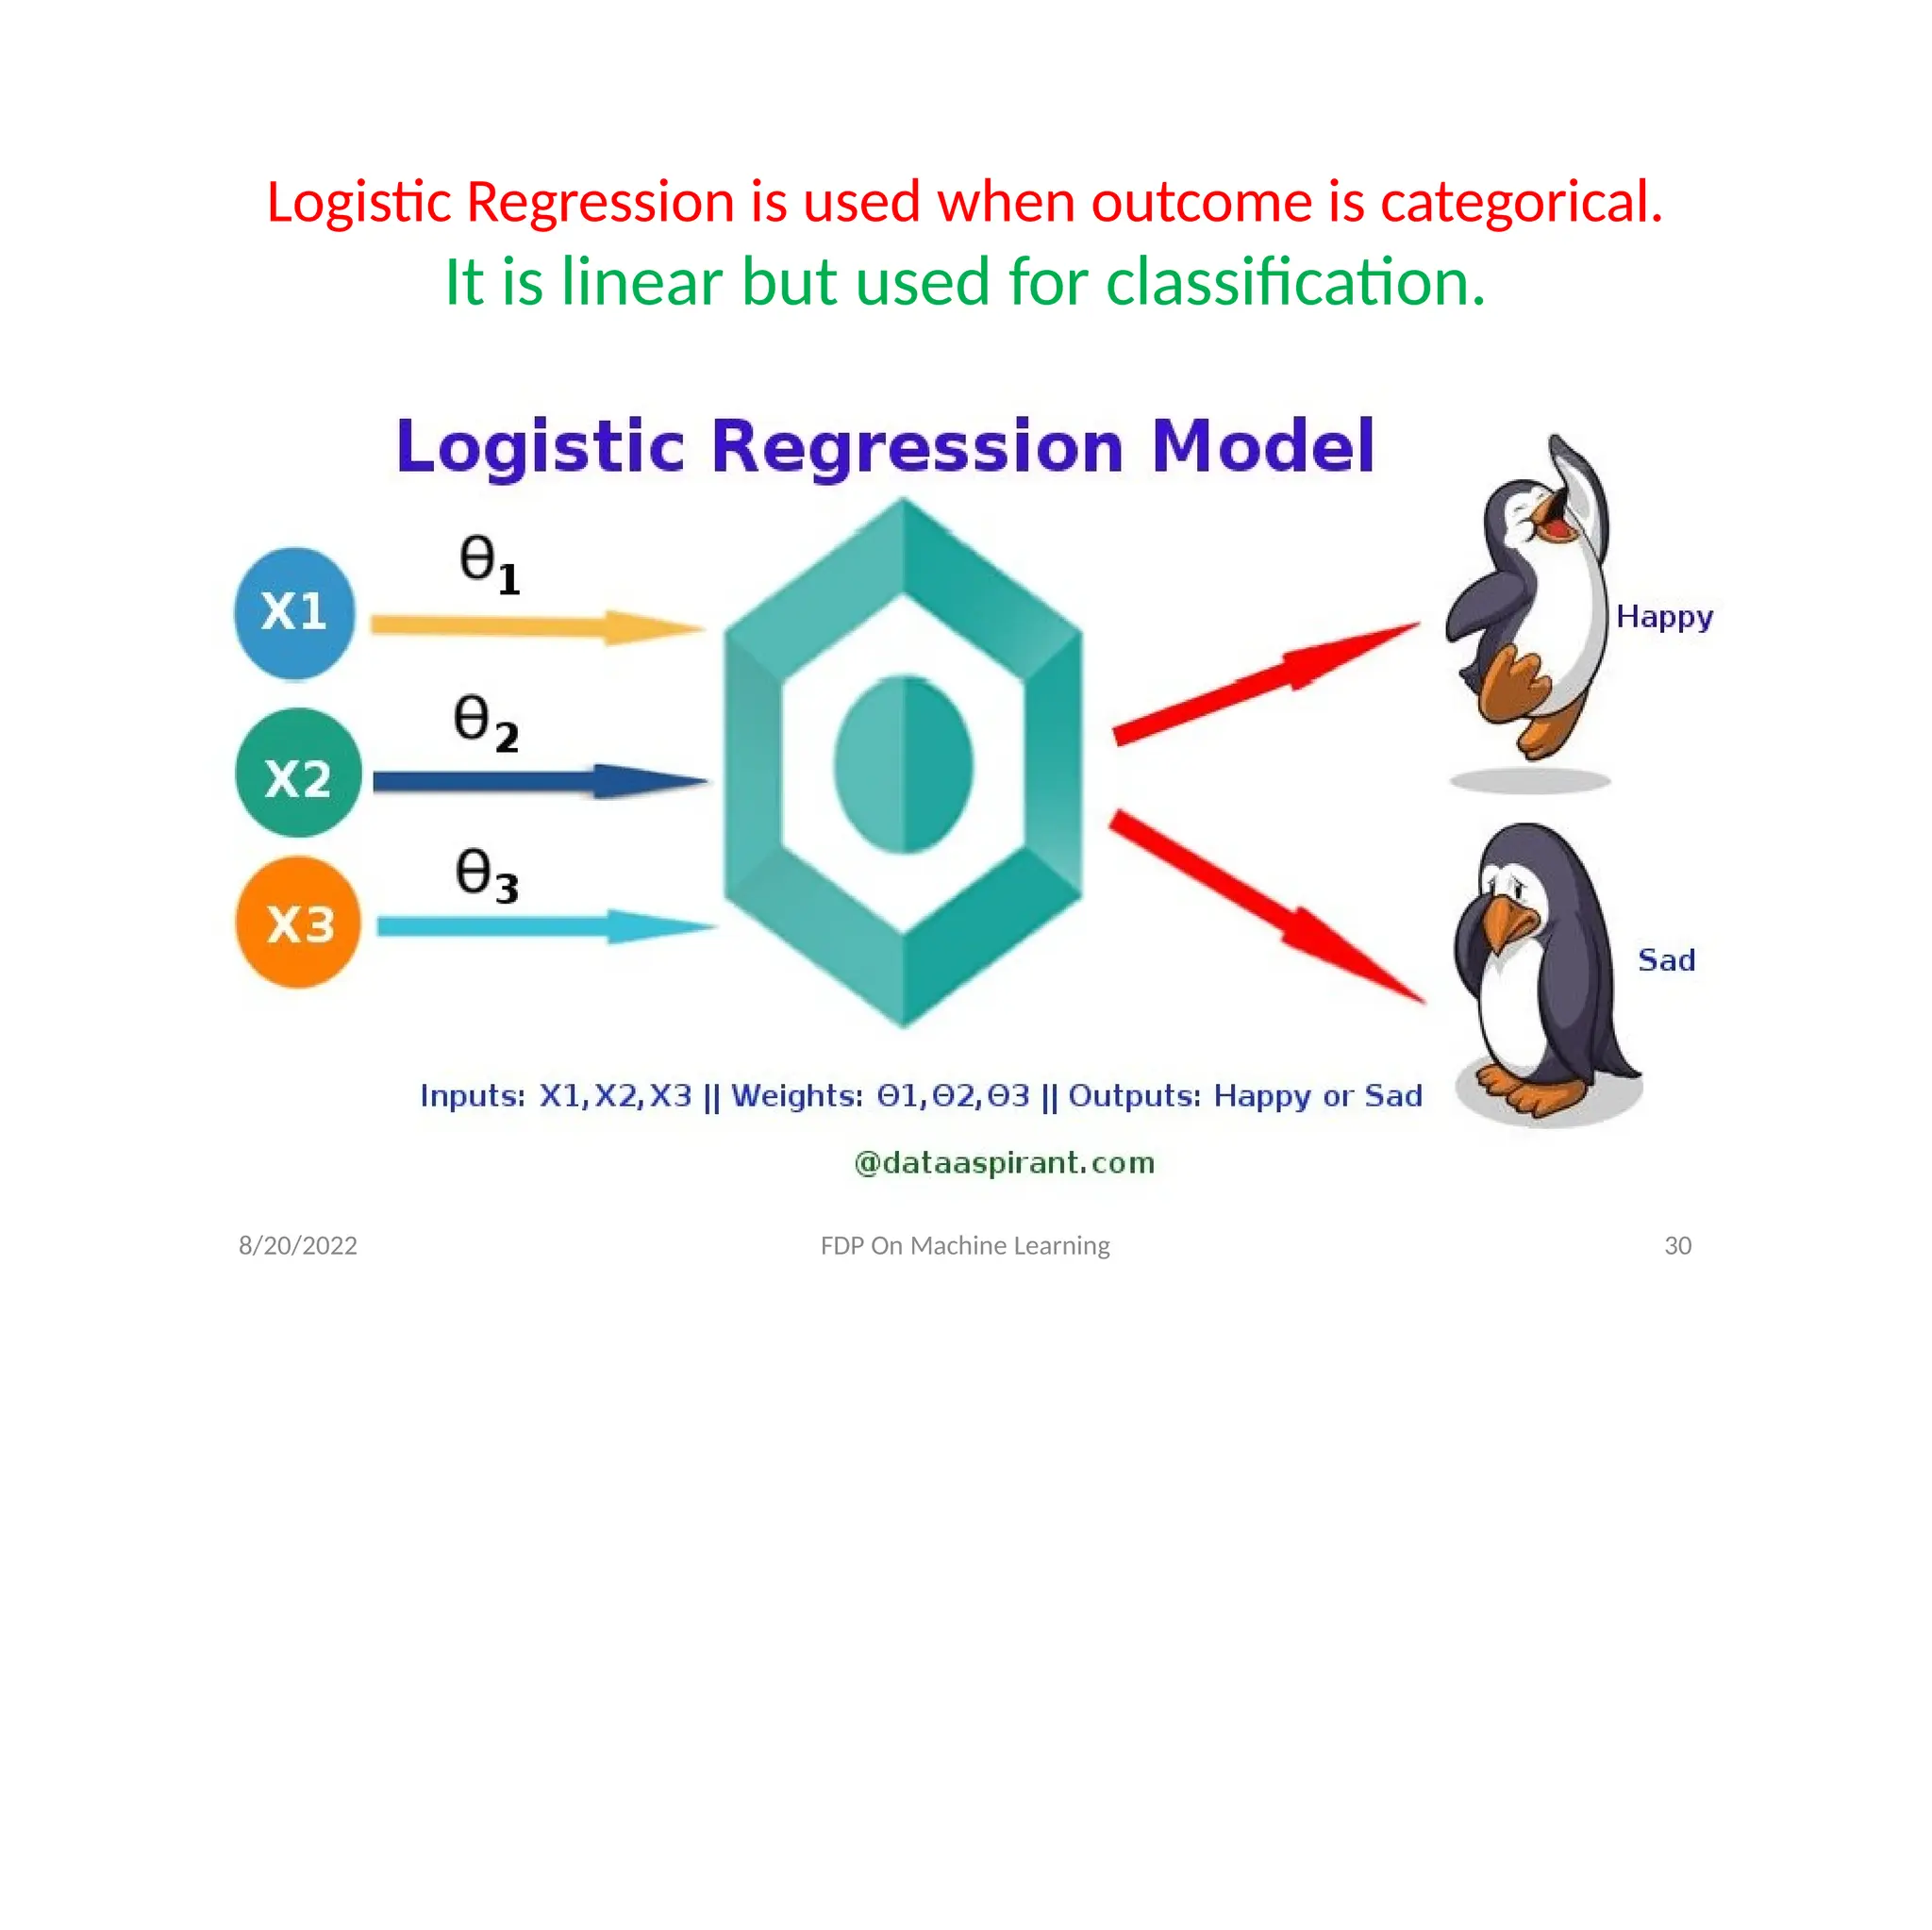
Logistic Regression isused when outcome is categorical.
It is linear but used for classification.
8/20/2022 FDP On Machine Learning 30
32.
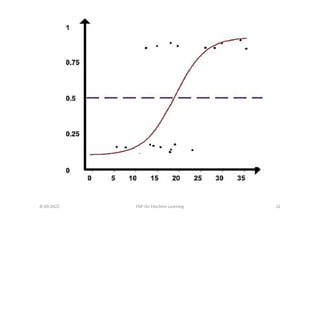
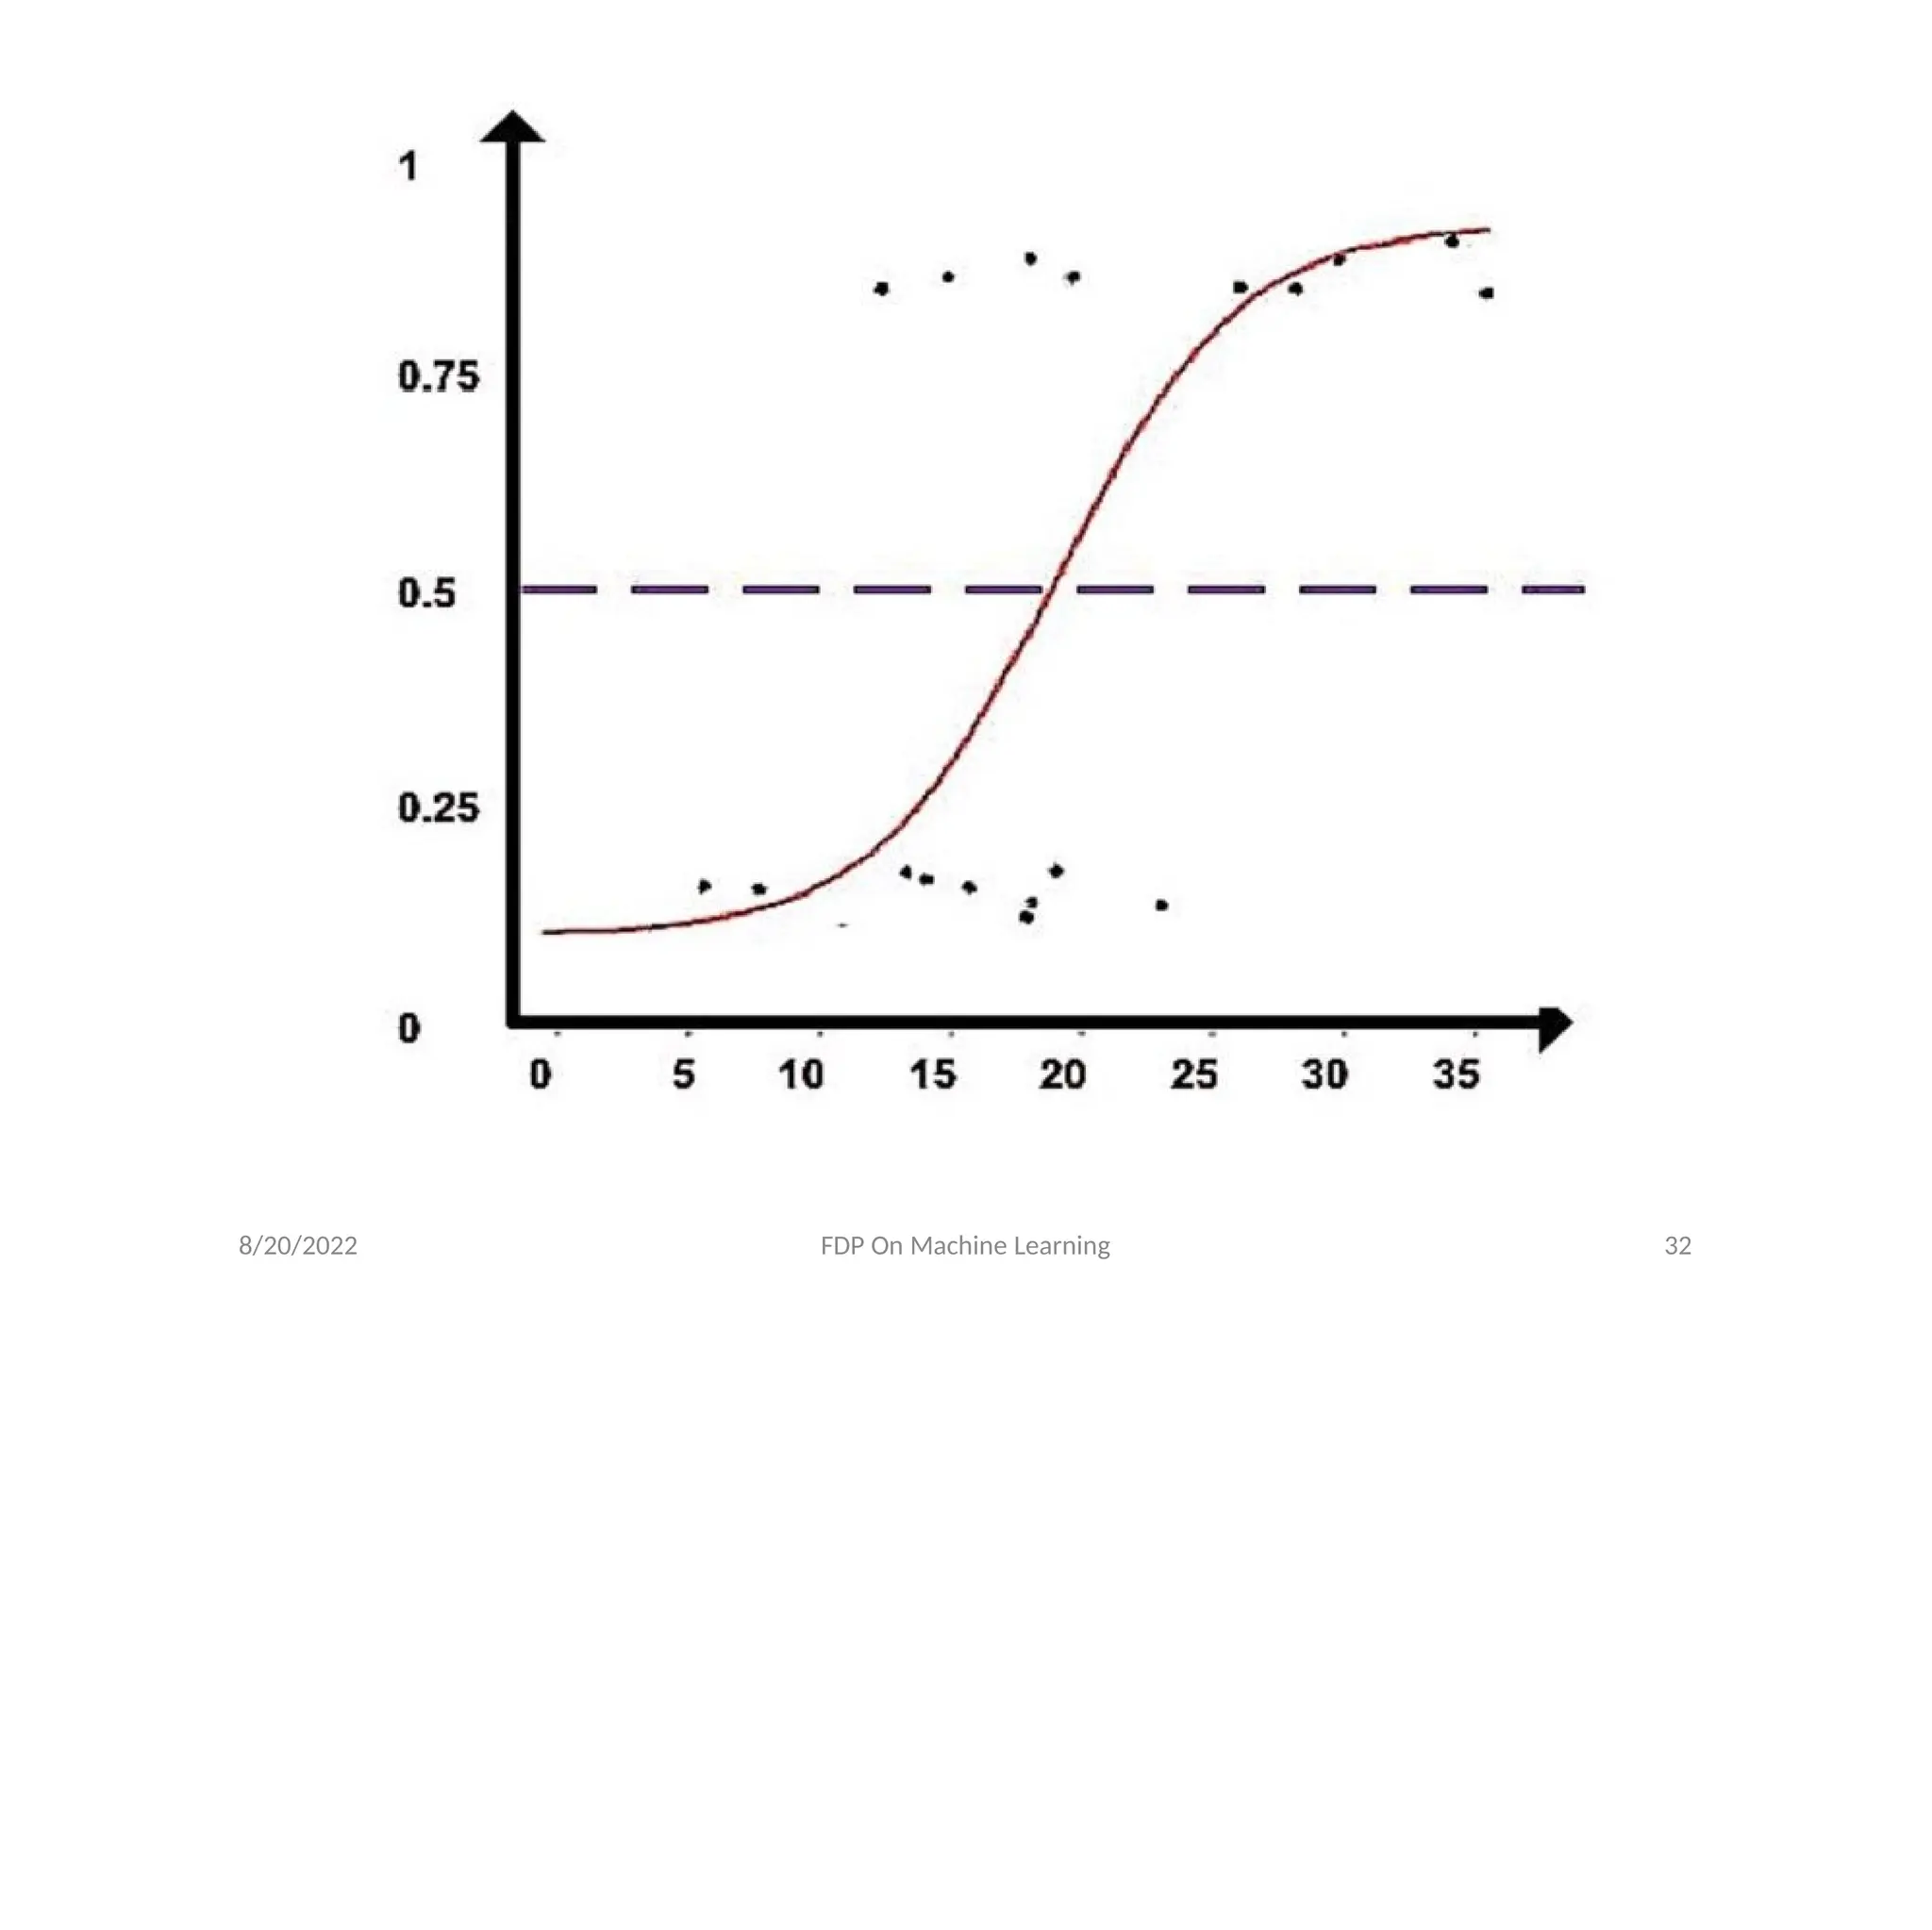
• Logistic Function(SigmoidFunction)-
f(x) =
It maps real values between 0 and 1, indicating
probabilities.
We assume a linear regression of type
log [ ] = b
0 + b1x1+……+bnxn
Here y =
8/20/2022 FDP On Machine Learning 31
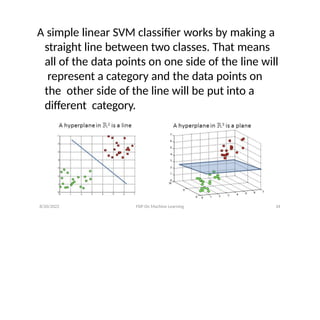
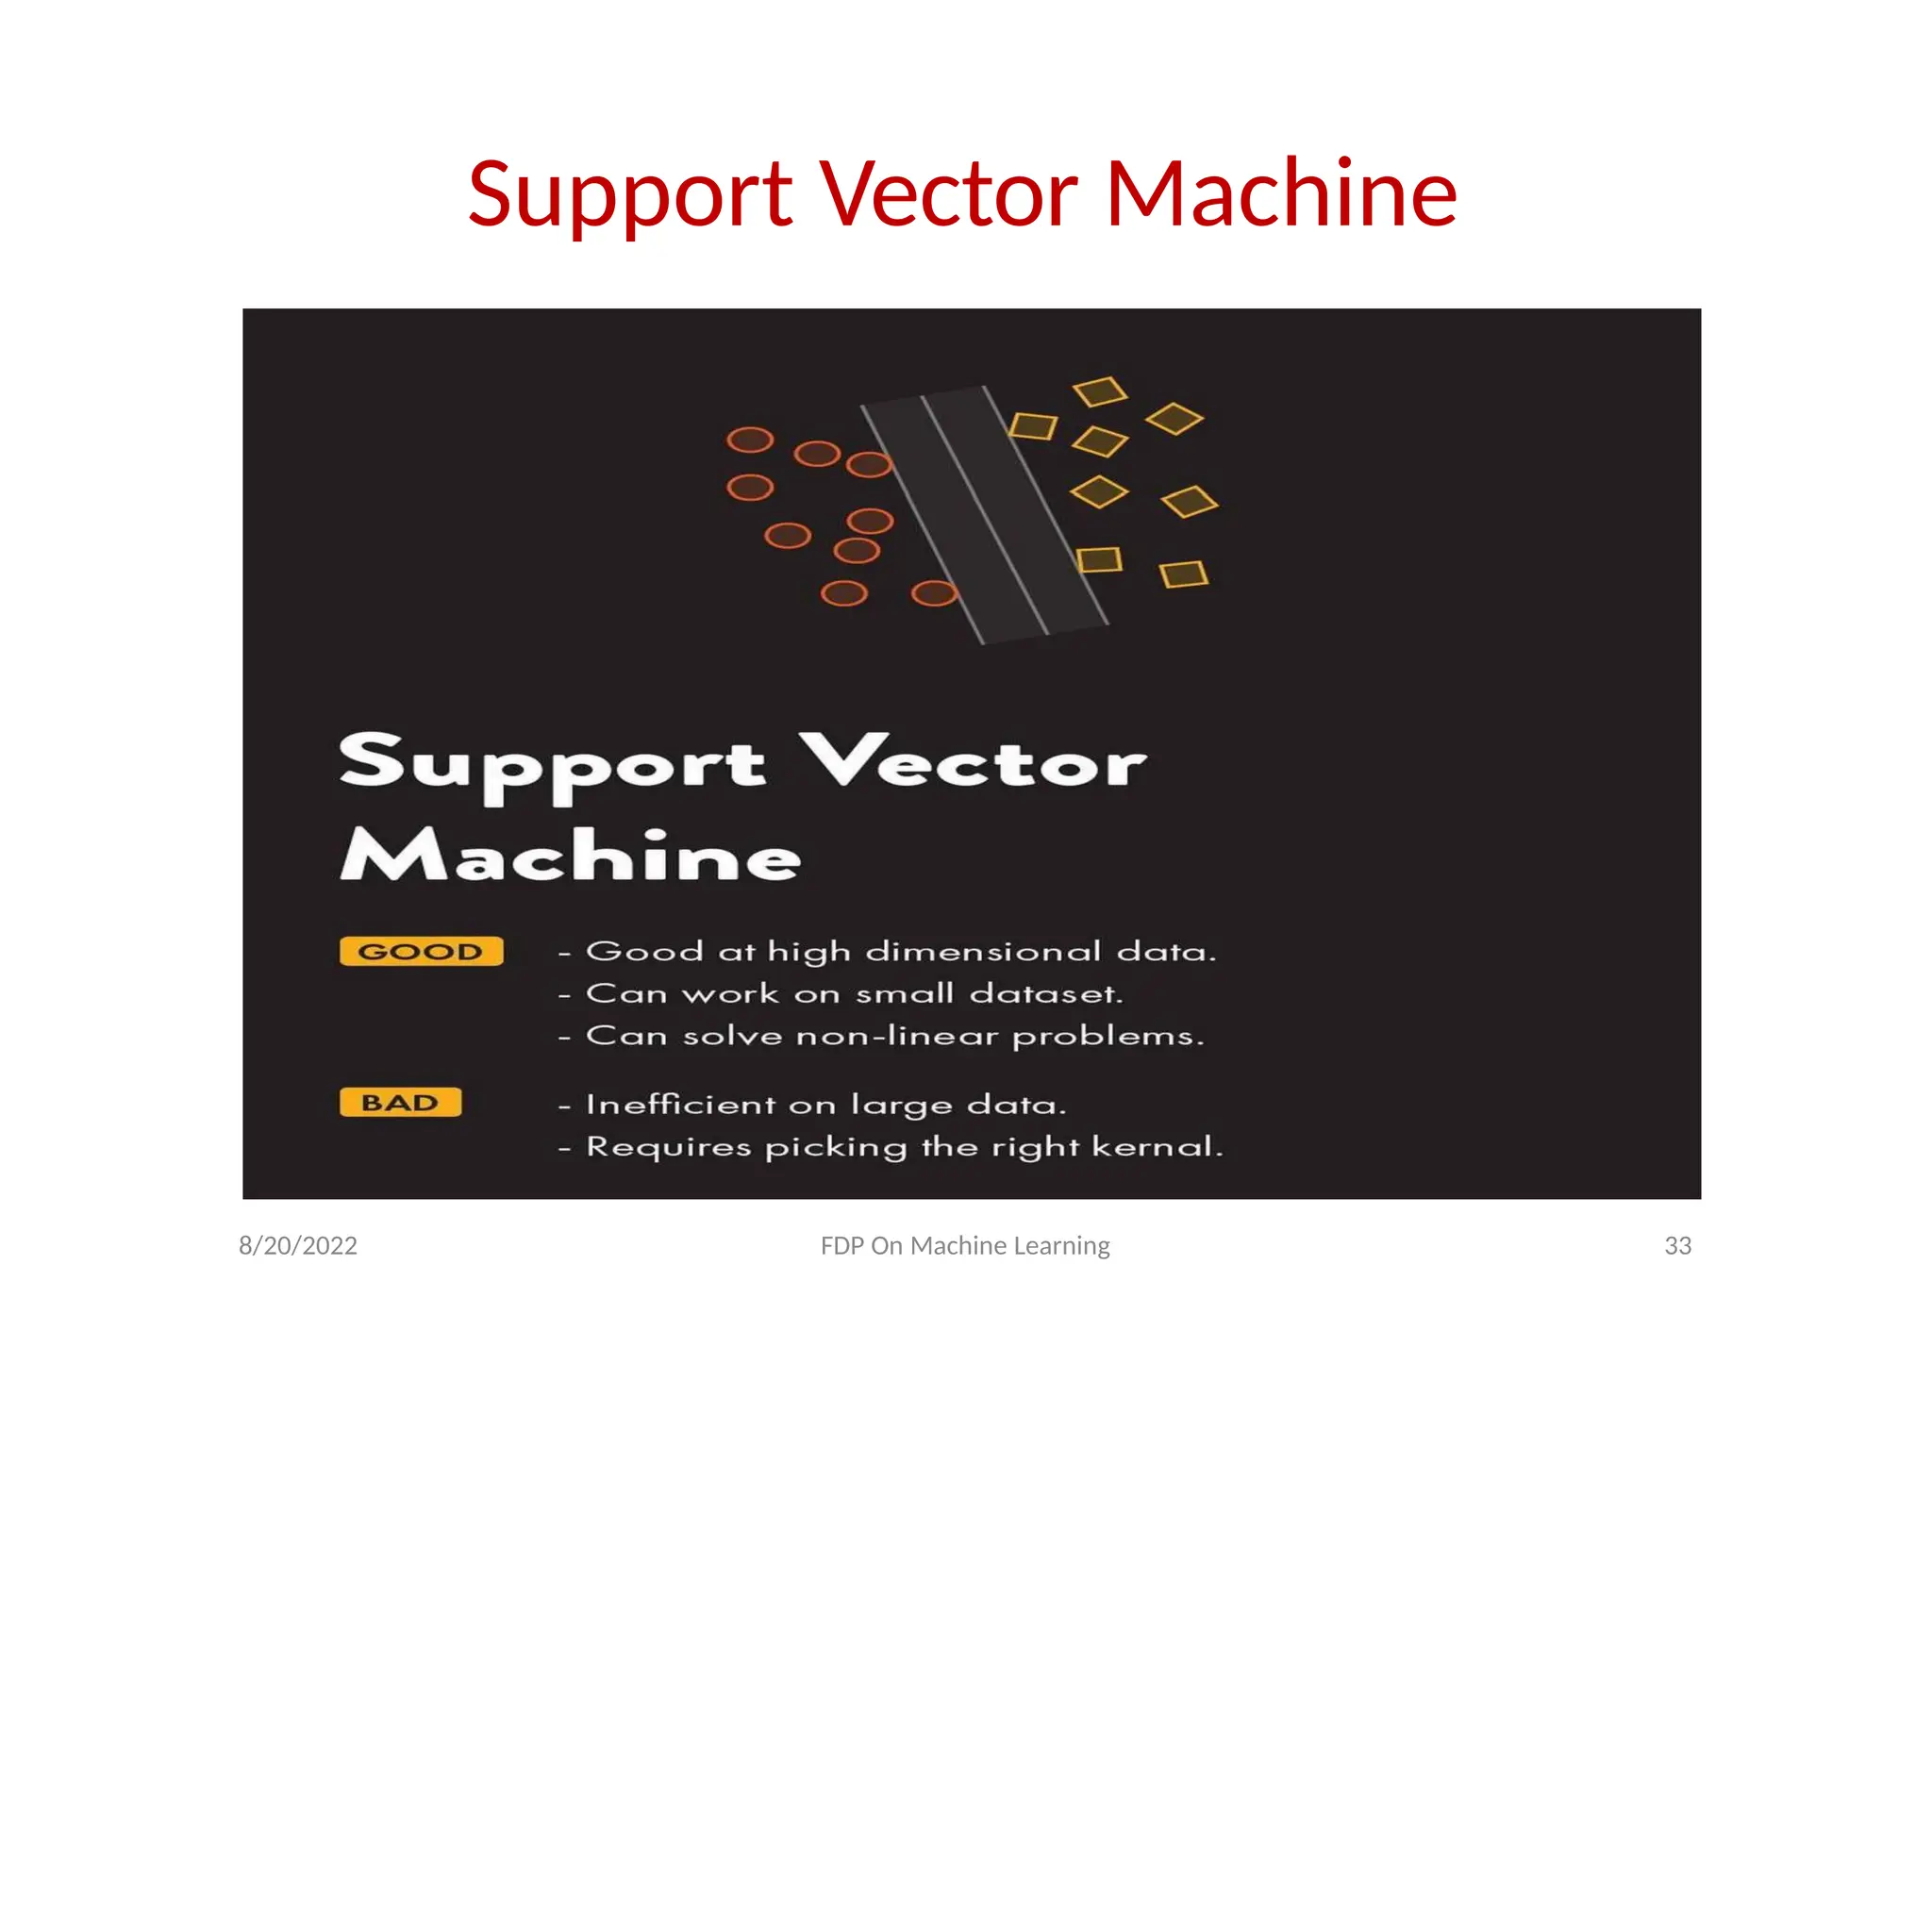
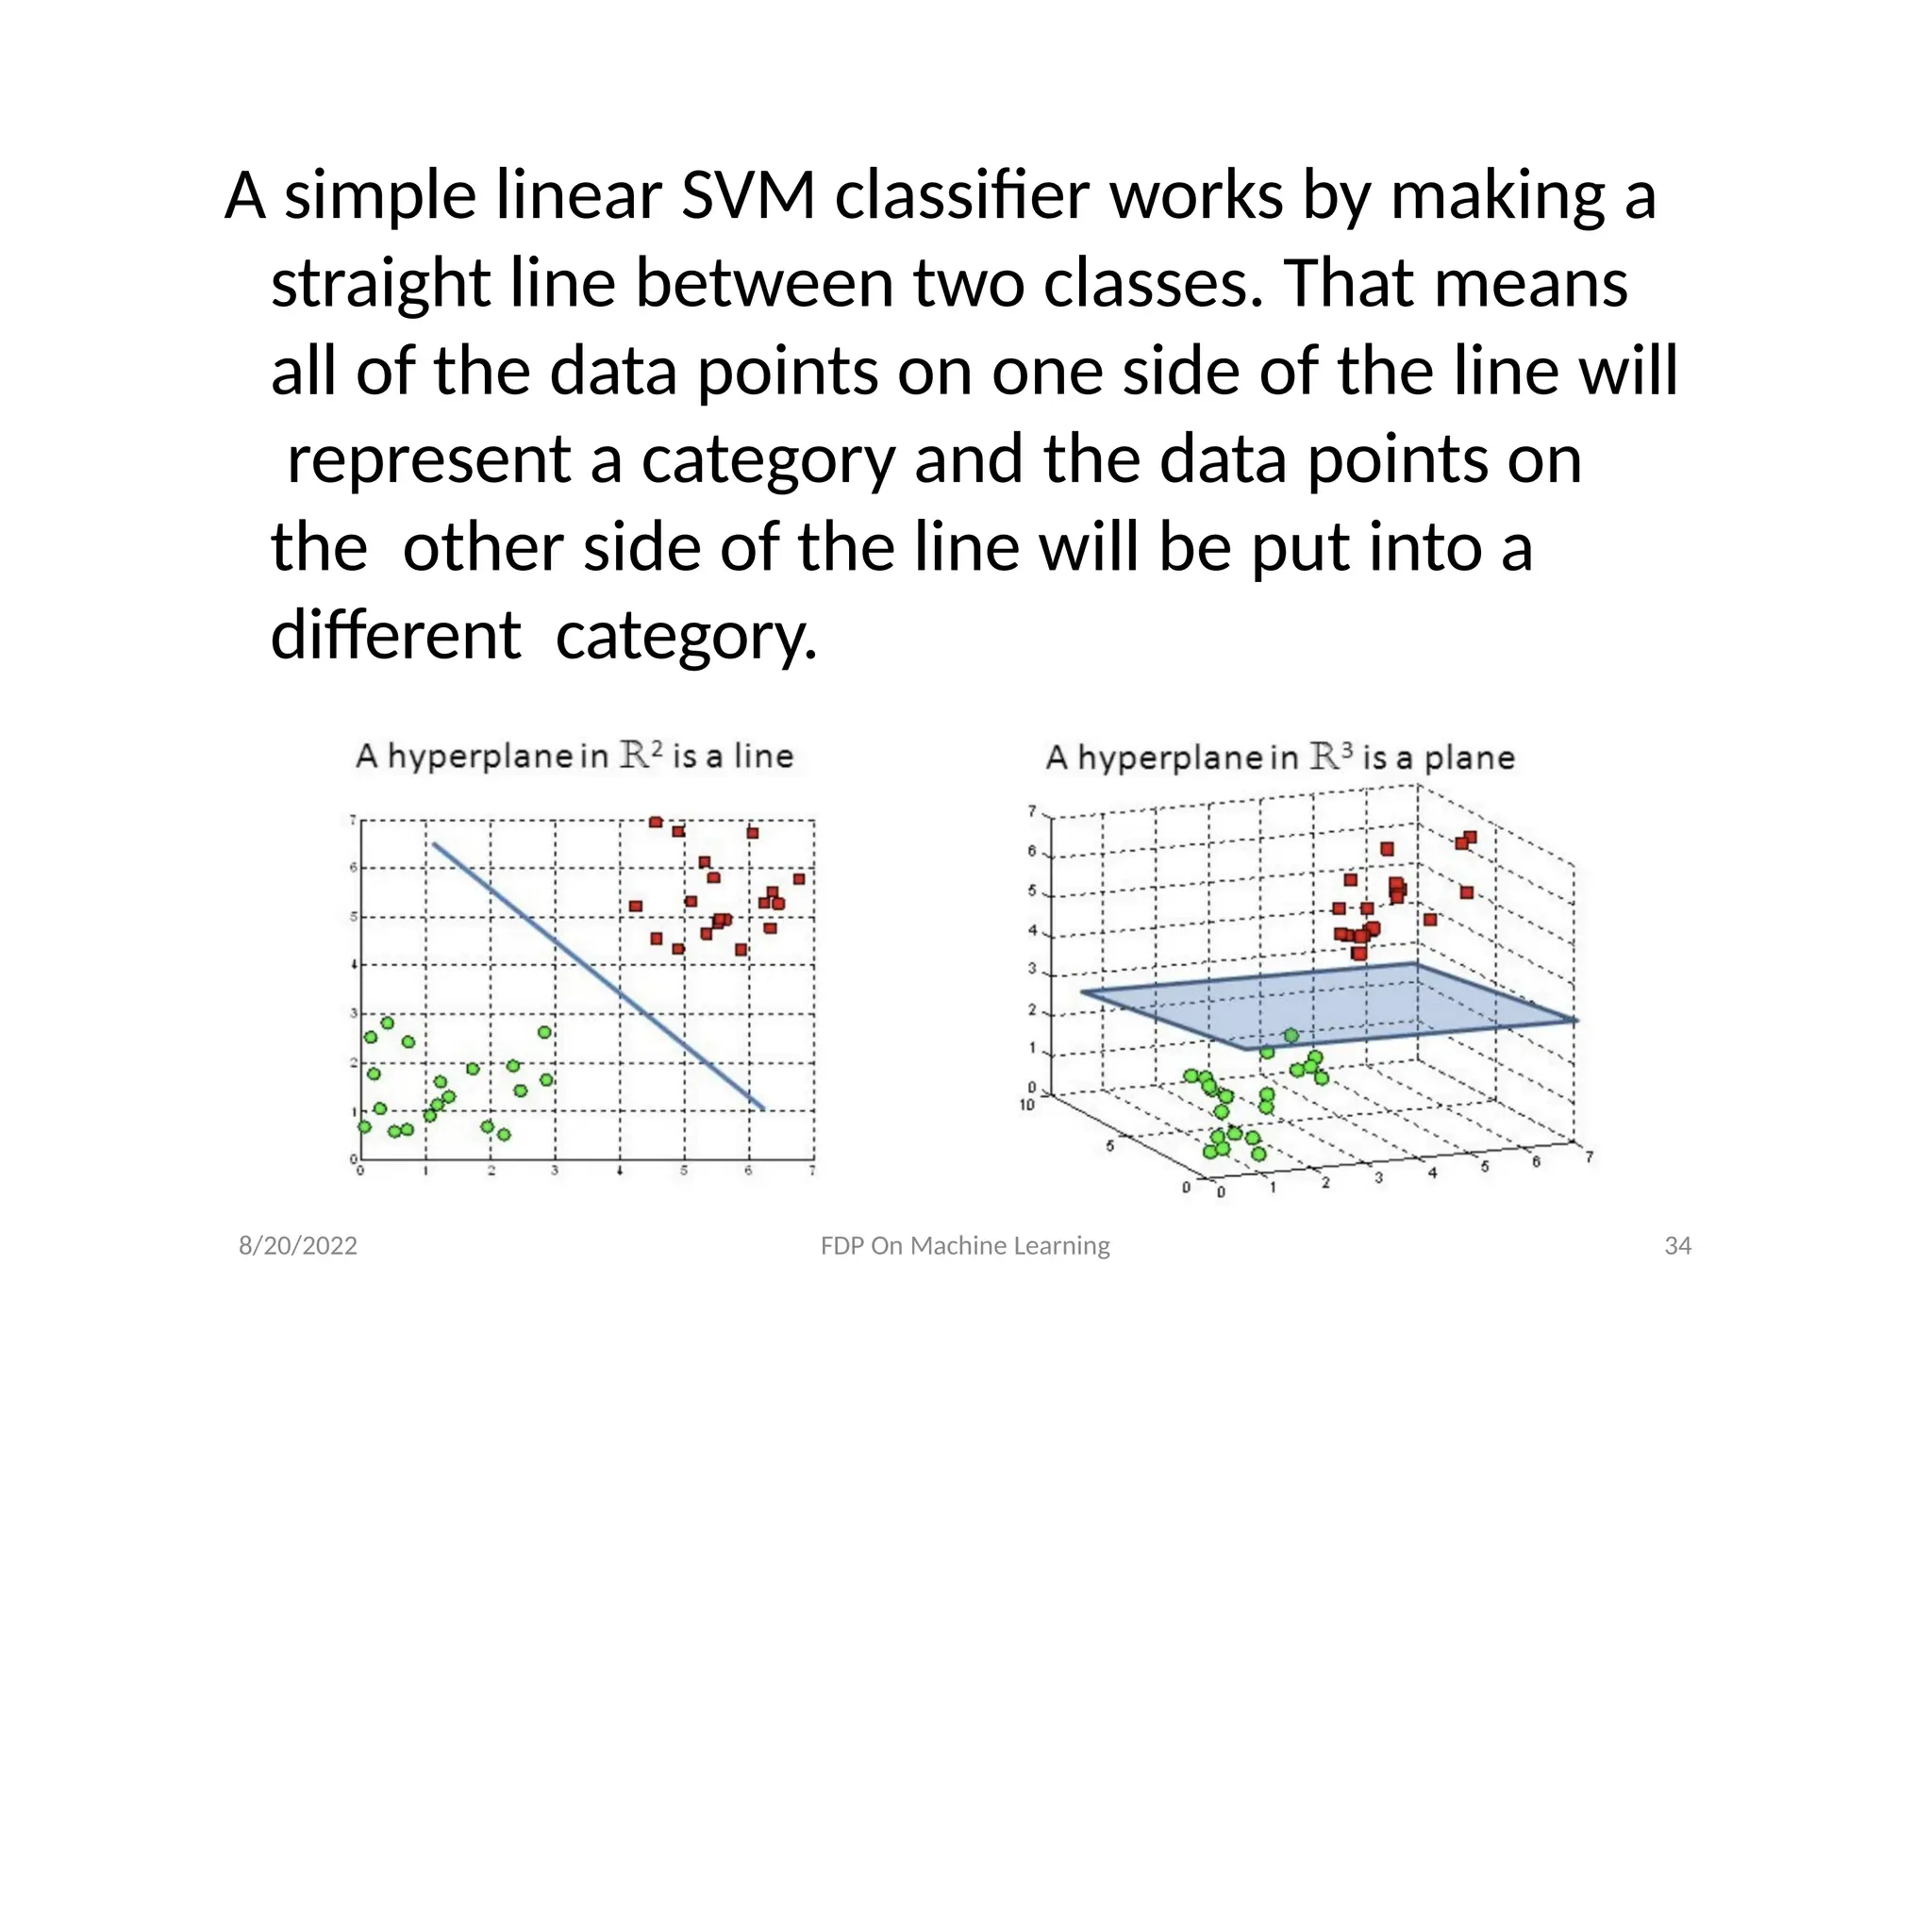
A simple linearSVM classifier works by making a
straight line between two classes. That means
all of the data points on one side of the line will
represent a category and the data points on
the other side of the line will be put into a
different category.
8/20/2022 FDP On Machine Learning 34
8/20/2022 FDP OnMachine Learning 36
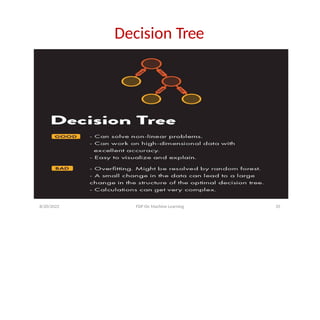
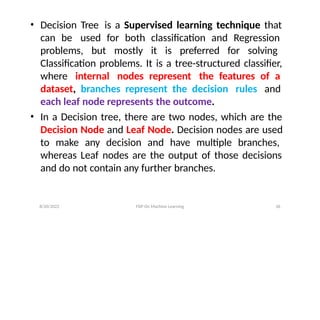
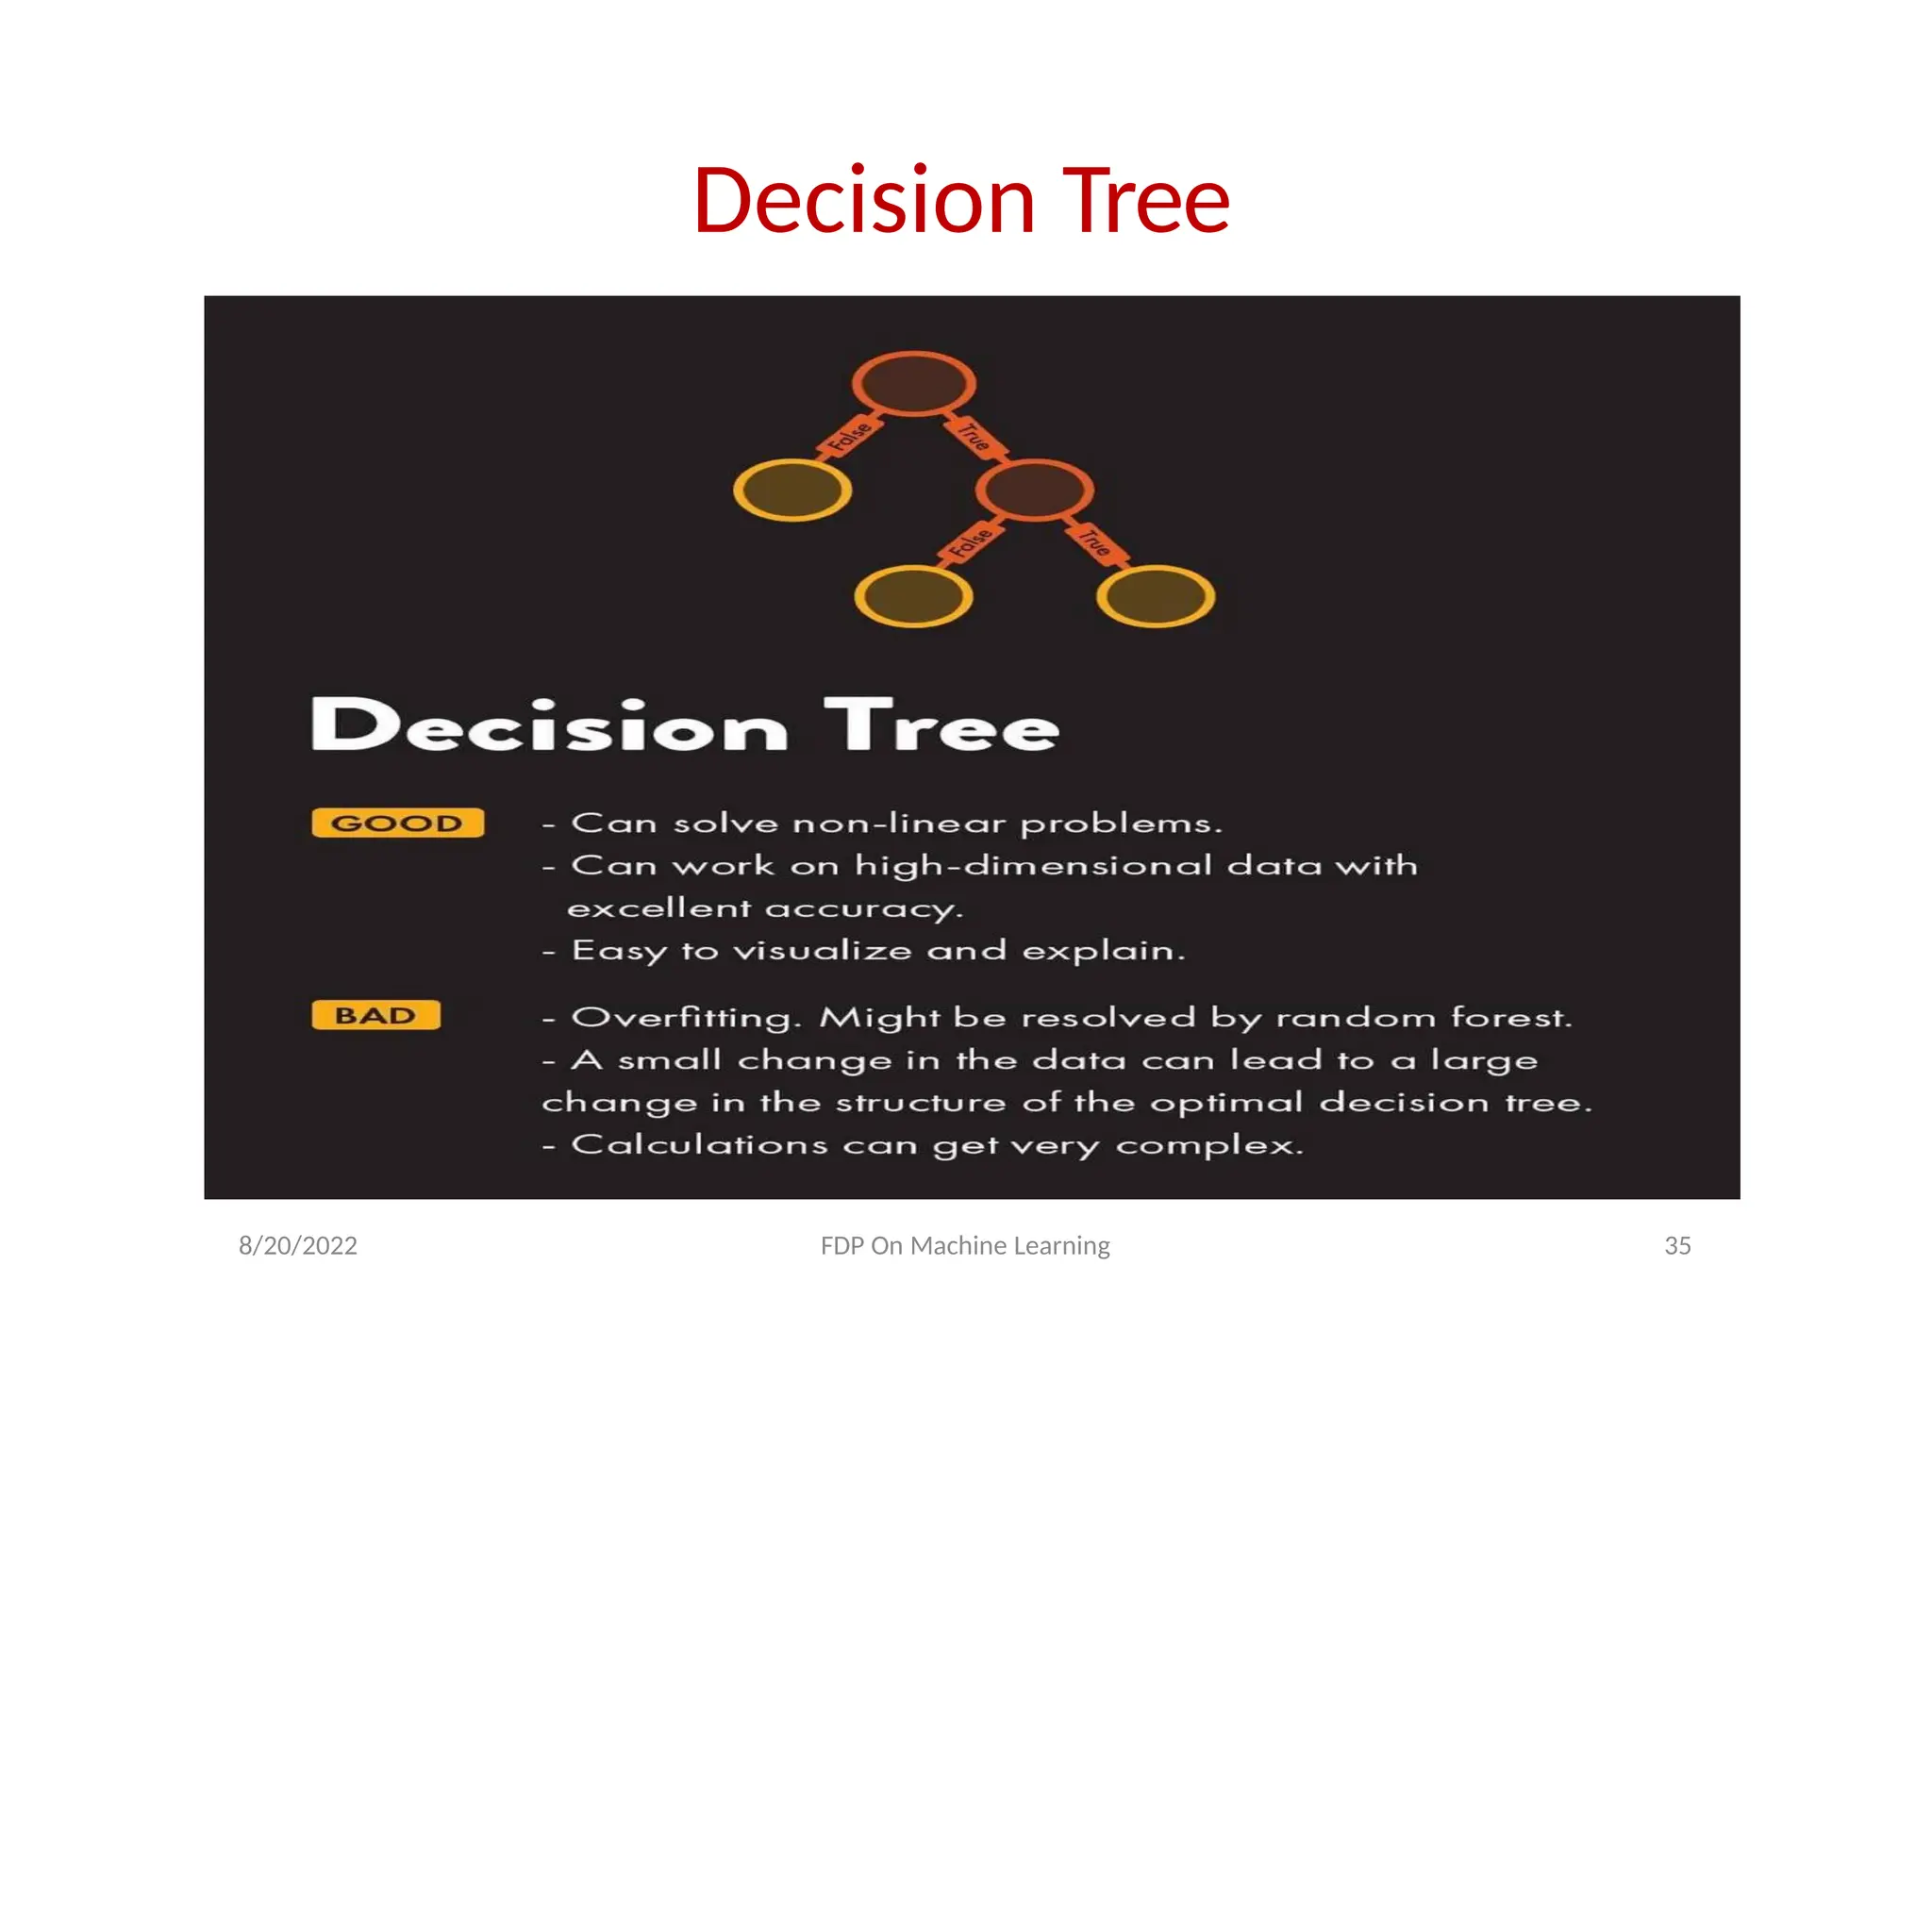
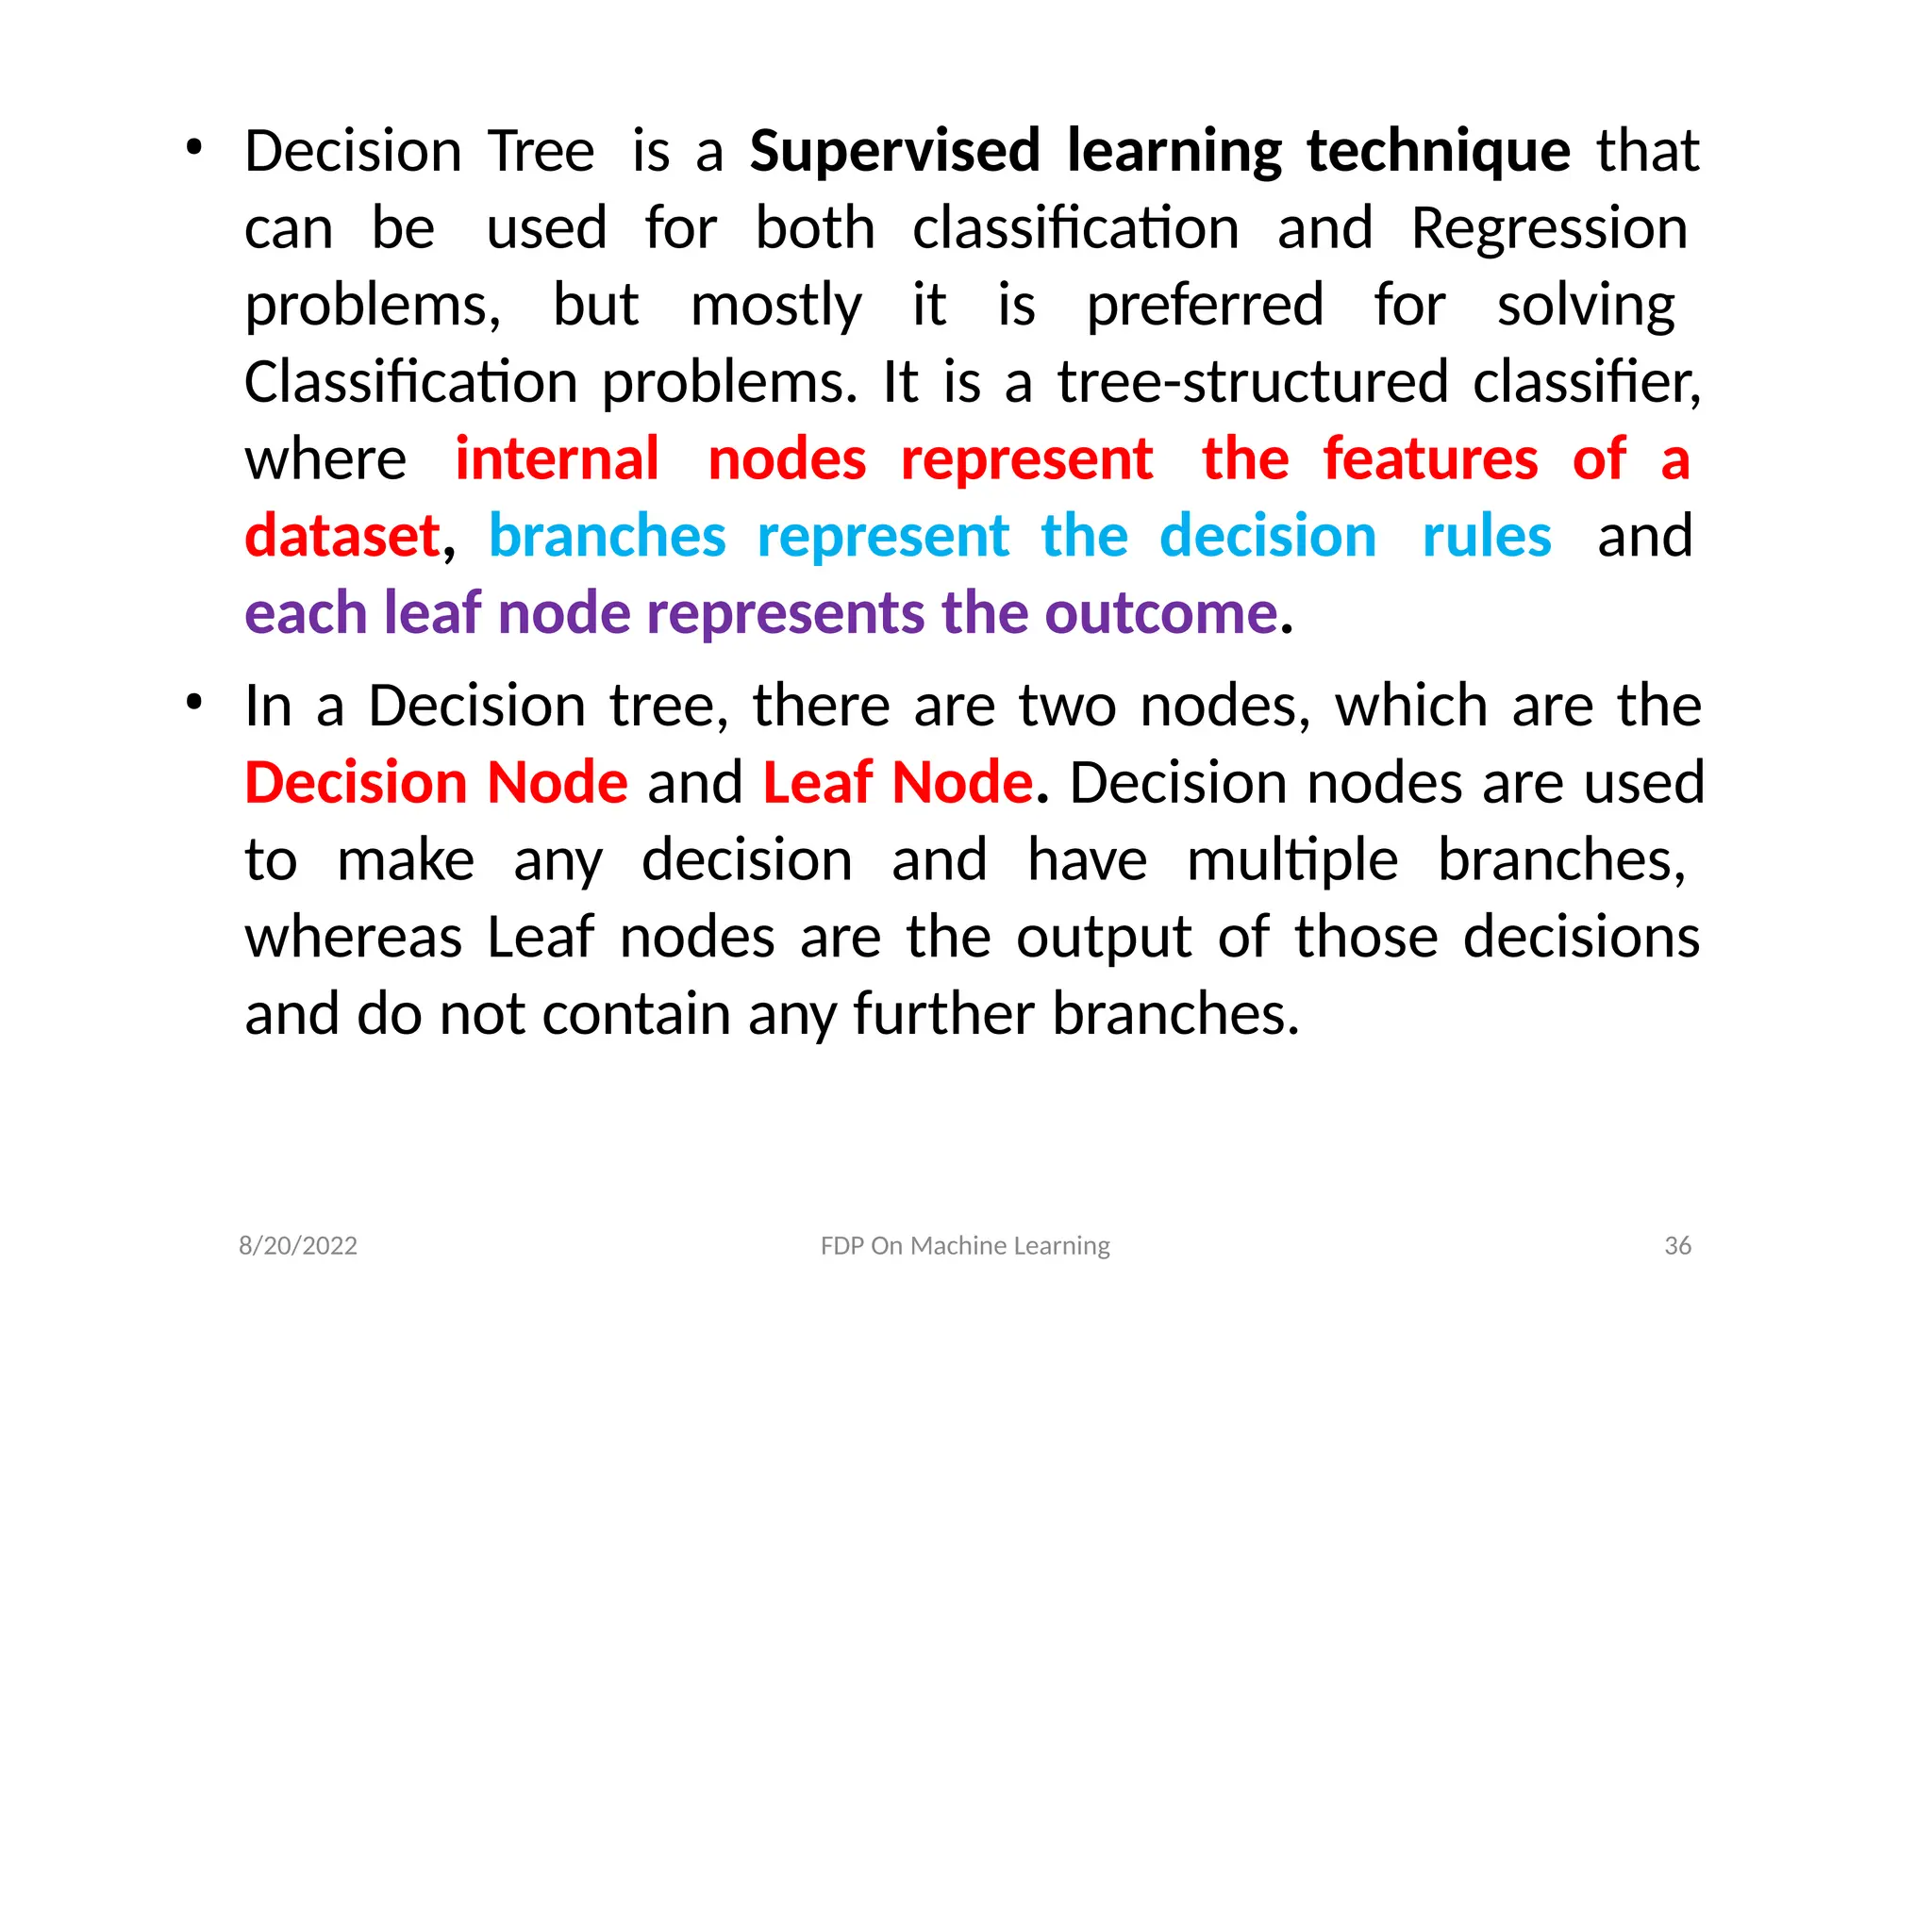
• Decision Tree is a Supervised learning technique that
can be used for both classification and Regression
problems, but mostly it is preferred for solving
Classification problems. It is a tree-structured classifier,
where internal nodes represent the features of a
dataset, branches represent the decision rules and
each leaf node represents the outcome.
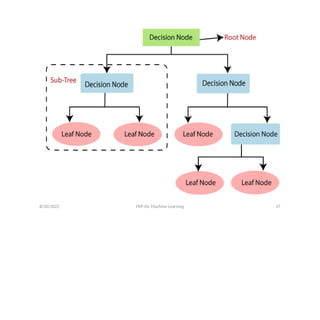
• In a Decision tree, there are two nodes, which are the
Decision Node and Leaf Node. Decision nodes are used
to make any decision and have multiple branches,
whereas Leaf nodes are the output of those decisions
and do not contain any further branches.
8/20/2022 FDP OnMachine Learning 39
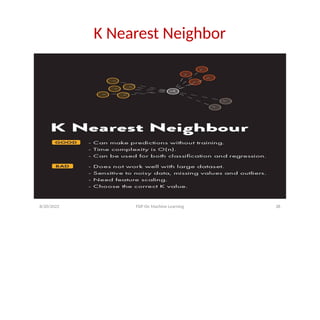
“Birds of a feather flock together.”
• The KNN algorithm assumes that similar things
exist in close proximity. In other words, similar
things are near to each other.
• Use the concept of norm or metric between two
things to decide their closeness. Commonly used
are Euclidean, Manhattan or Hamming distance
• To select the K that’s right for your data, we run the
KNN algorithm several times with different values
of K and choose the K that reduces the number of
errors we encounter while maintaining the
algorithm’s ability to accurately make predictions
when it’s given data it hasn’t seen before.
41.
8/20/2022 FDP OnMachine Learning 40
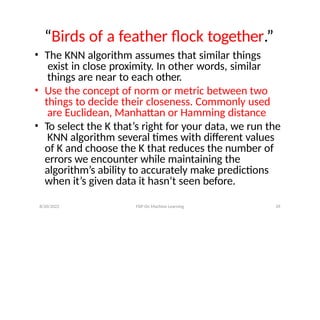
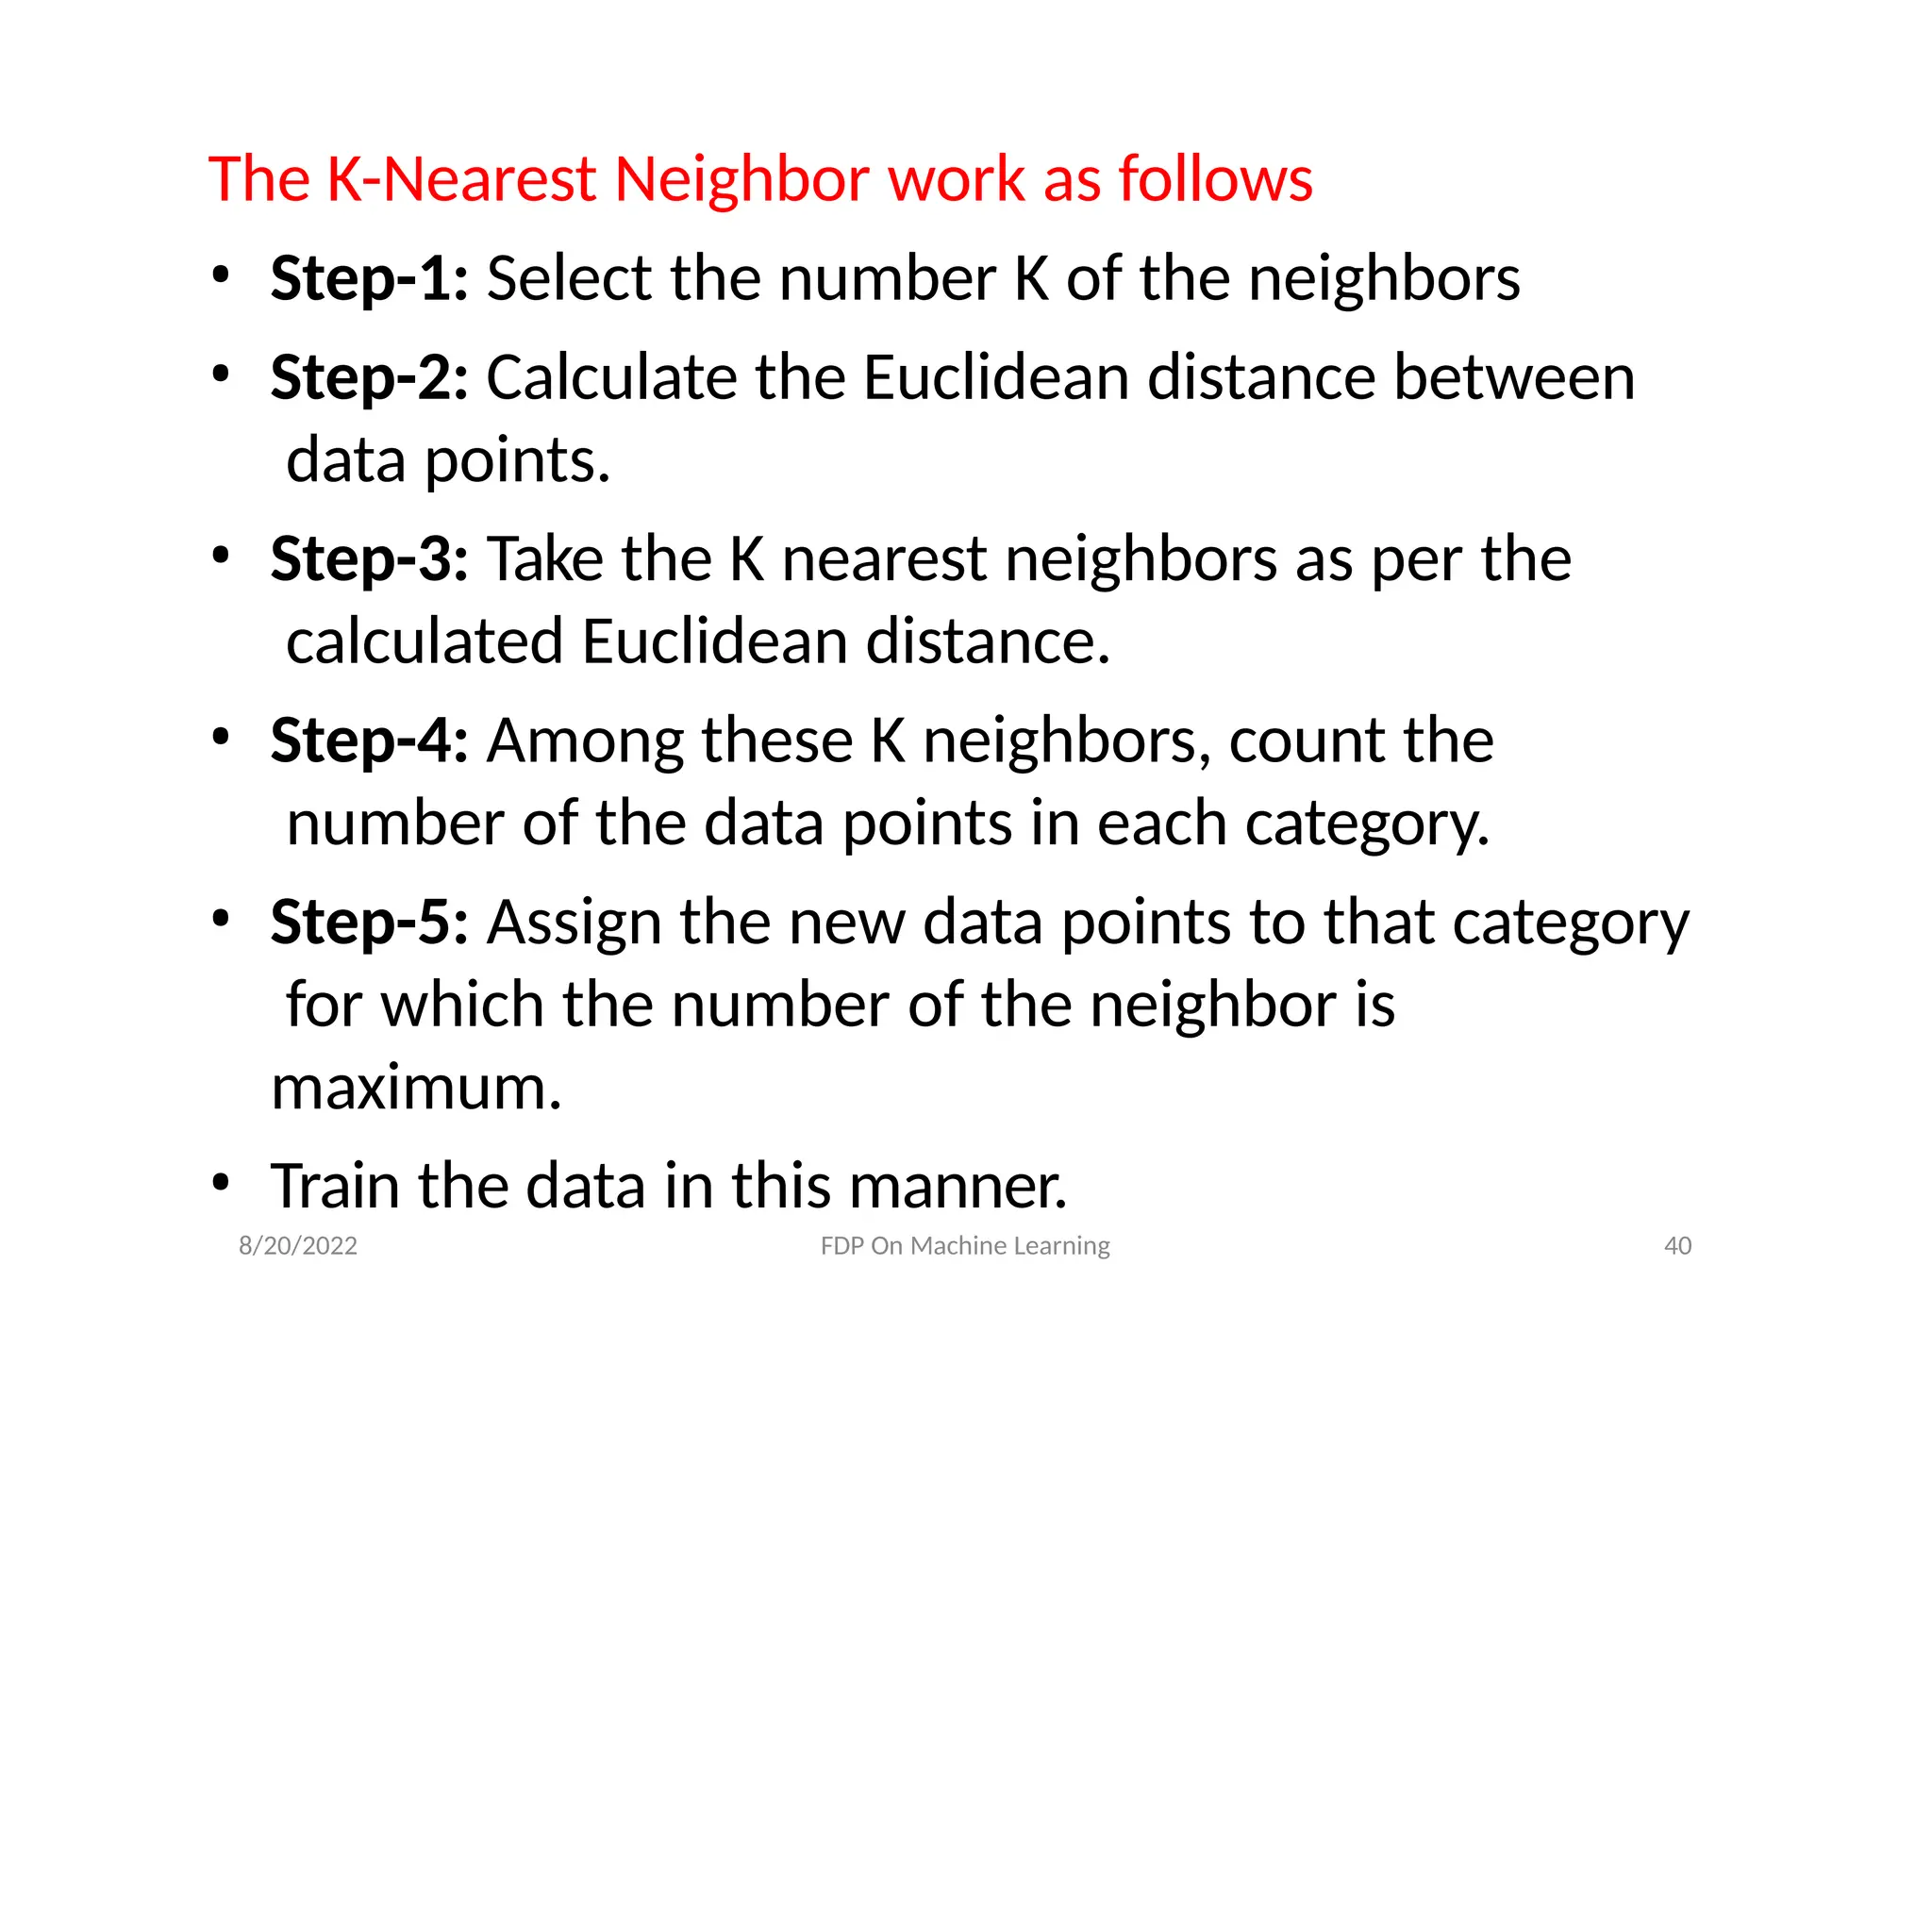
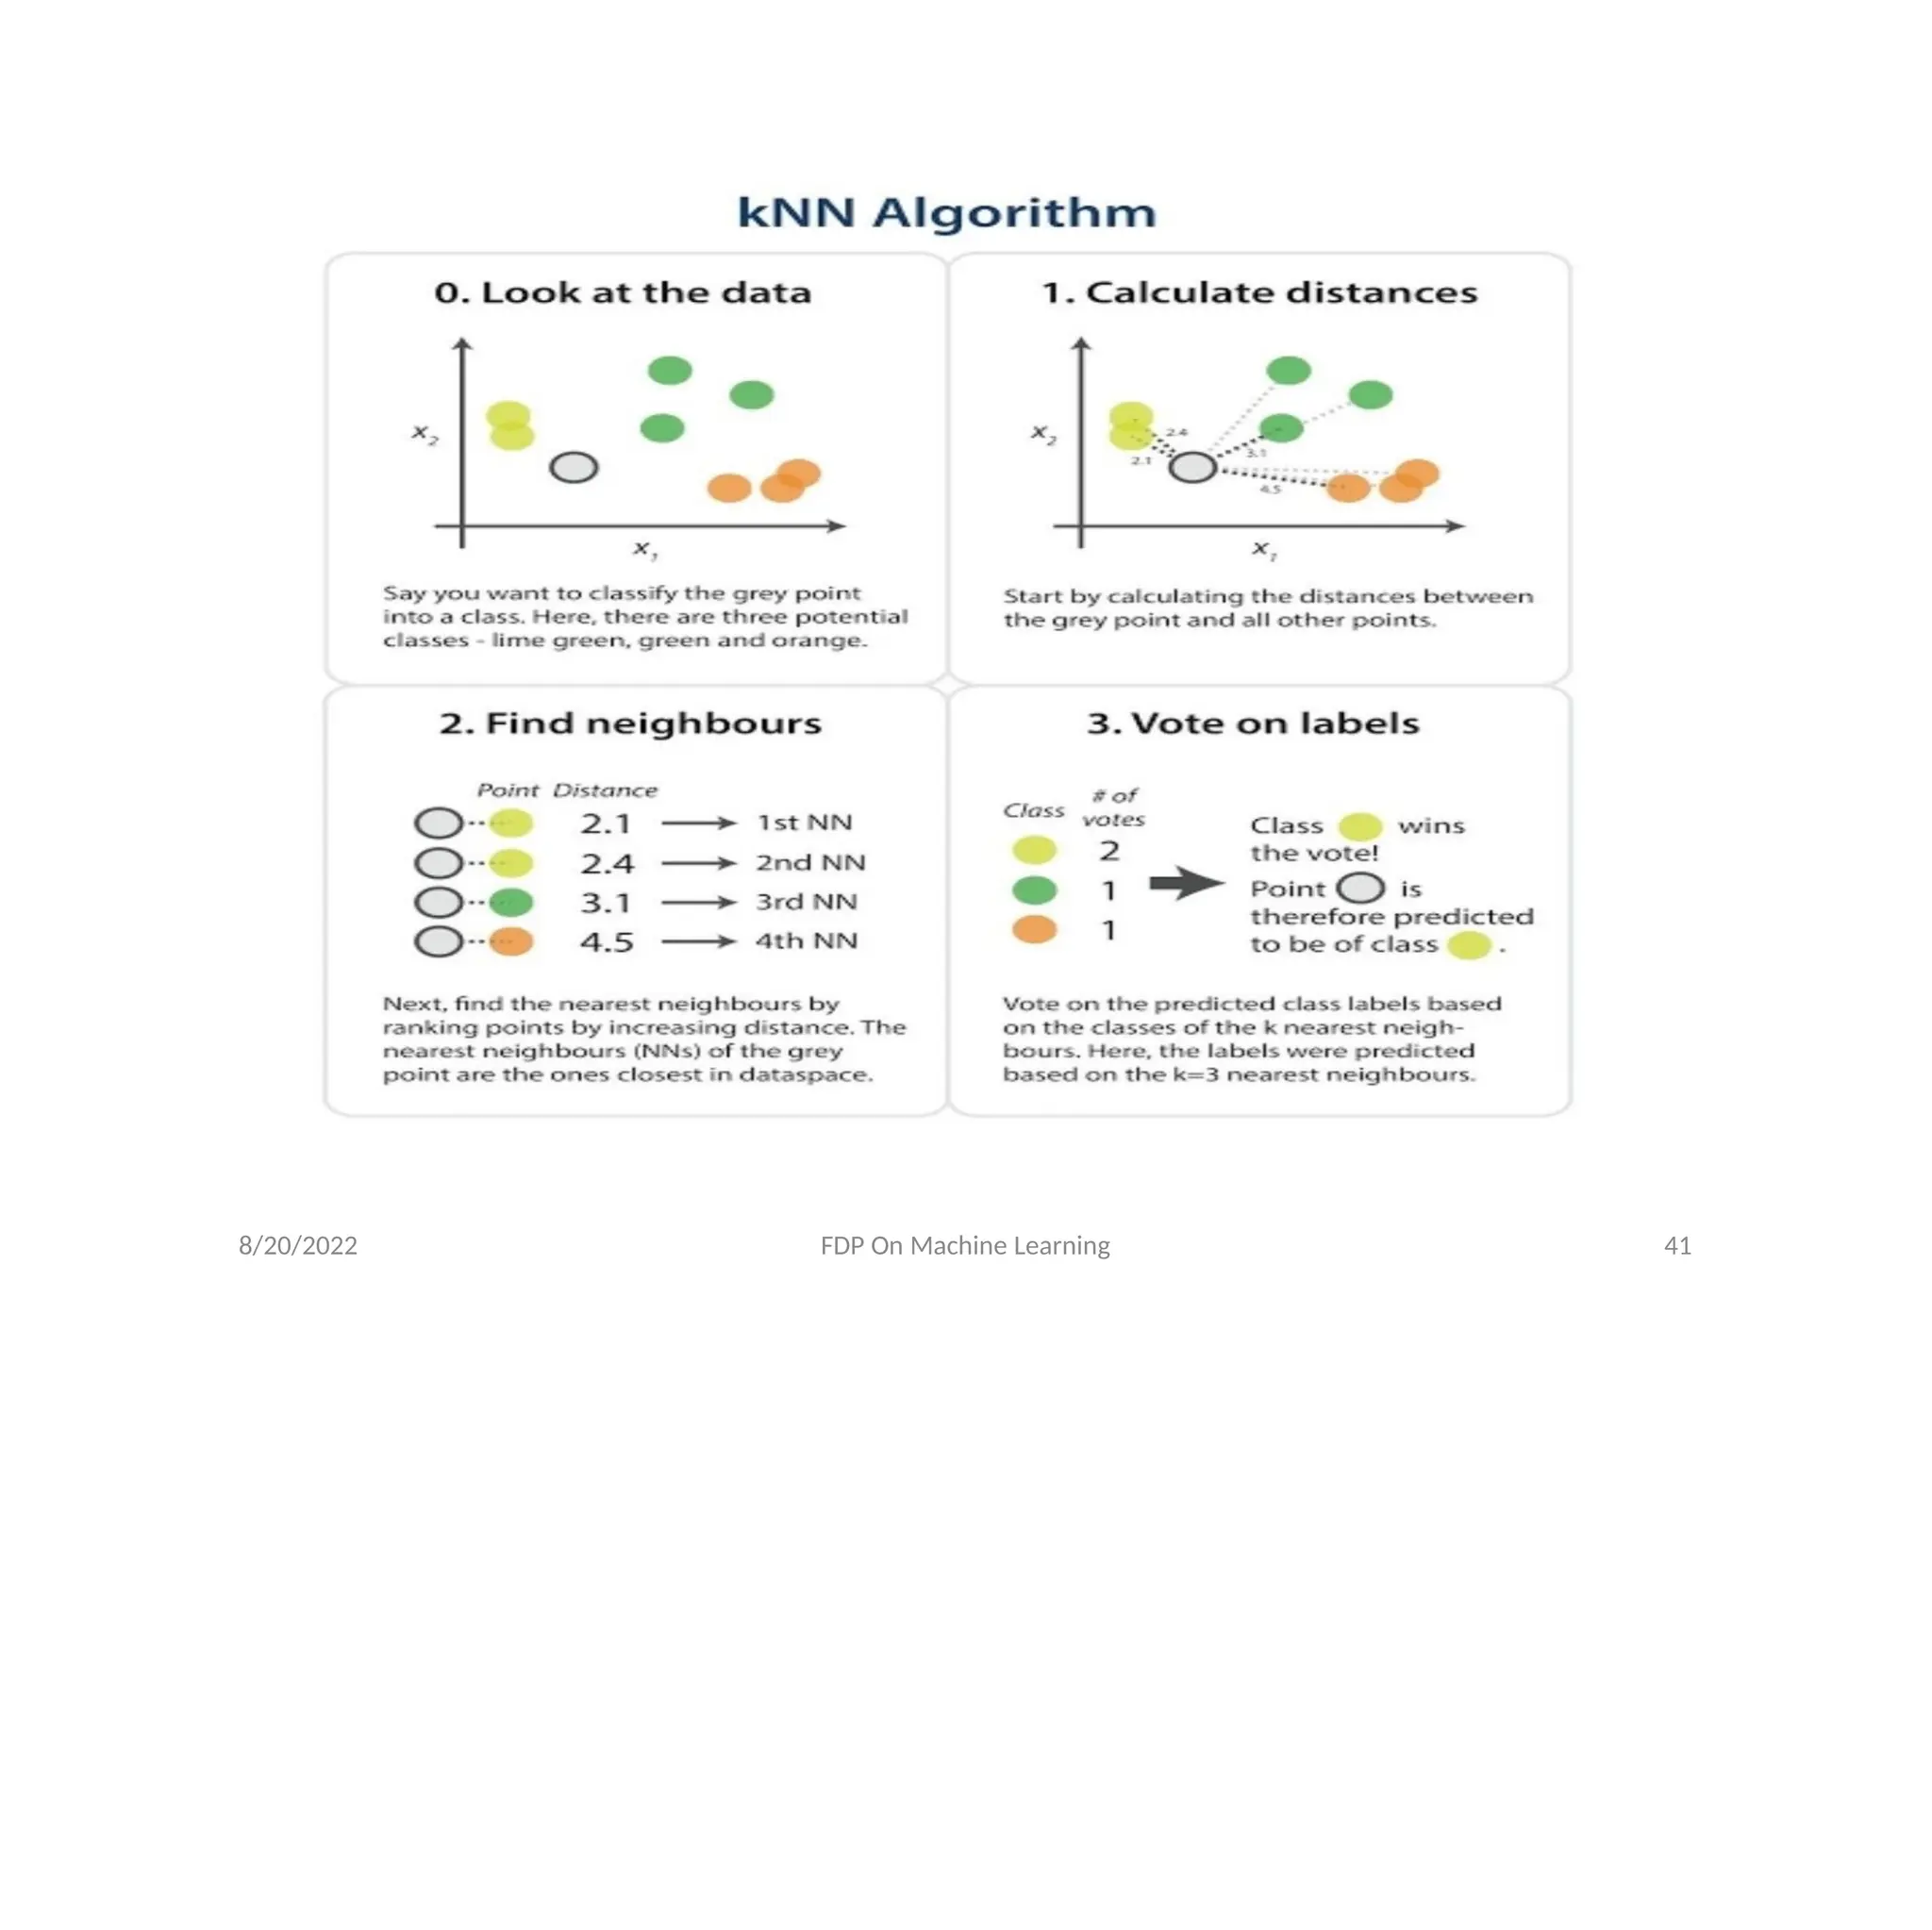
The K-Nearest Neighbor work as follows
• Step-1: Select the number K of the neighbors
• Step-2: Calculate the Euclidean distance between
data points.
• Step-3: Take the K nearest neighbors as per the
calculated Euclidean distance.
• Step-4: Among these K neighbors, count the
number of the data points in each category.
• Step-5: Assign the new data points to that category
for which the number of the neighbor is
maximum.
• Train the data in this manner.
8/20/2022 FDP OnMachine Learning 43
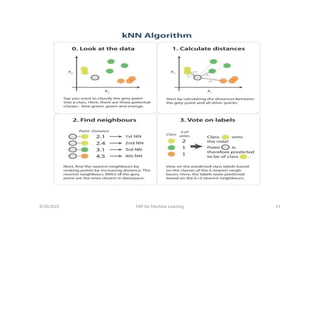
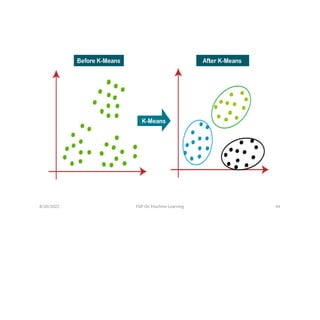
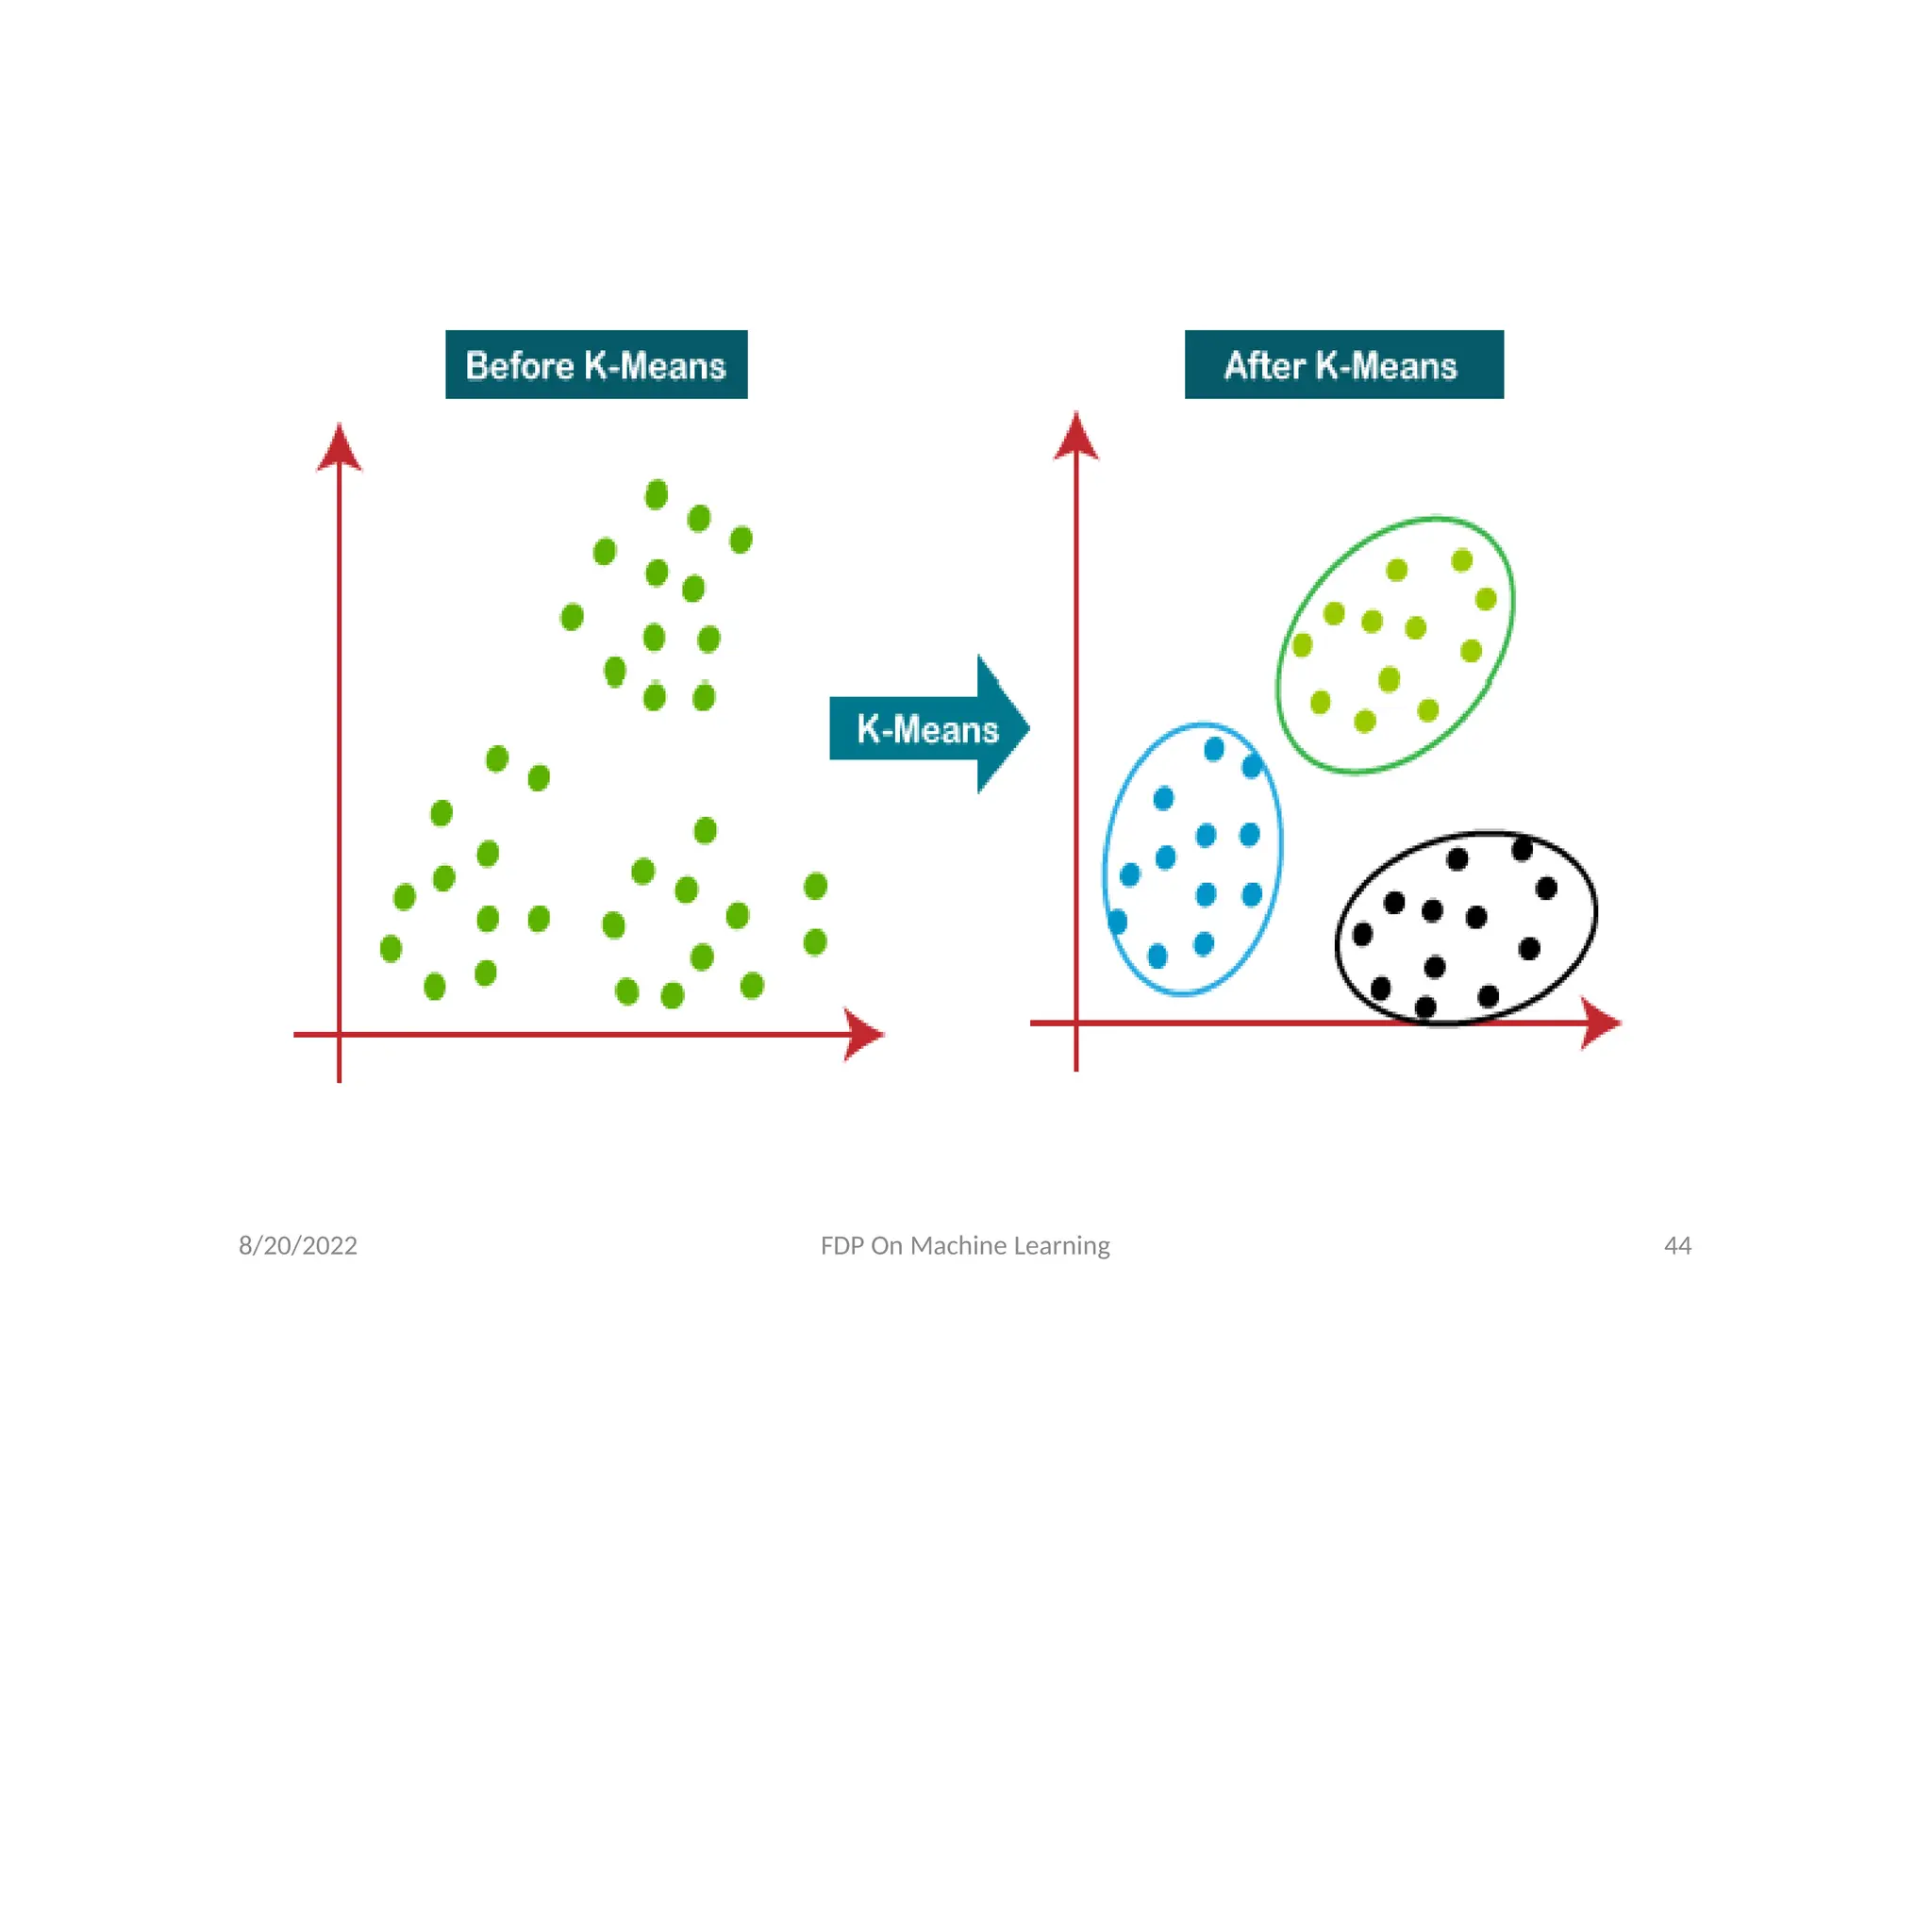
• K-Means Clustering is an unsupervised machine learning
algorithm which groups the unlabeled dataset into
different clusters. Here K defines the number of pre-
defined clusters that need to be created in the process, as
if K=2, there will be two clusters, and for K=3, there will be
three clusters, and so on.
• It is an iterative algorithm that divides the unlabeled
dataset into K different clusters in such a way that each
dataset belongs only one group that has similar
properties.
• It is a centroid-based algorithm, where each cluster is
associated with a centroid. The main aim of this algorithm
is to minimize the sum of distances between the data
points and their corresponding clusters.
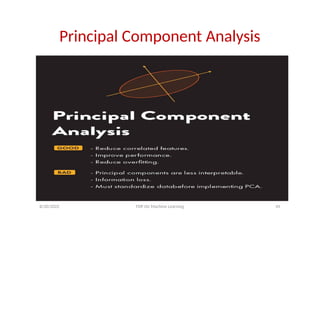
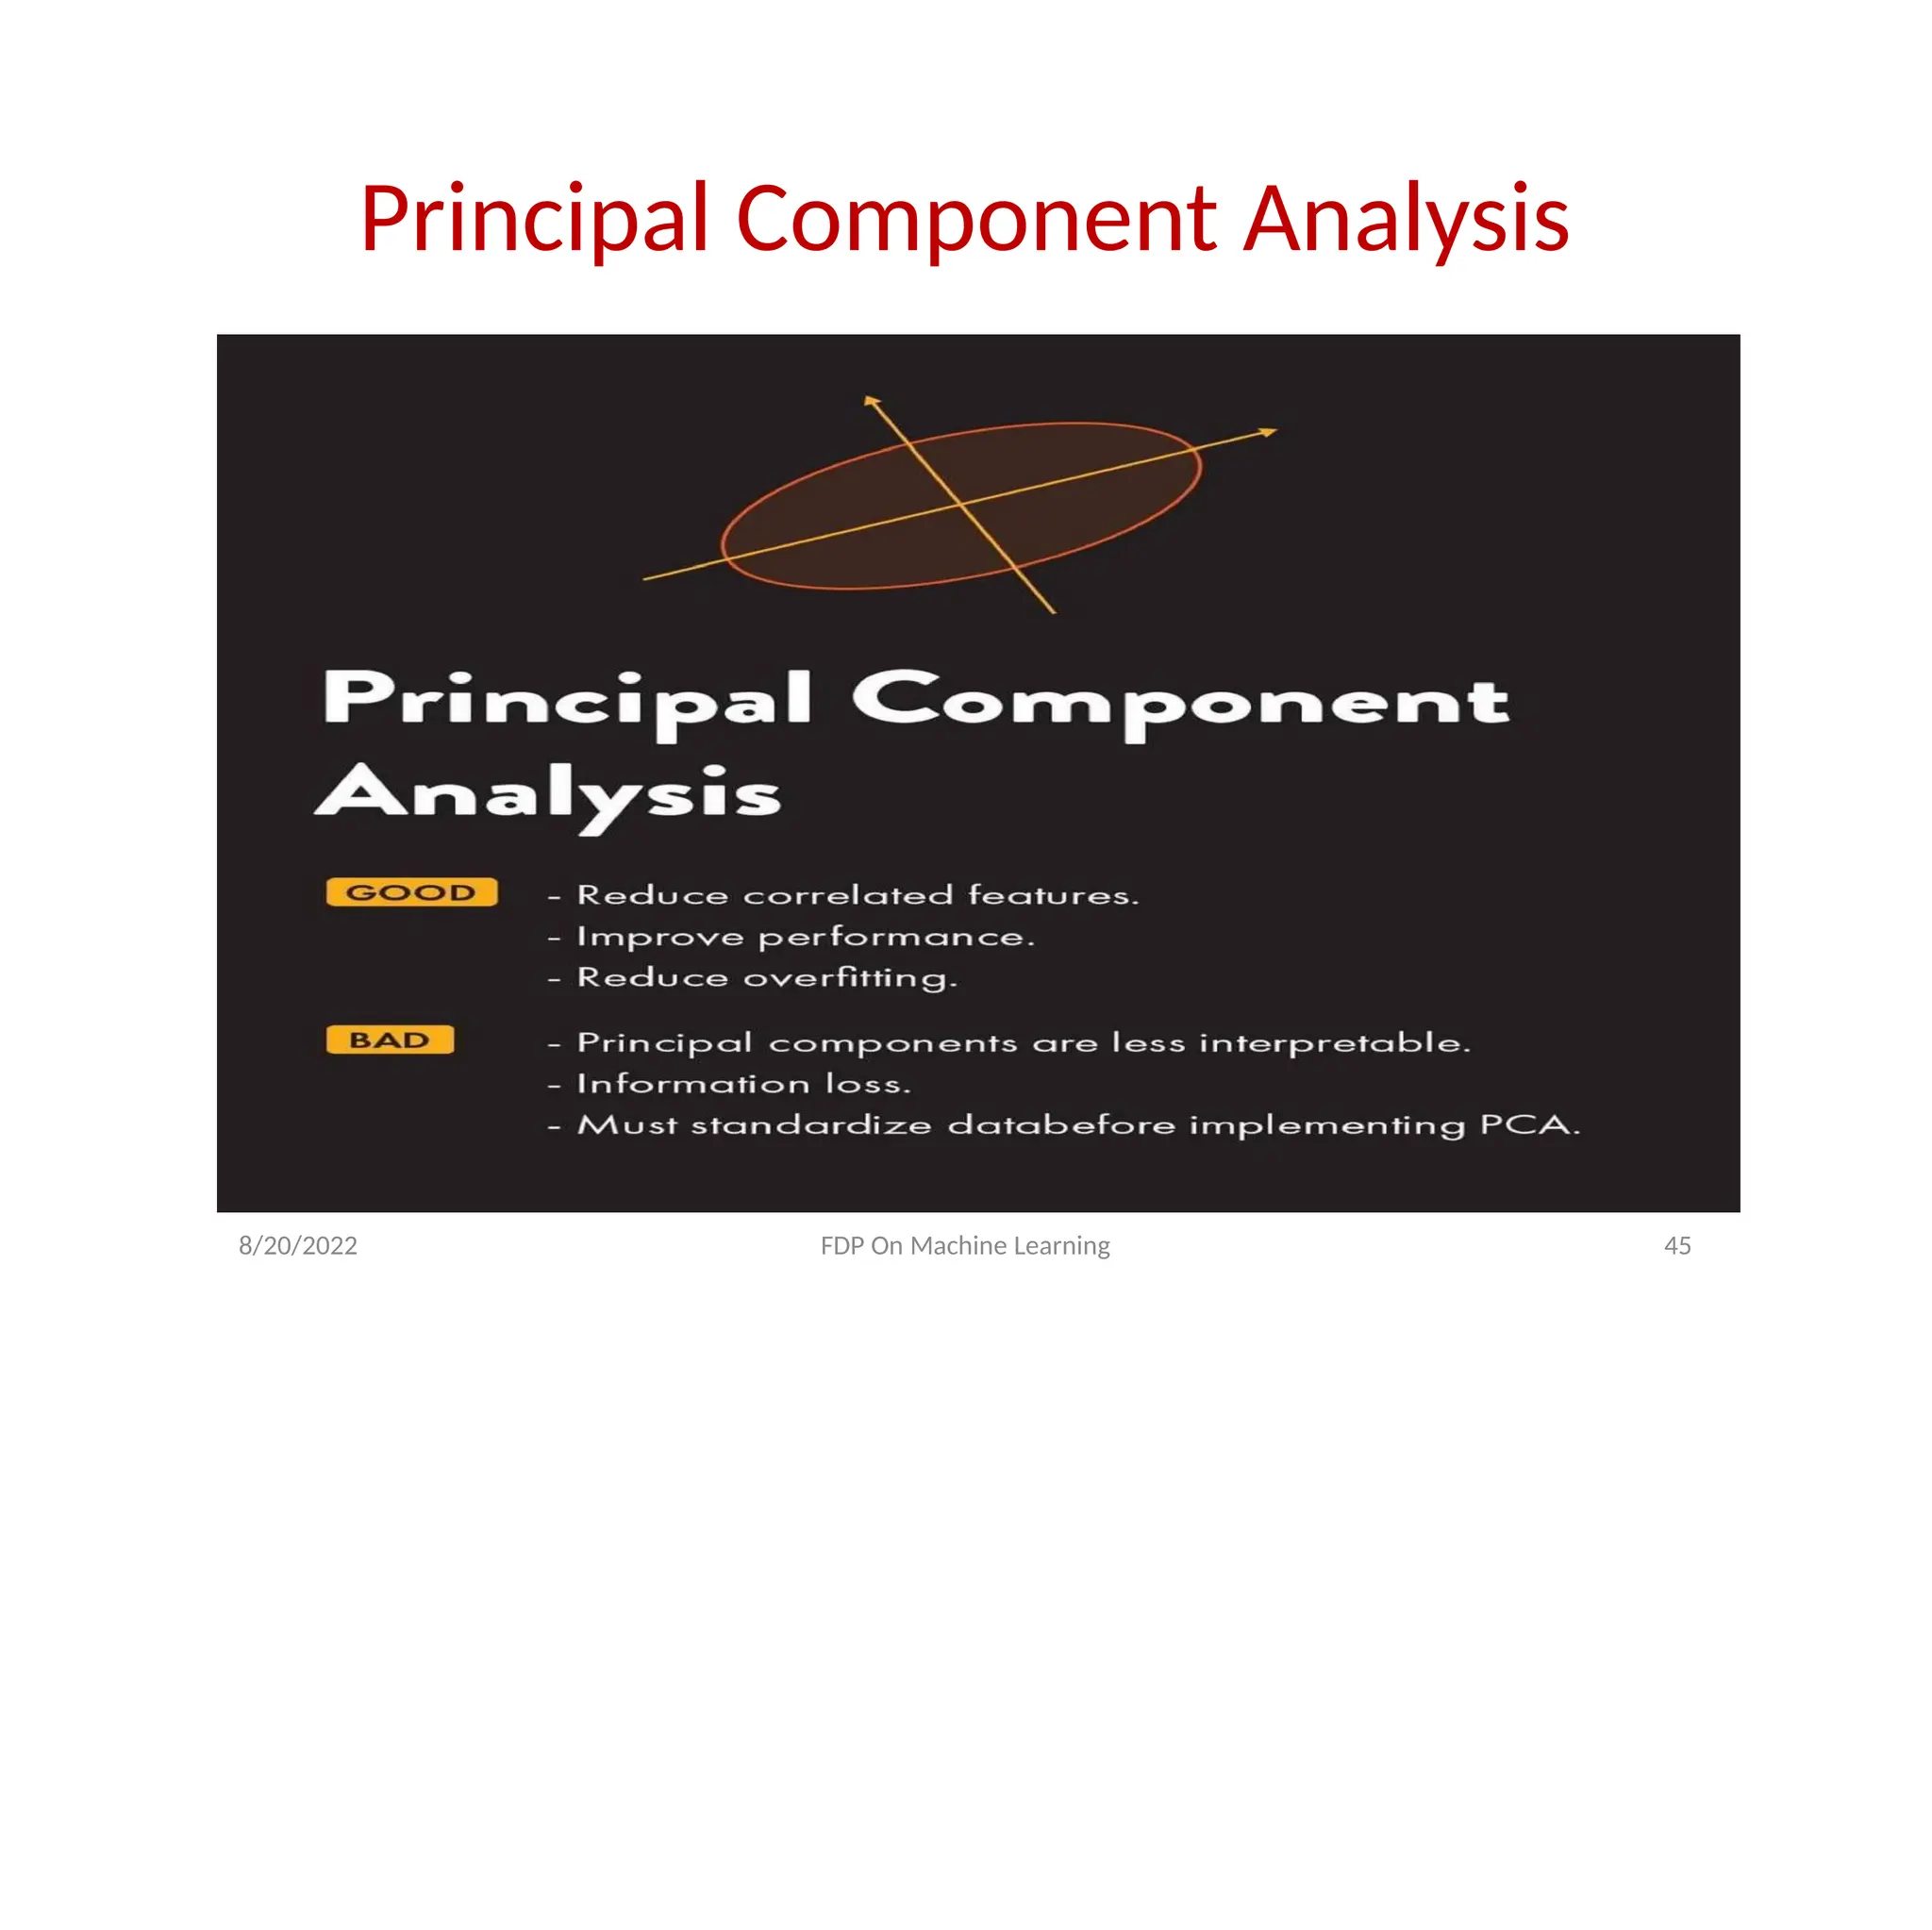
Principal Component Analysis,or PCA, is a
dimensionality-reduction method that is often
used to reduce the dimensionality of large data
sets, by transforming a large set of variables into
a smaller one that still contains most of the
information in the large set.
Following steps are used in PCA
(1) Normalization of Data – Compute the mean
Now normalize the data in [0,1] by using
formula
z =
8/20/2022 FDP On Machine Learning 46
48.
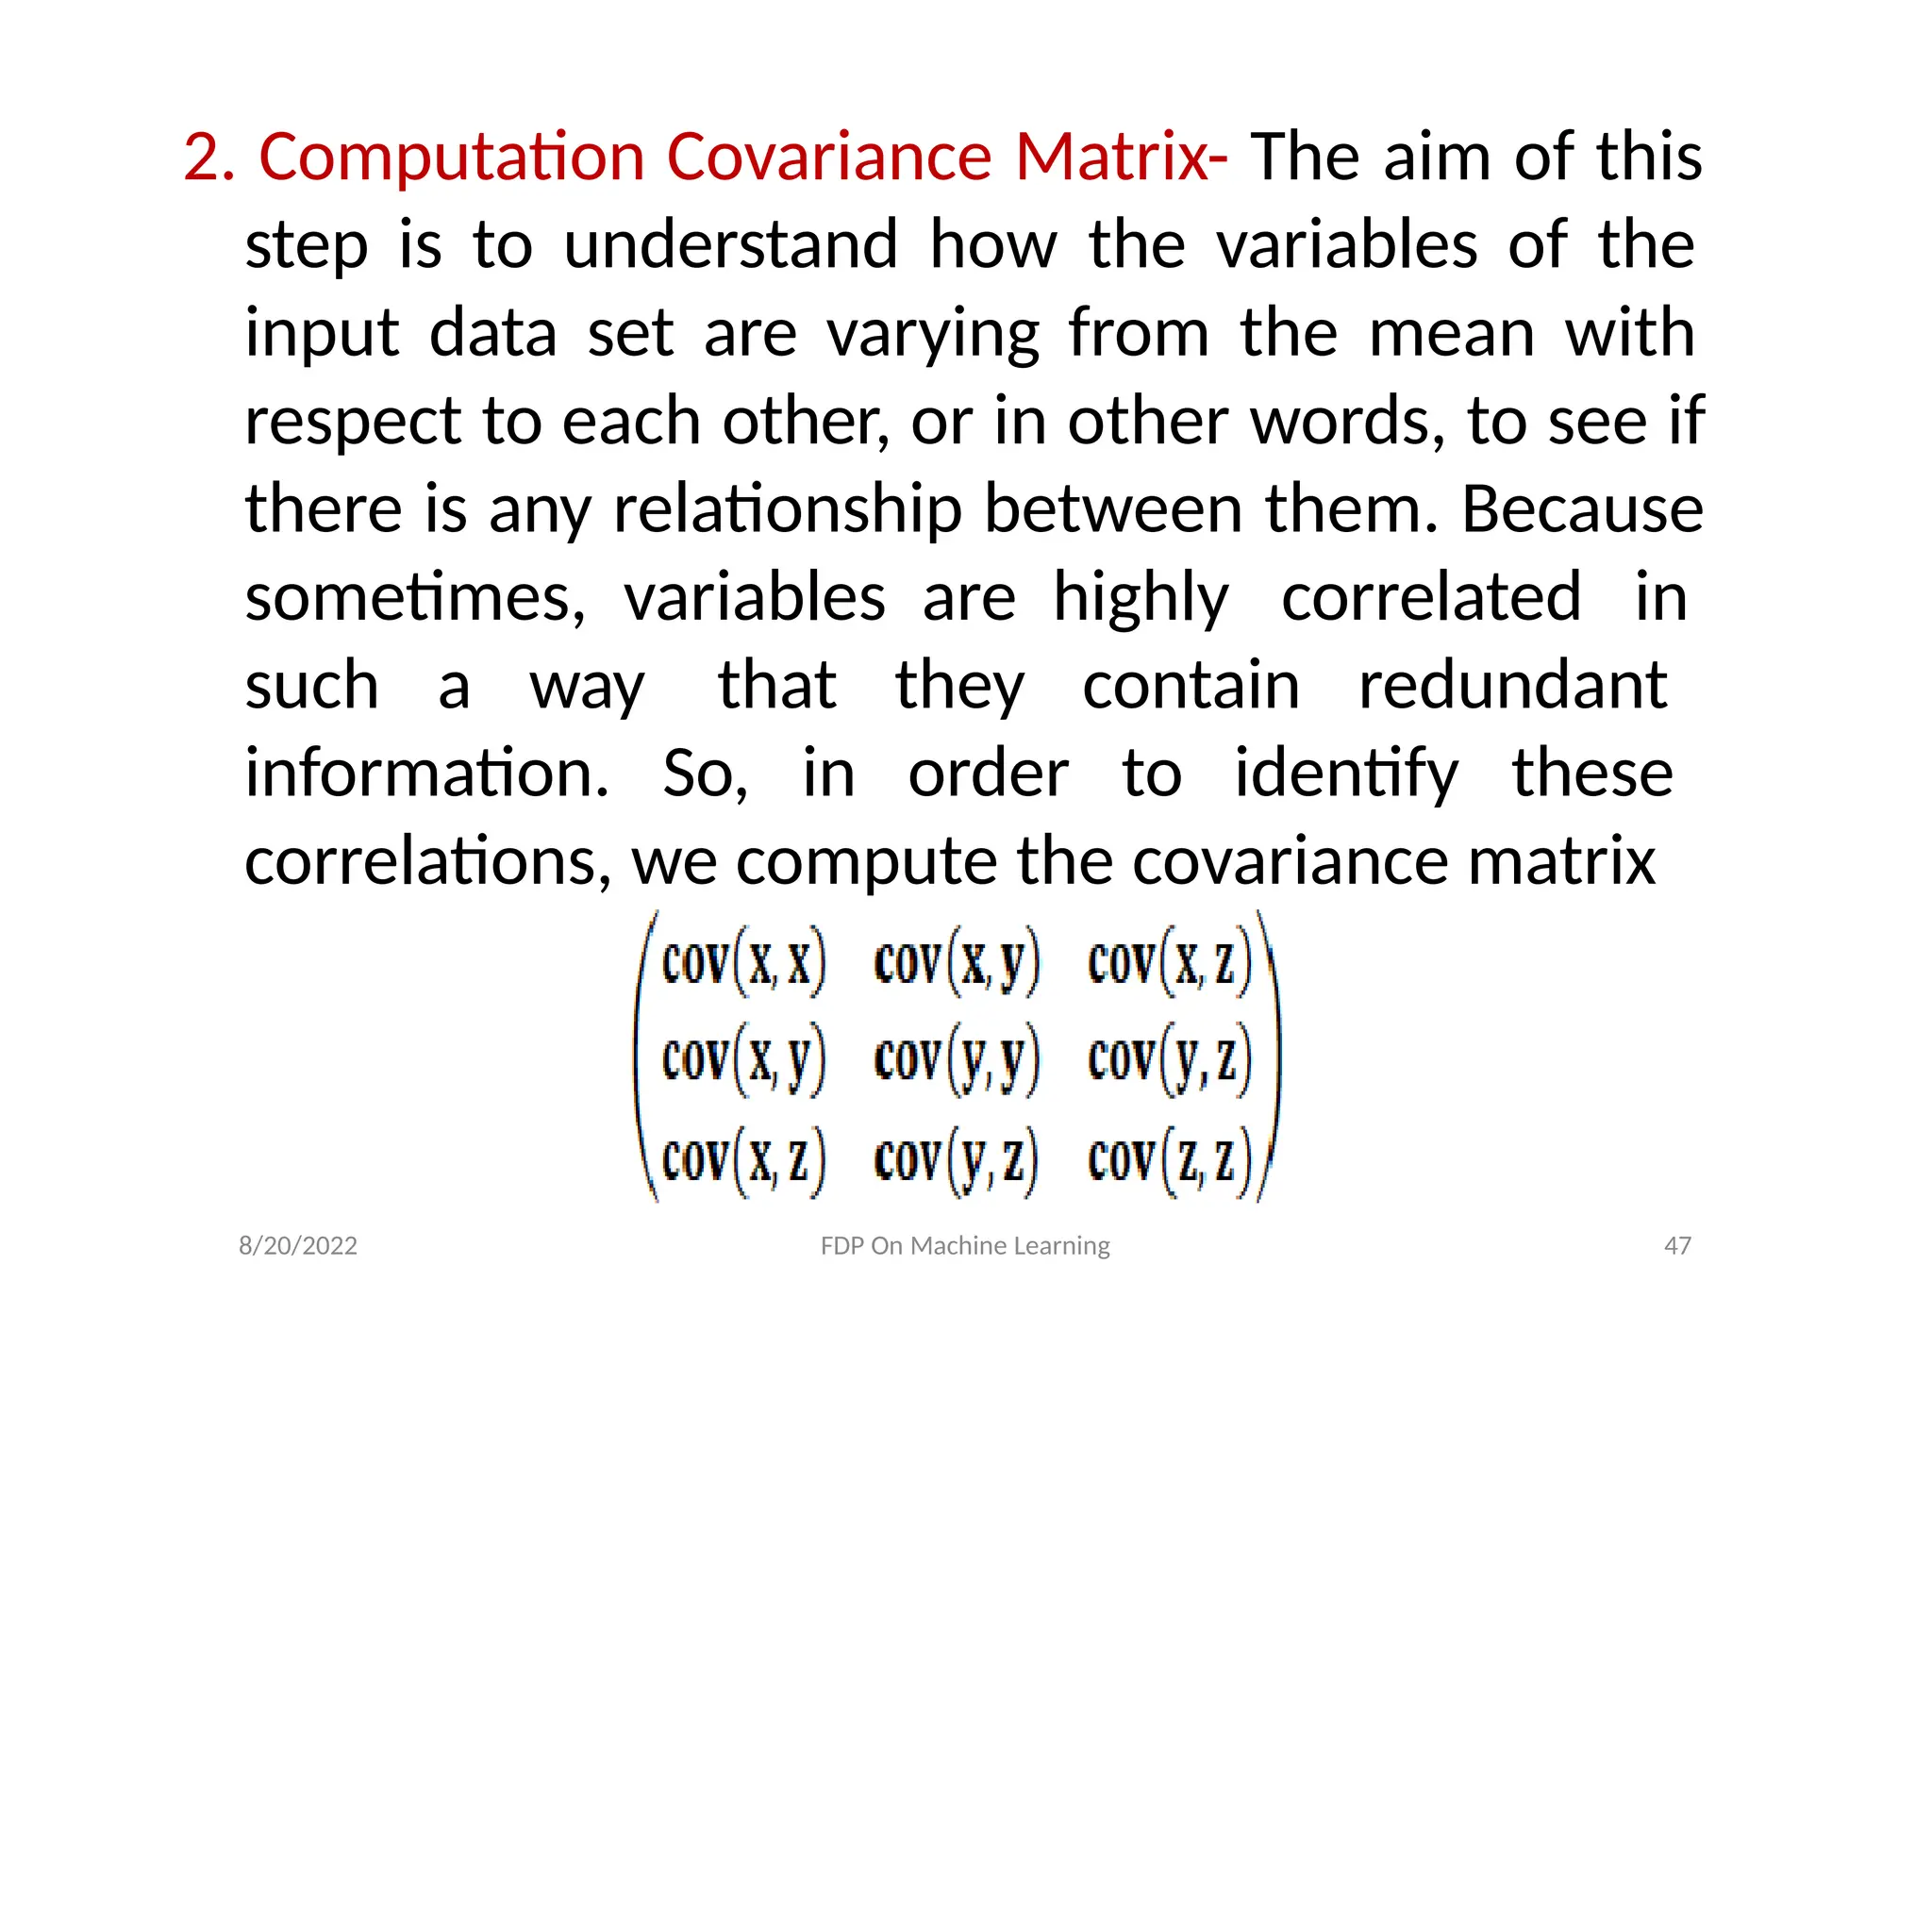
2. Computation CovarianceMatrix- The aim of this
step is to understand how the variables of the
input data set are varying from the mean with
respect to each other, or in other words, to see if
there is any relationship between them. Because
sometimes, variables are highly correlated in
such a way that they contain redundant
information. So, in order to identify these
correlations, we compute the covariance matrix
8/20/2022 FDP On Machine Learning 47
49.
This is asymmetric matrix.
Cov(x, x) = var(x) etc.
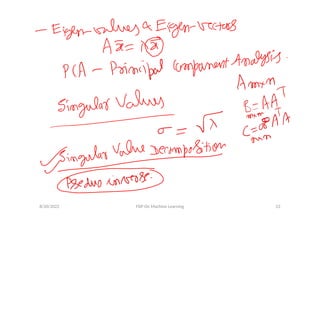
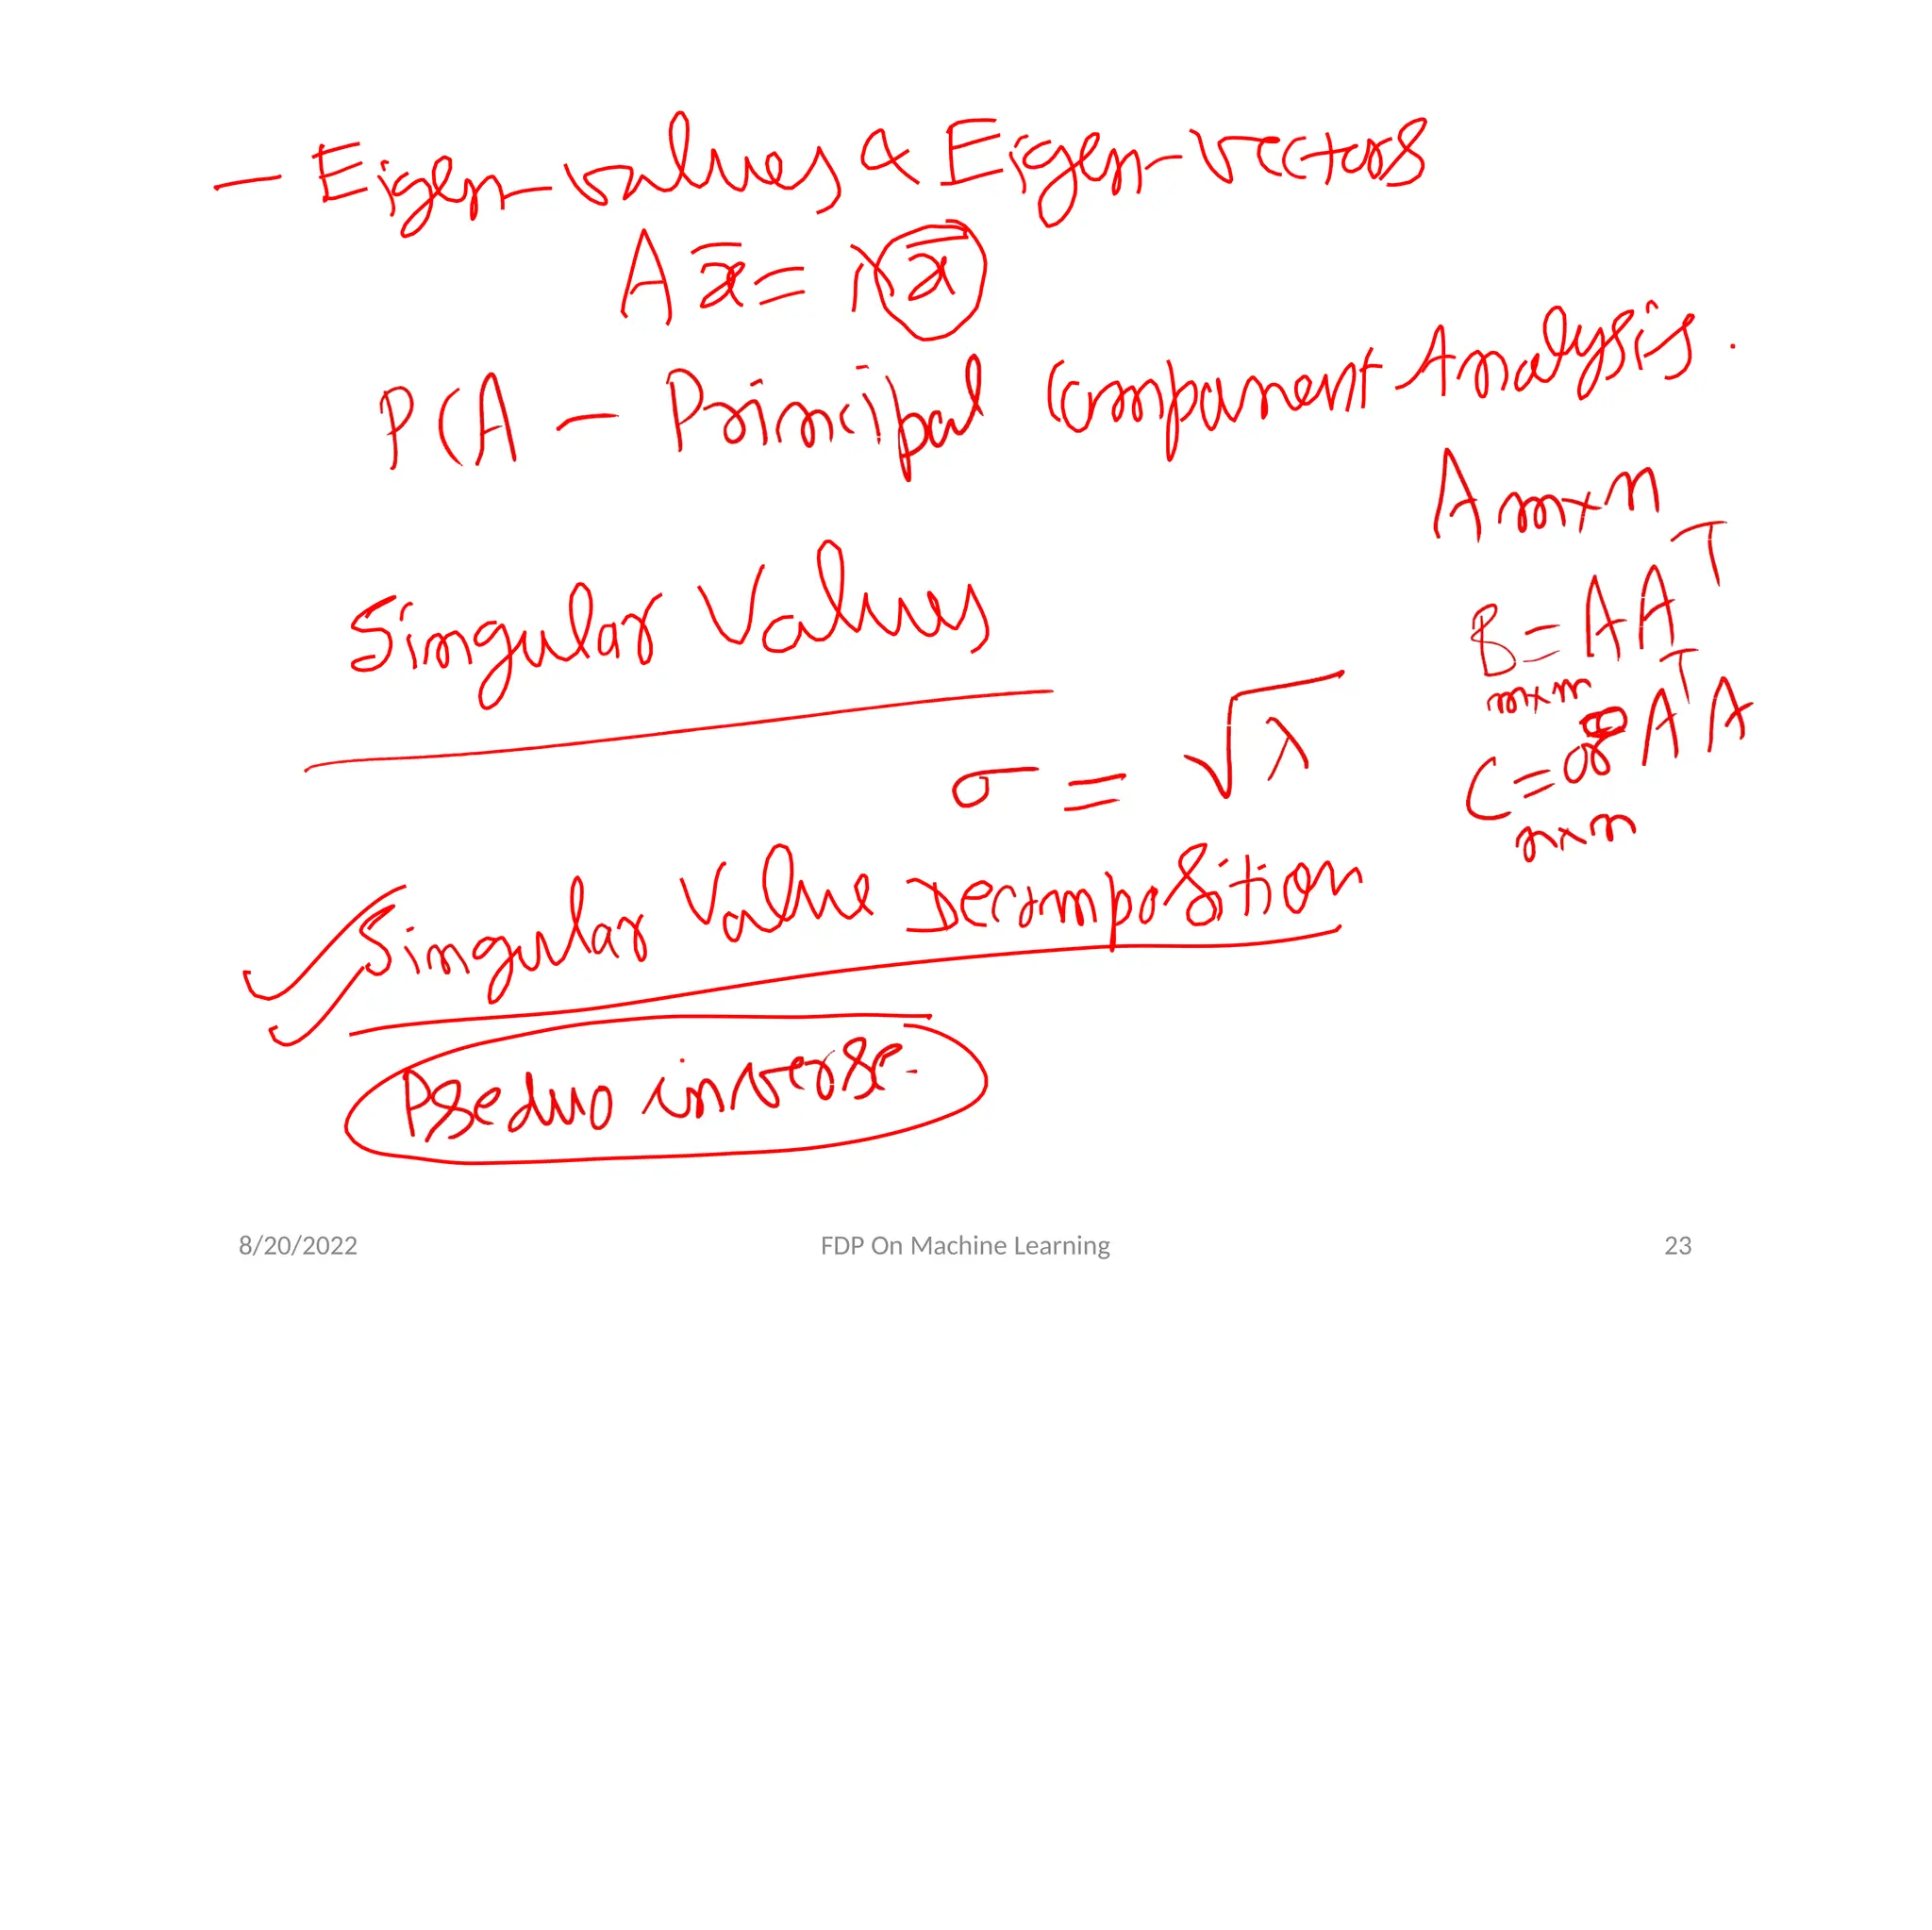
3. Computation of Eigen
values and Eigen Vectors-
Now compute the eigen values and
corresponding eigen vectors of the covariance
matrix (4). You will find some eigen values are very
small in magnitude . Precisely these eigen values
can be neglected. Thus reducing the dimension.
Principal components are new variables that are
constructed as linear combinations or mixtures of
the initial variables. These combinations are done in
such a way that the new variables (i.e., principal
components) are uncorrelated and most of the
information within the initial variables is squeezed
or compressed into the first components.
8/20/2022 FDP On Machine Learning 48
8/20/2022 FDP OnMachine Learning 50
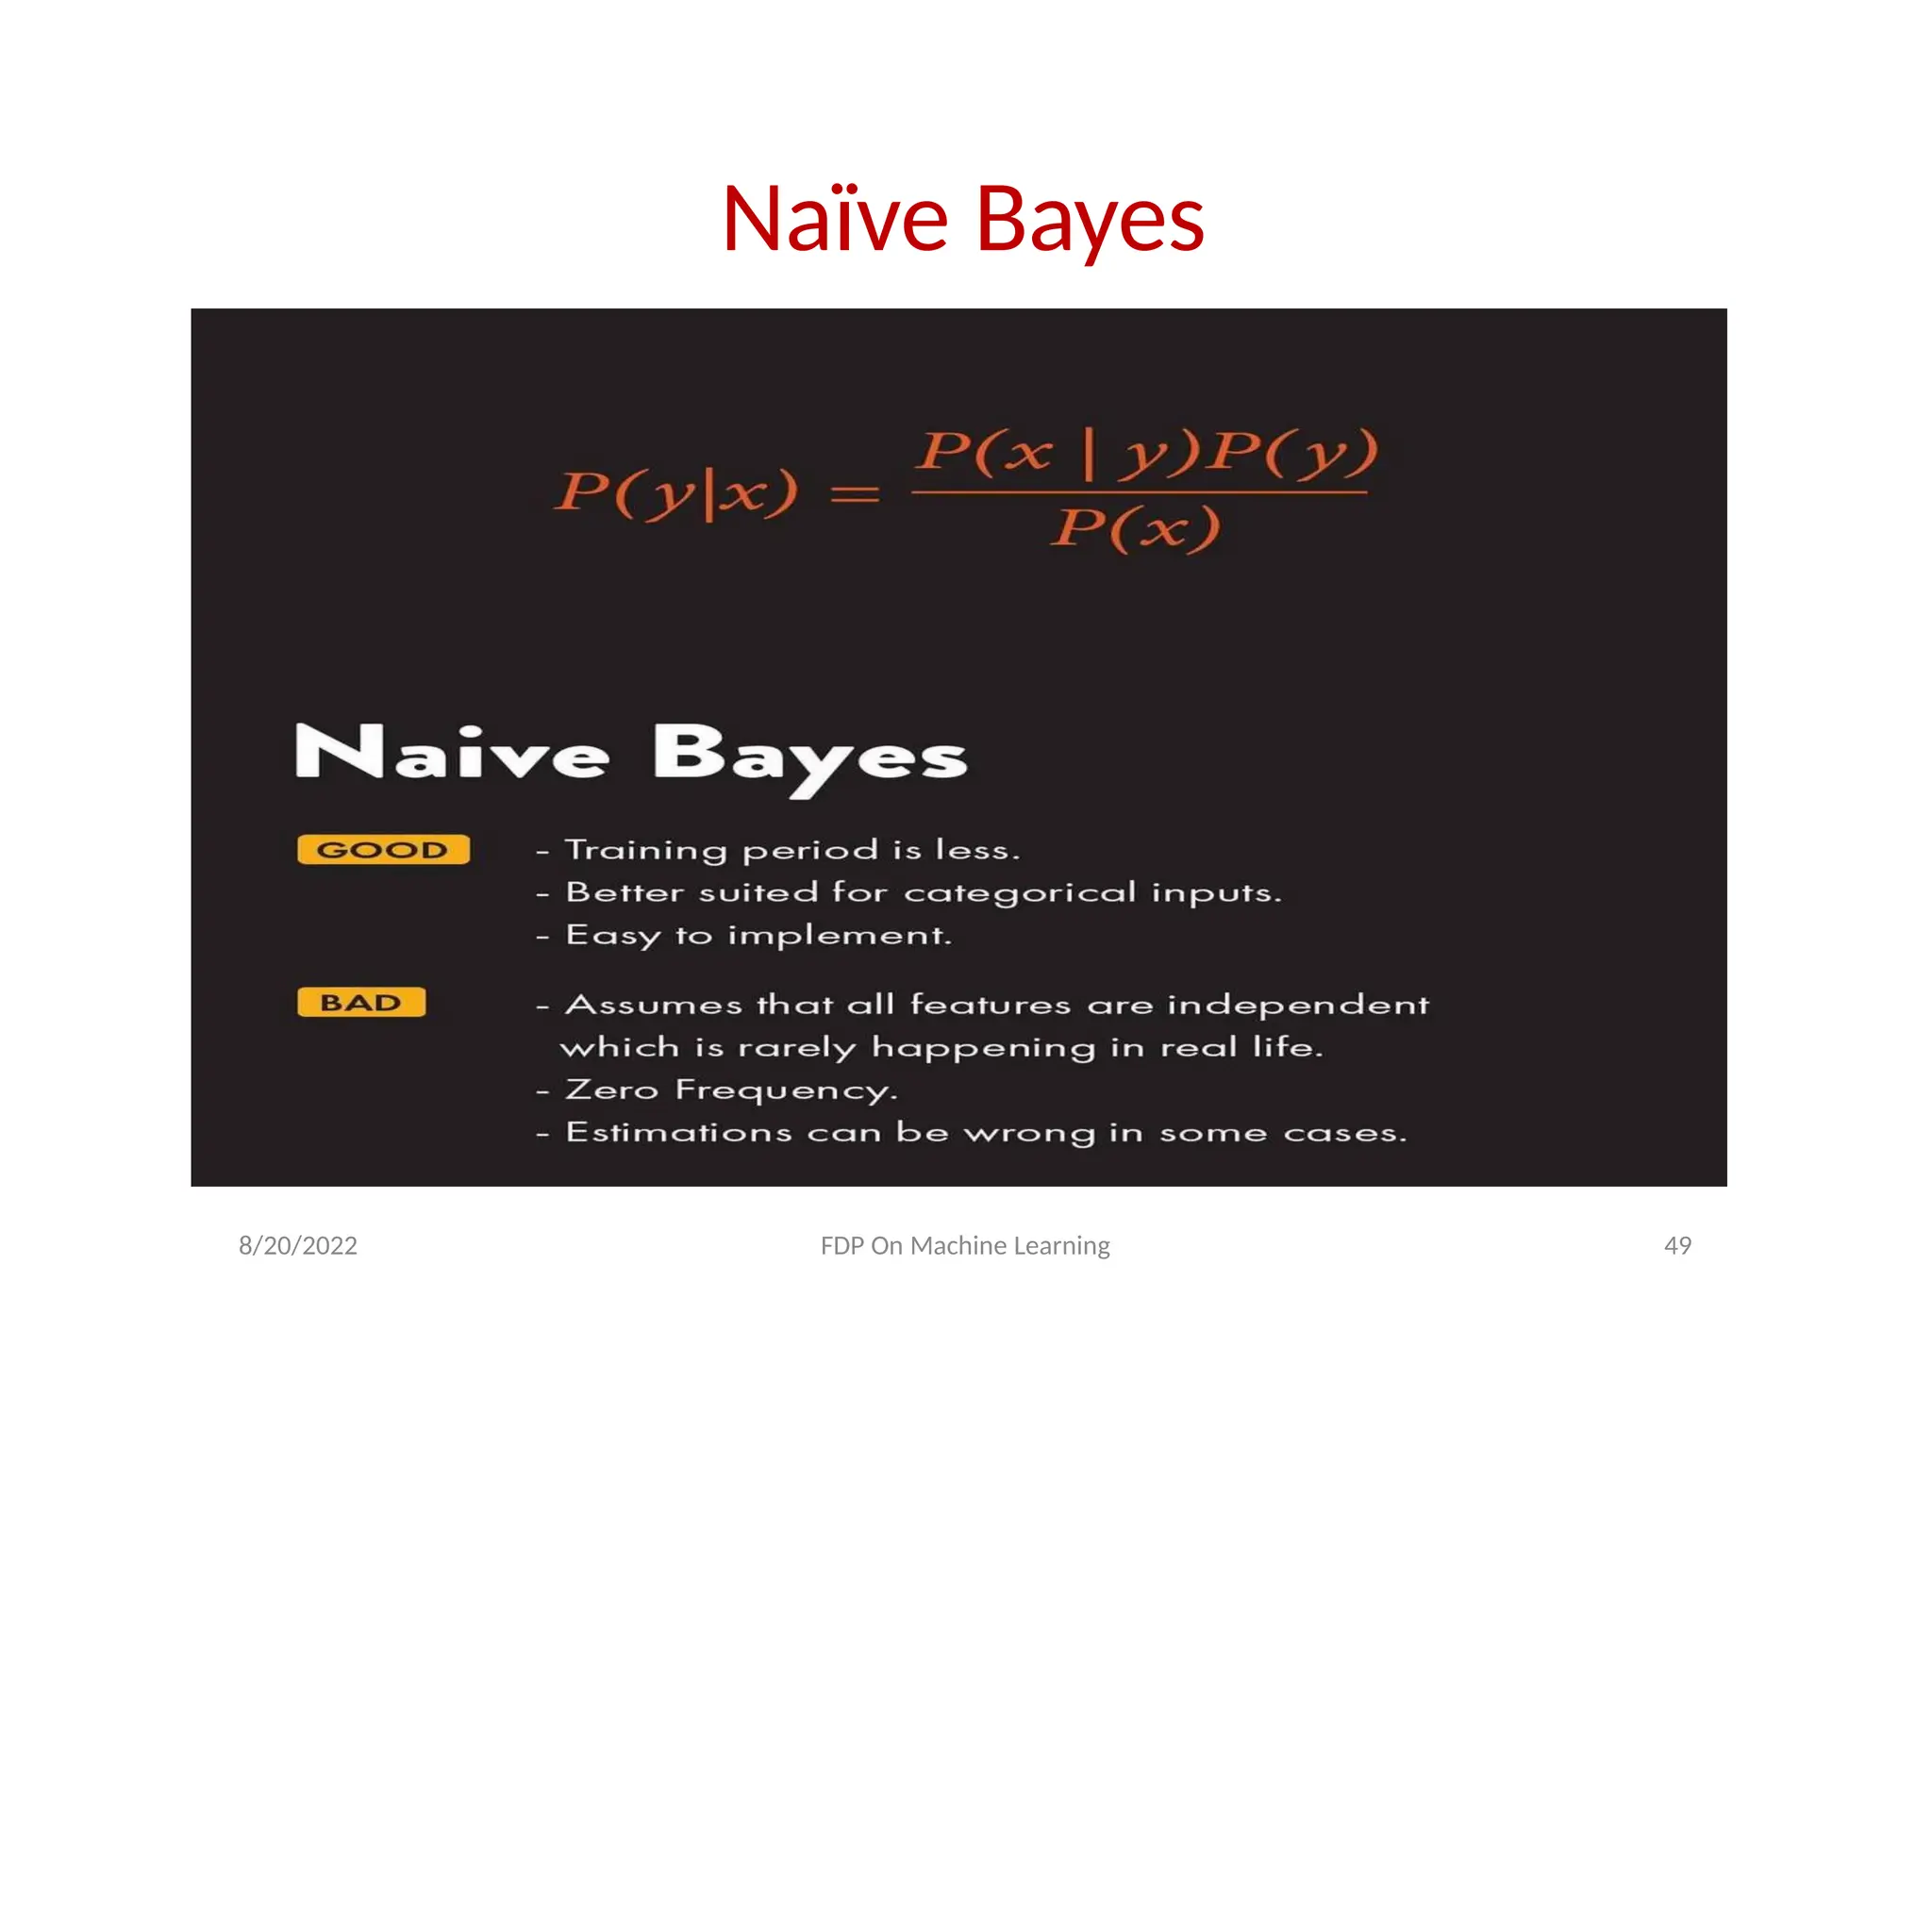
• Naïve Bayes algorithm is a supervised learning algorithm,
which is based on Bayes theorem and used for solving
classification problems.
• It is mainly used in text classification that includes a high-
dimensional training dataset.
• It is a probabilistic classifier, which means it predicts on the
basis of the probability of an object.
The Naïve Bayes algorithm is comprised of two words Naïve and
Bayes, Which can be described as:
• Naïve: It is called Naïve because it assumes that the
occurrence of a certain feature is independent of the
occurrence of other features. Such as if the fruit is identified
on the bases of color, shape, and taste, then red, spherical,
and sweet fruit is recognized as an apple. Hence each feature
individually contributes to identify that it is an apple without
depending on each other.
• Bayes: It is called Bayes because it depends on the principle
of
Bayes theorem .
52.
8/20/2022 FDP OnMachine Learning 51
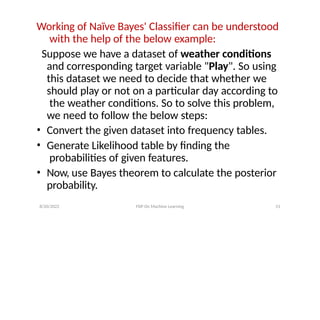
Working of Naïve Bayes' Classifier can be understood
with the help of the below example:
Suppose we have a dataset of weather conditions
and corresponding target variable "Play". So using
this dataset we need to decide that whether we
should play or not on a particular day according to
the weather conditions. So to solve this problem,
we need to follow the below steps:
• Convert the given dataset into frequency tables.
• Generate Likelihood table by finding the
probabilities of given features.
• Now, use Bayes theorem to calculate the posterior
probability.
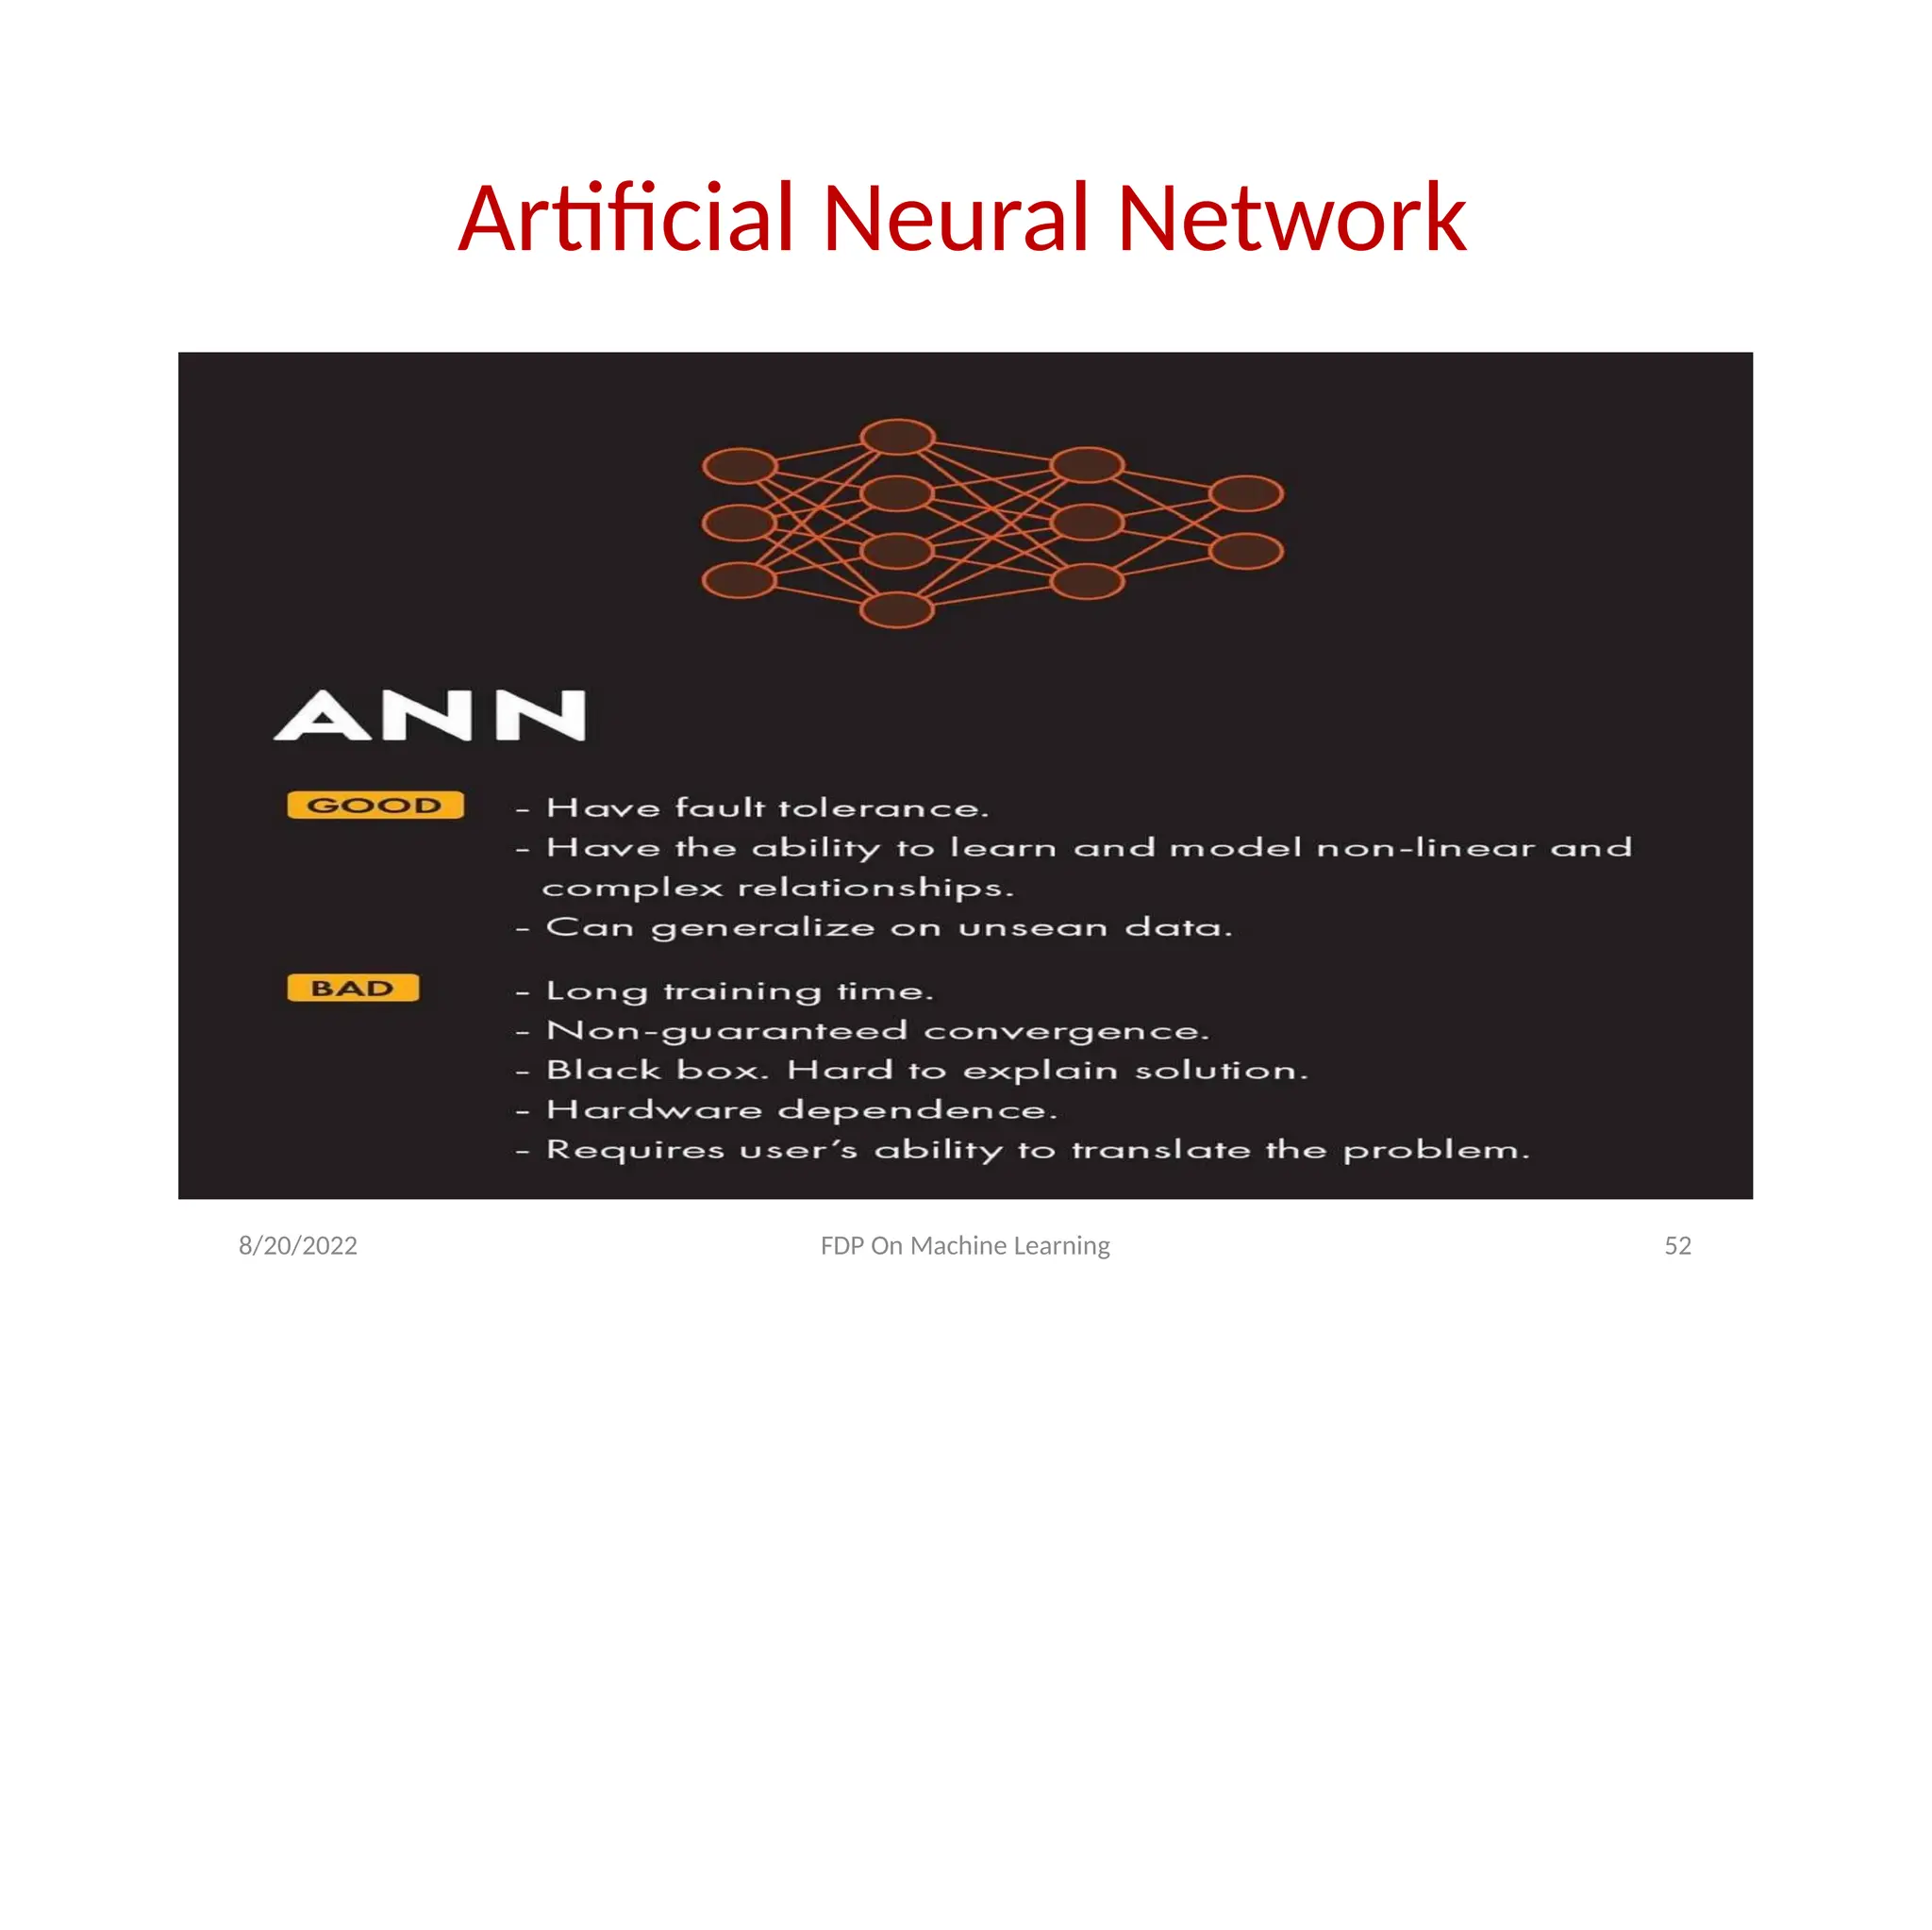
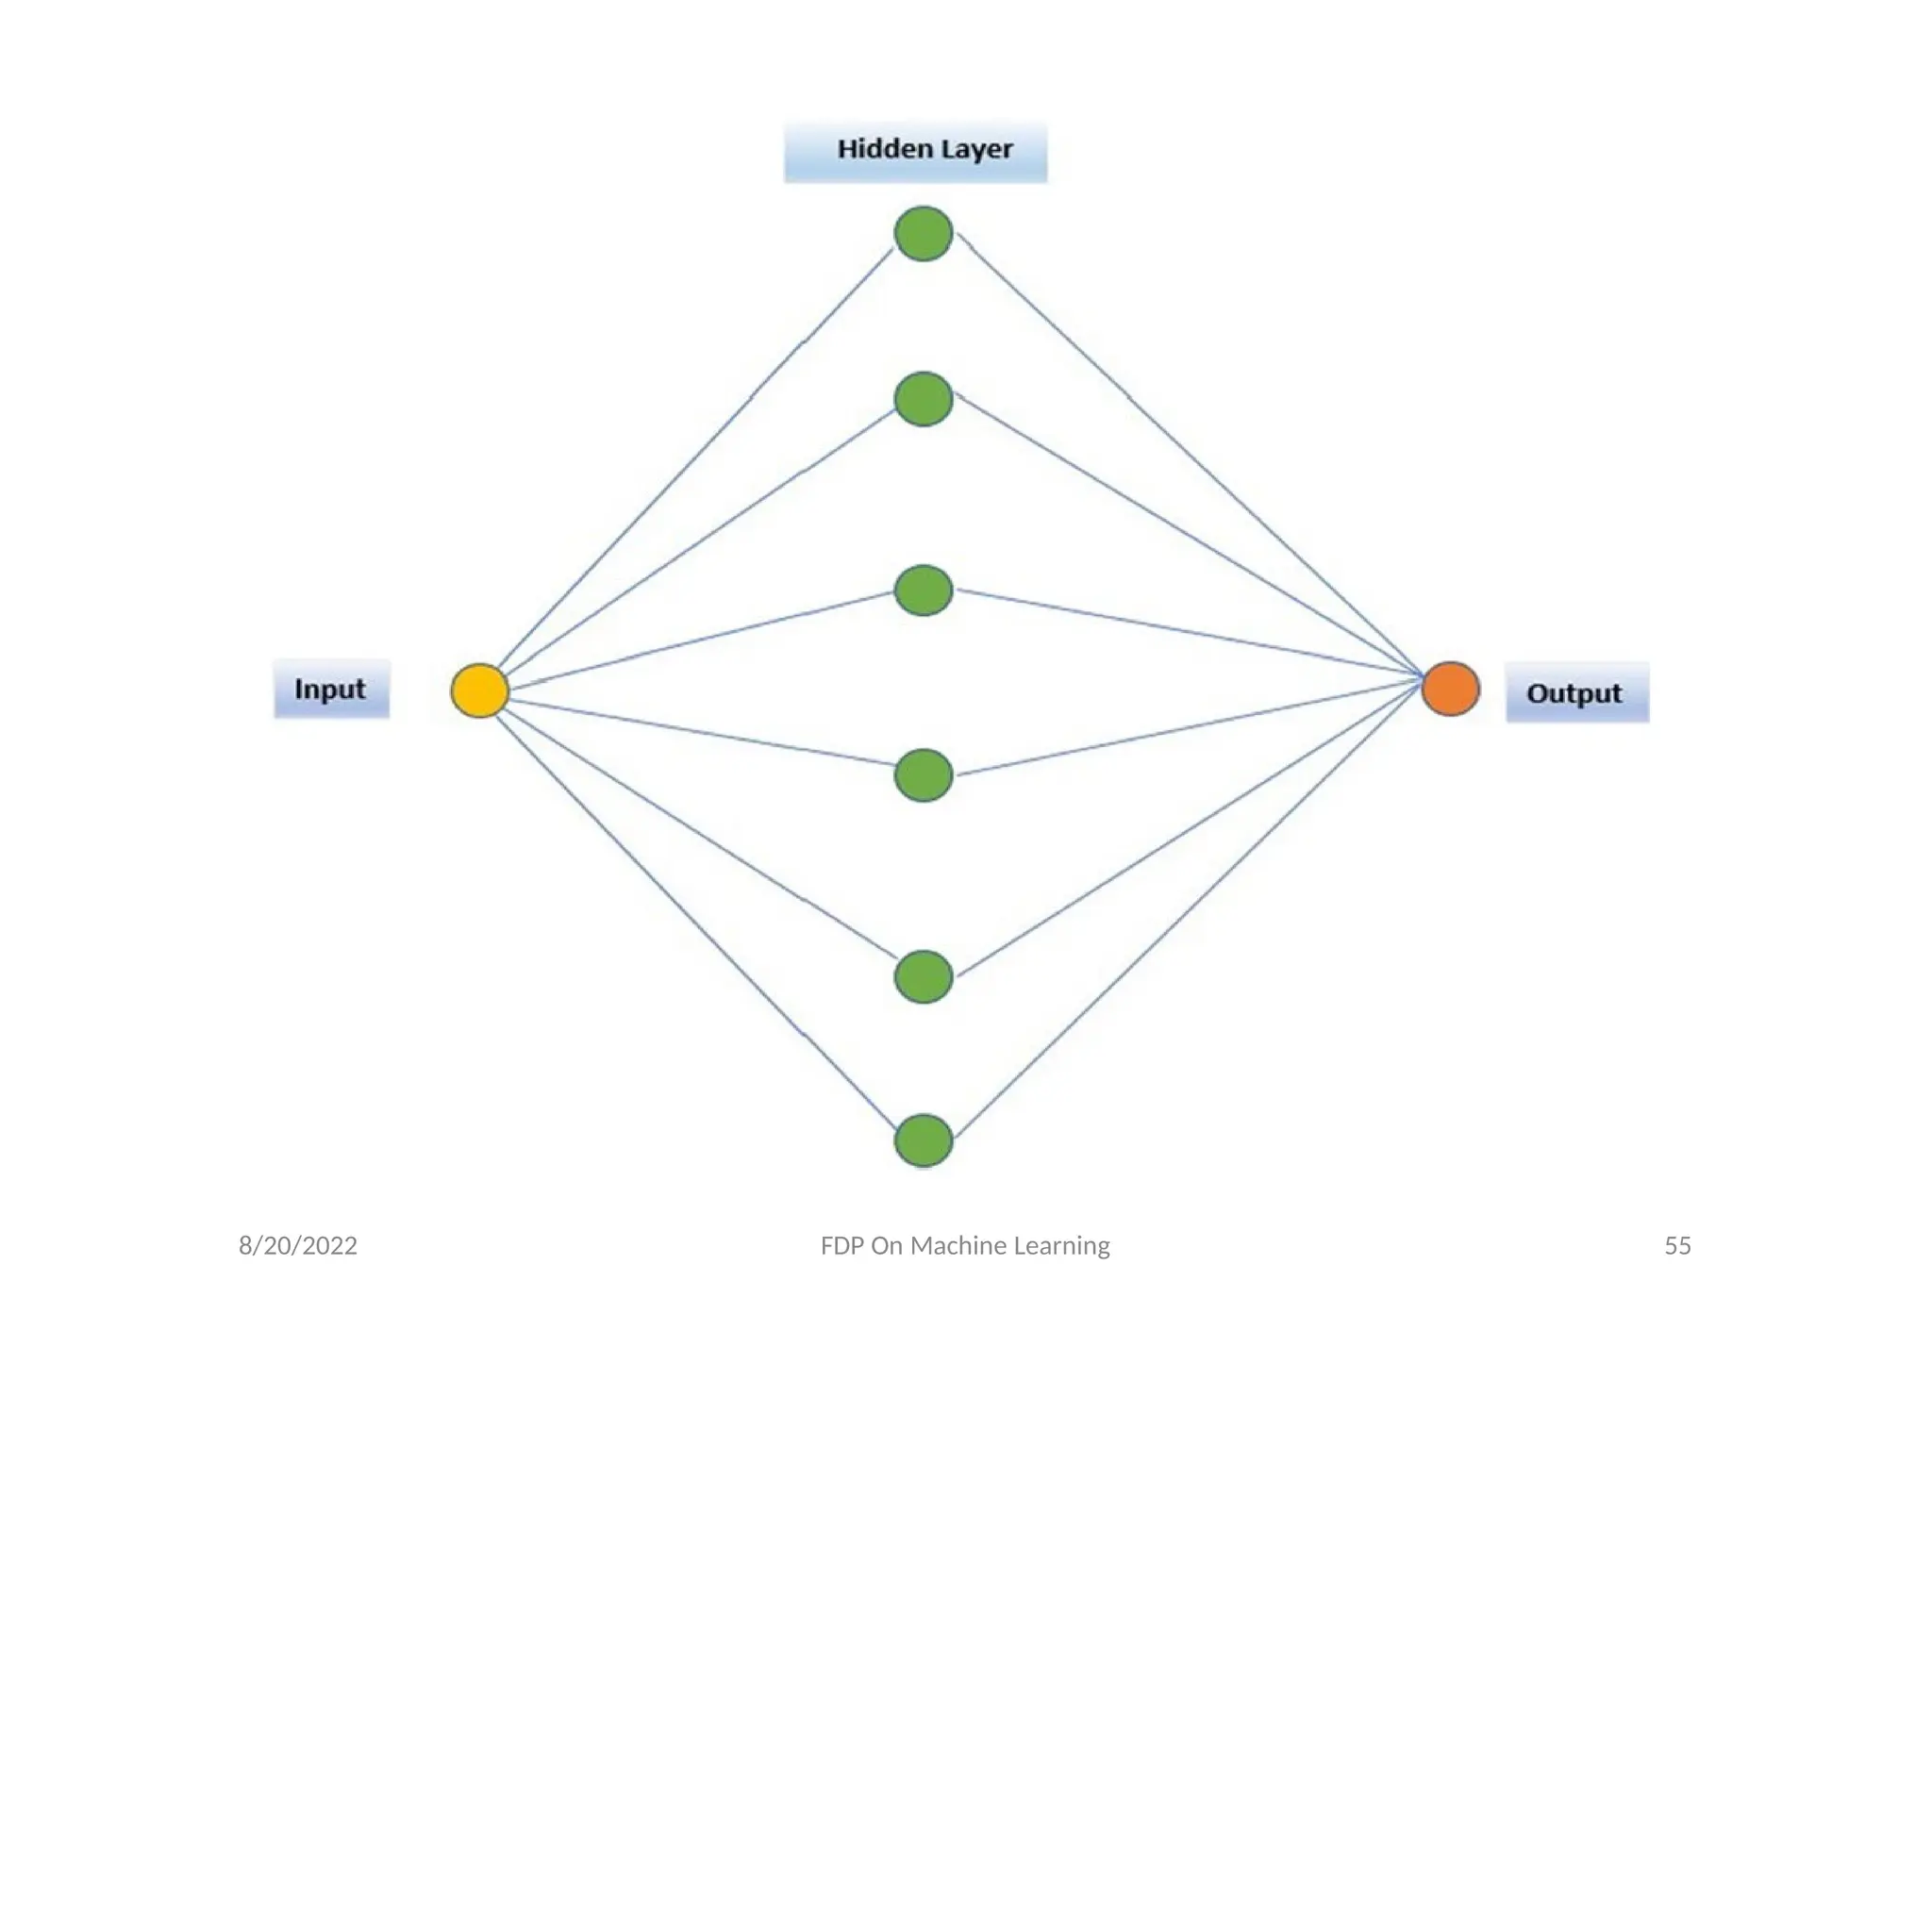
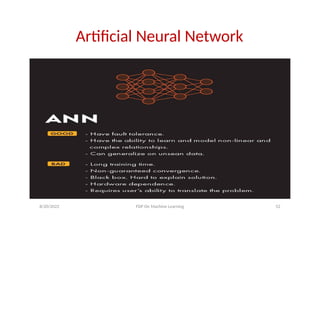
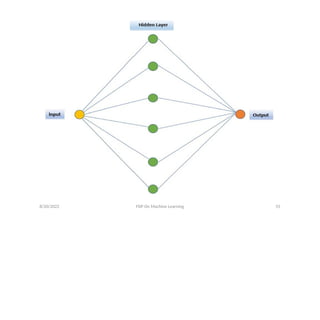
• A neuralnetwork (NN) is a powerful tool for
approximating bounded continuous functions in
machine learning.
• An artificial neural network (ANN) is a computing
system inspired by the complex biological neural
networks (NNs) constituting animal brains.
• The original purpose of constructing an ANN was
to mimic the problem solving process that occurs
in the human brain.
• NNs consist of artificial neurons (simplified
biological neurons) and connections (also called
edges) of artificial neurons (simplified
synapses).
8/20/2022 FDP On Machine Learning 53
55.
8/20/2022 FDP OnMachine Learning 54
• The output of each neuron is a non-linear
bounded function of the weighted sum of its
inputs.
• The neurons are usually arranged into layers,
where connections are established between
layers.
Reference
s
1. J.M. Phillips“ Mathematical Foundations for
Data Analysis “ (2018)
2. R. C. Mittal “Some Applications of Linear
Algebra in Computer Science” https://
www.researchgate.net/publication/3
52180145_Some_ApplicAtionS_of_lineAr_Alg
ebrA_in_computer_Science
3. G. Strang , “Introduction to Linear
Algebra” MIT Publication (2016)
58.
8/20/2022 FDP OnMachine Learning 57
4.R. C. Mittal, “Essentials of Mathematics in Data
Science” https://
www.researchgate.net/publication/3597
30625_Essentials_of_Mathematics_in_Data_Scie
nce
5.V. S. Joshi, “ Artificial Intelligence and Machine
Learning: A Primer”, e-book
6. CBSE and IBM Notes on Artificial Intelligence
7.Michael U. Gutmann, “Pen & Paper Exercises in
Machine Learning” e-book
59.
8/20/2022 FDP OnMachine Learning 58
8.Statistics and Probability for Data Science
available at www.DataCleanic.ml
9.Source of Some of Pictorial Slides –
Machinelearning Group in www.linkedin.com
(followed Hashtags)


![• Logistic Function(Sigmoid Function)-
f(x) =
It maps real values between 0 and 1, indicating
probabilities.
We assume a linear regression of type
log [ ] = b
0 + b1x1+……+bnxn
Here y =
8/20/2022 FDP On Machine Learning 31](https://image.slidesharecdn.com/fdpmachinelearning-251012110559-bcf0af21/85/FDP-and-Machine-Learning-for-faculty-pptx-32-320.jpg)


![Principal Component Analysis, or PCA, is a
dimensionality-reduction method that is often
used to reduce the dimensionality of large data
sets, by transforming a large set of variables into
a smaller one that still contains most of the
information in the large set.
Following steps are used in PCA
(1) Normalization of Data – Compute the mean
Now normalize the data in [0,1] by using
formula
z =
8/20/2022 FDP On Machine Learning 46](https://image.slidesharecdn.com/fdpmachinelearning-251012110559-bcf0af21/85/FDP-and-Machine-Learning-for-faculty-pptx-47-320.jpg)


![• Logistic Function(Sigmoid Function)-
f(x) =
It maps real values between 0 and 1, indicating
probabilities.
We assume a linear regression of type
log [ ] = b
0 + b1x1+……+bnxn
Here y =
8/20/2022 FDP On Machine Learning 31](https://image.slidesharecdn.com/fdpmachinelearning-251012110559-bcf0af21/75/FDP-and-Machine-Learning-for-faculty-pptx-32-2048.jpg)


![Principal Component Analysis, or PCA, is a
dimensionality-reduction method that is often
used to reduce the dimensionality of large data
sets, by transforming a large set of variables into
a smaller one that still contains most of the
information in the large set.
Following steps are used in PCA
(1) Normalization of Data – Compute the mean
Now normalize the data in [0,1] by using
formula
z =
8/20/2022 FDP On Machine Learning 46](https://image.slidesharecdn.com/fdpmachinelearning-251012110559-bcf0af21/75/FDP-and-Machine-Learning-for-faculty-pptx-47-2048.jpg)