ALGORITHMS AND FLOWCHARTS
A typical programming task can be divided into
two phases:
Problem solving phase
produce an ordered sequence of steps that describe
solution of problem
this sequence of steps is called an algorithm
Implementation phase
implement the program in some programming
language
3.
Steps in ProblemSolving
First produce a general algorithm (one can use
pseudocode)
Refine the algorithm successively to get step by
step detailed algorithm that is very close to a
computer language.
Pseudocode is an artificial and informal
language that helps programmers develop
algorithms. Pseudocode is very similar to
everyday English.
4.
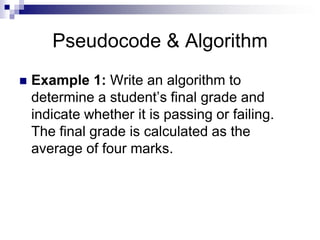
Pseudocode & Algorithm
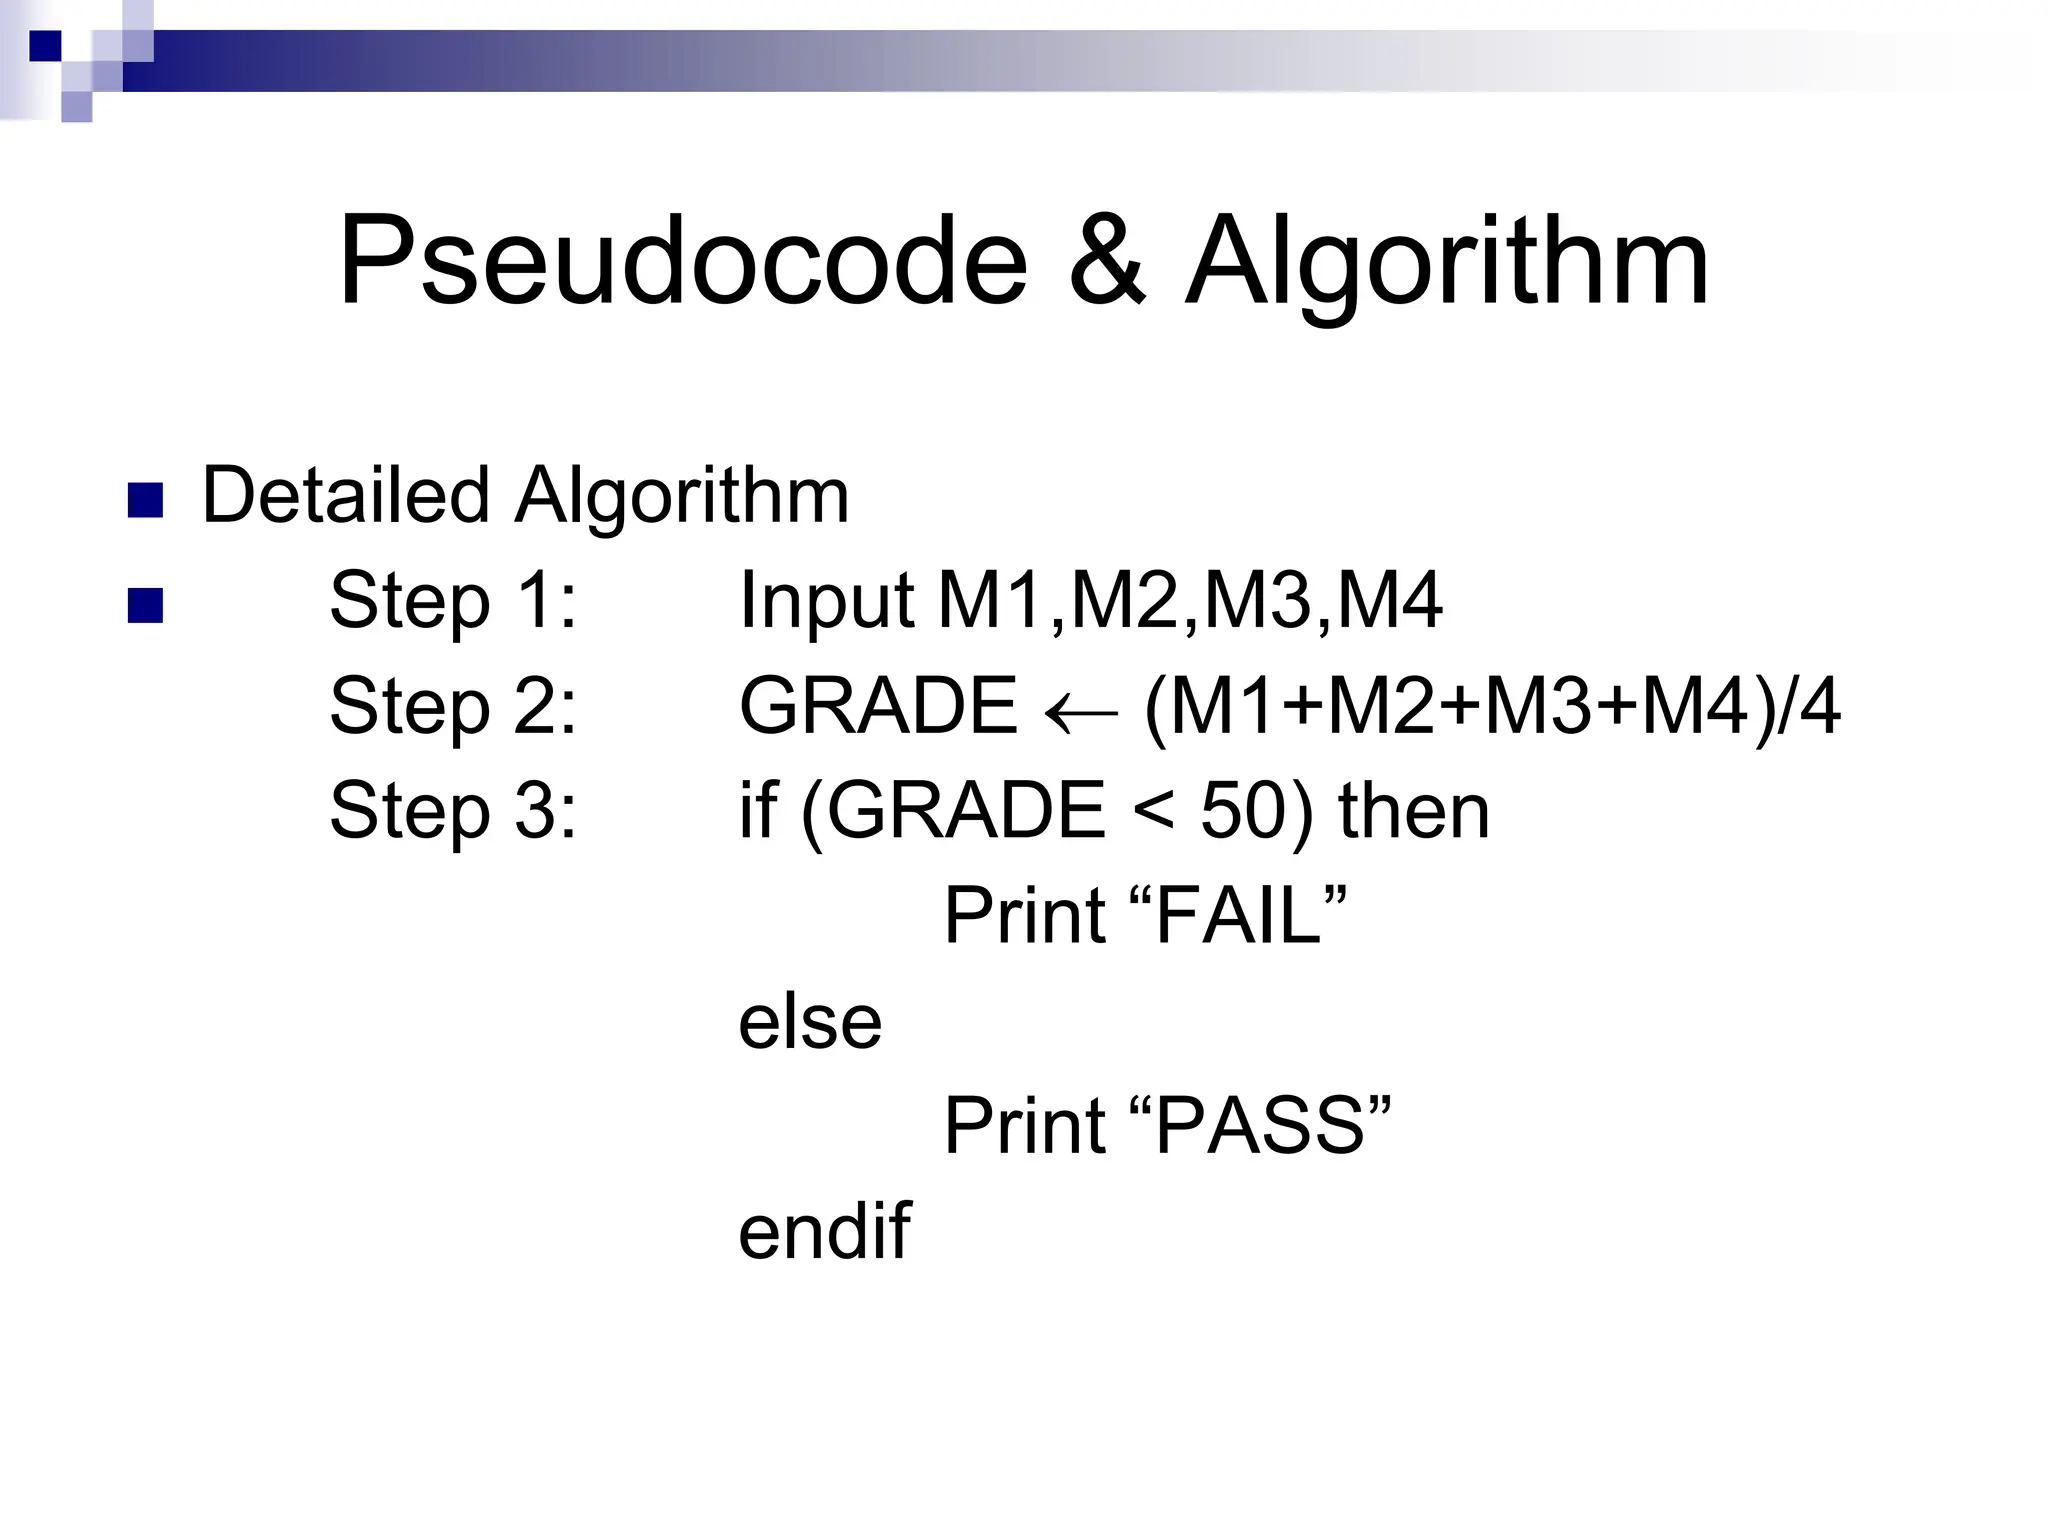
Example 1: Write an algorithm to
determine a student’s final grade and
indicate whether it is passing or failing.
The final grade is calculated as the
average of four marks.
5.
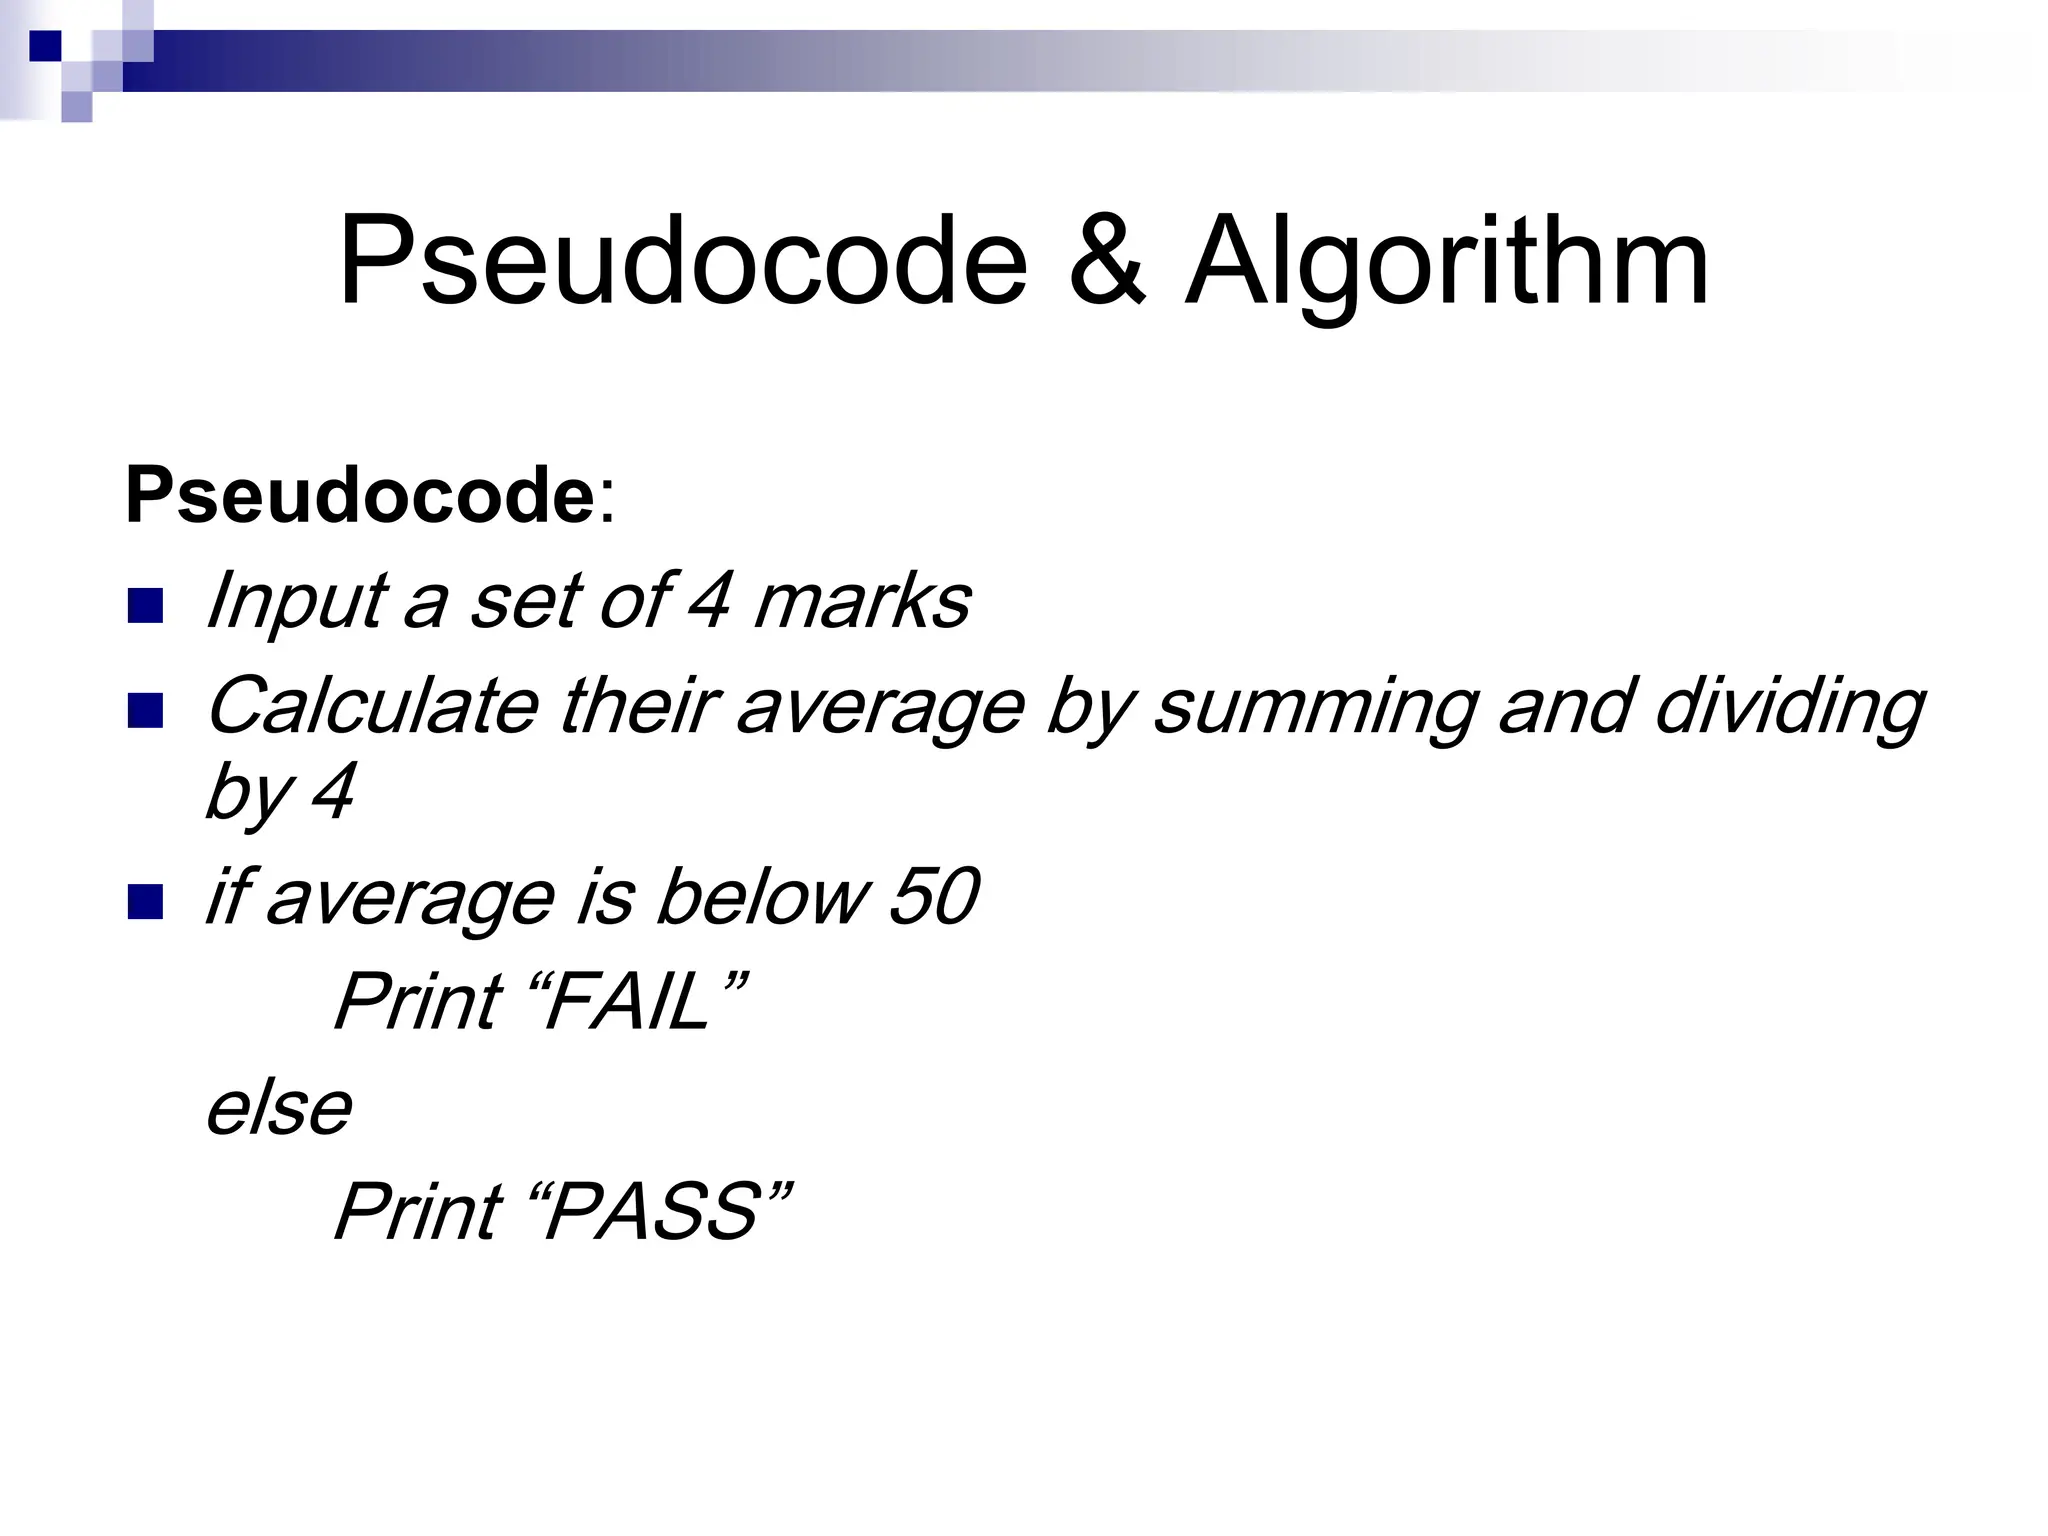
Pseudocode & Algorithm
Pseudocode:
Input a set of 4 marks
Calculate their average by summing and dividing
by 4
if average is below 50
Print “FAIL”
else
Print “PASS”
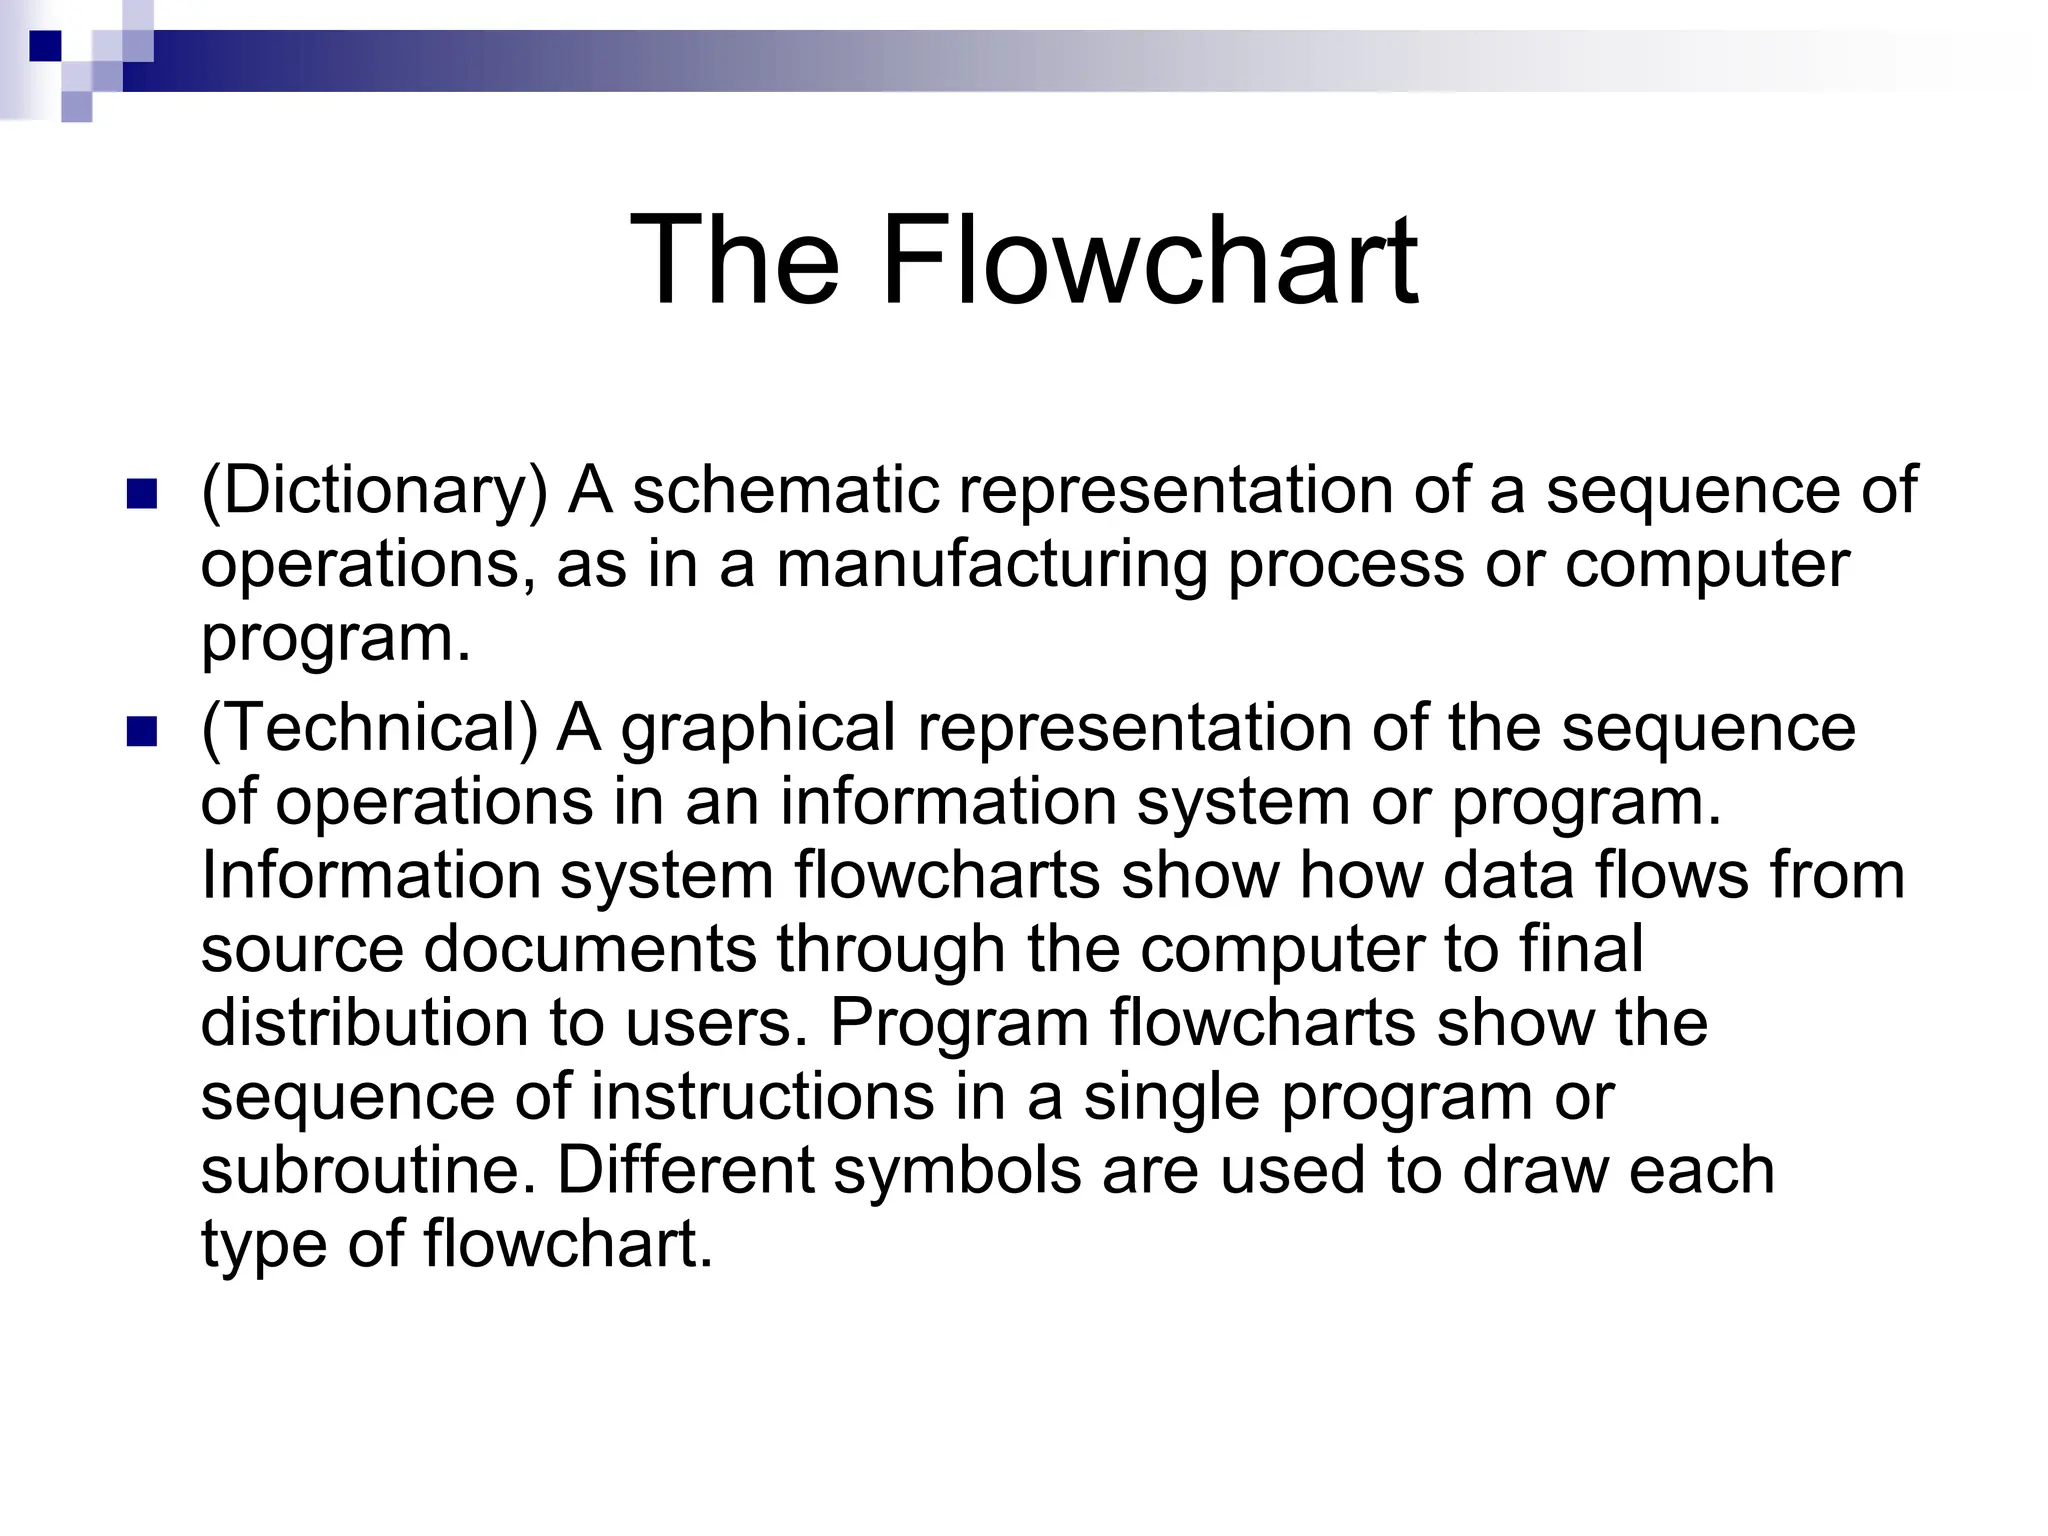
The Flowchart
(Dictionary)A schematic representation of a sequence of
operations, as in a manufacturing process or computer
program.
(Technical) A graphical representation of the sequence
of operations in an information system or program.
Information system flowcharts show how data flows from
source documents through the computer to final
distribution to users. Program flowcharts show the
sequence of instructions in a single program or
subroutine. Different symbols are used to draw each
type of flowchart.
8.
The Flowchart
A Flowchart
showslogic of an algorithm
emphasizes individual steps and their
interconnections
e.g. control flow from one action to the next
9.
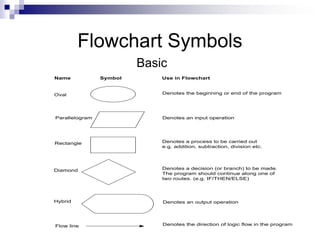
Flowchart Symbols
Basic
Oval
Parallelogram
Rectangle
Diamond
Hybrid
Name SymbolUse in Flowchart
Denotes the beginning or end of the program
Denotes an input operation
Denotes an output operation
Denotes a decision (or branch) to be made.
The program should continue along one of
two routes. (e.g. IF/THEN/ELSE)
Denotes a process to be carried out
e.g. addition, subtraction, division etc.
Flow line Denotes the direction of logic flow in the program
10.
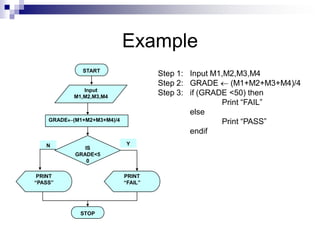
Example
PRINT
“PASS”
Step 1: InputM1,M2,M3,M4
Step 2: GRADE (M1+M2+M3+M4)/4
Step 3: if (GRADE <50) then
Print “FAIL”
else
Print “PASS”
endif
START
Input
M1,M2,M3,M4
GRADE(M1+M2+M3+M4)/4
IS
GRADE<5
0
PRINT
“FAIL”
STOP
Y
N
11.
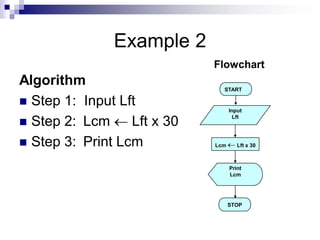
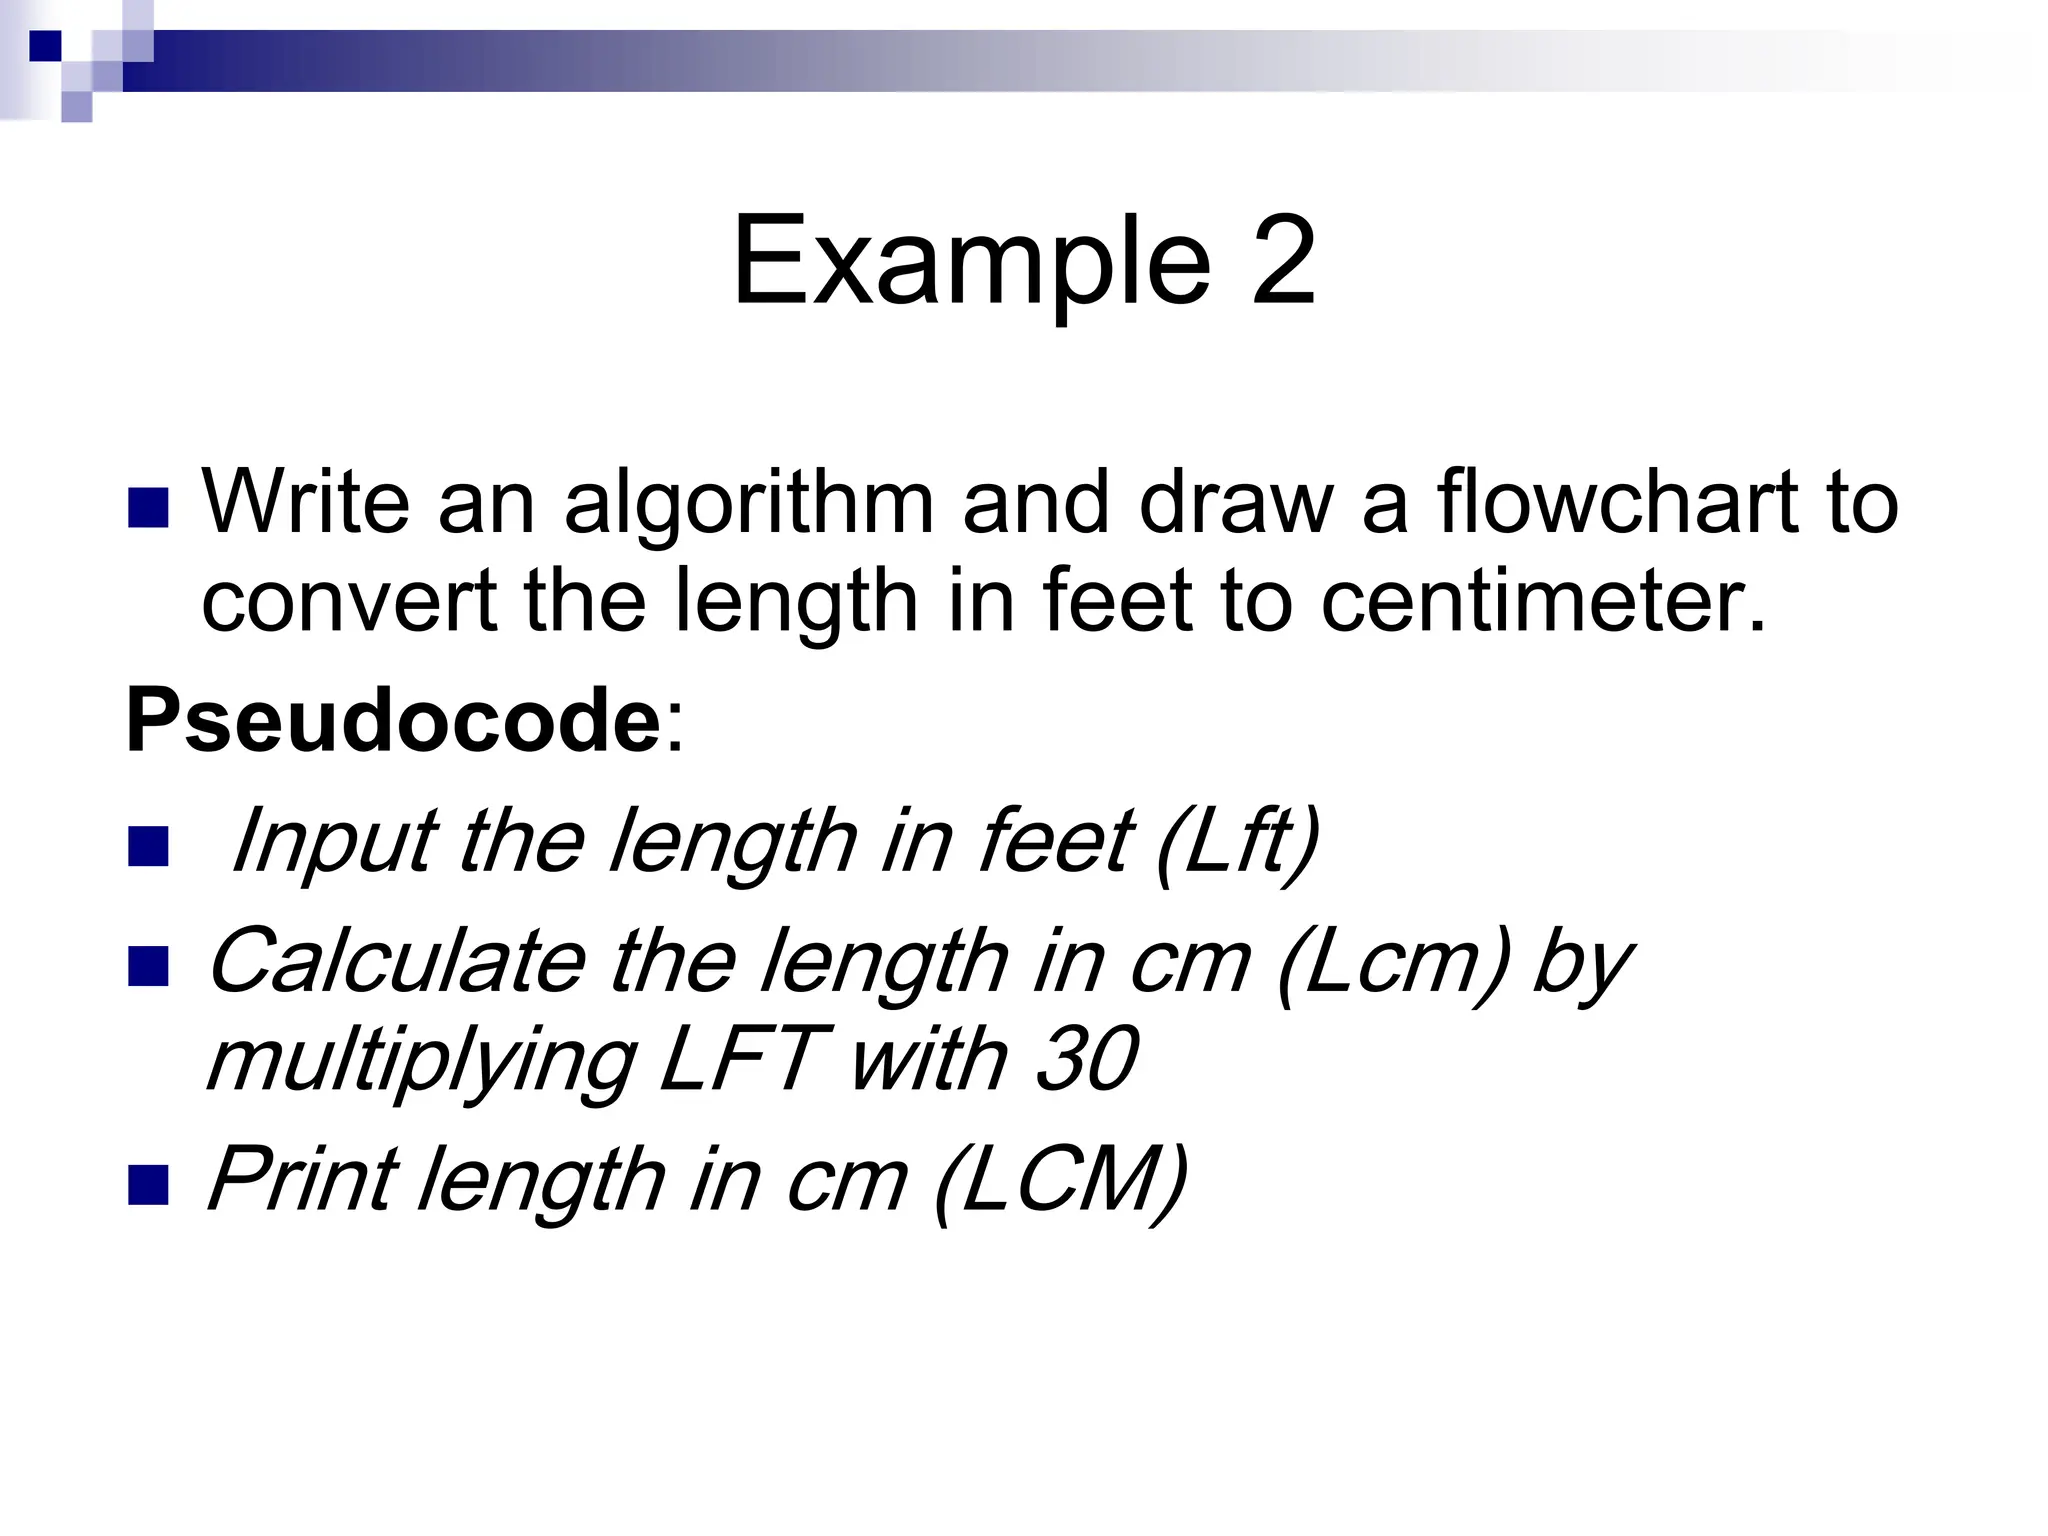
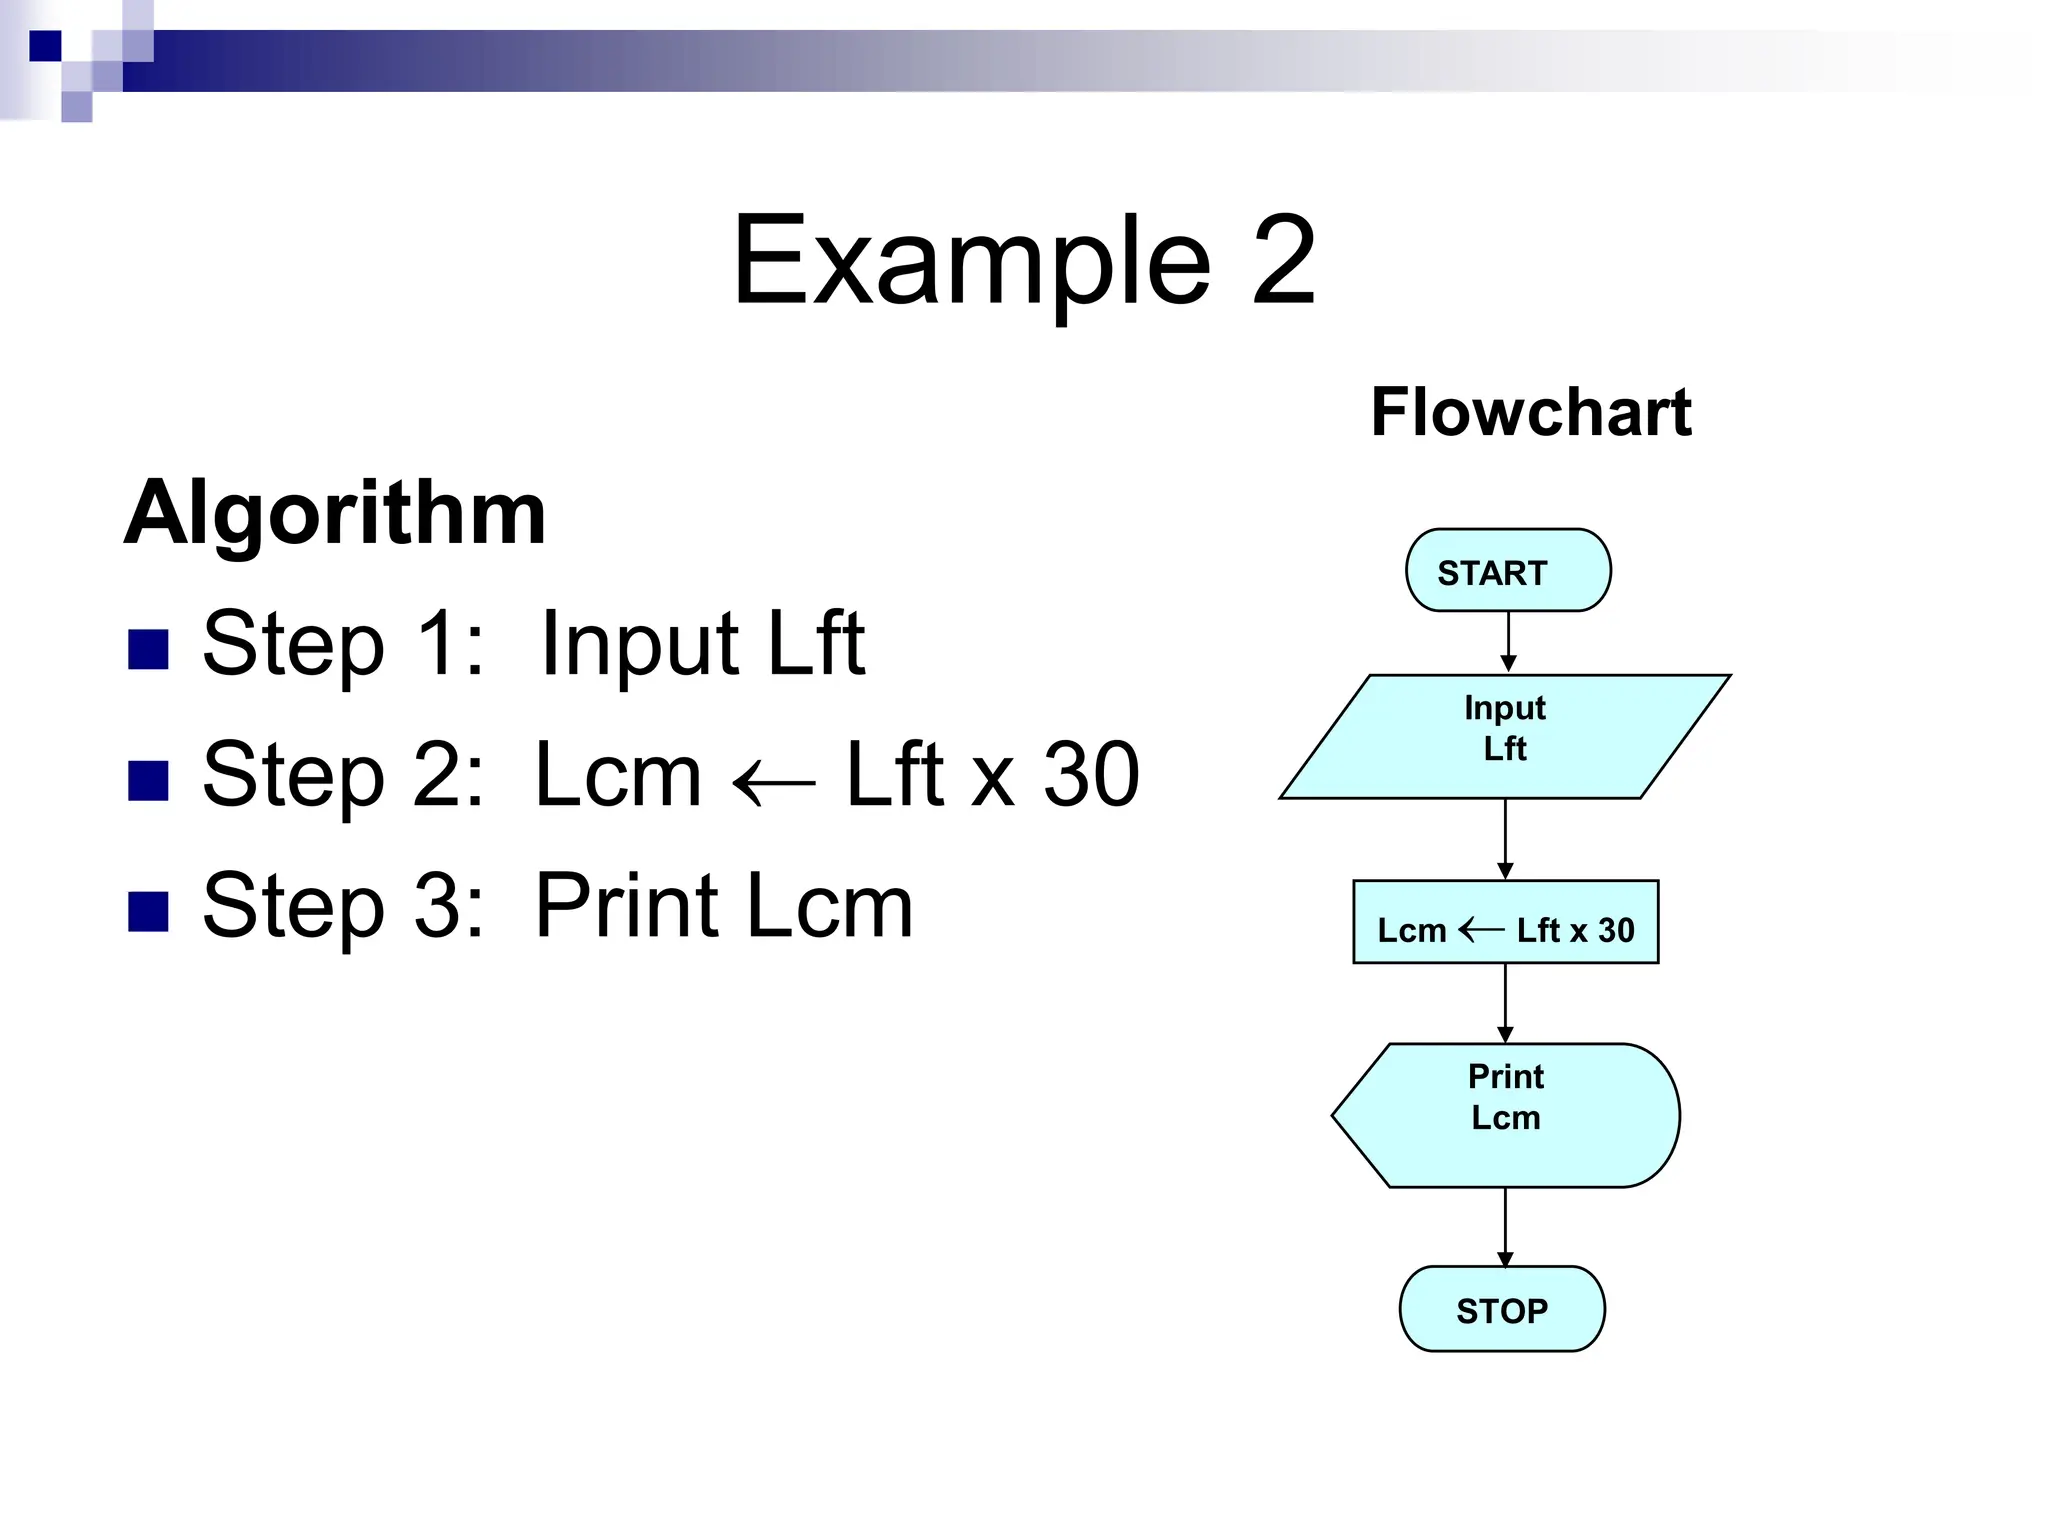
Example 2
Writean algorithm and draw a flowchart to
convert the length in feet to centimeter.
Pseudocode:
Input the length in feet (Lft)
Calculate the length in cm (Lcm) by
multiplying LFT with 30
Print length in cm (LCM)
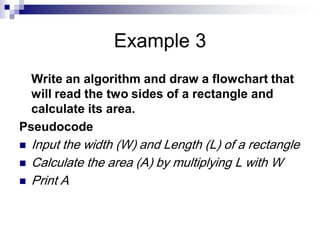
Example 3
Write analgorithm and draw a flowchart that
will read the two sides of a rectangle and
calculate its area.
Pseudocode
Input the width (W) and Length (L) of a rectangle
Calculate the area (A) by multiplying L with W
Print A
14.
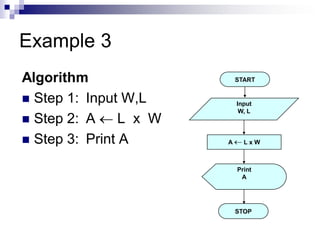
Example 3
Algorithm
Step1: Input W,L
Step 2: A L x W
Step 3: Print A
START
Input
W, L
A L x W
Print
A
STOP
15.
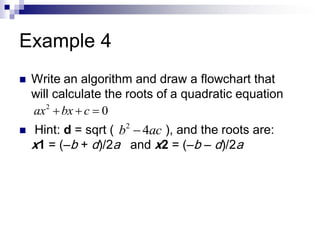
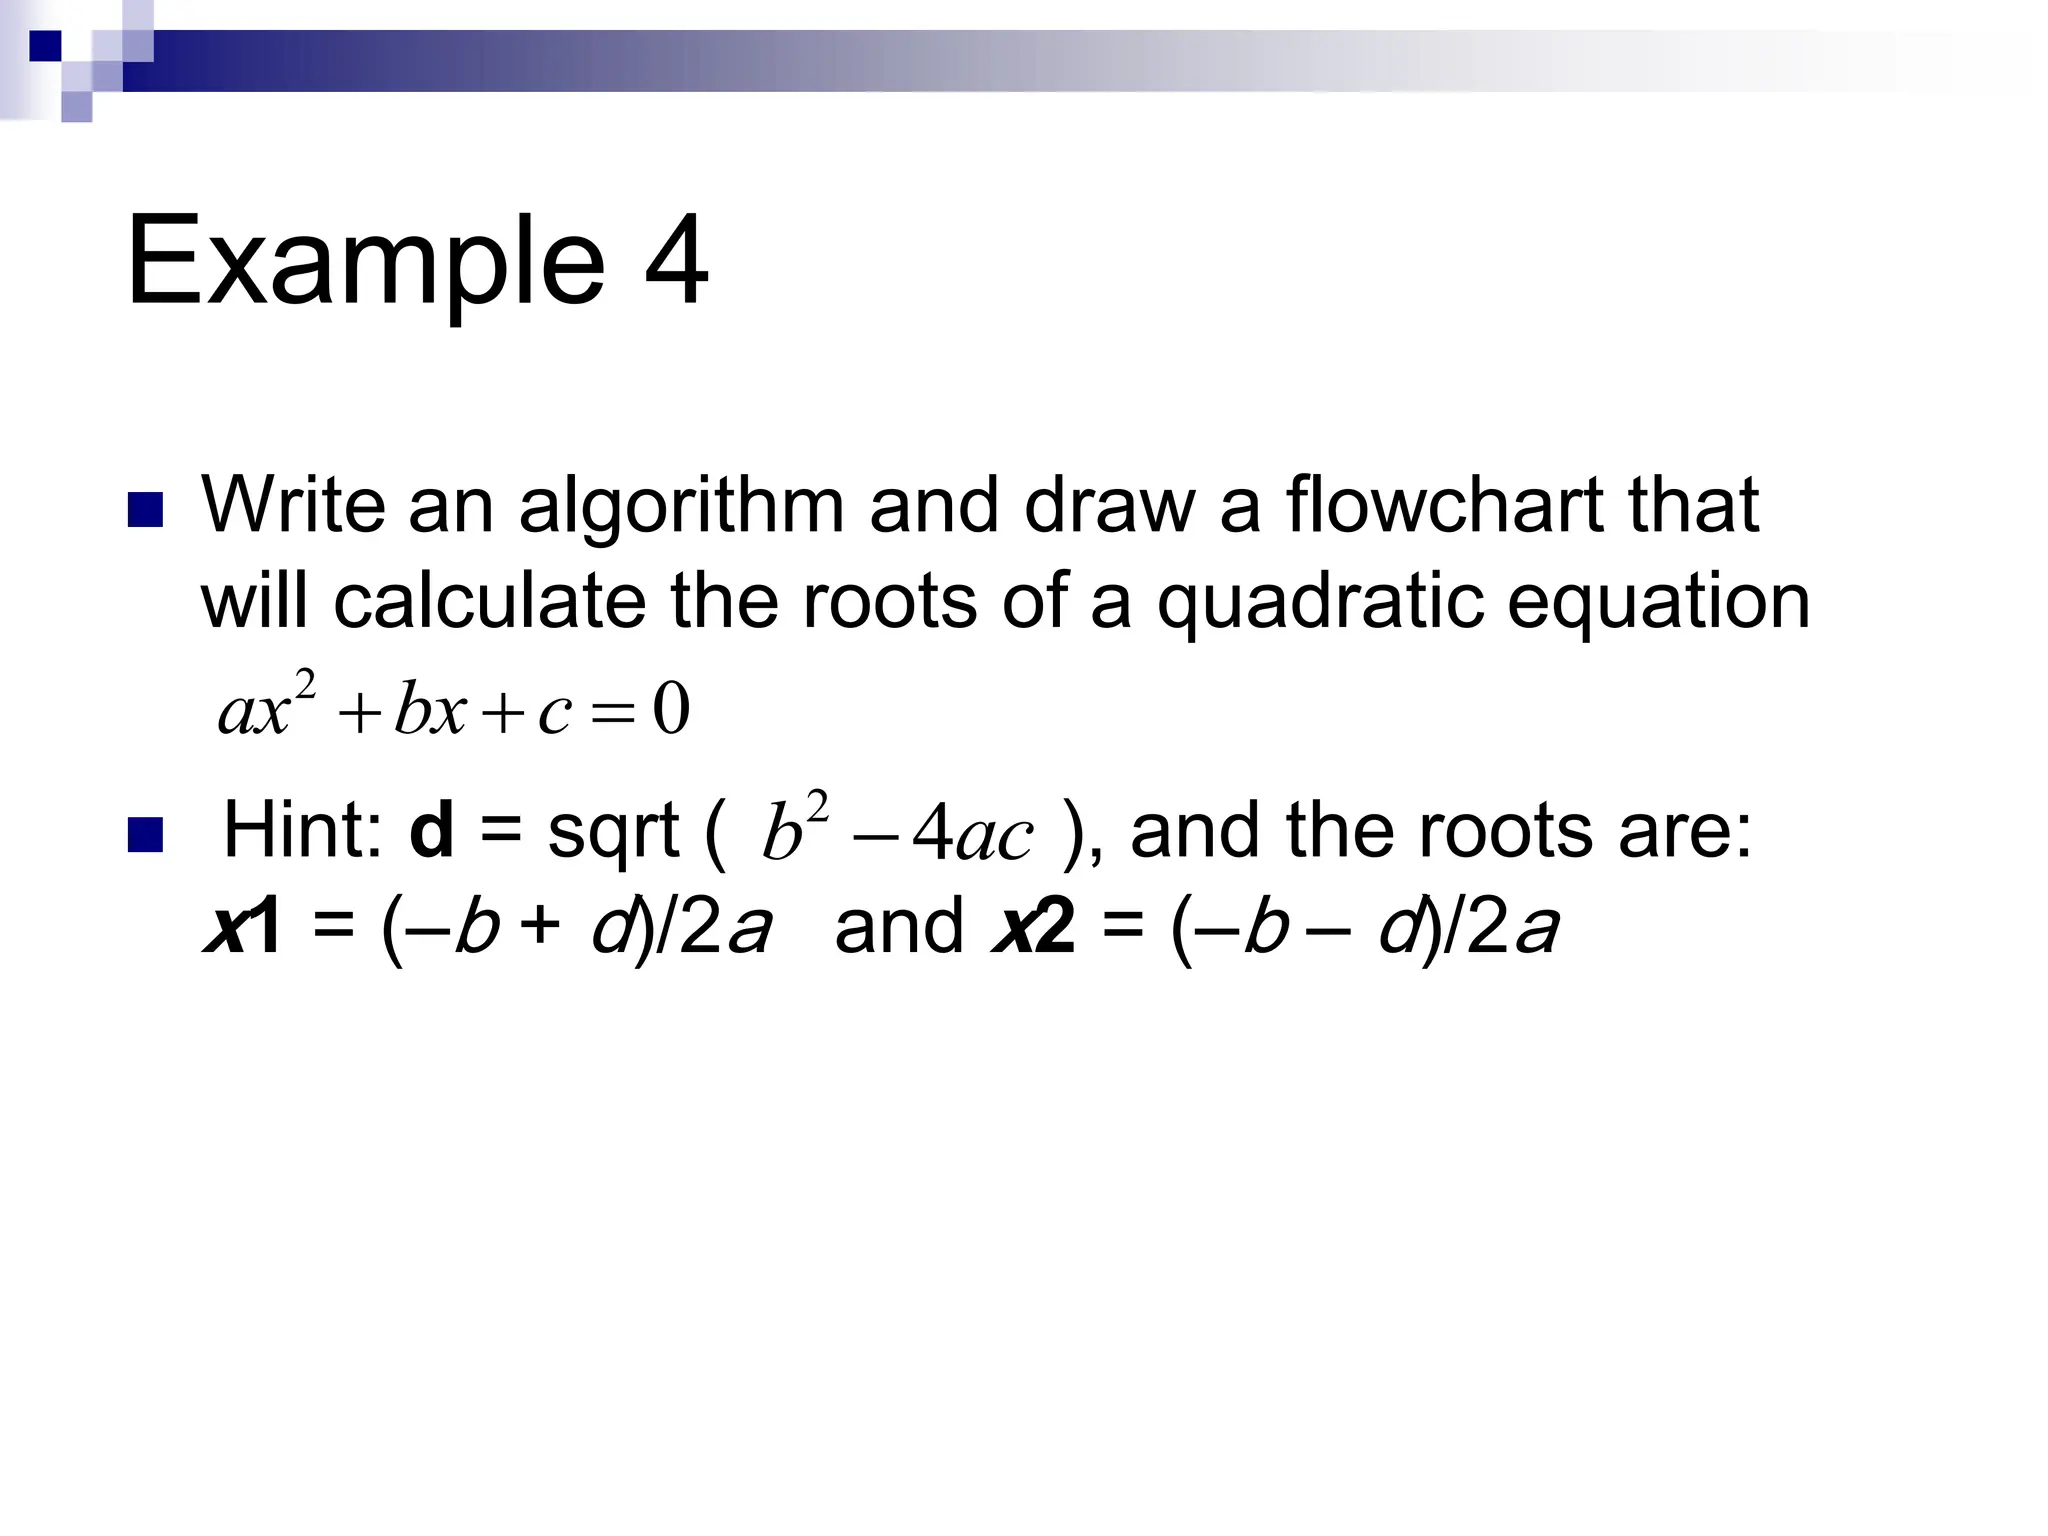
Example 4
Writean algorithm and draw a flowchart that
will calculate the roots of a quadratic equation
Hint: d = sqrt ( ), and the roots are:
x1 = (–b + d)/2a and x2 = (–b – d)/2a
2
0
ax bx c
2
4
b ac
16.
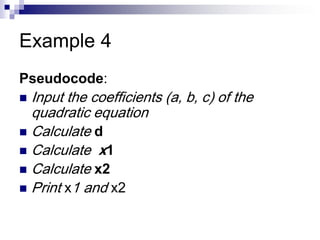
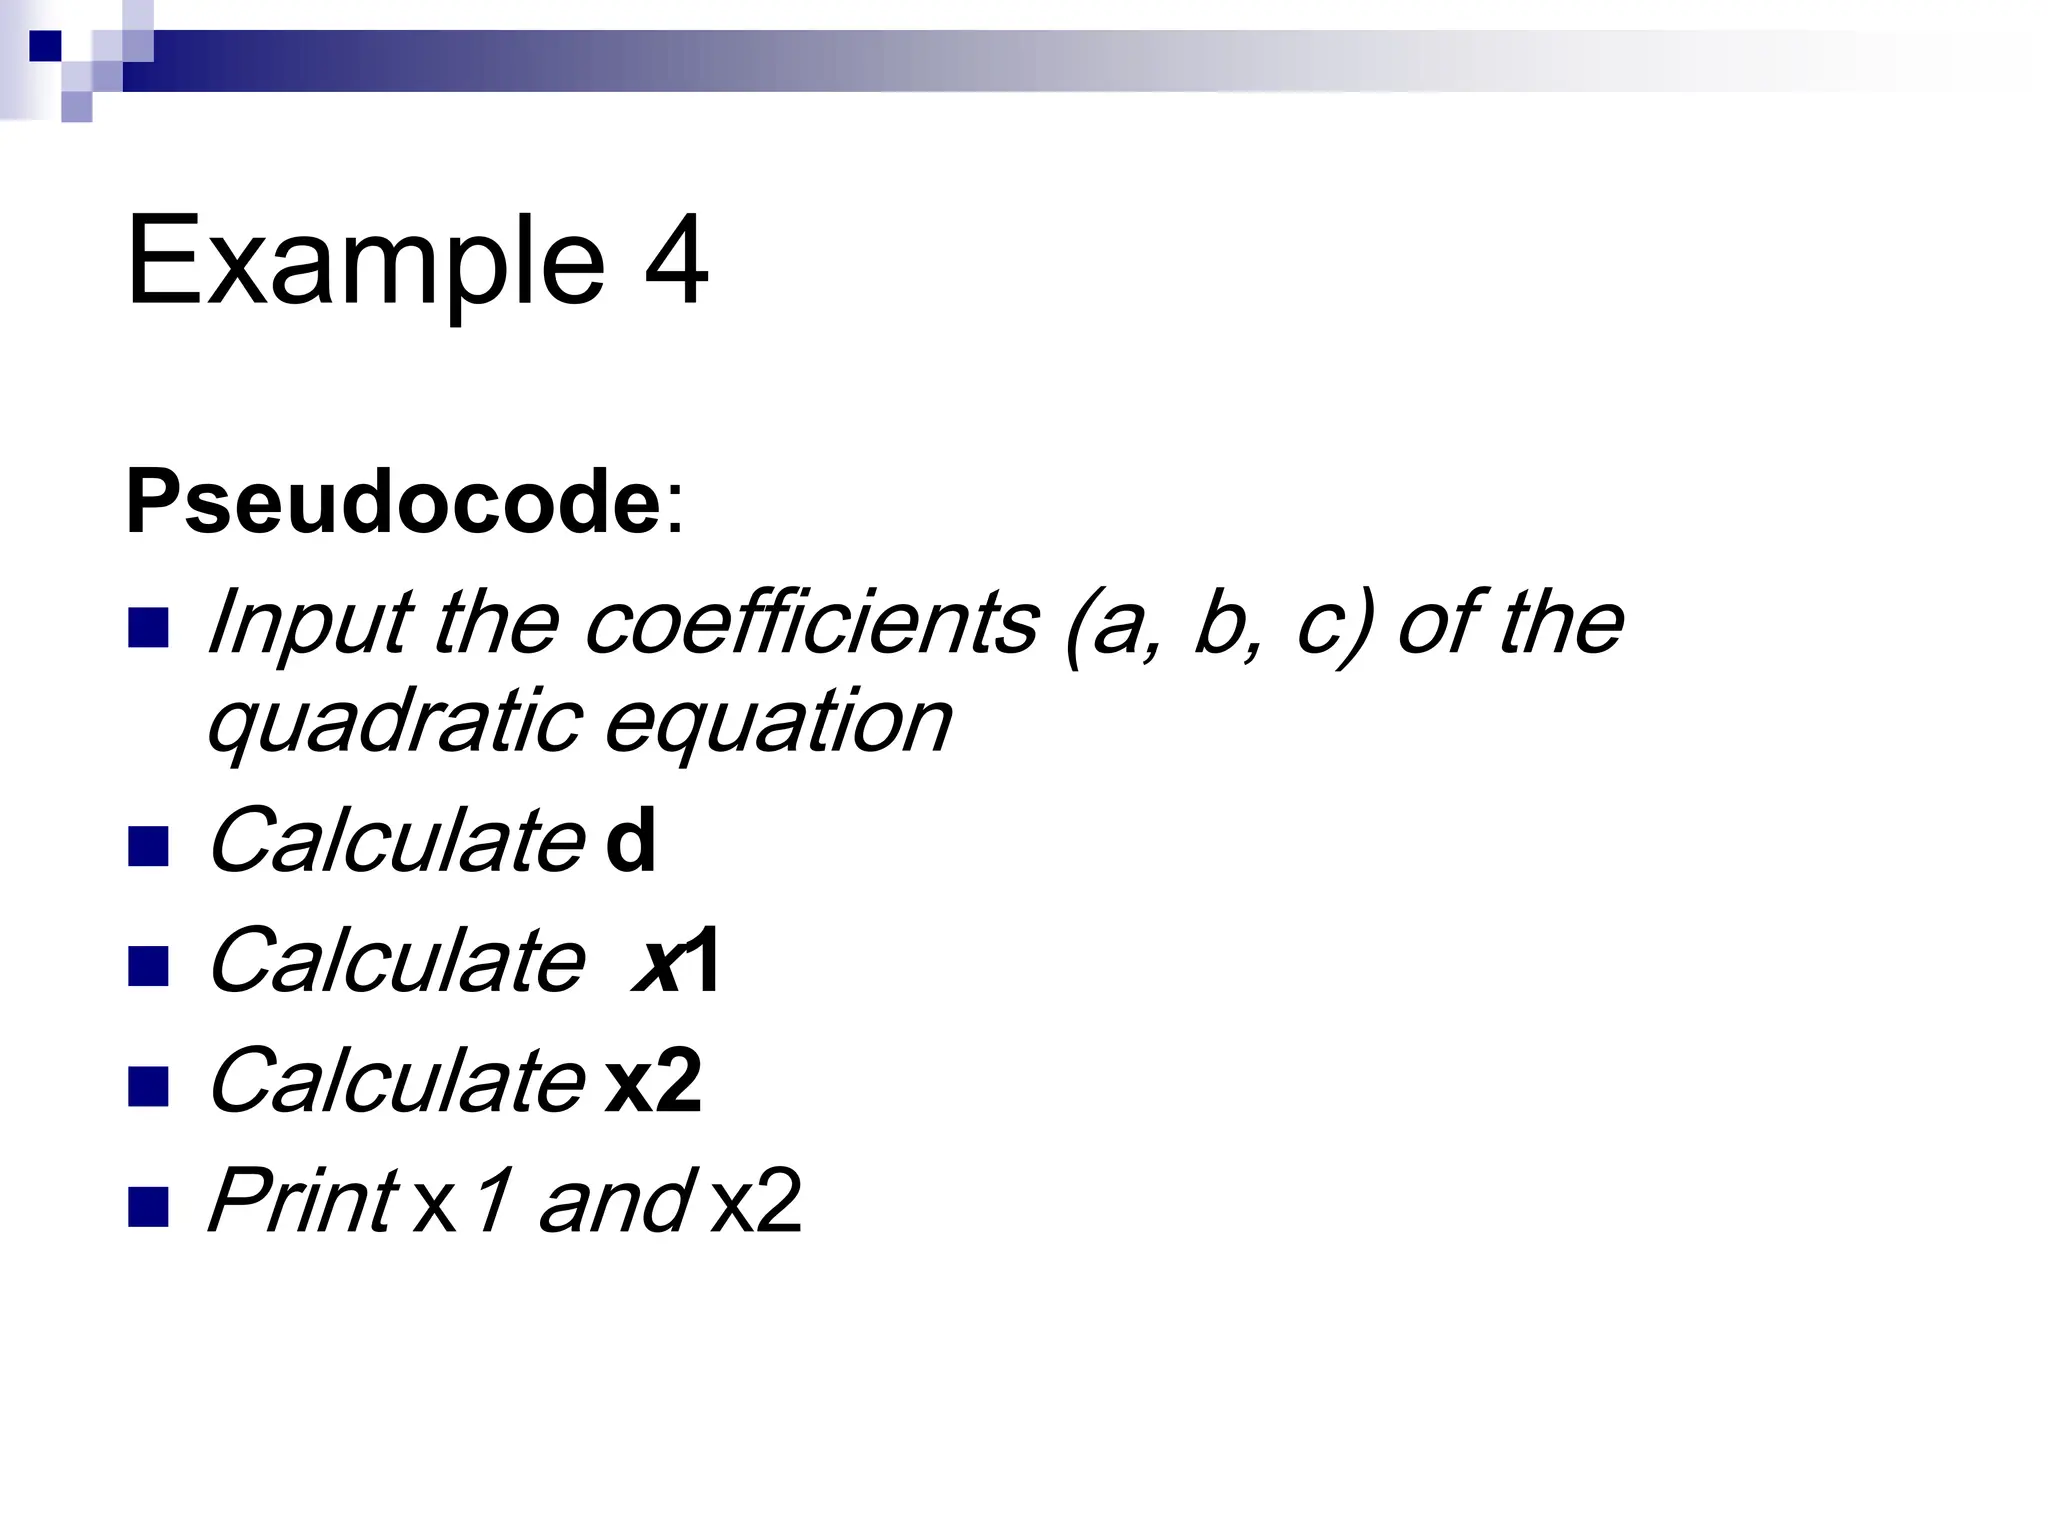
Example 4
Pseudocode:
Inputthe coefficients (a, b, c) of the
quadratic equation
Calculate d
Calculate x1
Calculate x2
Print x1 and x2
17.
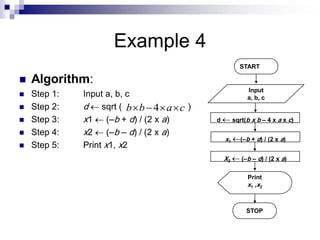
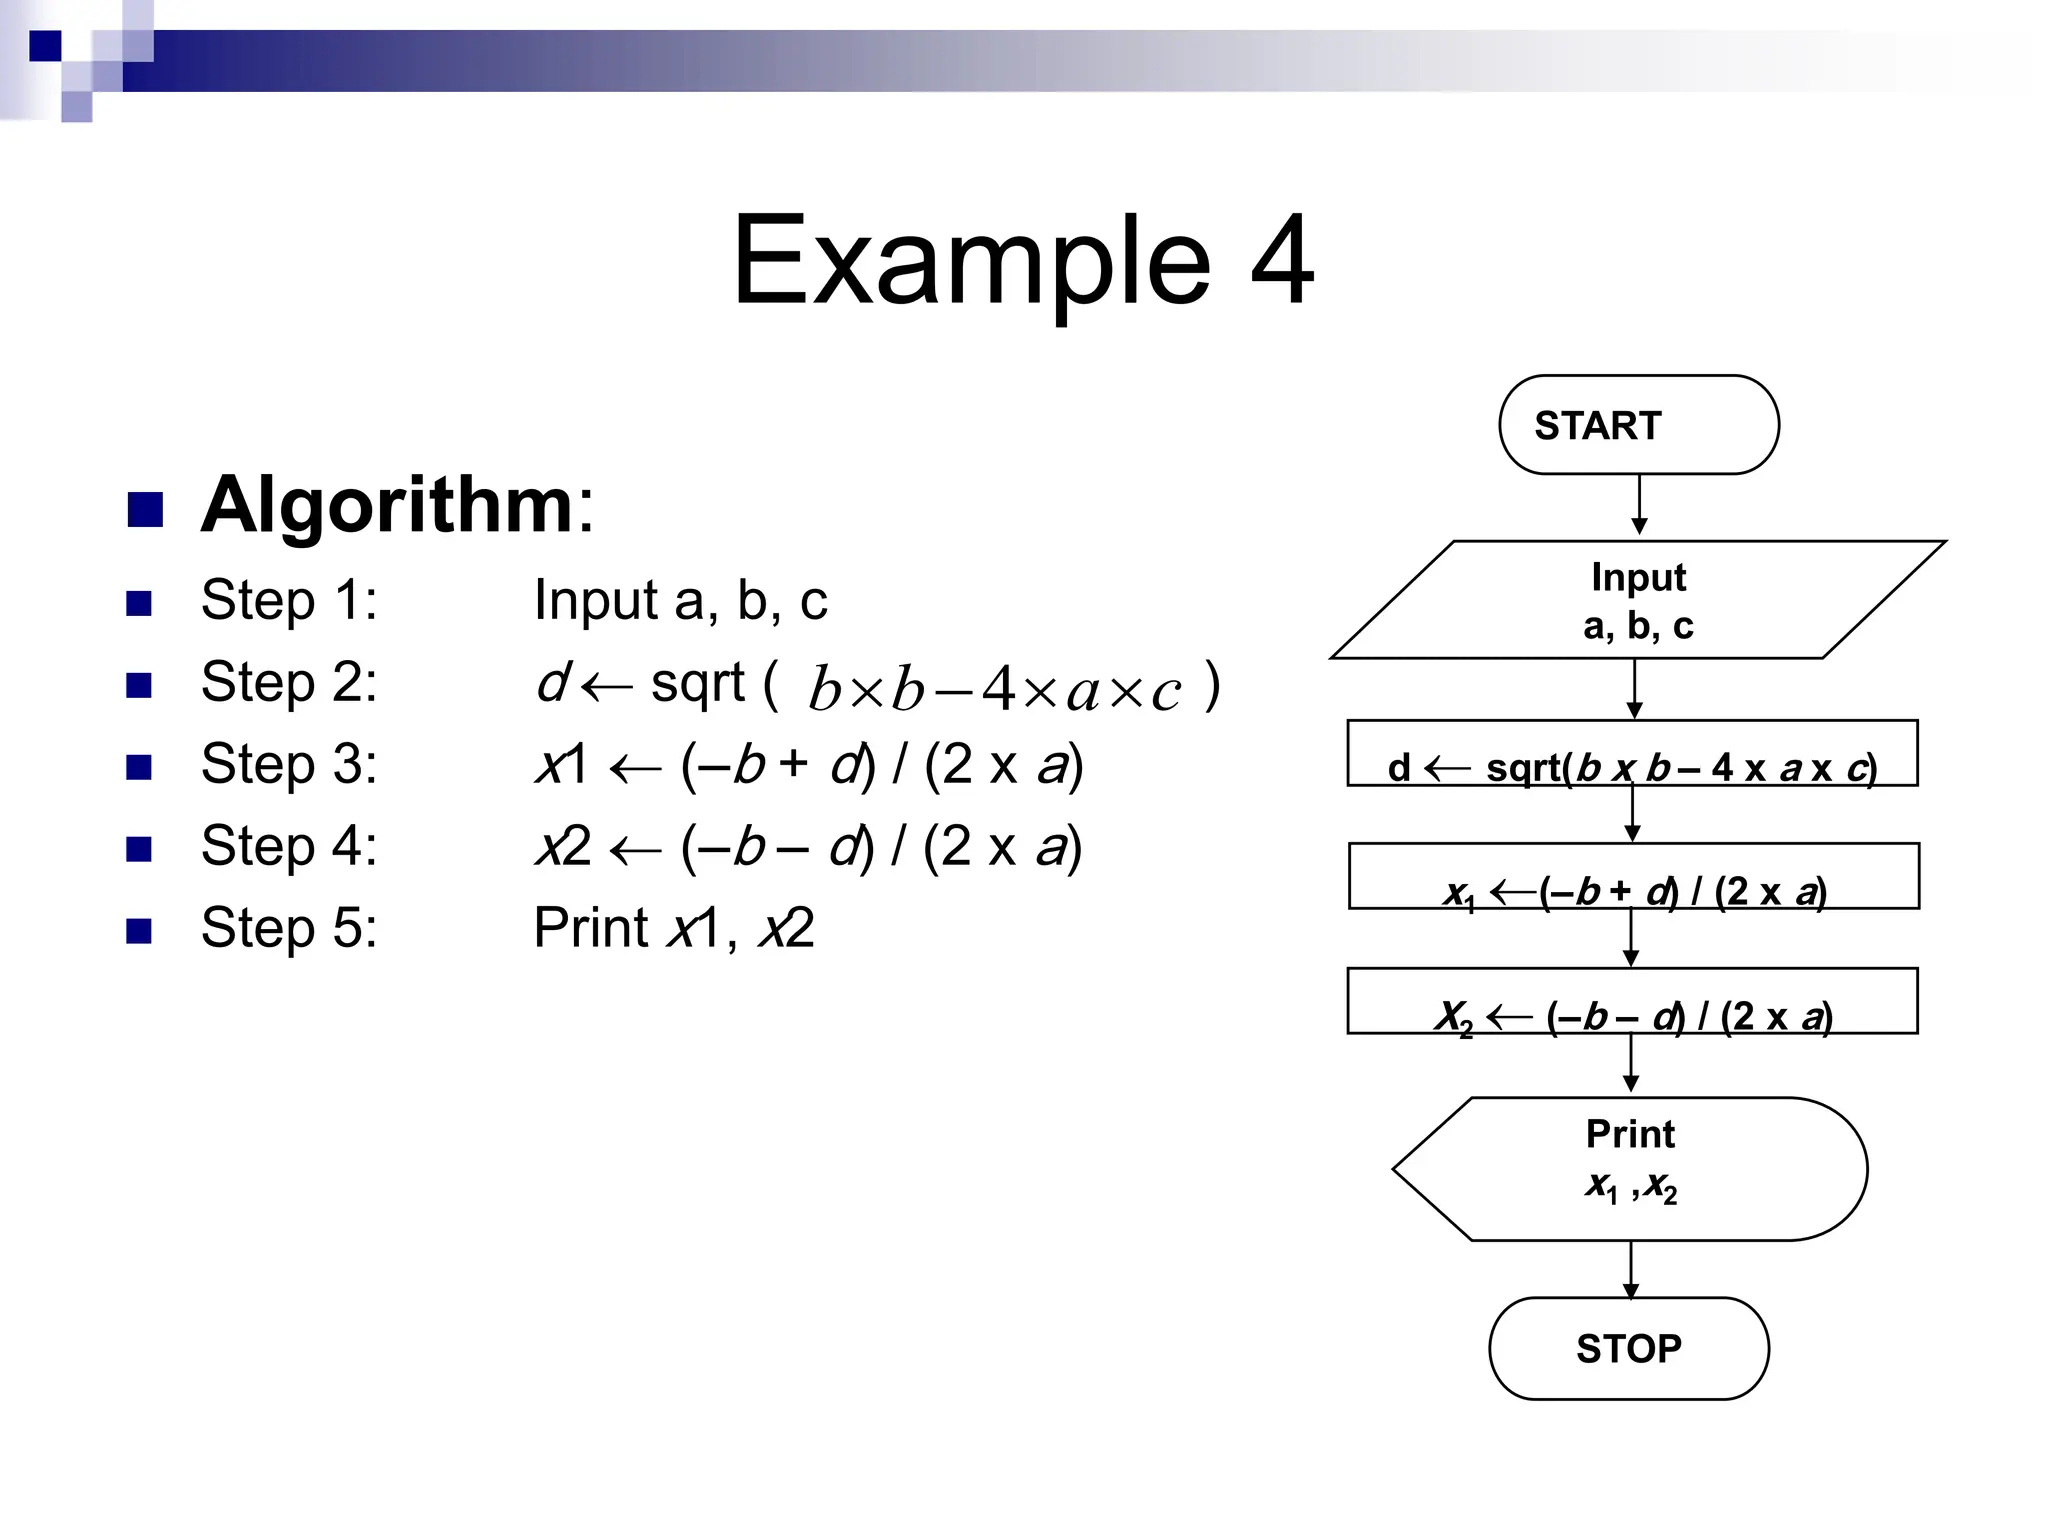
Example 4
Algorithm:
Step 1: Input a, b, c
Step 2: d sqrt ( )
Step 3: x1 (–b + d) / (2 x a)
Step 4: x2 (–b – d) / (2 x a)
Step 5: Print x1, x2
START
Input
a, b, c
d sqrt(b x b – 4 x a x c)
Print
x1 ,x2
STOP
x1 (–b + d) / (2 x a)
X2 (–b – d) / (2 x a)
4
b b a c
18.
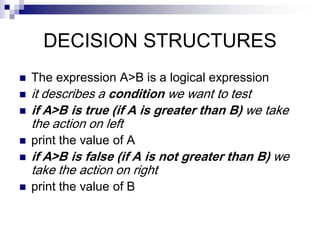
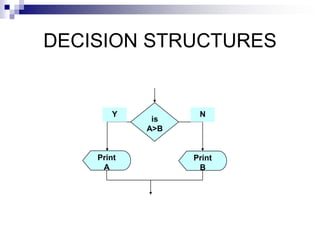
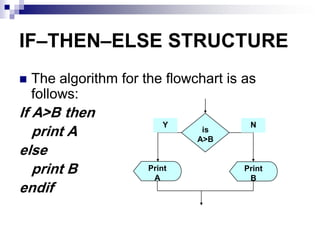
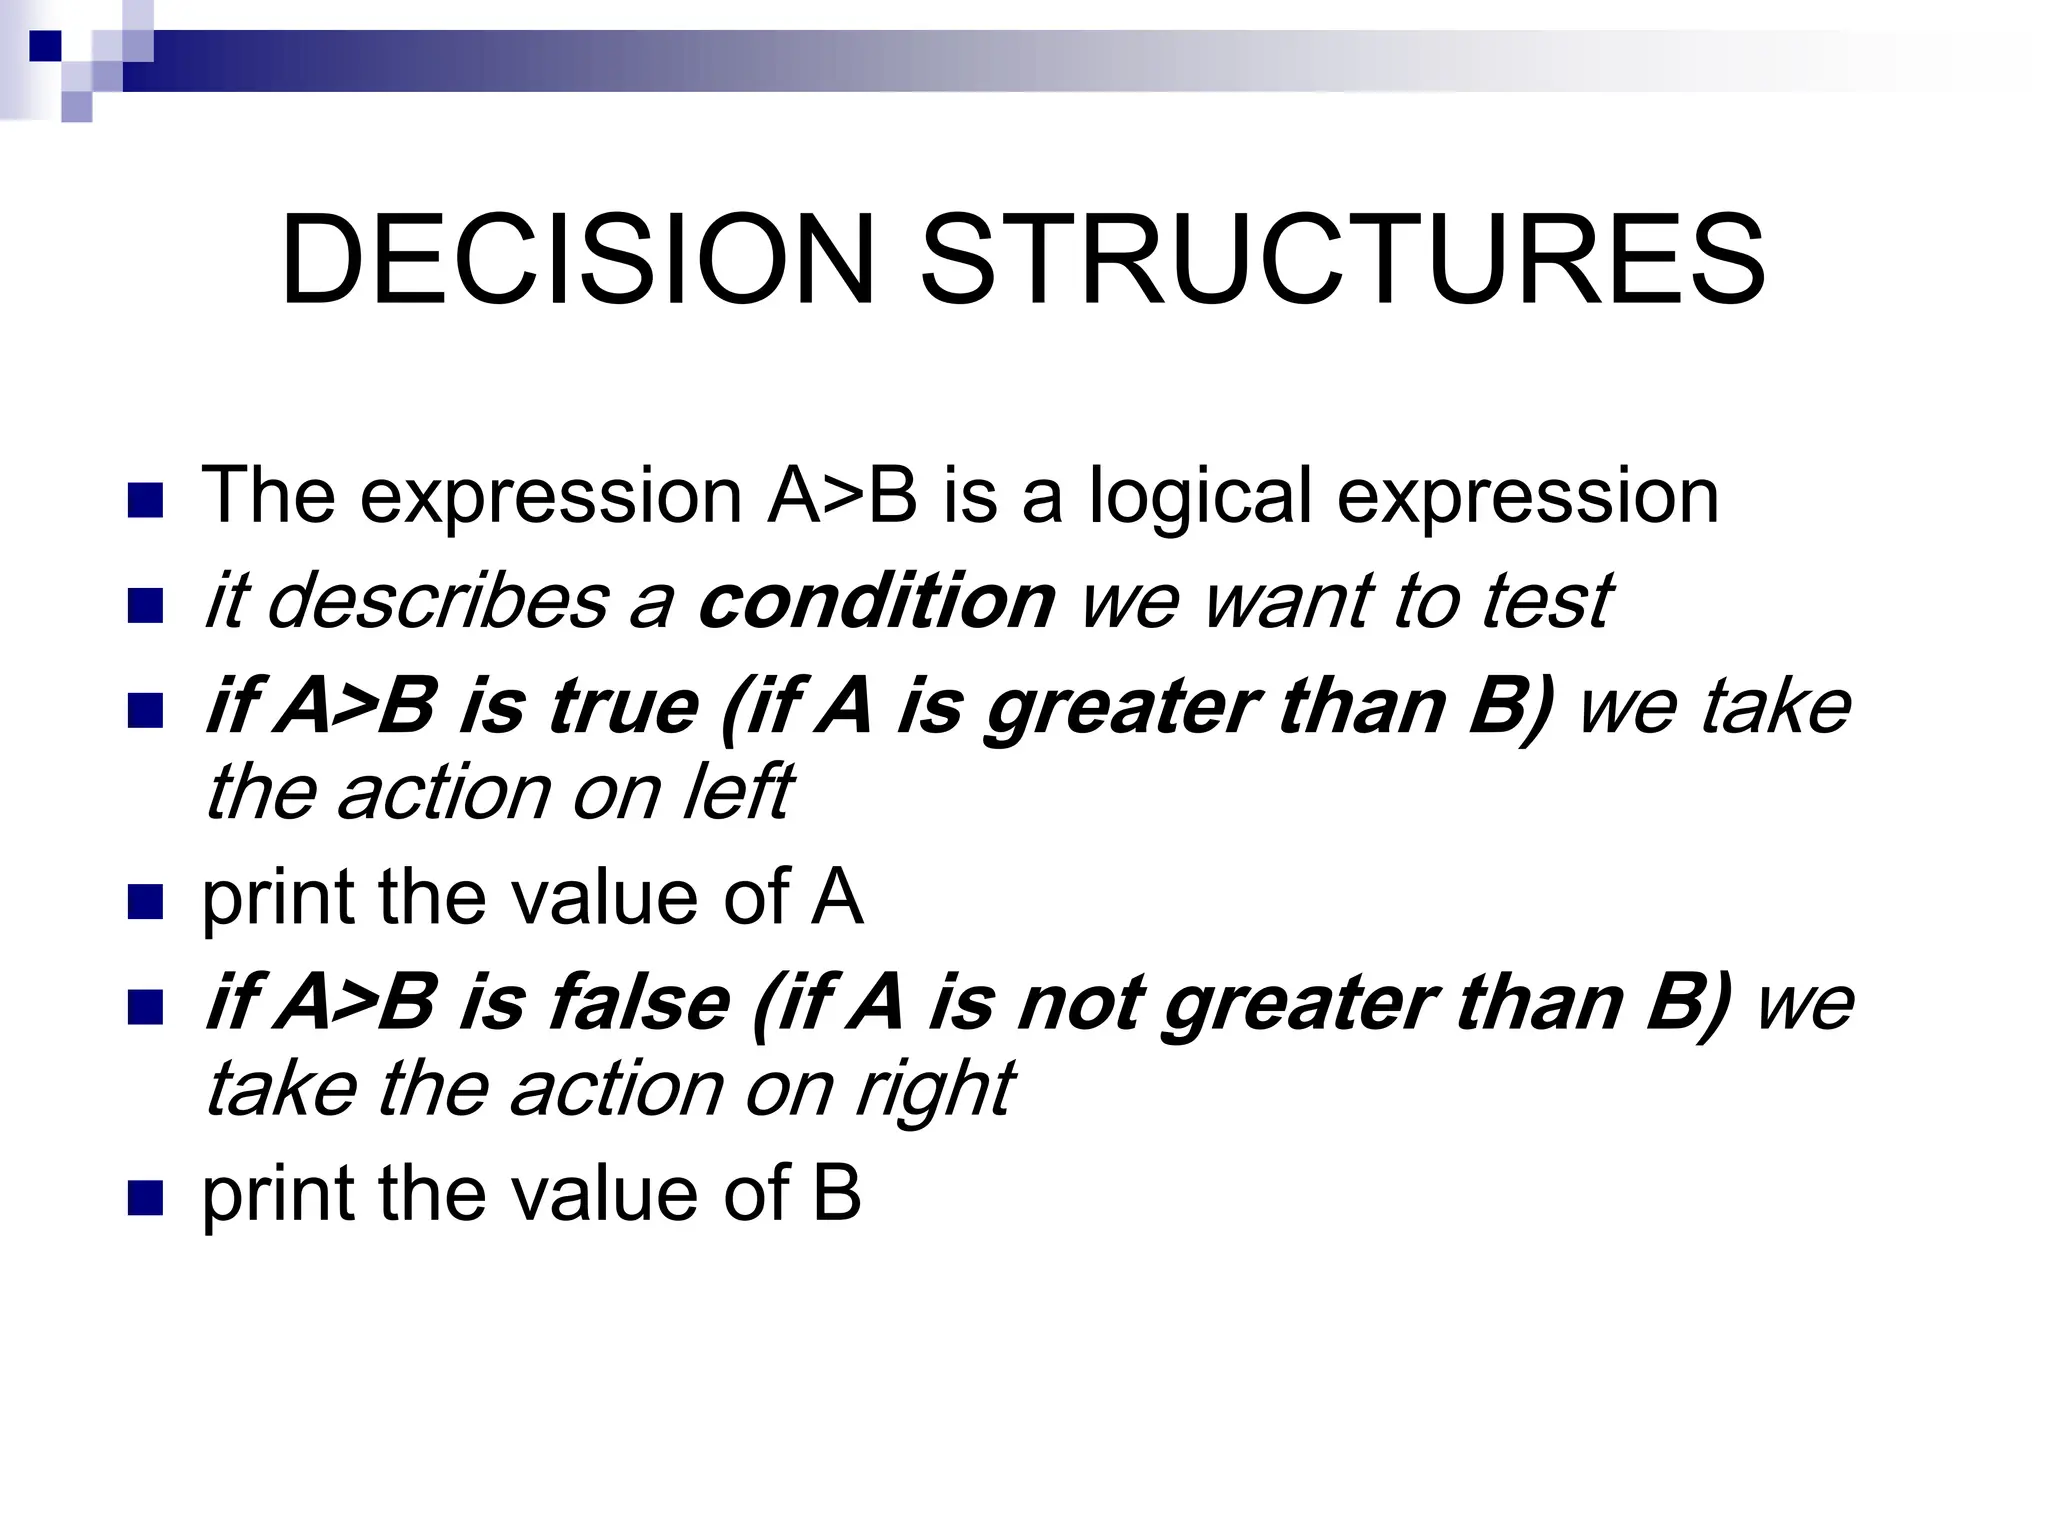
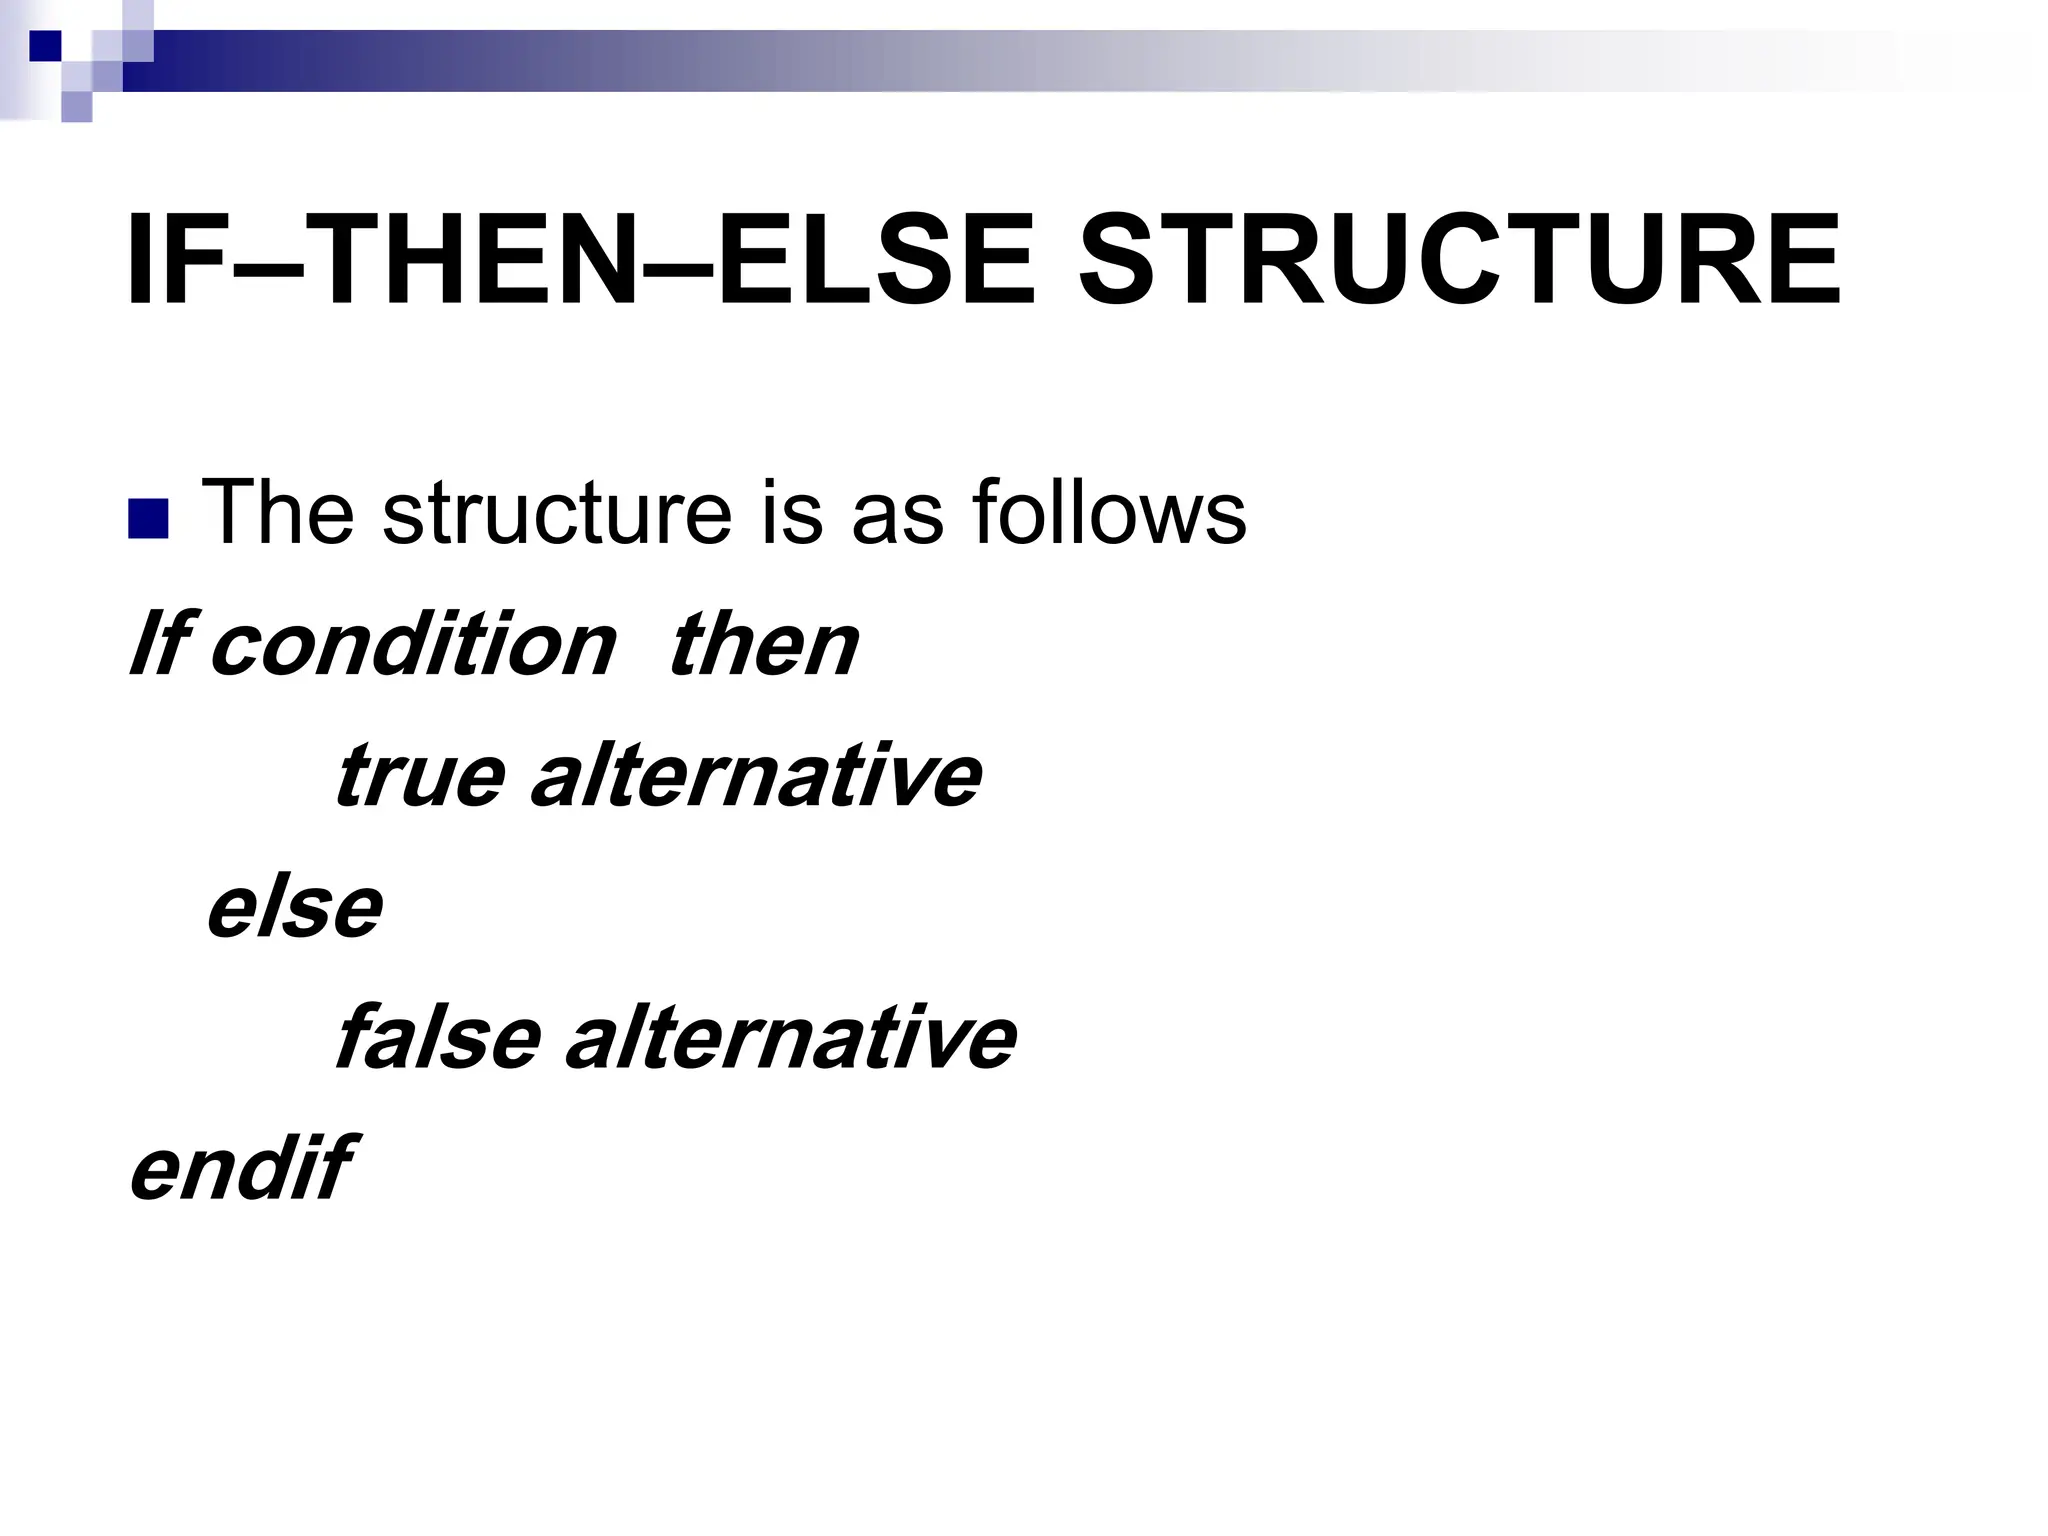
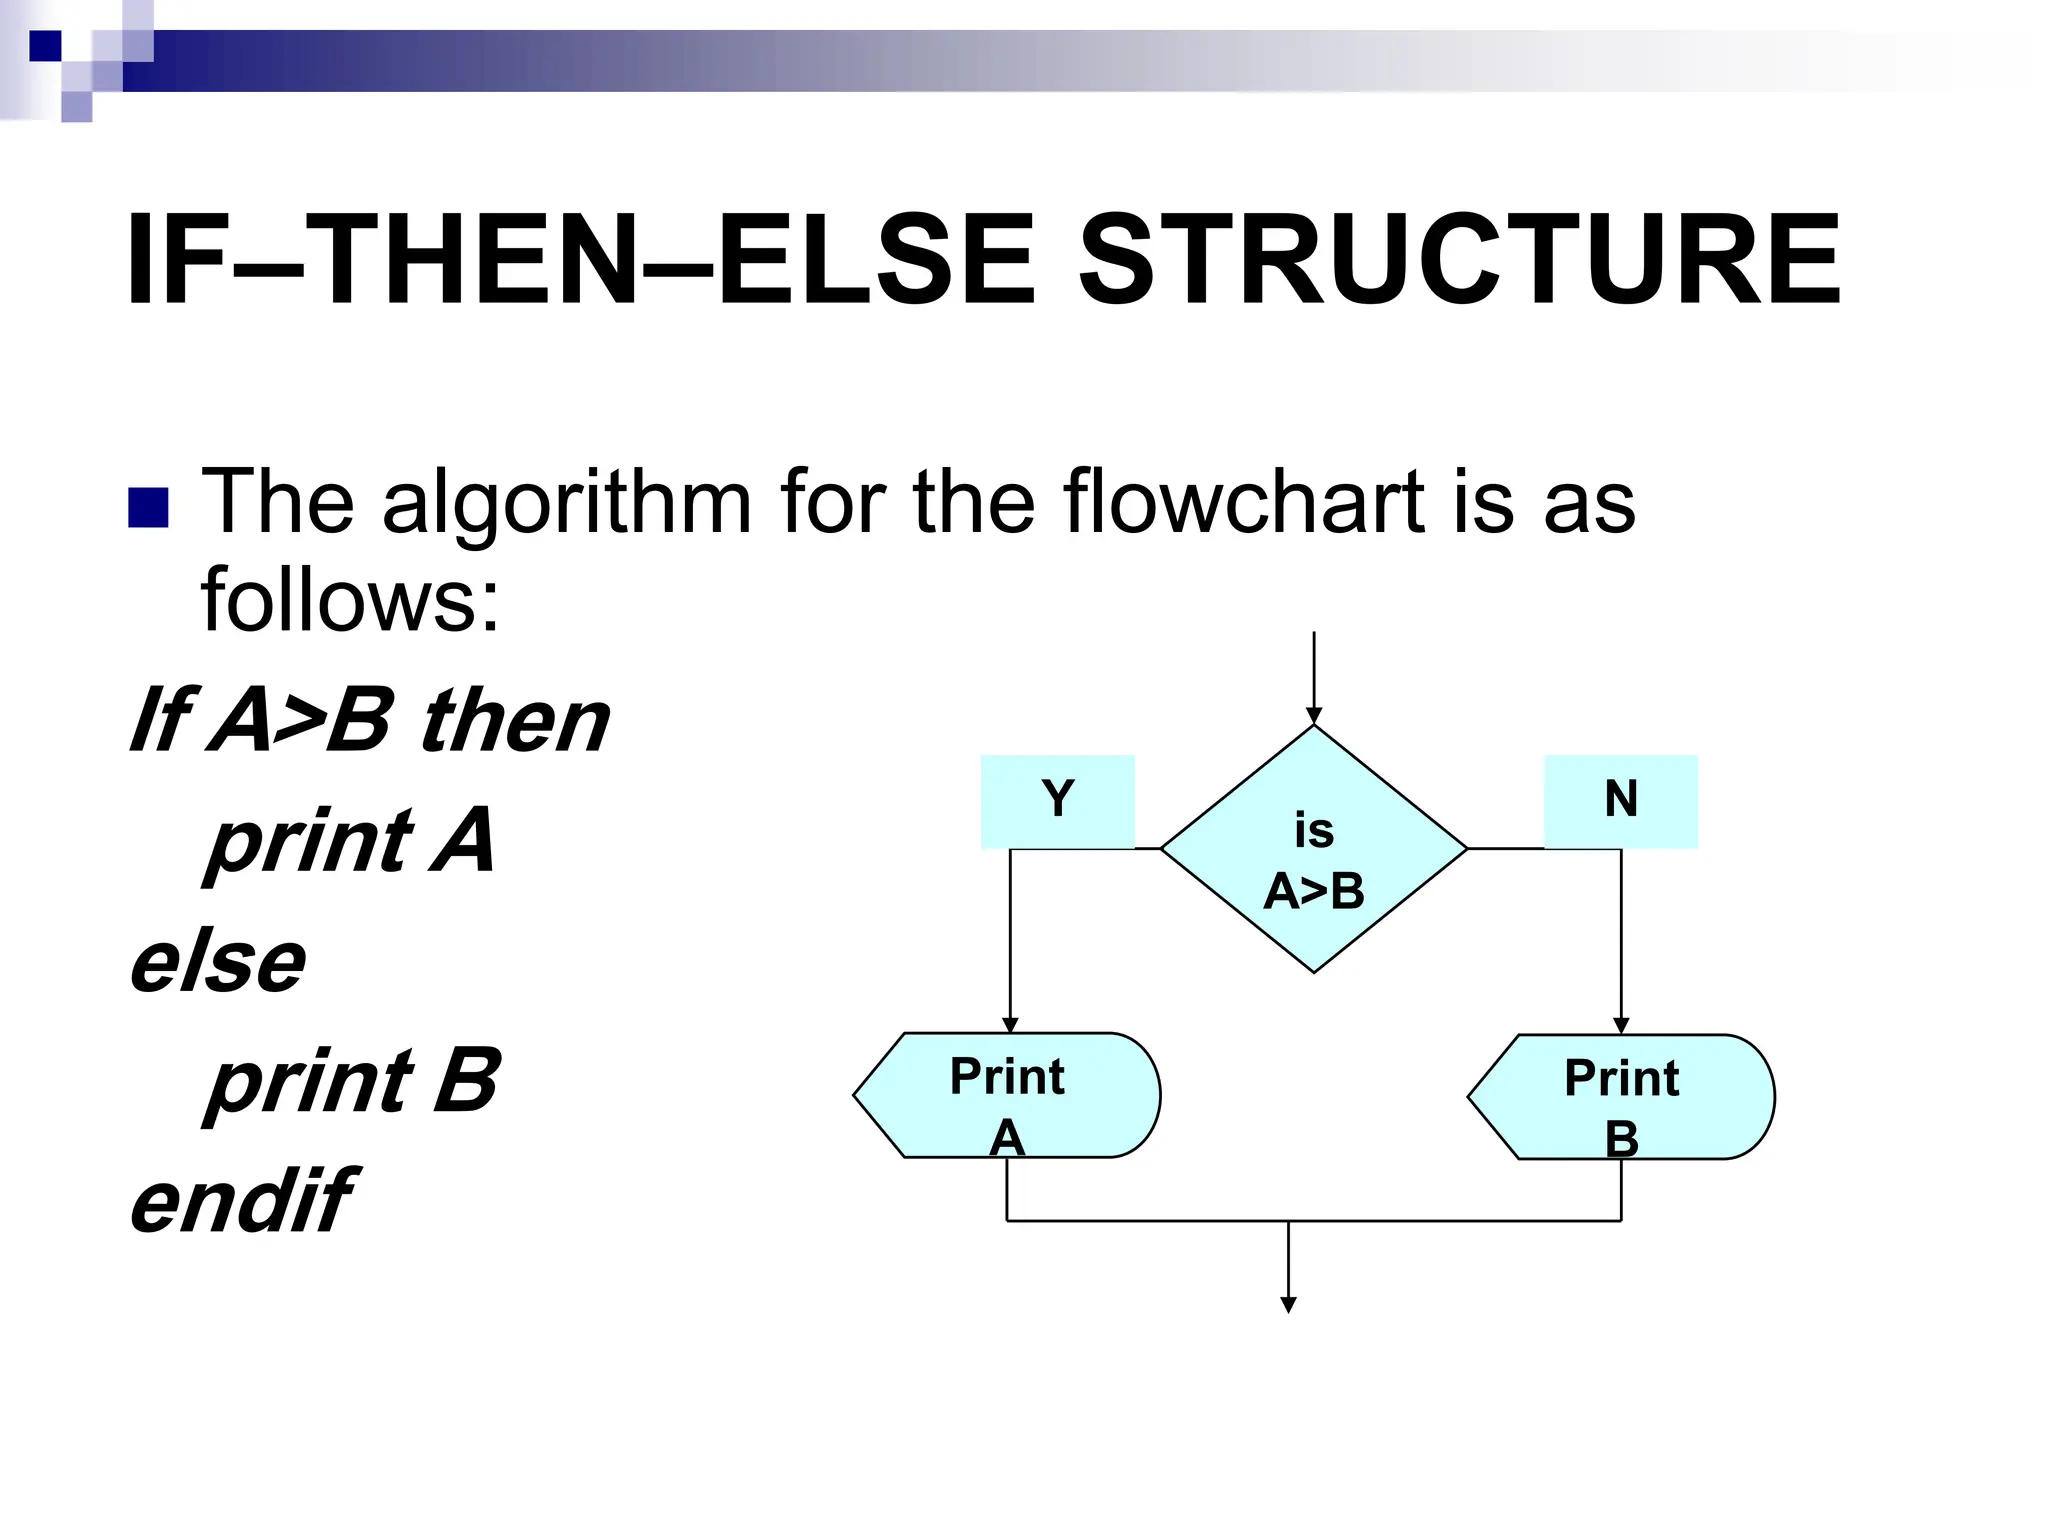
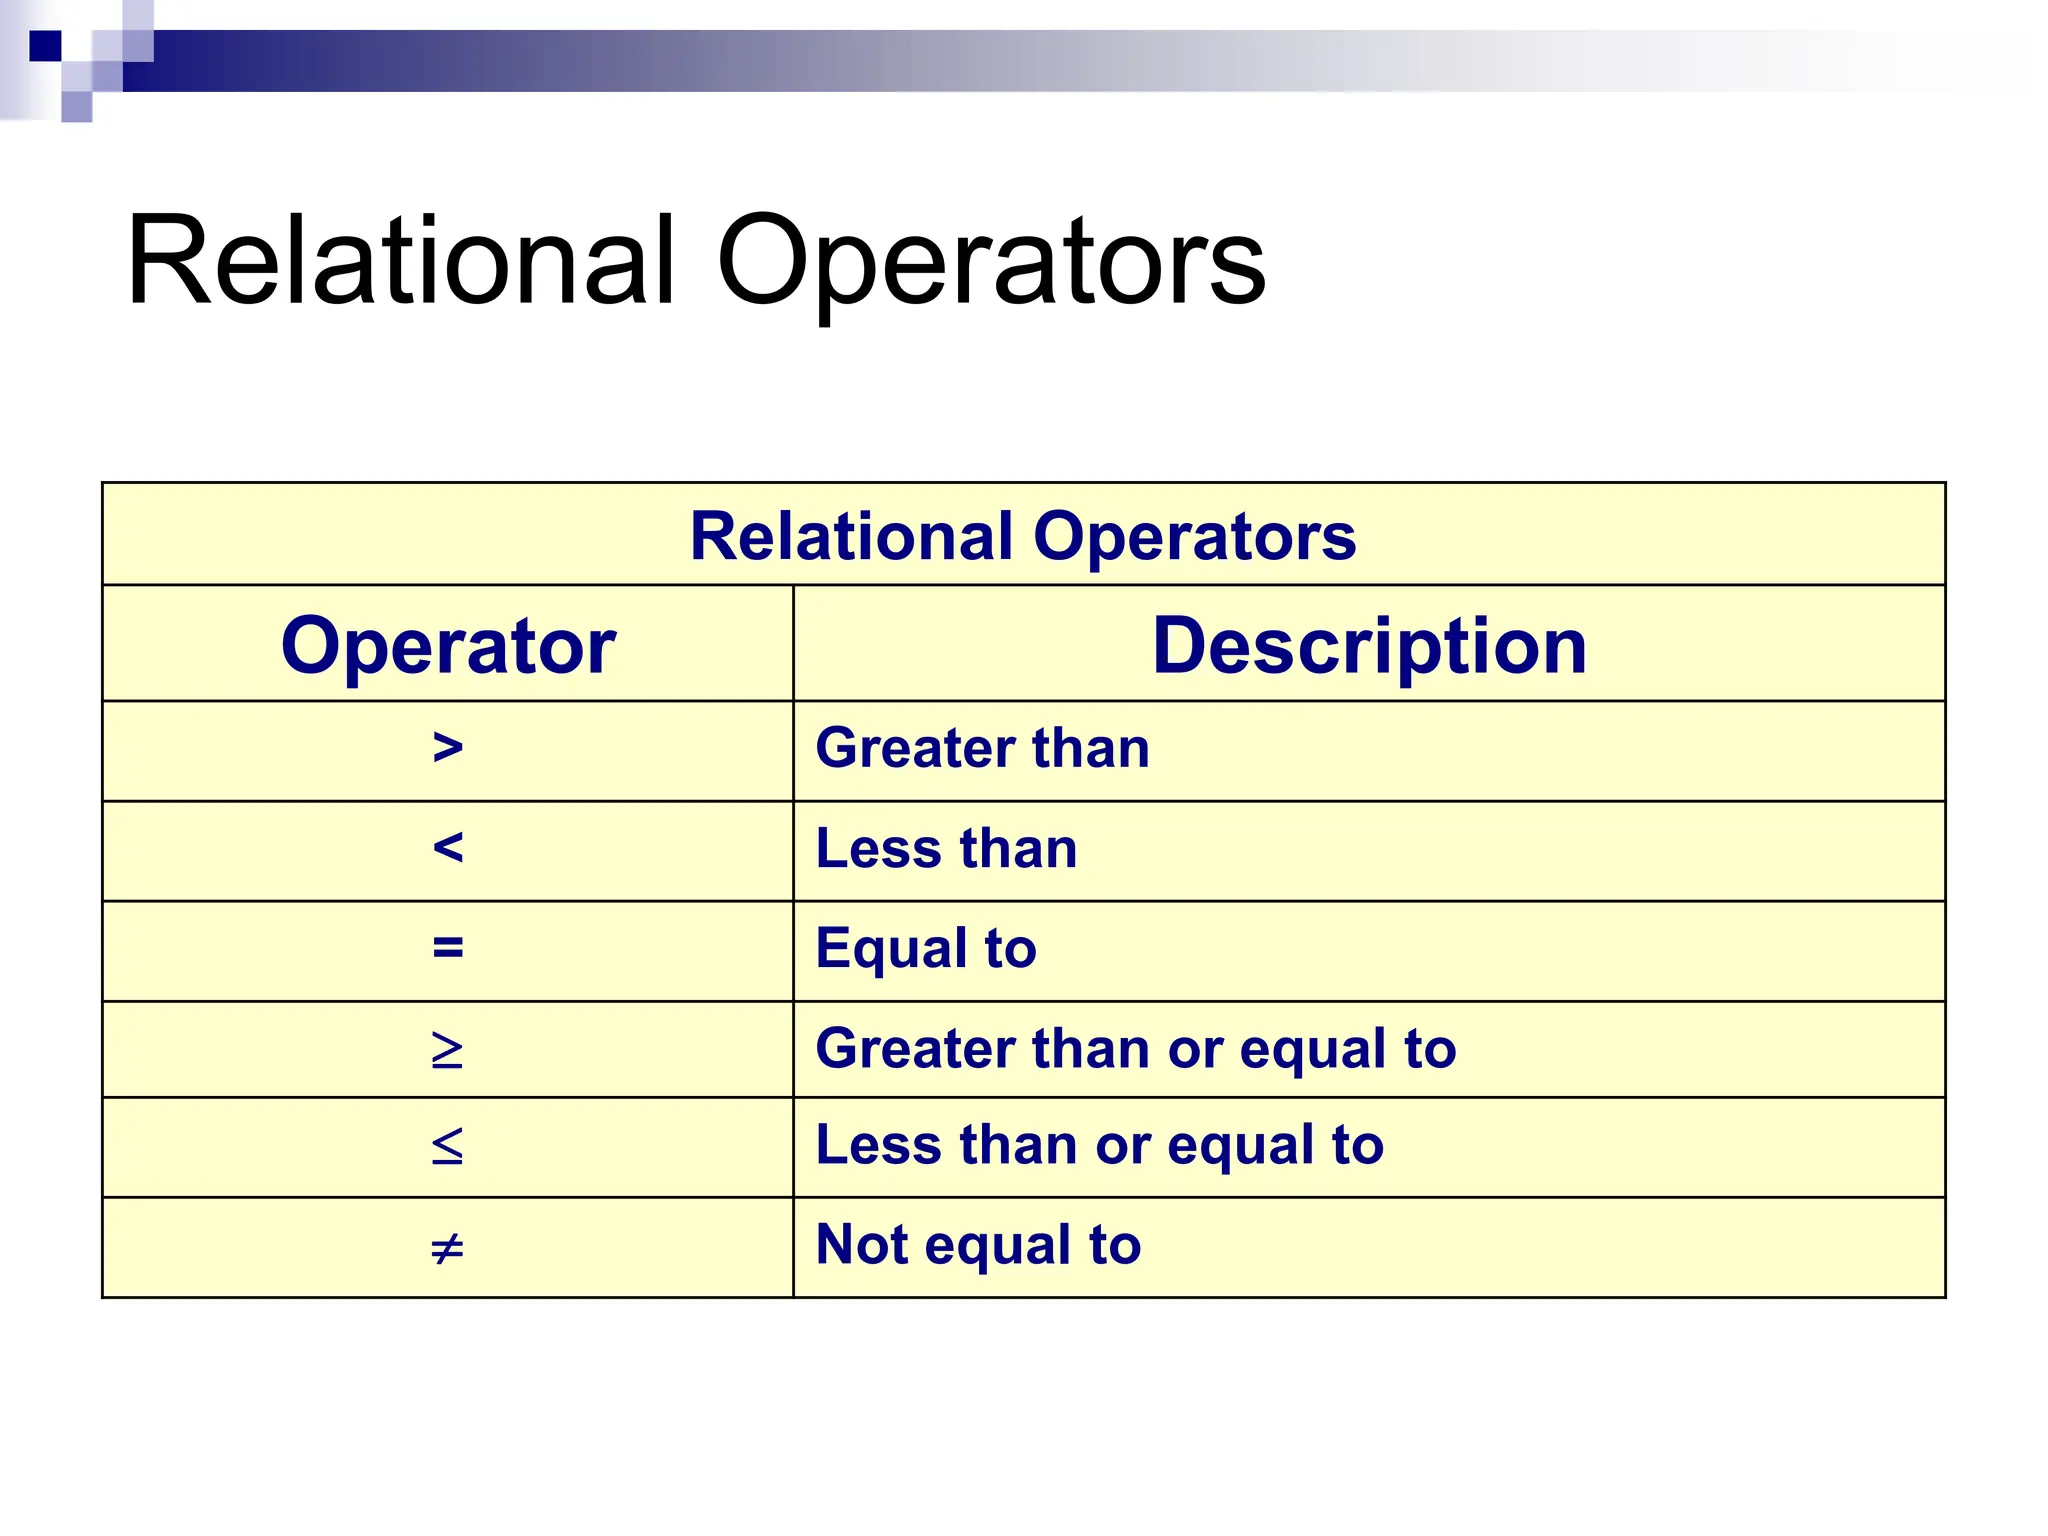
DECISION STRUCTURES
Theexpression A>B is a logical expression
it describes a condition we want to test
if A>B is true (if A is greater than B) we take
the action on left
print the value of A
if A>B is false (if A is not greater than B) we
take the action on right
print the value of B
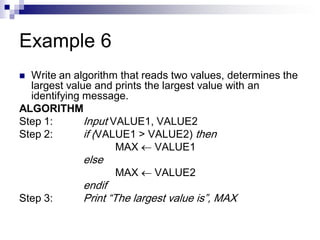
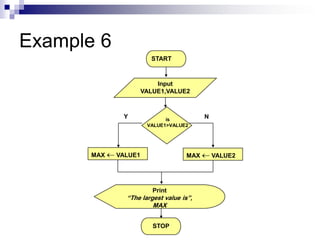
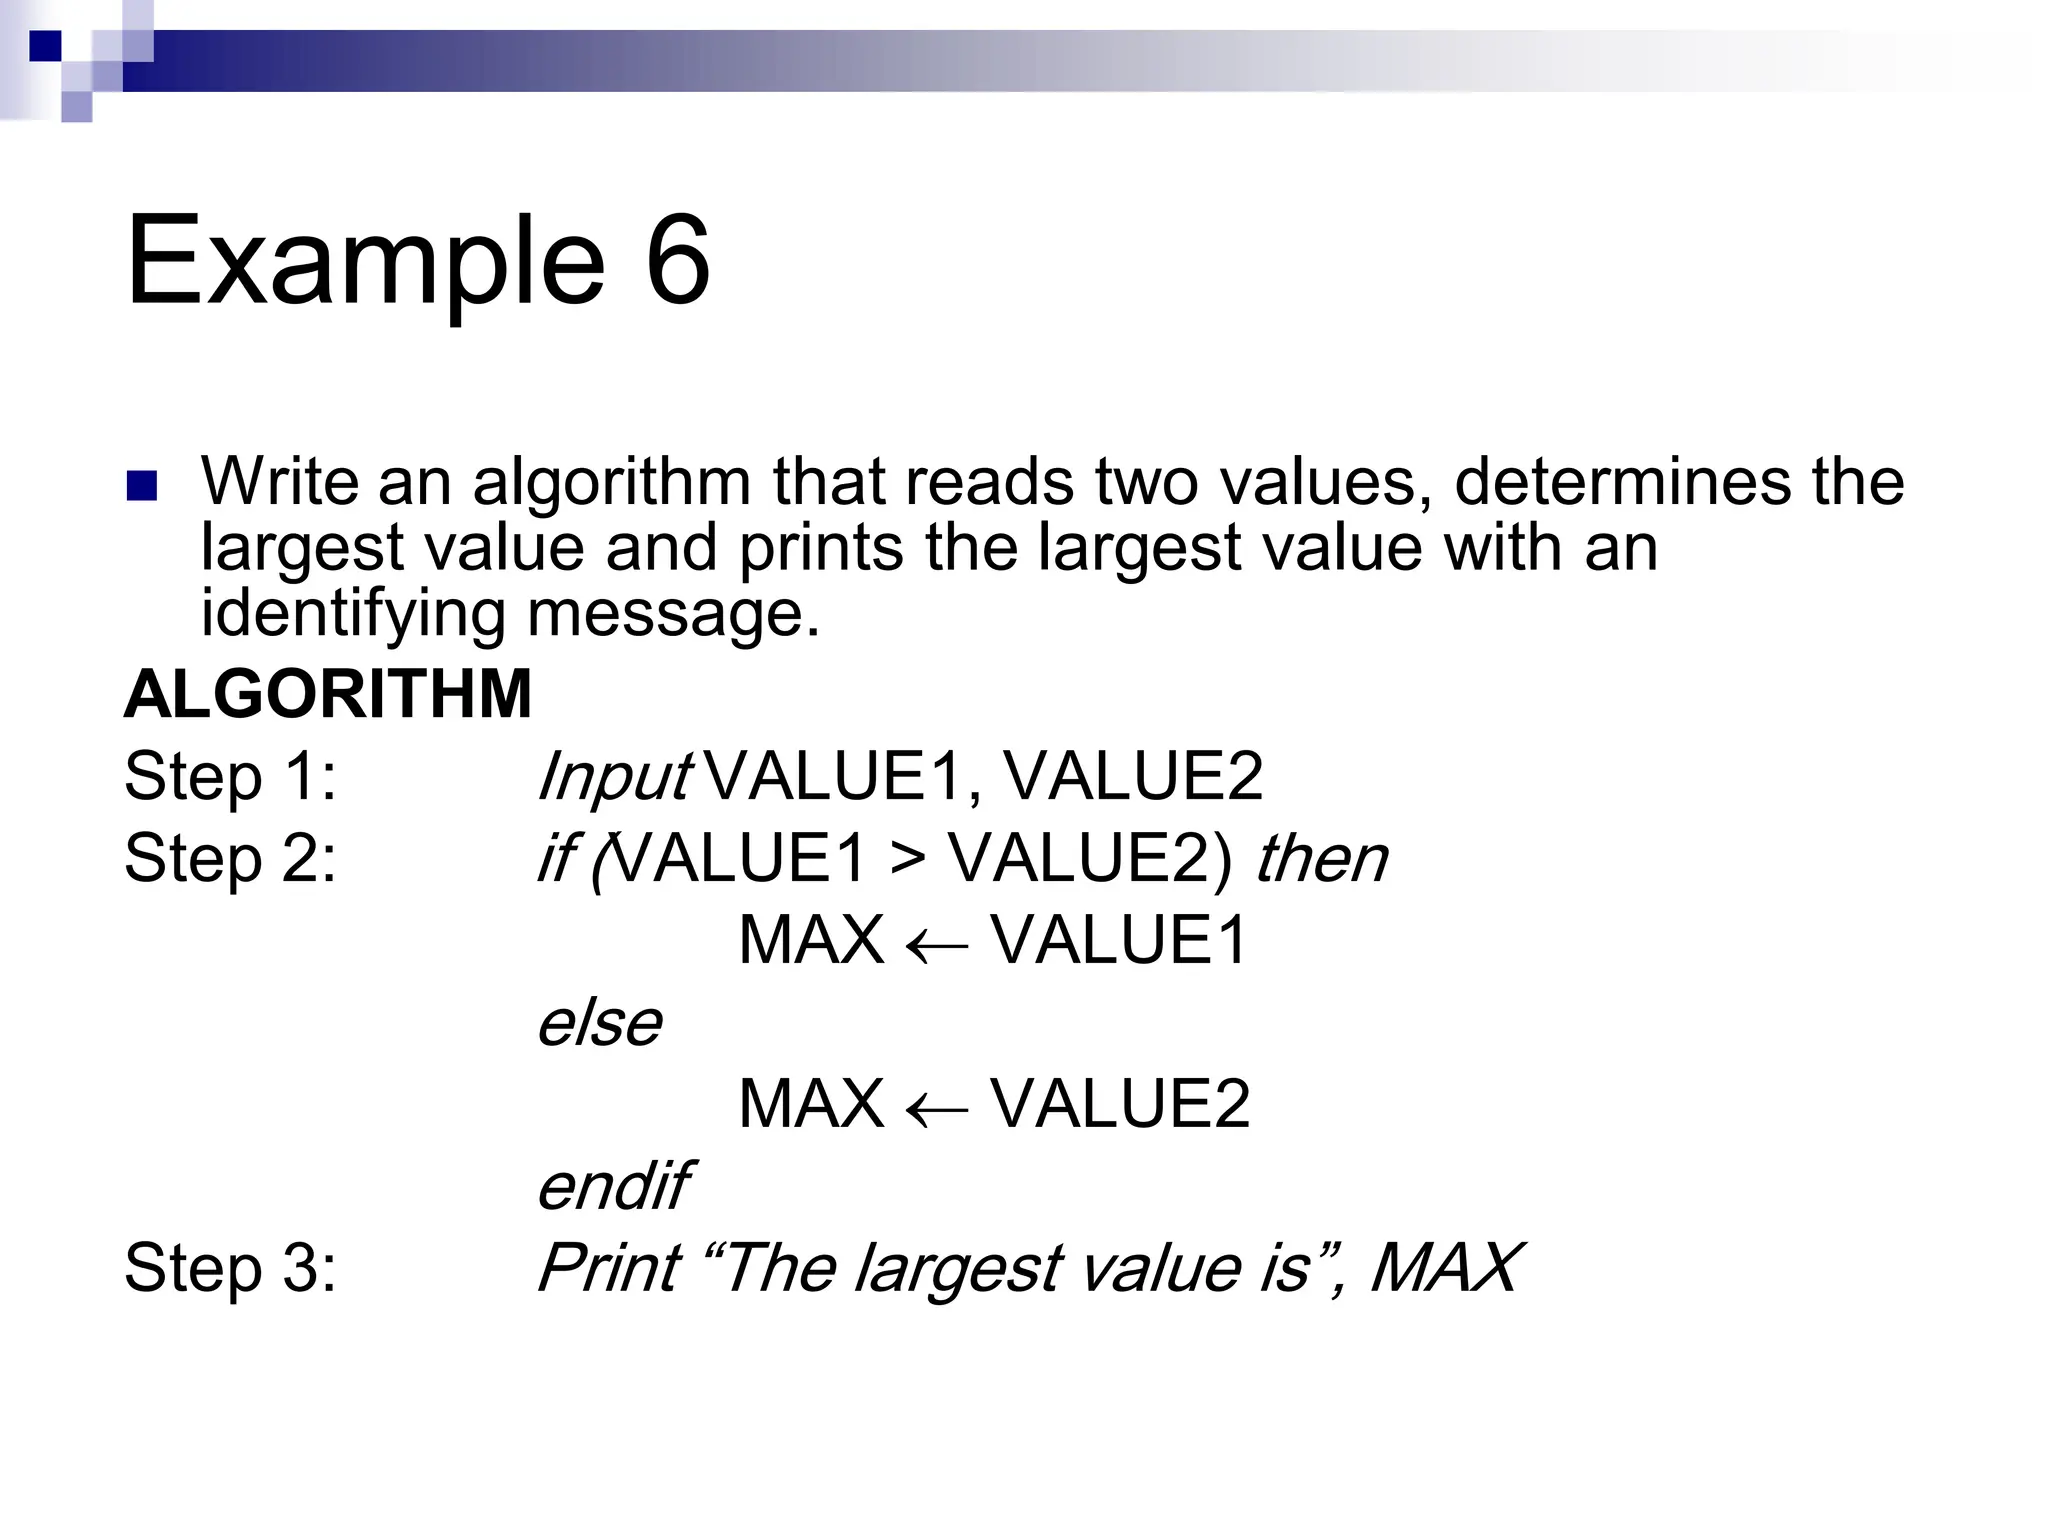
Example 6
Writean algorithm that reads two values, determines the
largest value and prints the largest value with an
identifying message.
ALGORITHM
Step 1: Input VALUE1, VALUE2
Step 2: if (VALUE1 > VALUE2) then
MAX VALUE1
else
MAX VALUE2
endif
Step 3: Print “The largest value is”, MAX
24.
Example 6
MAX VALUE1
Print
“The largest value is”,
MAX
STOP
Y N
START
Input
VALUE1,VALUE2
MAX VALUE2
is
VALUE1>VALUE2
25.
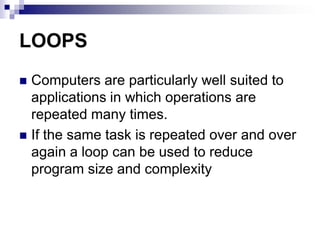
LOOPS
Computers areparticularly well suited to
applications in which operations are
repeated many times.
If the same task is repeated over and over
again a loop can be used to reduce
program size and complexity
26.
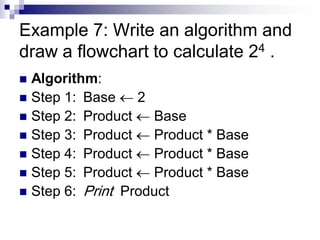
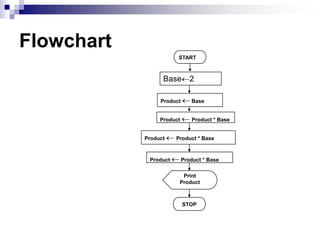
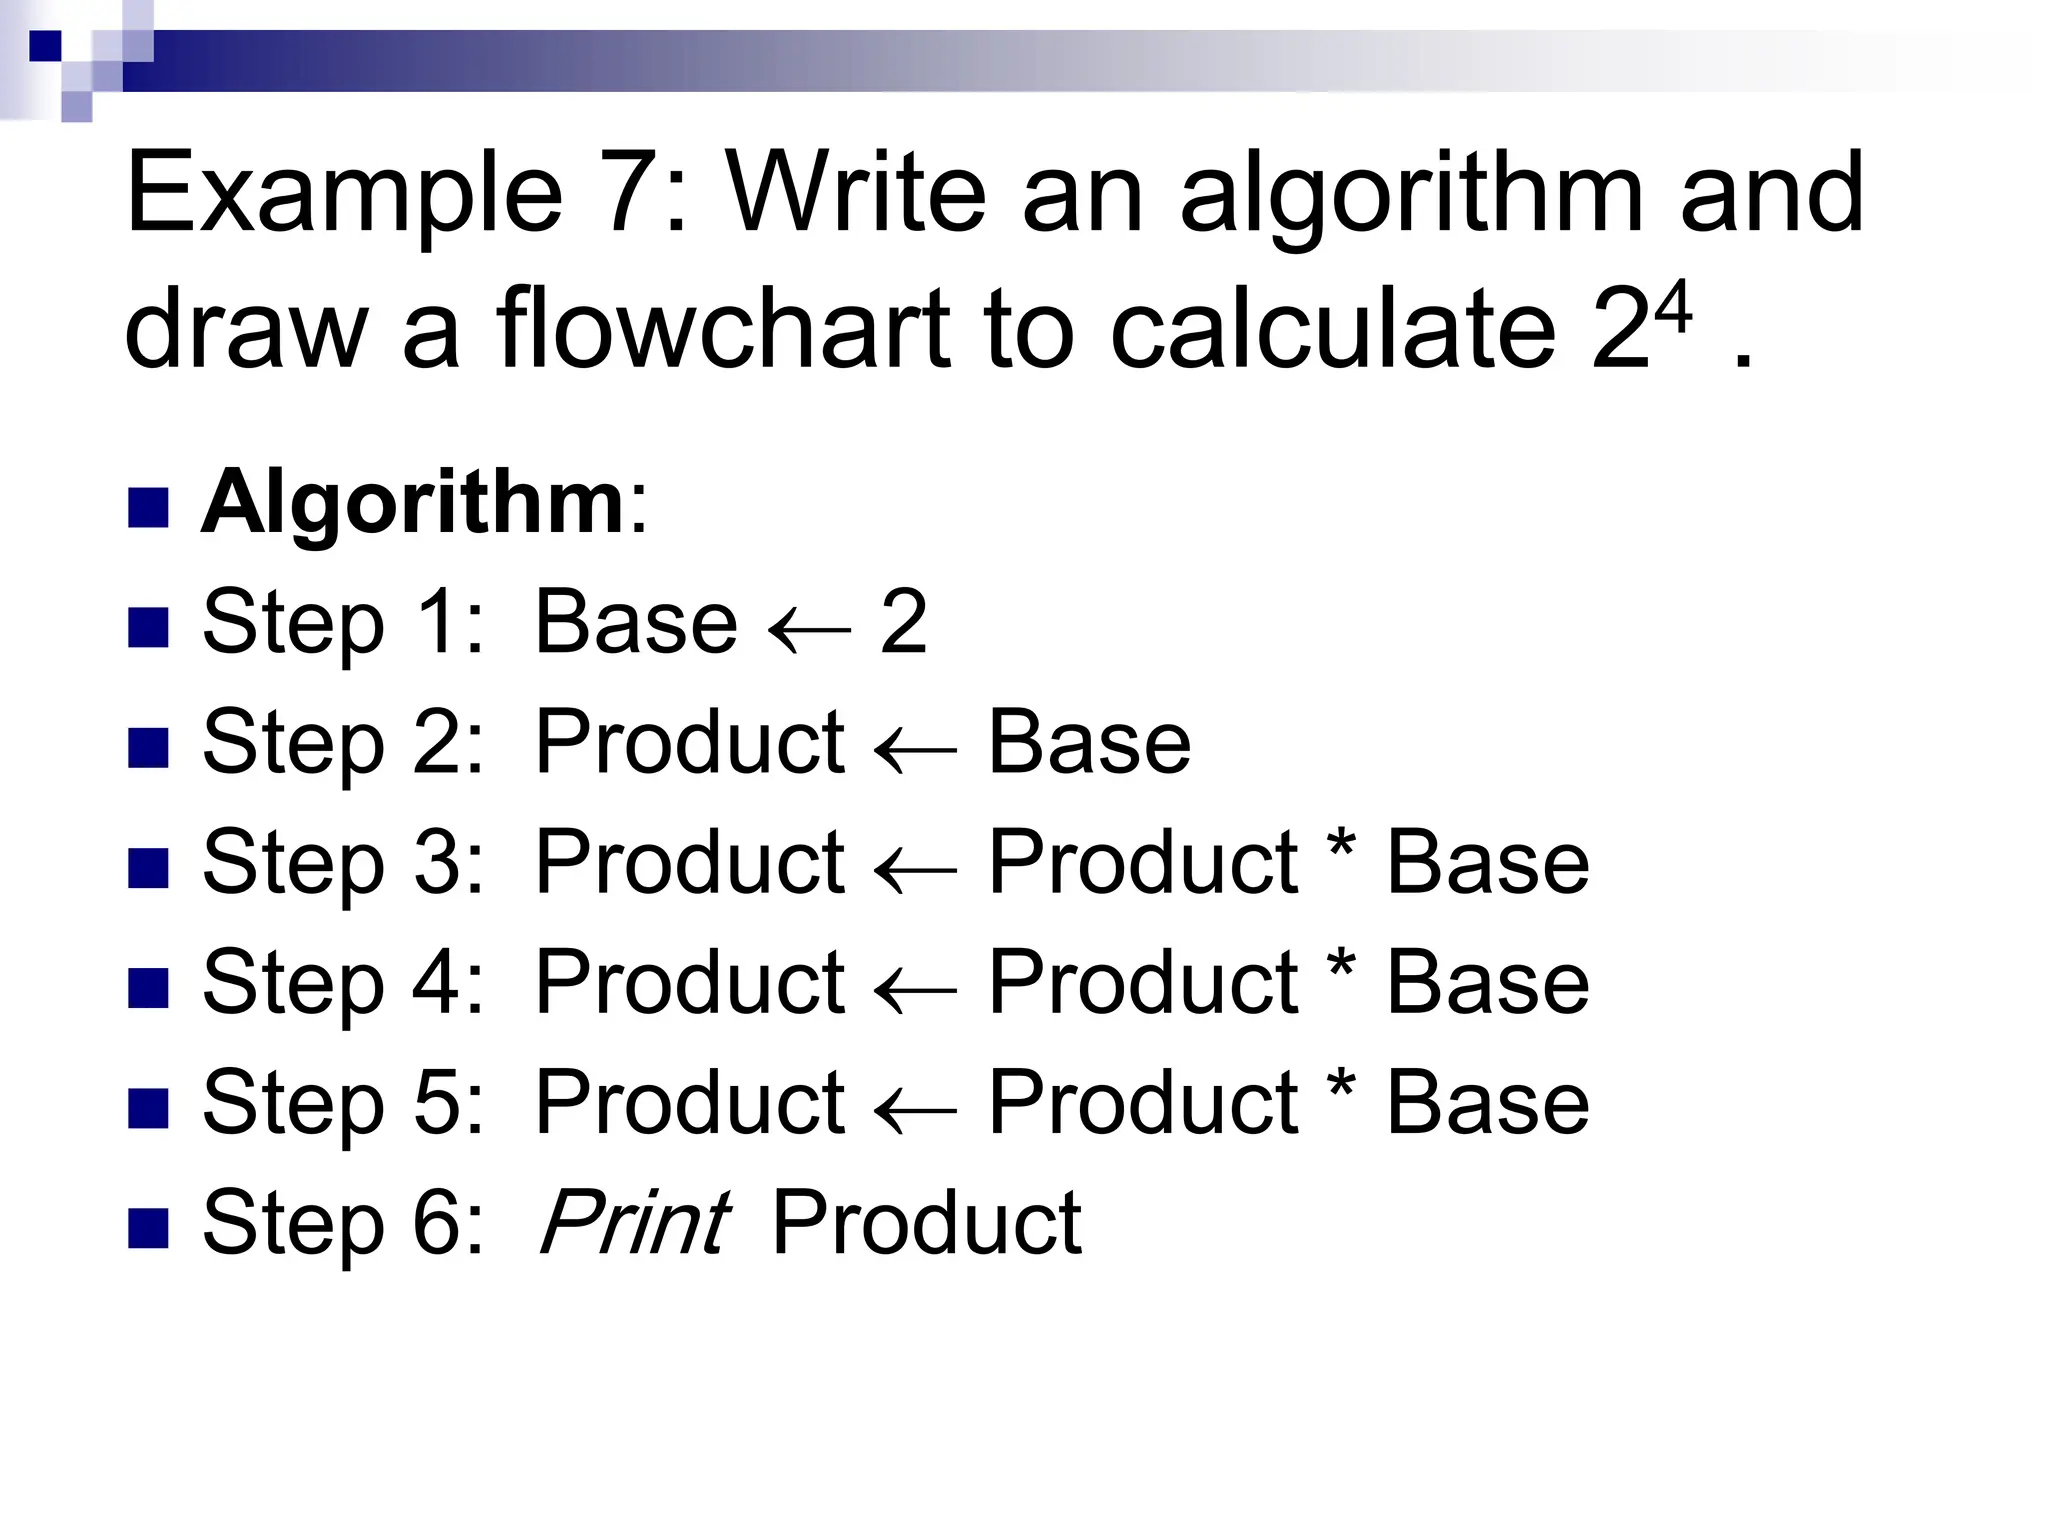
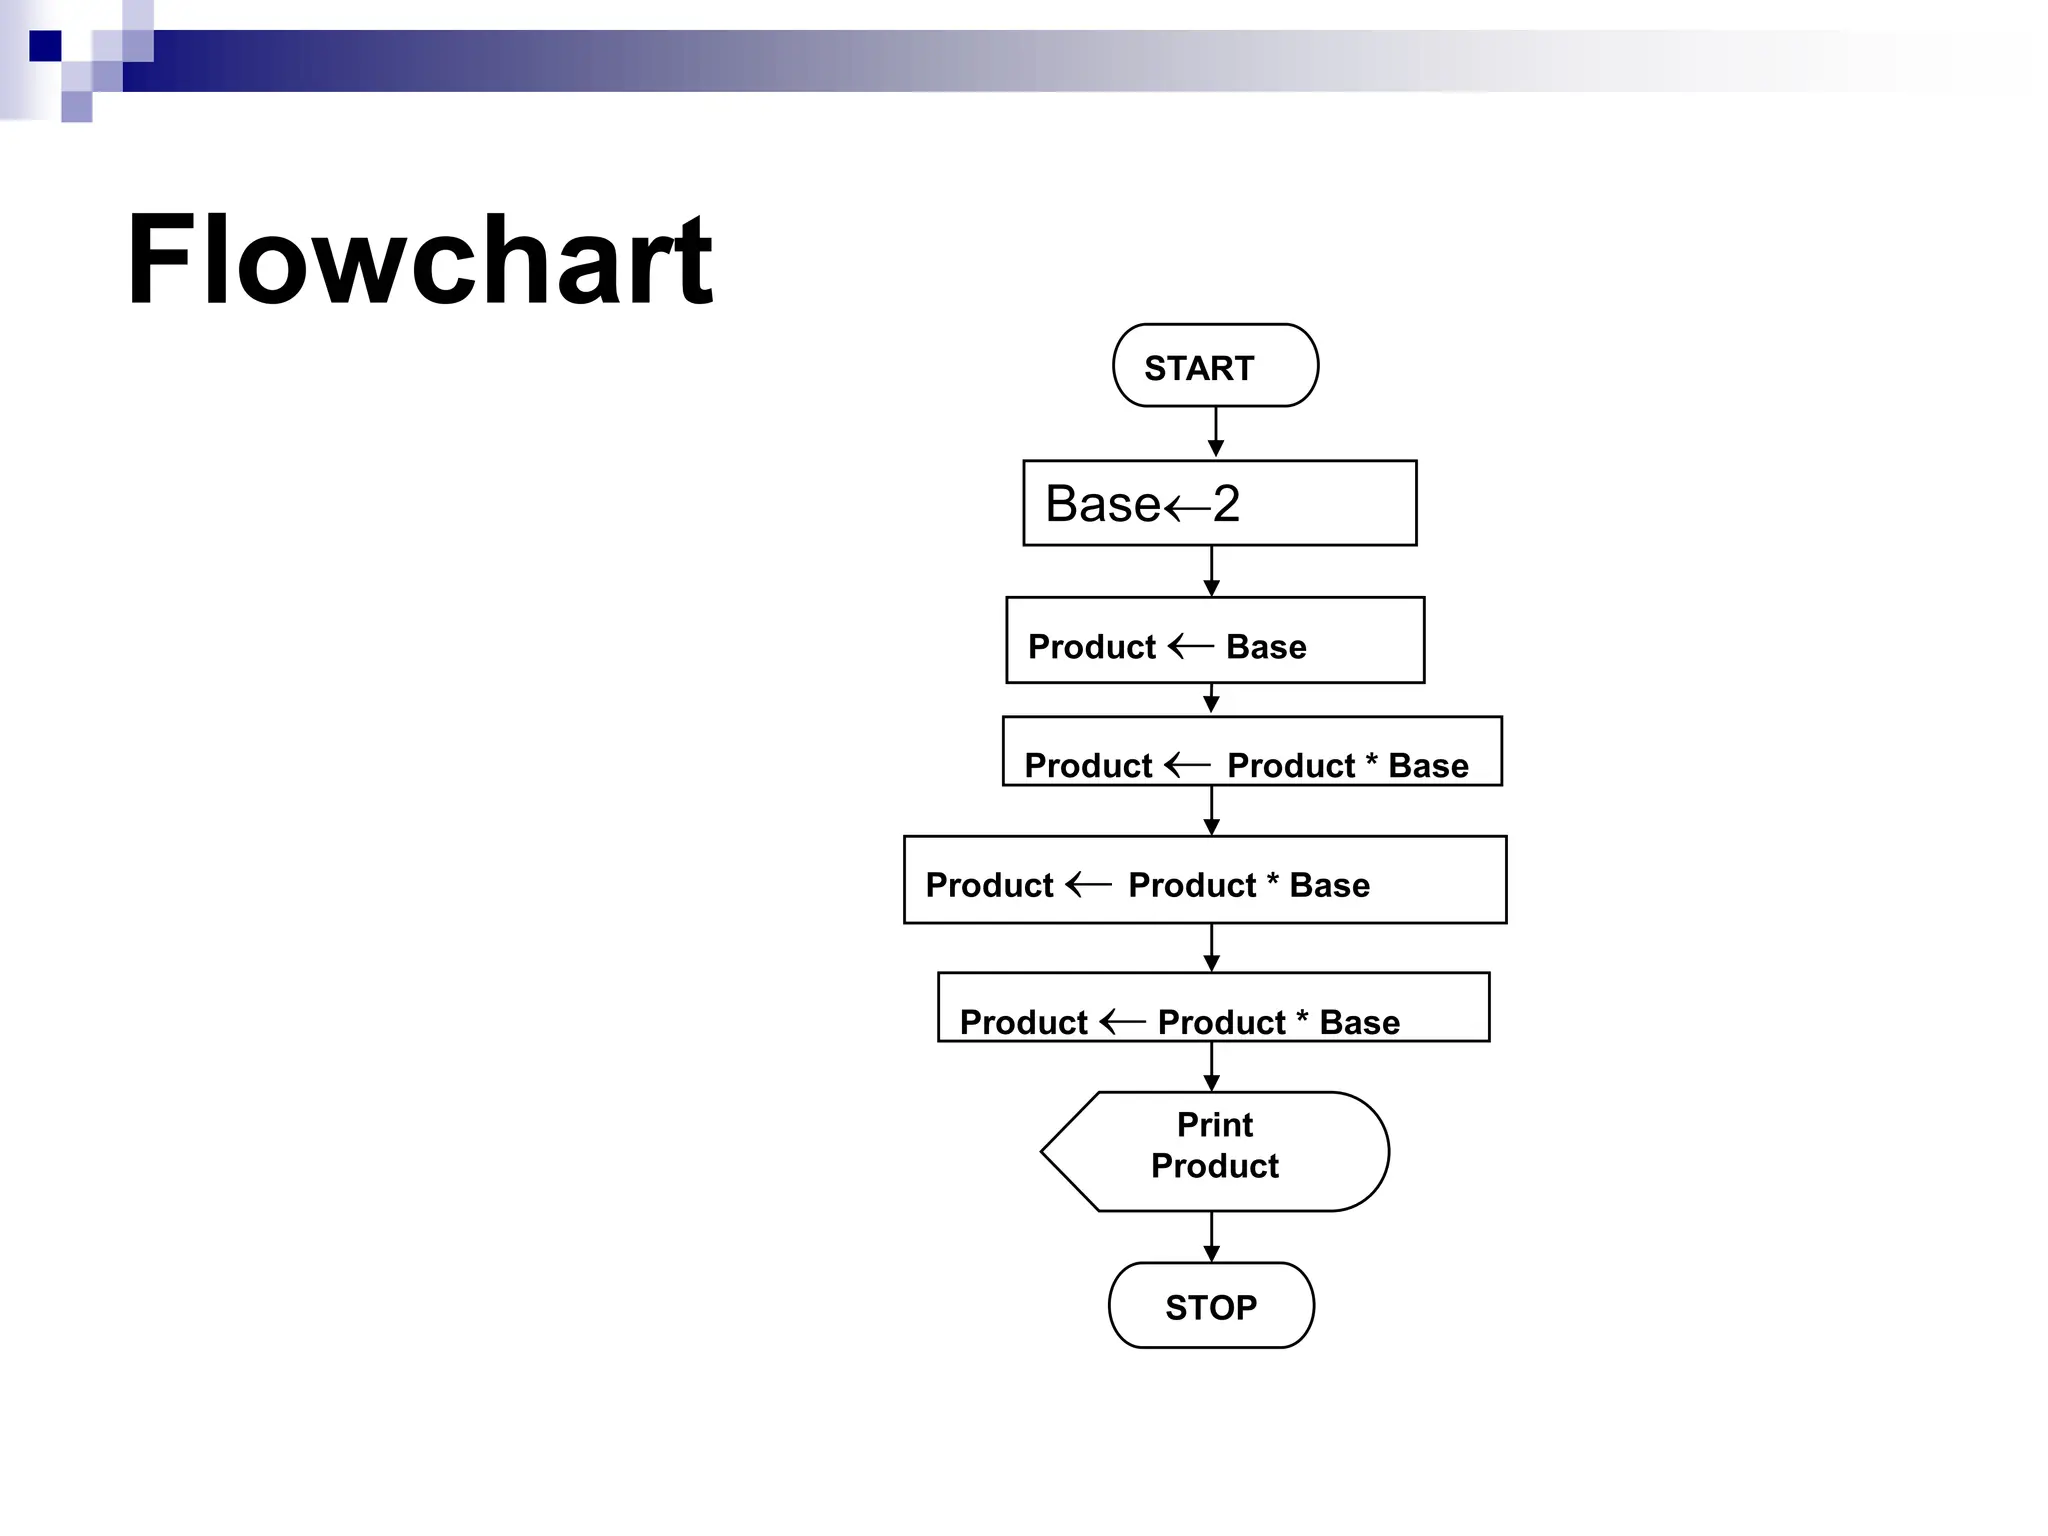
Example 7: Writean algorithm and
draw a flowchart to calculate 24 .
Algorithm:
Step 1: Base 2
Step 2: Product Base
Step 3: Product Product * Base
Step 4: Product Product * Base
Step 5: Product Product * Base
Step 6: Print Product
Question: Whathappens if you want to
calculate 2 to the power of 1000?
Answer: Use a LOOP (repeated execution
of the same set of instructions)
29.
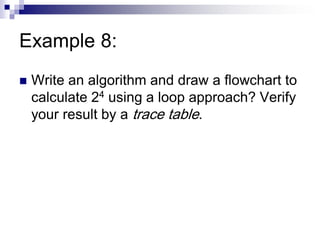
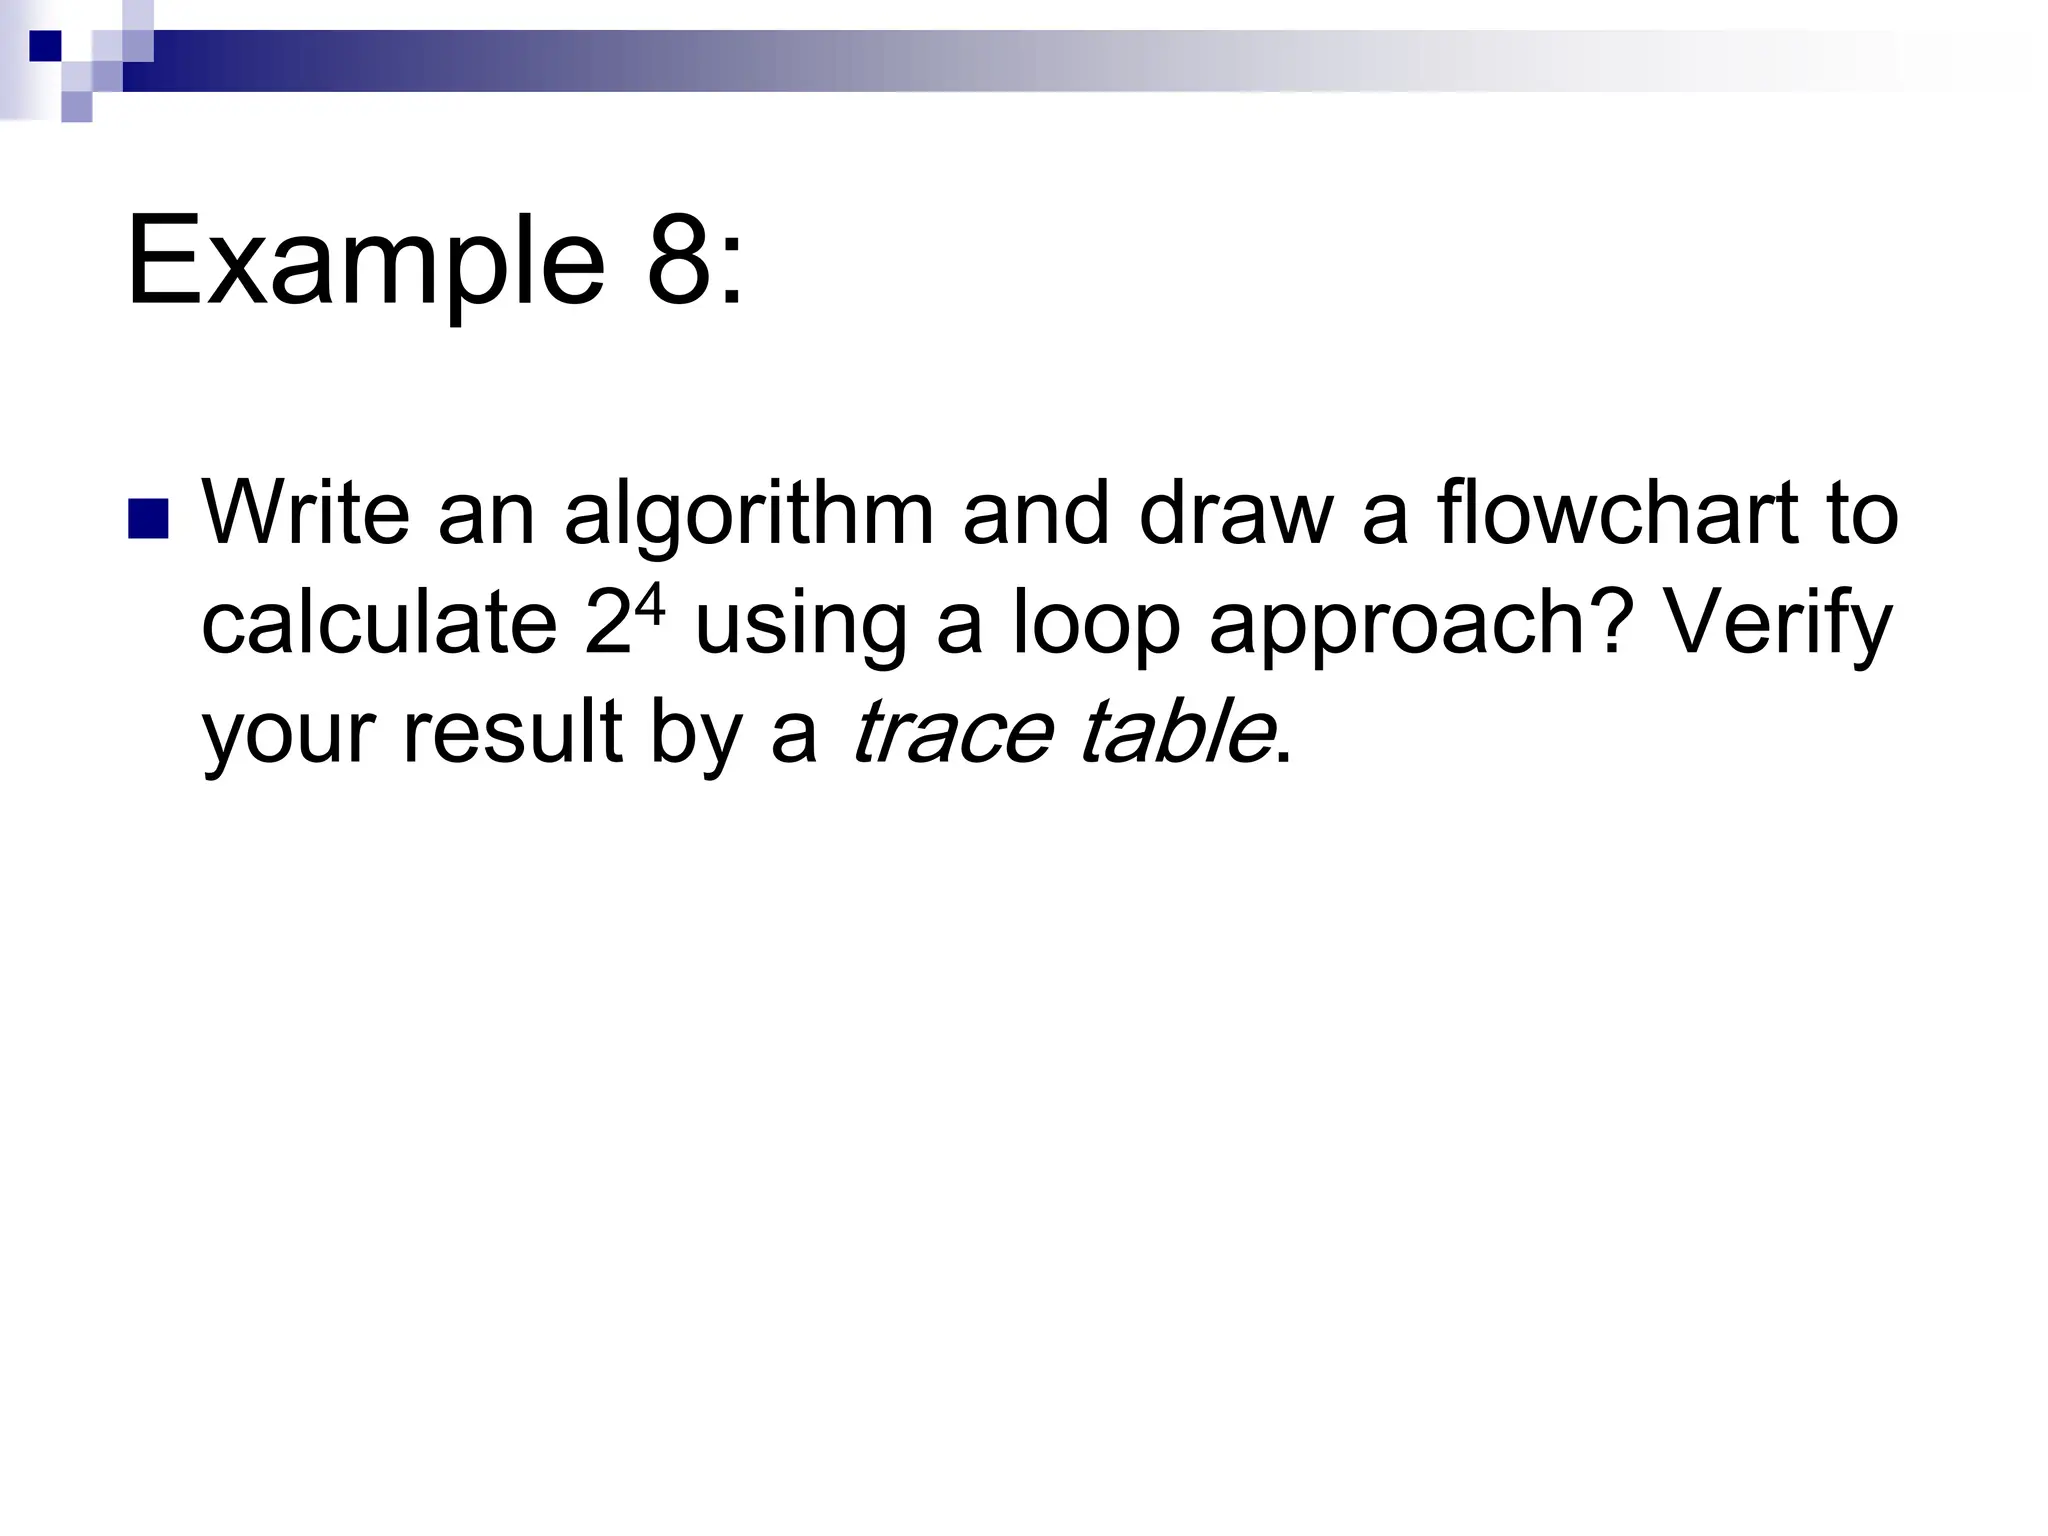
Example 8:
Writean algorithm and draw a flowchart to
calculate 24 using a loop approach? Verify
your result by a trace table.
30.
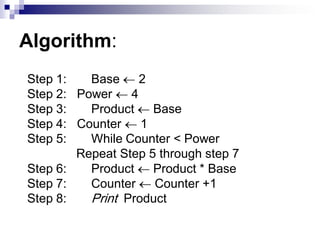
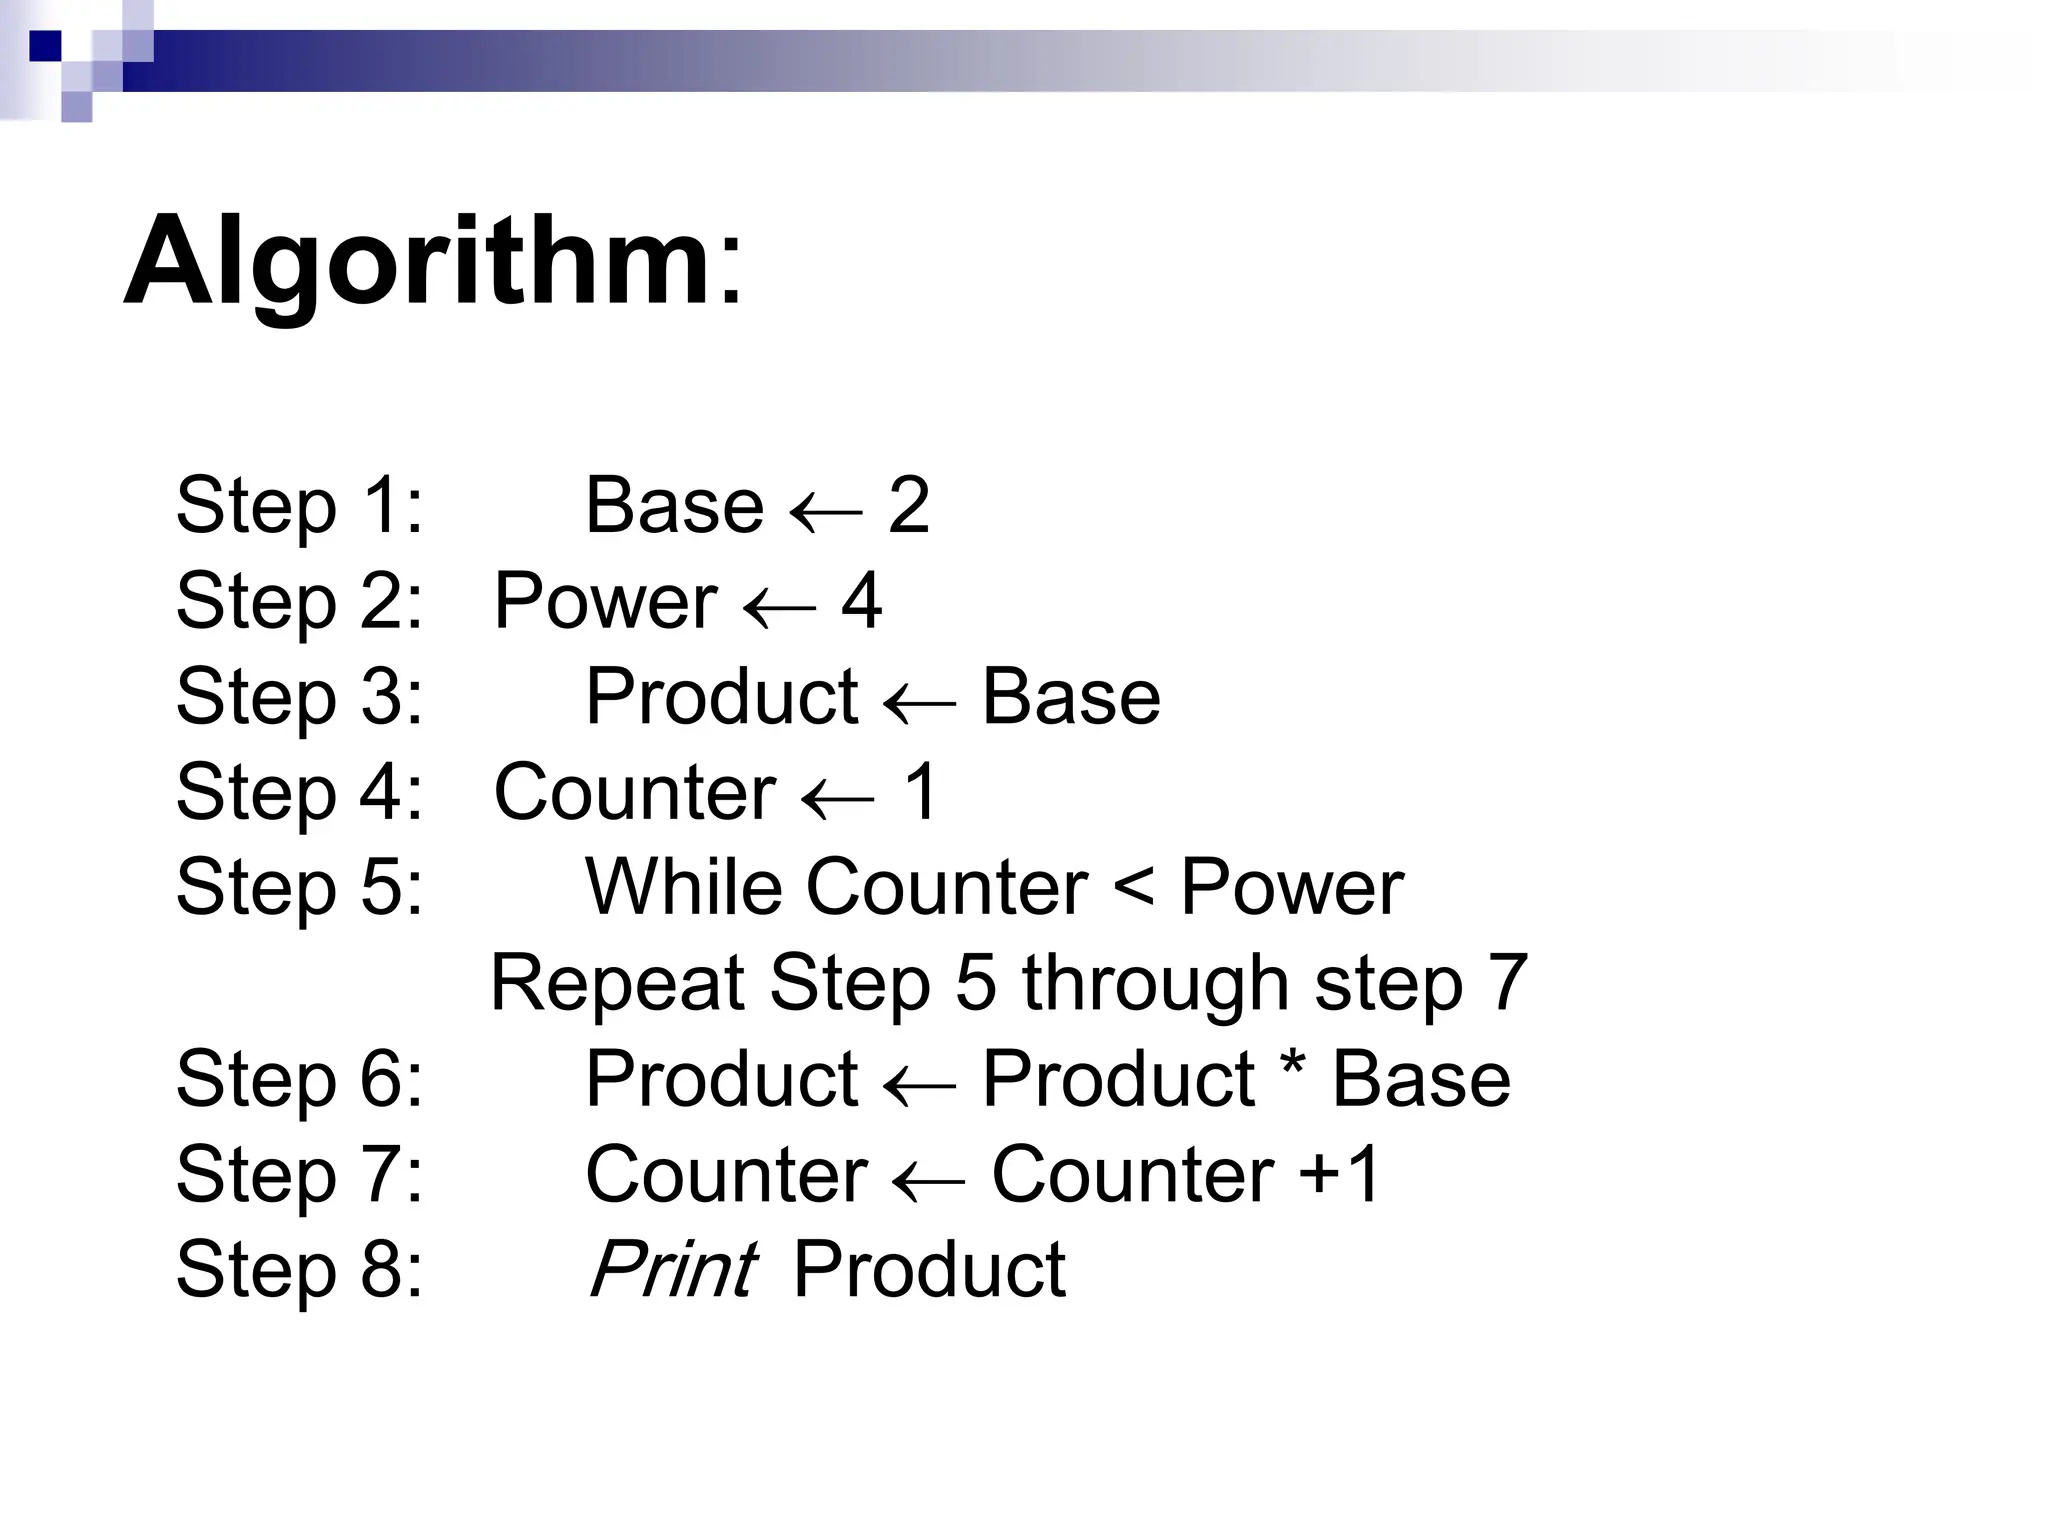
Algorithm:
Step 1: Base 2
Step 2: Power 4
Step 3: Product Base
Step 4: Counter 1
Step 5: While Counter < Power
Repeat Step 5 through step 7
Step 6: Product Product * Base
Step 7: Counter Counter +1
Step 8: Print Product
31.
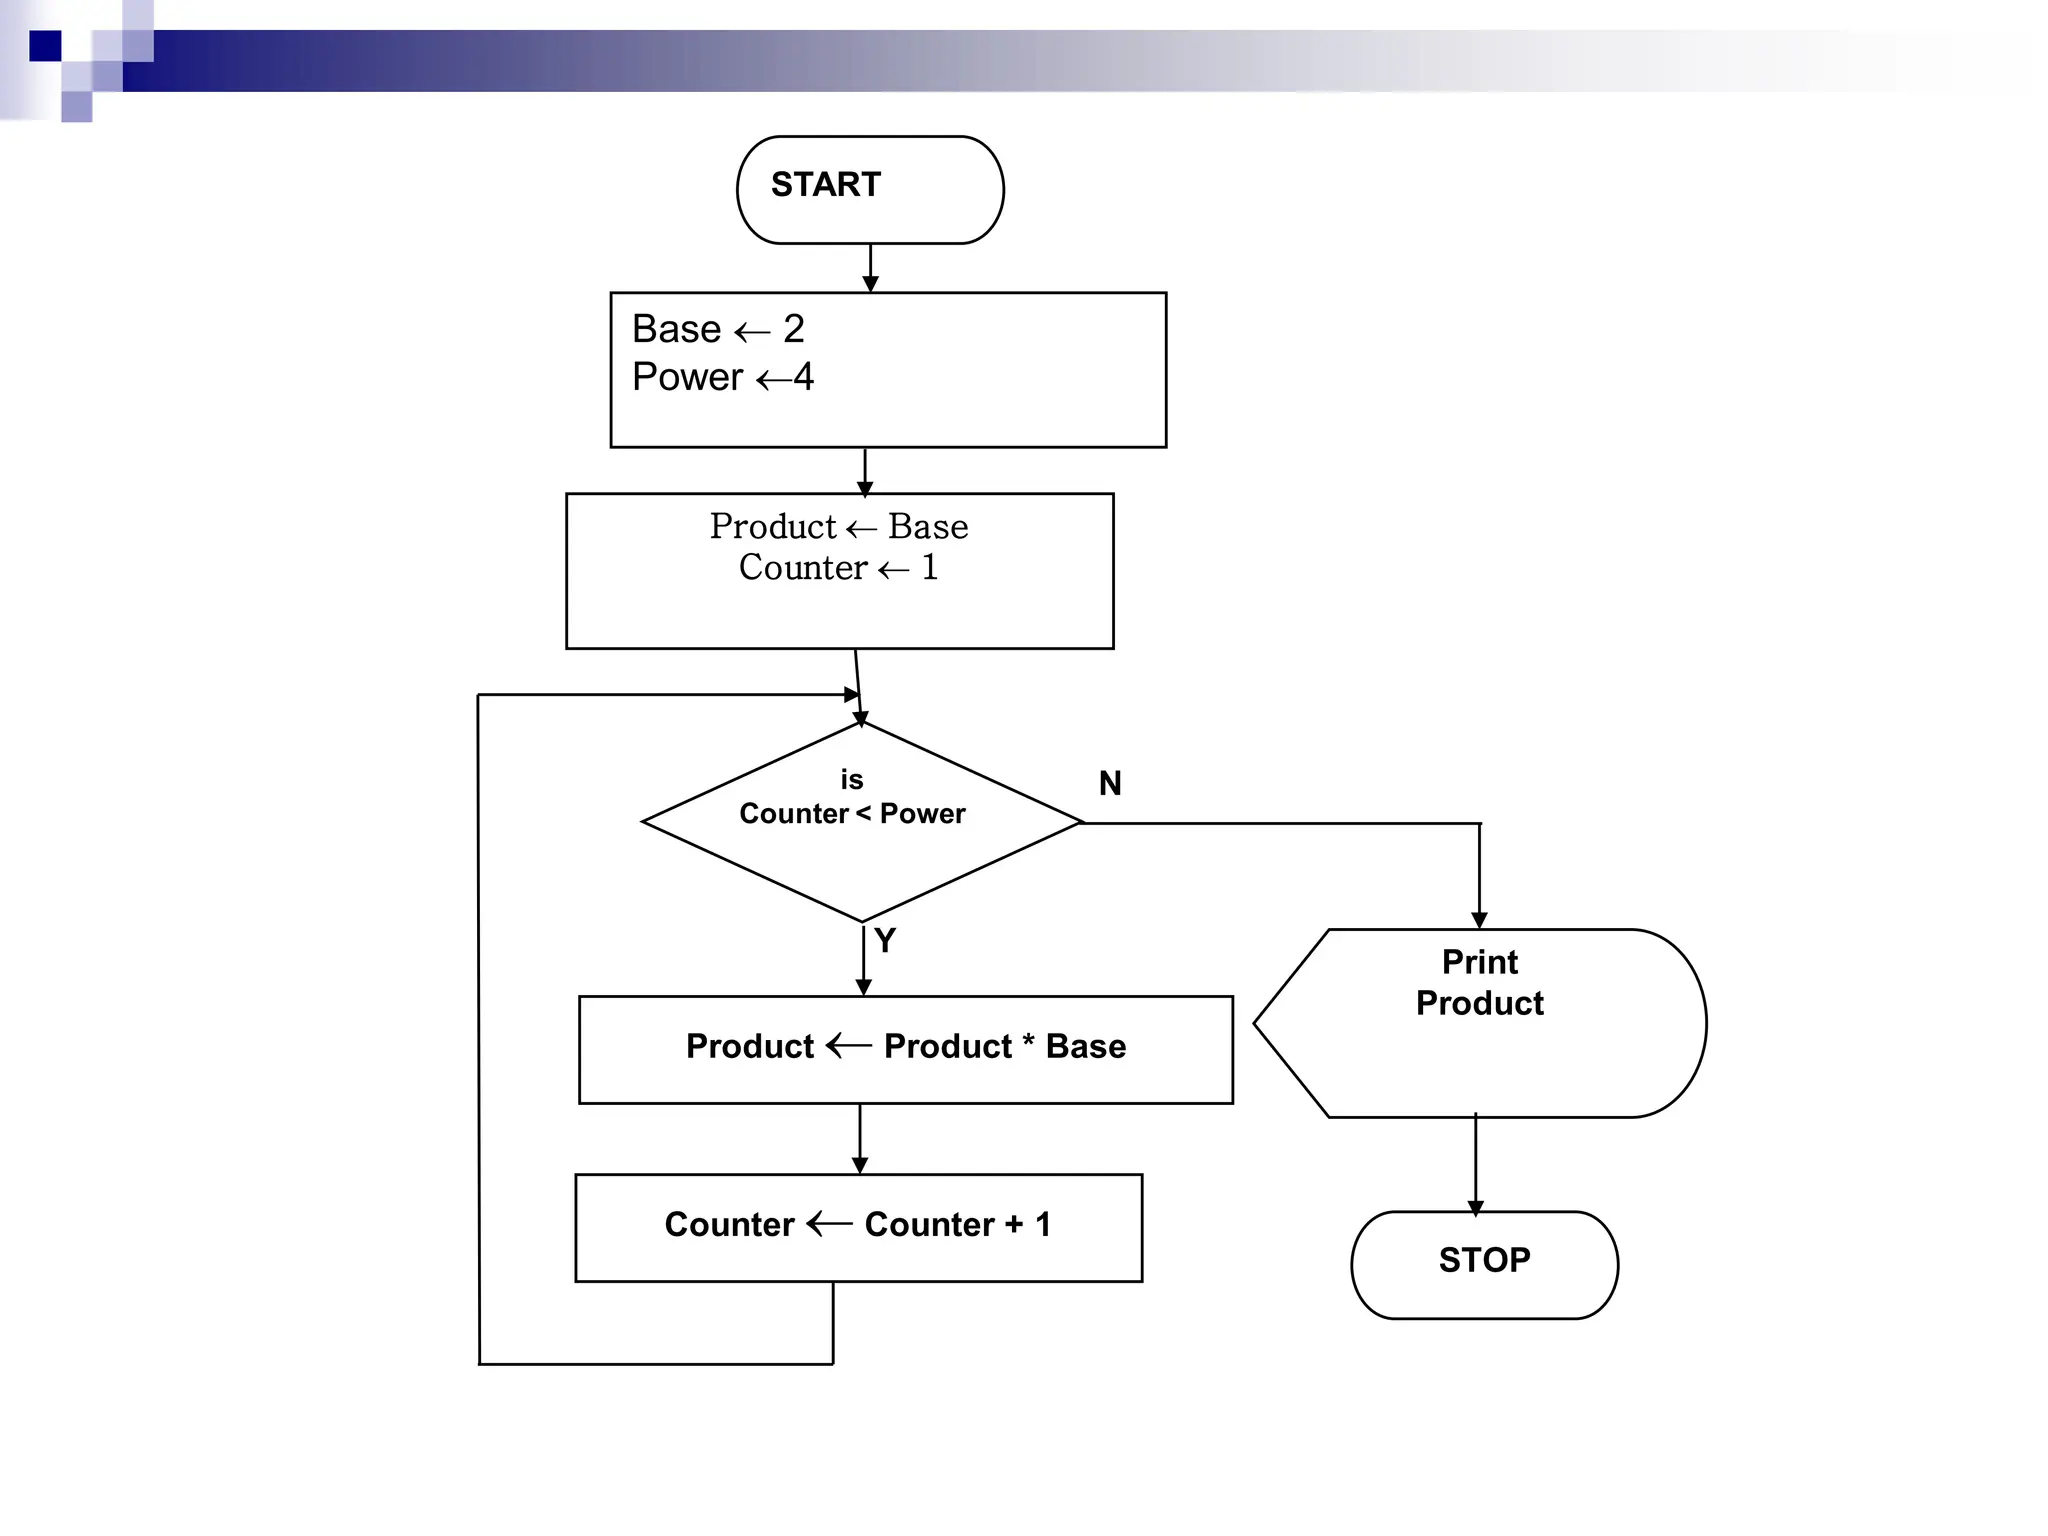
START
Product Base
Counter 1
Print
Product
STOP
Y
is
Counter < Power
Product Product * Base
Counter Counter + 1
N
Base 2
Power 4
32.
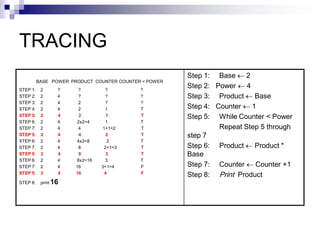
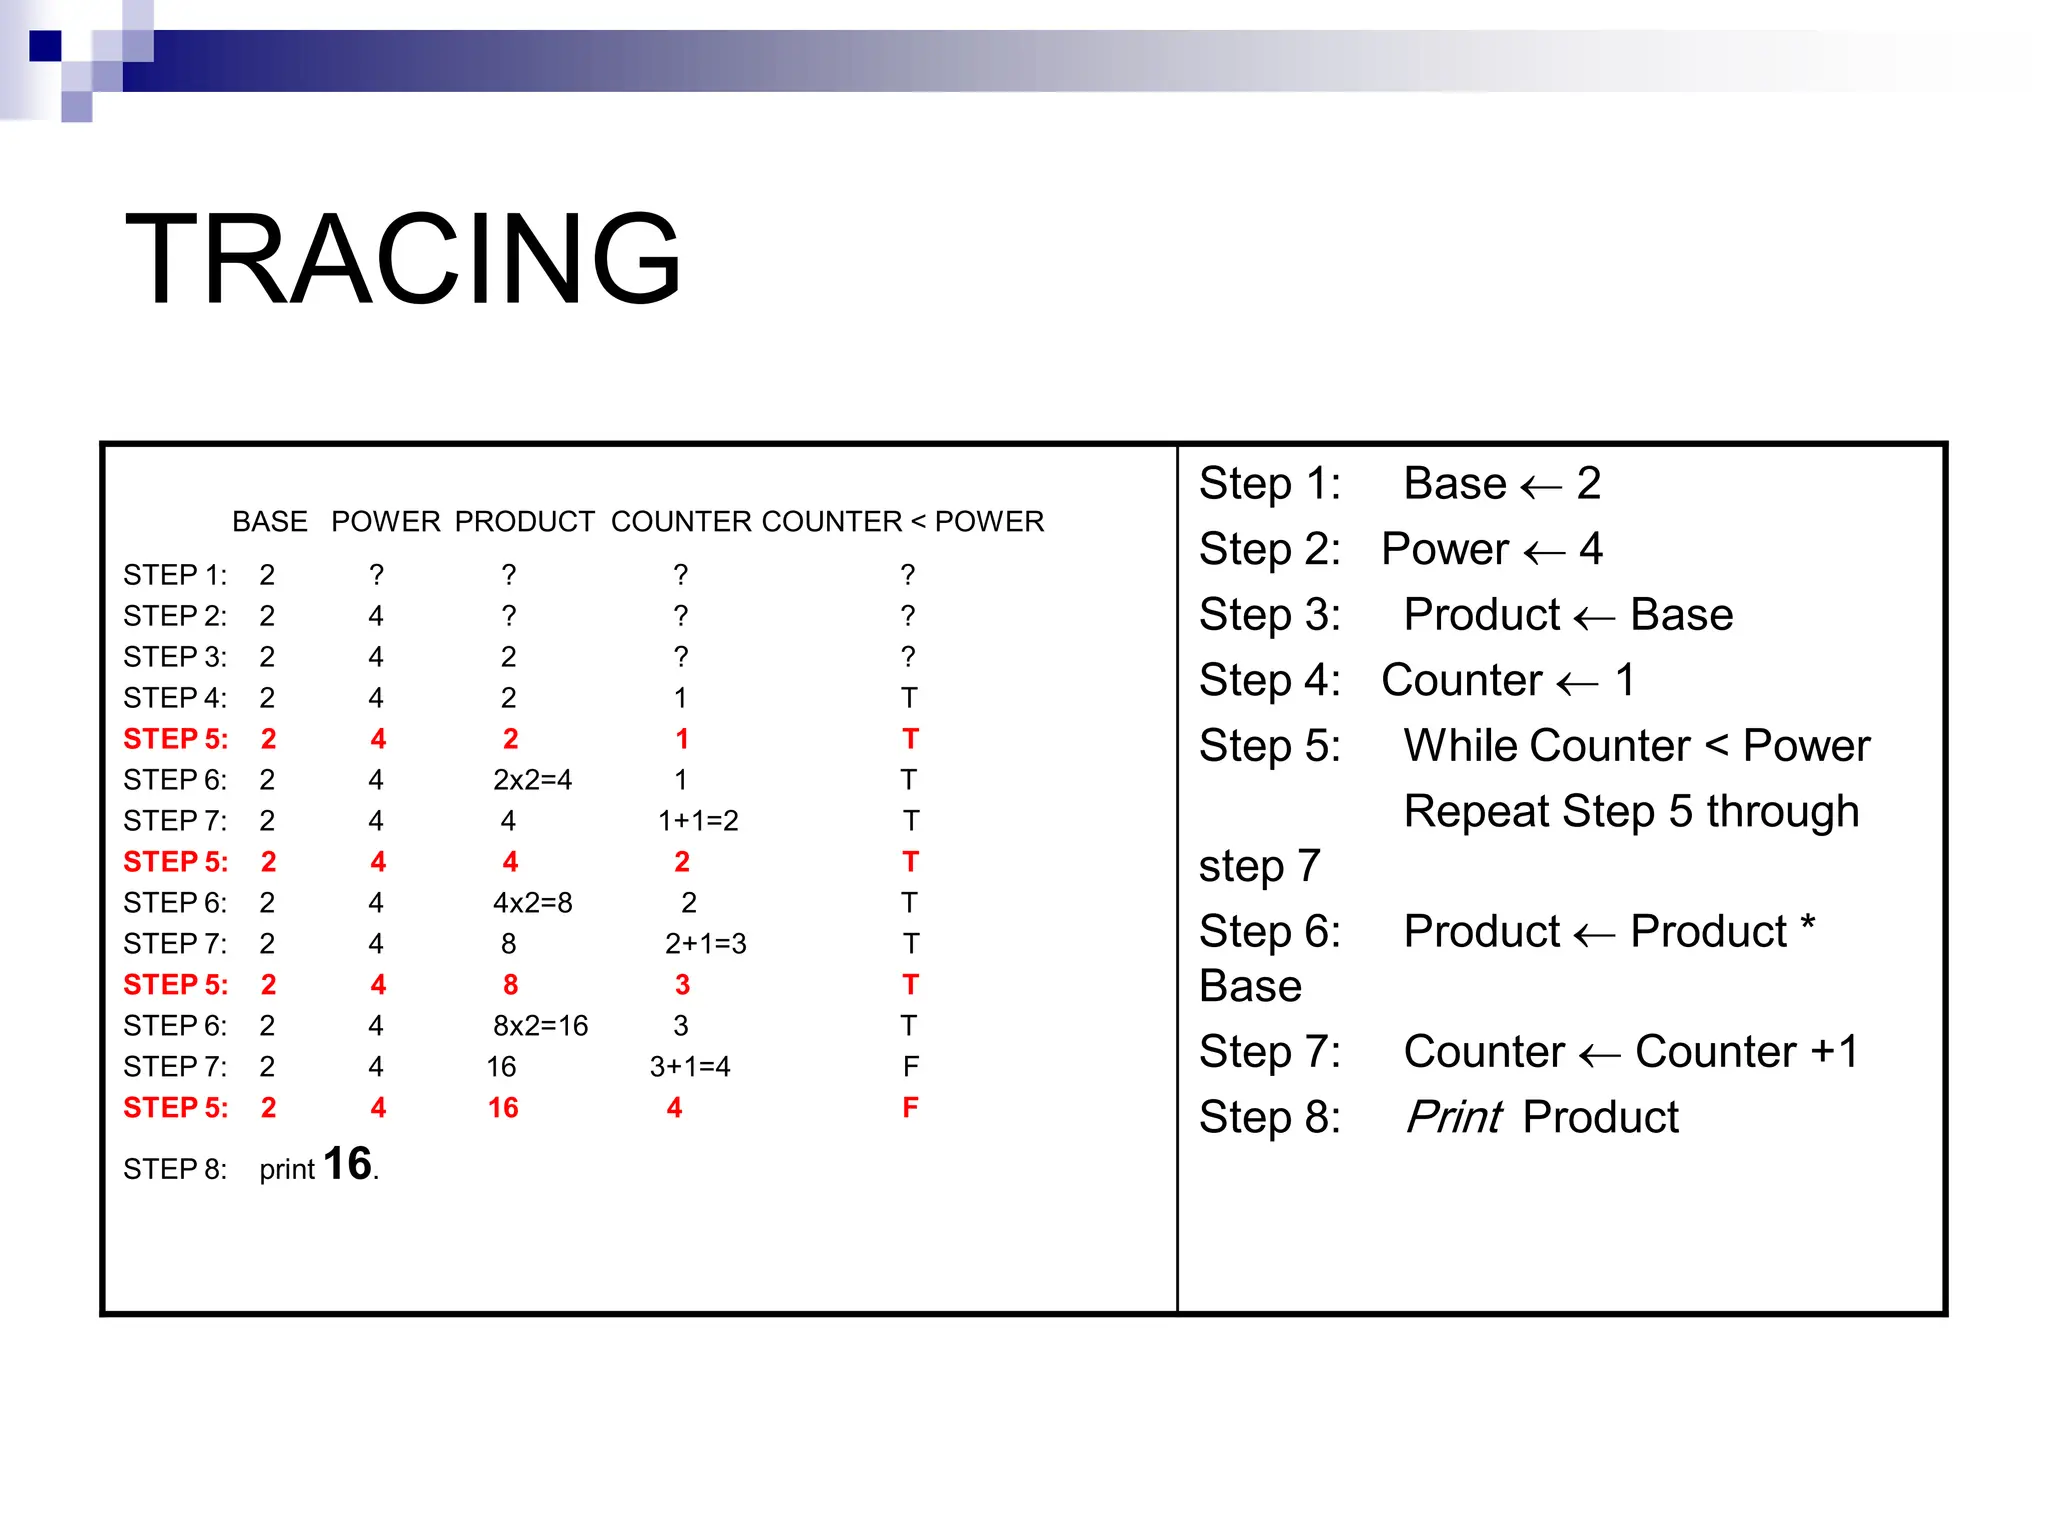
TRACING
BASE POWER PRODUCTCOUNTER COUNTER < POWER
STEP 1: 2 ? ? ? ?
STEP 2: 2 4 ? ? ?
STEP 3: 2 4 2 ? ?
STEP 4: 2 4 2 1 T
STEP 5: 2 4 2 1 T
STEP 6: 2 4 2x2=4 1 T
STEP 7: 2 4 4 1+1=2 T
STEP 5: 2 4 4 2 T
STEP 6: 2 4 4x2=8 2 T
STEP 7: 2 4 8 2+1=3 T
STEP 5: 2 4 8 3 T
STEP 6: 2 4 8x2=16 3 T
STEP 7: 2 4 16 3+1=4 F
STEP 5: 2 4 16 4 F
STEP 8: print 16.
Step 1: Base 2
Step 2: Power 4
Step 3: Product Base
Step 4: Counter 1
Step 5: While Counter < Power
Repeat Step 5 through
step 7
Step 6: Product Product *
Base
Step 7: Counter Counter +1
Step 8: Print Product
33.
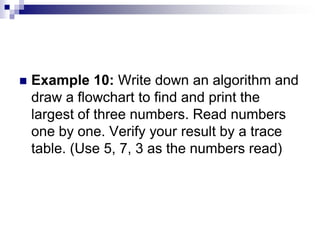
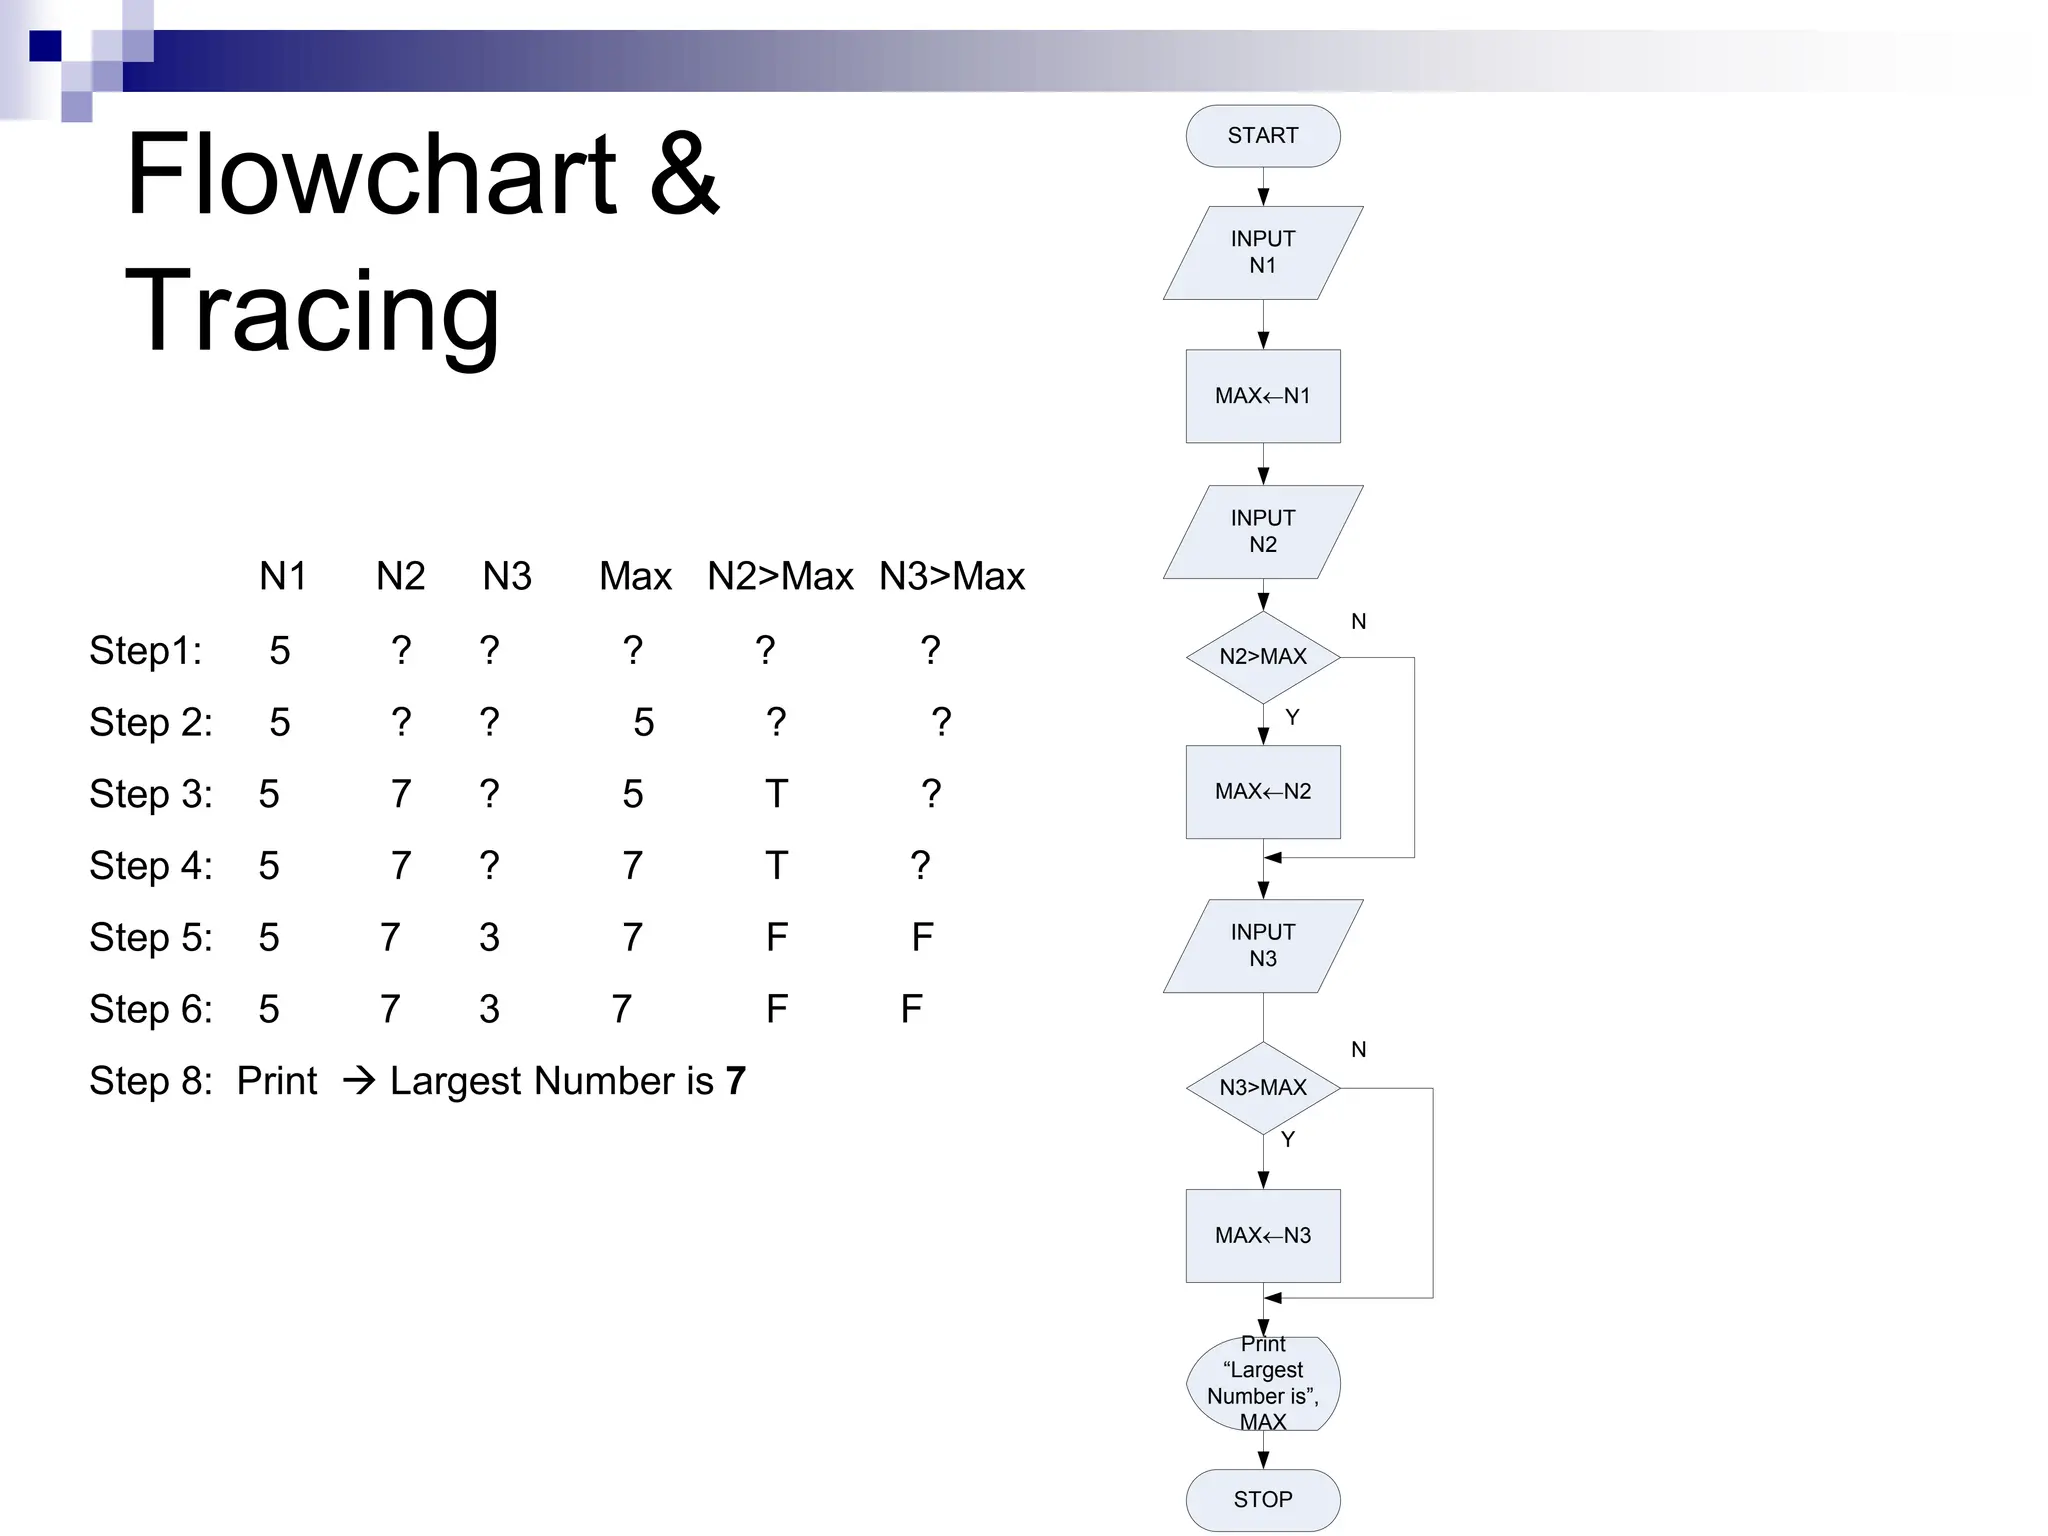
Example 10:Write down an algorithm and
draw a flowchart to find and print the
largest of three numbers. Read numbers
one by one. Verify your result by a trace
table. (Use 5, 7, 3 as the numbers read)
34.
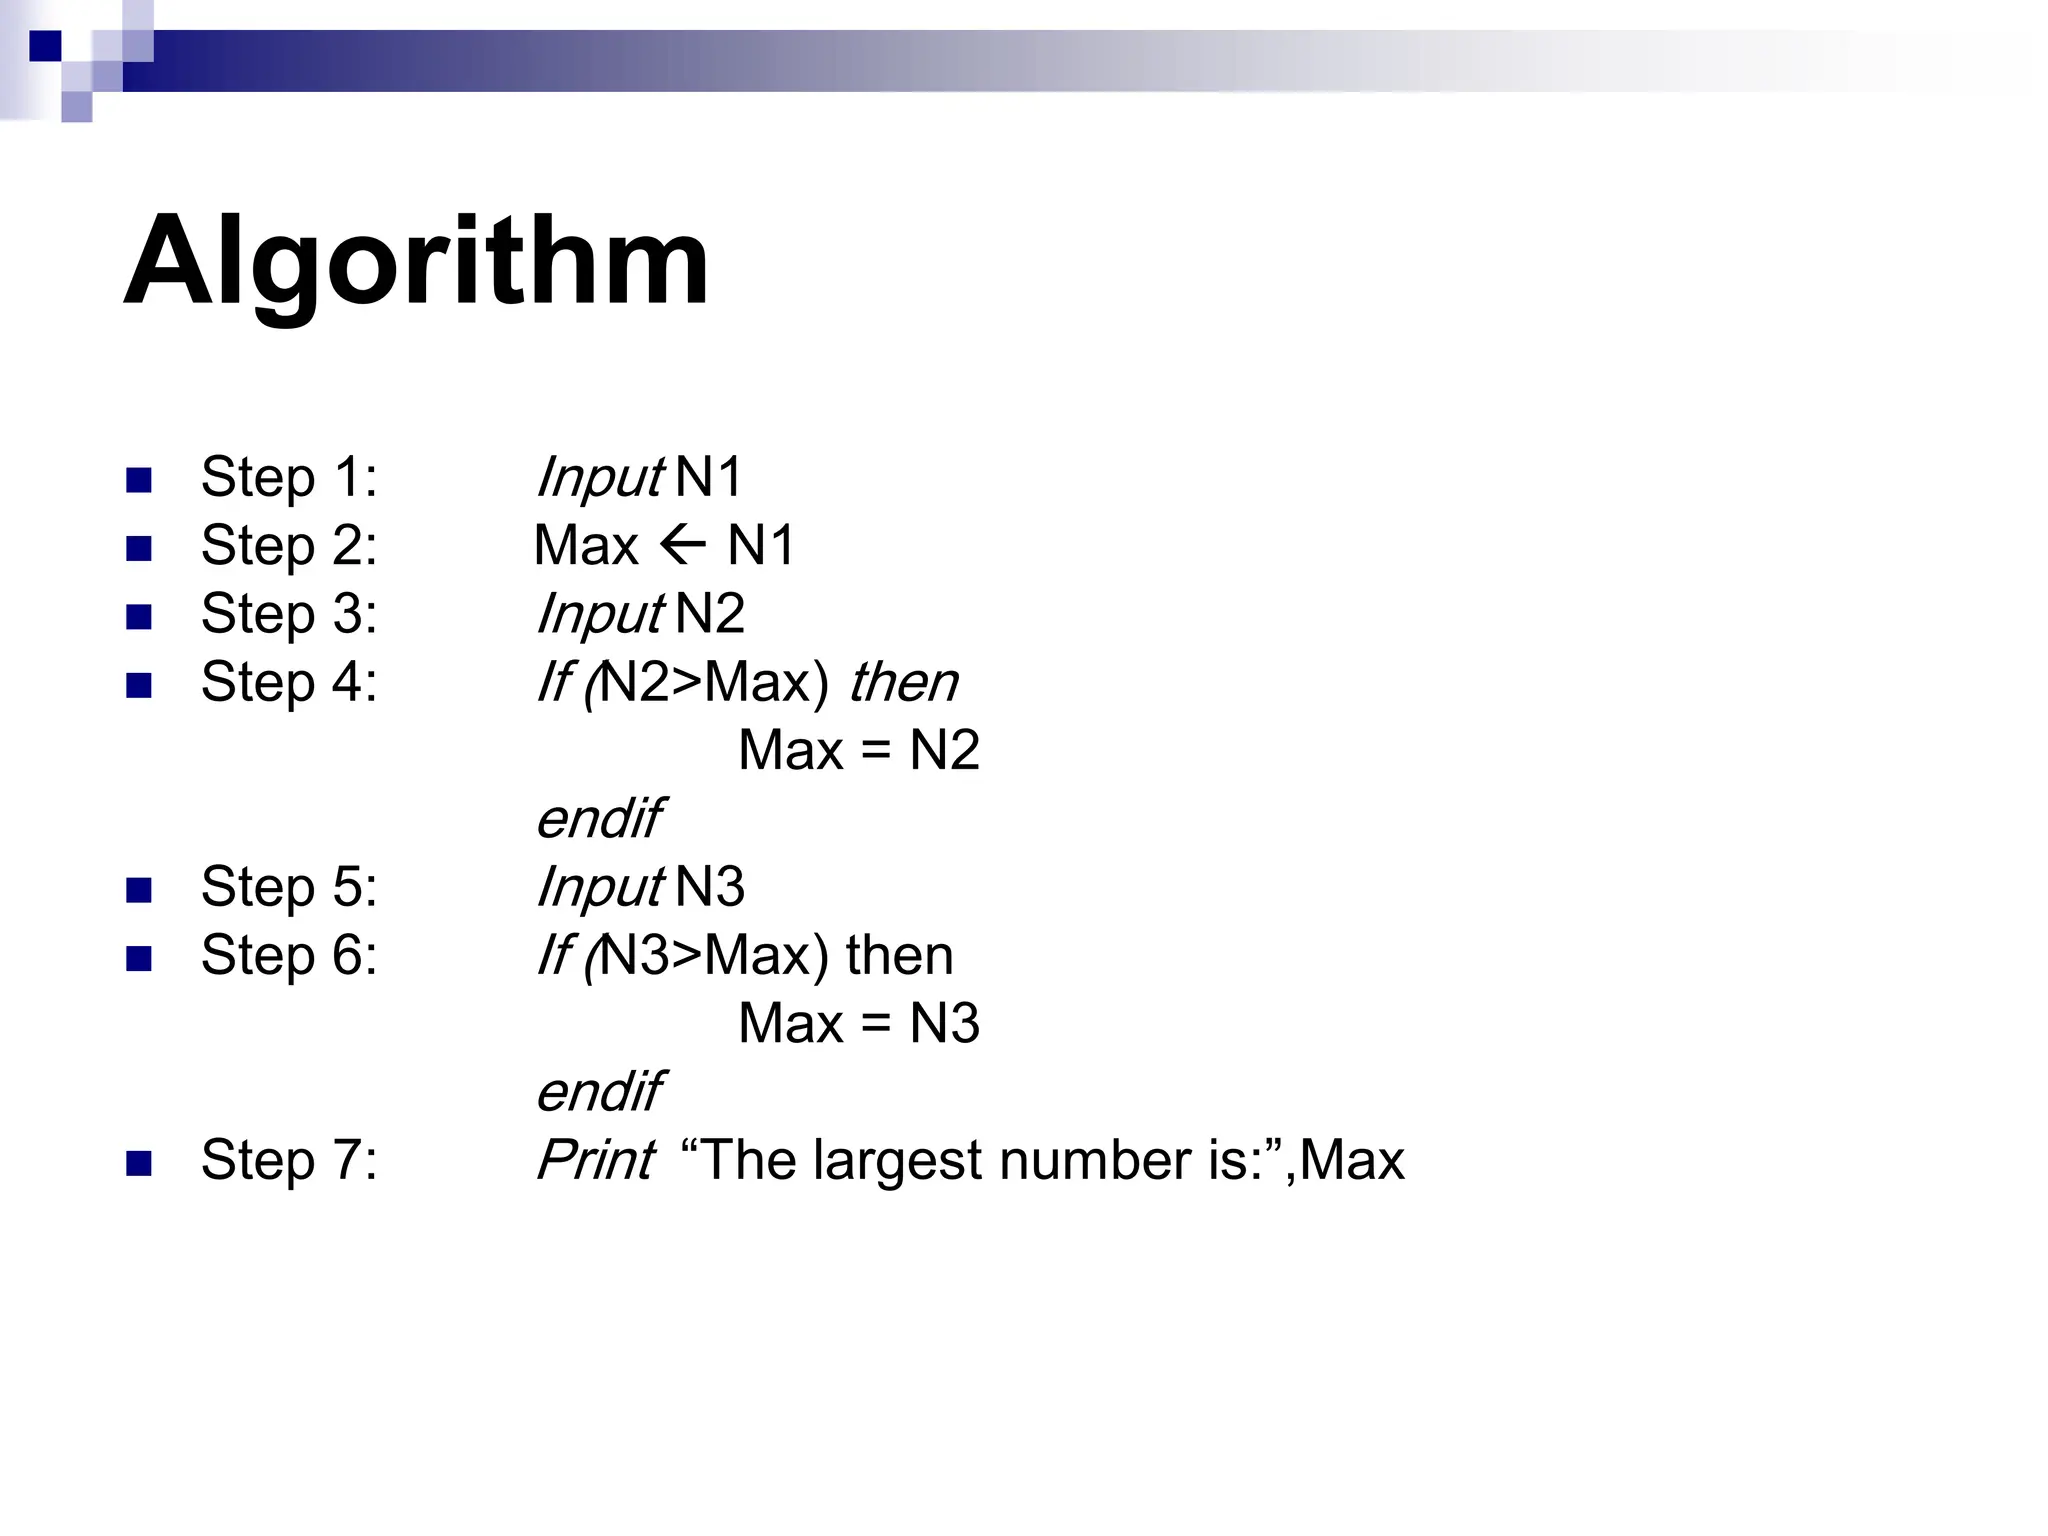
Algorithm
Step 1:Input N1
Step 2: Max N1
Step 3: Input N2
Step 4: If (N2>Max) then
Max = N2
endif
Step 5: Input N3
Step 6: If (N3>Max) then
Max = N3
endif
Step 7: Print “The largest number is:”,Max
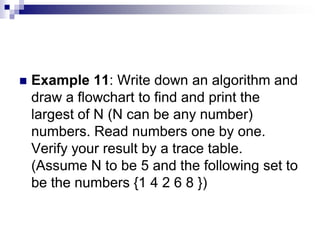
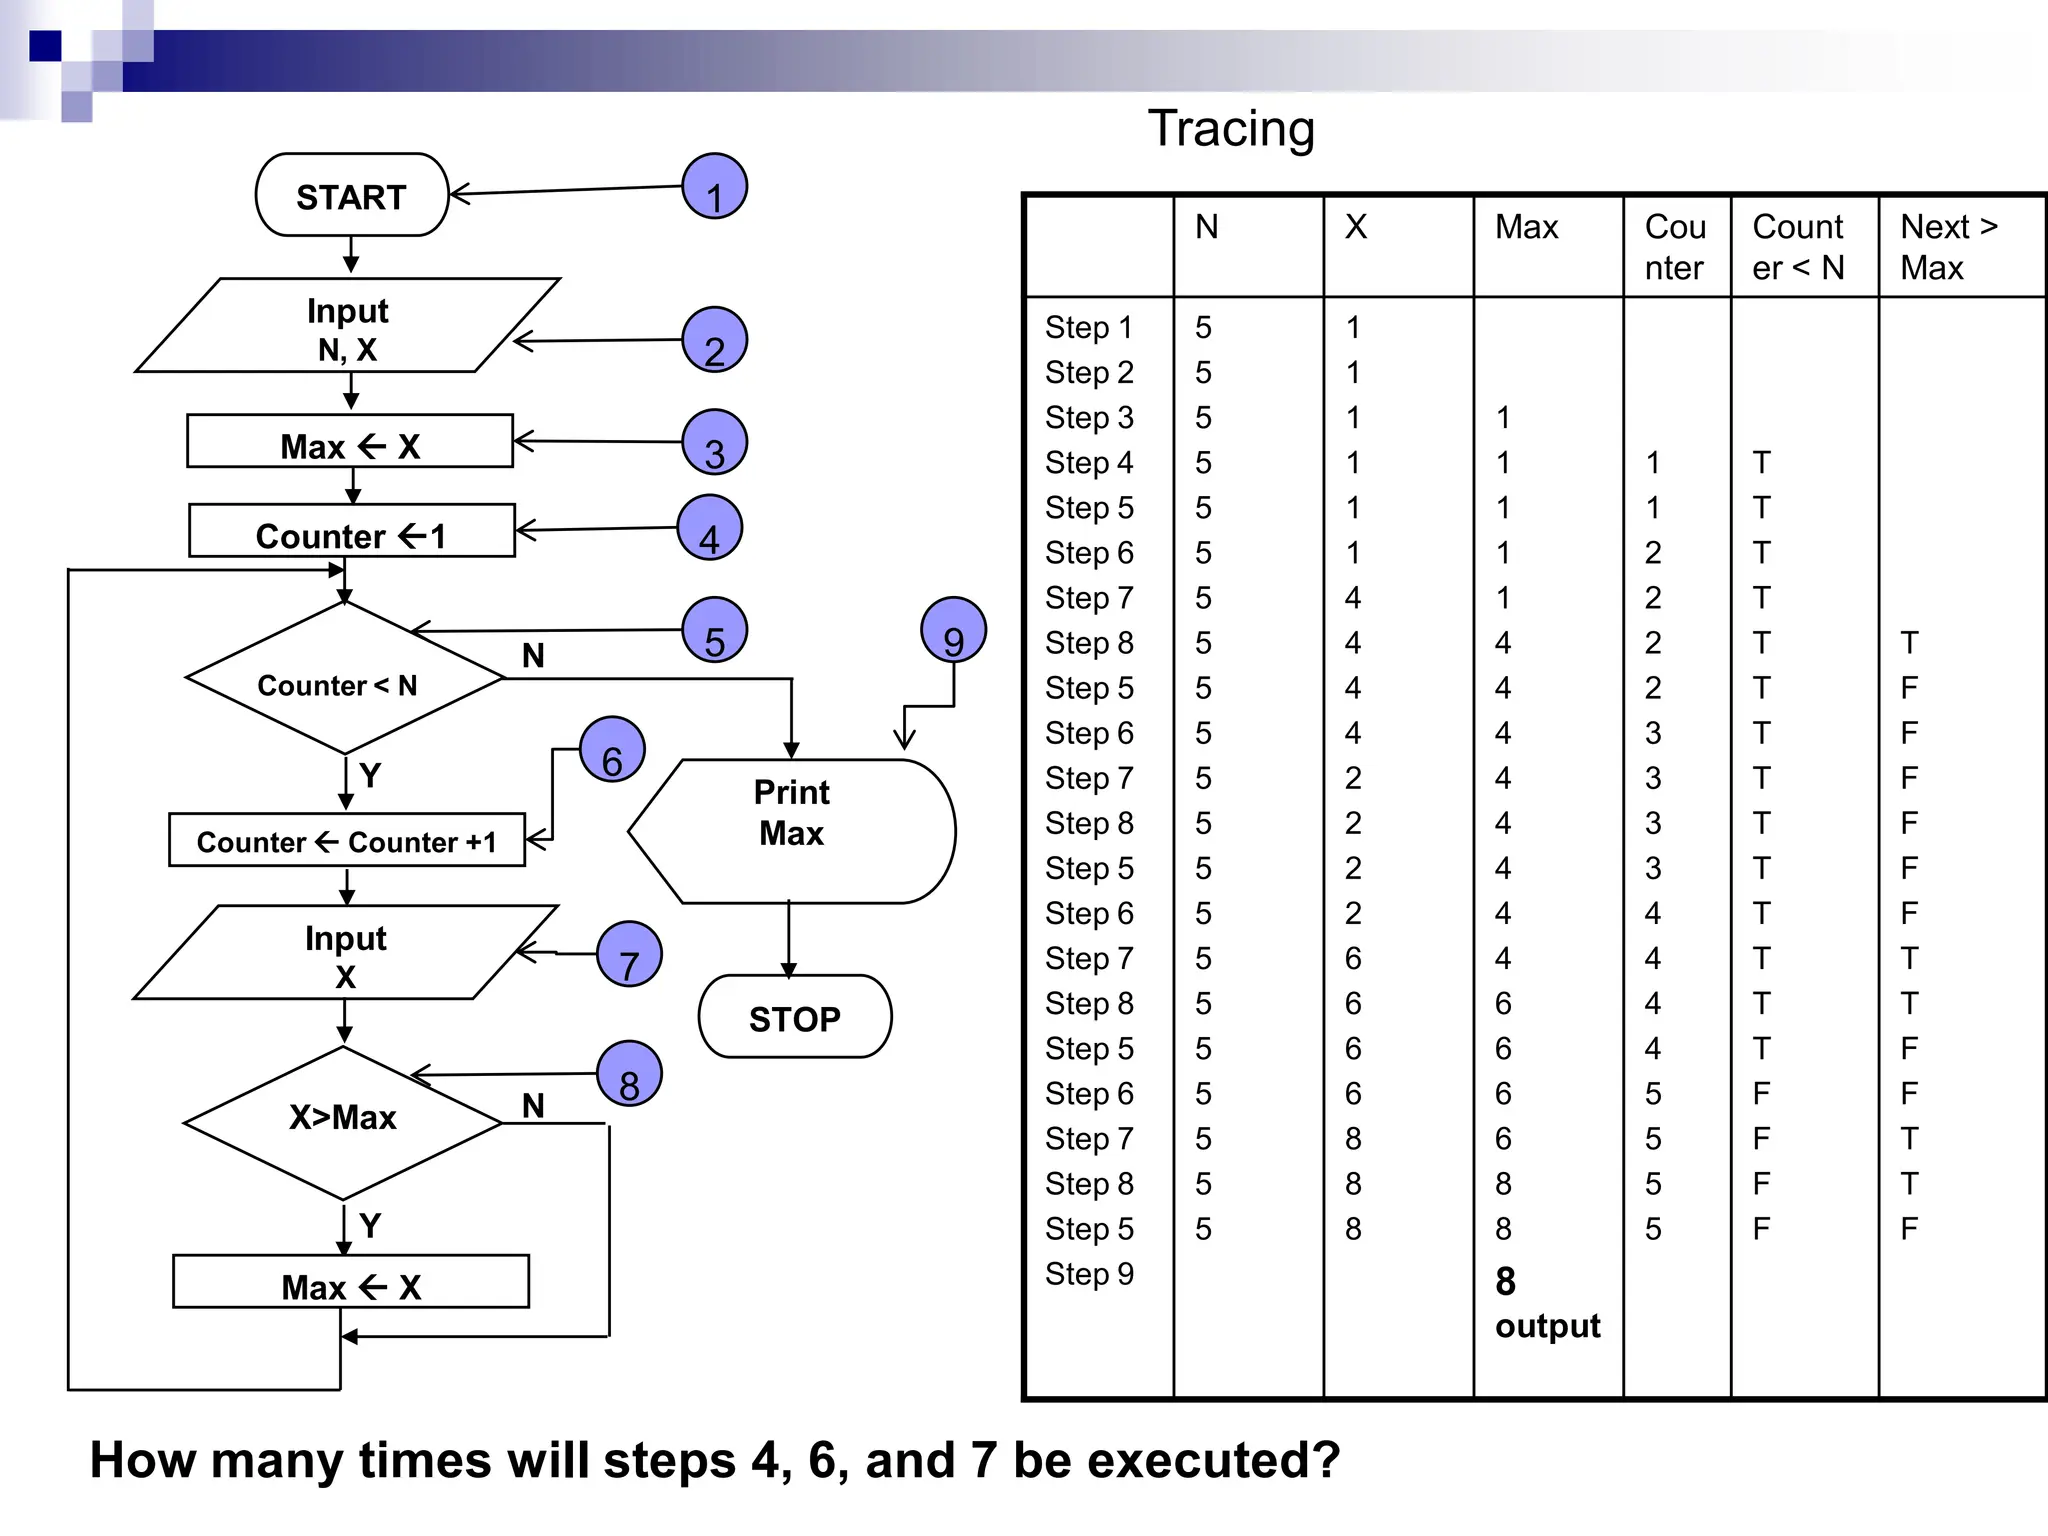
Example 11:Write down an algorithm and
draw a flowchart to find and print the
largest of N (N can be any number)
numbers. Read numbers one by one.
Verify your result by a trace table.
(Assume N to be 5 and the following set to
be the numbers {1 4 2 6 8 })
37.
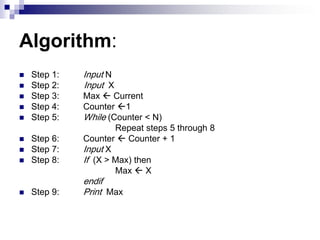
Algorithm:
Step 1:Input N
Step 2: Input X
Step 3: Max Current
Step 4: Counter 1
Step 5: While (Counter < N)
Repeat steps 5 through 8
Step 6: Counter Counter + 1
Step 7: Input X
Step 8: If (X > Max) then
Max X
endif
Step 9: Print Max
38.
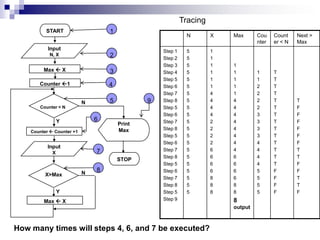
N X MaxCou
nter
Count
er < N
Next >
Max
Step 1
Step 2
Step 3
Step 4
Step 5
Step 6
Step 7
Step 8
Step 5
Step 6
Step 7
Step 8
Step 5
Step 6
Step 7
Step 8
Step 5
Step 6
Step 7
Step 8
Step 5
Step 9
5
5
5
5
5
5
5
5
5
5
5
5
5
5
5
5
5
5
5
5
5
1
1
1
1
1
1
4
4
4
4
2
2
2
2
6
6
6
6
8
8
8
1
1
1
1
1
4
4
4
4
4
4
4
4
6
6
6
6
8
8
8
output
1
1
2
2
2
2
3
3
3
3
4
4
4
4
5
5
5
5
T
T
T
T
T
T
T
T
T
T
T
T
T
T
F
F
F
F
T
F
F
F
F
F
F
T
T
F
F
T
T
F
START
Input
N, X
Max X
Print
Max
STOP
Y
Counter < N
N
Counter 1
Counter Counter +1
Input
X
X>Max
Y
N
Max X
1
2
3
4
5
6
7
8
9
Tracing
How many times will steps 4, 6, and 7 be executed?
39.
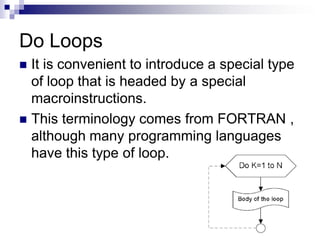
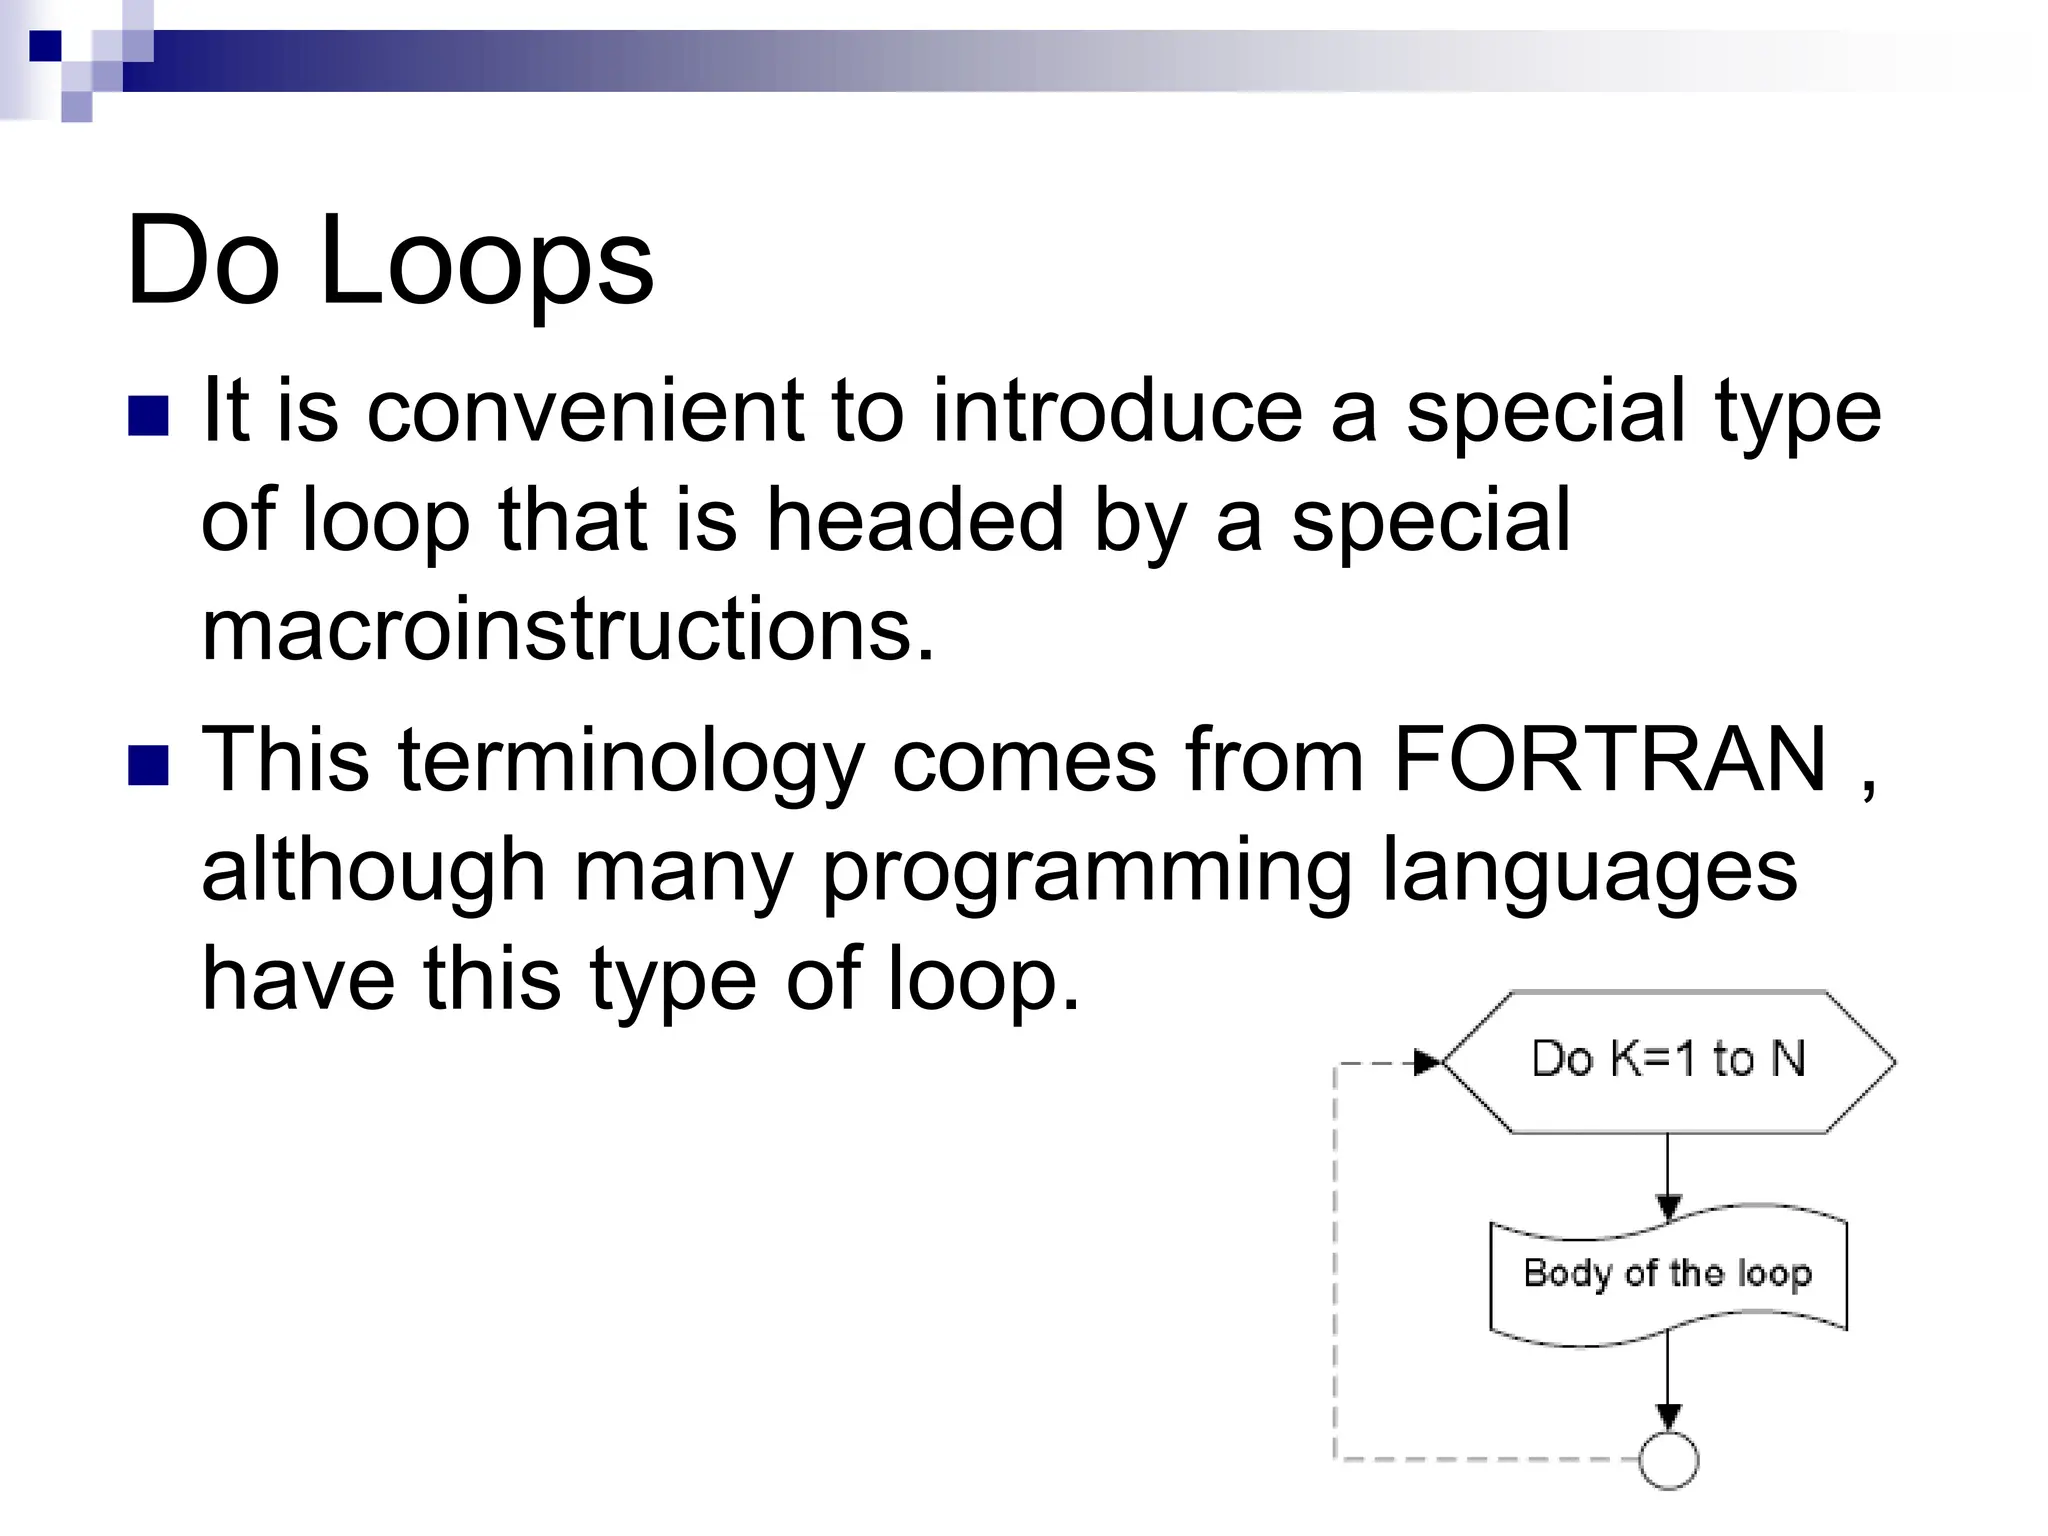
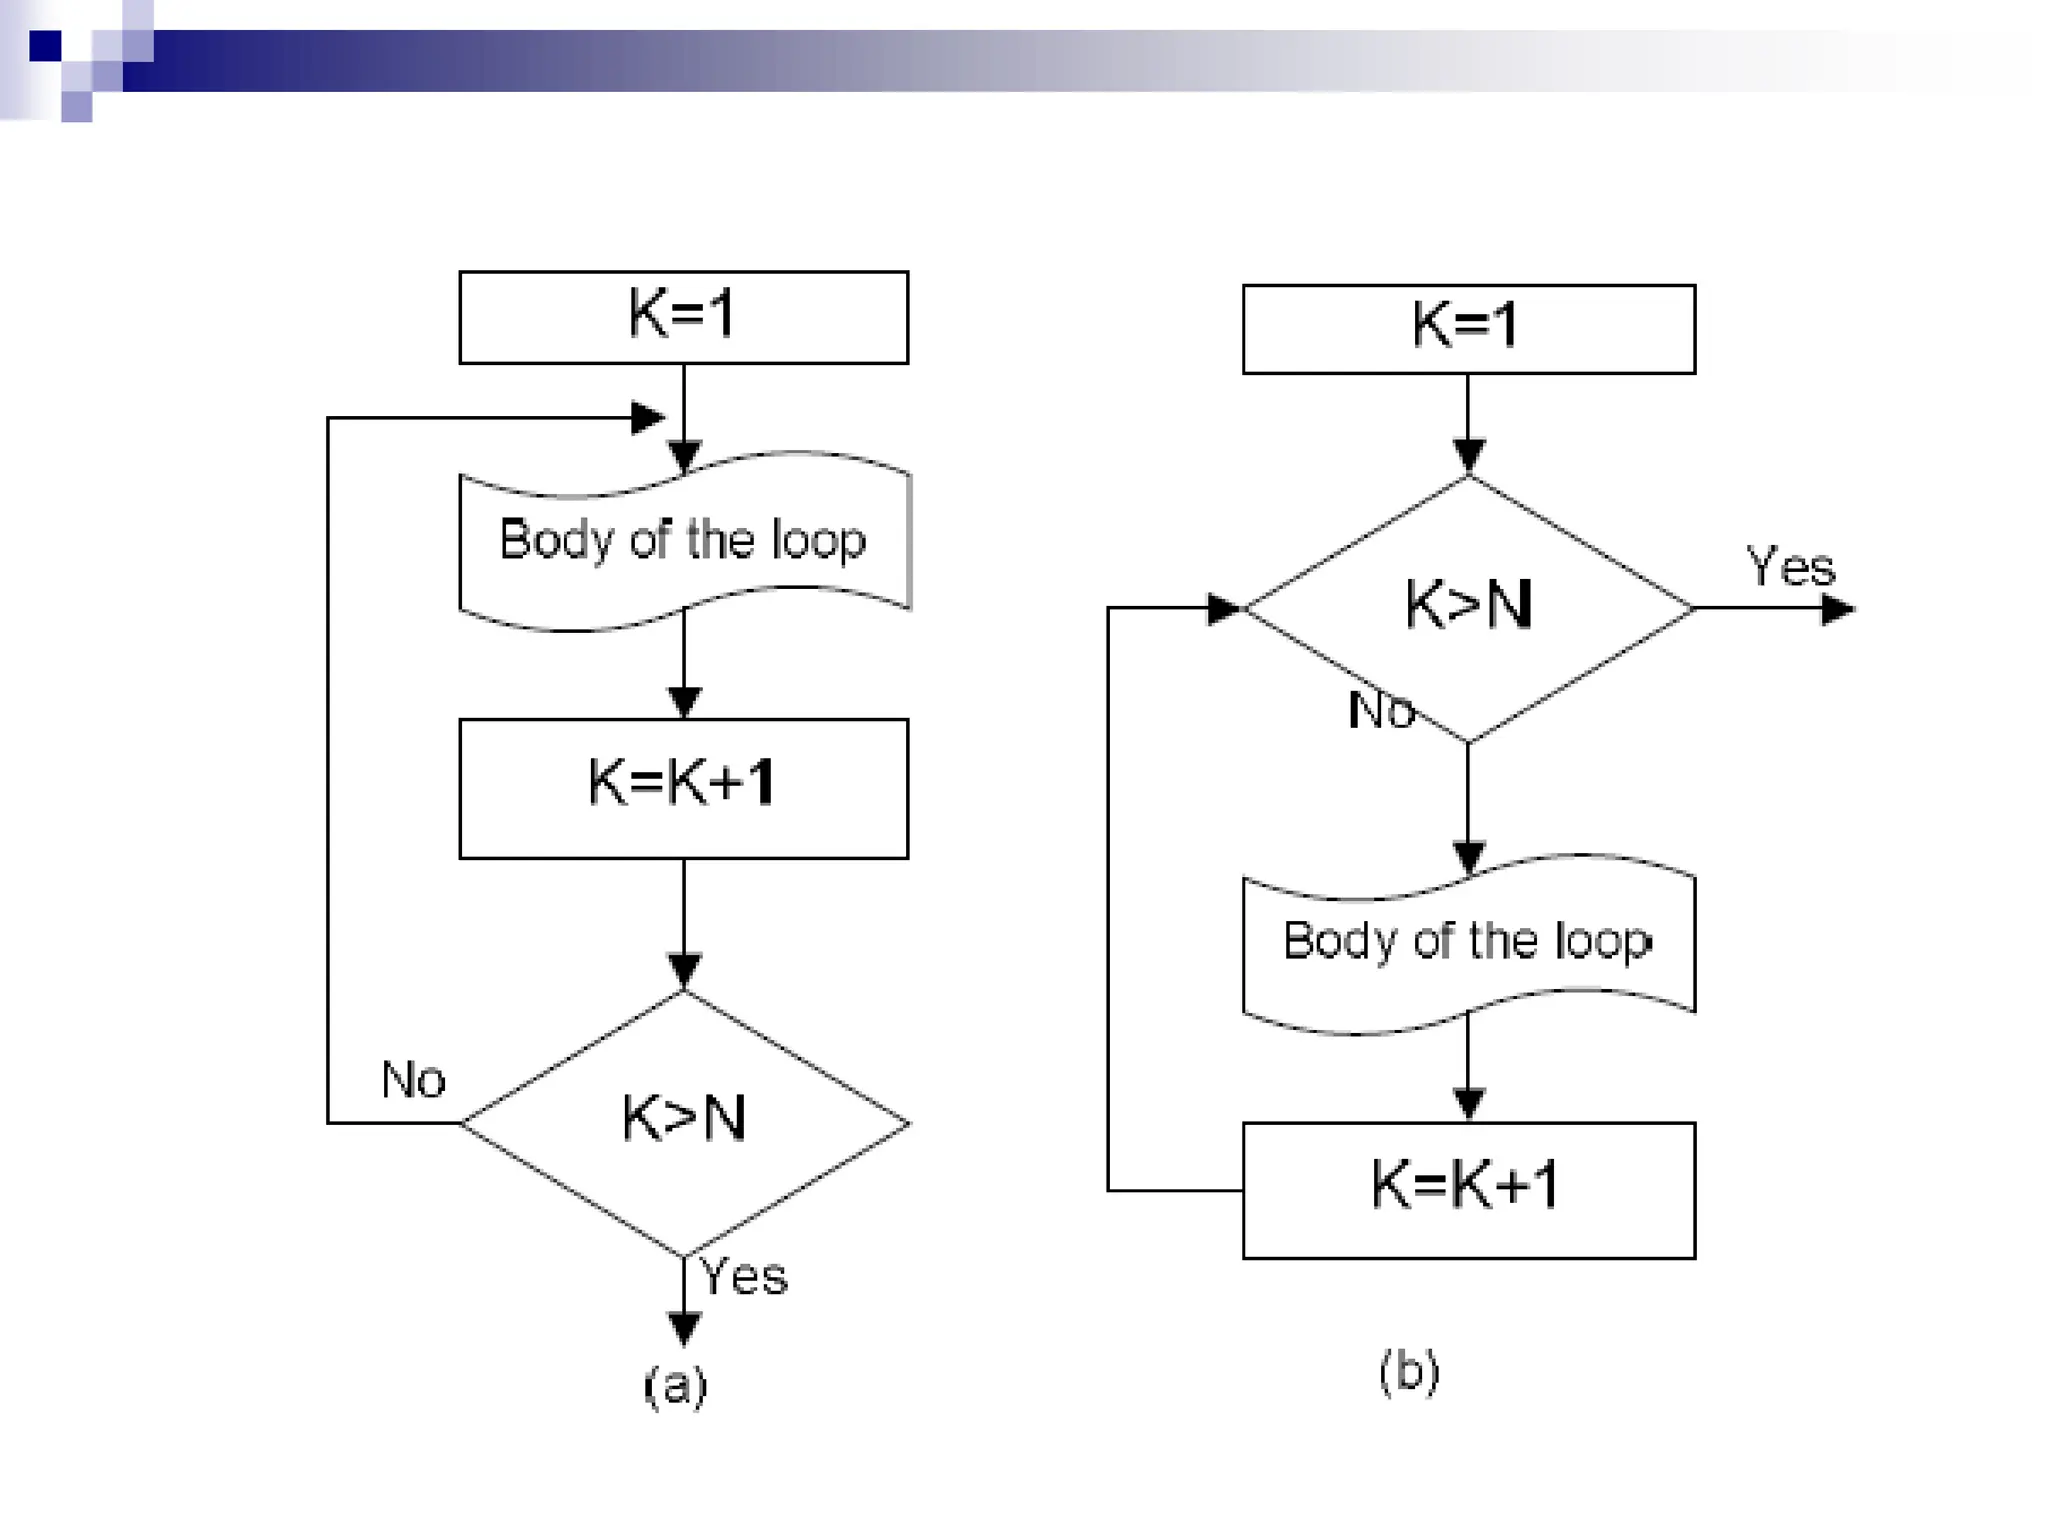
Do Loops
Itis convenient to introduce a special type
of loop that is headed by a special
macroinstructions.
This terminology comes from FORTRAN ,
although many programming languages
have this type of loop.
40.
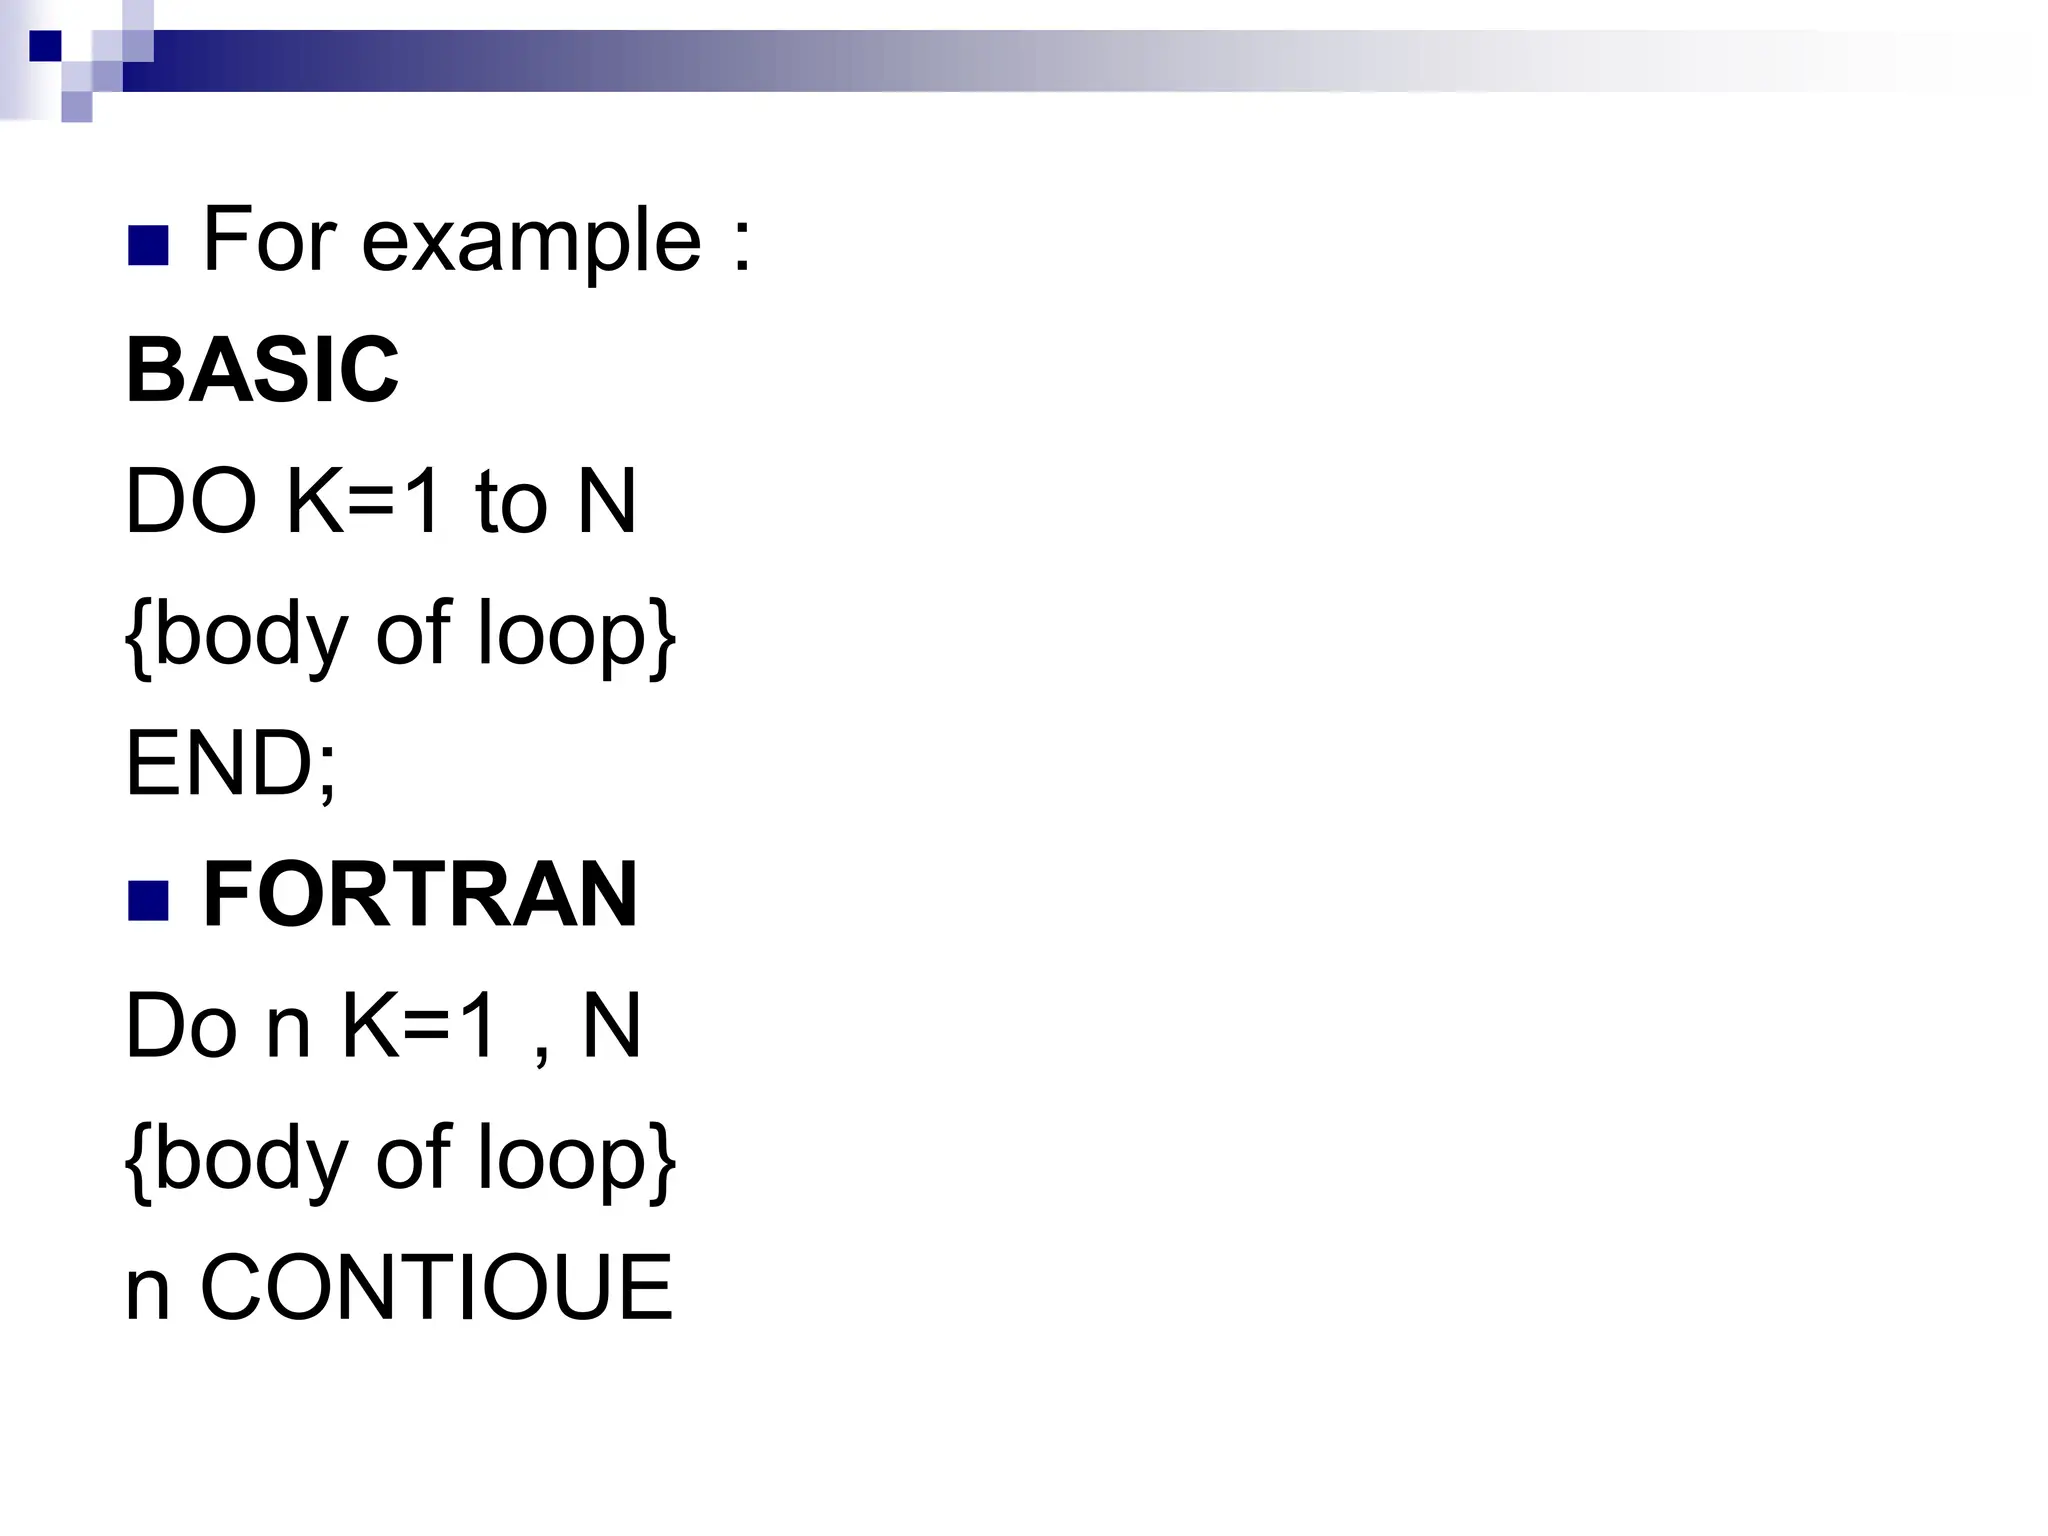
For example:
BASIC
DO K=1 to N
{body of loop}
END;
FORTRAN
Do n K=1 , N
{body of loop}
n CONTIOUE
42.
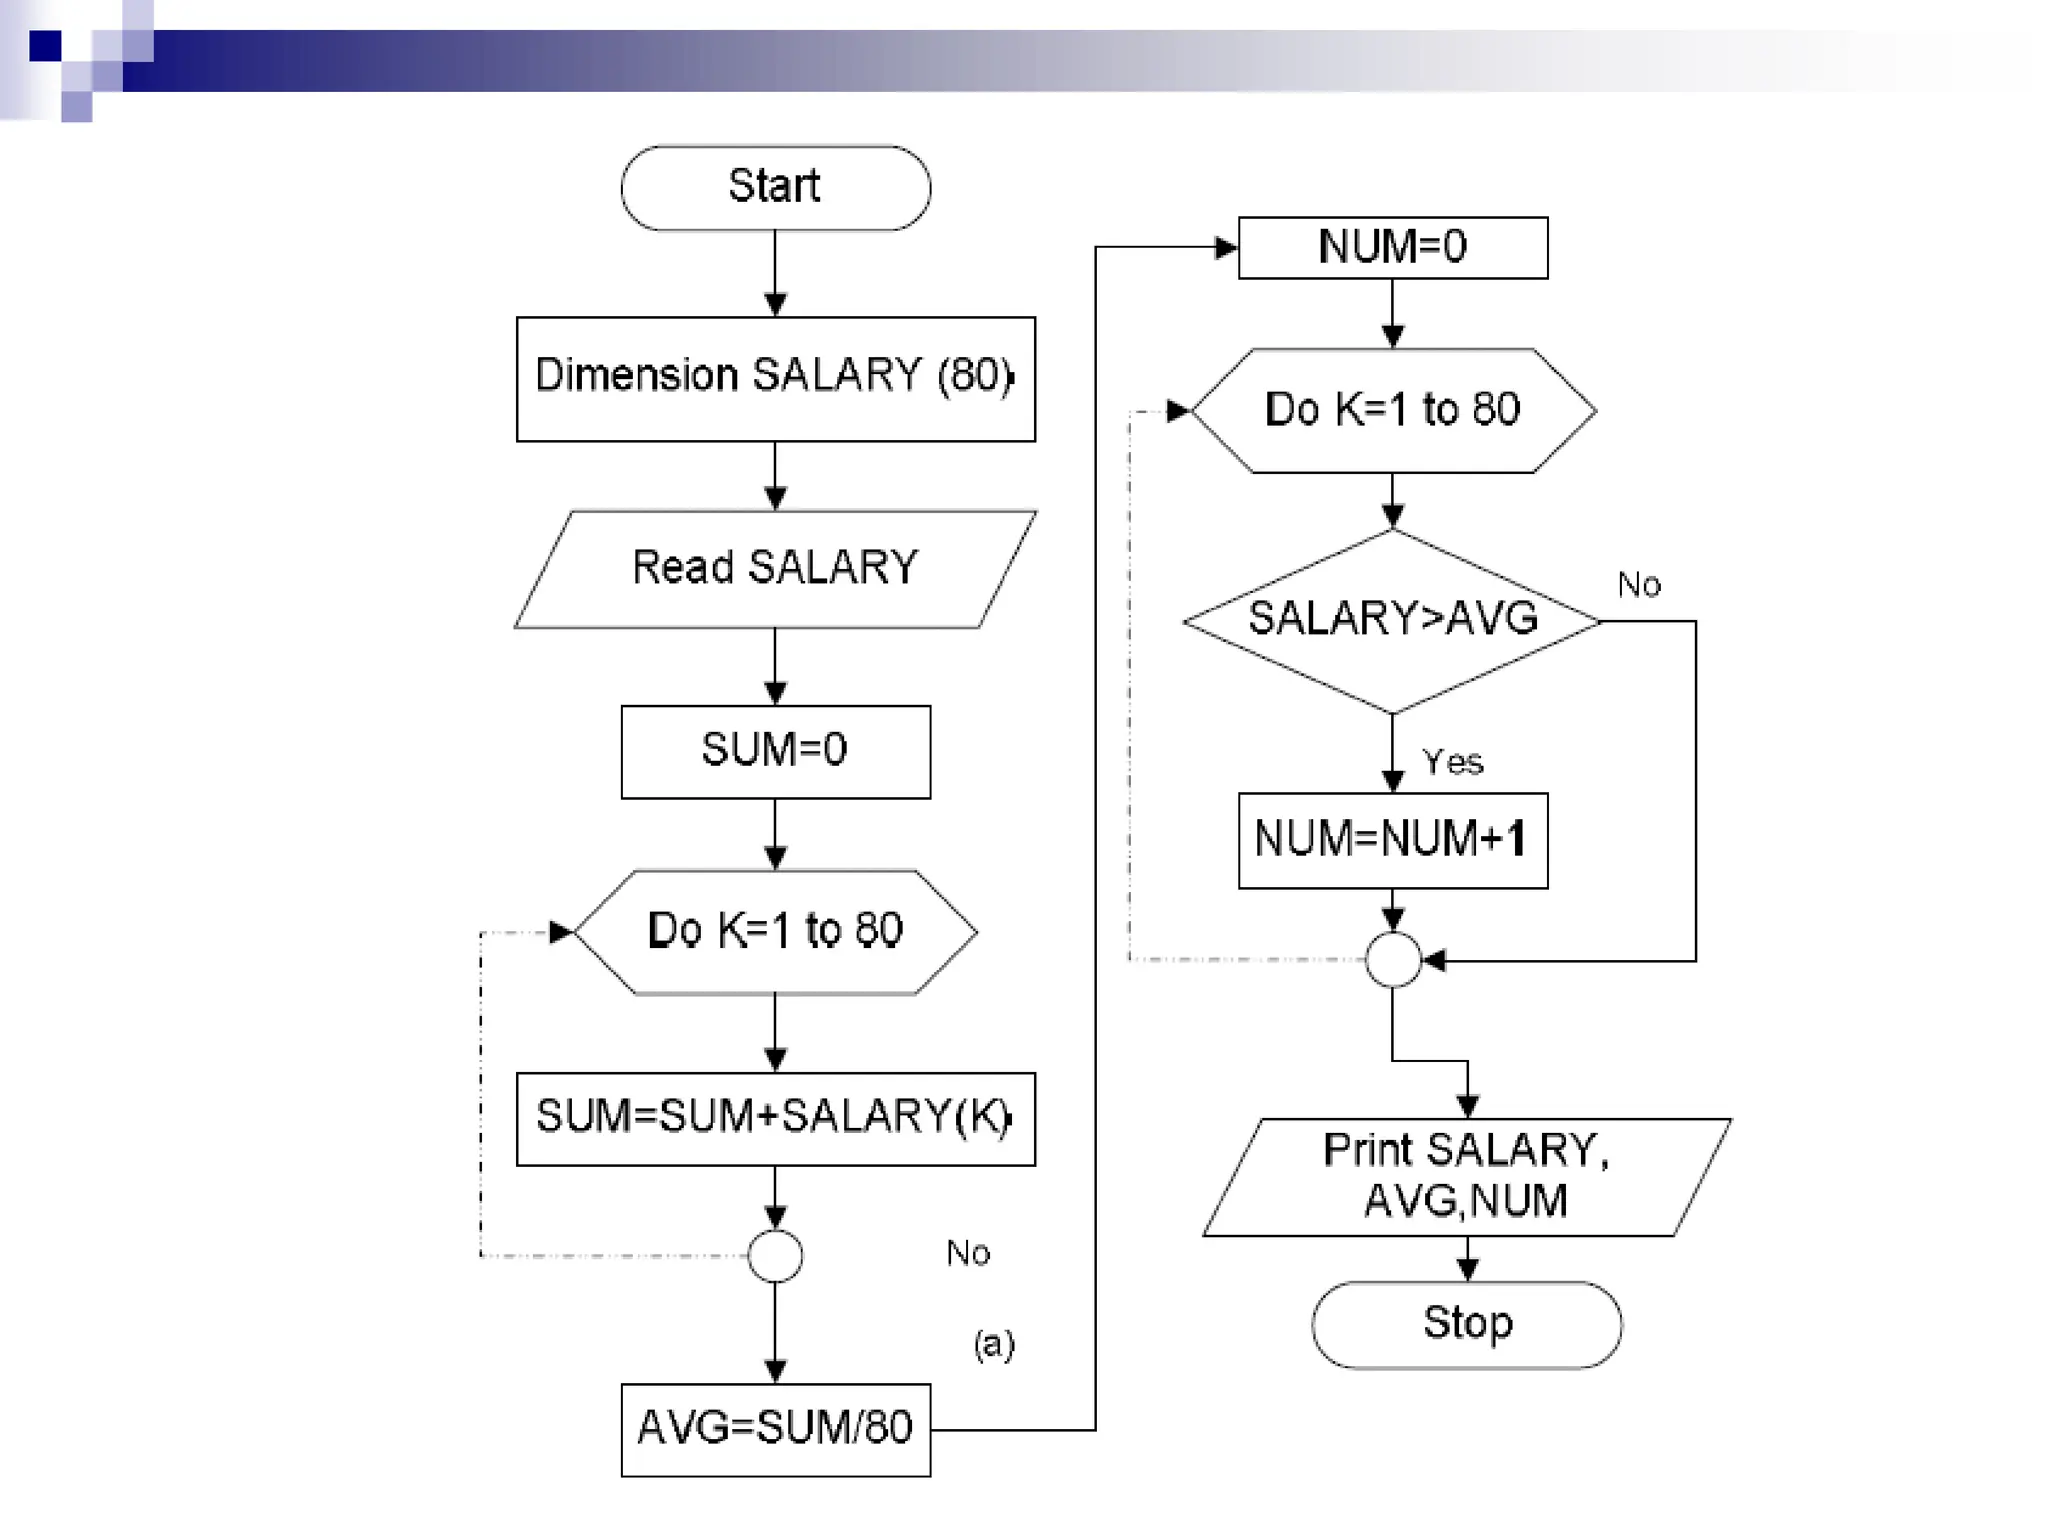
Example :A company has 80
employees give a flowchart that
finds the average salary and the number
of employees earning above the average
salary. Observe that the salaries are read
into an array, SALARY. Next, the average
salary, AVG, is calculated.
Then each salary , SALARY(K), is
compared with AVG to obtain the number
NUM of salaries grater than AVG.
Prob. 1.Write an algorithm and draw a flowchart to
print the square of all numbers from 1 to10.
Prob. 2. Write an algorithm and draw a flowchart to
print the SUM of numbers from LOW to HIGH. Test
with LOW=3 and HIGH=9.
Prob. 3. Write an algorithm and draw a flowchart to
print all numbers between LOW and HIGH that are
divisible by NUMBER.
Prob. 4. Draw a flowchart for a program that reads
10 numbers from the user and prints out their sum,
and their product.
46.
Prob. 5.Write an algorithm and draw a flowchart to
count and print all numbers from LOW to HIGH by
steps of STEP. Test with LOW=0 and HIGH=100 and
STEP=5.
Prob. 6. Write an algorithm and draw a flowchart to
print the multiplication table for 6's. i.e.
---- 1 6 = 6
---- 2 6 = 12
…
---- 12 6 = 72
Prob. 7. Write an algorithm and draw a flowchart that
will find and print the product of 3 numbers.
47.
Prob. 8.Write an algorithm and draw a
flowchart that will find and print
The factorial of NUMBER is FACTORIAL.
Test the flowchart for NUMBER=5.