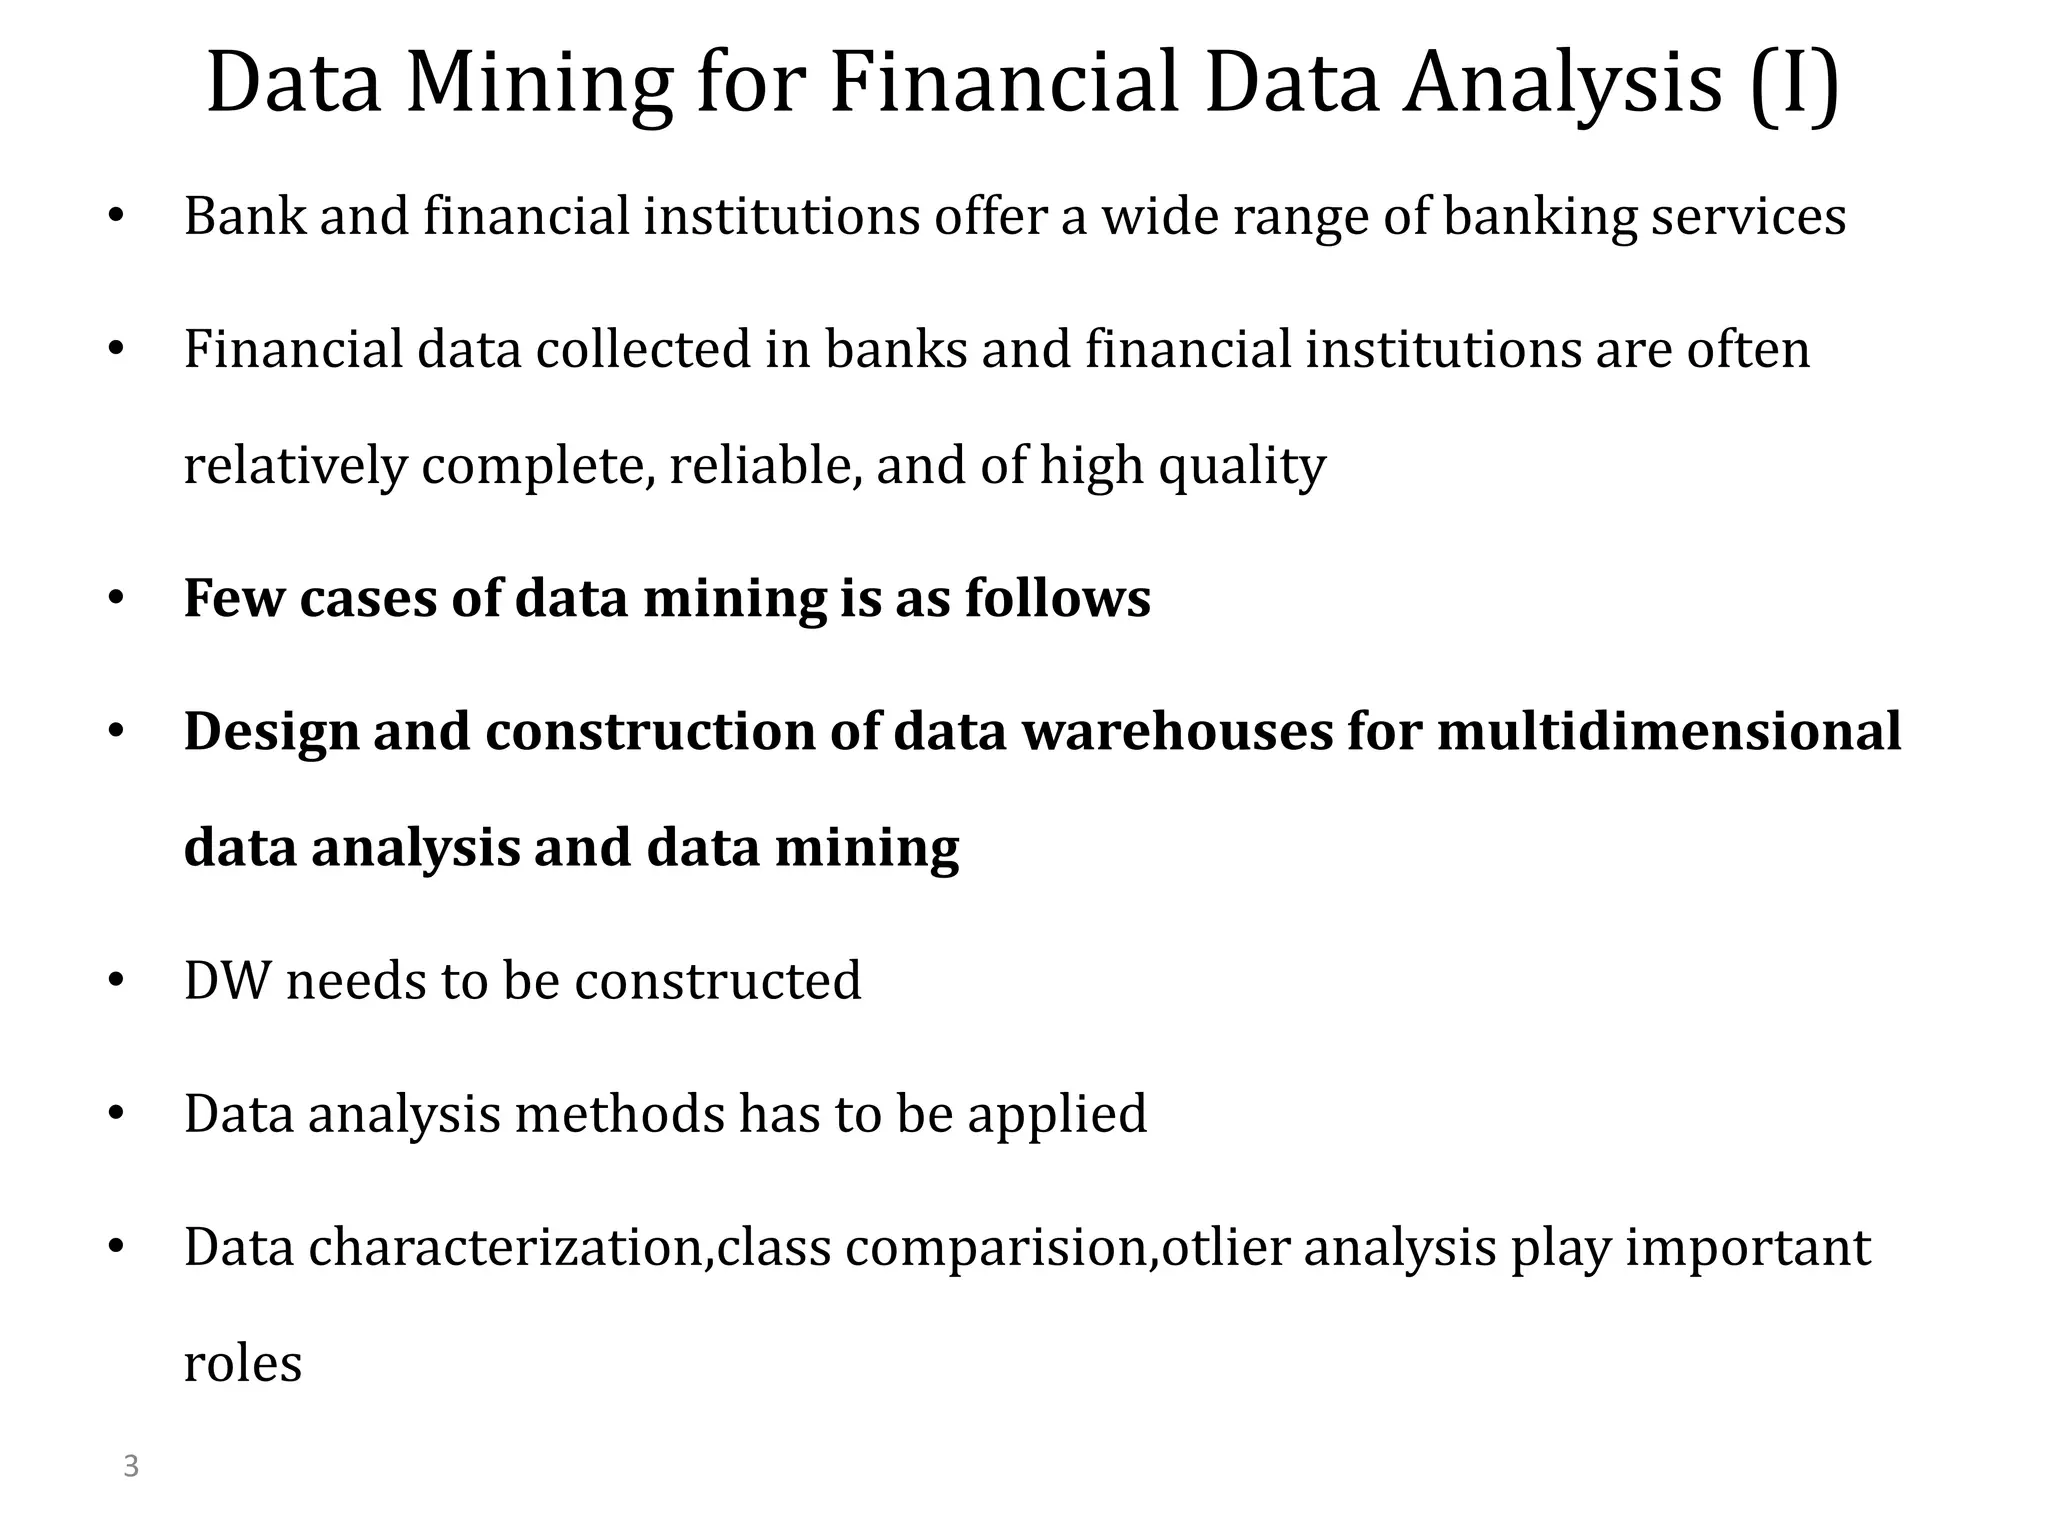
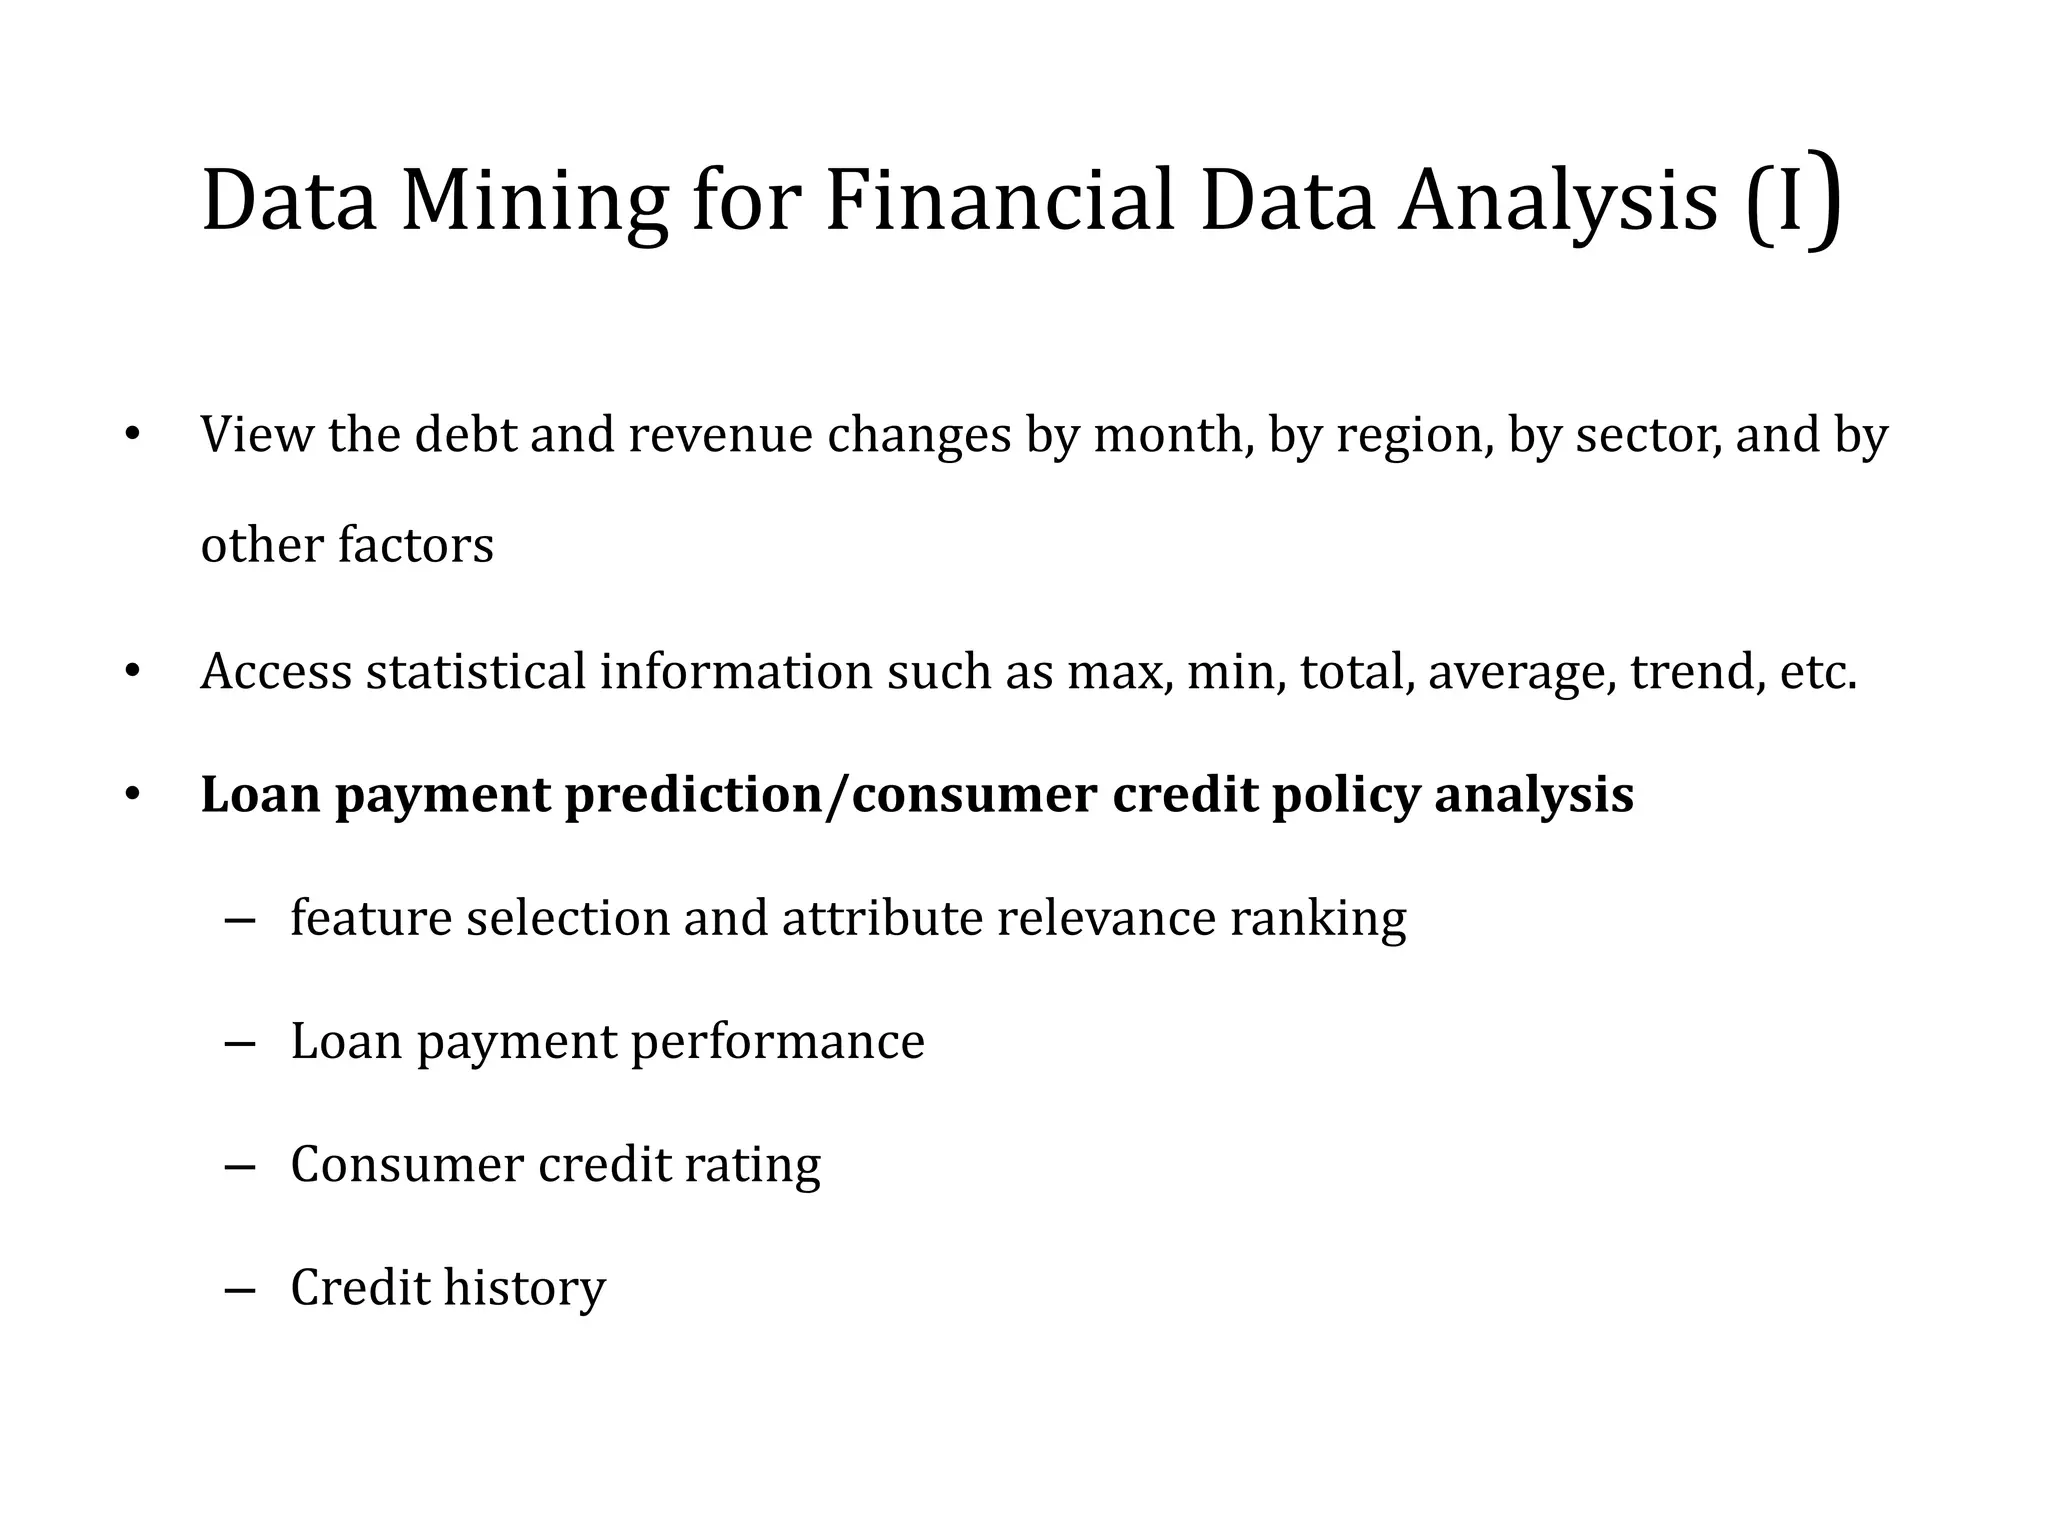
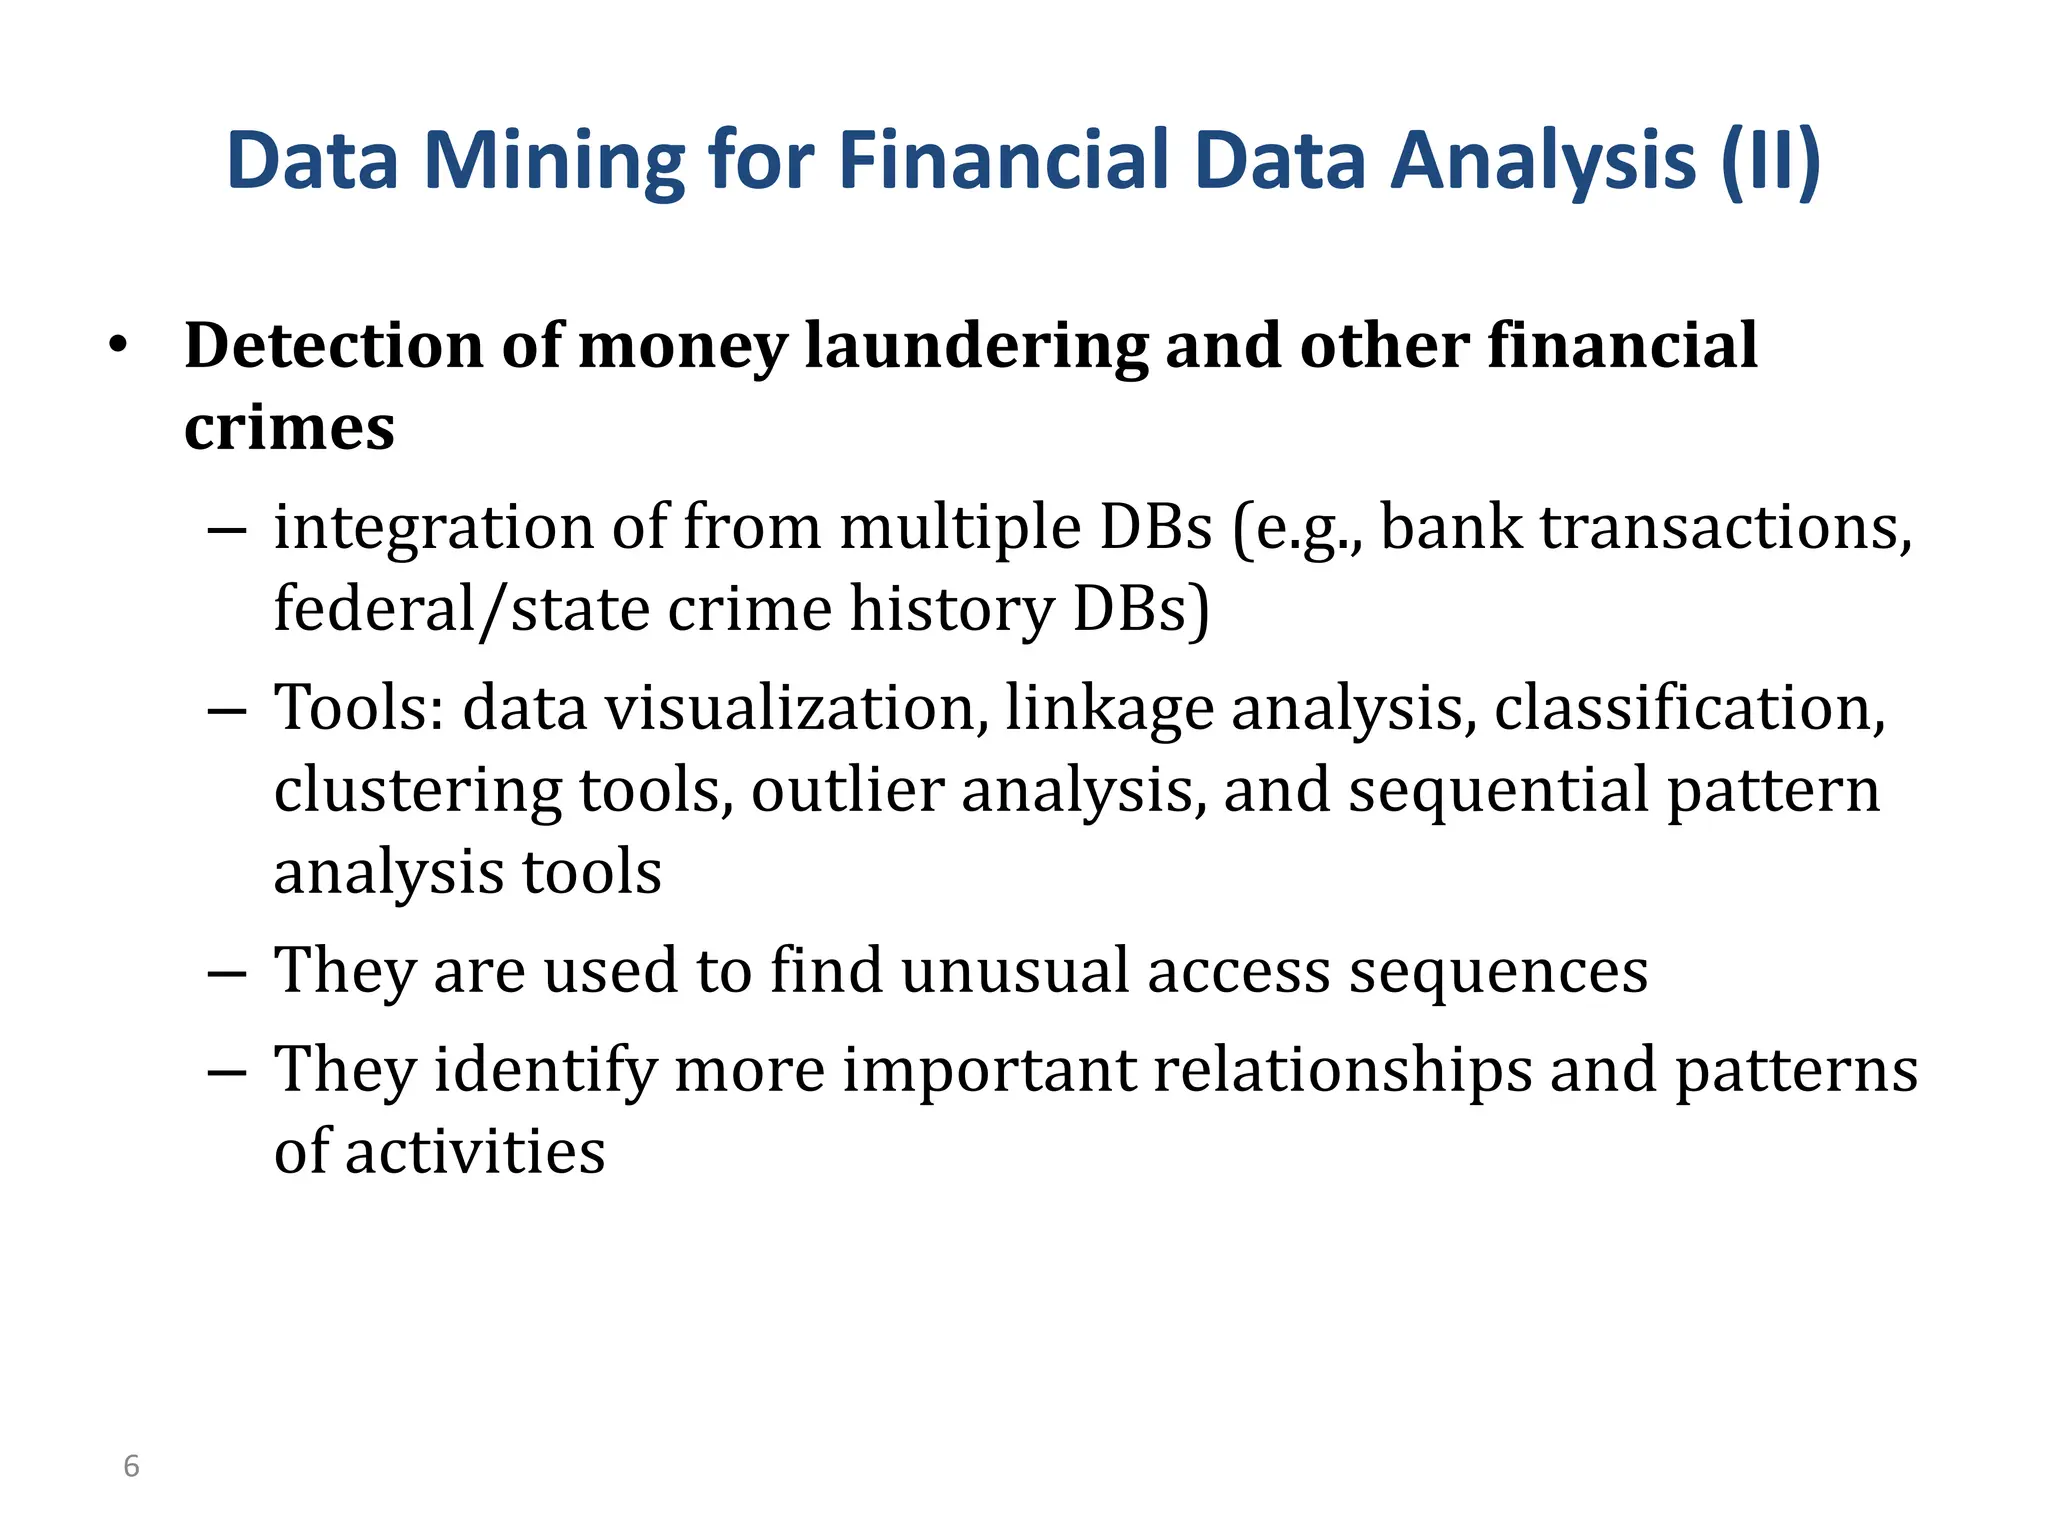
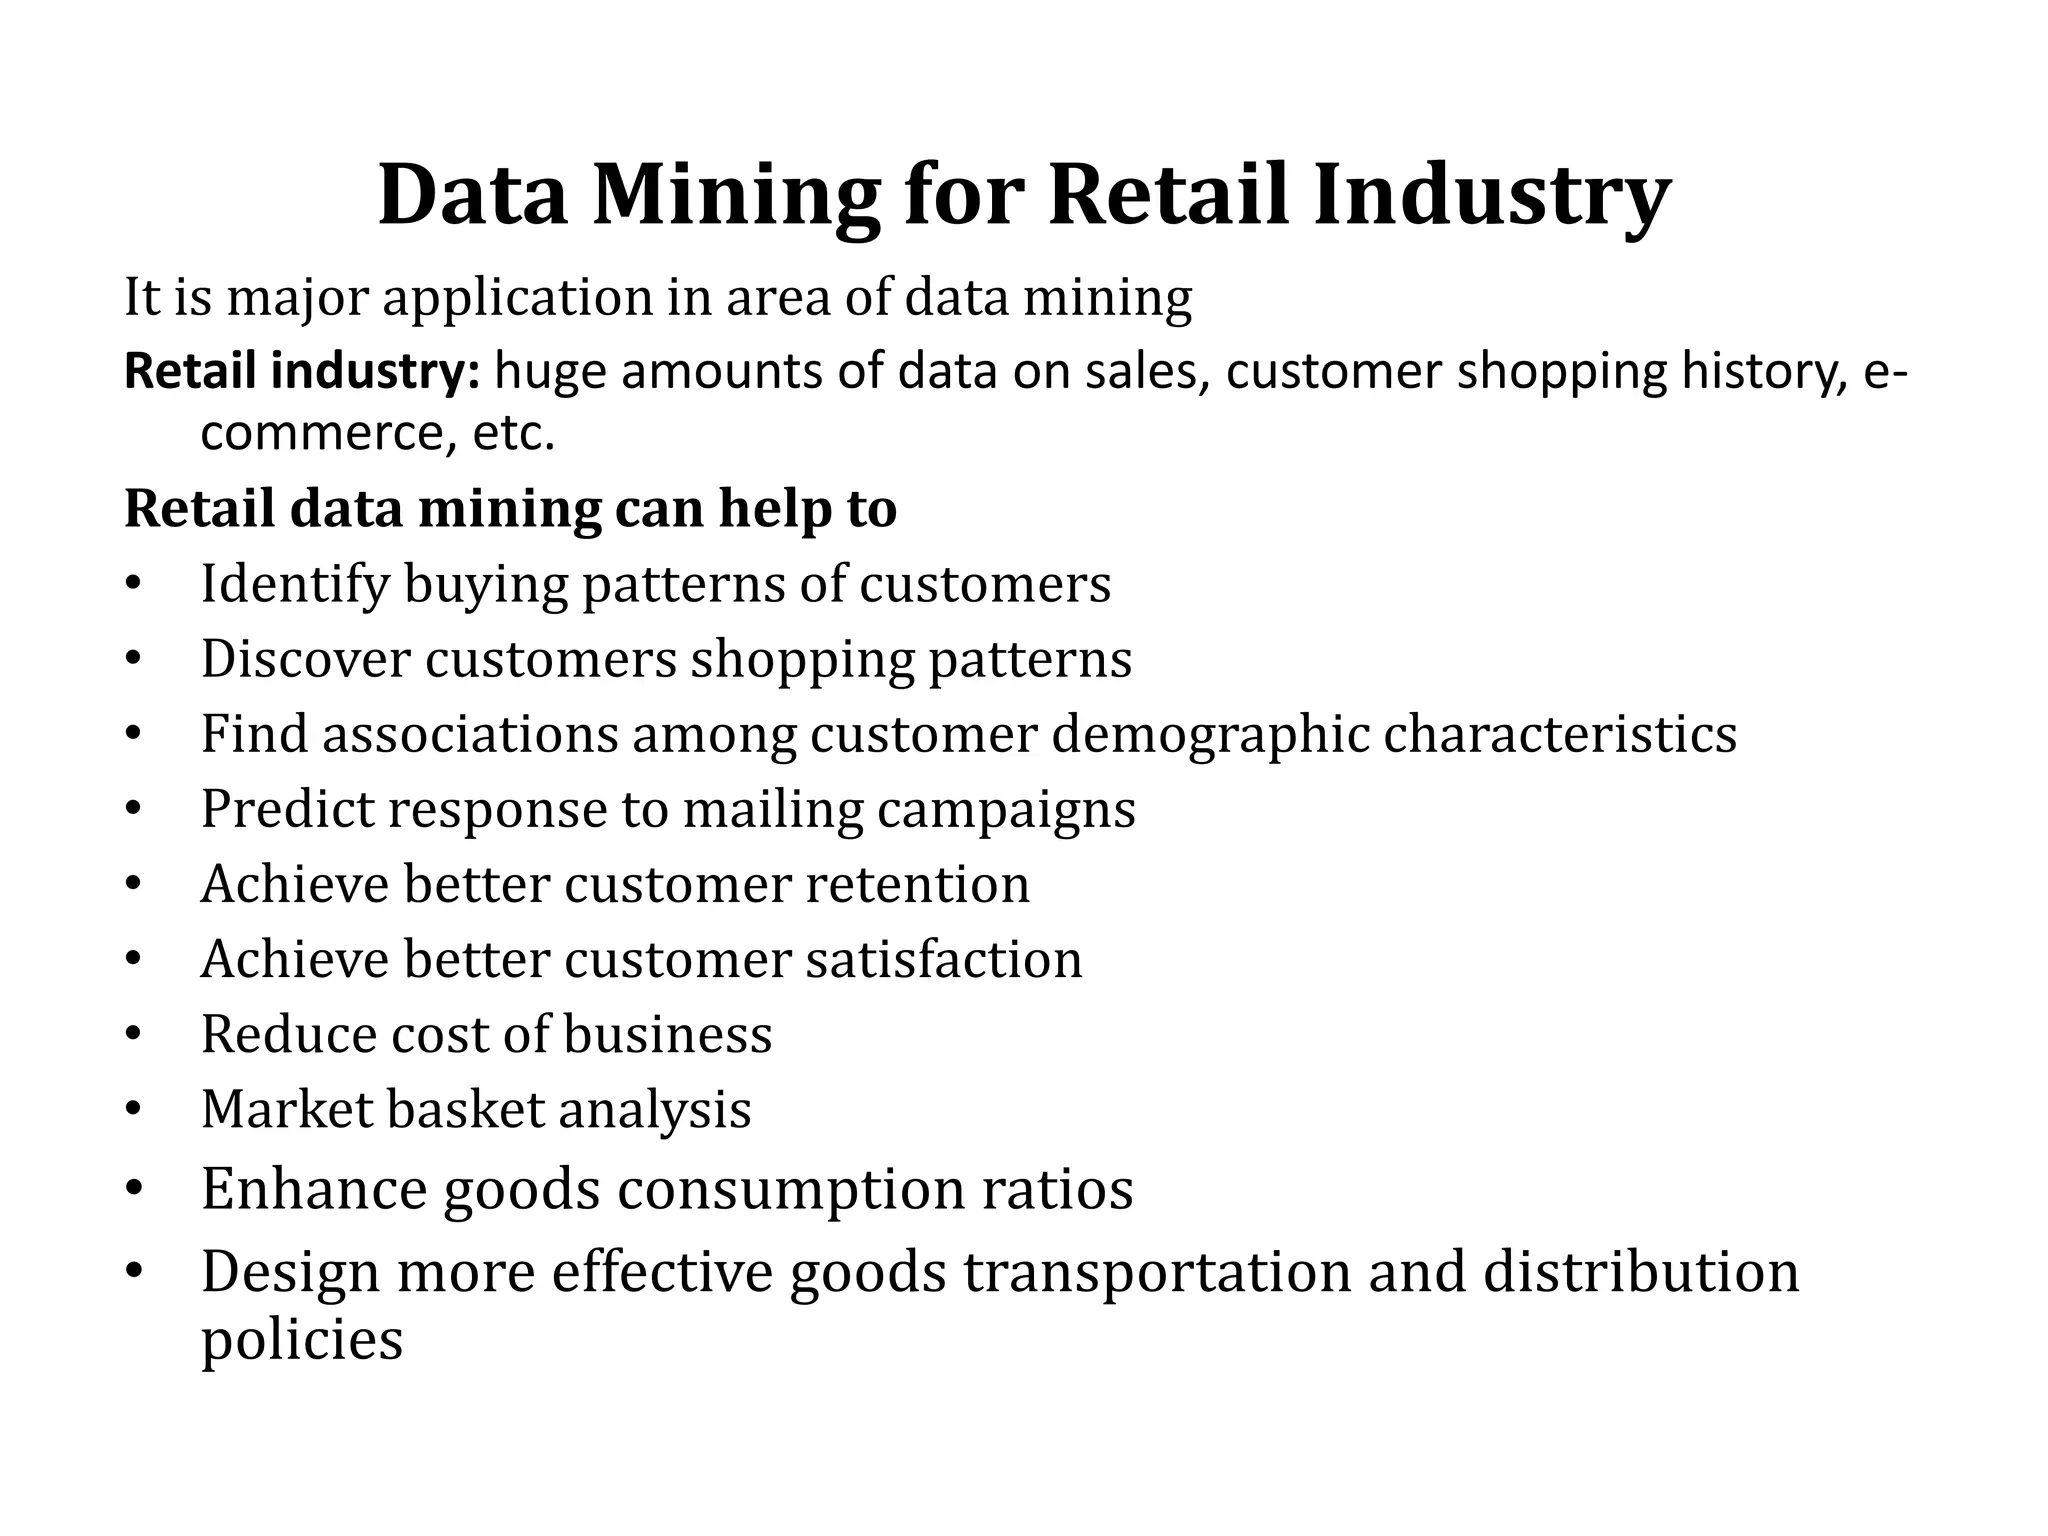
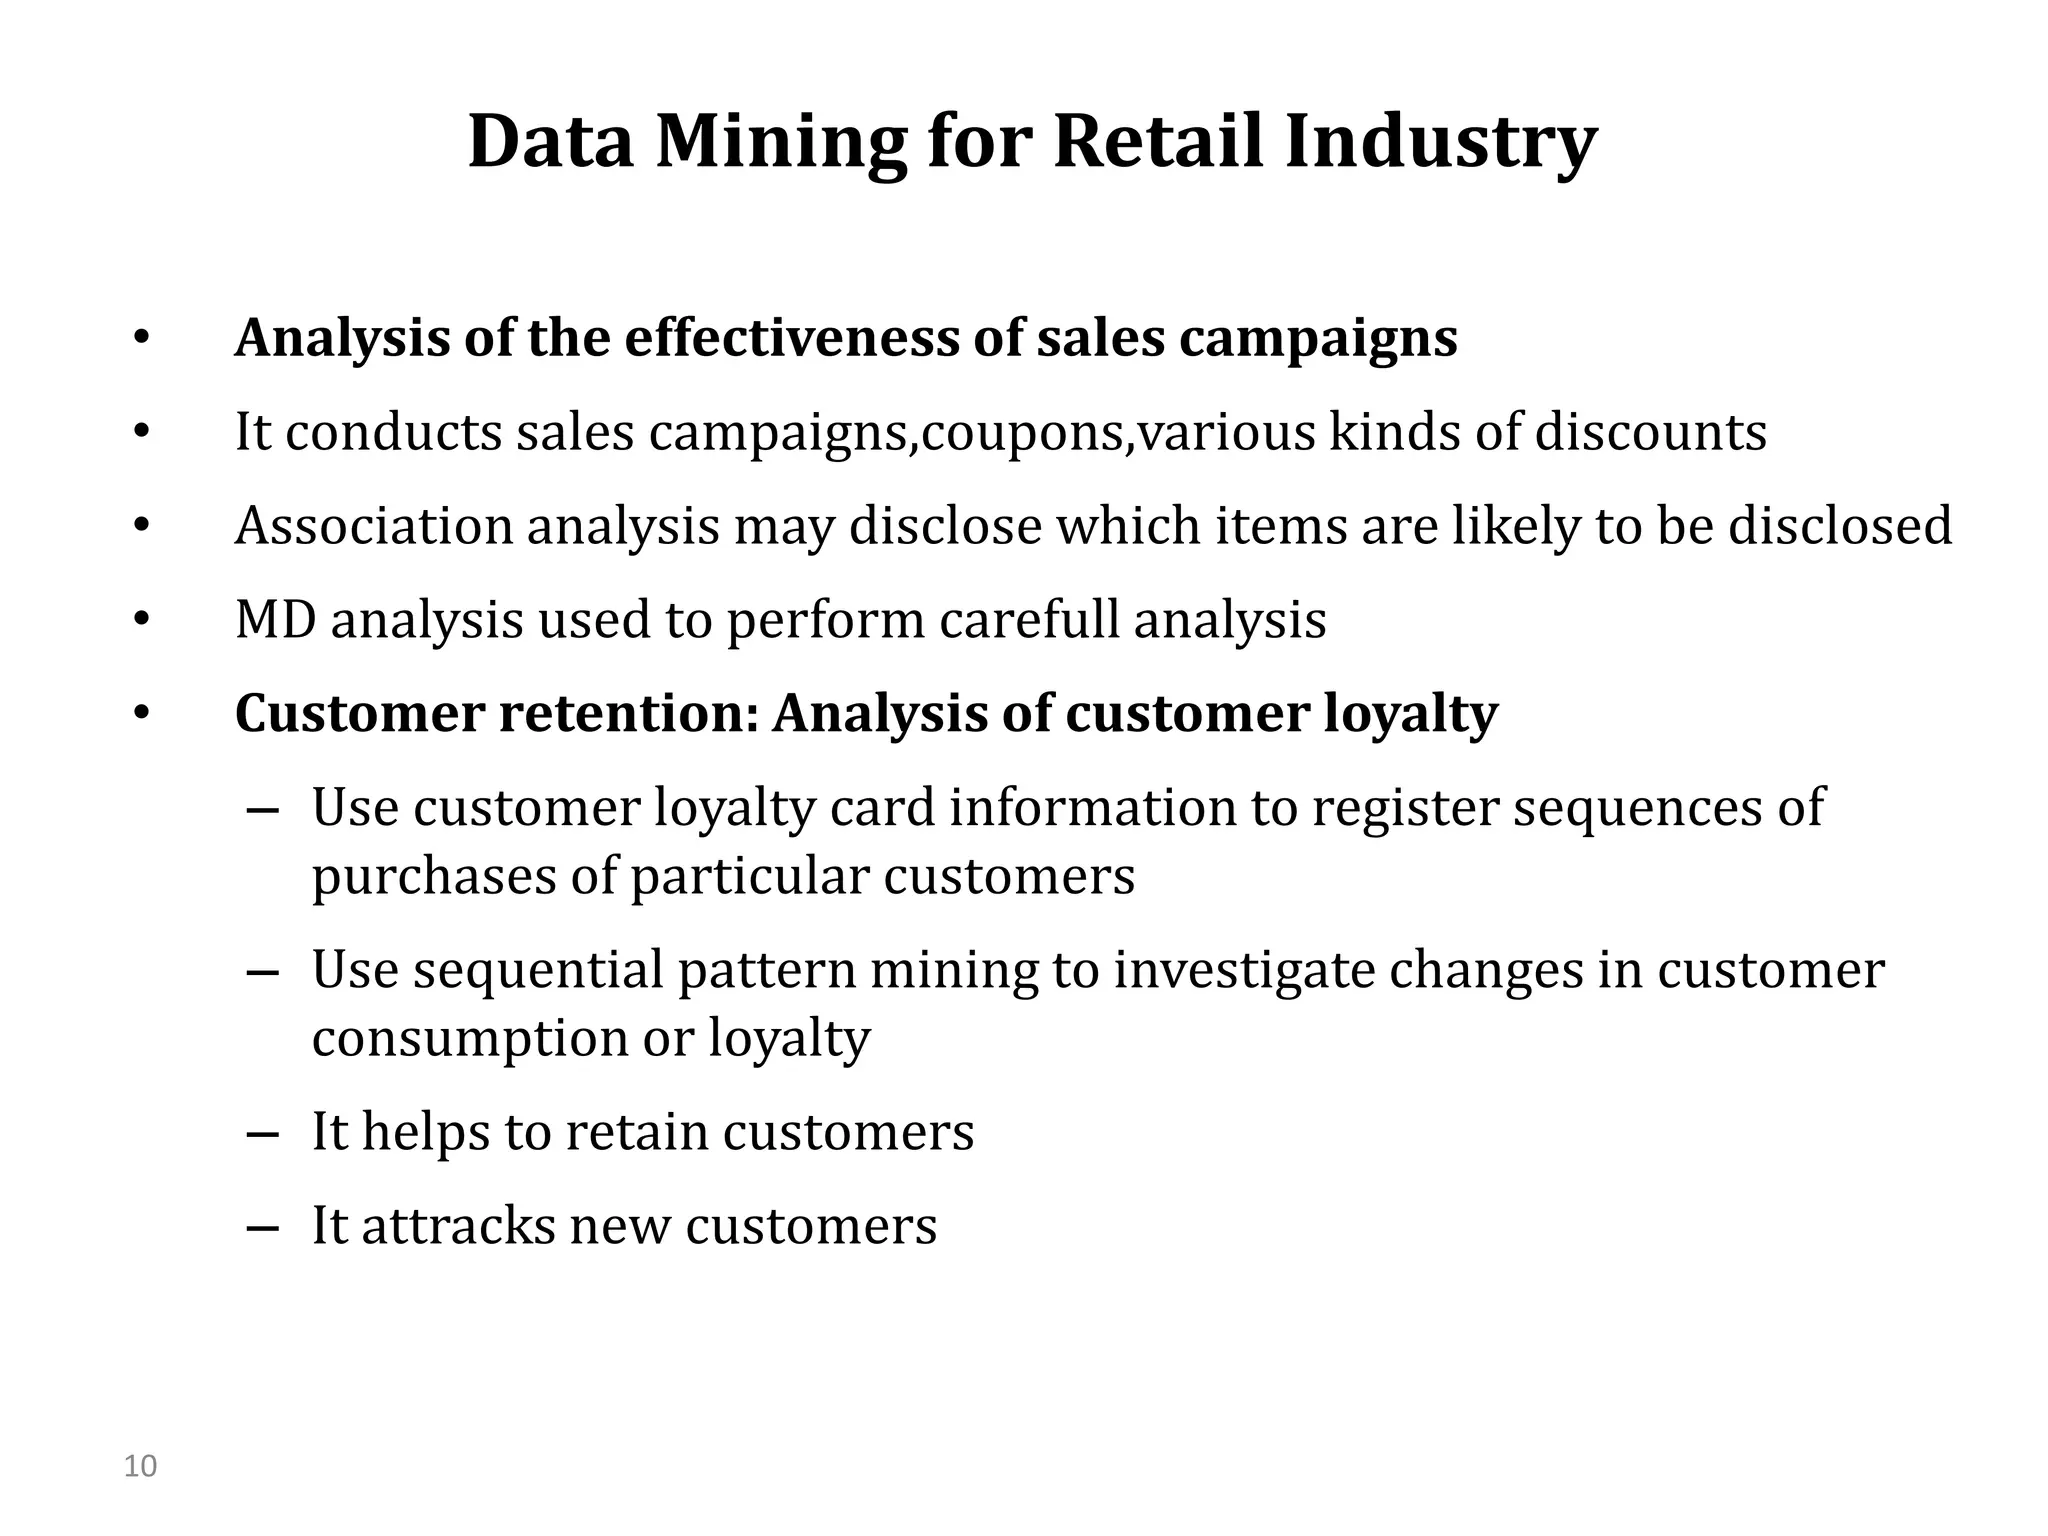
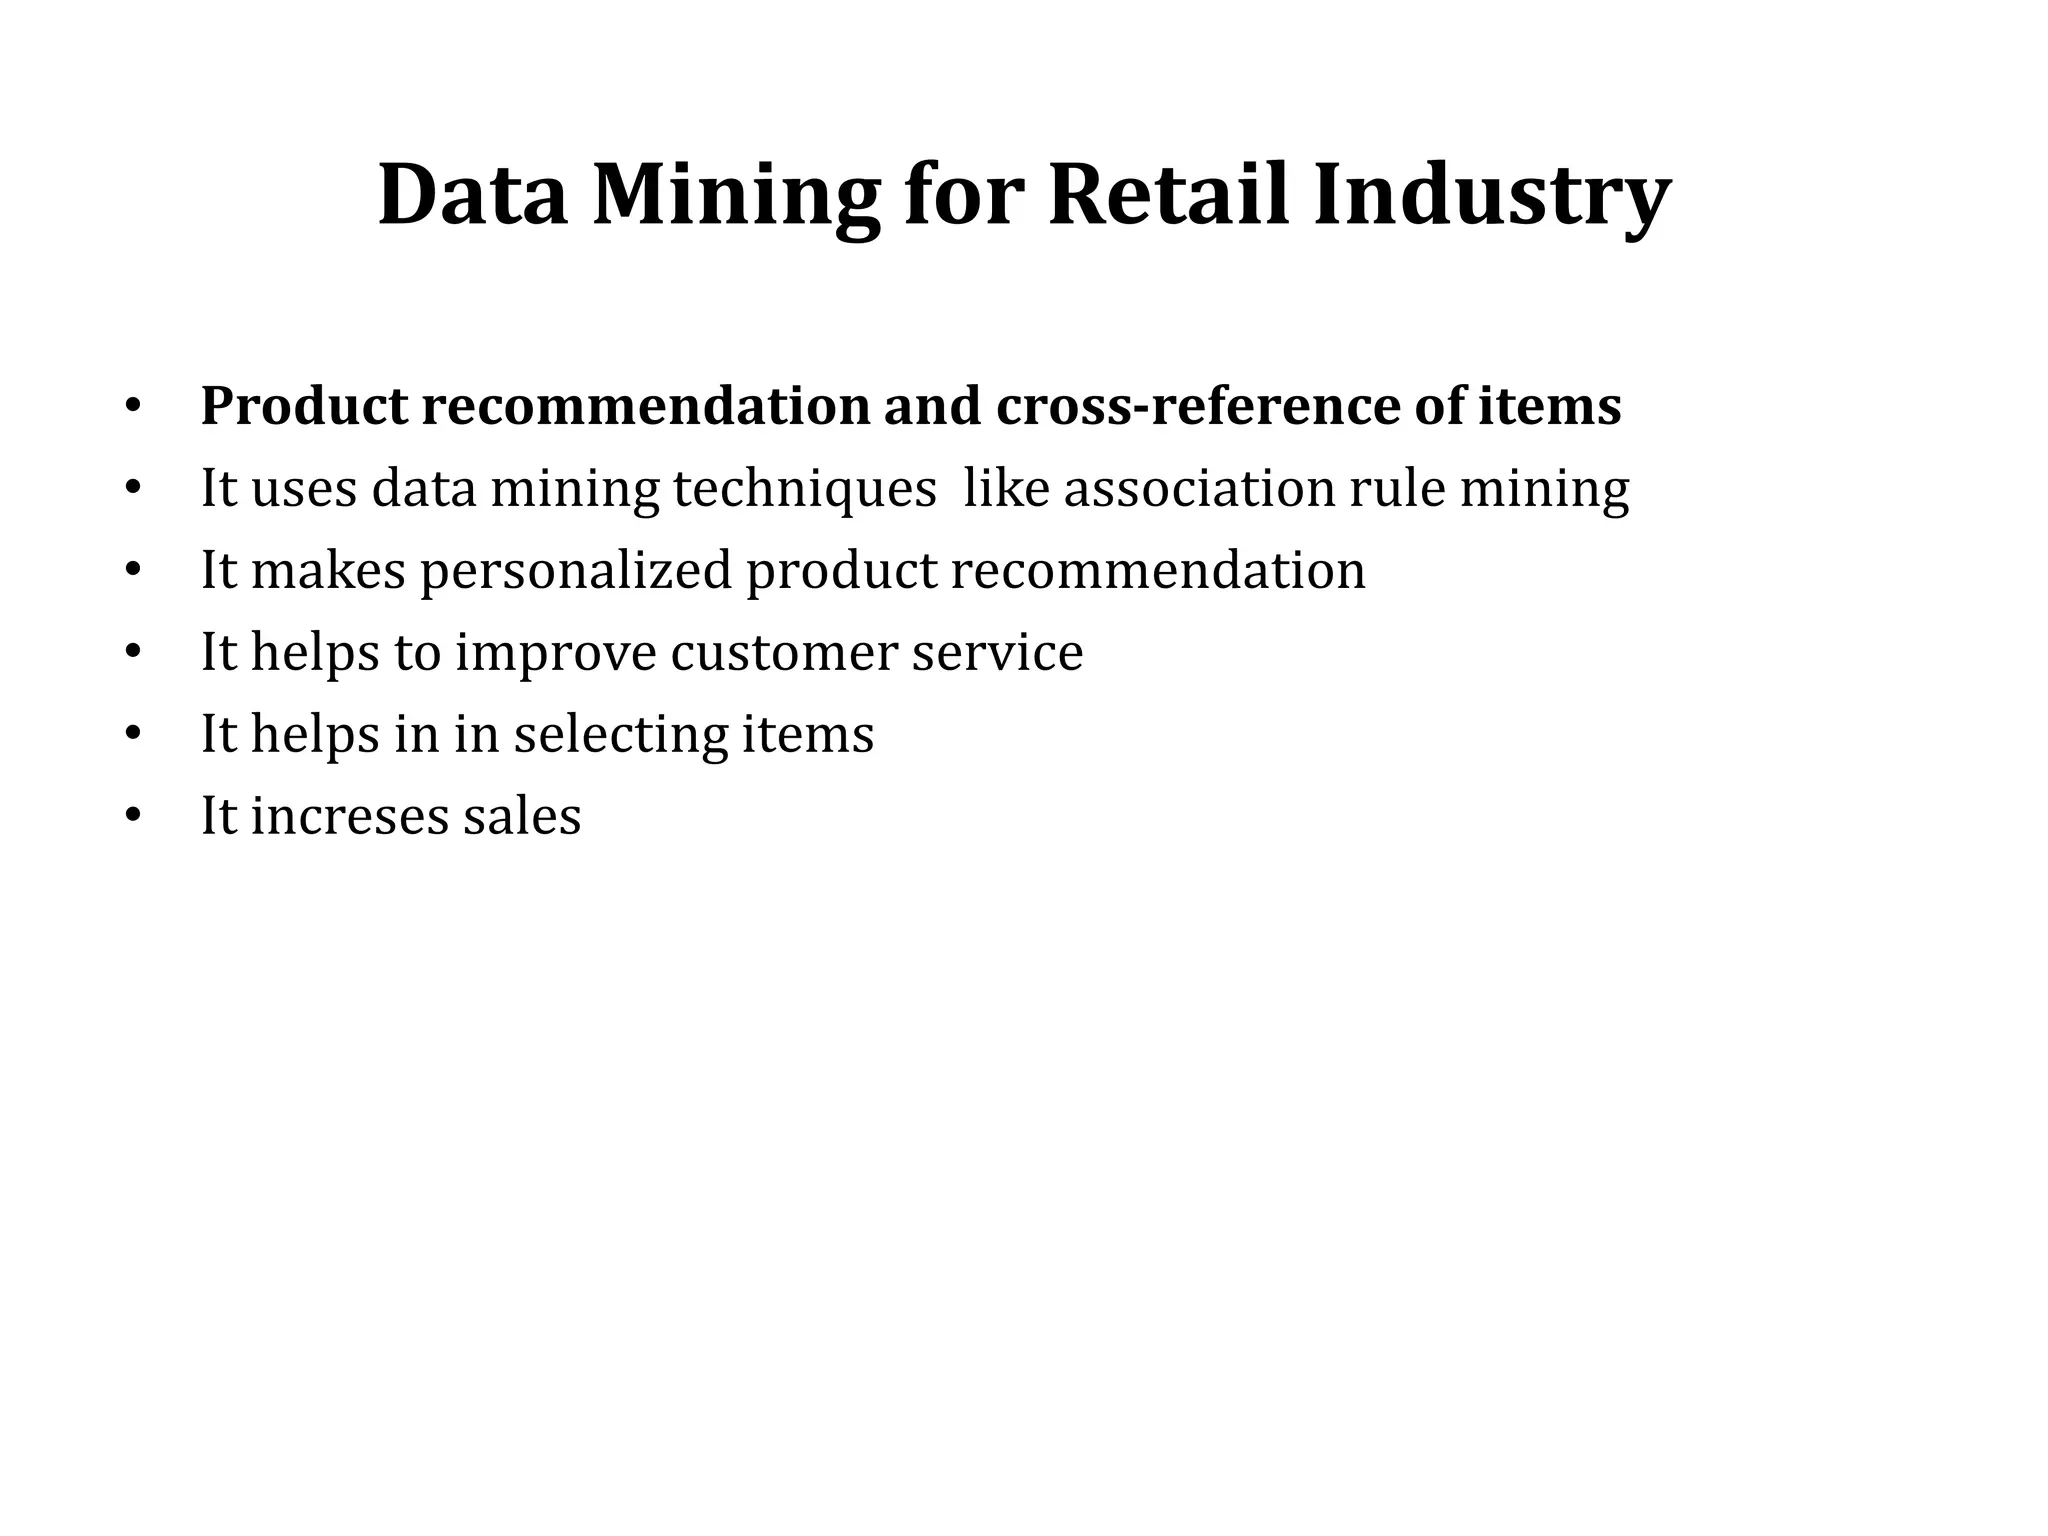
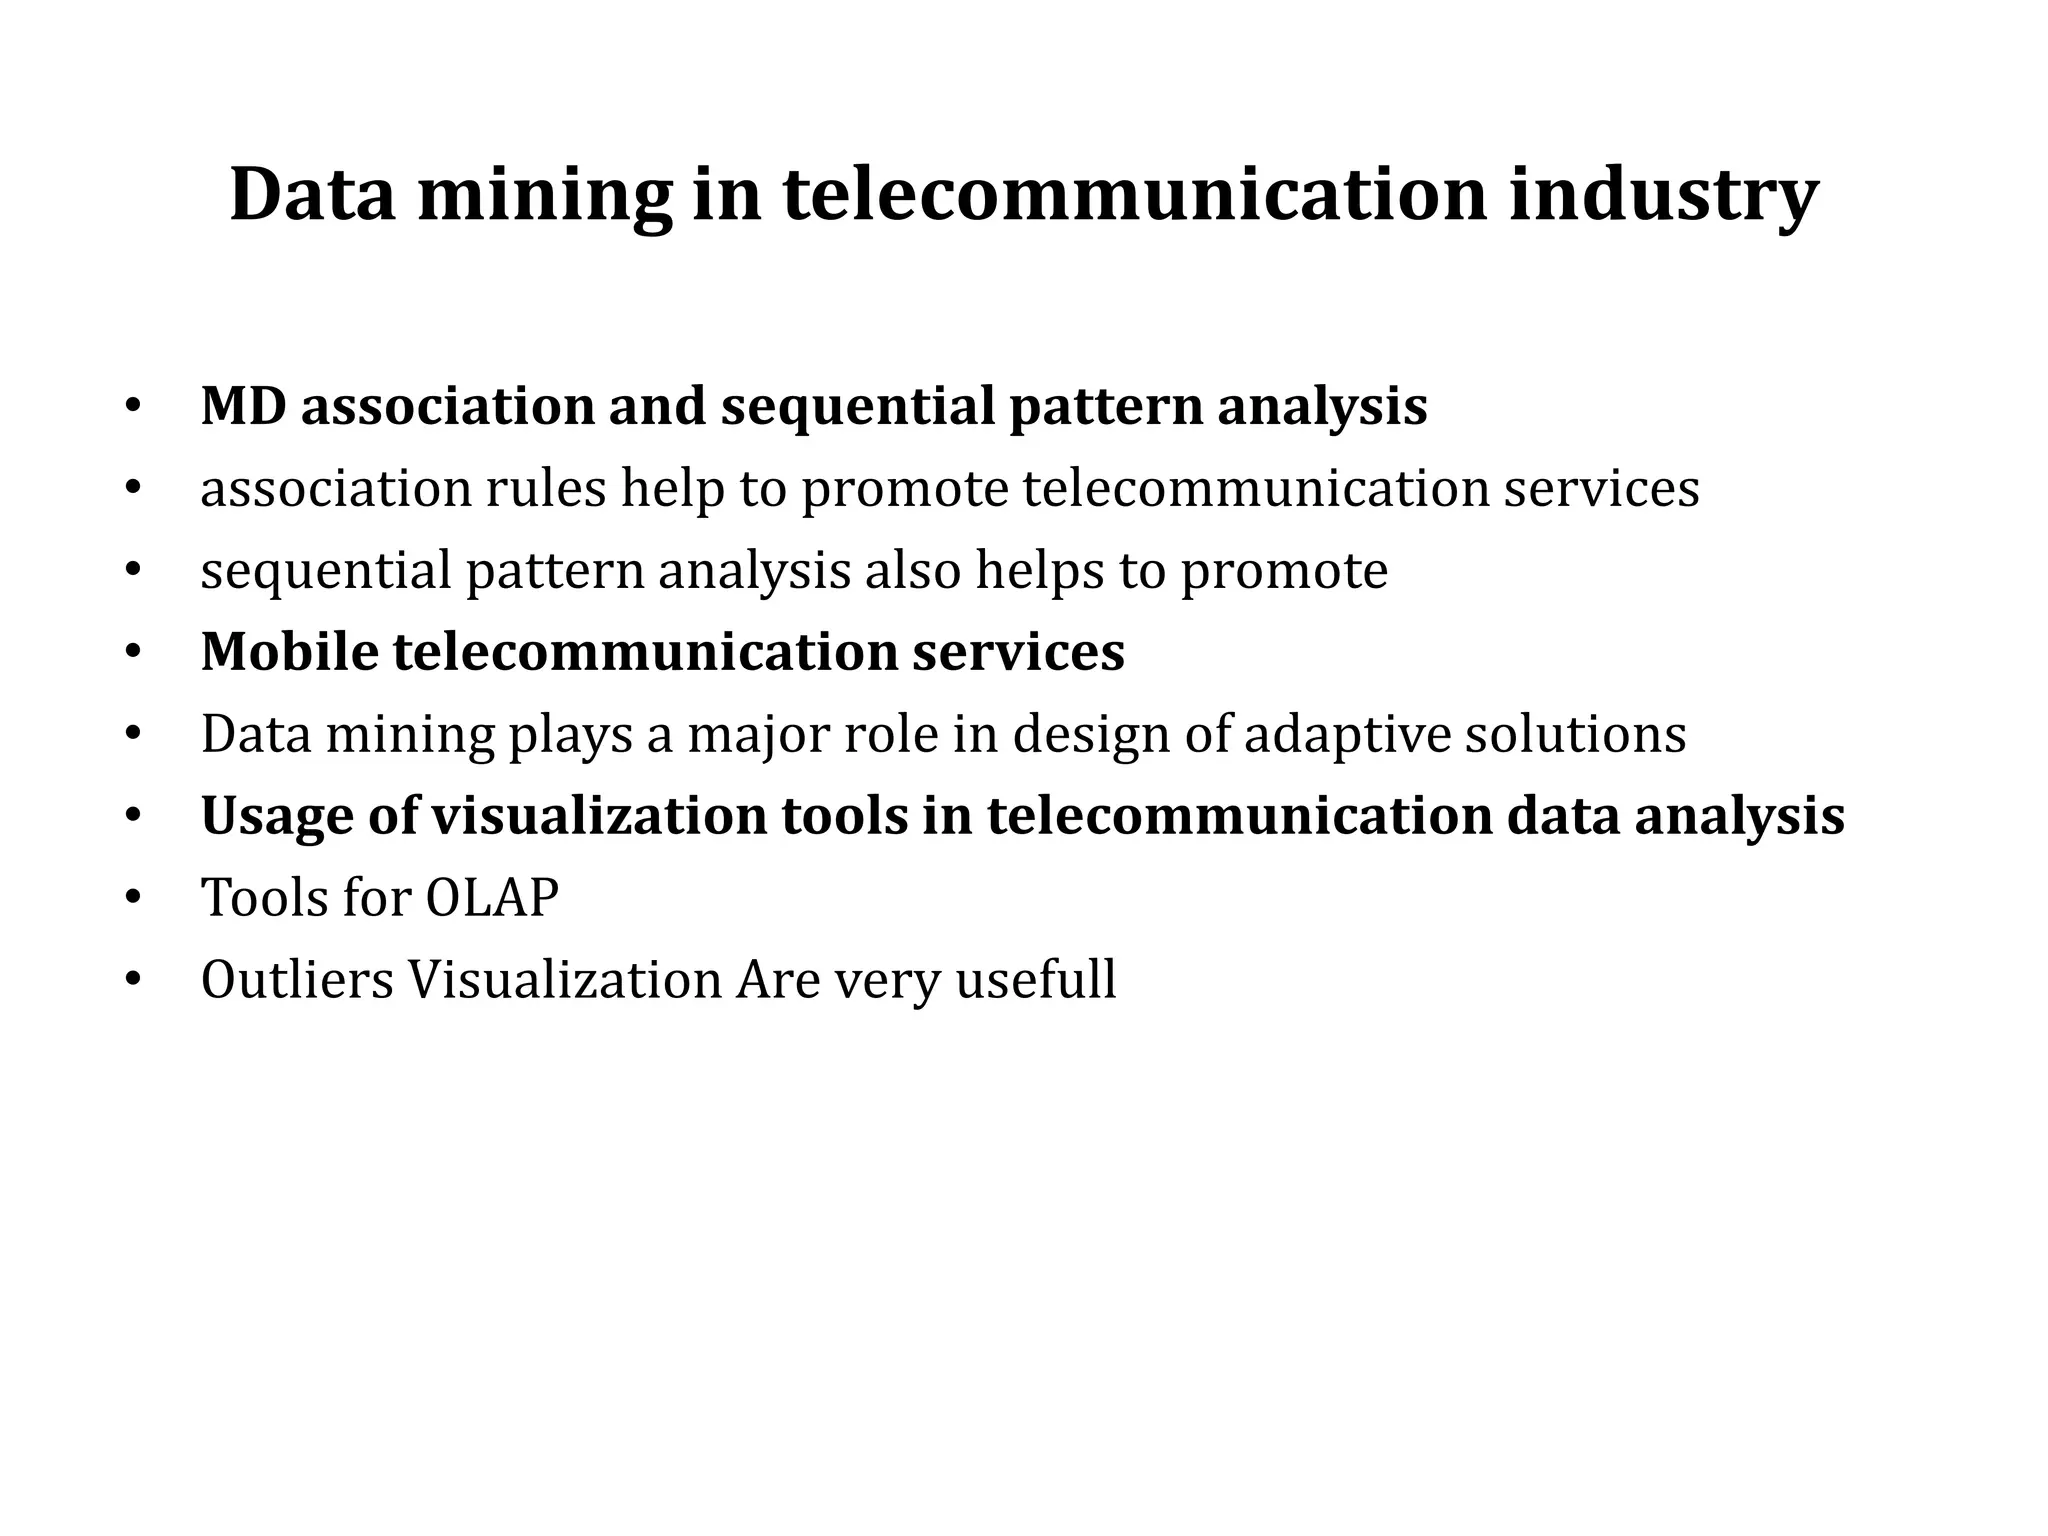
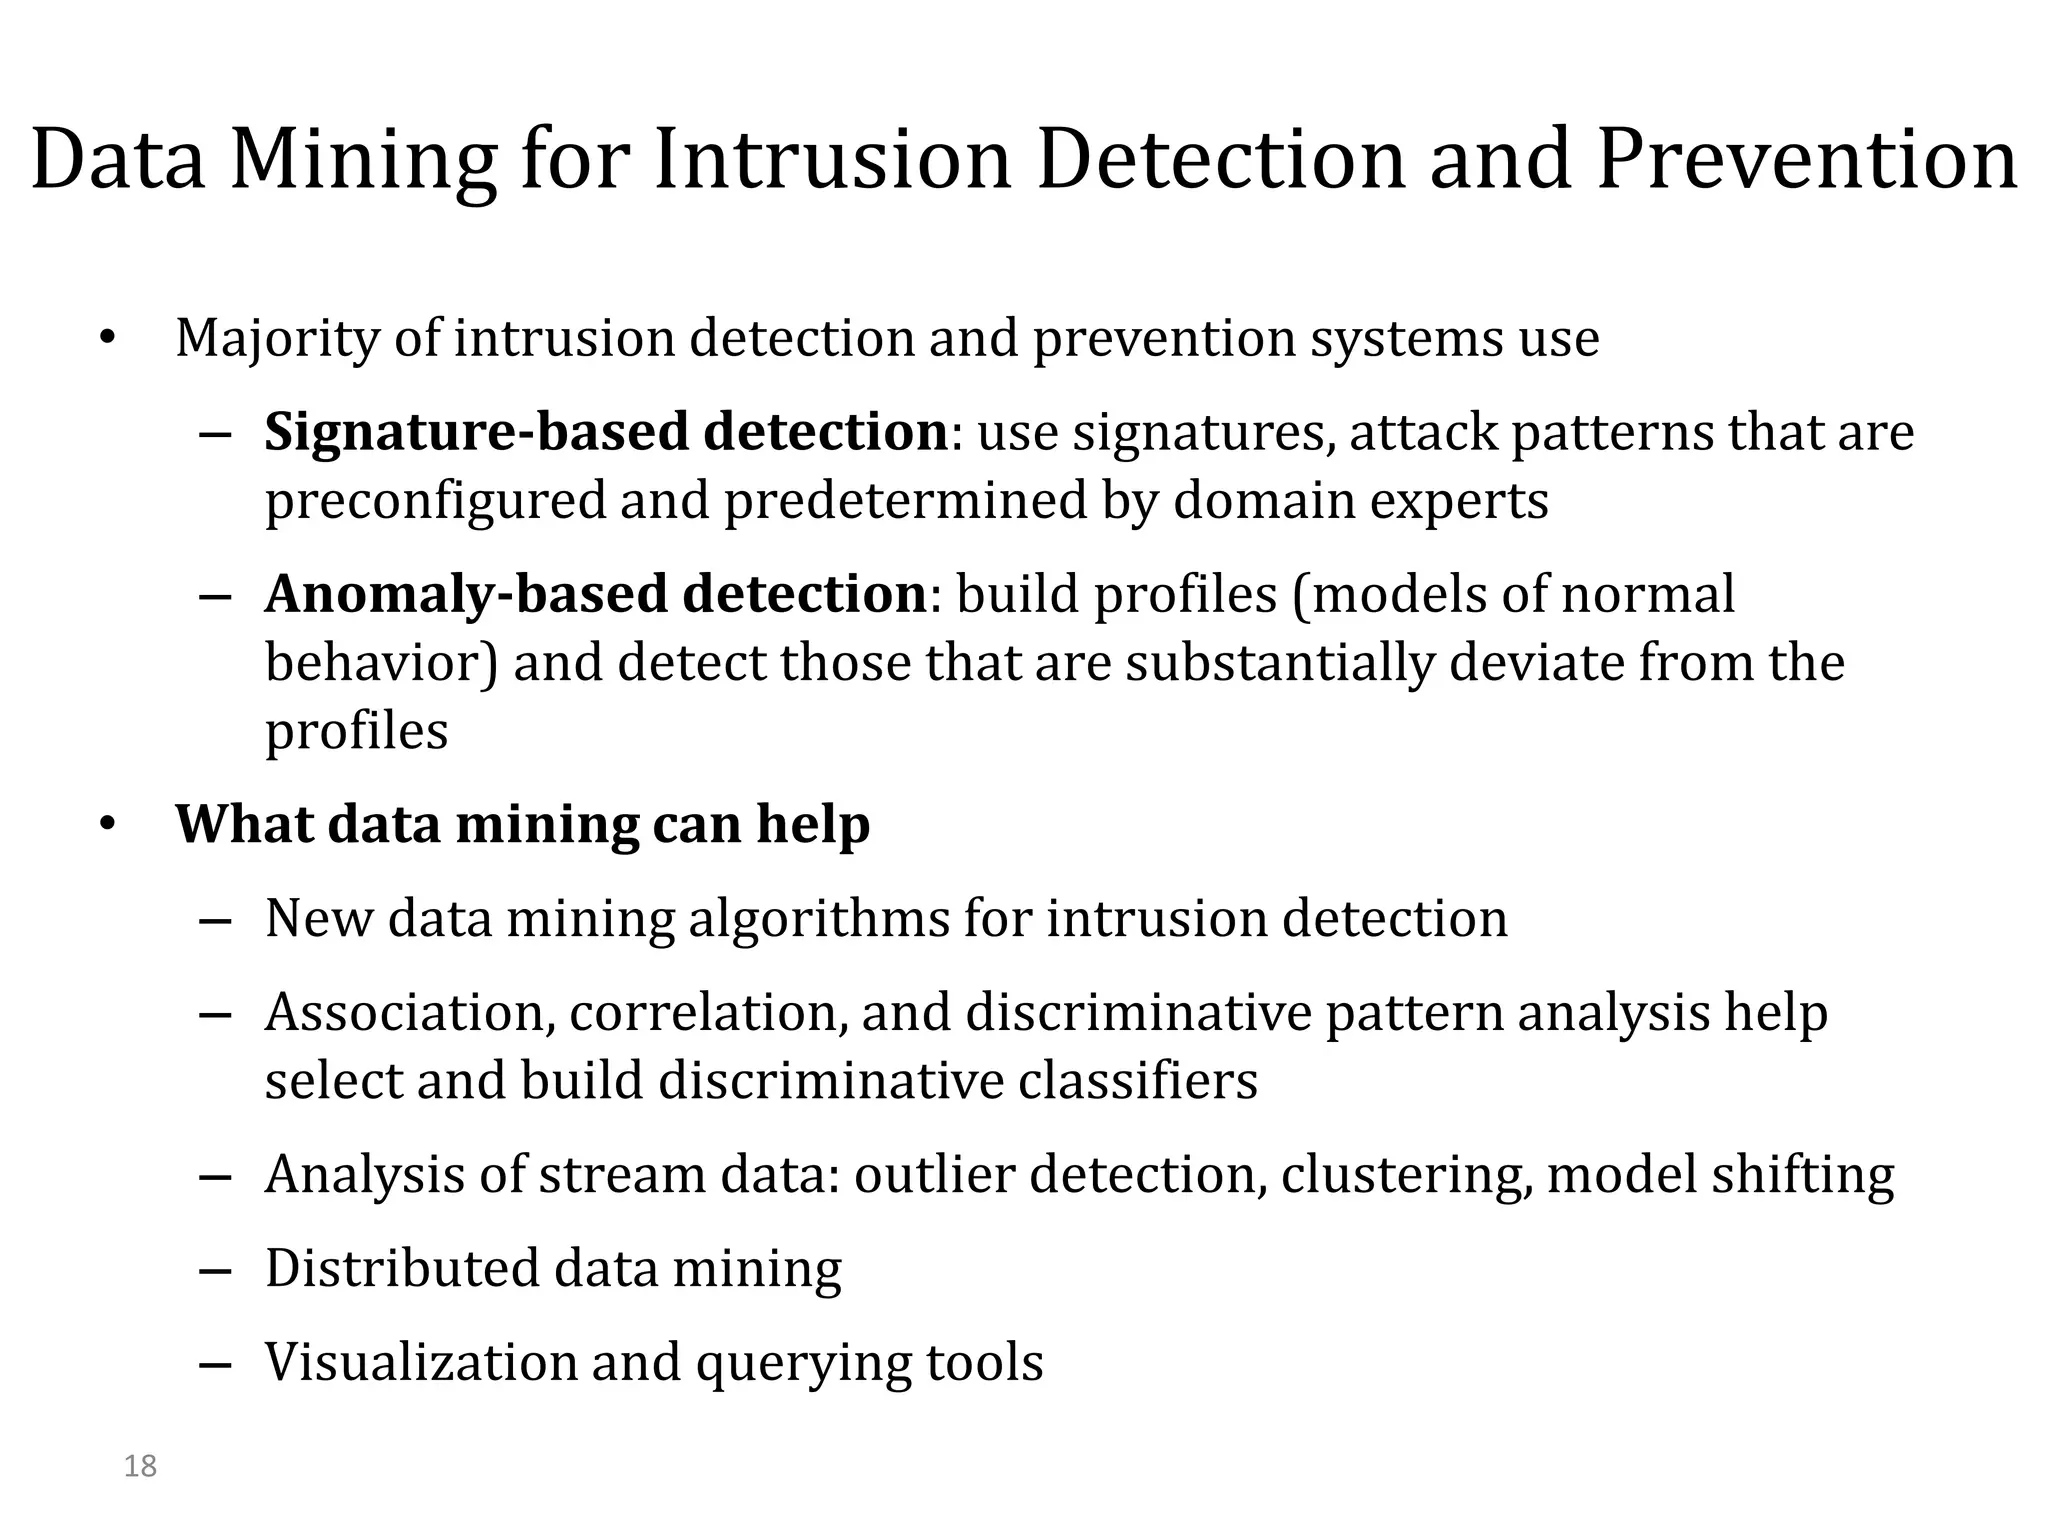
KEMBAR78
introduction to data mining applications | PPT
Introduction to Data mining applications
• Data mining: A young discipline with broad and diverse applications
• Many tools have been developed for domain specific applications
• It includes finance ,retail industry,tele communications
• Some application domains
– Data Mining for Financial data analysis
– Data Mining for Retail and
– Data Mining for Telecommunication Industries
– Data Mining for biological data
– Data Mining for scientific applications
– Data Mining for Intrusion Detection and Prevention
Data Mining for Financial Data Analysis (I)
1. Design and construction of data warehouses for multidimensional
data analysis and data mining
2. Loan payment prediction/consumer credit policy analysis
3. Classification and clustering of customers for targeted marketing
4. Classification and clustering of customers for targeted marketing
3
Data Mining for Financial Data Analysis (I)
• Bank and financial institutions offer a wide range of banking services
• Financial data collected in banks and financial institutions are often
relatively complete, reliable, and of high quality
• Few cases of data mining is as follows
• Design and construction of data warehouses for multidimensional
data analysis and data mining
• DW needs to be constructed
• Data analysis methods has to be applied
• Data characterization,class comparision,otlier analysis play important
roles
Data Mining for Financial Data Analysis (I)
• View the debt and revenue changes by month, by region, by sector, and by
other factors
• Access statistical information such as max, min, total, average, trend, etc.
• Loan payment prediction/consumer credit policy analysis
– feature selection and attribute relevance ranking
– Loan payment performance
– Consumer credit rating
– Credit history
Data Mining for Financial Data Analysis (I)
• Classification and clustering of customers for targeted
marketing
– Classification technique is used to identify most crucial
factors that influence customers in decision making
– identify customer groups
– multidimensional segmentation by nearest-neighbor,
classification,
– decision trees,
– associate a new customer to an appropriate customer
group
– Facilitate targeted marketing
6
• Detection of money laundering and other financial
crimes
– integration of from multiple DBs (e.g., bank transactions,
federal/state crime history DBs)
– Tools: data visualization, linkage analysis, classification,
clustering tools, outlier analysis, and sequential pattern
analysis tools
– They are used to find unusual access sequences
– They identify more important relationships and patterns
of activities
Data Mining for Financial Data Analysis (II)
Data Mining for Retail Industry
It is major application in area of data mining
Retail industry: huge amounts of data on sales, customer shopping history, e-
commerce, etc.
Retail data mining can help to
• Identify buying patterns of customers
• Discover customers shopping patterns
• Find associations among customer demographic characteristics
• Predict response to mailing campaigns
• Achieve better customer retention
• Achieve better customer satisfaction
• Reduce cost of business
• Market basket analysis
• Enhance goods consumption ratios
• Design more effective goods transportation and distribution
policies
Data Mining for Retail Industry
Data mining in retail industry is outliend as follows
1. Design and construction of data warehouses
2. Multidimensional analysis of sales, customers, products, time, and
region
3. Analysis of the effectiveness of sales campaigns
4. Customer retention: Analysis of customer loyalty
5. Product recommendation and cross-reference of items
Data Mining for Retail Industry
• Design and construction of data warehouses
• It guides the design and development of DW
• It involves deciding which dimensions to include
• What preprocessing to perform inorder to facilitate effective data
mining
• Multidimensional analysis of sales, customers, products, time, and
region
• It requires timely information regarding customer
needs,sales,trends,fashion,quality cost,profit
• It provides powerfull MD analysis
• It uses visualization tools
• It facilitates analysis on aggregate complex conditions
10
Data Mining for Retail Industry
• Analysis of the effectiveness of sales campaigns
• It conducts sales campaigns,coupons,various kinds of discounts
• Association analysis may disclose which items are likely to be disclosed
• MD analysis used to perform carefull analysis
• Customer retention: Analysis of customer loyalty
– Use customer loyalty card information to register sequences of
purchases of particular customers
– Use sequential pattern mining to investigate changes in customer
consumption or loyalty
– It helps to retain customers
– It attracks new customers
Data Mining for Retail Industry
• Product recommendation and cross-reference of items
• It uses data mining techniques like association rule mining
• It makes personalized product recommendation
• It helps to improve customer service
• It helps in in selecting items
• It increses sales
Data mining in telecommunication industry
• It integrates telecommunication,computer networks,internet
It creates great demand to help the following
• To understand the business involved
• To identify telecommunication patterns
• To catcy fraudlent activities
• To make better use of resources
• To improve quality of service
Data mining in telecommunication industry
• Few scenarios for which data mining may improve telecommunication
industry
MD analysis of telecommunication data
• OLAP tools are used
• Visualization tools are used
• Compares data traffic
• System overload
• Resource usage user group behaviour and profit
• Fraudlent pattern analysis and identification of unusual patterns
• Identify potential fraudlent users
• Detect attempts to gain fraudlent
• Discover unusual patterns
Data mining in telecommunication industry
• MD association and sequential pattern analysis
• association rules help to promote telecommunication services
• sequential pattern analysis also helps to promote
• Mobile telecommunication services
• Data mining plays a major role in design of adaptive solutions
• Usage of visualization tools in telecommunication data analysis
• Tools for OLAP
• Outliers Visualization Are very usefull
Data mining for biological data analysis
• Biological data mining has become essential part of new research field
called bio informatics
• Biological data mining helps to
• Characterize patient behaviour to predict office visits
• Identify successful medical therapies for different illness
• Develop effective genomic and proteomic data analysis
• DNA sequence comprises of 4 building blocks (adenine
,cytosine,guanine,thymine
• These 4 are combined to form long sequence of chain that resembles
twisted ladder
Data mining for biological data analysis
1. Semantic integration of heterogeneous ,distributed genomic and
protein database:
2. Allignment,indexing,similarity search and comparitive analysis of
multiple nucleoids/protein sequences
3. Discovery of structural patterns and analysis of genetic networks and
protein paths
4. Association and path analysis
5. Visualization tools in gentic data analysis
17
Data Mining in Science and Engineering
• Data warehouses and data preprocessing
– Resolving inconsistencies or incompatible data collected in diverse
environments and different periods (e.g. eco-system studies)
• Mining complex data types
– Spatiotemporal, biological, diverse semantics and relationships
• Graph-based and network-based mining
– Links, relationships, data flow, etc.
• Visualization tools and domain-specific knowledge
• Other issues
– Data mining in social sciences and social studies: text and social
media
– Data mining in computer science: monitoring systems, software
bugs, network intrusion
18
Data Mining for Intrusion Detection and Prevention
• Majority of intrusion detection and prevention systems use
– Signature-based detection: use signatures, attack patterns that are
preconfigured and predetermined by domain experts
– Anomaly-based detection: build profiles (models of normal
behavior) and detect those that are substantially deviate from the
profiles
• What data mining can help
– New data mining algorithms for intrusion detection
– Association, correlation, and discriminative pattern analysis help
select and build discriminative classifiers
– Analysis of stream data: outlier detection, clustering, model shifting
– Distributed data mining
– Visualization and querying tools
Data Mining for Intrusion Detection and Prevention
• New data mining algorithms for intrusion detection
• It Is Used To Detect Misuse detection
• Anaomaly detection models are build
• Normal behaviour is automatically detected
• Significant deviations
1. Association and correlation analysis and aggregation to help select
and build discriminating attributes
2. Analysis of stream data (it is crucial)
3. Distributed data mining(it helps to analyse network data from several
locations)
4. Visualization and querying tools
20
Trends of Data Mining
• Application exploration: Dealing with application-specific problems
• Scalable and interactive data mining methods
• Integration of data mining with Web search engines, database systems,
data warehouse systems and cloud computing systems
• Mining social and information networks
• Mining spatiotemporal, moving objects and cyber-physical systems
• Mining multimedia, text and web data
• Mining biological and biomedical data
• Data mining with software engineering and system engineering
• Visual and audio data mining
• Distributed data mining and real-time data stream mining
• Privacy protection and information security in data mining
Spatial Data Mining
• A spatial database stores a large amount of space-related data, such as
maps, remote sensing or medical imaging data
• It have many features distinguishing them from relational databases.
• It has topological and/or distance information
• Spatial data mining refers to the extraction of knowledge, spatial
relationships
• It discovers spatial relationships between spatial and nonspatial data,
• It have wide applications in geographic information systems,
geomarketing, remote sensing, image database exploration, medical
imaging, navigation, traffic control, environmental studies
• A crucial challenge to spatial data mining is the exploration of efficient
spatial data mining techniques
Spatial Data Mining :close interdependenc
• For example: nature resource,climate, temperature, and economic
situations are likely to be similar in geographically closely located
regions.
• People consider this as the first law of geography: “Everything is
related to everything else, but nearby things are more related than
distant things.”
spatial Data Cube Construction and Spatial OLAP
• “Can we construct a spatial data warehouse?”
• Yes, as with relational data,
• we can construct a data warehouse that facilitates spatial data mining.
• A spatial data warehouse is a subject-oriented, integrated, time-
variant, and nonvolatile collection of both spatial and nonspatial data
in support of decision-making processes.
several challenging issues regarding the construction and
utilization of spatial data warehouses
• the integration of spatial data from heterogeneous sources and systems
• The second challenge is the realization of fast and flexible on-line
analytical processing in spatial data warehouses
• In a spatial warehouse, both dimensions and measures may contain
spatial components.
Three types of dimensions in a spatial data cube
• A nonspatial dimension: It contains only nonspatial data. Nonspatial
dimensions temperature and precipitation can be constructed for the
warehouse
eg:“hot” for temperature and “wet” for precipitation
• A spatial-to-nonspatial dimension :it is a dimension whose primitive-
level data are spatial but whose generalization, starting at a certain high
level, becomes nonspatial.
example: the spatial dimension city relays geographic data for the U.S.
map.
Aspatial-to-spatial dimension :it is a dimension whose primitive level and
all of its highlevel generalized data are spatial.
Example: the dimension equi temperature region contains spatial data, as
do all of its generalizations, such as with regions covering
• 0-5 degrees (Celsius), 5-10 degrees, and so on.
two types of measures in a spatial data cube:
• A numerical measure: it contains only numerical data.
For example, one measure in a spatial data warehouse could be the
monthly revenue of a region, so that a roll-up may compute the total
revenue by year, by county, and so on.
• Numerical measures can be further classified into distributive,
algebraic, and holistic
• A spatial measure: contains a collection of pointers to spatial objects
• the regions with the same range of temperature and precipitation will
be grouped into the same cell
computation of spatial
measures in spatial data cube construction:
• There are three possible choices
• Collect and store the corresponding spatial object pointers but do not
perform precomputation:
• It stores in the corresponding cube cell, a pointer to a collection of spatial
object pointers, and invoking and performing the spatial merge
• This method is a good choice if only spatial display is
• on-line spatial merge computation is fast
• Precompute and store a rough approximation of the spatial measures
in the spatial data cube:
• This choice is good for a rough view or coarse estimation of spatial merge
results
• it requires little storage space.
• Selectively precompute some spatial measures in the spatial data
cube.:
• This can be a smart choice.
• “Which portion of the cube should be selected for materialization?”
• The selection can be performed at the cuboid level,
Mining Spatial Association and Co-location Patterns
• Similar to the mining of association rules in transactional and
relational databases,
• spatial association rules can be mined in spatial databases.
• A spatial association rule is of the form A->B [s%;c%], where A and B
are sets of spatial or nonspatial predicates,
• s% is the support of the rule, and c%is the confidence of the rule
• Eg: is a(X; “school”)^close to(X; “sports center”))close to(X; “park”)
[0:5%;80%].
• This rule states that 80% of schools that are close to sports centers are
also close to parks, and 0.5% of the data belongs to such a case.
• Since spatial association mining needs to evaluate multiple spatial
relationships among a large number of spatial objects, the process
could be quite costly.
progressive refinement & spatial co-locations
• progressive refinement : it can be adopted in spatial association
analysis. The method first mines large data sets roughly using a fast
algorithm and then improves the quality of mining in data set using a
more expensive algorithm
• spatial co-locations:
• one may like to identify groups of particular features that appear
frequently close to each other in a geospatial map.
• This is essentially the problem of mining spatial co-locations.
• Finding spatial co-locations can be considered as a special case of
mining spatial associations.
Spatial Clustering Methods
• Spatial data clustering identifies clusters, or densely populated regions,
according to some distance measurement in a large, multidimensional
data s
• Spatial classification: you would like to classify regions in a province
into rich versus poor according to the average family income. In doing
so, you would like to identify the important spatial-related factors that
determine a region’s classification
• Spatial trend analysis : it deals with another issue: the detection of
changes and trends along a spatial dimension. Typically, trend analysis
detects changes with time
• changes of temporal patterns in time-series data. Spatial trend analysis
replaces time with space
Mining Raster Databases
• Spatial database systems usually handle vector data that consist of
points, lines, polygons (regions), and their compositions, such as
networks or partitions.
• Examples: a huge amount of space-related data are in digital raster
(image) forms, such as satellite images, remote sensing data
Multimedia Data Mining
• “What is a multimedia database?” A
multimedia database system stores and
manages a
• It is a large collection of multimedia data, such
as audio, video, image, graphics, speech,
text,document, and hypertext data, which
contain text, text markups, and linkages.
Similarity Search in Multimedia Data
• “When searching for similarities in multimedia data, can we search on
either the data description or the data content?”
• we consider two main families
• description-based retrieval systems: which build indices and
perform object retrieval based on image descriptions, such as
keywords, captions, size, and time of creation;
• content-based retrieval systems: support retrieval based on the
image content, such as color histogram, texture, pattern, image
topology, and the shape of objects and their layouts and locations
within the image
• Image-sample-based queries :find all of the images that are similar
to the given image sample. This search compares the signature
extracted from the sample with the feature vectors of images that have
already been extracted and indexed in the image database.
• Based on this comparison, images that are close to the sample image
are returned.
• Image feature specification queries: specify or sketch image features
like color, texture, or shape, which are translated into a feature vector
to be matched with the feature vectors of the images in the database
Approaches proposed similarity-based retrieval in
image databases, based on image signature
• Color histogram–based signature:
• This method does not contain any information about shape, image
topology, or texture.
• Thus, two images with similar color composition but that contain very
different shapes or textures may be identified
• Multifeature composed signature: In this approach, the signature of an
image includes a composition of multiple features like color histogram,
shape, image topology, and texture. The extracted image features are
stored as metadata,
Approaches proposed similarity-based retrieval in
image databases, based on image signature
Wavelet-based signature: This approach uses the dominant wavelet
coefficients of an image as its signature
• Wavelets capture shape, texture, and image topology information
• in a single unified framework.
• This improves efficiency
Wavelet-based signature with region-based granularity: In this
approach, the computation and comparison of signatures are at the
granularity of regions, not the entire image.
Multidimensional Analysis of Multimedia Data
• A multimedia data cube can contain additional dimensions and
measures for multimedia information, such as color, texture, and shape.
• MultiMediaMiner system is constructed as follows.
• Each image contains two descriptors: a feature descriptor and a layout
descriptor.
• The original image is not stored directly in the database; only its
descriptors are stored
• The feature descriptor is a set of vectors
• color vector containing the color histogram quantized to 512 colors
• MFC(Most Frequent Color) vector & MFO(Most Frequent
• Orientation) vector. The MFC and MFO contain five color centroids
and five edge orientation centroids for the five most frequent colors
and five most frequent orientations,
• respectively.
• The edge orientations used are 0, 22:5, 45, 67:5, 90,
A multimedia data cube dimensions.
• Image Excavator : component of MultiMediaMiner uses image
contextual information, like HTML tags in Web pages, to derive
keywords
• A multimedia data cube can have many dimensions.
• the size of the image or video in bytes
• the width and height of the frames (or pictures)
• the date on which the image or video was created (or last modified);
• the format type of the image or video
• the frame sequence duration in seconds;
• the image or video Internet domain
• the Internet domain of pages referencing the
• image or video (parent URL)
• the keywords
• a color dimension
• an edge-orientation dimension;
Classification and Prediction
Analysis of Multimedia Data
• Classification and predictive modeling have been used for
mining multimedia data, especially in scientific research,
such as astronomy, seismology, and geo scientific research.
• Data preprocessing is important when mining image data
and can include data
• cleaning, data transformation, and feature extraction.
Standard methods used in pattern recognition, such as
edge detection
• The popular use of the World Wide Web has made the Web
a rich and gigantic repository of multimedia data
Mining Associations in Multimedia Data
Three categories can be observed:
• Associations between image content and nonimage content
features: A rule like “If at least 50% of the upper part of the picture is
blue, then it is likely to represent sky” belongs to this category since it
links the image content to the keyword sky.
• Associations among image contents that are not related to spatial
relationships: A rule like “If a picture contains two blue squares, then it
is likely to contain one red circle aswell” belongs to this category since
the associations are all regarding image contents.
• Associations among image contents related to spatial
relationships: A rule like “If a red triangle is between two yellow
squares, then it is likely a big oval-shaped object is underneath” belongs
to this category since it associates objects in the image with spatial
relationships.
Audio and Video Data Mining
• Besides still images, an incommensurable amount of audiovisual
information is becoming available in digital form
• set of standards are there for multimedia information description and
compression.
• For example, MPEG-k (developed by MPEG: Moving Picture Experts
Group) and JPEG are typical video compression schemes.
• The most recently released MPEG-7, formally named “Multimedia
Content Description Interface,” is a standard for describing the
multimedia content data.
• There are still a lot of research issues

introduction to data mining applications

  • 1.
    Introduction to Datamining applications • Data mining: A young discipline with broad and diverse applications • Many tools have been developed for domain specific applications • It includes finance ,retail industry,tele communications • Some application domains – Data Mining for Financial data analysis – Data Mining for Retail and – Data Mining for Telecommunication Industries – Data Mining for biological data – Data Mining for scientific applications – Data Mining for Intrusion Detection and Prevention
  • 2.
    Data Mining forFinancial Data Analysis (I) 1. Design and construction of data warehouses for multidimensional data analysis and data mining 2. Loan payment prediction/consumer credit policy analysis 3. Classification and clustering of customers for targeted marketing 4. Classification and clustering of customers for targeted marketing
  • 3.
    3 Data Mining forFinancial Data Analysis (I) • Bank and financial institutions offer a wide range of banking services • Financial data collected in banks and financial institutions are often relatively complete, reliable, and of high quality • Few cases of data mining is as follows • Design and construction of data warehouses for multidimensional data analysis and data mining • DW needs to be constructed • Data analysis methods has to be applied • Data characterization,class comparision,otlier analysis play important roles
  • 4.
    Data Mining forFinancial Data Analysis (I) • View the debt and revenue changes by month, by region, by sector, and by other factors • Access statistical information such as max, min, total, average, trend, etc. • Loan payment prediction/consumer credit policy analysis – feature selection and attribute relevance ranking – Loan payment performance – Consumer credit rating – Credit history
  • 5.
    Data Mining forFinancial Data Analysis (I) • Classification and clustering of customers for targeted marketing – Classification technique is used to identify most crucial factors that influence customers in decision making – identify customer groups – multidimensional segmentation by nearest-neighbor, classification, – decision trees, – associate a new customer to an appropriate customer group – Facilitate targeted marketing
  • 6.
    6 • Detection ofmoney laundering and other financial crimes – integration of from multiple DBs (e.g., bank transactions, federal/state crime history DBs) – Tools: data visualization, linkage analysis, classification, clustering tools, outlier analysis, and sequential pattern analysis tools – They are used to find unusual access sequences – They identify more important relationships and patterns of activities Data Mining for Financial Data Analysis (II)
  • 7.
    Data Mining forRetail Industry It is major application in area of data mining Retail industry: huge amounts of data on sales, customer shopping history, e- commerce, etc. Retail data mining can help to • Identify buying patterns of customers • Discover customers shopping patterns • Find associations among customer demographic characteristics • Predict response to mailing campaigns • Achieve better customer retention • Achieve better customer satisfaction • Reduce cost of business • Market basket analysis • Enhance goods consumption ratios • Design more effective goods transportation and distribution policies
  • 8.
    Data Mining forRetail Industry Data mining in retail industry is outliend as follows 1. Design and construction of data warehouses 2. Multidimensional analysis of sales, customers, products, time, and region 3. Analysis of the effectiveness of sales campaigns 4. Customer retention: Analysis of customer loyalty 5. Product recommendation and cross-reference of items
  • 9.
    Data Mining forRetail Industry • Design and construction of data warehouses • It guides the design and development of DW • It involves deciding which dimensions to include • What preprocessing to perform inorder to facilitate effective data mining • Multidimensional analysis of sales, customers, products, time, and region • It requires timely information regarding customer needs,sales,trends,fashion,quality cost,profit • It provides powerfull MD analysis • It uses visualization tools • It facilitates analysis on aggregate complex conditions
  • 10.
    10 Data Mining forRetail Industry • Analysis of the effectiveness of sales campaigns • It conducts sales campaigns,coupons,various kinds of discounts • Association analysis may disclose which items are likely to be disclosed • MD analysis used to perform carefull analysis • Customer retention: Analysis of customer loyalty – Use customer loyalty card information to register sequences of purchases of particular customers – Use sequential pattern mining to investigate changes in customer consumption or loyalty – It helps to retain customers – It attracks new customers
  • 11.
    Data Mining forRetail Industry • Product recommendation and cross-reference of items • It uses data mining techniques like association rule mining • It makes personalized product recommendation • It helps to improve customer service • It helps in in selecting items • It increses sales
  • 12.
    Data mining intelecommunication industry • It integrates telecommunication,computer networks,internet It creates great demand to help the following • To understand the business involved • To identify telecommunication patterns • To catcy fraudlent activities • To make better use of resources • To improve quality of service
  • 13.
    Data mining intelecommunication industry • Few scenarios for which data mining may improve telecommunication industry MD analysis of telecommunication data • OLAP tools are used • Visualization tools are used • Compares data traffic • System overload • Resource usage user group behaviour and profit • Fraudlent pattern analysis and identification of unusual patterns • Identify potential fraudlent users • Detect attempts to gain fraudlent • Discover unusual patterns
  • 14.
    Data mining intelecommunication industry • MD association and sequential pattern analysis • association rules help to promote telecommunication services • sequential pattern analysis also helps to promote • Mobile telecommunication services • Data mining plays a major role in design of adaptive solutions • Usage of visualization tools in telecommunication data analysis • Tools for OLAP • Outliers Visualization Are very usefull
  • 15.
    Data mining forbiological data analysis • Biological data mining has become essential part of new research field called bio informatics • Biological data mining helps to • Characterize patient behaviour to predict office visits • Identify successful medical therapies for different illness • Develop effective genomic and proteomic data analysis • DNA sequence comprises of 4 building blocks (adenine ,cytosine,guanine,thymine • These 4 are combined to form long sequence of chain that resembles twisted ladder
  • 16.
    Data mining forbiological data analysis 1. Semantic integration of heterogeneous ,distributed genomic and protein database: 2. Allignment,indexing,similarity search and comparitive analysis of multiple nucleoids/protein sequences 3. Discovery of structural patterns and analysis of genetic networks and protein paths 4. Association and path analysis 5. Visualization tools in gentic data analysis
  • 17.
    17 Data Mining inScience and Engineering • Data warehouses and data preprocessing – Resolving inconsistencies or incompatible data collected in diverse environments and different periods (e.g. eco-system studies) • Mining complex data types – Spatiotemporal, biological, diverse semantics and relationships • Graph-based and network-based mining – Links, relationships, data flow, etc. • Visualization tools and domain-specific knowledge • Other issues – Data mining in social sciences and social studies: text and social media – Data mining in computer science: monitoring systems, software bugs, network intrusion
  • 18.
    18 Data Mining forIntrusion Detection and Prevention • Majority of intrusion detection and prevention systems use – Signature-based detection: use signatures, attack patterns that are preconfigured and predetermined by domain experts – Anomaly-based detection: build profiles (models of normal behavior) and detect those that are substantially deviate from the profiles • What data mining can help – New data mining algorithms for intrusion detection – Association, correlation, and discriminative pattern analysis help select and build discriminative classifiers – Analysis of stream data: outlier detection, clustering, model shifting – Distributed data mining – Visualization and querying tools
  • 19.
    Data Mining forIntrusion Detection and Prevention • New data mining algorithms for intrusion detection • It Is Used To Detect Misuse detection • Anaomaly detection models are build • Normal behaviour is automatically detected • Significant deviations 1. Association and correlation analysis and aggregation to help select and build discriminating attributes 2. Analysis of stream data (it is crucial) 3. Distributed data mining(it helps to analyse network data from several locations) 4. Visualization and querying tools
  • 20.
    20 Trends of DataMining • Application exploration: Dealing with application-specific problems • Scalable and interactive data mining methods • Integration of data mining with Web search engines, database systems, data warehouse systems and cloud computing systems • Mining social and information networks • Mining spatiotemporal, moving objects and cyber-physical systems • Mining multimedia, text and web data • Mining biological and biomedical data • Data mining with software engineering and system engineering • Visual and audio data mining • Distributed data mining and real-time data stream mining • Privacy protection and information security in data mining
  • 21.
    Spatial Data Mining •A spatial database stores a large amount of space-related data, such as maps, remote sensing or medical imaging data • It have many features distinguishing them from relational databases. • It has topological and/or distance information • Spatial data mining refers to the extraction of knowledge, spatial relationships • It discovers spatial relationships between spatial and nonspatial data, • It have wide applications in geographic information systems, geomarketing, remote sensing, image database exploration, medical imaging, navigation, traffic control, environmental studies • A crucial challenge to spatial data mining is the exploration of efficient spatial data mining techniques
  • 22.
    Spatial Data Mining:close interdependenc • For example: nature resource,climate, temperature, and economic situations are likely to be similar in geographically closely located regions. • People consider this as the first law of geography: “Everything is related to everything else, but nearby things are more related than distant things.”
  • 23.
    spatial Data CubeConstruction and Spatial OLAP • “Can we construct a spatial data warehouse?” • Yes, as with relational data, • we can construct a data warehouse that facilitates spatial data mining. • A spatial data warehouse is a subject-oriented, integrated, time- variant, and nonvolatile collection of both spatial and nonspatial data in support of decision-making processes.
  • 24.
    several challenging issuesregarding the construction and utilization of spatial data warehouses • the integration of spatial data from heterogeneous sources and systems • The second challenge is the realization of fast and flexible on-line analytical processing in spatial data warehouses • In a spatial warehouse, both dimensions and measures may contain spatial components.
  • 25.
    Three types ofdimensions in a spatial data cube • A nonspatial dimension: It contains only nonspatial data. Nonspatial dimensions temperature and precipitation can be constructed for the warehouse eg:“hot” for temperature and “wet” for precipitation • A spatial-to-nonspatial dimension :it is a dimension whose primitive- level data are spatial but whose generalization, starting at a certain high level, becomes nonspatial. example: the spatial dimension city relays geographic data for the U.S. map. Aspatial-to-spatial dimension :it is a dimension whose primitive level and all of its highlevel generalized data are spatial. Example: the dimension equi temperature region contains spatial data, as do all of its generalizations, such as with regions covering • 0-5 degrees (Celsius), 5-10 degrees, and so on.
  • 26.
    two types ofmeasures in a spatial data cube: • A numerical measure: it contains only numerical data. For example, one measure in a spatial data warehouse could be the monthly revenue of a region, so that a roll-up may compute the total revenue by year, by county, and so on. • Numerical measures can be further classified into distributive, algebraic, and holistic • A spatial measure: contains a collection of pointers to spatial objects • the regions with the same range of temperature and precipitation will be grouped into the same cell
  • 29.
    computation of spatial measuresin spatial data cube construction: • There are three possible choices • Collect and store the corresponding spatial object pointers but do not perform precomputation: • It stores in the corresponding cube cell, a pointer to a collection of spatial object pointers, and invoking and performing the spatial merge • This method is a good choice if only spatial display is • on-line spatial merge computation is fast • Precompute and store a rough approximation of the spatial measures in the spatial data cube: • This choice is good for a rough view or coarse estimation of spatial merge results • it requires little storage space. • Selectively precompute some spatial measures in the spatial data cube.: • This can be a smart choice. • “Which portion of the cube should be selected for materialization?” • The selection can be performed at the cuboid level,
  • 30.
    Mining Spatial Associationand Co-location Patterns • Similar to the mining of association rules in transactional and relational databases, • spatial association rules can be mined in spatial databases. • A spatial association rule is of the form A->B [s%;c%], where A and B are sets of spatial or nonspatial predicates, • s% is the support of the rule, and c%is the confidence of the rule • Eg: is a(X; “school”)^close to(X; “sports center”))close to(X; “park”) [0:5%;80%]. • This rule states that 80% of schools that are close to sports centers are also close to parks, and 0.5% of the data belongs to such a case. • Since spatial association mining needs to evaluate multiple spatial relationships among a large number of spatial objects, the process could be quite costly.
  • 31.
    progressive refinement &spatial co-locations • progressive refinement : it can be adopted in spatial association analysis. The method first mines large data sets roughly using a fast algorithm and then improves the quality of mining in data set using a more expensive algorithm • spatial co-locations: • one may like to identify groups of particular features that appear frequently close to each other in a geospatial map. • This is essentially the problem of mining spatial co-locations. • Finding spatial co-locations can be considered as a special case of mining spatial associations.
  • 32.
    Spatial Clustering Methods •Spatial data clustering identifies clusters, or densely populated regions, according to some distance measurement in a large, multidimensional data s • Spatial classification: you would like to classify regions in a province into rich versus poor according to the average family income. In doing so, you would like to identify the important spatial-related factors that determine a region’s classification • Spatial trend analysis : it deals with another issue: the detection of changes and trends along a spatial dimension. Typically, trend analysis detects changes with time • changes of temporal patterns in time-series data. Spatial trend analysis replaces time with space
  • 33.
    Mining Raster Databases •Spatial database systems usually handle vector data that consist of points, lines, polygons (regions), and their compositions, such as networks or partitions. • Examples: a huge amount of space-related data are in digital raster (image) forms, such as satellite images, remote sensing data
  • 34.
    Multimedia Data Mining •“What is a multimedia database?” A multimedia database system stores and manages a • It is a large collection of multimedia data, such as audio, video, image, graphics, speech, text,document, and hypertext data, which contain text, text markups, and linkages.
  • 35.
    Similarity Search inMultimedia Data • “When searching for similarities in multimedia data, can we search on either the data description or the data content?” • we consider two main families • description-based retrieval systems: which build indices and perform object retrieval based on image descriptions, such as keywords, captions, size, and time of creation; • content-based retrieval systems: support retrieval based on the image content, such as color histogram, texture, pattern, image topology, and the shape of objects and their layouts and locations within the image • Image-sample-based queries :find all of the images that are similar to the given image sample. This search compares the signature extracted from the sample with the feature vectors of images that have already been extracted and indexed in the image database. • Based on this comparison, images that are close to the sample image are returned. • Image feature specification queries: specify or sketch image features like color, texture, or shape, which are translated into a feature vector to be matched with the feature vectors of the images in the database
  • 36.
    Approaches proposed similarity-basedretrieval in image databases, based on image signature • Color histogram–based signature: • This method does not contain any information about shape, image topology, or texture. • Thus, two images with similar color composition but that contain very different shapes or textures may be identified • Multifeature composed signature: In this approach, the signature of an image includes a composition of multiple features like color histogram, shape, image topology, and texture. The extracted image features are stored as metadata,
  • 37.
    Approaches proposed similarity-basedretrieval in image databases, based on image signature Wavelet-based signature: This approach uses the dominant wavelet coefficients of an image as its signature • Wavelets capture shape, texture, and image topology information • in a single unified framework. • This improves efficiency Wavelet-based signature with region-based granularity: In this approach, the computation and comparison of signatures are at the granularity of regions, not the entire image.
  • 38.
    Multidimensional Analysis ofMultimedia Data • A multimedia data cube can contain additional dimensions and measures for multimedia information, such as color, texture, and shape. • MultiMediaMiner system is constructed as follows. • Each image contains two descriptors: a feature descriptor and a layout descriptor. • The original image is not stored directly in the database; only its descriptors are stored • The feature descriptor is a set of vectors • color vector containing the color histogram quantized to 512 colors • MFC(Most Frequent Color) vector & MFO(Most Frequent • Orientation) vector. The MFC and MFO contain five color centroids and five edge orientation centroids for the five most frequent colors and five most frequent orientations, • respectively. • The edge orientations used are 0, 22:5, 45, 67:5, 90,
  • 39.
    A multimedia datacube dimensions. • Image Excavator : component of MultiMediaMiner uses image contextual information, like HTML tags in Web pages, to derive keywords • A multimedia data cube can have many dimensions. • the size of the image or video in bytes • the width and height of the frames (or pictures) • the date on which the image or video was created (or last modified); • the format type of the image or video • the frame sequence duration in seconds; • the image or video Internet domain • the Internet domain of pages referencing the • image or video (parent URL) • the keywords • a color dimension • an edge-orientation dimension;
  • 40.
    Classification and Prediction Analysisof Multimedia Data • Classification and predictive modeling have been used for mining multimedia data, especially in scientific research, such as astronomy, seismology, and geo scientific research. • Data preprocessing is important when mining image data and can include data • cleaning, data transformation, and feature extraction. Standard methods used in pattern recognition, such as edge detection • The popular use of the World Wide Web has made the Web a rich and gigantic repository of multimedia data
  • 41.
    Mining Associations inMultimedia Data Three categories can be observed: • Associations between image content and nonimage content features: A rule like “If at least 50% of the upper part of the picture is blue, then it is likely to represent sky” belongs to this category since it links the image content to the keyword sky. • Associations among image contents that are not related to spatial relationships: A rule like “If a picture contains two blue squares, then it is likely to contain one red circle aswell” belongs to this category since the associations are all regarding image contents. • Associations among image contents related to spatial relationships: A rule like “If a red triangle is between two yellow squares, then it is likely a big oval-shaped object is underneath” belongs to this category since it associates objects in the image with spatial relationships.
  • 42.
    Audio and VideoData Mining • Besides still images, an incommensurable amount of audiovisual information is becoming available in digital form • set of standards are there for multimedia information description and compression. • For example, MPEG-k (developed by MPEG: Moving Picture Experts Group) and JPEG are typical video compression schemes. • The most recently released MPEG-7, formally named “Multimedia Content Description Interface,” is a standard for describing the multimedia content data. • There are still a lot of research issues