Course
Outcomes
After completion ofthis course, students will be able to
Understand machine-learning concepts.
Understand and implement Classification concepts.
Understand and analyse the different Regression
algorithms.
Apply the concept of Unsupervised Learning.
Apply the concepts ofArtificial Neural Networks.
2.
Topics
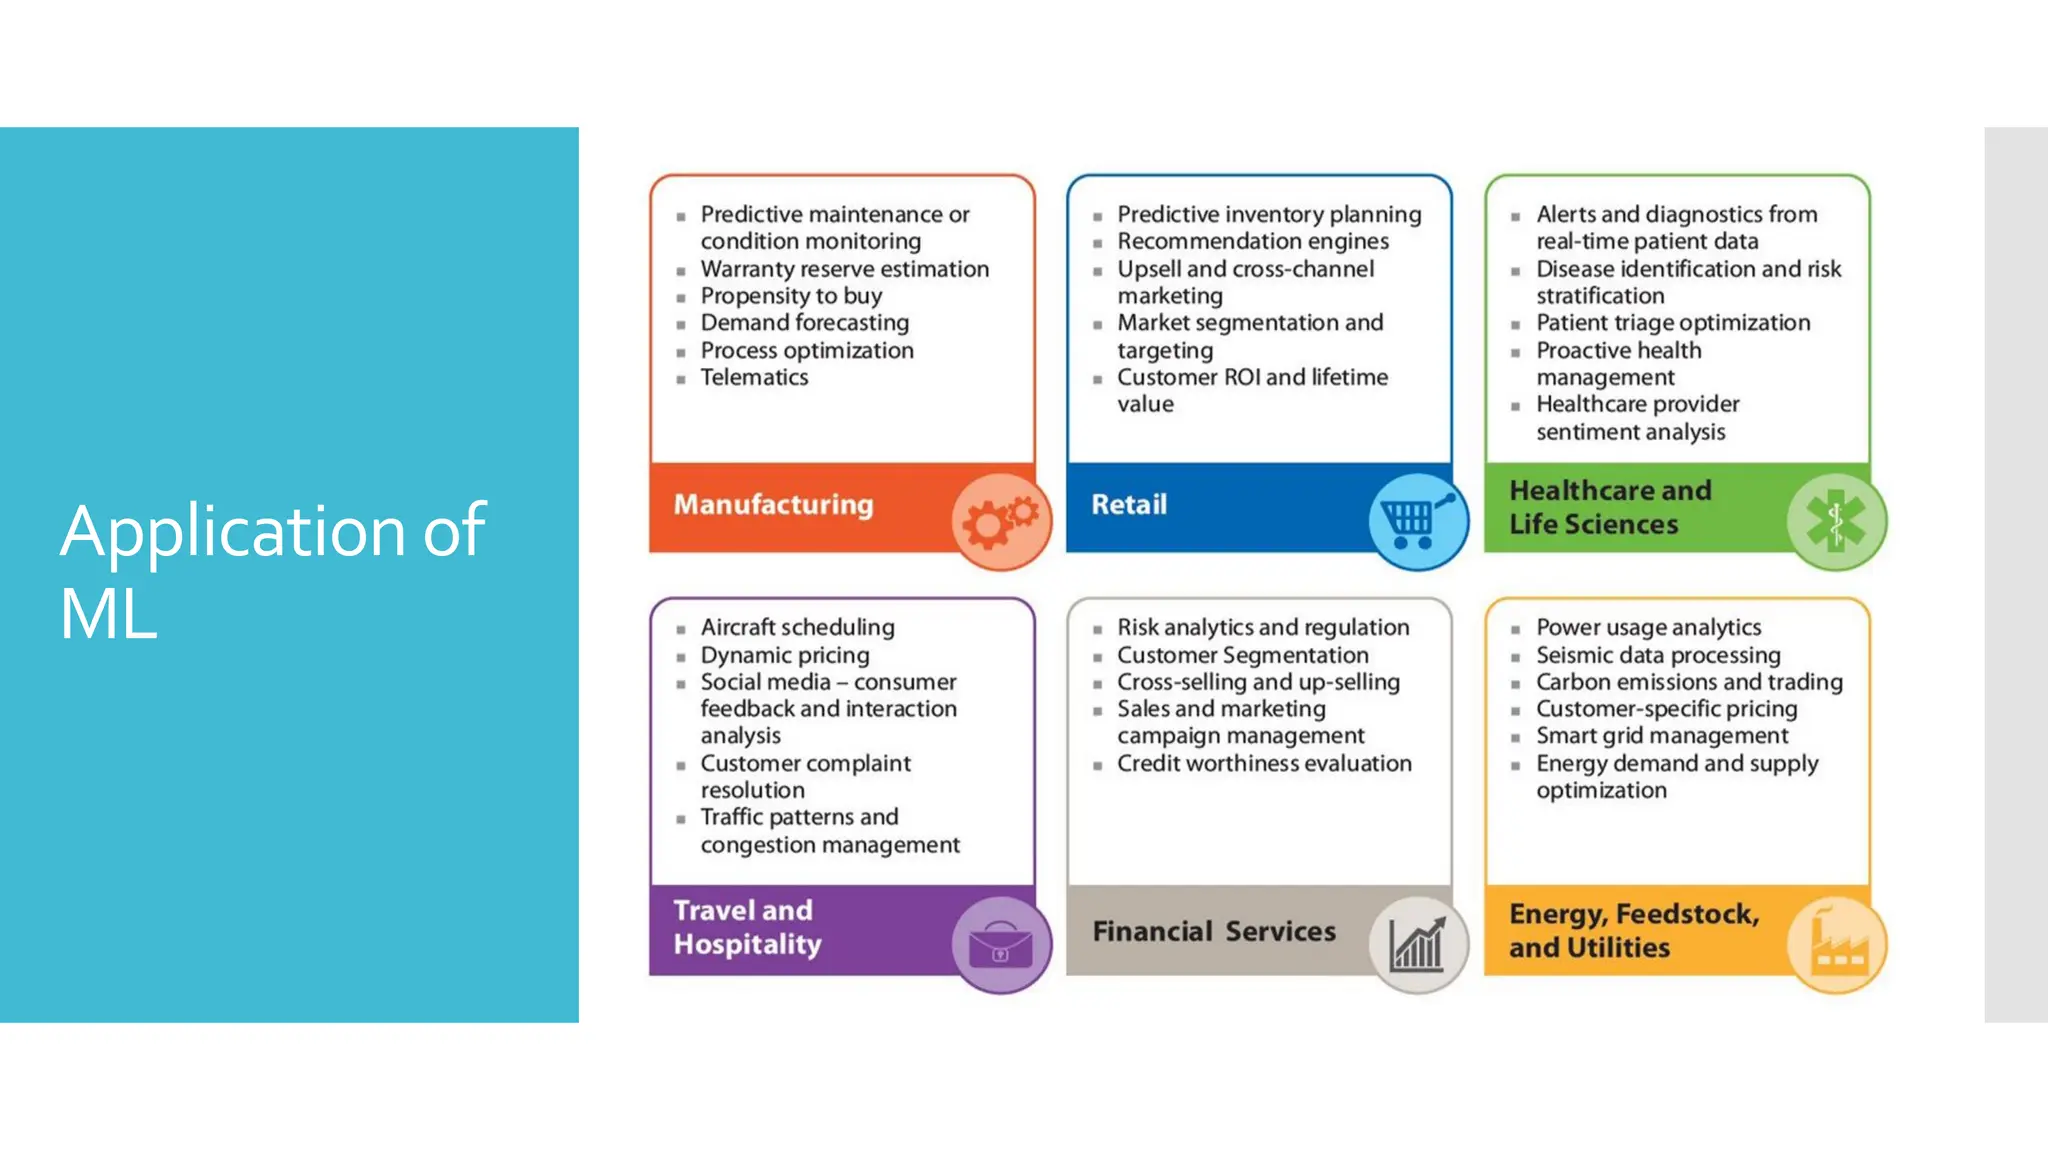
Introduction to ML:
Motivation and Applications
Importance of DataVisualization
Basics of Supervised, Unsupervised, and Reinforcement
Learning
Current research trends in ML
3.
Machine
Learning
Introduction
ML isan interdisciplinary field:
Data Analyst: visualize, analyze data, optimization
Data Engineers: build and test scalable / stable /
optimal ecosystems for data scientists to run their
algorithms
Database Administrator: responsible for the
proper functioning of all the databases.
Data Scientist: perform predictive analysis and
offer actionable insights.
Statistician: extract and offer valuable insights
from the data using statistical theory and tools.
Machine
Learning
Introduction
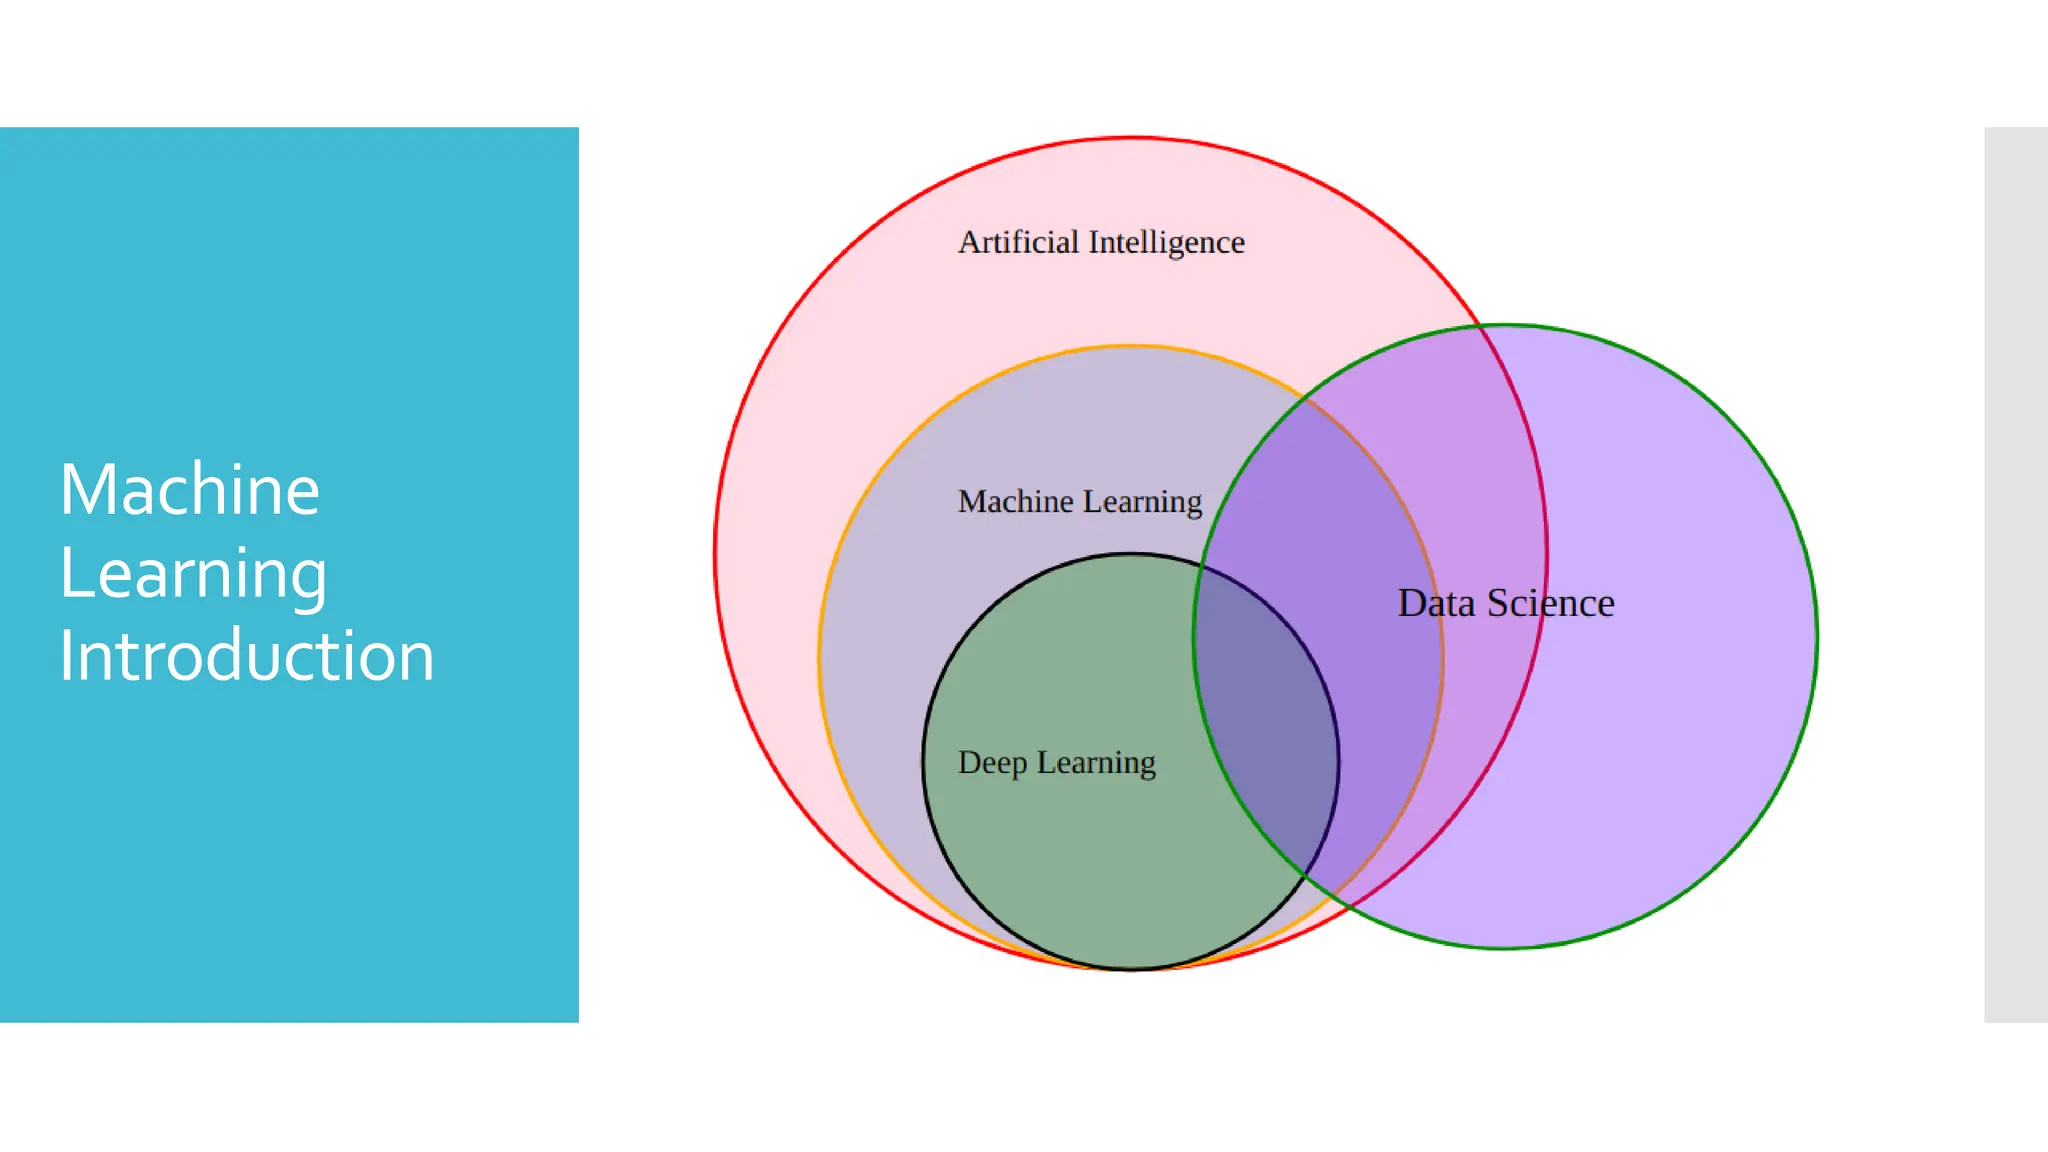
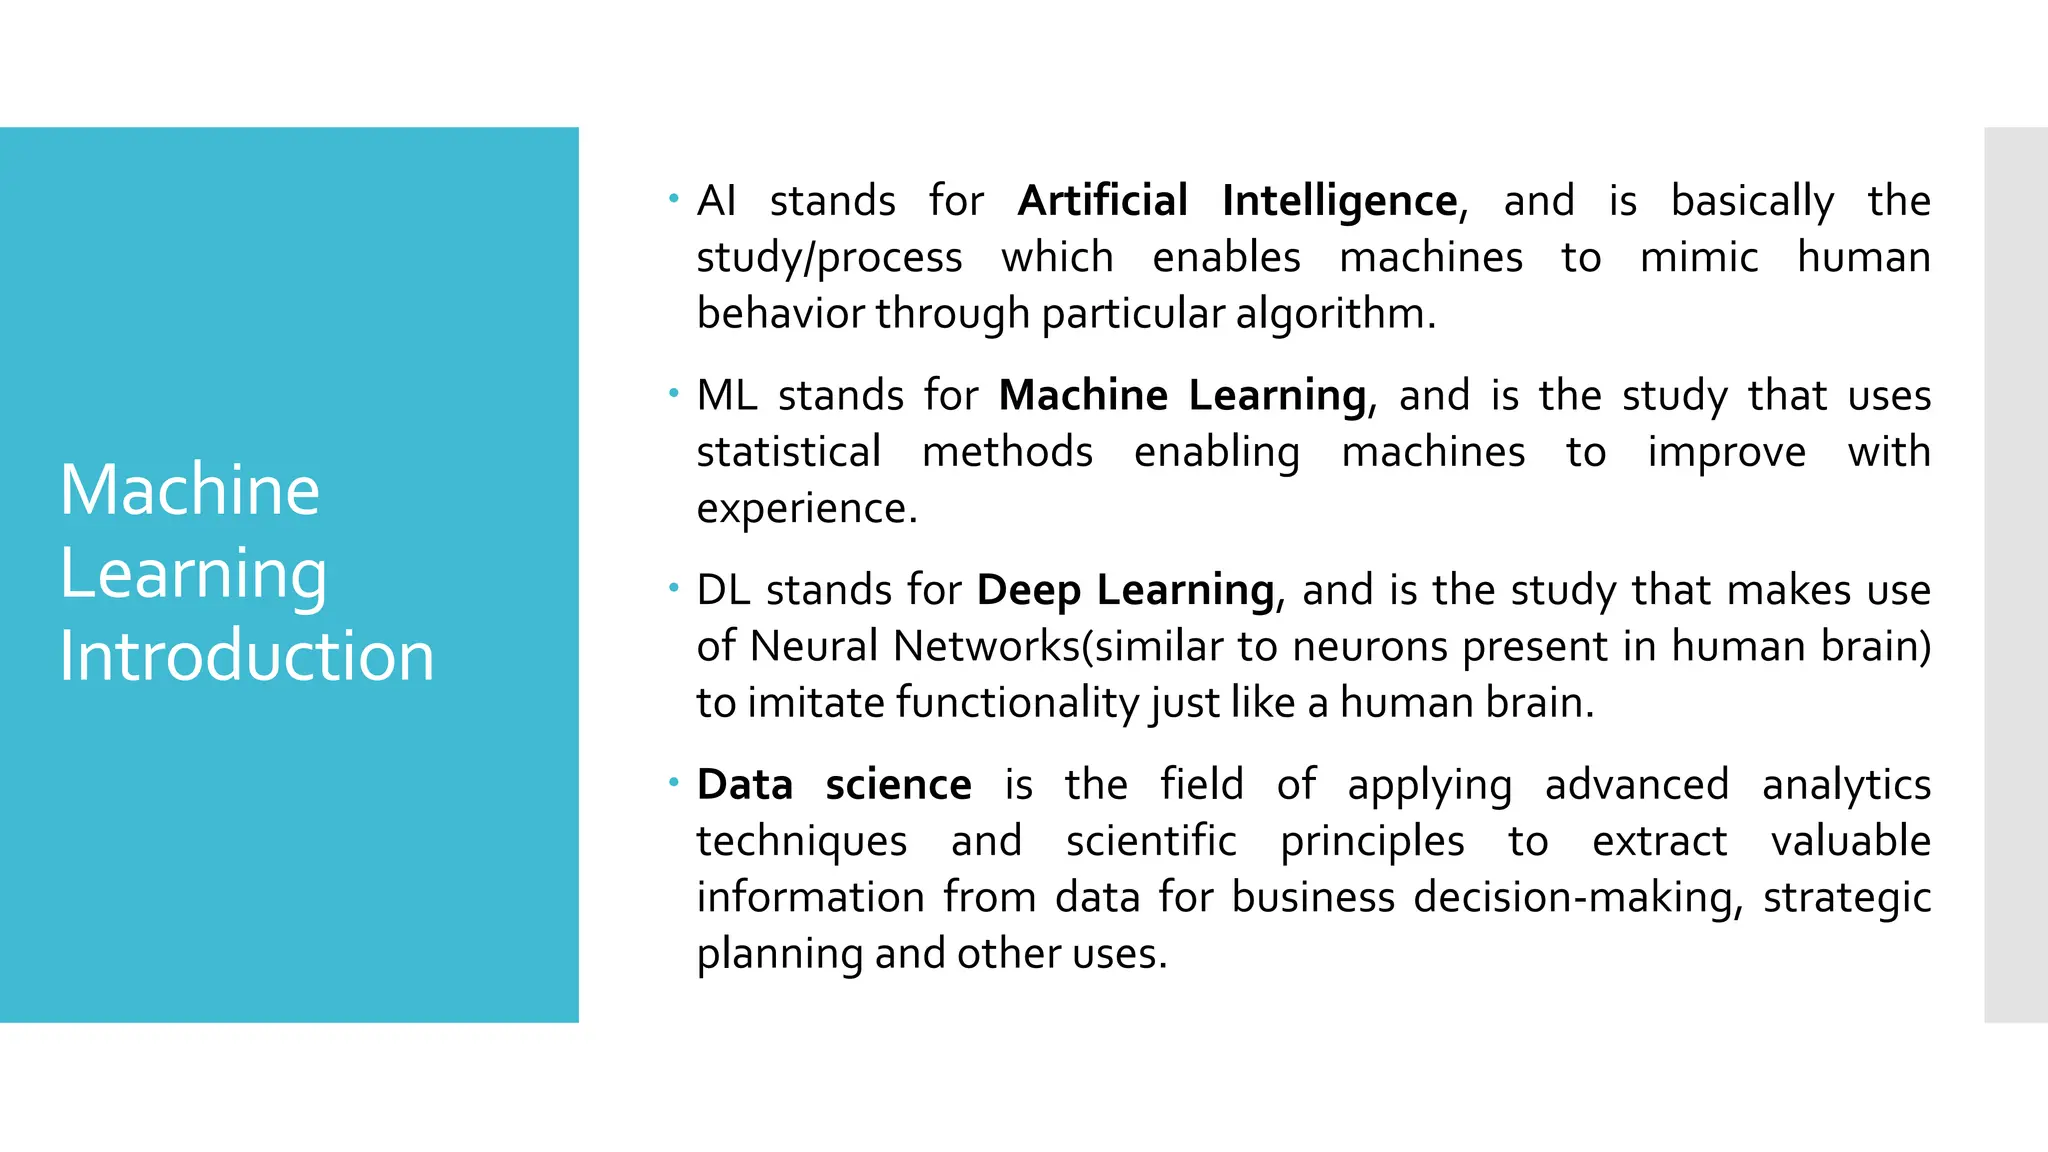
AI standsfor Artificial Intelligence, and is basically the
study/process which enables machines to mimic human
behavior through particular algorithm.
ML stands for Machine Learning, and is the study that uses
statistical methods enabling machines to improve with
experience.
DL stands for Deep Learning, and is the study that makes use
of Neural Networks(similar to neurons present in human brain)
to imitate functionality just like a human brain.
Data science is the field of applying advanced analytics
techniques and scientific principles to extract valuable
information from data for business decision-making, strategic
planning and other uses.
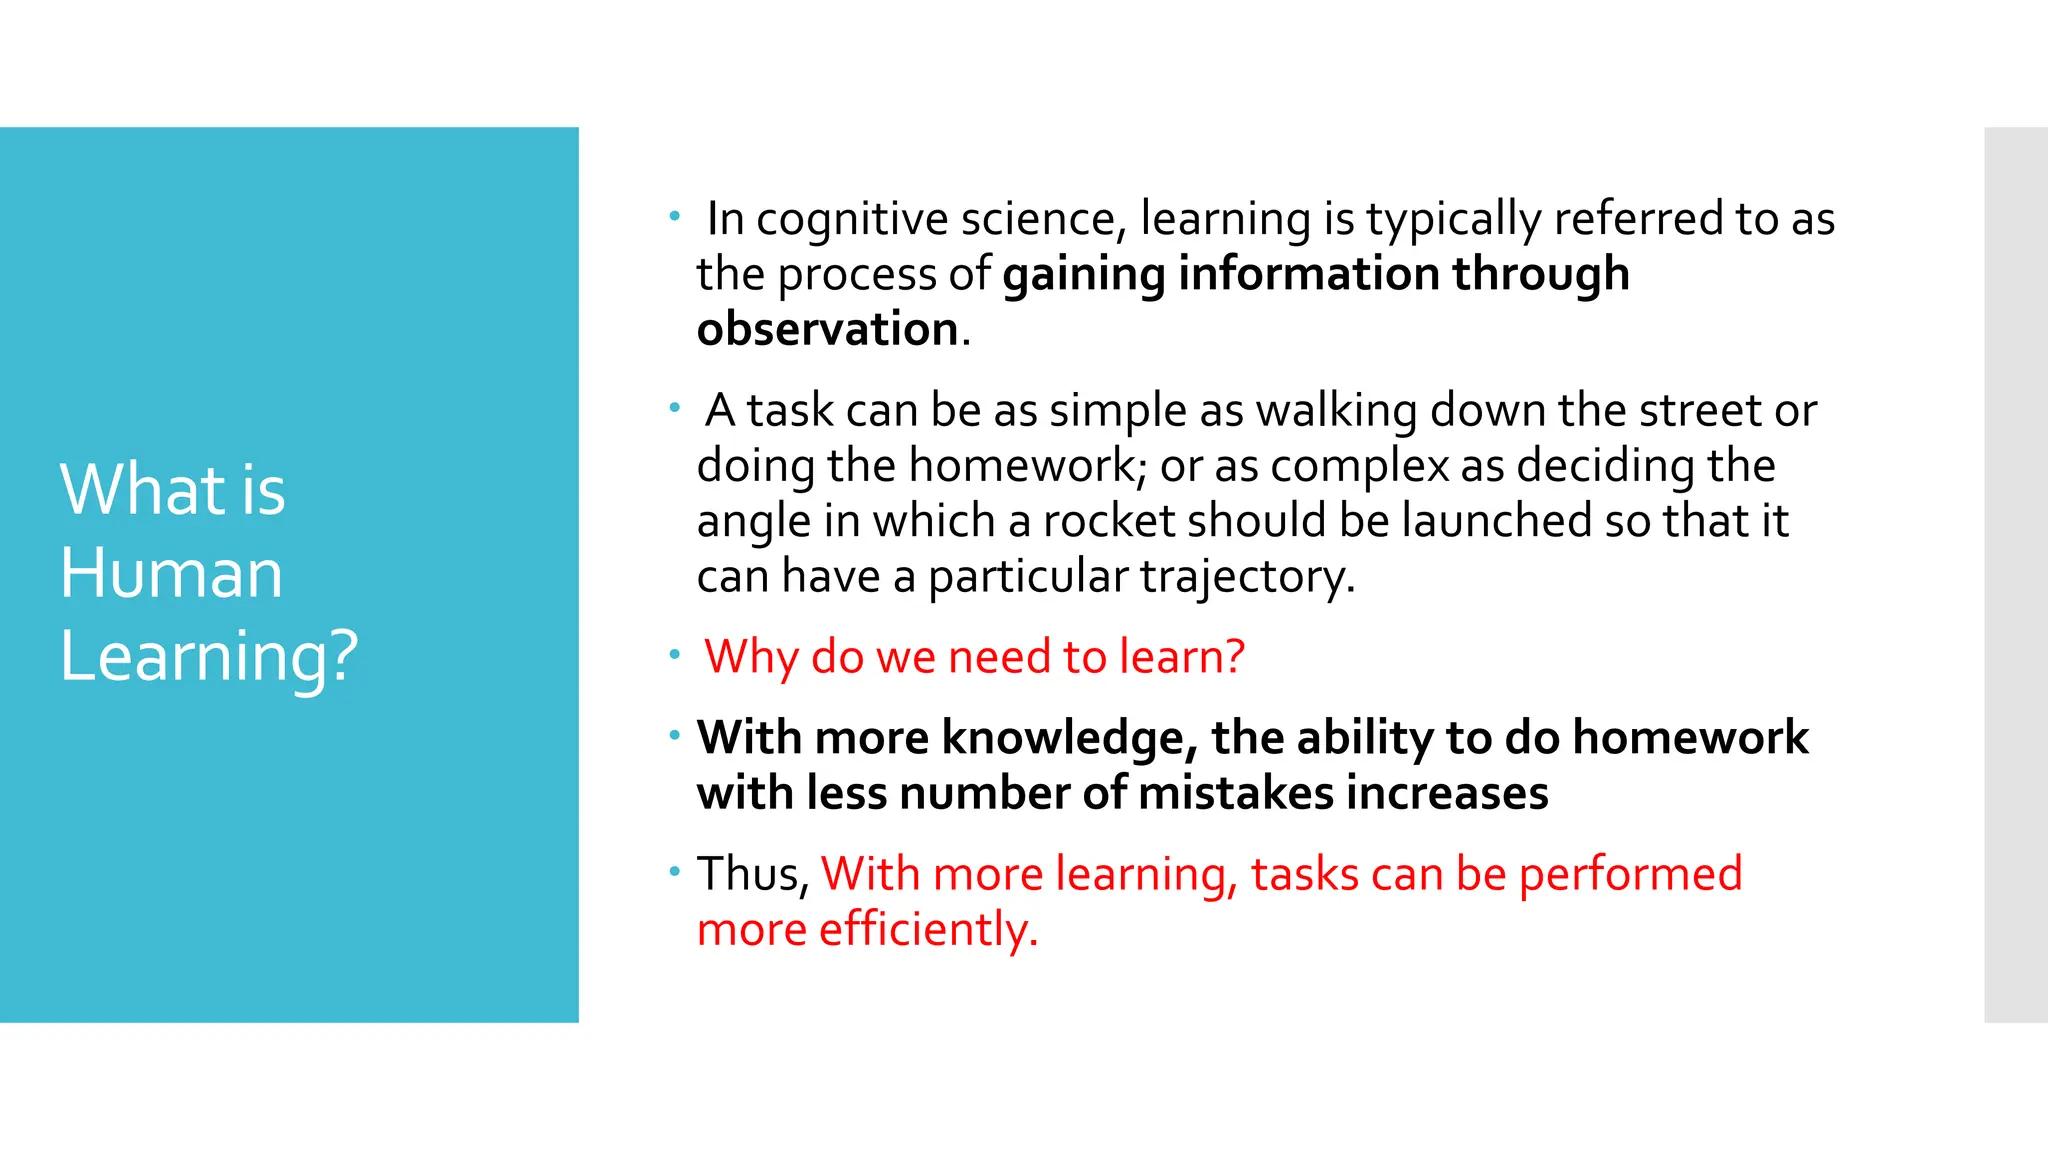
What is
Human
Learning?
Incognitive science, learning is typically referred to as
the process of gaining information through
observation.
A task can be as simple as walking down the street or
doing the homework; or as complex as deciding the
angle in which a rocket should be launched so that it
can have a particular trajectory.
Why do we need to learn?
With more knowledge, the ability to do homework
with less number of mistakes increases
Thus,With more learning, tasks can be performed
more efficiently.
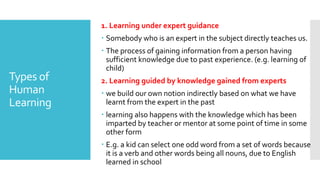
10.
Types of
Human
Learning
1. Learningunder expert guidance
Somebody who is an expert in the subject directly teaches us.
The process of gaining information from a person having
sufficient knowledge due to past experience. (e.g. learning of
child)
2. Learning guided by knowledge gained from experts
we build our own notion indirectly based on what we have
learnt from the expert in the past
learning also happens with the knowledge which has been
imparted by teacher or mentor at some point of time in some
other form
E.g. a kid can select one odd word from a set of words because
it is a verb and other words being all nouns, due to English
learned in school
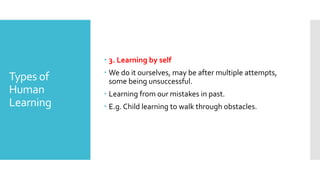
11.
Types of
Human
Learning
3.Learning by self
We do it ourselves, may be after multiple attempts,
some being unsuccessful.
Learning from our mistakes in past.
E.g. Child learning to walk through obstacles.
12.
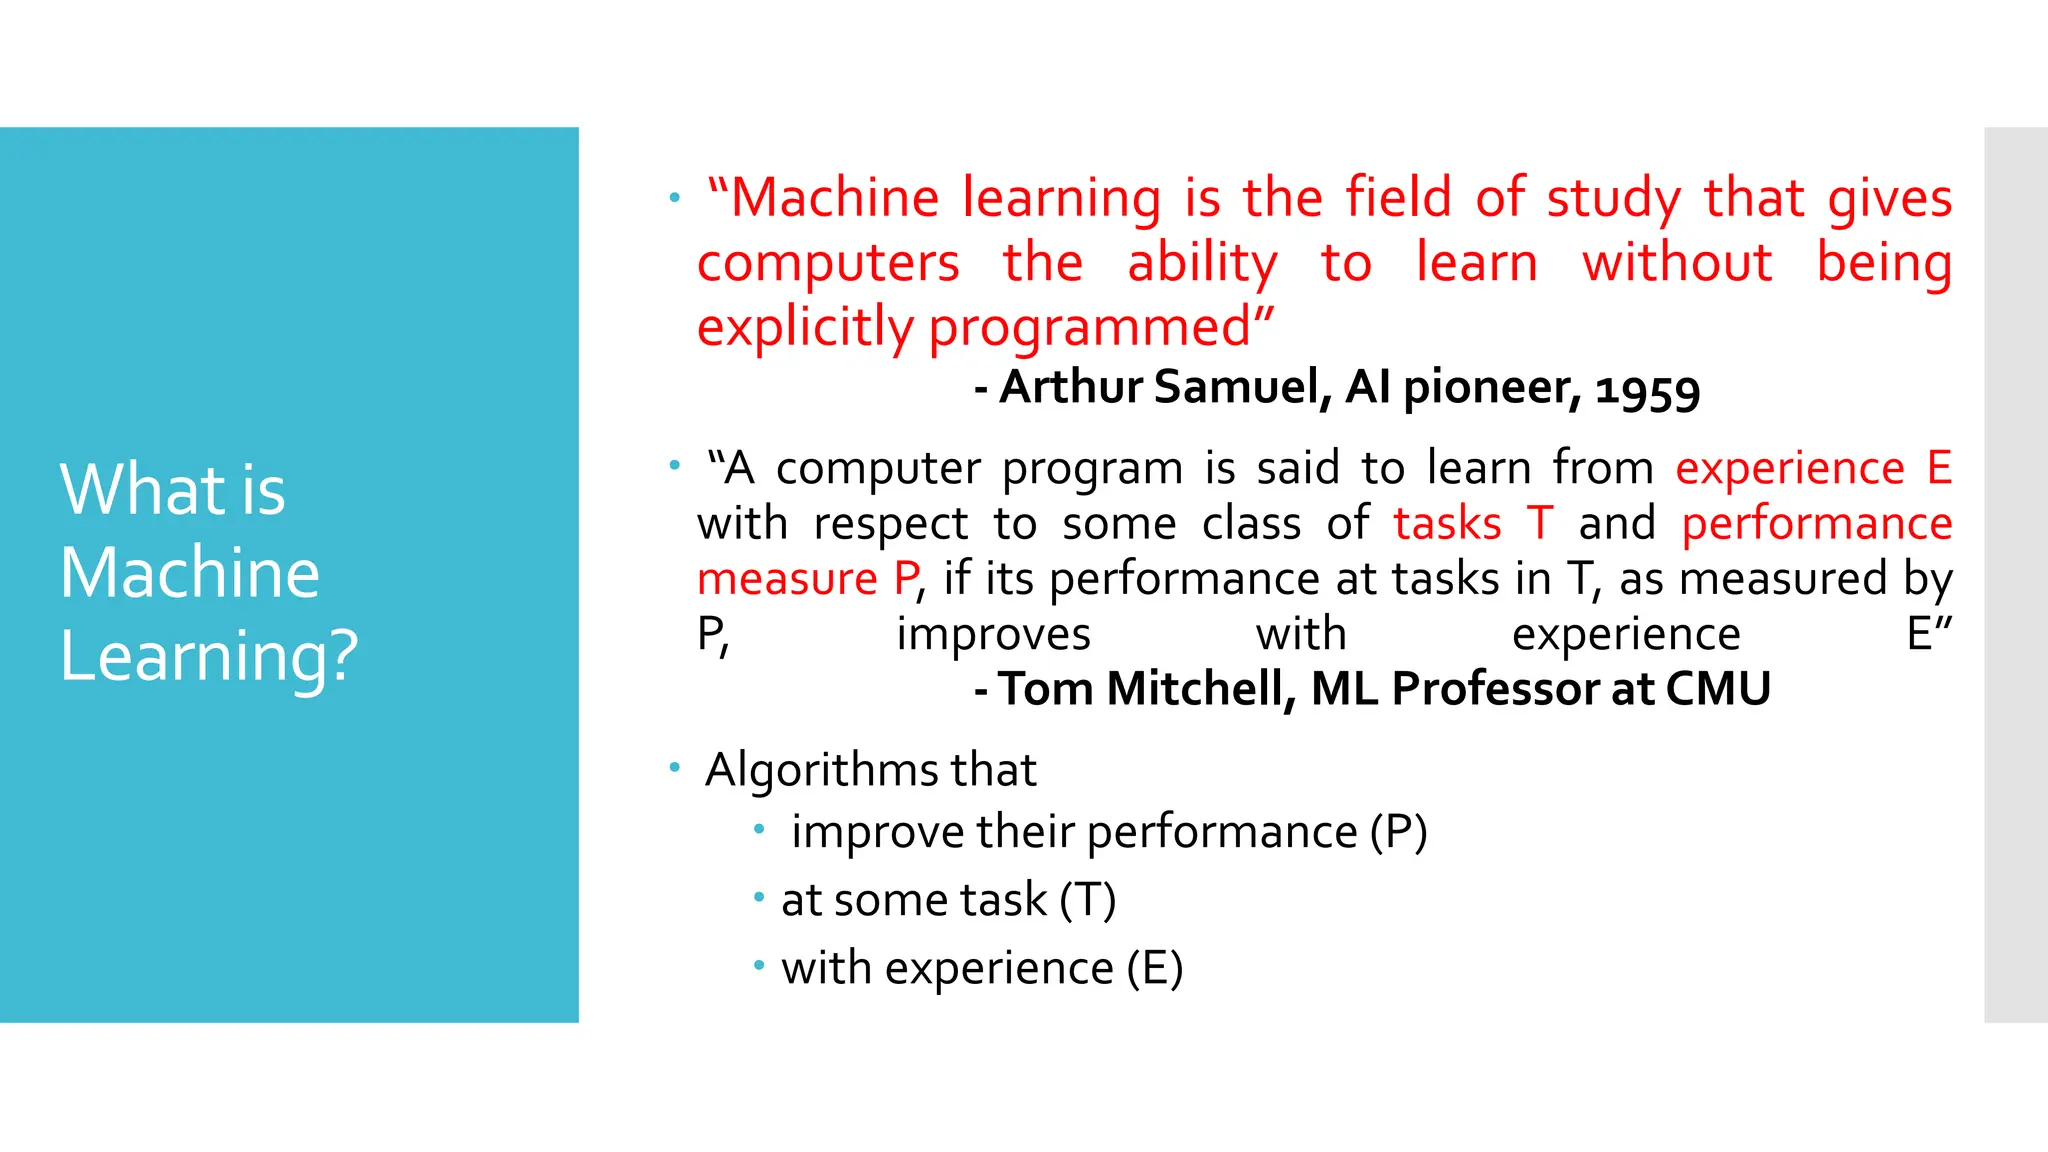
What is
Machine
Learning?
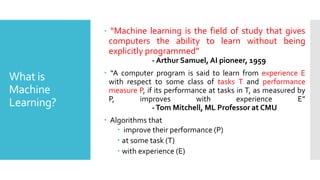
“Machinelearning is the field of study that gives
computers the ability to learn without being
explicitly programmed”
- Arthur Samuel, AI pioneer, 1959
“A computer program is said to learn from experience E
with respect to some class of tasks T and performance
measure P, if its performance at tasks in T, as measured by
P, improves with experience E”
-Tom Mitchell, ML Professor at CMU
Algorithms that
improve their performance (P)
at some task (T)
with experience (E)
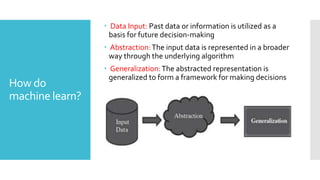
How do
machine learn?
Data Input: Past data or information is utilized as a
basis for future decision-making
Abstraction:The input data is represented in a broader
way through the underlying algorithm
Generalization:The abstracted representation is
generalized to form a framework for making decisions
15.
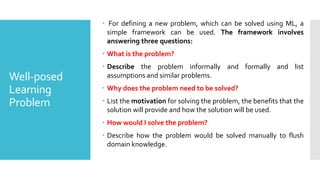
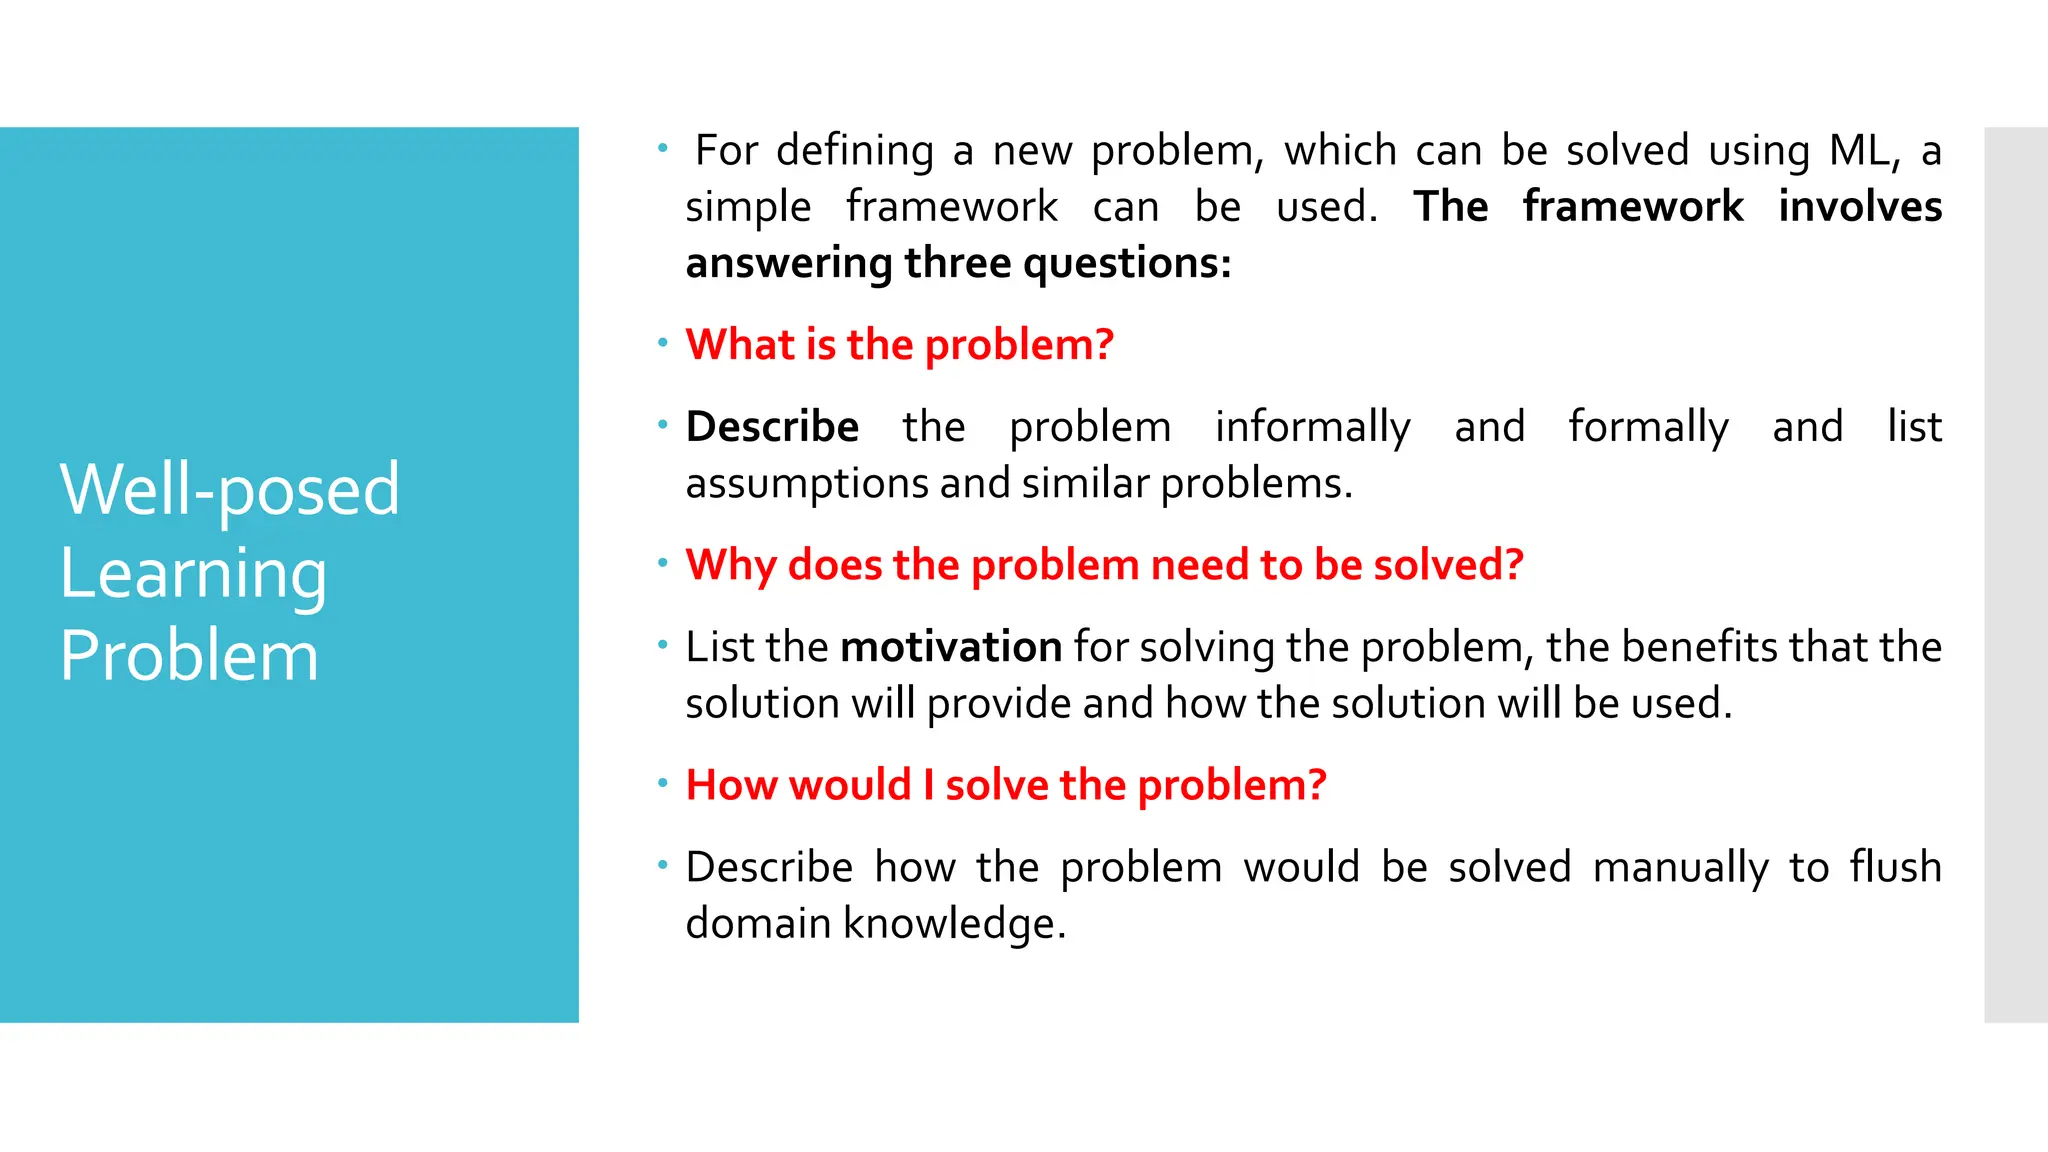
Well-posed
Learning
Problem
For defininga new problem, which can be solved using ML, a
simple framework can be used. The framework involves
answering three questions:
What is the problem?
Describe the problem informally and formally and list
assumptions and similar problems.
Why does the problem need to be solved?
List the motivation for solving the problem, the benefits that the
solution will provide and how the solution will be used.
How would I solve the problem?
Describe how the problem would be solved manually to flush
domain knowledge.
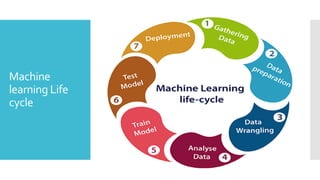
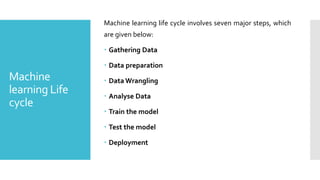
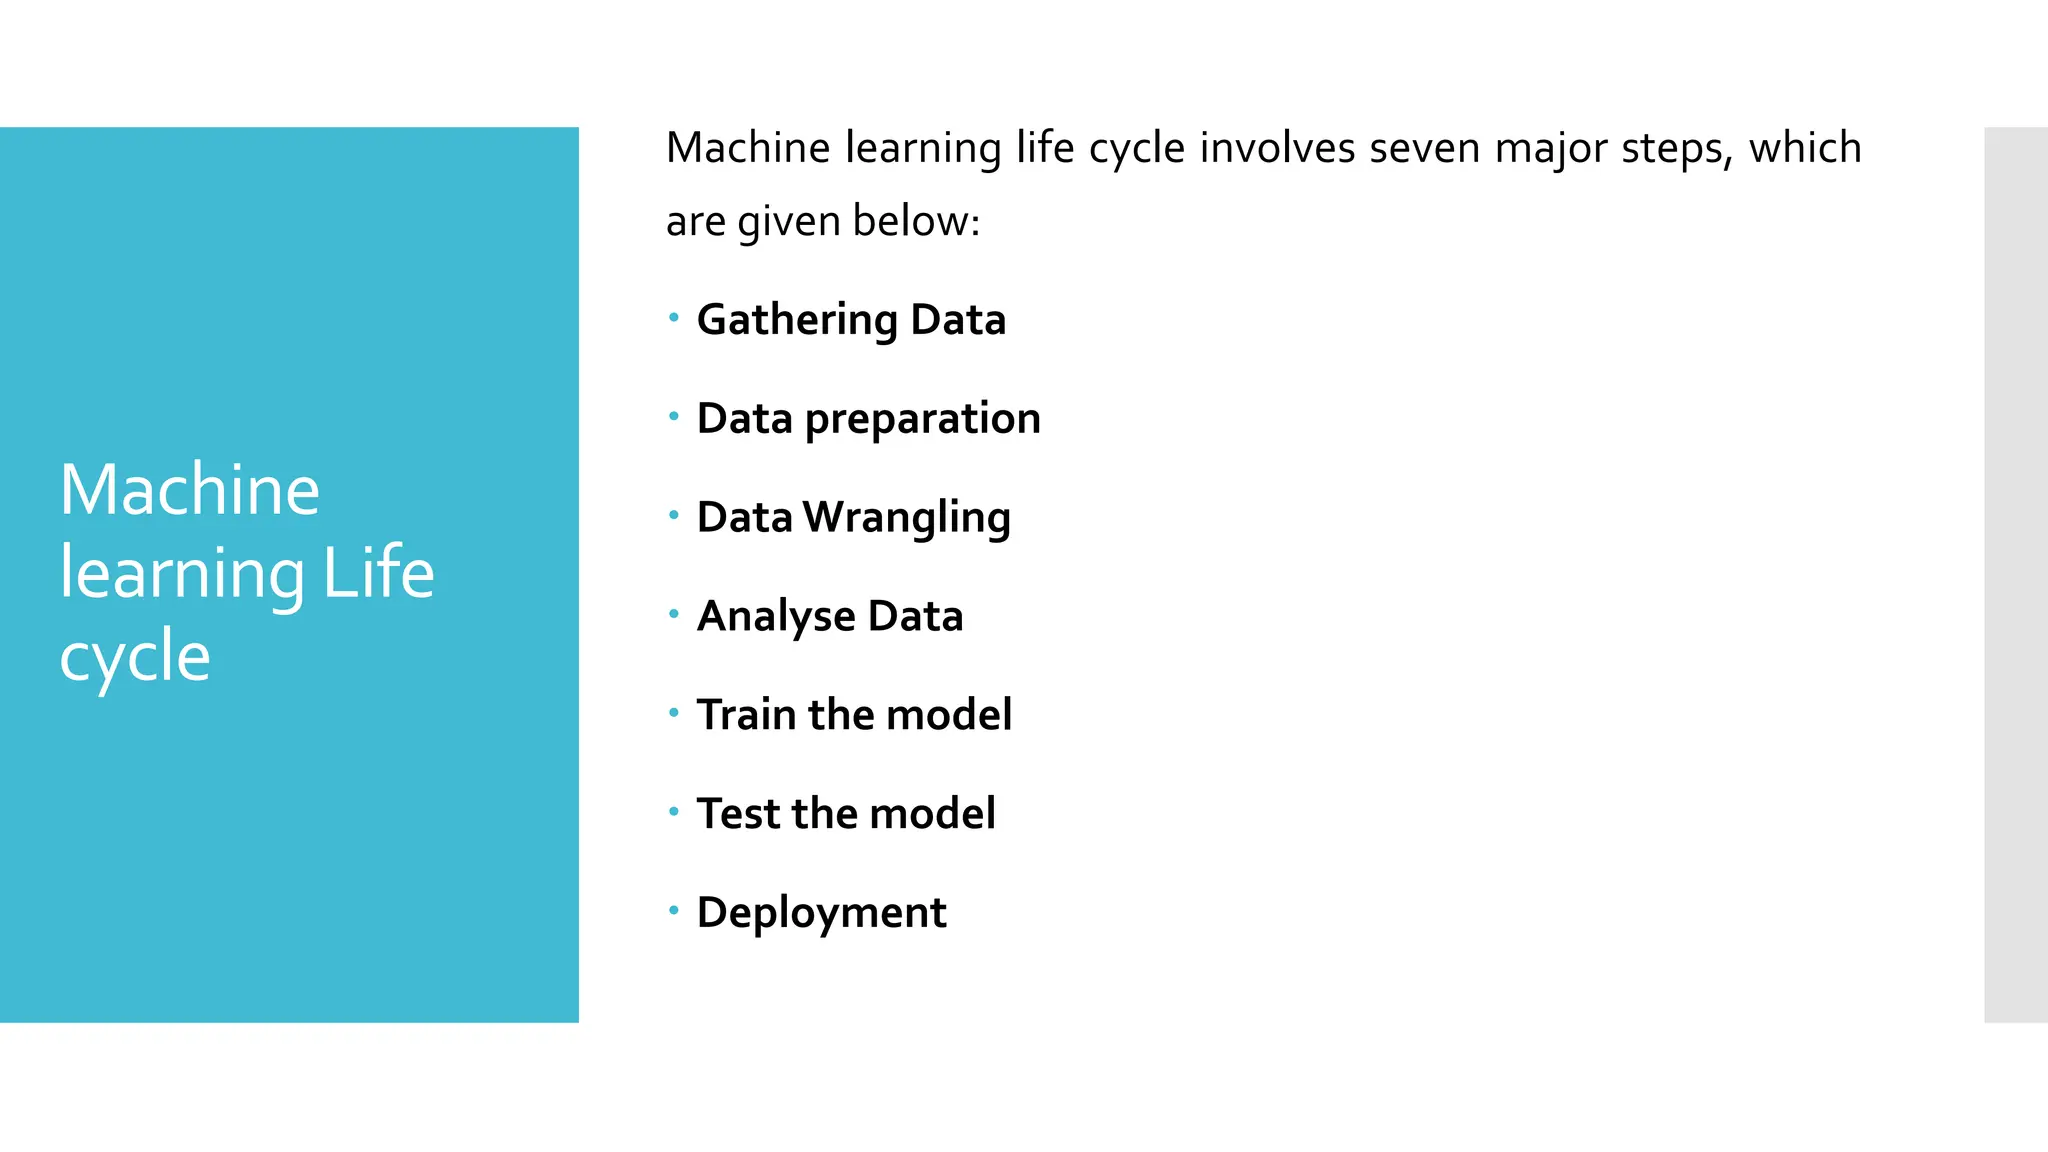
Machine
learning Life
cycle
Machine learninglife cycle involves seven major steps, which
are given below:
Gathering Data
Data preparation
Data Wrangling
Analyse Data
Train the model
Test the model
Deployment
18.
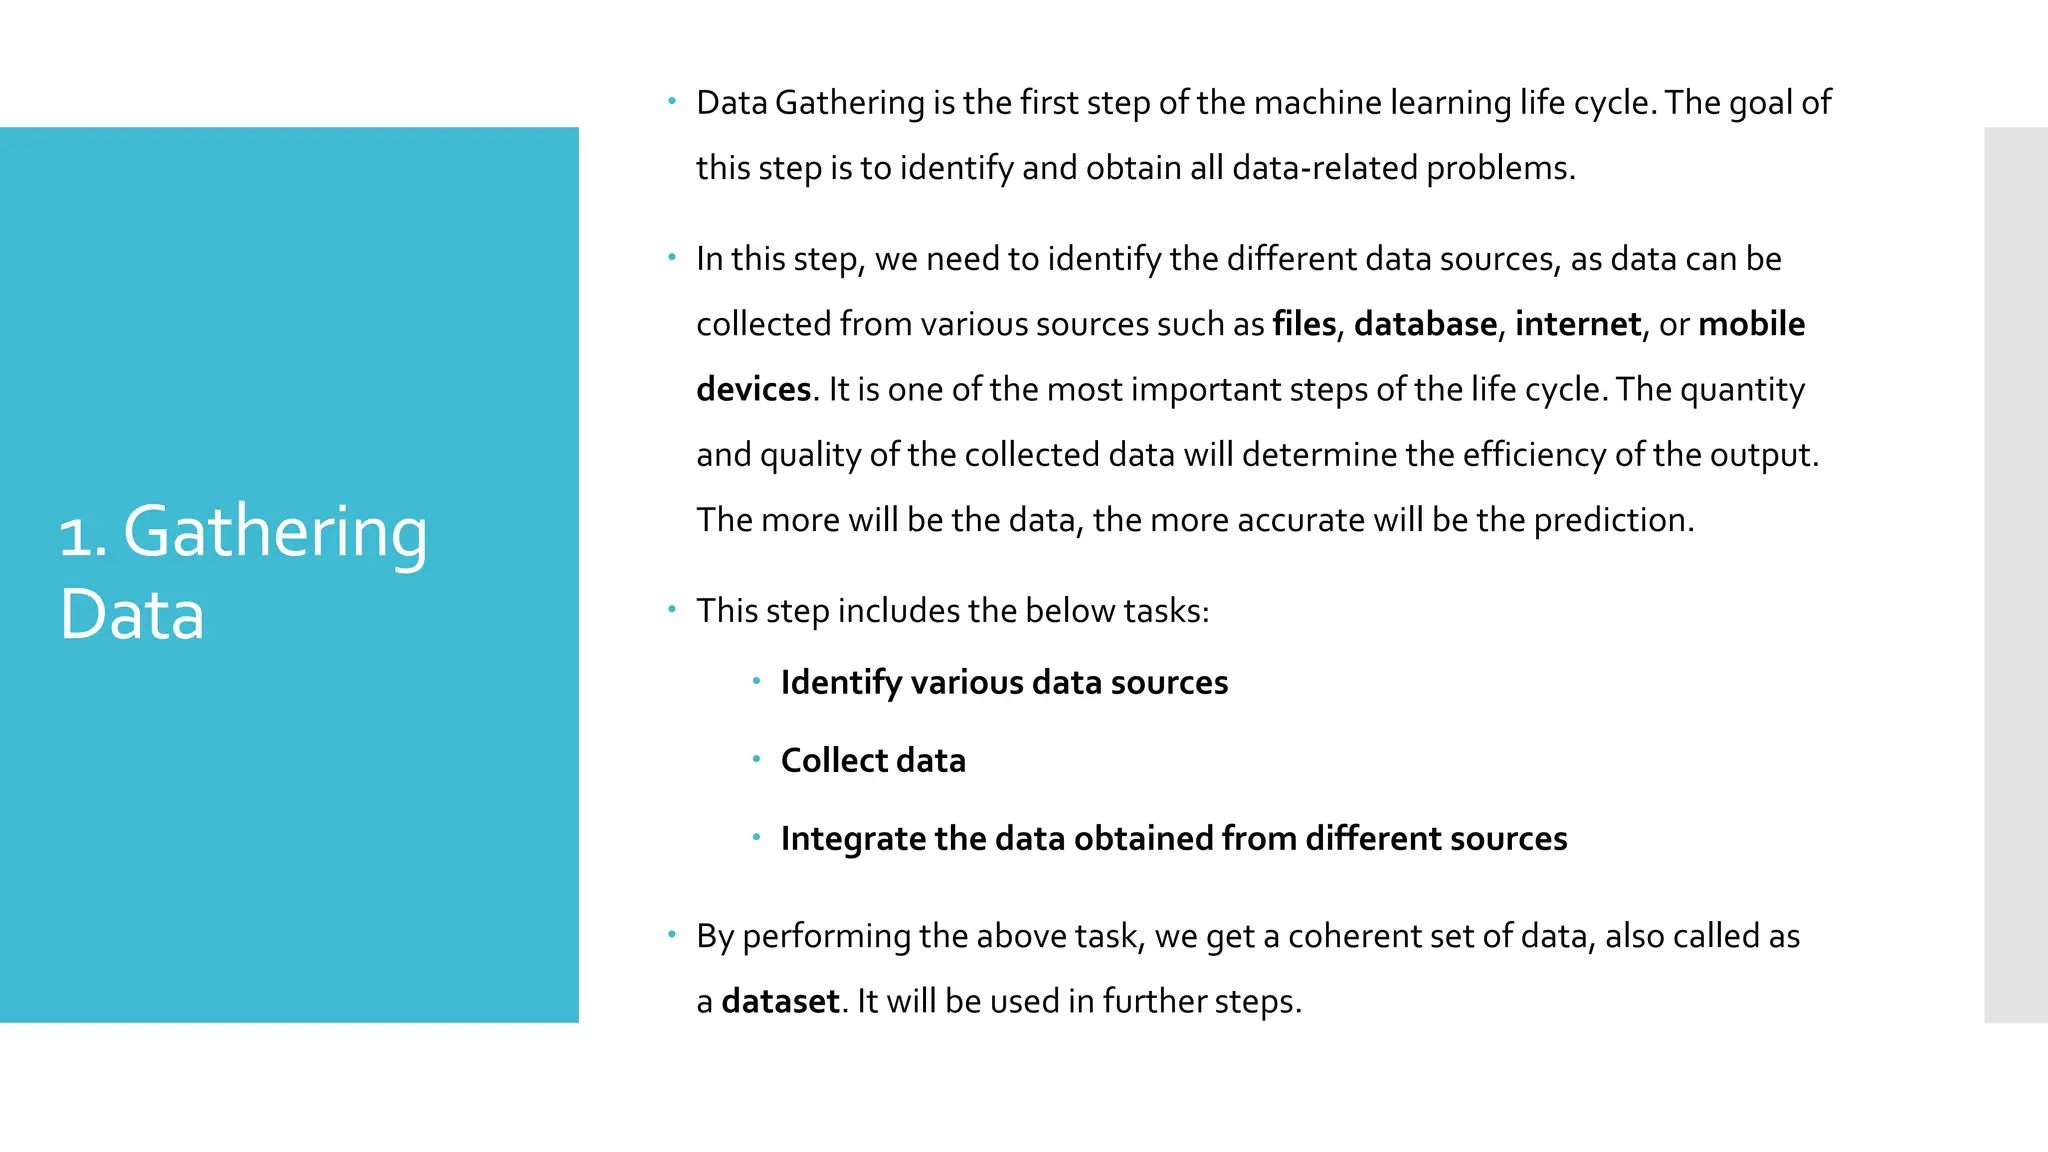
1.Gathering
Data
Data Gatheringis the first step of the machine learning life cycle.The goal of
this step is to identify and obtain all data-related problems.
In this step, we need to identify the different data sources, as data can be
collected from various sources such as files, database, internet, or mobile
devices. It is one of the most important steps of the life cycle.The quantity
and quality of the collected data will determine the efficiency of the output.
The more will be the data, the more accurate will be the prediction.
This step includes the below tasks:
Identify various data sources
Collect data
Integrate the data obtained from different sources
By performing the above task, we get a coherent set of data, also called as
a dataset. It will be used in further steps.
19.
2. Data
preparation
Aftercollecting the data, we need to prepare it for further steps.
Data preparation is a step where we put our data into a suitable
place and prepare it to use in our machine learning training.
In this step, first, we put all data together, and then randomize the
ordering of data.
Data exploration: It is used to understand the nature of data that
we have to work with. We need to understand the characteristics,
format, and quality of data.
A better understanding of data leads to an effective outcome. In
this, we find Correlations, general trends, and outliers.
20.
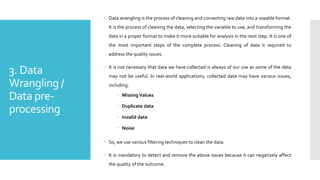
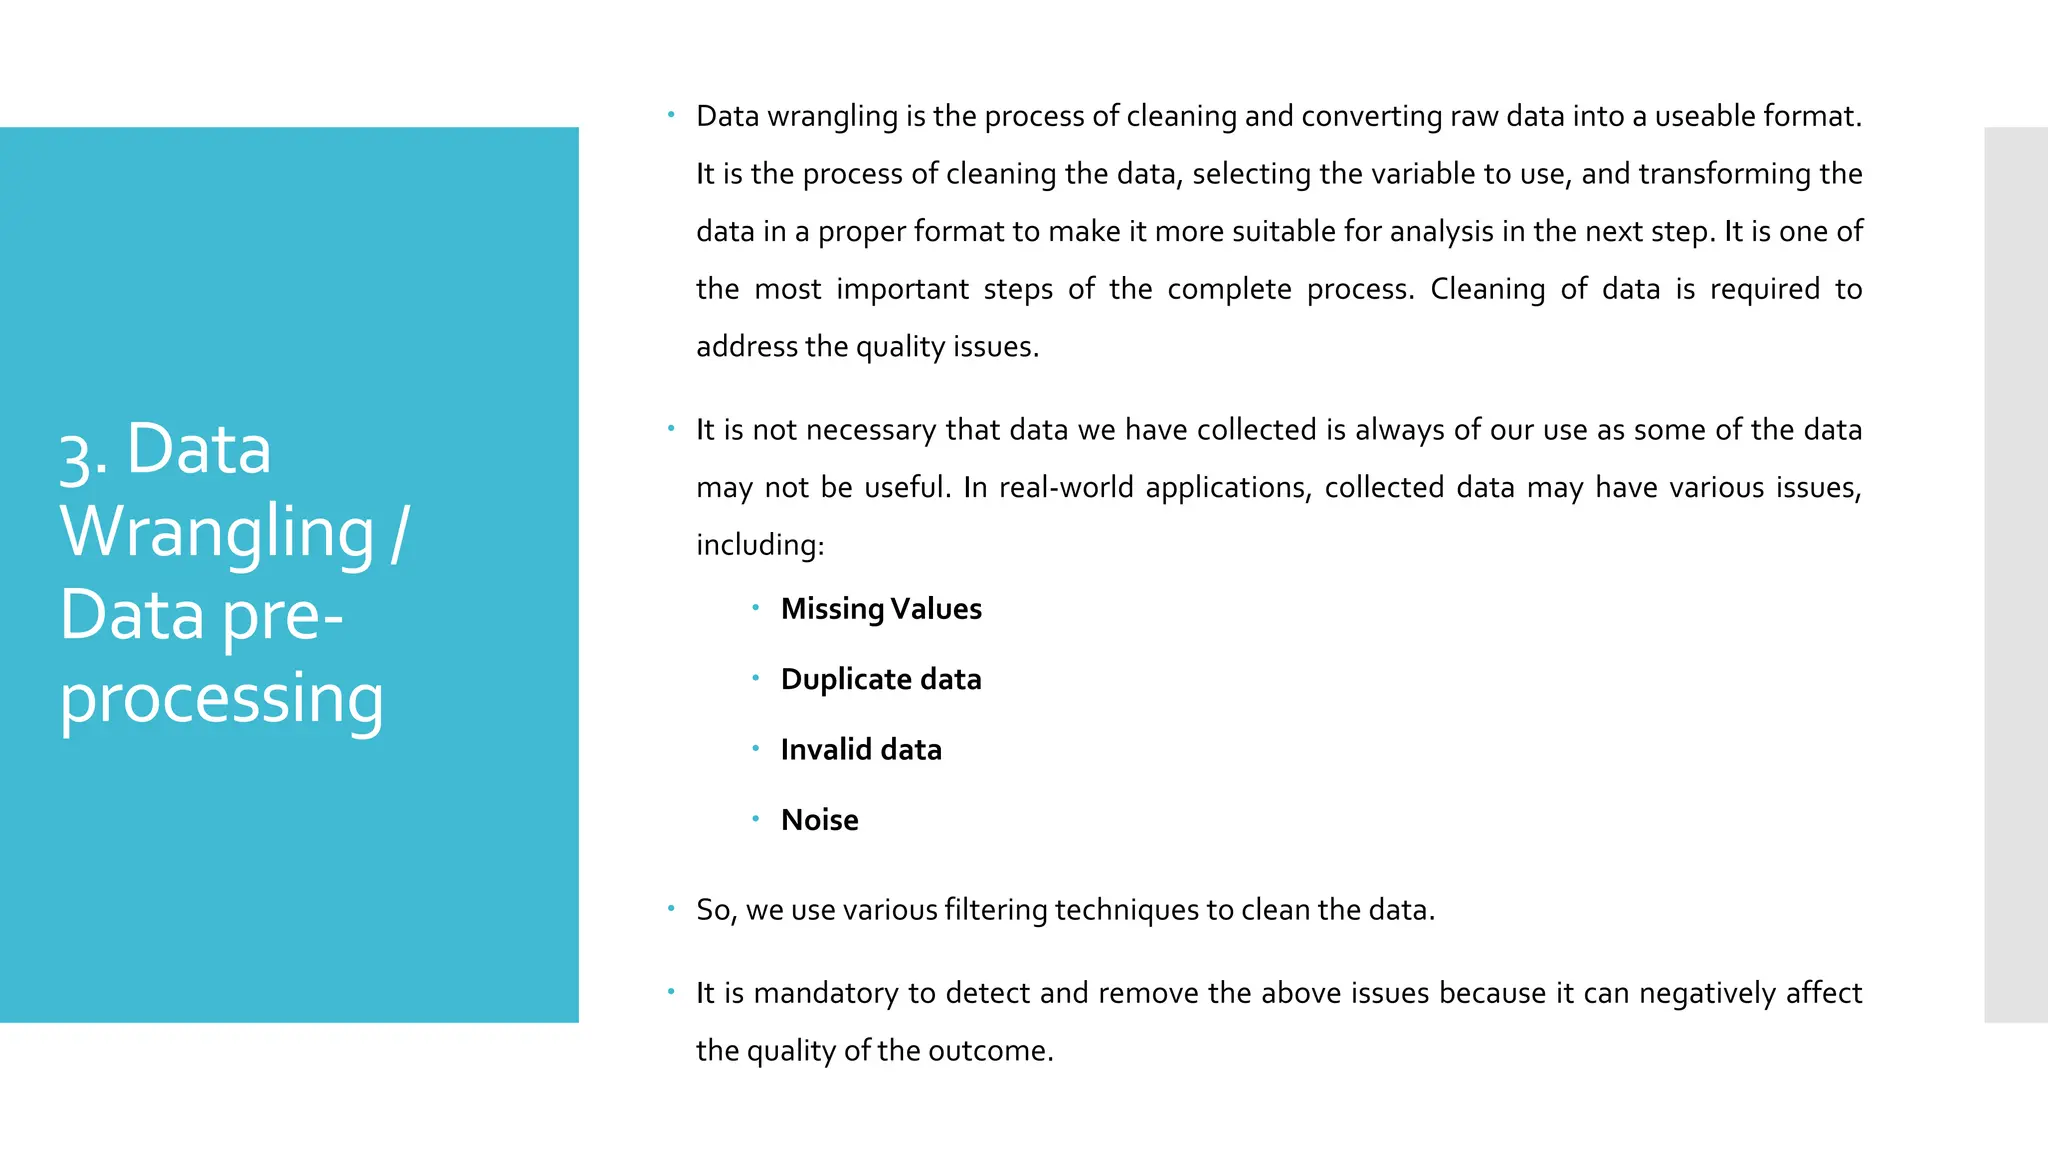
3. Data
Wrangling /
Datapre-
processing
Data wrangling is the process of cleaning and converting raw data into a useable format.
It is the process of cleaning the data, selecting the variable to use, and transforming the
data in a proper format to make it more suitable for analysis in the next step. It is one of
the most important steps of the complete process. Cleaning of data is required to
address the quality issues.
It is not necessary that data we have collected is always of our use as some of the data
may not be useful. In real-world applications, collected data may have various issues,
including:
Missing Values
Duplicate data
Invalid data
Noise
So, we use various filtering techniques to clean the data.
It is mandatory to detect and remove the above issues because it can negatively affect
the quality of the outcome.
21.
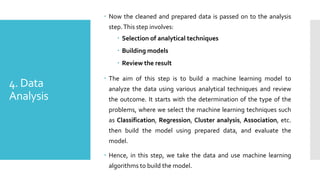
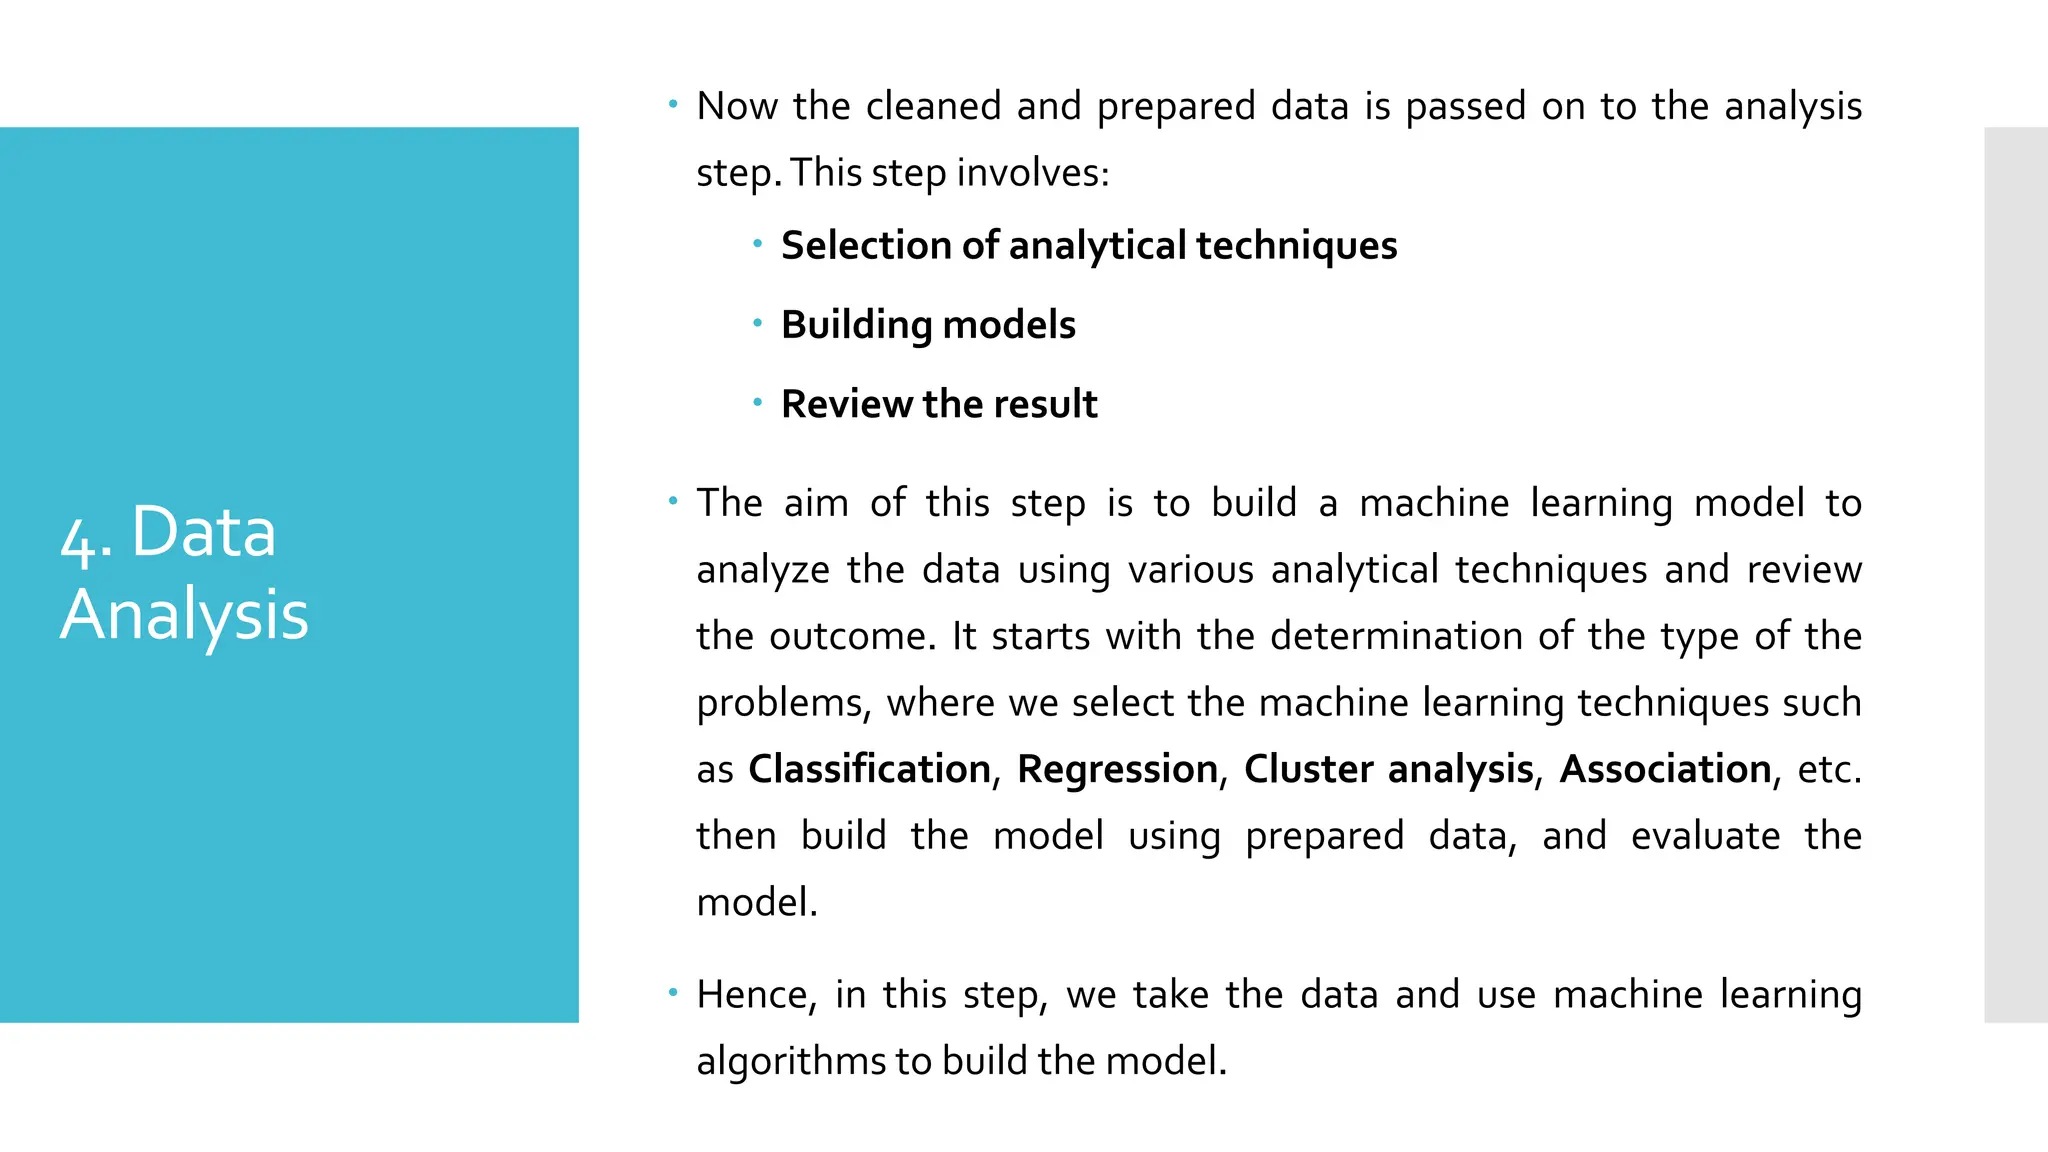
4. Data
Analysis
Nowthe cleaned and prepared data is passed on to the analysis
step.This step involves:
Selection of analytical techniques
Building models
Review the result
The aim of this step is to build a machine learning model to
analyze the data using various analytical techniques and review
the outcome. It starts with the determination of the type of the
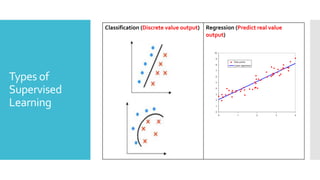
problems, where we select the machine learning techniques such
as Classification, Regression, Cluster analysis, Association, etc.
then build the model using prepared data, and evaluate the
model.
Hence, in this step, we take the data and use machine learning
algorithms to build the model.
22.
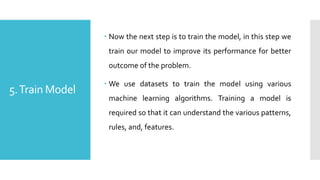
5.Train Model
Nowthe next step is to train the model, in this step we
train our model to improve its performance for better
outcome of the problem.
We use datasets to train the model using various
machine learning algorithms. Training a model is
required so that it can understand the various patterns,
rules, and, features.
23.
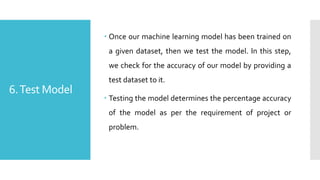
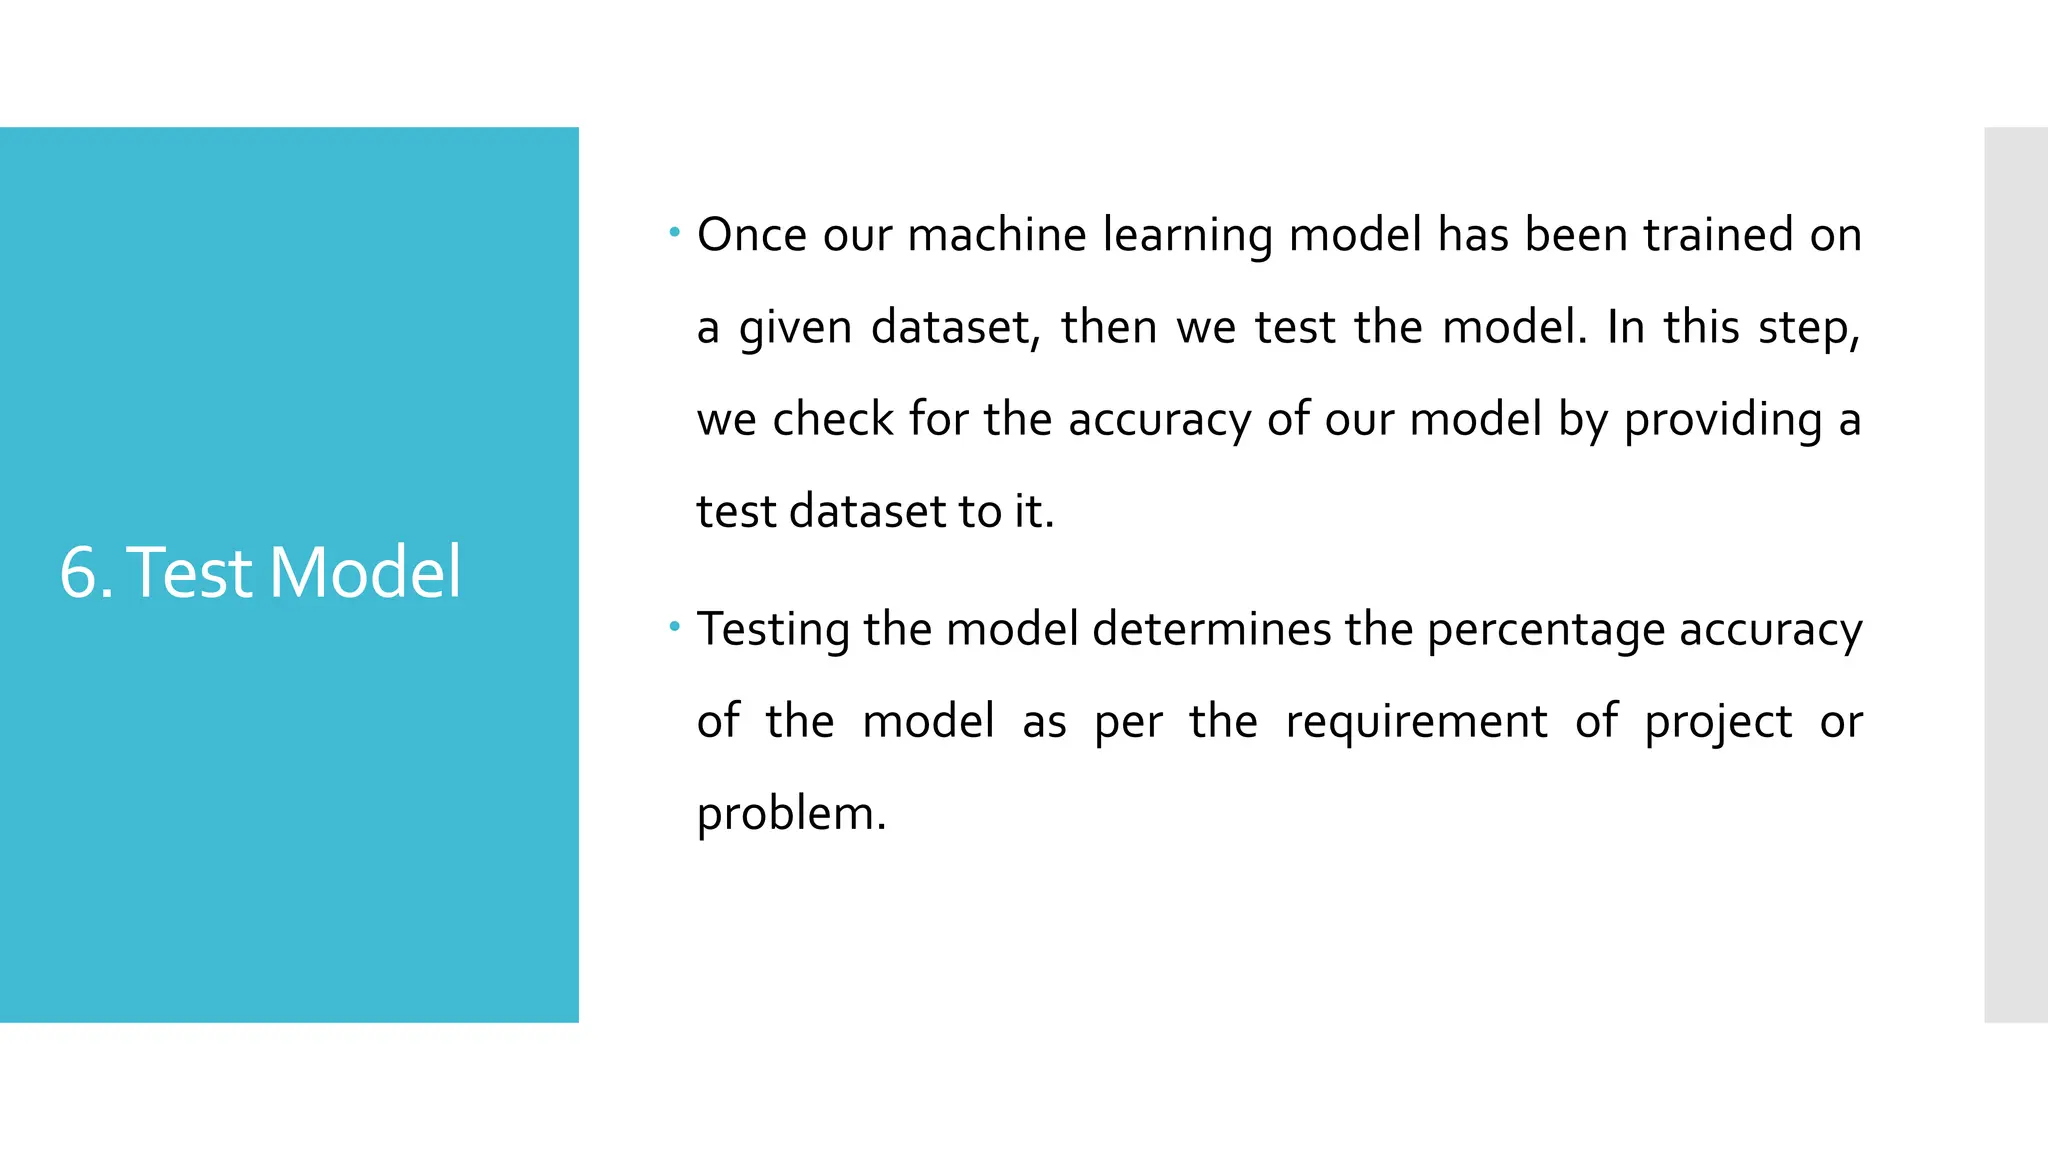
6.Test Model
Onceour machine learning model has been trained on
a given dataset, then we test the model. In this step,
we check for the accuracy of our model by providing a
test dataset to it.
Testing the model determines the percentage accuracy
of the model as per the requirement of project or
problem.
24.
7. Deployment
Thelast step of machine learning life cycle is
deployment, where we deploy the model in the real-
world system.
If the above-prepared model is producing an accurate
result as per our requirement with acceptable speed,
then we deploy the model in the real system. But
before deploying the project, we will check whether it
is improving its performance using available data or
not. The deployment phase is similar to making the
final report for a project
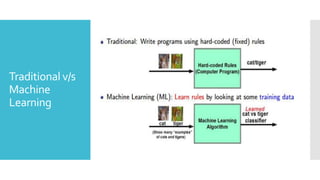
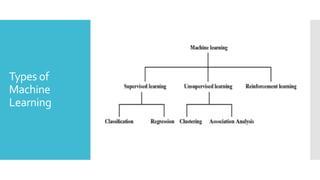
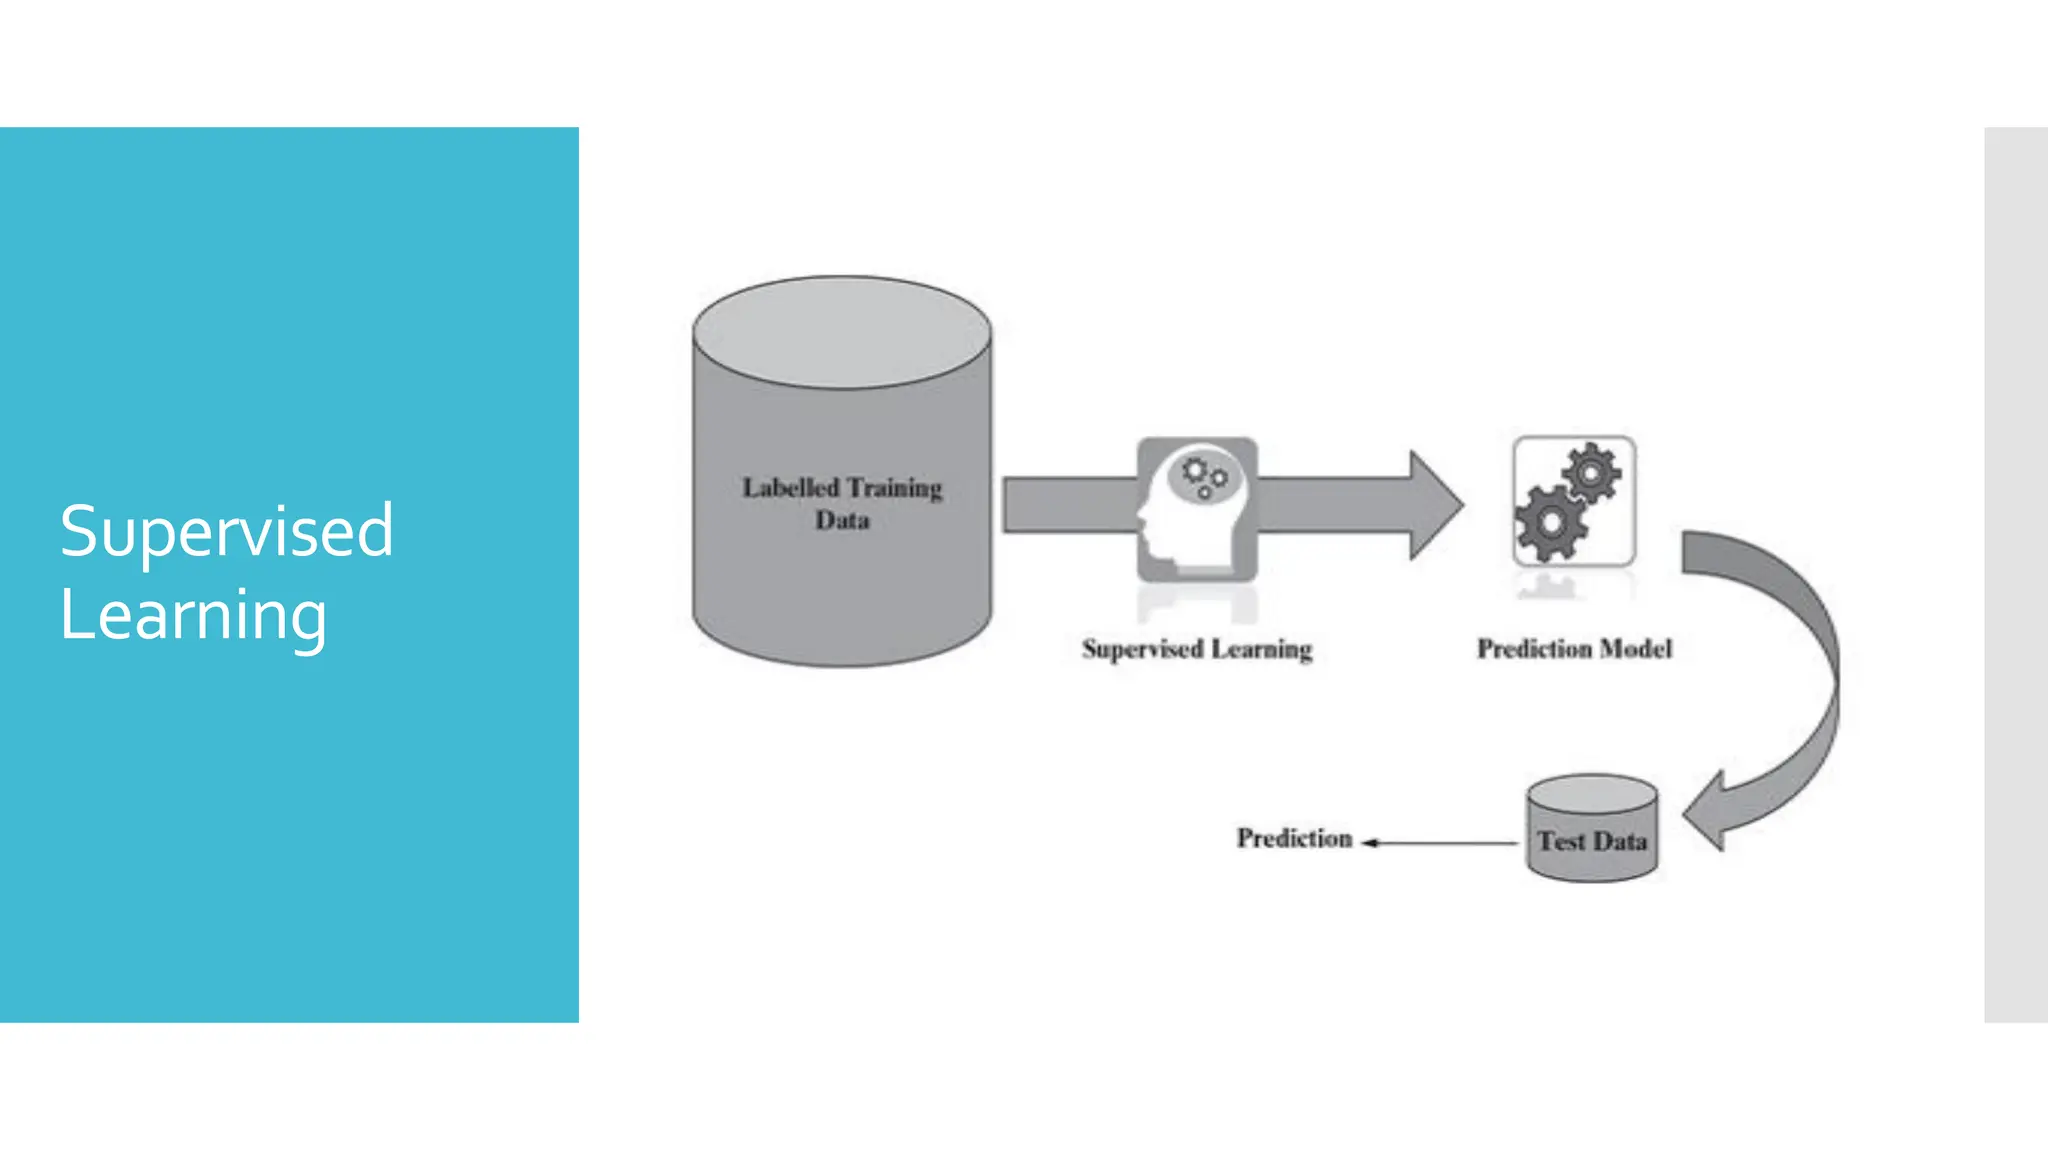
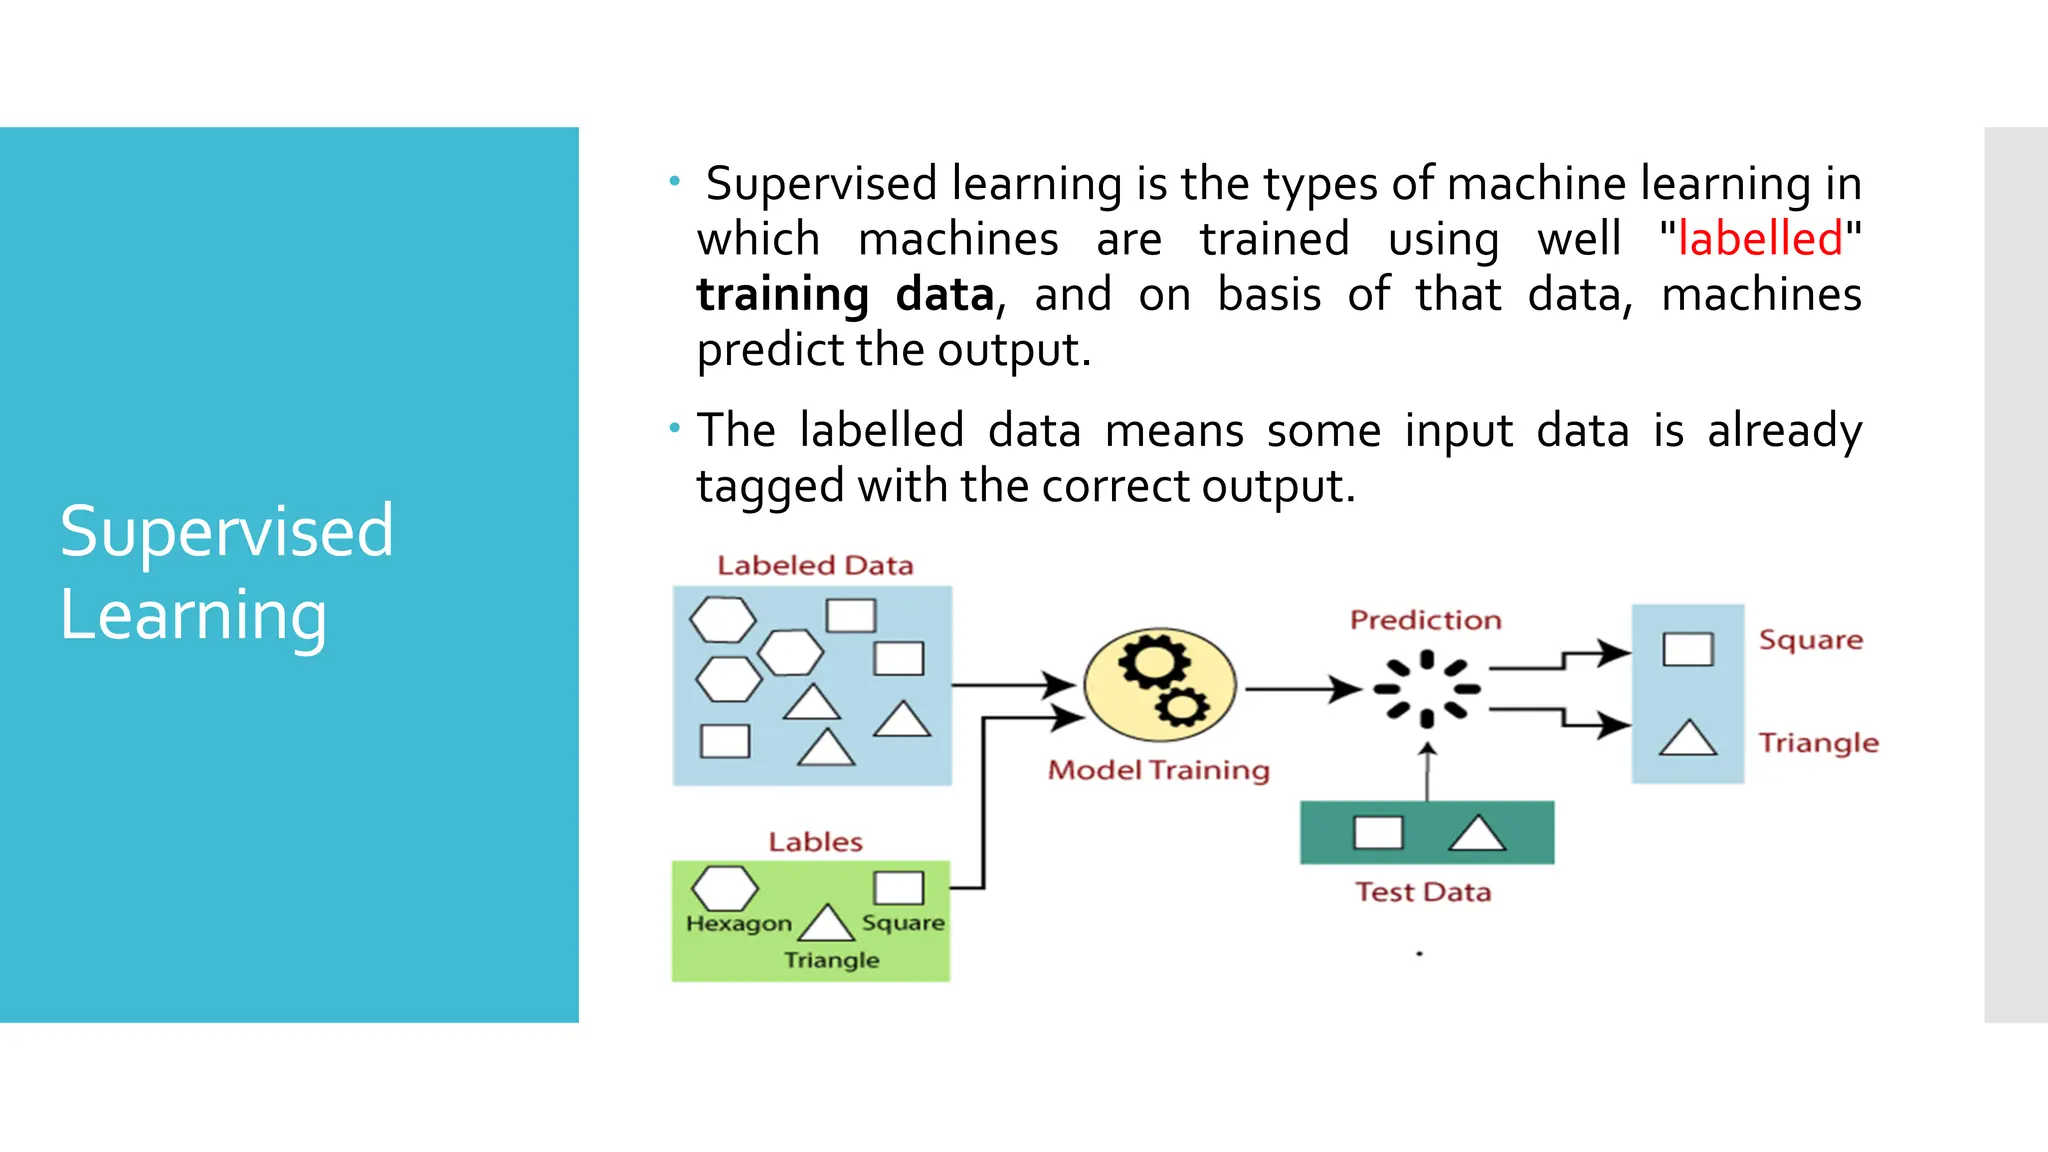
Supervised
Learning
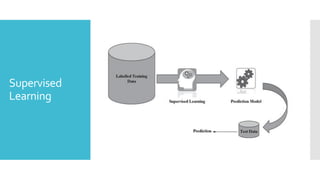
Supervised learningis the types of machine learning in
which machines are trained using well "labelled"
training data, and on basis of that data, machines
predict the output.
The labelled data means some input data is already
tagged with the correct output.
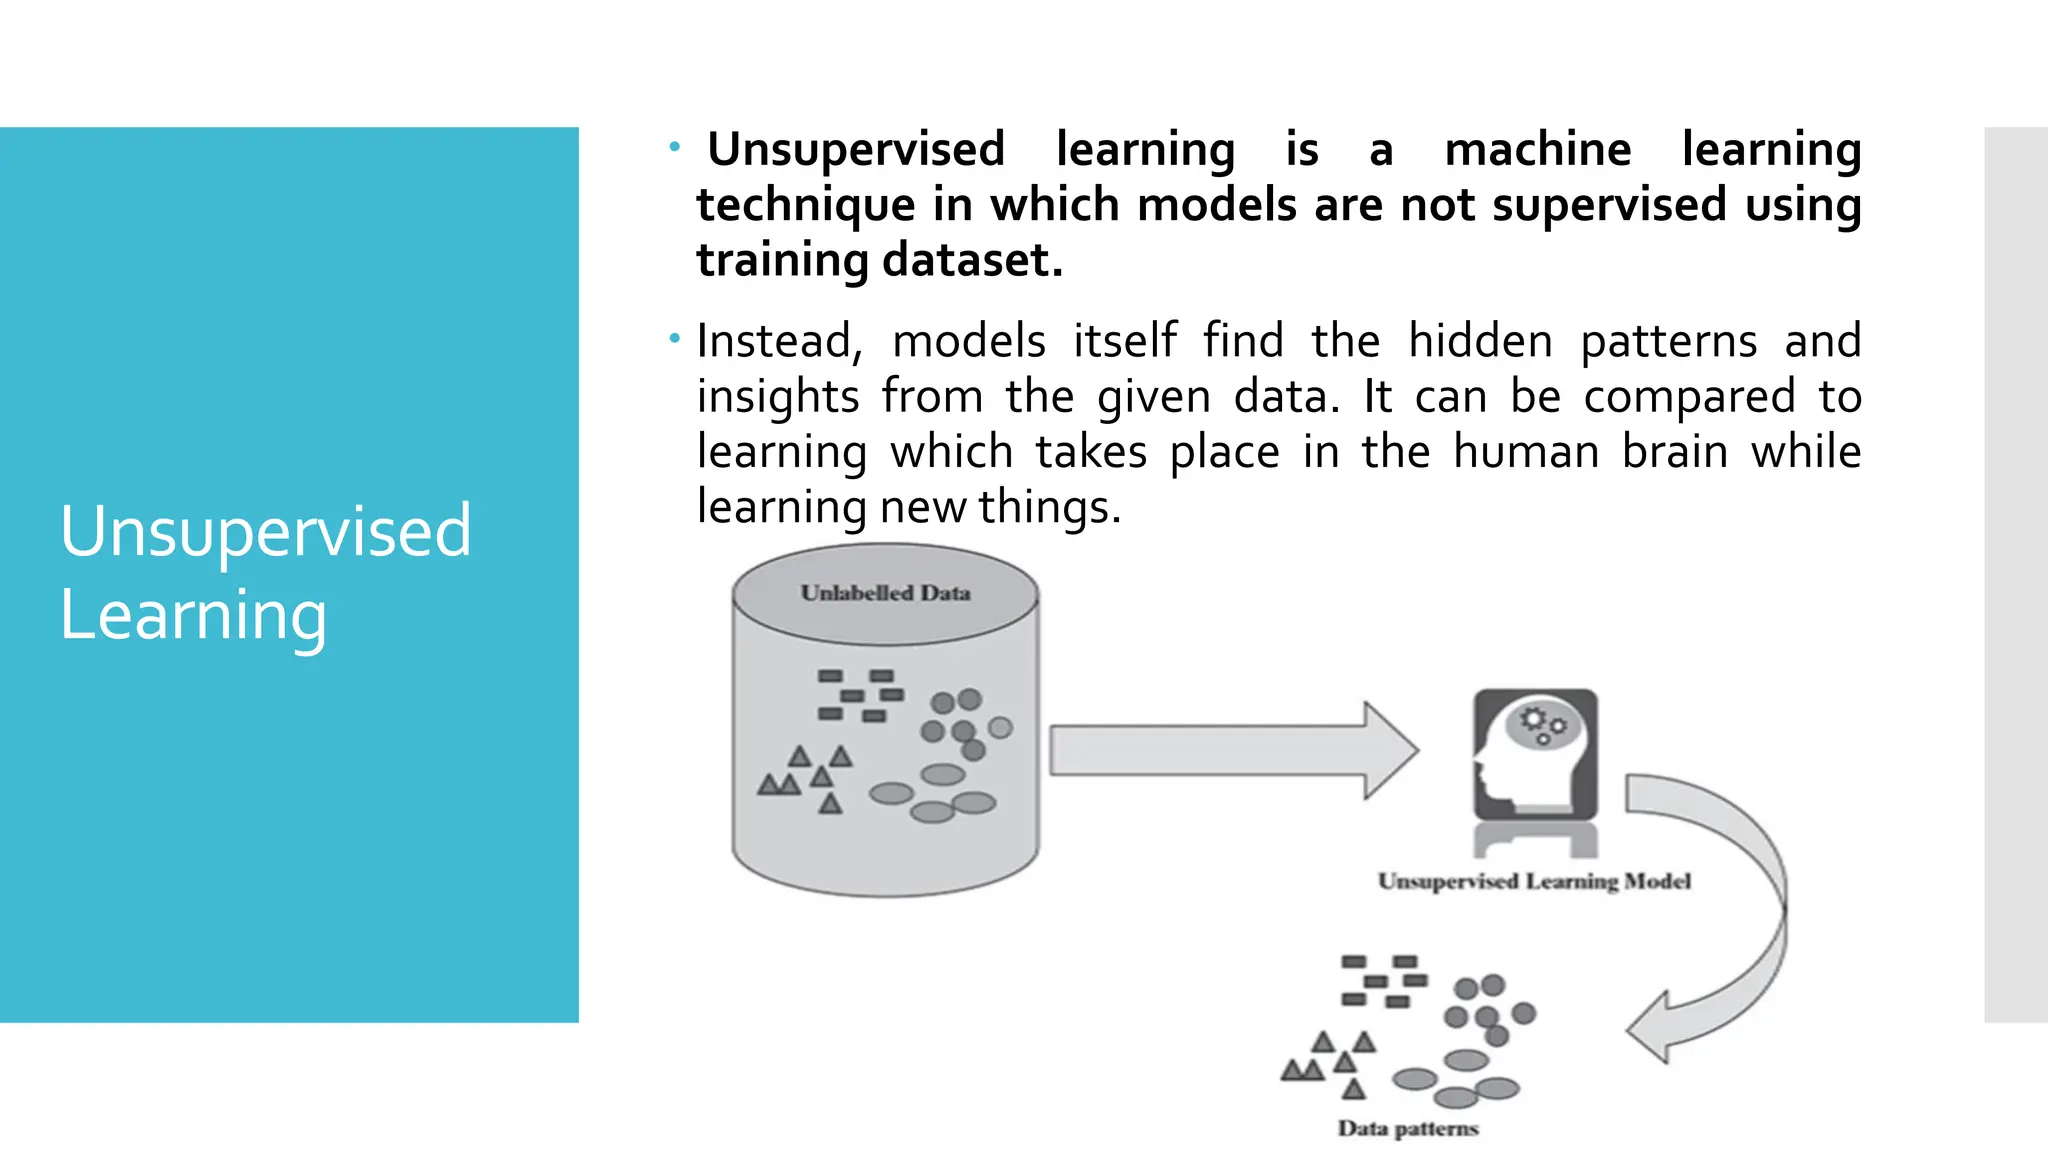
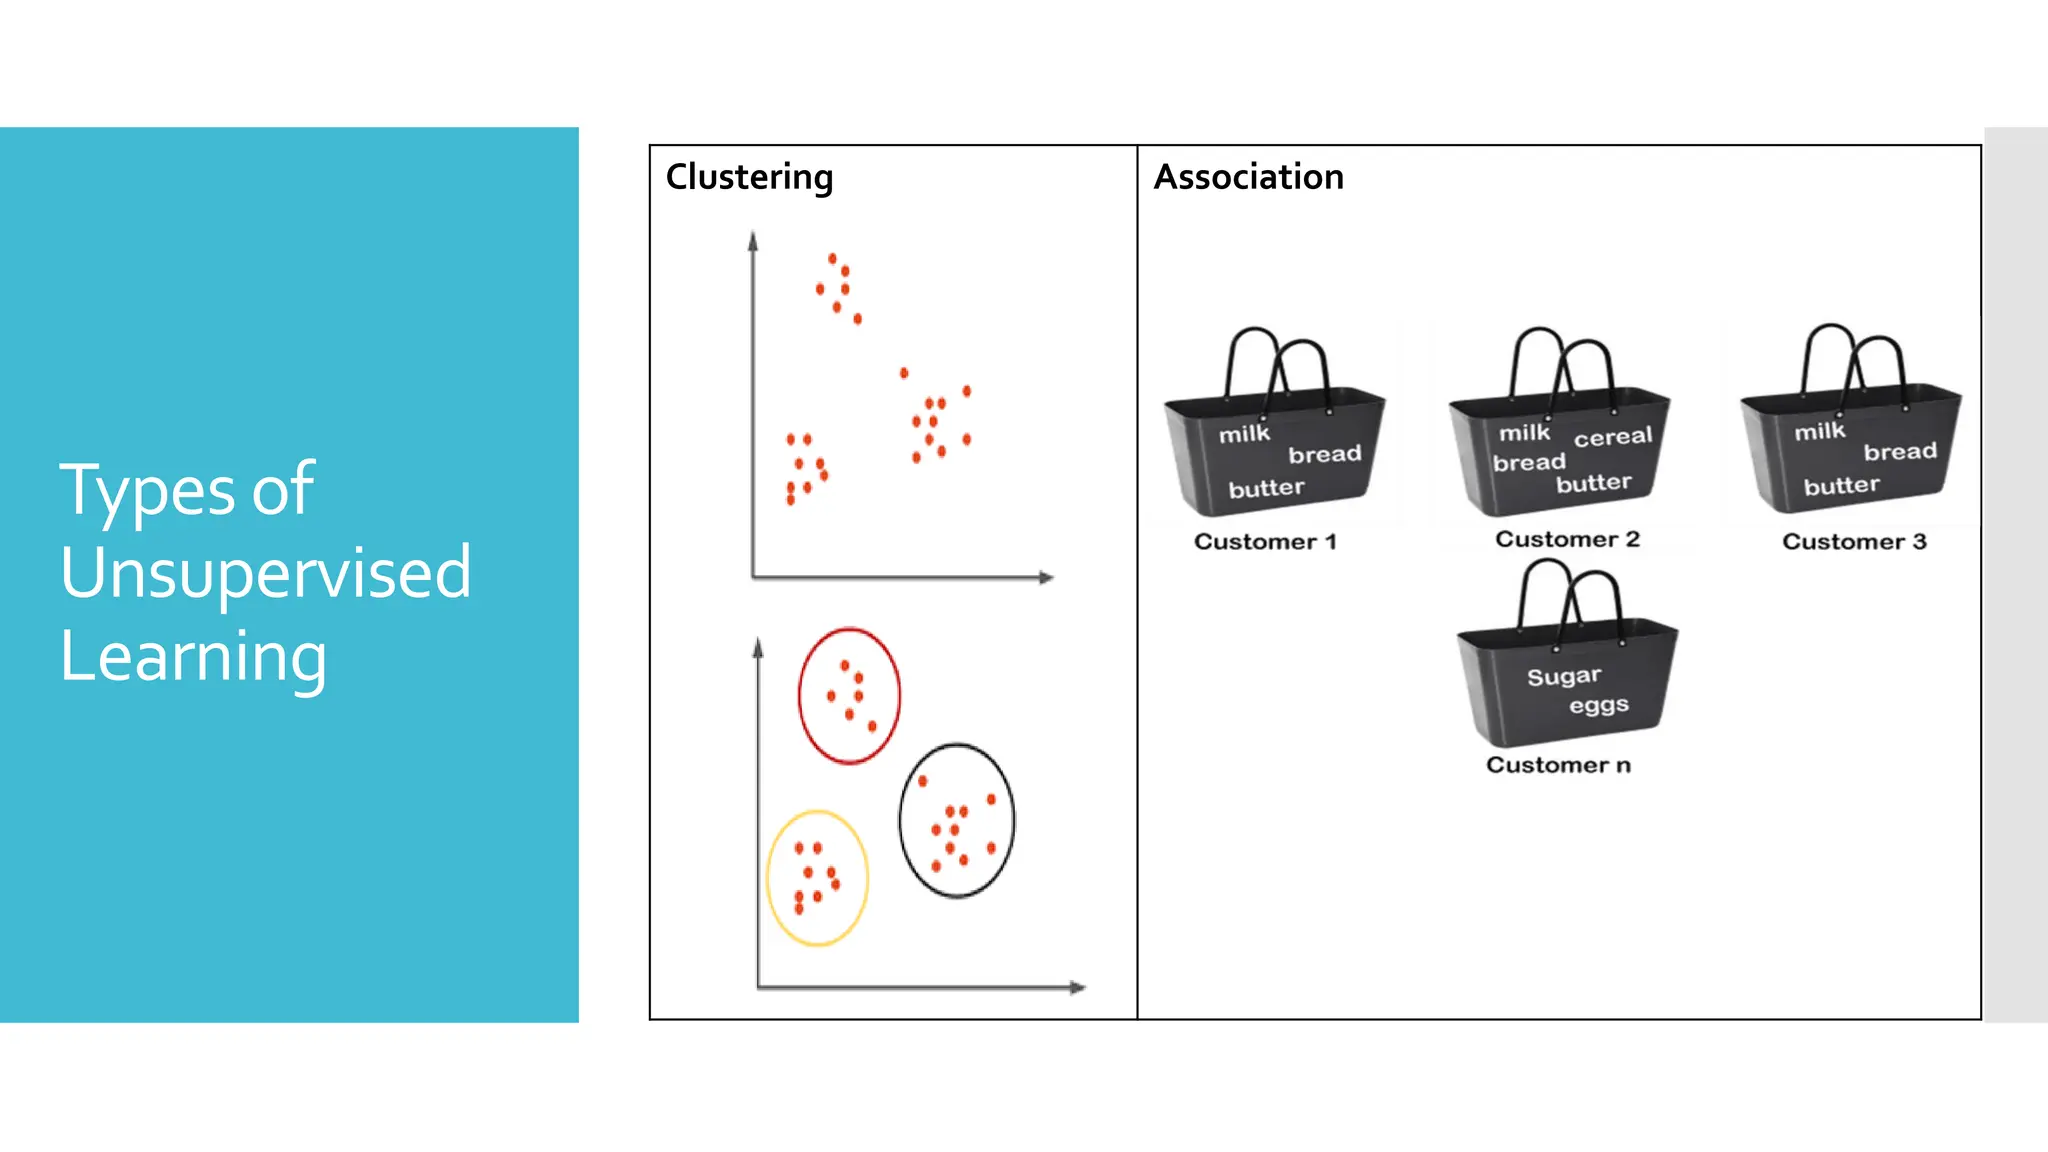
Unsupervised
Learning
Unsupervised learningis a machine learning
technique in which models are not supervised using
training dataset.
Instead, models itself find the hidden patterns and
insights from the given data. It can be compared to
learning which takes place in the human brain while
learning new things.
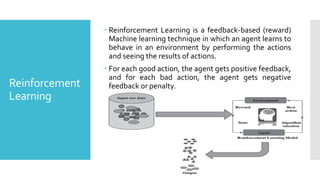
Reinforcement
Learning
Reinforcement Learningis a feedback-based (reward)
Machine learning technique in which an agent learns to
behave in an environment by performing the actions
and seeing the results of actions.
For each good action, the agent gets positive feedback,
and for each bad action, the agent gets negative
feedback or penalty.
32.
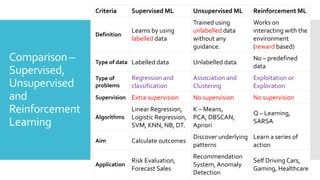
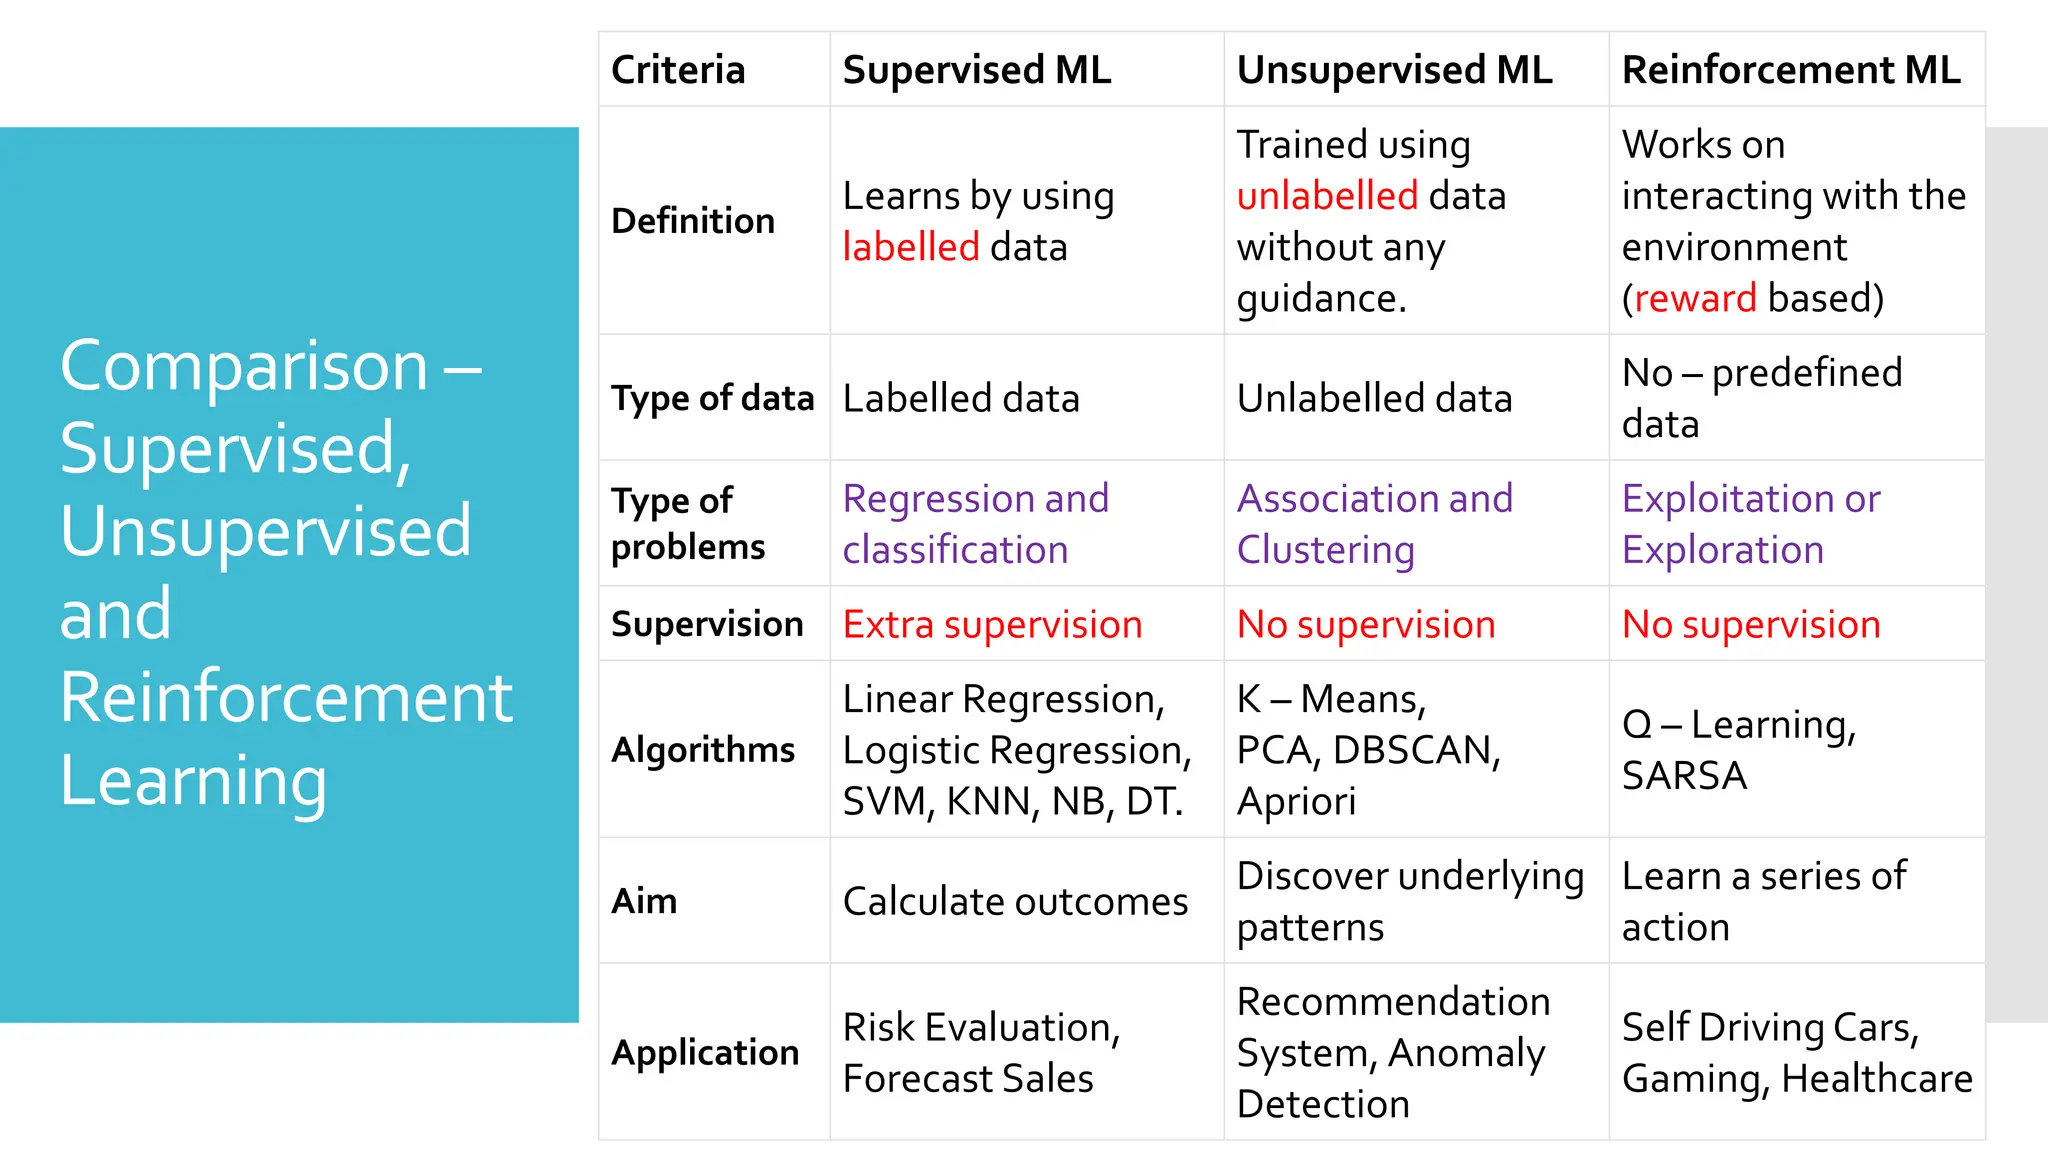
Comparison –
Supervised,
Unsupervised
and
Reinforcement
Learning
Criteria SupervisedML Unsupervised ML Reinforcement ML
Definition
Learns by using
labelled data
Trained using
unlabelled data
without any
guidance.
Works on
interacting with the
environment
(reward based)
Type of data Labelled data Unlabelled data
No – predefined
data
Type of
problems
Regression and
classification
Association and
Clustering
Exploitation or
Exploration
Supervision Extra supervision No supervision No supervision
Algorithms
Linear Regression,
Logistic Regression,
SVM, KNN, NB, DT.
K – Means,
PCA, DBSCAN,
Apriori
Q – Learning,
SARSA
Aim Calculate outcomes
Discover underlying
patterns
Learn a series of
action
Application
Risk Evaluation,
Forecast Sales
Recommendation
System, Anomaly
Detection
Self Driving Cars,
Gaming, Healthcare
33.
Did you know?
Many video games are based on artificial intelligence
technique called Expert System. This technique can
imitate areas of human behavior, with a goal to mimic the
human ability of senses, perception, and reasoning.
34.
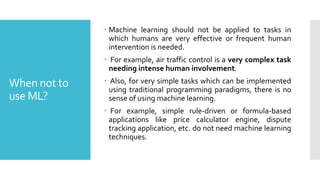
When not to
useML?
Machine learning should not be applied to tasks in
which humans are very effective or frequent human
intervention is needed.
For example, air traffic control is a very complex task
needing intense human involvement.
Also, for very simple tasks which can be implemented
using traditional programming paradigms, there is no
sense of using machine learning.
For example, simple rule-driven or formula-based
applications like price calculator engine, dispute
tracking application, etc. do not need machine learning
techniques.
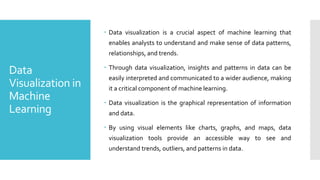
Data
Visualization in
Machine
Learning
Datavisualization is a crucial aspect of machine learning that
enables analysts to understand and make sense of data patterns,
relationships, and trends.
Through data visualization, insights and patterns in data can be
easily interpreted and communicated to a wider audience, making
it a critical component of machine learning.
Data visualization is the graphical representation of information
and data.
By using visual elements like charts, graphs, and maps, data
visualization tools provide an accessible way to see and
understand trends, outliers, and patterns in data.
38.
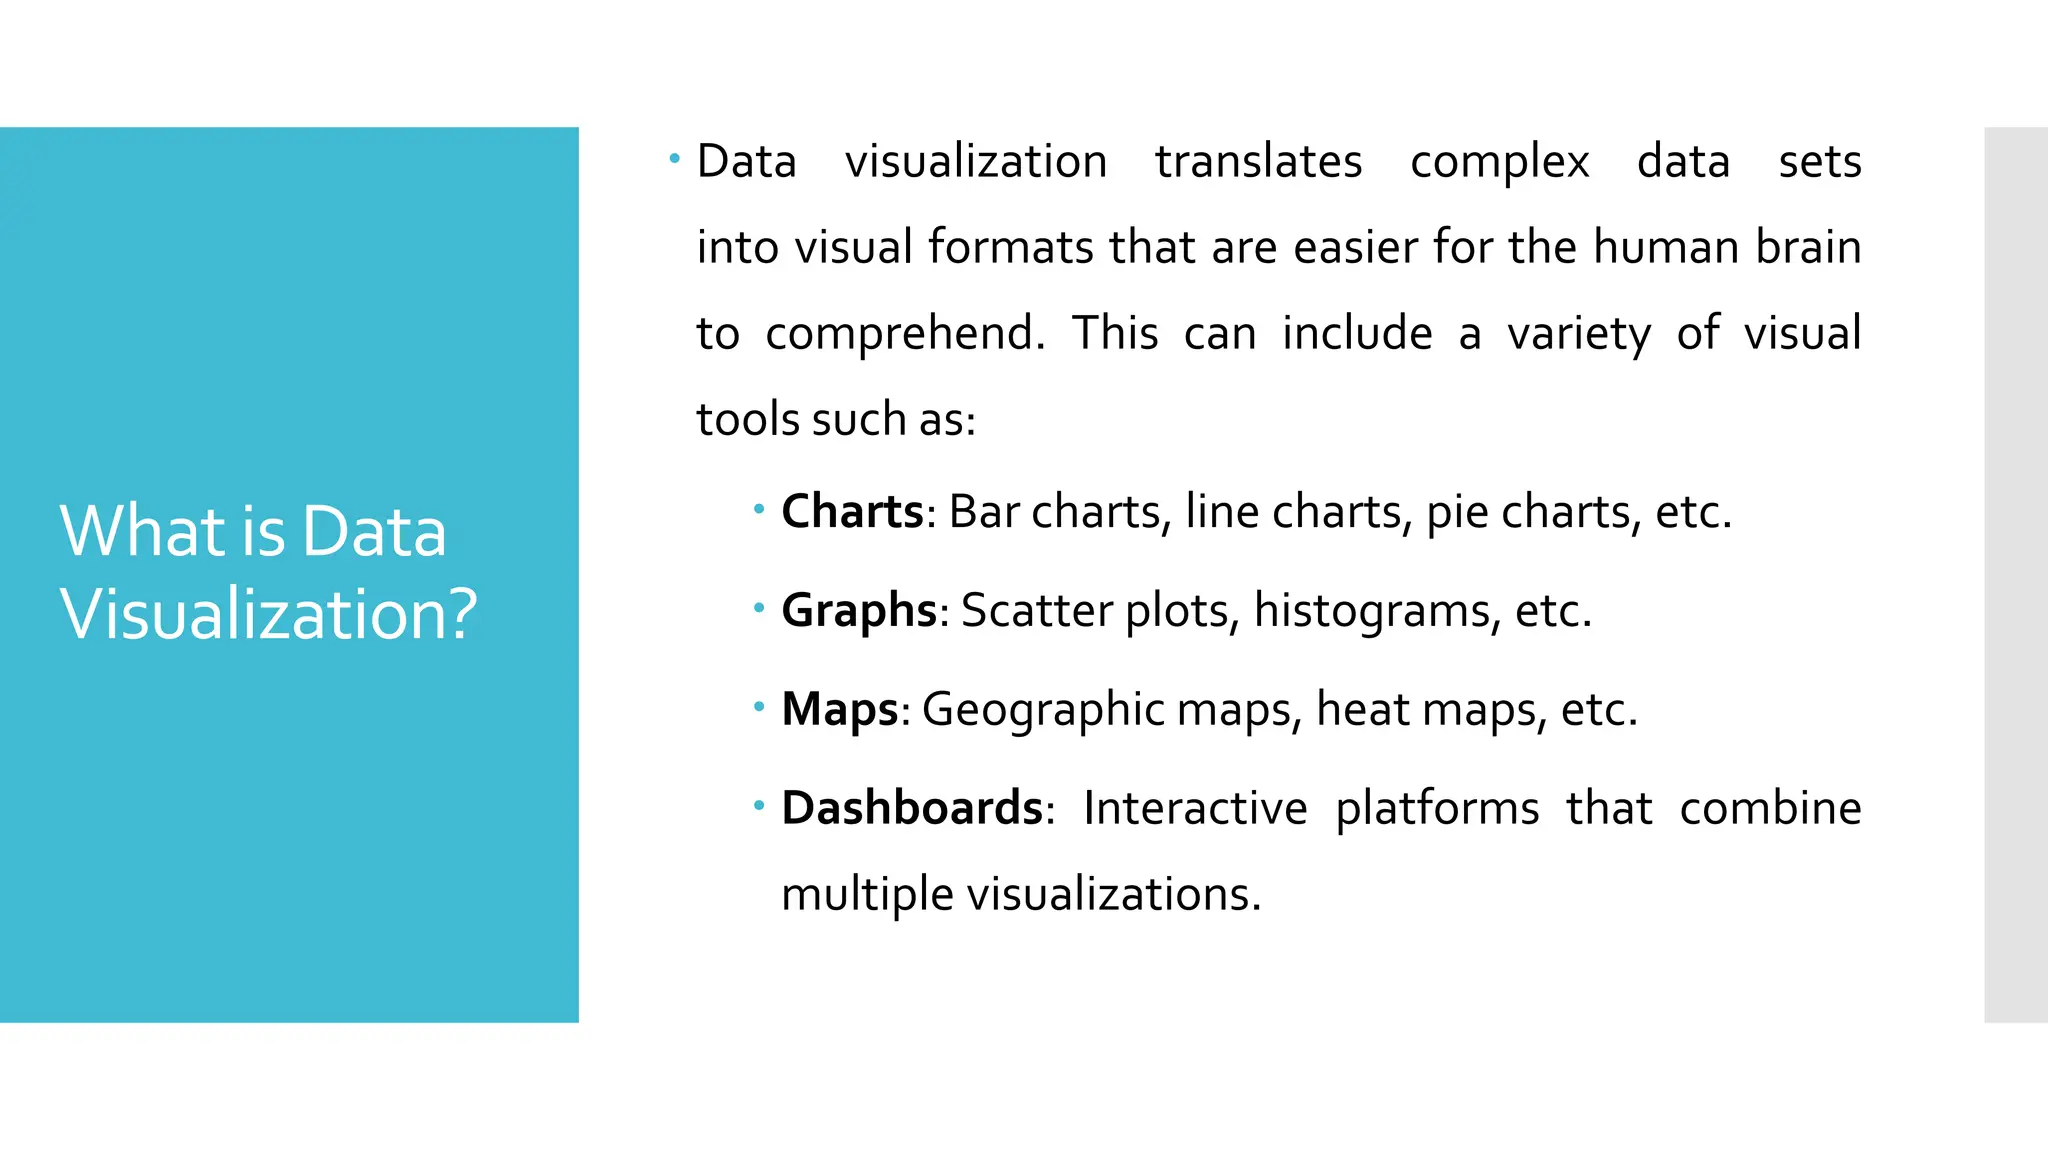
What is Data
Visualization?
Data visualization translates complex data sets
into visual formats that are easier for the human brain
to comprehend. This can include a variety of visual
tools such as:
Charts: Bar charts, line charts, pie charts, etc.
Graphs: Scatter plots, histograms, etc.
Maps: Geographic maps, heat maps, etc.
Dashboards: Interactive platforms that combine
multiple visualizations.
39.
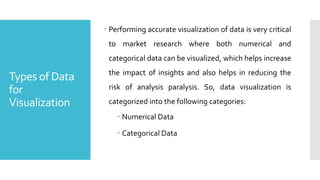
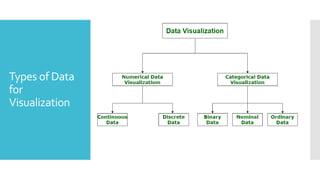
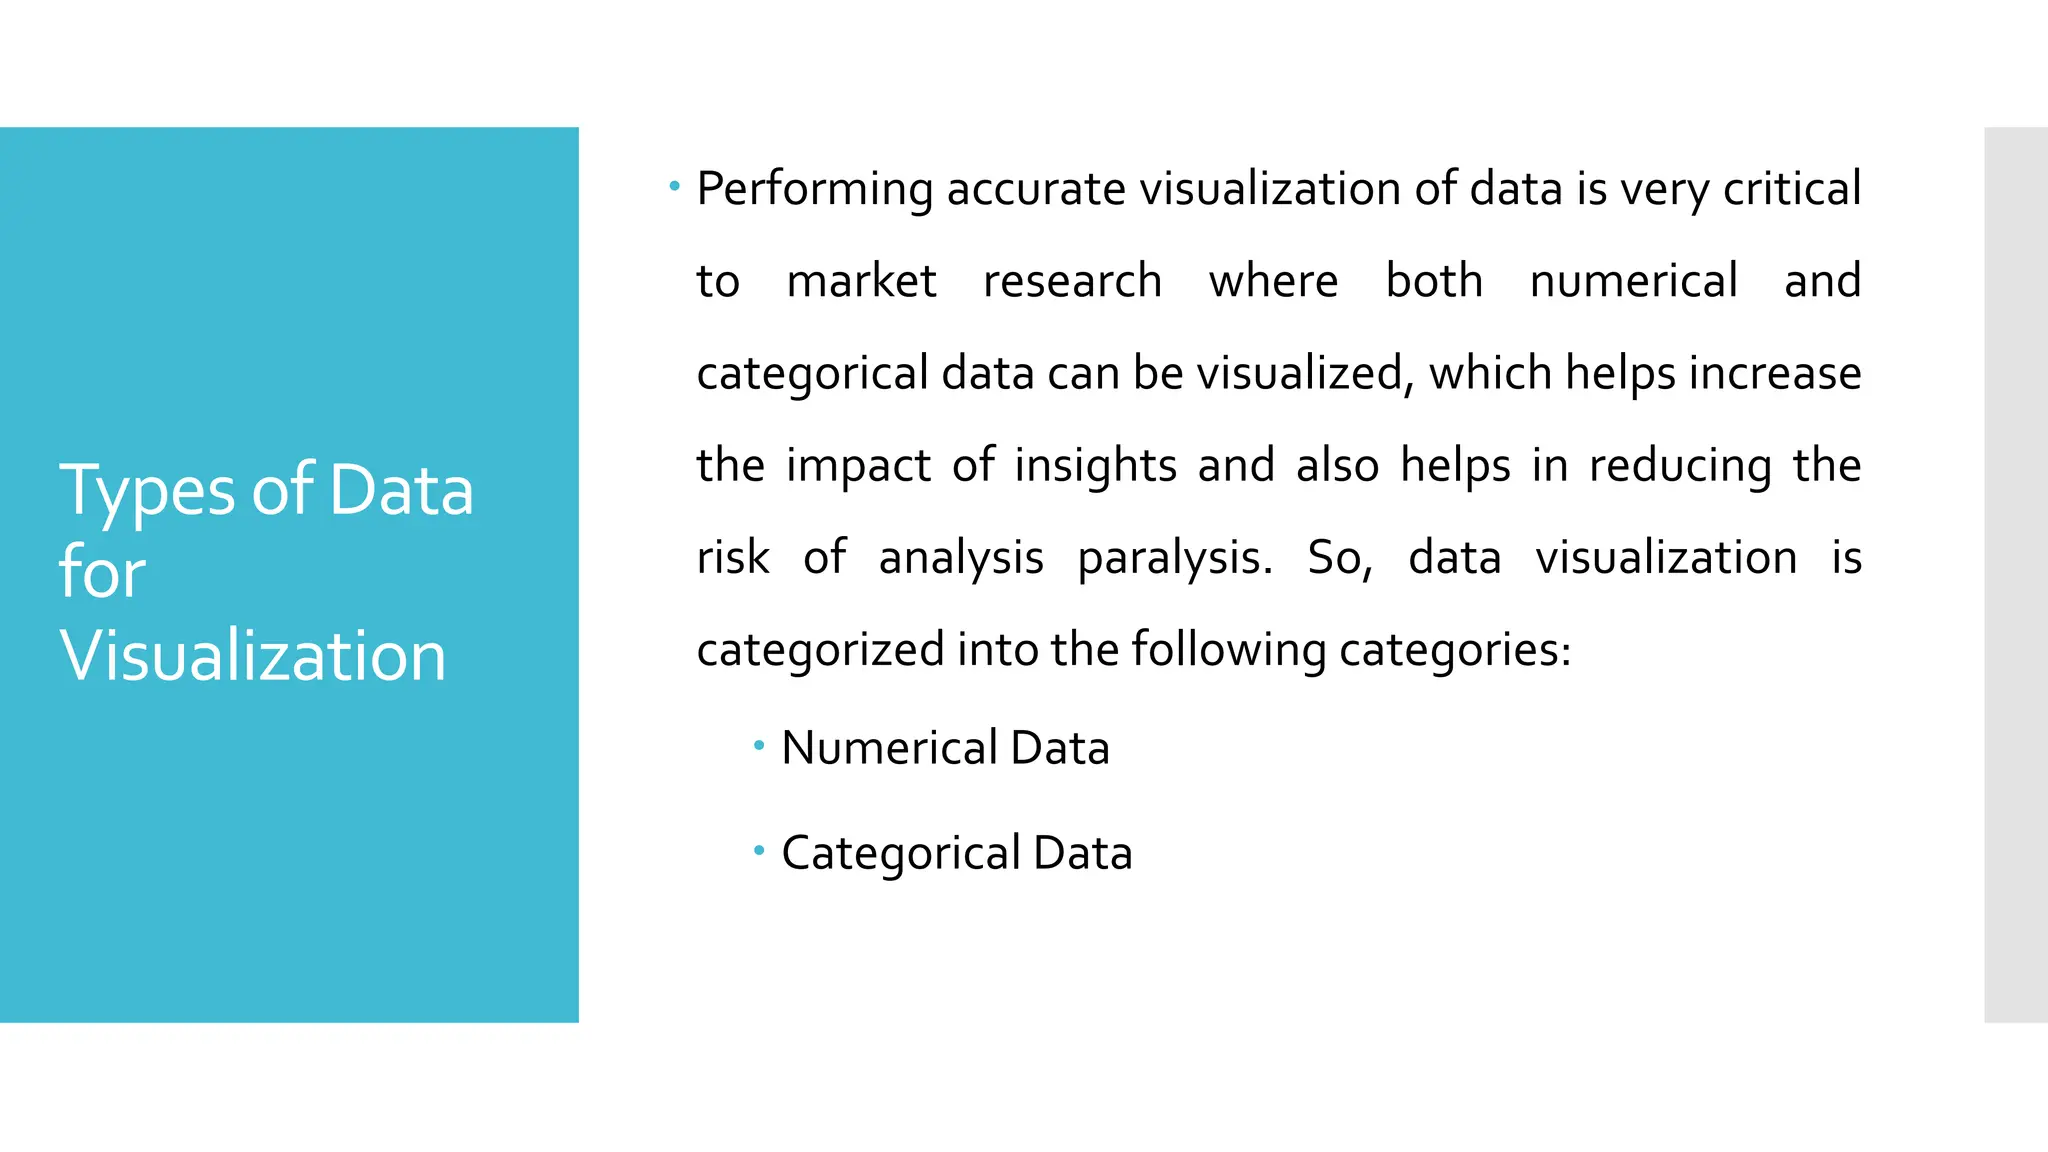
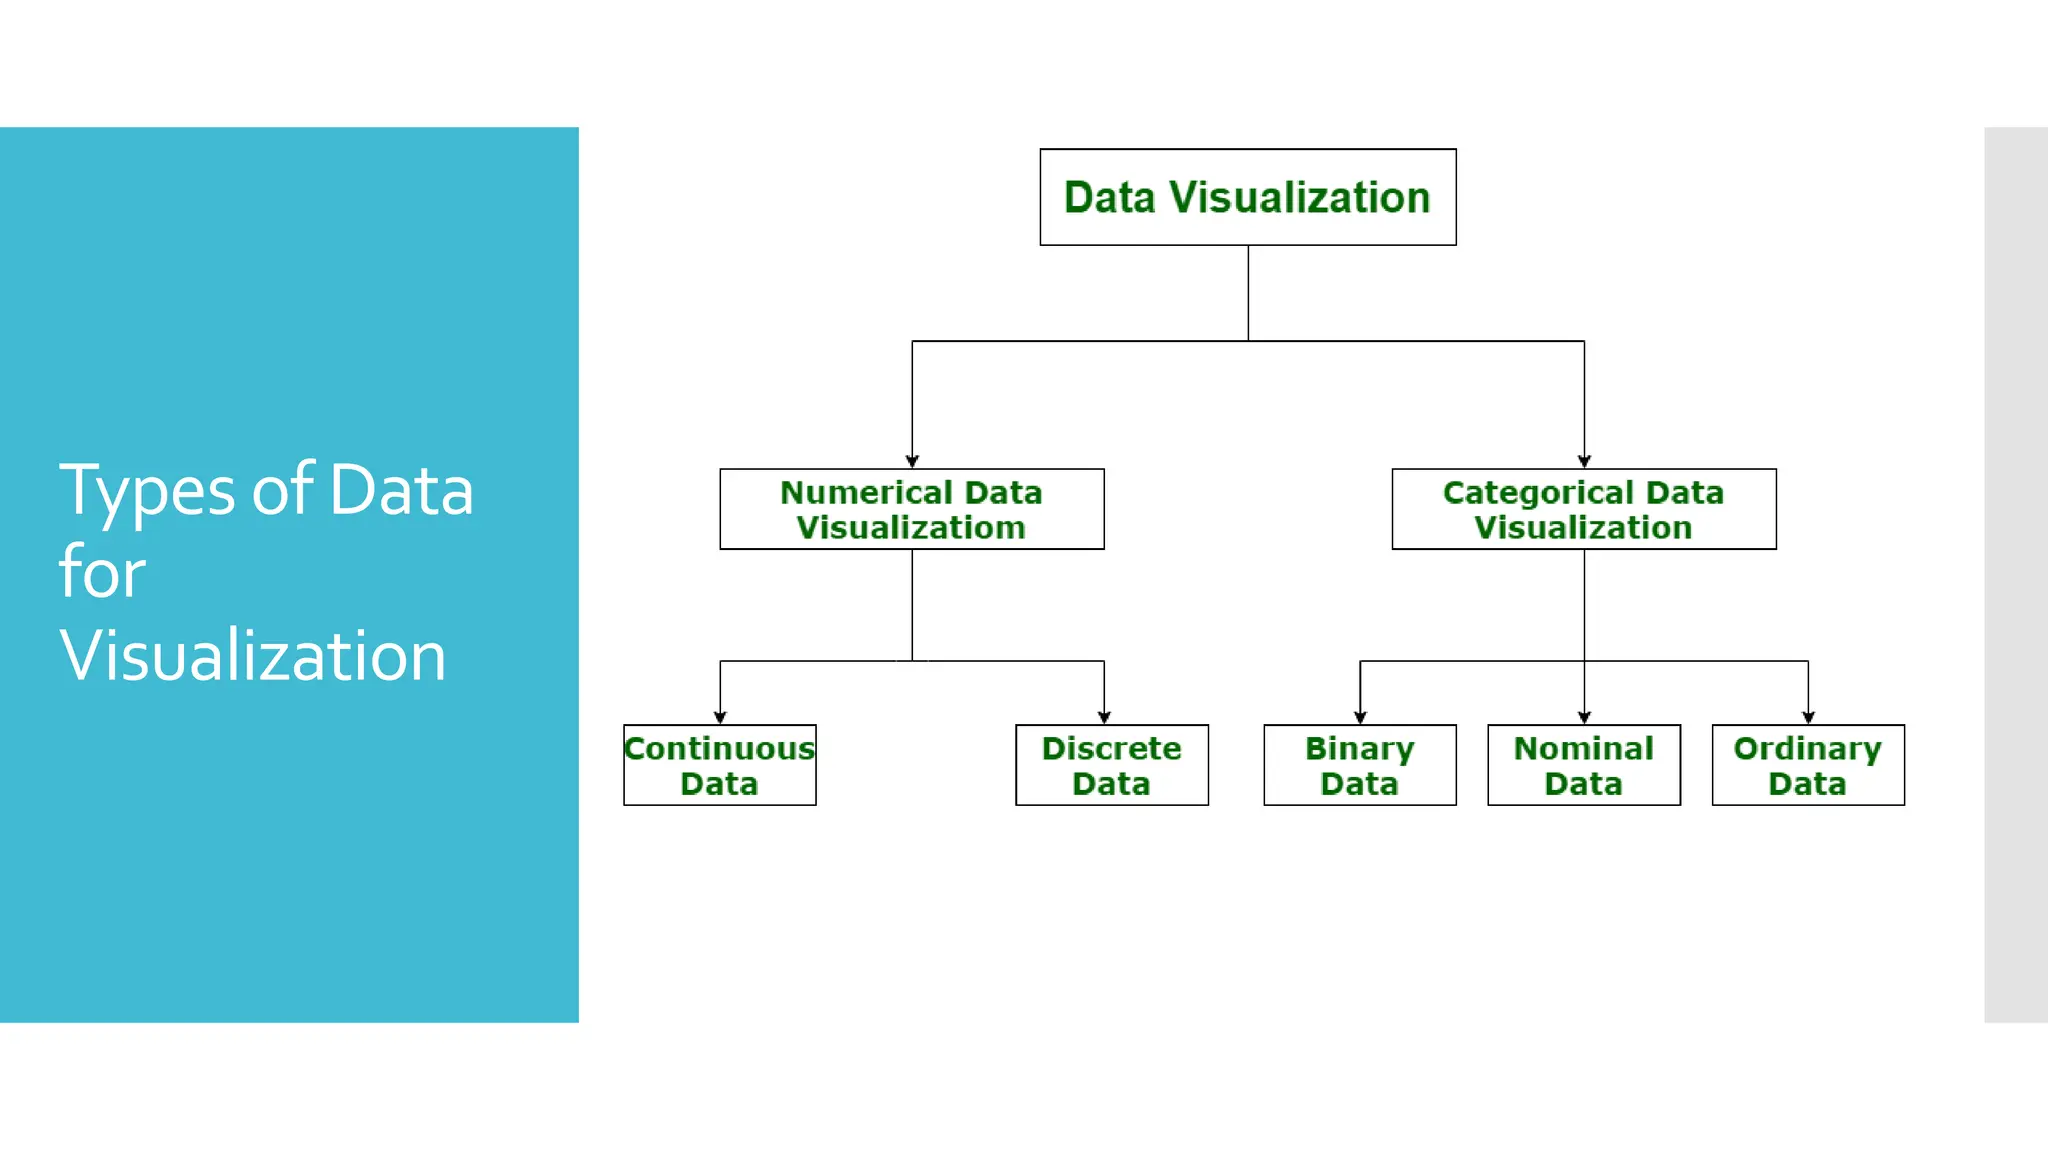
Types of Data
for
Visualization
Performing accurate visualization of data is very critical
to market research where both numerical and
categorical data can be visualized, which helps increase
the impact of insights and also helps in reducing the
risk of analysis paralysis. So, data visualization is
categorized into the following categories:
Numerical Data
Categorical Data
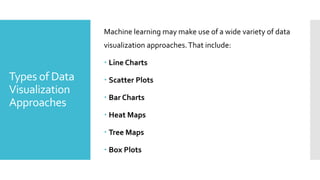
Types of Data
Visualization
Approaches
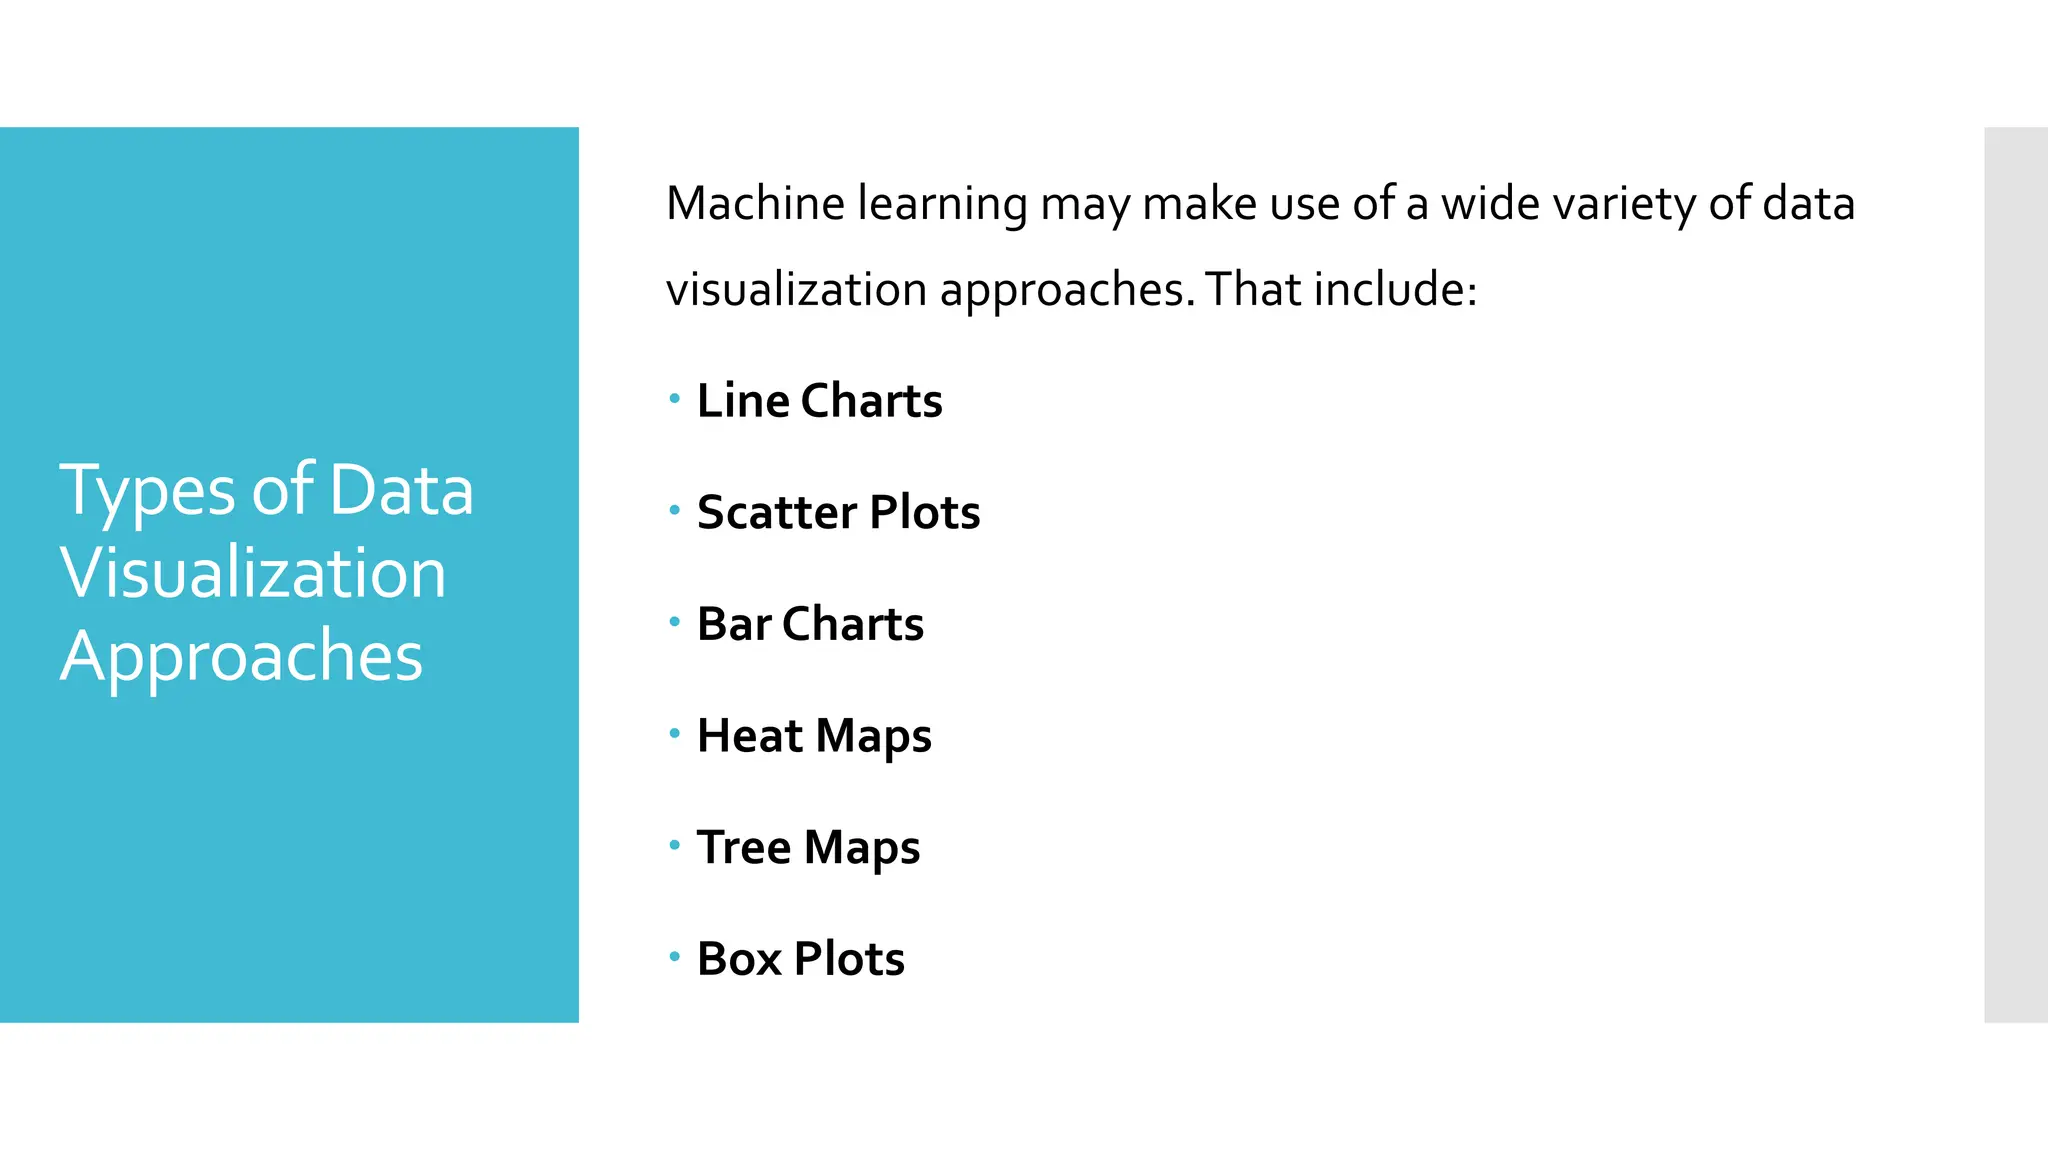
Machinelearning may make use of a wide variety of data
visualization approaches.That include:
Line Charts
Scatter Plots
Bar Charts
Heat Maps
Tree Maps
Box Plots
42.
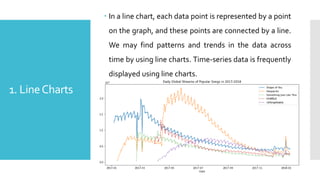
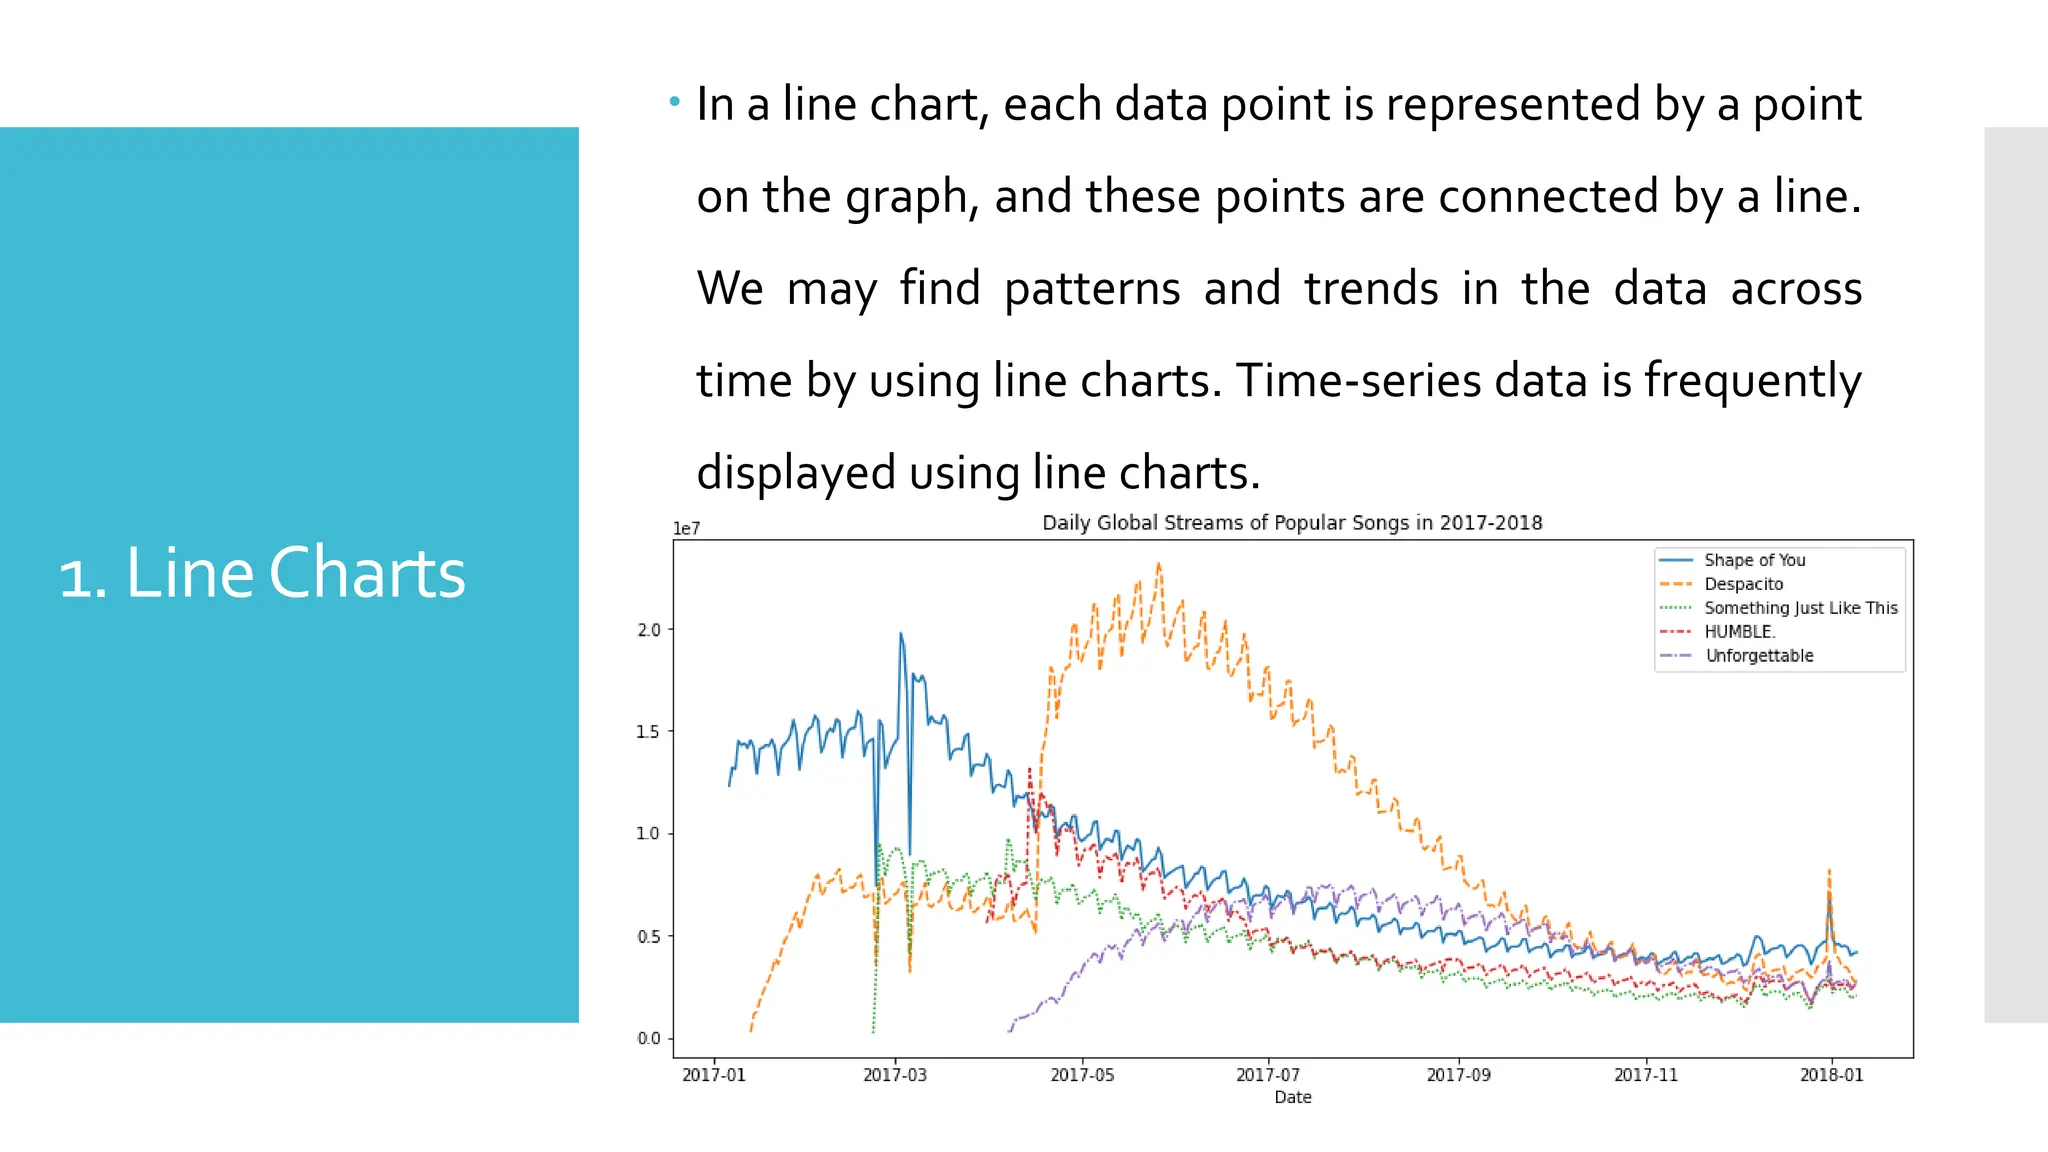
1. LineCharts
Ina line chart, each data point is represented by a point
on the graph, and these points are connected by a line.
We may find patterns and trends in the data across
time by using line charts. Time-series data is frequently
displayed using line charts.
43.
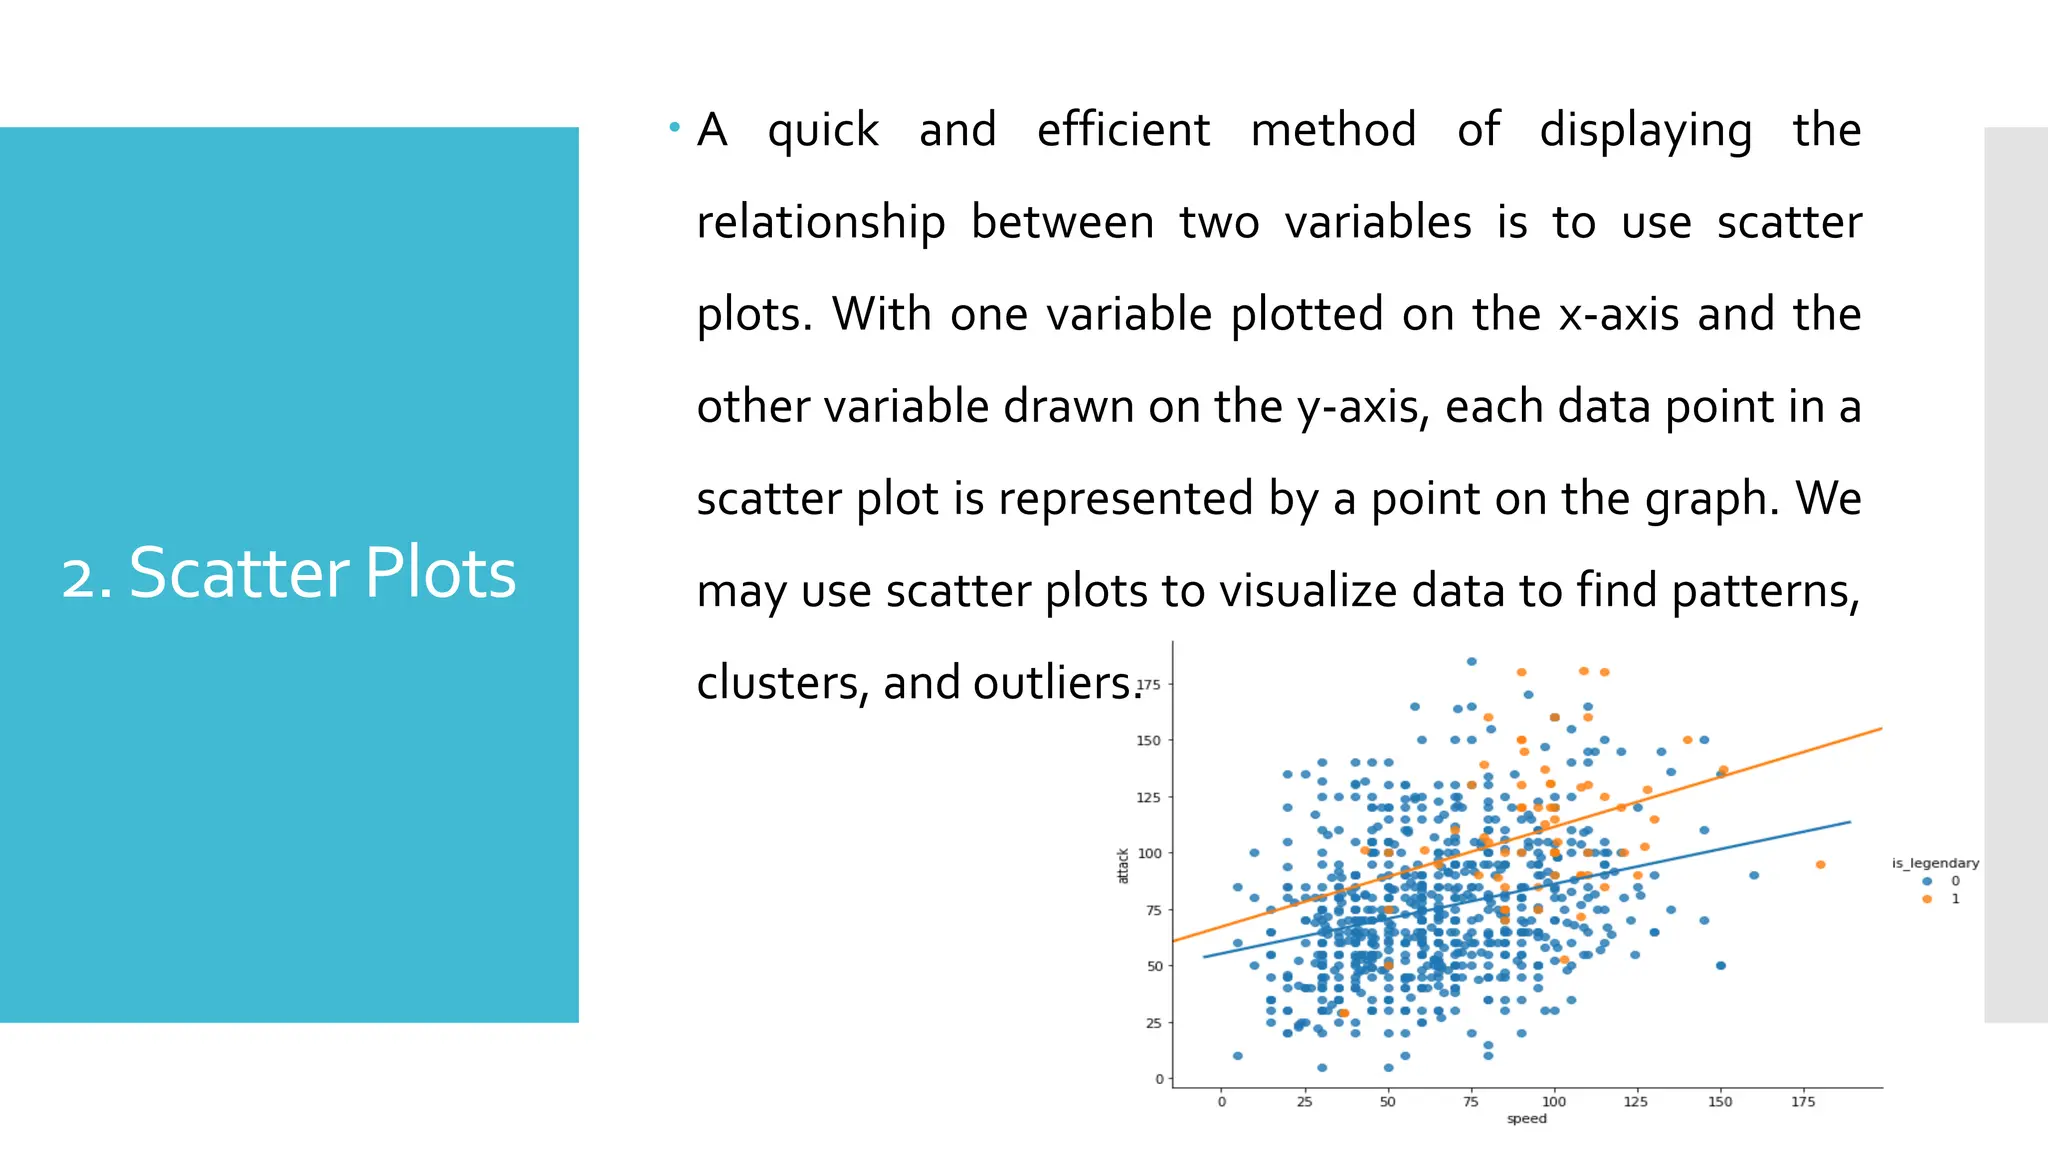
2.Scatter Plots
Aquick and efficient method of displaying the
relationship between two variables is to use scatter
plots. With one variable plotted on the x-axis and the
other variable drawn on the y-axis, each data point in a
scatter plot is represented by a point on the graph. We
may use scatter plots to visualize data to find patterns,
clusters, and outliers.
44.
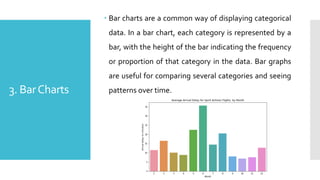
3. BarCharts
Barcharts are a common way of displaying categorical
data. In a bar chart, each category is represented by a
bar, with the height of the bar indicating the frequency
or proportion of that category in the data. Bar graphs
are useful for comparing several categories and seeing
patterns over time.
45.
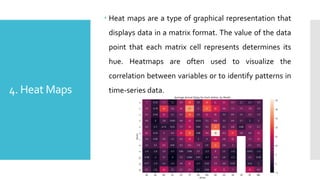
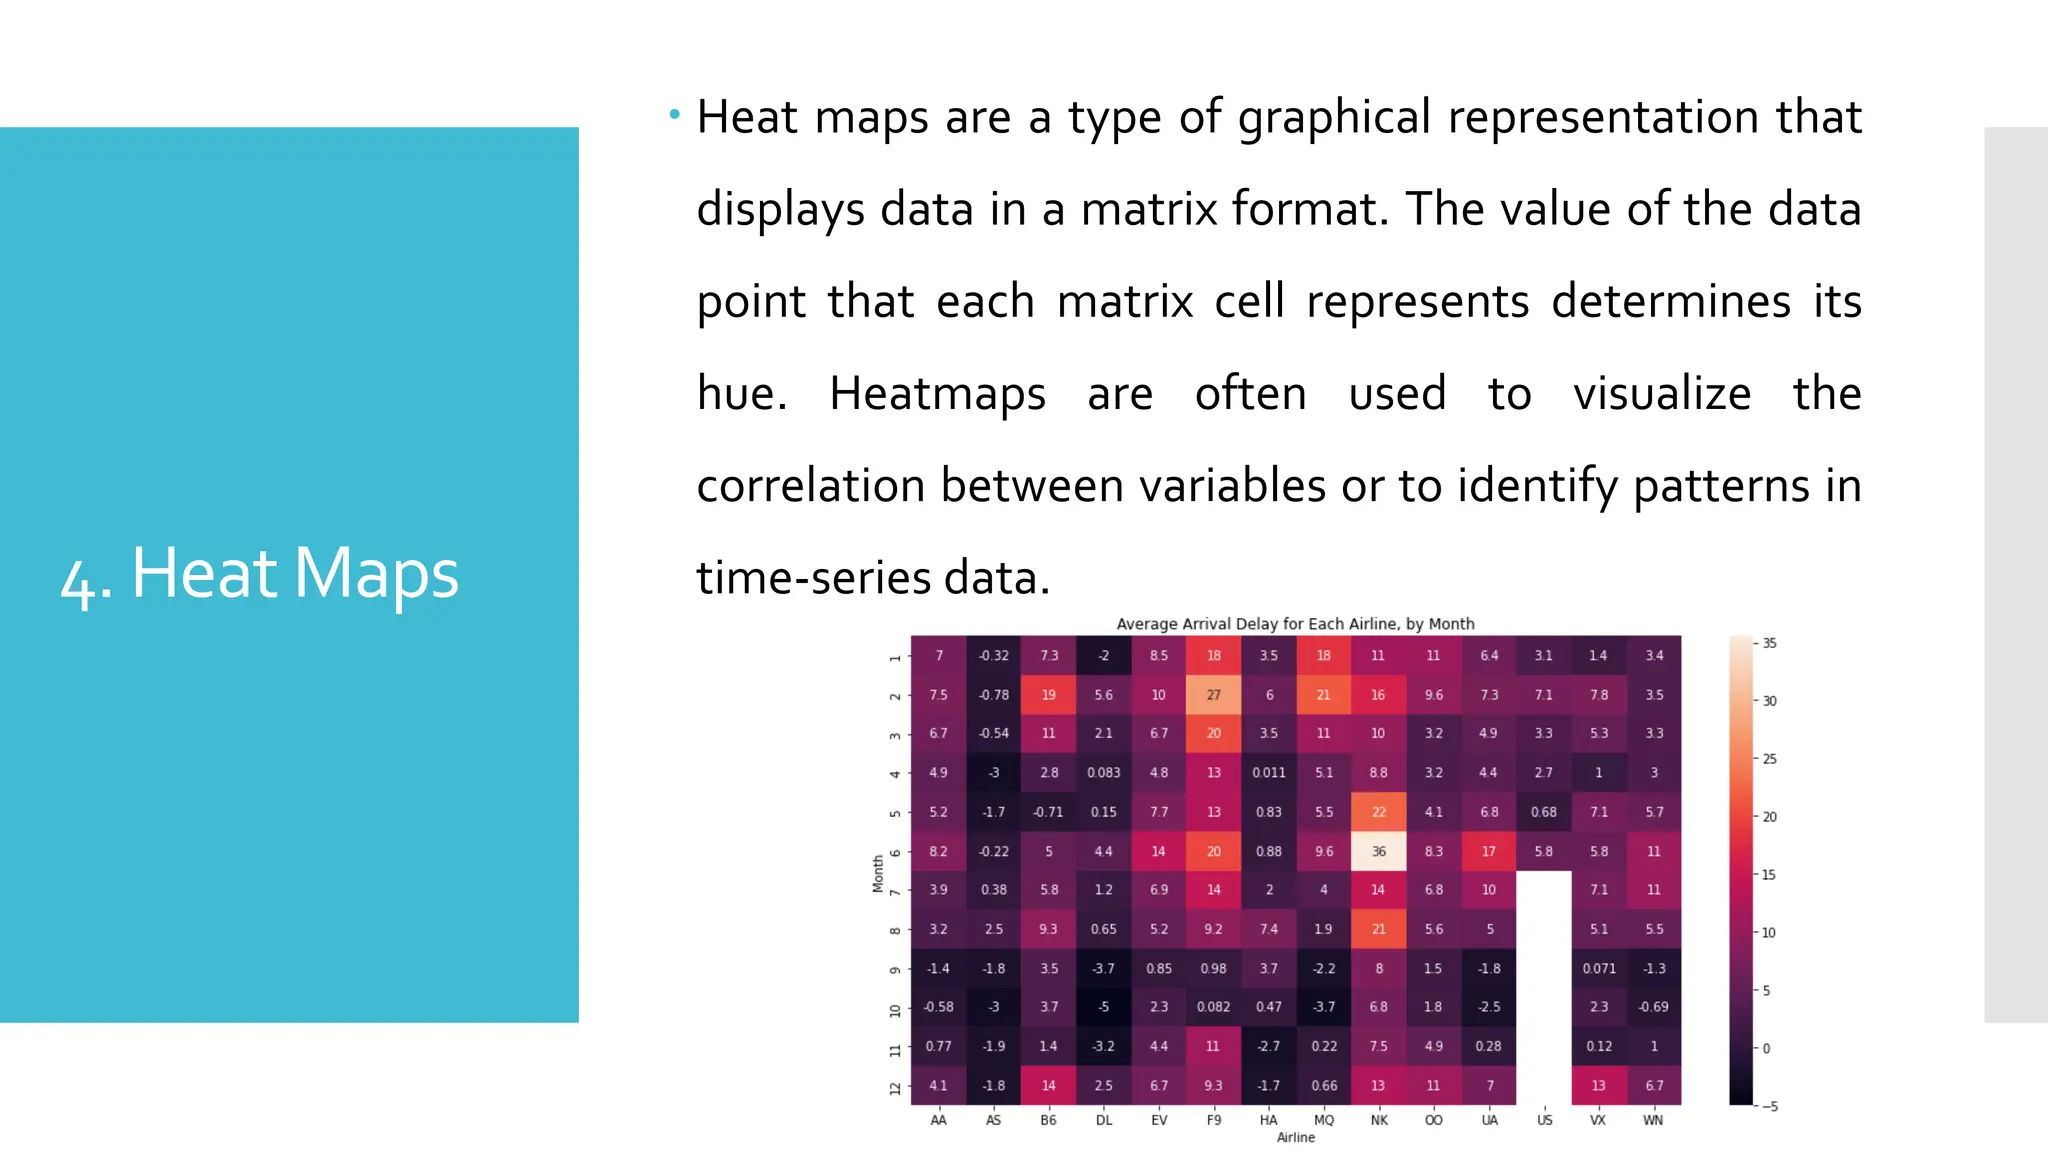
4. Heat Maps
Heat maps are a type of graphical representation that
displays data in a matrix format. The value of the data
point that each matrix cell represents determines its
hue. Heatmaps are often used to visualize the
correlation between variables or to identify patterns in
time-series data.
46.
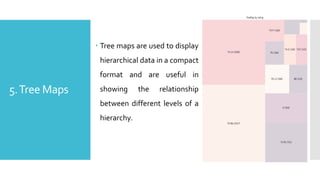
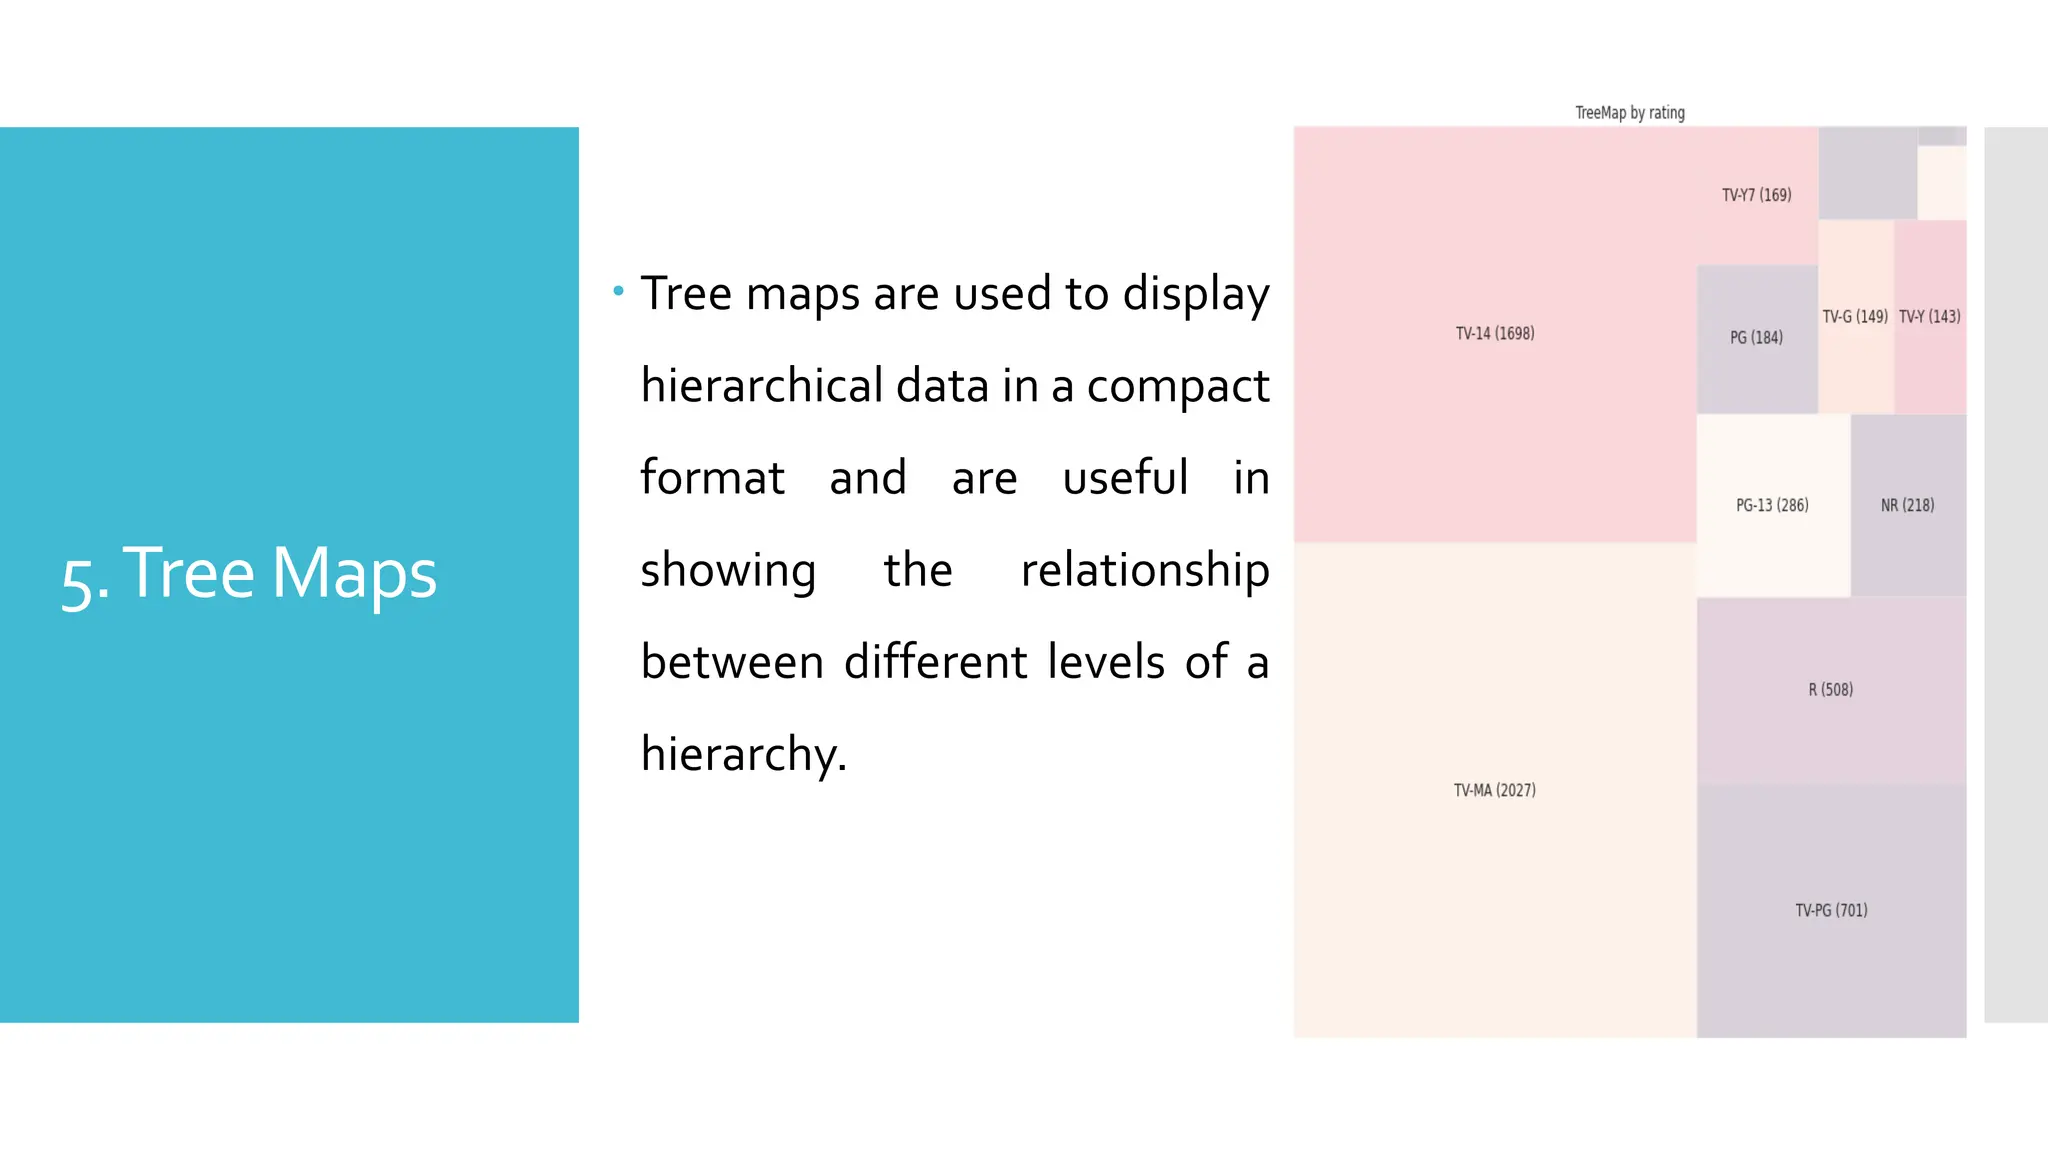
5.Tree Maps
Treemaps are used to display
hierarchical data in a compact
format and are useful in
showing the relationship
between different levels of a
hierarchy.
47.
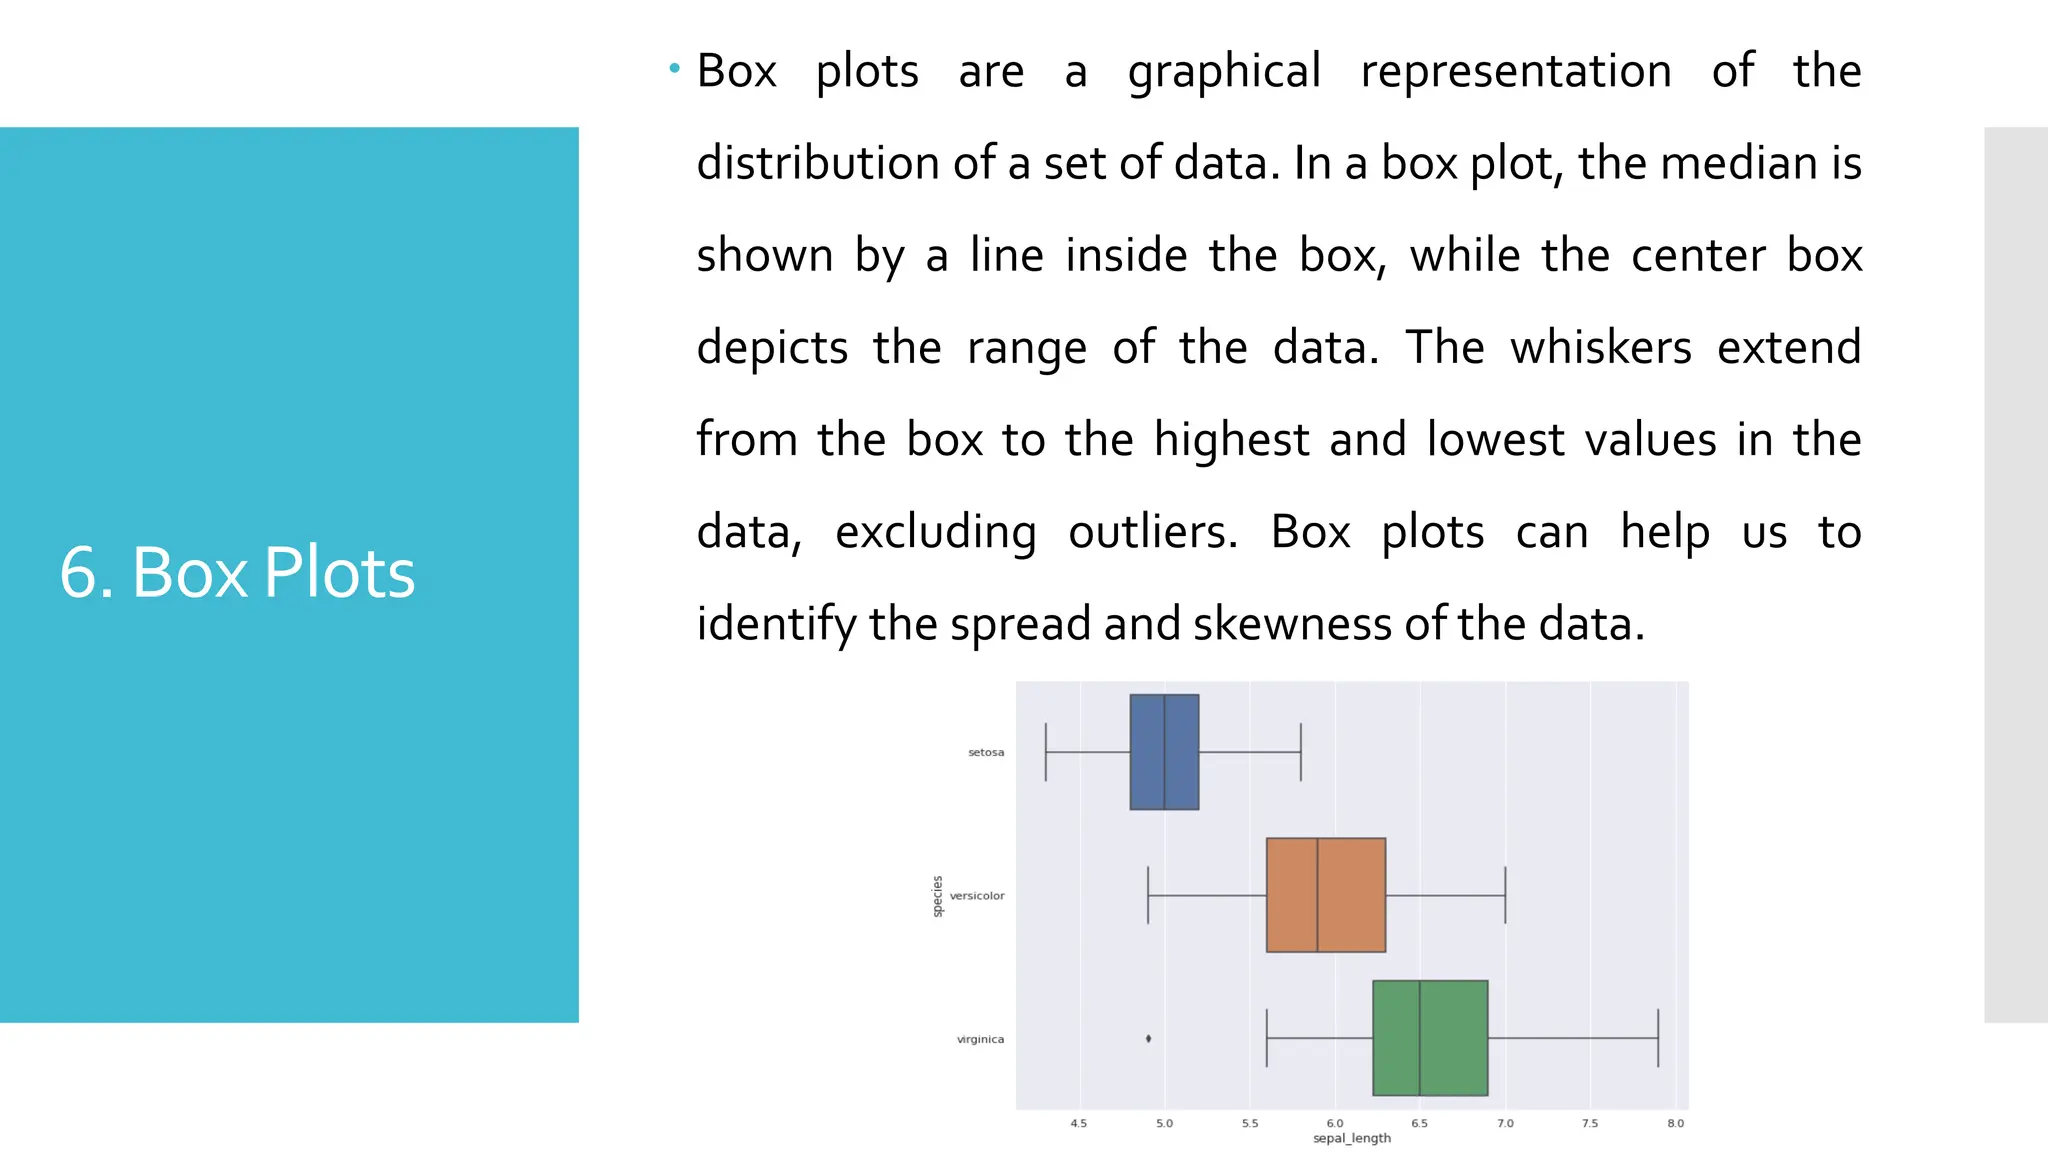
6. Box Plots
Box plots are a graphical representation of the
distribution of a set of data. In a box plot, the median is
shown by a line inside the box, while the center box
depicts the range of the data. The whiskers extend
from the box to the highest and lowest values in the
data, excluding outliers. Box plots can help us to
identify the spread and skewness of the data.
48.
Uses of Data
Visualizationin
Machine
Learning
Identify trends and patterns in data: It may be challenging to
spot trends and patterns in data using conventional approaches,
but data visualization tools may be utilized to do so.
Communicate insights to stakeholders: Data visualization can be
used to communicate insights to stakeholders in a format that is
easily understandable and can help to support decision-making
processes.
Monitor machine learning models: Data visualization can be used
to monitor machine learning models in real time and to identify
any issues or anomalies in the data.
Improve data quality: Data visualization can be used to identify
outliers and inconsistencies in the data and to improve data
quality by removing them.