Download as PDF, PPTX

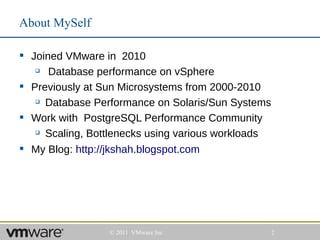

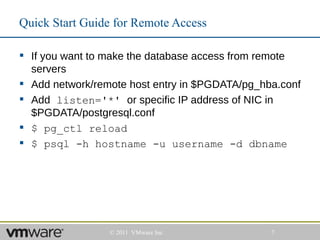

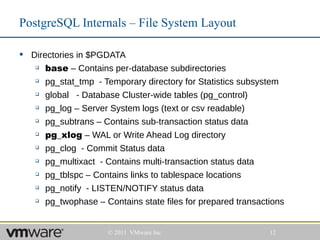
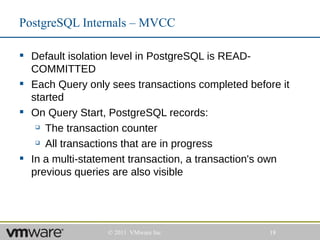
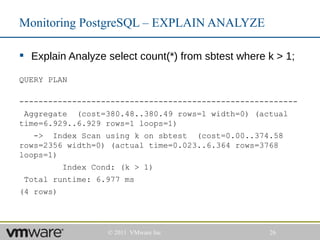
![PostgreSQL Internals – Processes Layout
> pgrep -lf postgres
6688 /usr/local/postgres/bin/postgres
(POSTMASTER)
6689 postgres: logger process
6691 postgres: writer process
6692 postgres: wal writer process
6693 postgres: autovacuum launcher process
6694 postgres: stats collector process
13583 postgres: username dbname [local] idle in
transaction
© 2011 VMware Inc 13](https://image.slidesharecdn.com/pgeast2011-intropgsa-130313162207-phpapp02/85/Introduction-to-PostgreSQL-for-System-Administrators-13-320.jpg)

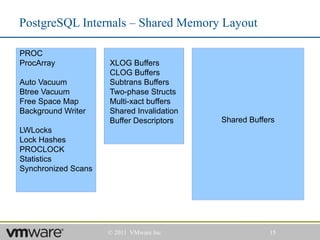
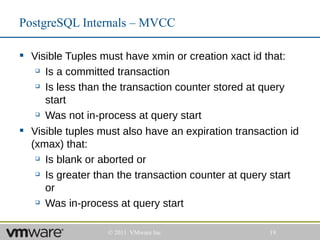
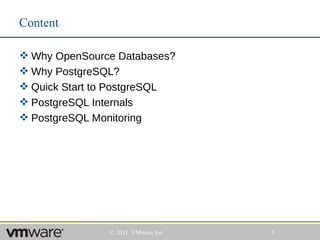
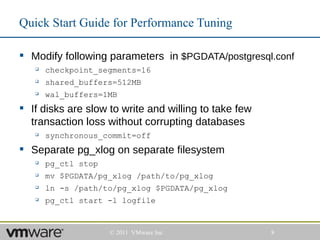
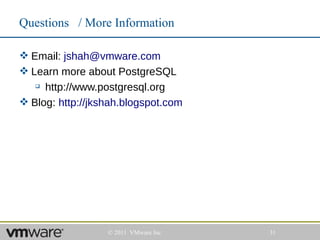
![Monitoring PostgreSQL – Monitoring DB Statistics
select * from pg_stat_database;
[ RECORD 4 ]-+-----------
datid | 16384
datname | sbtest
numbackends | 1
xact_commit | 136978505
xact_rollback | 95
blks_read | 99161
blks_hit | 1481038913
tup_returned | 1138850495
tup_fetched | 986059963
tup_inserted | 3150677
tup_updated | 6145651
tup_deleted | 2050612
© 2011 VMware Inc 27](https://image.slidesharecdn.com/pgeast2011-intropgsa-130313162207-phpapp02/85/Introduction-to-PostgreSQL-for-System-Administrators-27-320.jpg)
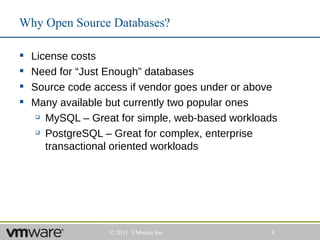
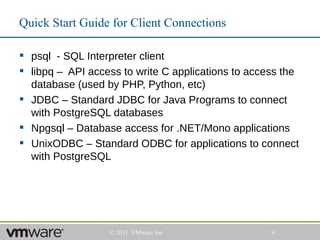
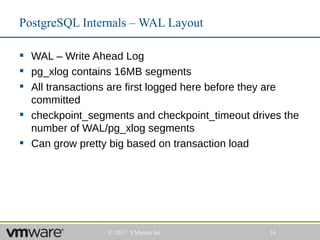
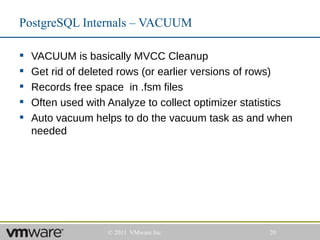
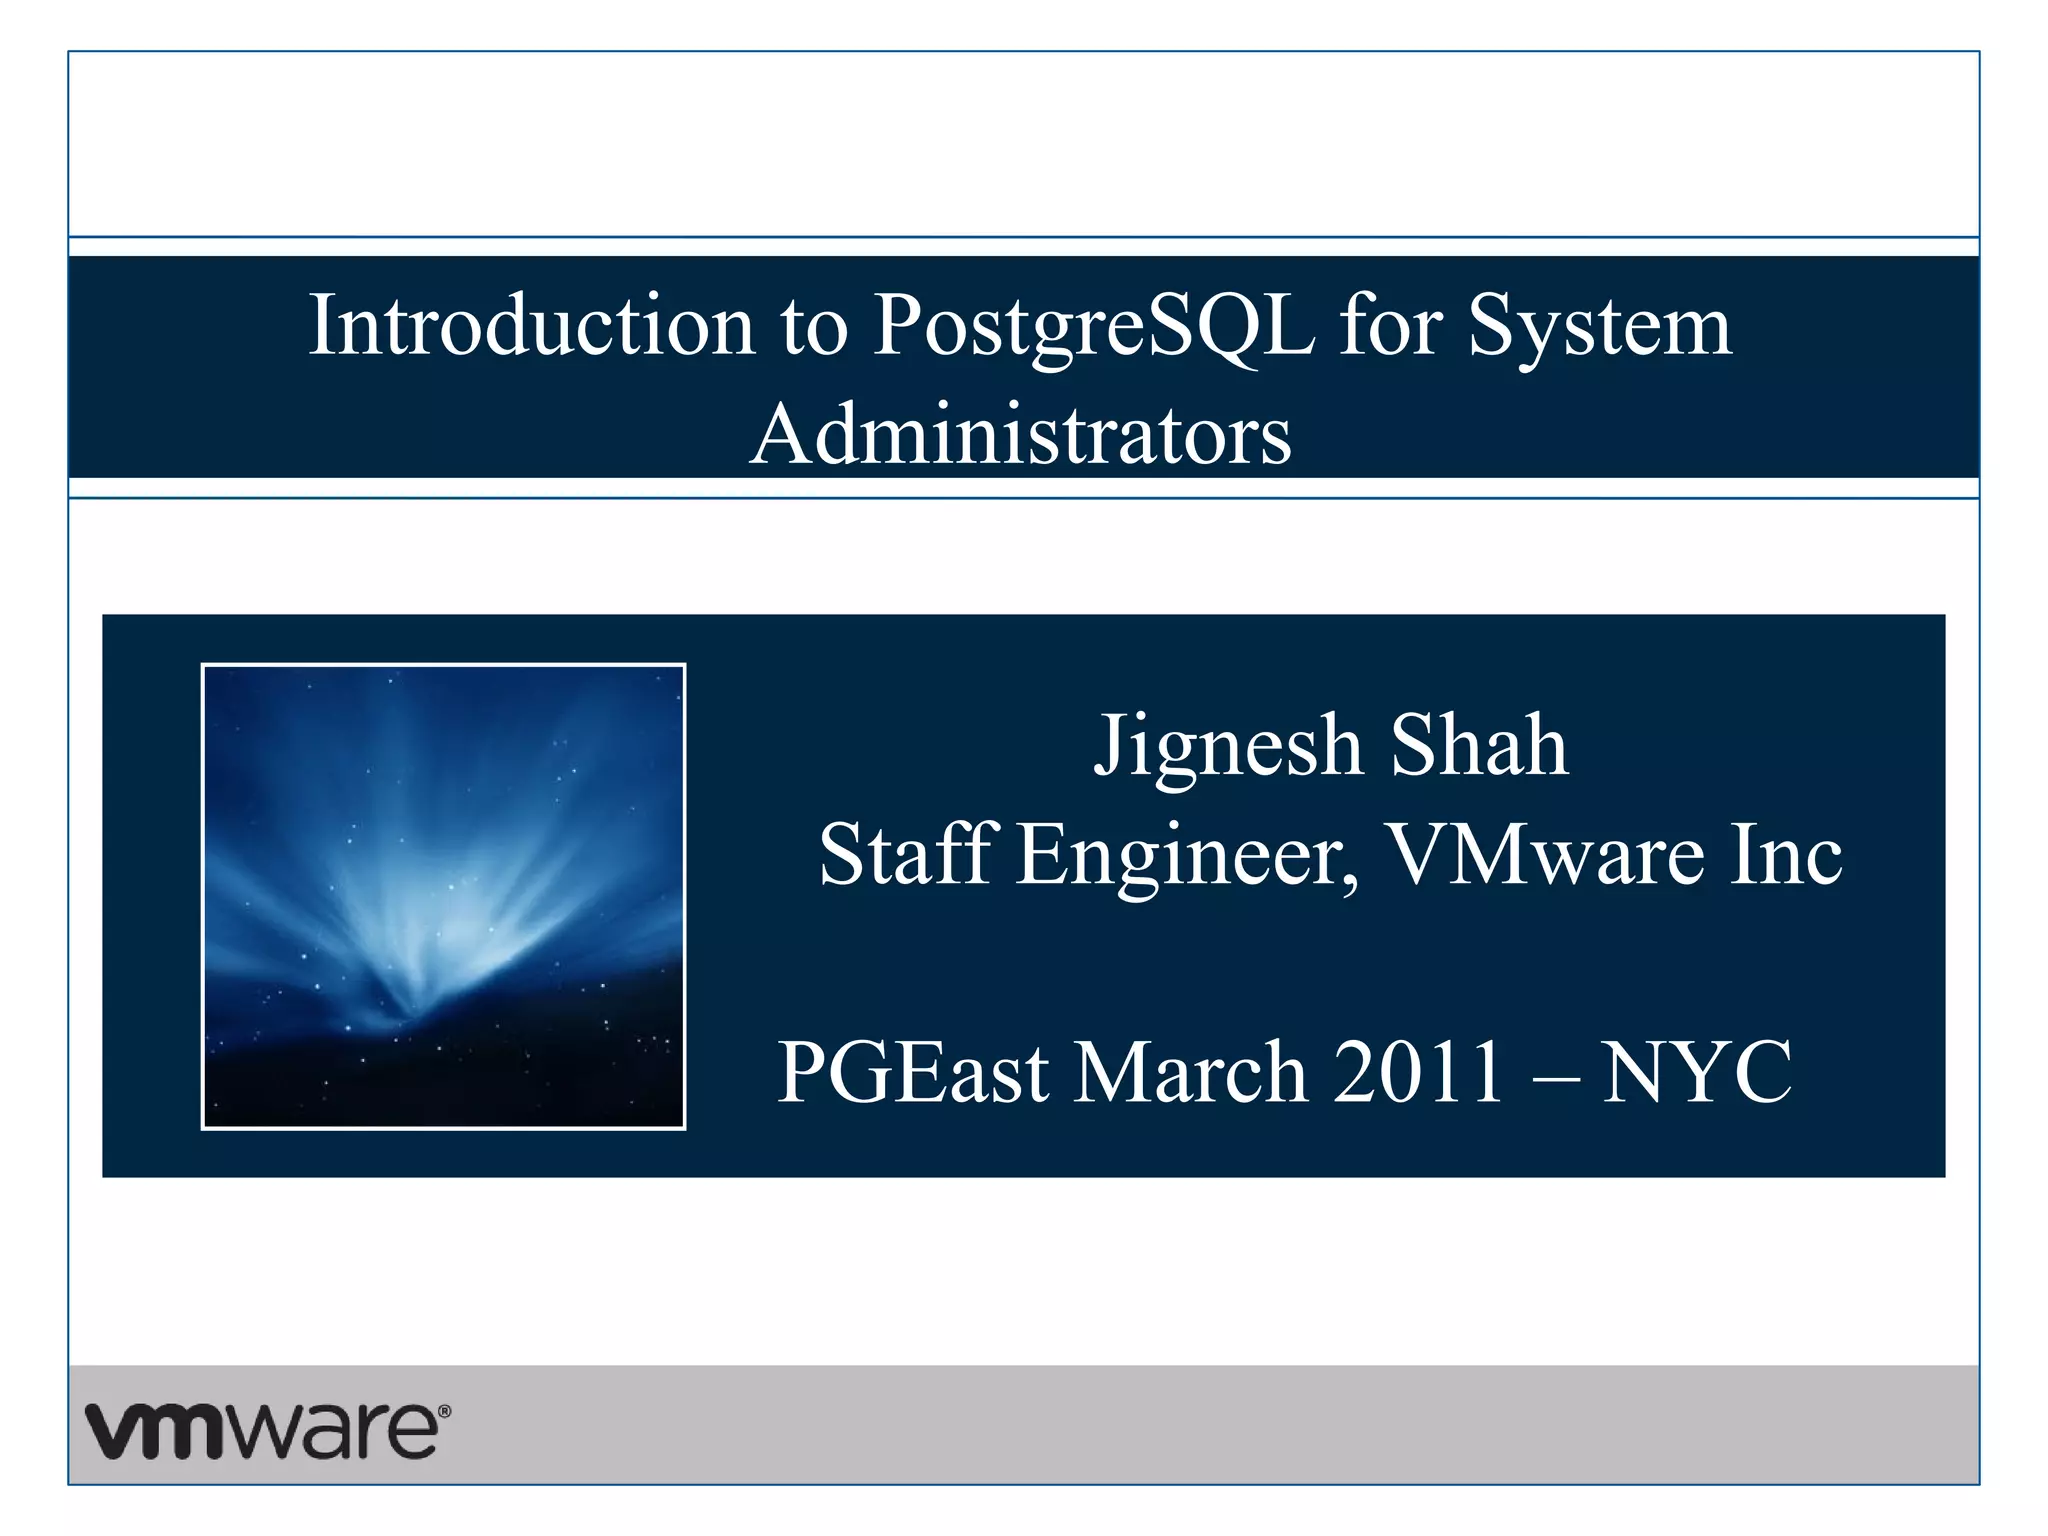
![Monitoring PostgreSQL – Monitoring Table Statistics
select * from pg_stat_user_tables;
-[ RECORD 1 ]----+------------------------------
relid | 16405
schemaname | public
relname | sbtest
seq_scan | 2
seq_tup_read | 0
idx_scan | 2001731
idx_tup_fetch | 46158444
n_tup_ins | 211207
n_tup_upd | 333527
n_tup_del | 111207
n_tup_hot_upd | 108633
n_live_tup | 100000
n_dead_tup | 0
last_vacuum |
last_autovacuum | 2010-12-02 01:38:44.821662+00
last_analyze |
last_autoanalyze | 2010-12-02 01:38:47.598785+00
© 2011 VMware Inc 28](https://image.slidesharecdn.com/pgeast2011-intropgsa-130313162207-phpapp02/85/Introduction-to-PostgreSQL-for-System-Administrators-28-320.jpg)
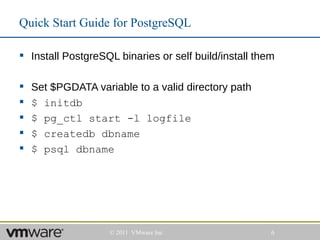
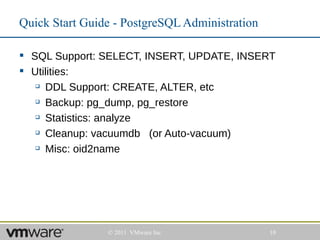
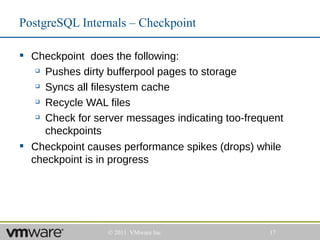
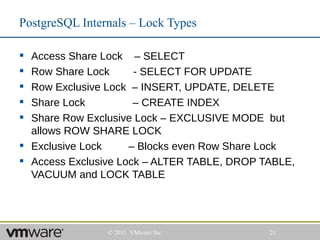
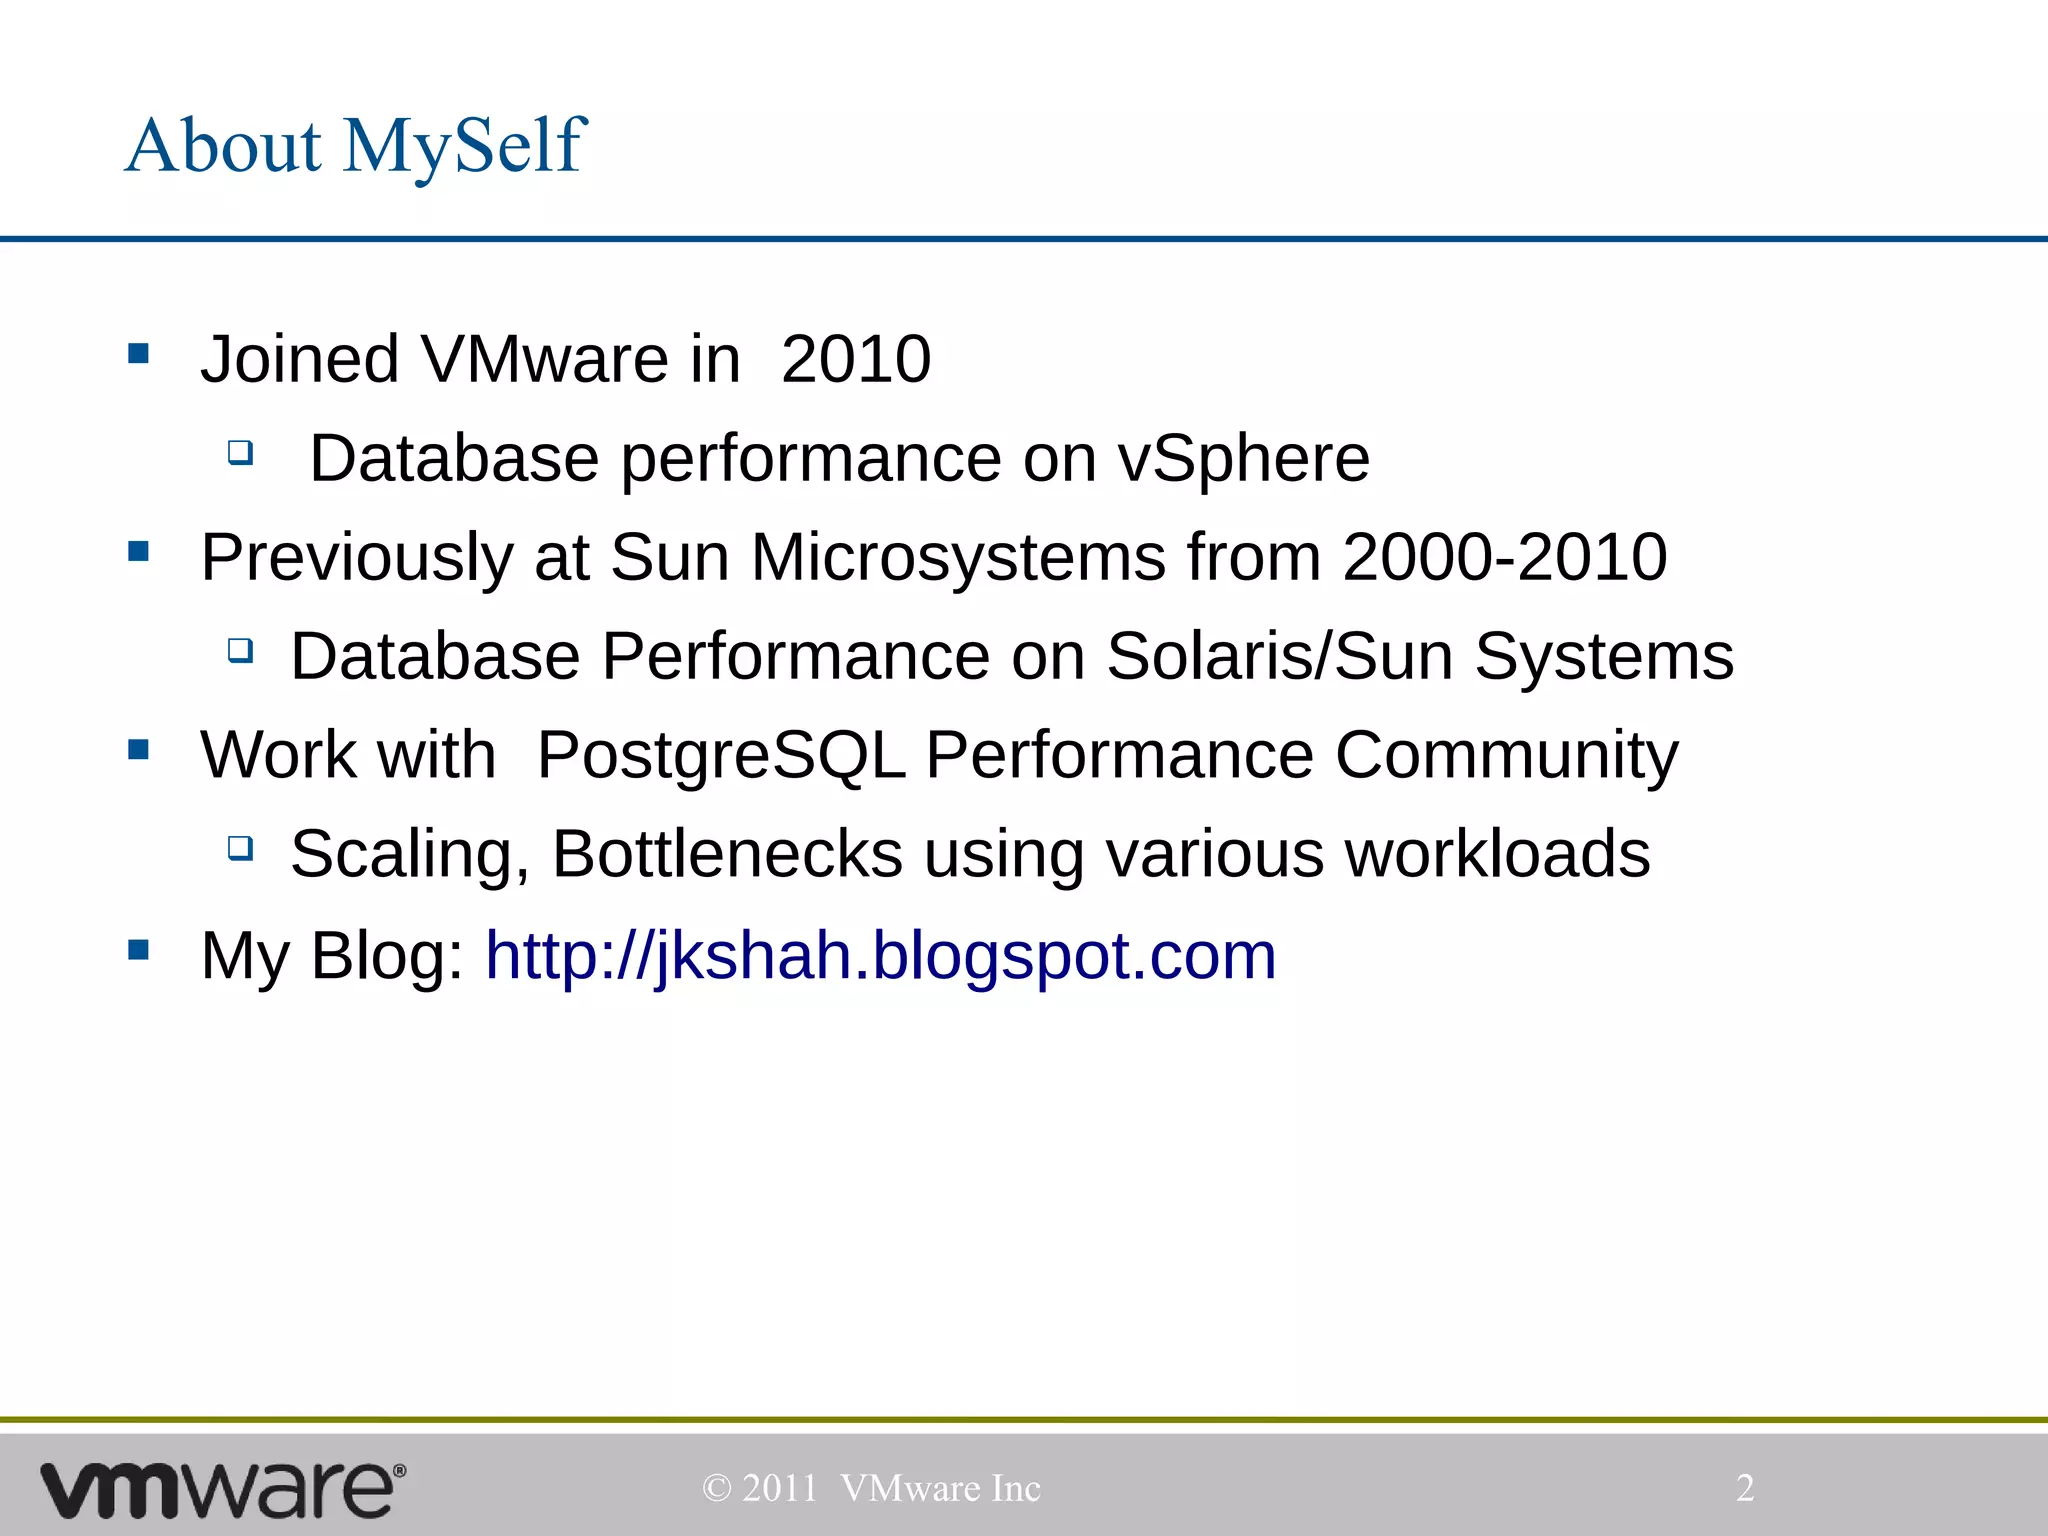
![Monitoring PostgreSQL – Monitoring IO Statistics
select * from pg_statio_user_tables;
-[ RECORD 1 ]---+---------
relid | 16405
schemaname | public
relname | sbtest
heap_blks_read | 4588
heap_blks_hit | 29358125
idx_blks_read | 1919
idx_blks_hit | 6551658
toast_blks_read |
toast_blks_hit |
tidx_blks_read |
tidx_blks_hit |
© 2011 VMware Inc 29](https://image.slidesharecdn.com/pgeast2011-intropgsa-130313162207-phpapp02/85/Introduction-to-PostgreSQL-for-System-Administrators-29-320.jpg)
![Monitoring PostgreSQL – Monitoring IO Statistics
select * from pg_statio_user_indexes;
-[ RECORD 1 ]-+------------
relid | 16405
indexrelid | 16412
schemaname | public
relname | sbtest
indexrelname | sbtest_pkey
idx_blks_read | 391
idx_blks_hit | 5210450
-[ RECORD 2 ]-+------------
relid | 16405
indexrelid | 16414
schemaname | public
relname | sbtest
indexrelname | k
idx_blks_read | 1528
idx_blks_hit | 1341208
© 2011 VMware Inc 30](https://image.slidesharecdn.com/pgeast2011-intropgsa-130313162207-phpapp02/85/Introduction-to-PostgreSQL-for-System-Administrators-30-320.jpg)
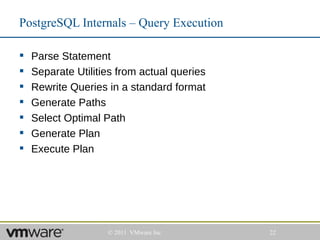
![PostgreSQL Internals – Processes Layout
> pgrep -lf postgres
6688 /usr/local/postgres/bin/postgres
(POSTMASTER)
6689 postgres: logger process
6691 postgres: writer process
6692 postgres: wal writer process
6693 postgres: autovacuum launcher process
6694 postgres: stats collector process
13583 postgres: username dbname [local] idle in
transaction
© 2011 VMware Inc 13](https://image.slidesharecdn.com/pgeast2011-intropgsa-130313162207-phpapp02/75/Introduction-to-PostgreSQL-for-System-Administrators-13-2048.jpg)

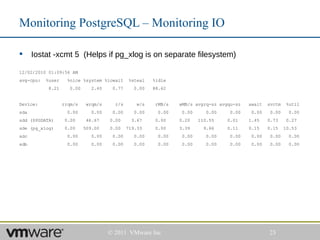
![Monitoring PostgreSQL – Monitoring DB Statistics
select * from pg_stat_database;
[ RECORD 4 ]-+-----------
datid | 16384
datname | sbtest
numbackends | 1
xact_commit | 136978505
xact_rollback | 95
blks_read | 99161
blks_hit | 1481038913
tup_returned | 1138850495
tup_fetched | 986059963
tup_inserted | 3150677
tup_updated | 6145651
tup_deleted | 2050612
© 2011 VMware Inc 27](https://image.slidesharecdn.com/pgeast2011-intropgsa-130313162207-phpapp02/75/Introduction-to-PostgreSQL-for-System-Administrators-27-2048.jpg)
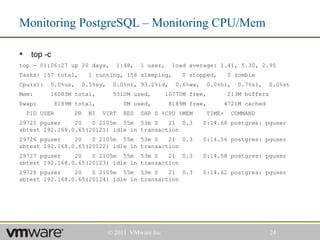
![Monitoring PostgreSQL – Monitoring Table Statistics
select * from pg_stat_user_tables;
-[ RECORD 1 ]----+------------------------------
relid | 16405
schemaname | public
relname | sbtest
seq_scan | 2
seq_tup_read | 0
idx_scan | 2001731
idx_tup_fetch | 46158444
n_tup_ins | 211207
n_tup_upd | 333527
n_tup_del | 111207
n_tup_hot_upd | 108633
n_live_tup | 100000
n_dead_tup | 0
last_vacuum |
last_autovacuum | 2010-12-02 01:38:44.821662+00
last_analyze |
last_autoanalyze | 2010-12-02 01:38:47.598785+00
© 2011 VMware Inc 28](https://image.slidesharecdn.com/pgeast2011-intropgsa-130313162207-phpapp02/75/Introduction-to-PostgreSQL-for-System-Administrators-28-2048.jpg)
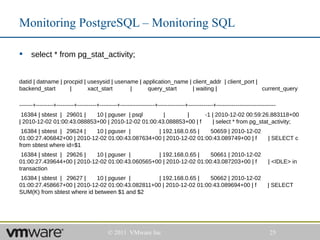
![Monitoring PostgreSQL – Monitoring IO Statistics
select * from pg_statio_user_tables;
-[ RECORD 1 ]---+---------
relid | 16405
schemaname | public
relname | sbtest
heap_blks_read | 4588
heap_blks_hit | 29358125
idx_blks_read | 1919
idx_blks_hit | 6551658
toast_blks_read |
toast_blks_hit |
tidx_blks_read |
tidx_blks_hit |
© 2011 VMware Inc 29](https://image.slidesharecdn.com/pgeast2011-intropgsa-130313162207-phpapp02/75/Introduction-to-PostgreSQL-for-System-Administrators-29-2048.jpg)
![Monitoring PostgreSQL – Monitoring IO Statistics
select * from pg_statio_user_indexes;
-[ RECORD 1 ]-+------------
relid | 16405
indexrelid | 16412
schemaname | public
relname | sbtest
indexrelname | sbtest_pkey
idx_blks_read | 391
idx_blks_hit | 5210450
-[ RECORD 2 ]-+------------
relid | 16405
indexrelid | 16414
schemaname | public
relname | sbtest
indexrelname | k
idx_blks_read | 1528
idx_blks_hit | 1341208
© 2011 VMware Inc 30](https://image.slidesharecdn.com/pgeast2011-intropgsa-130313162207-phpapp02/75/Introduction-to-PostgreSQL-for-System-Administrators-30-2048.jpg)

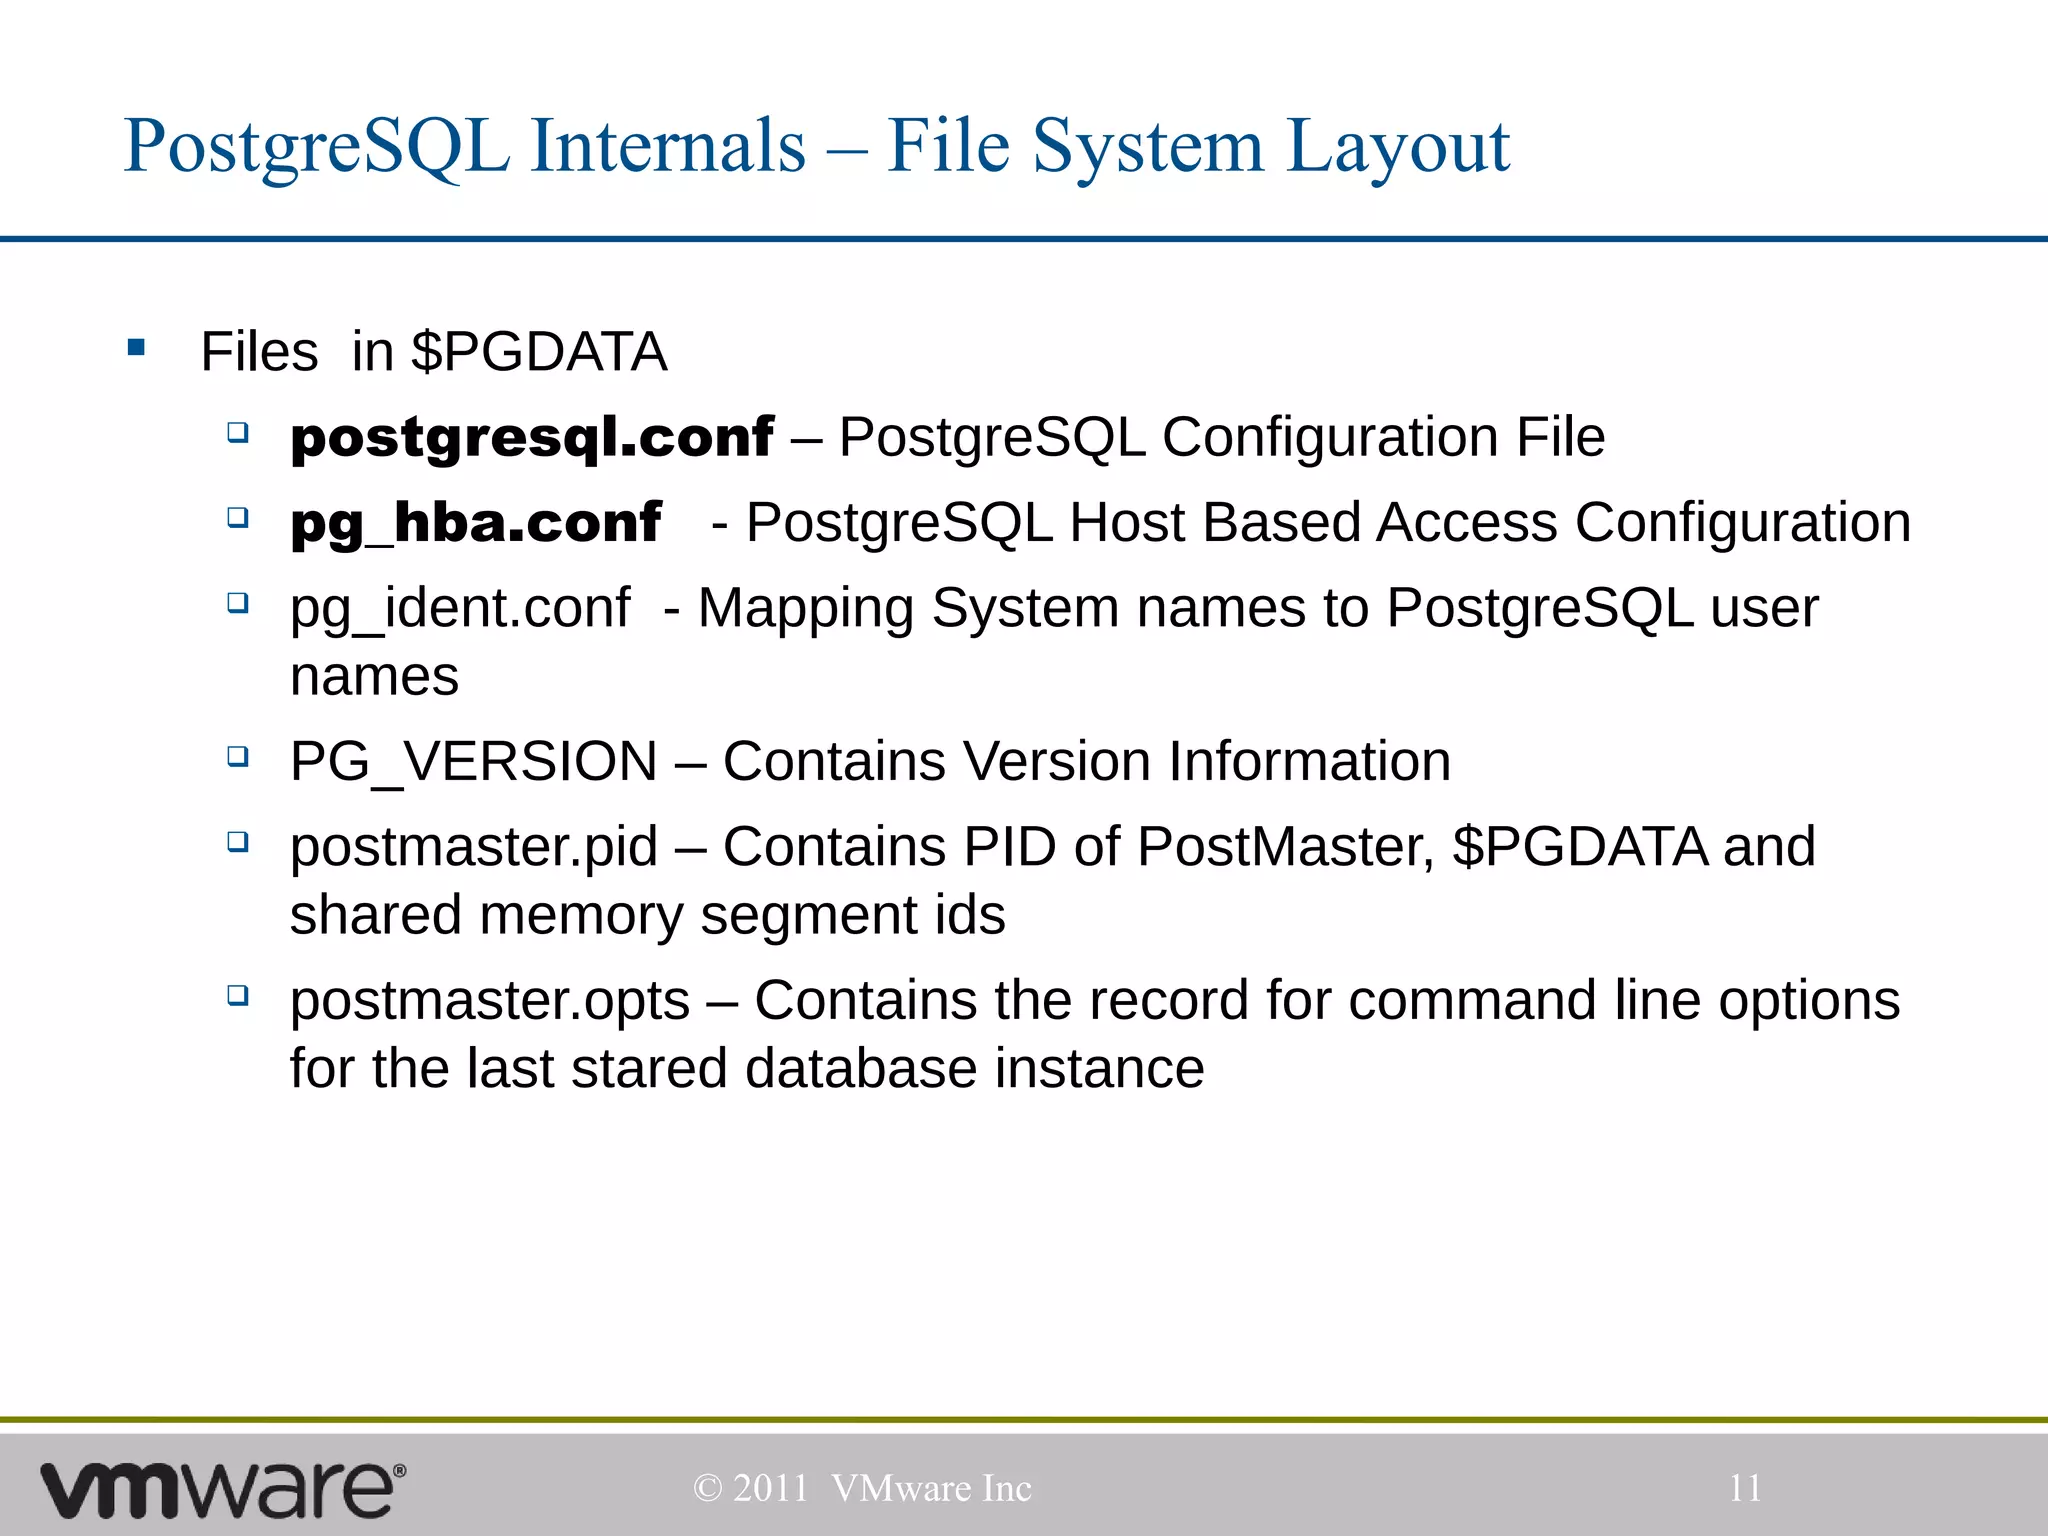
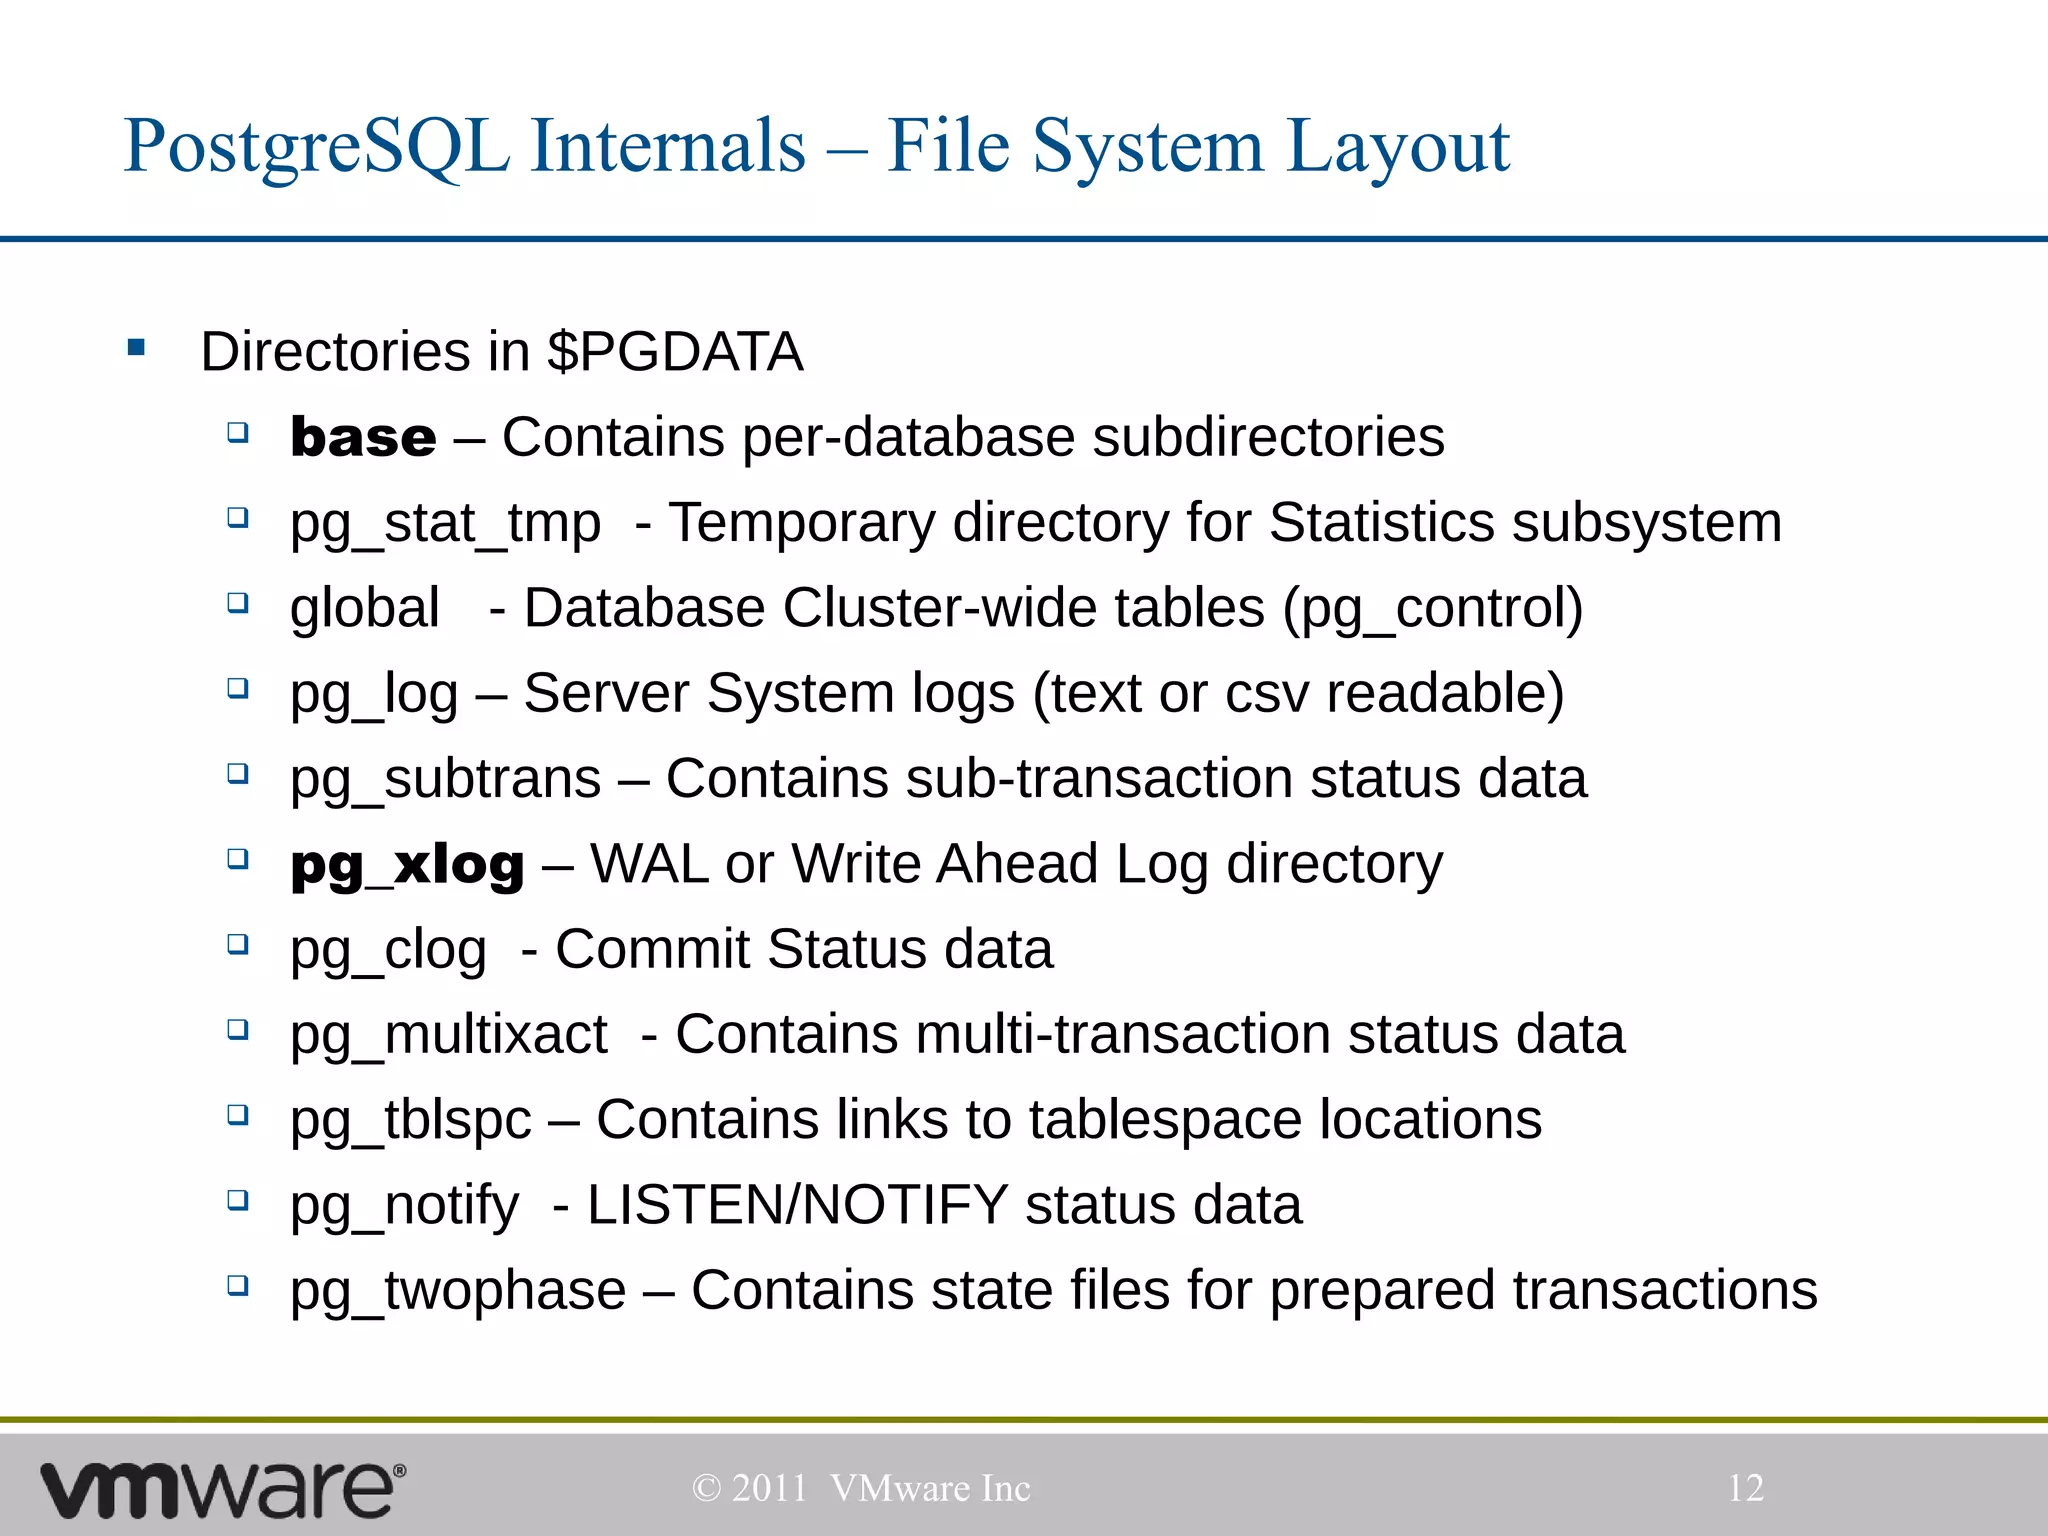
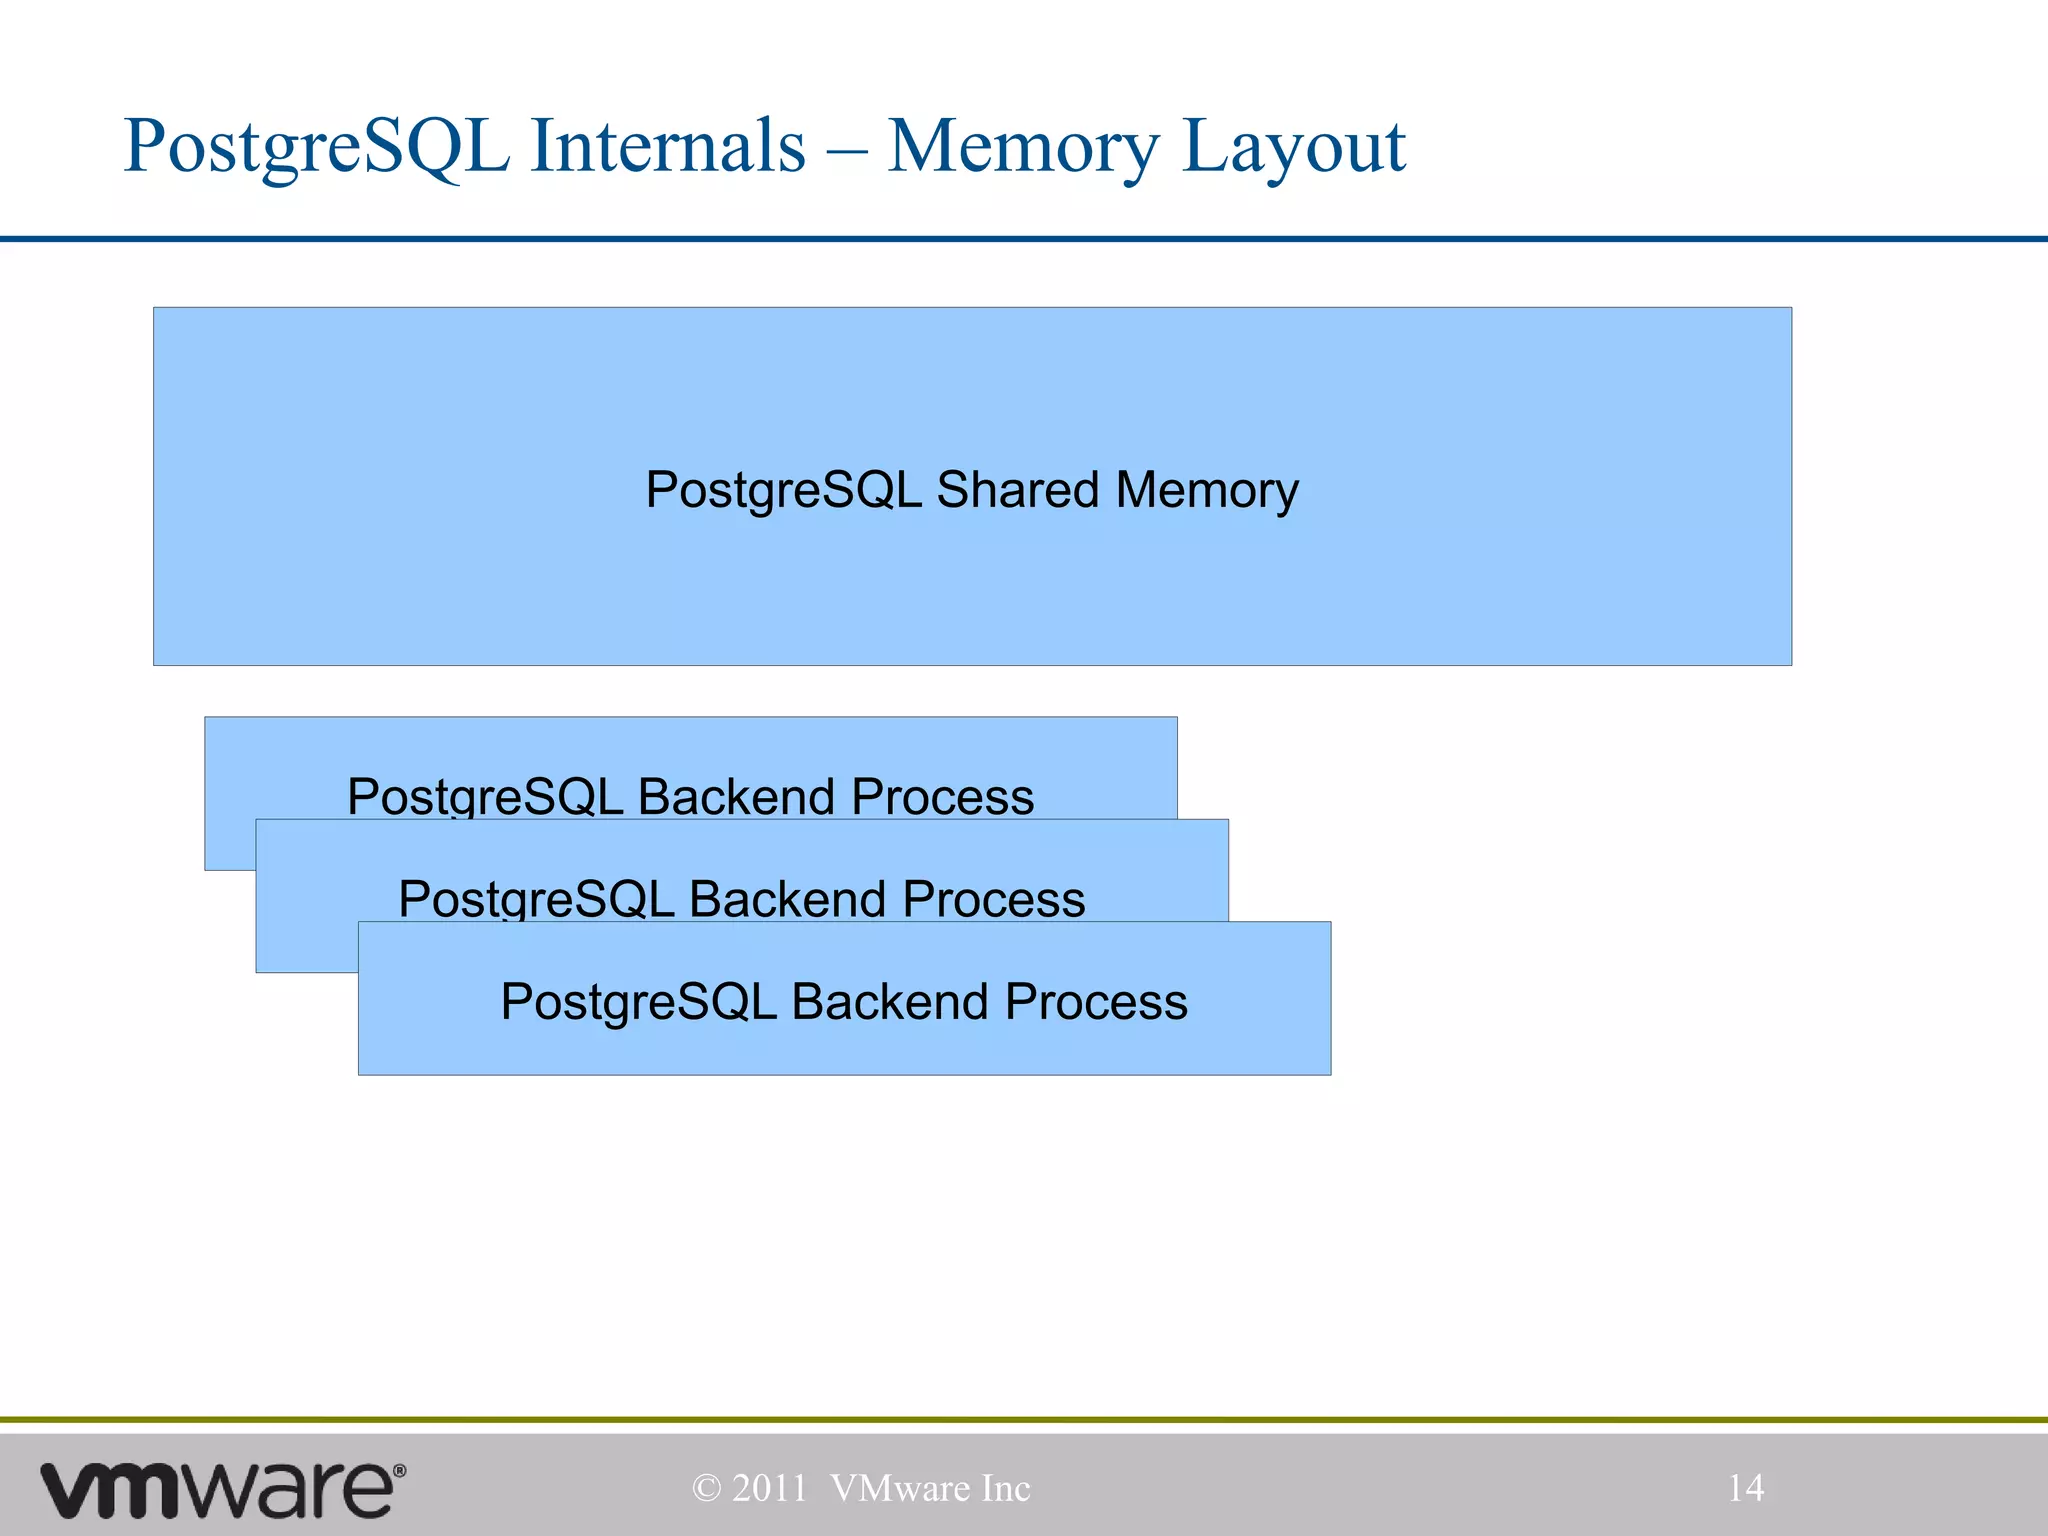
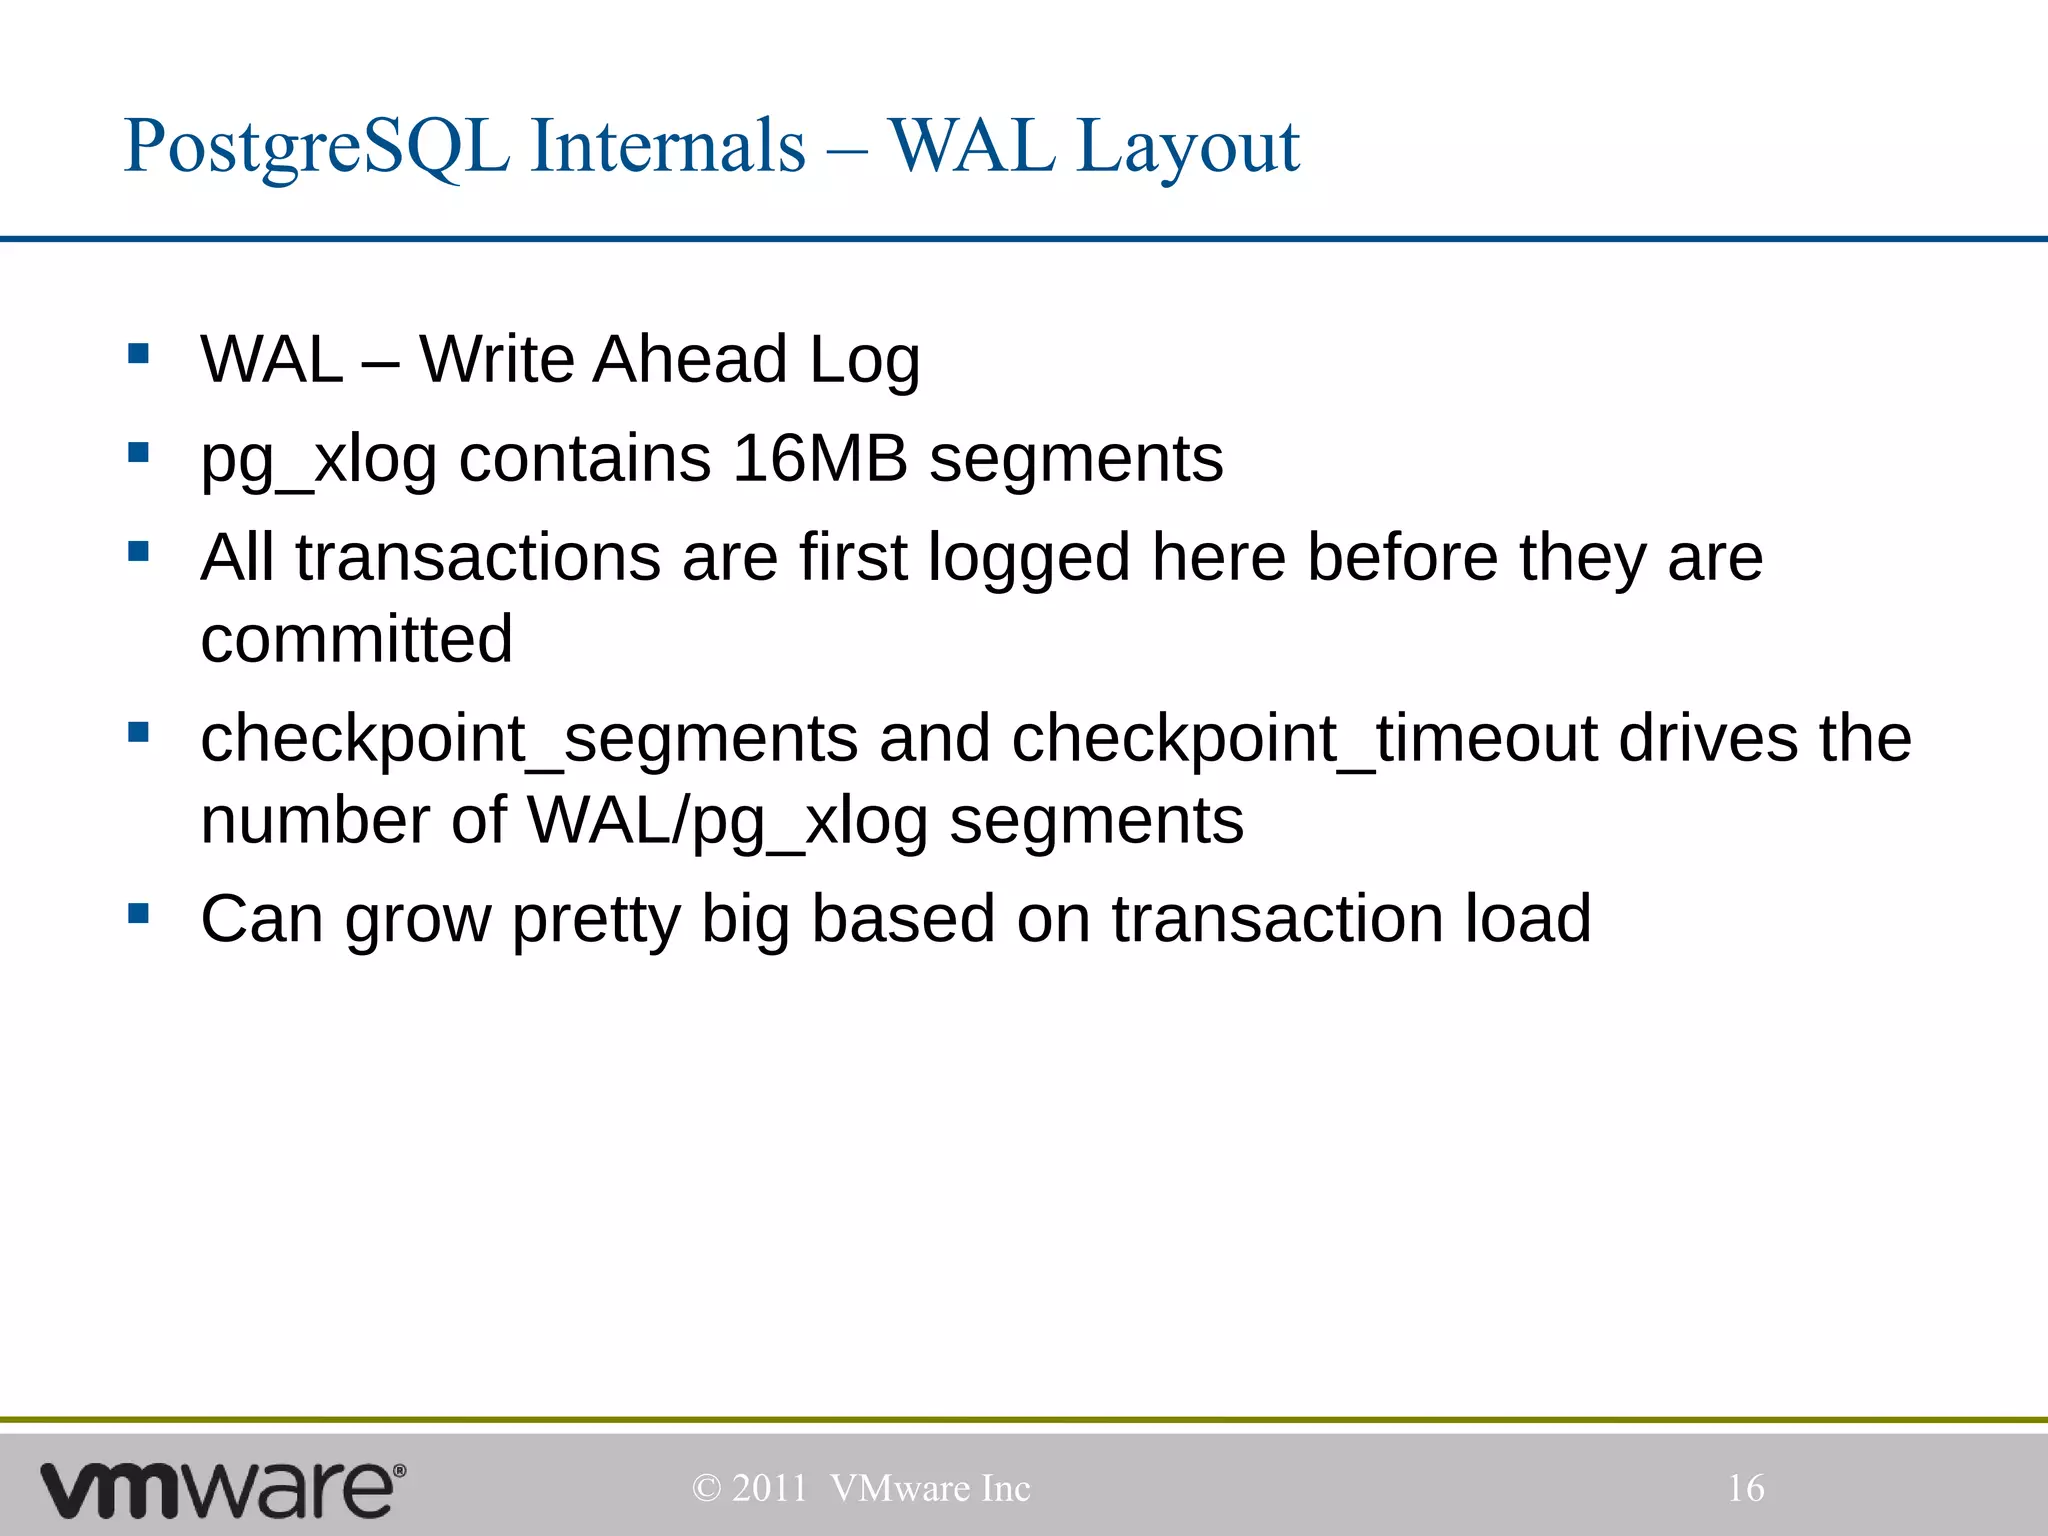
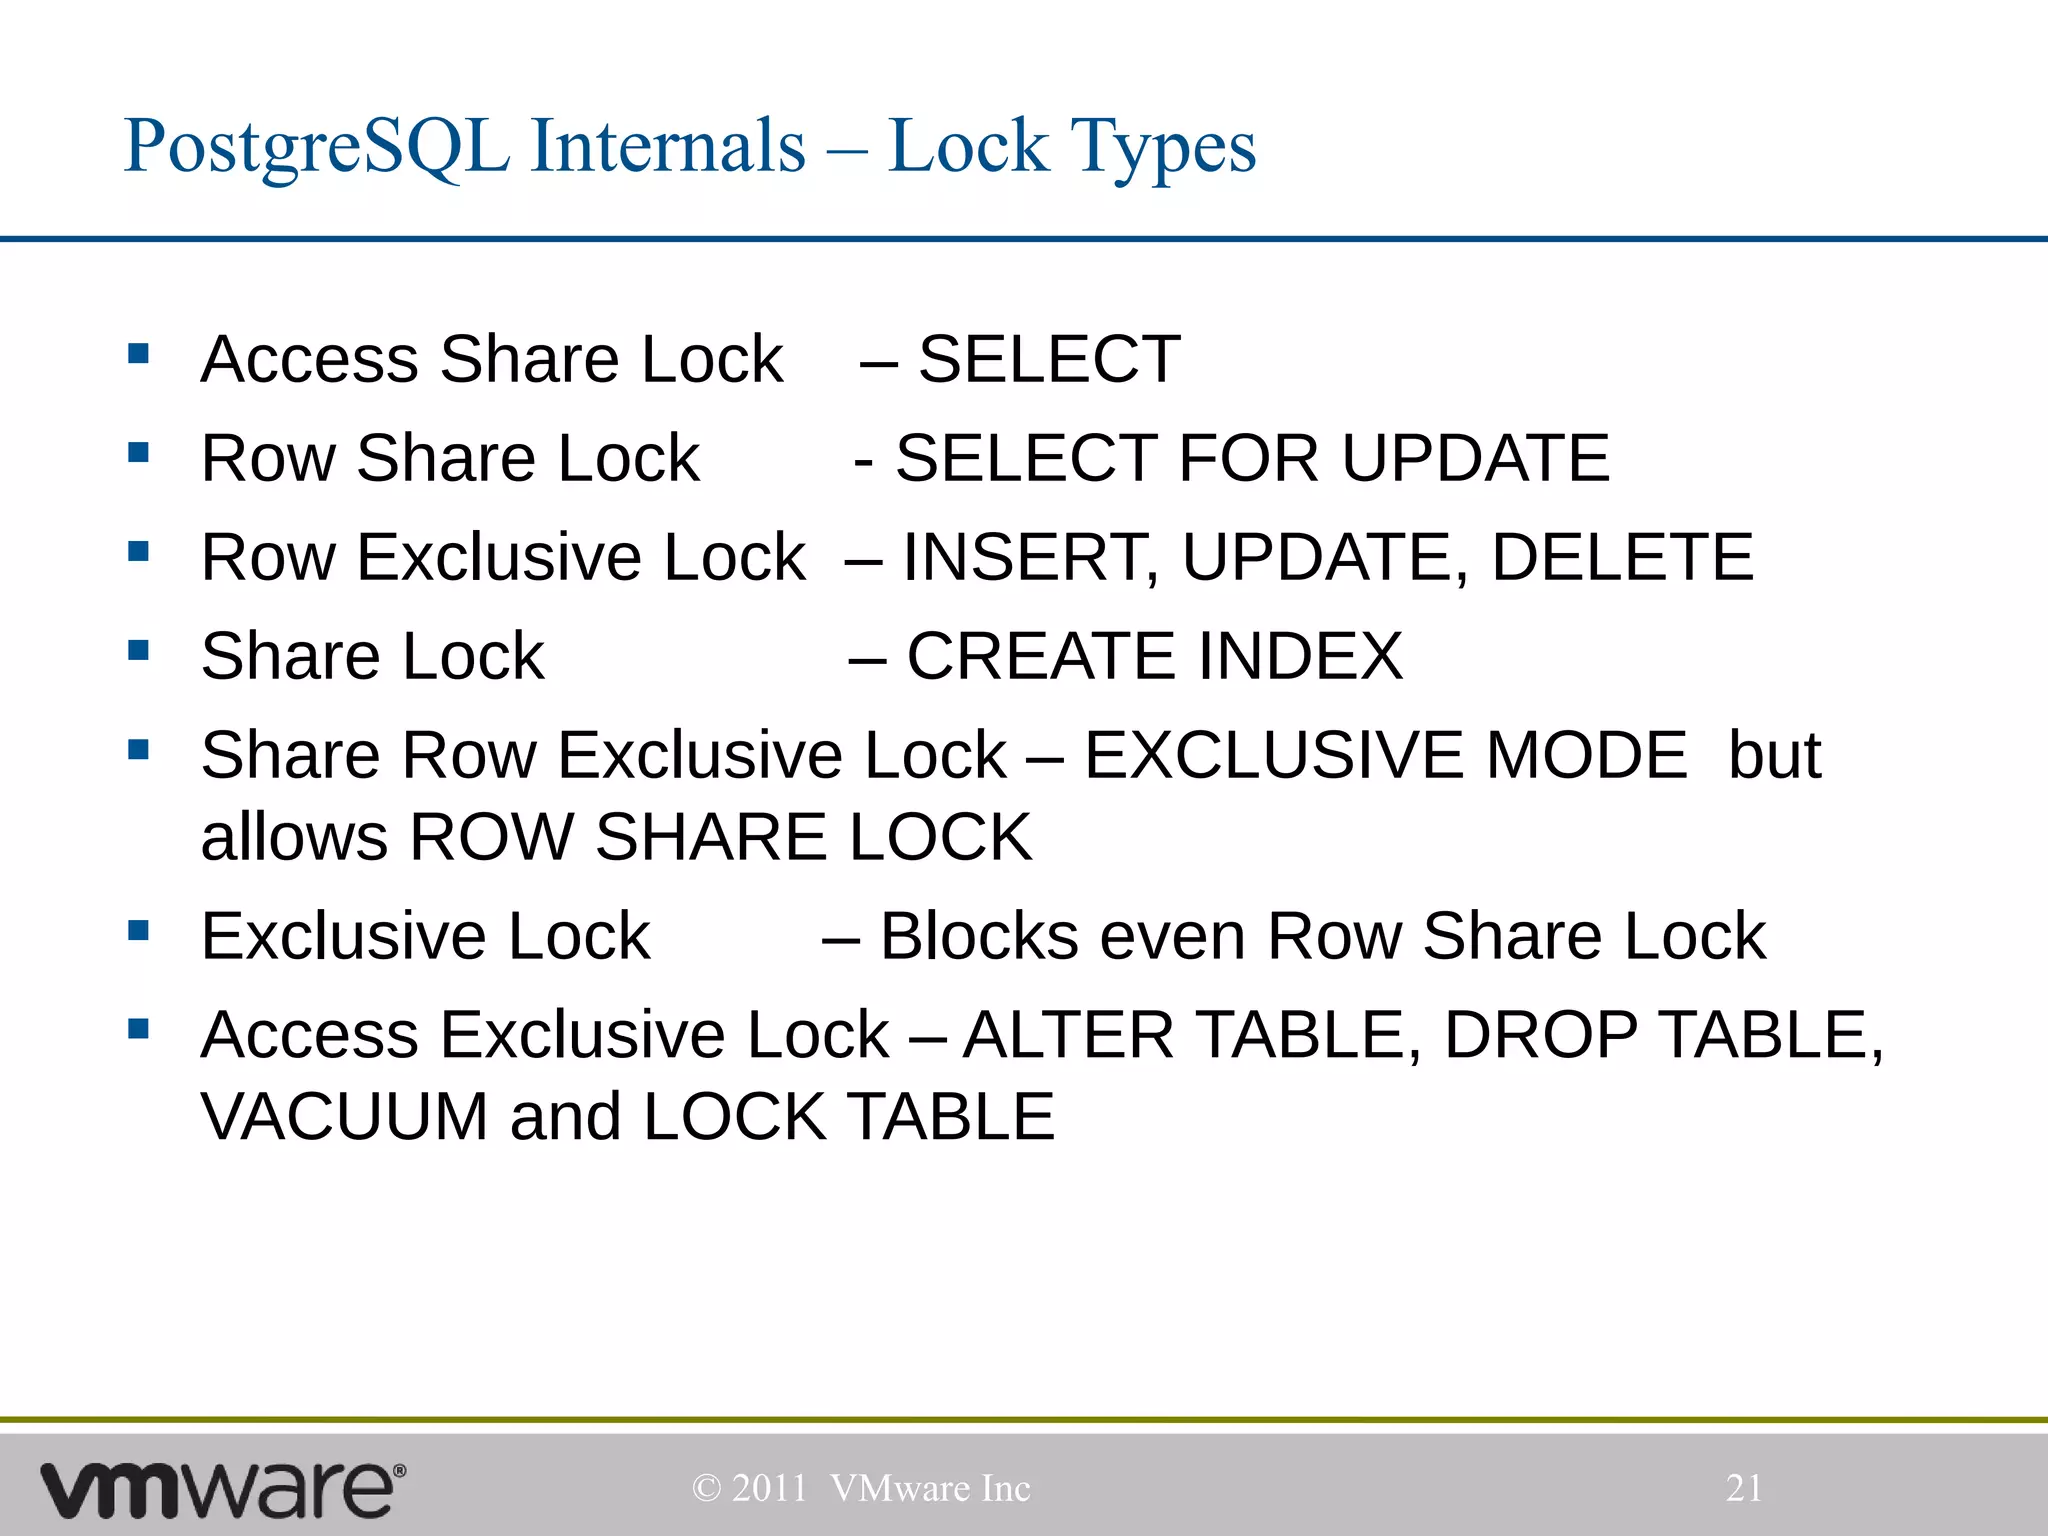
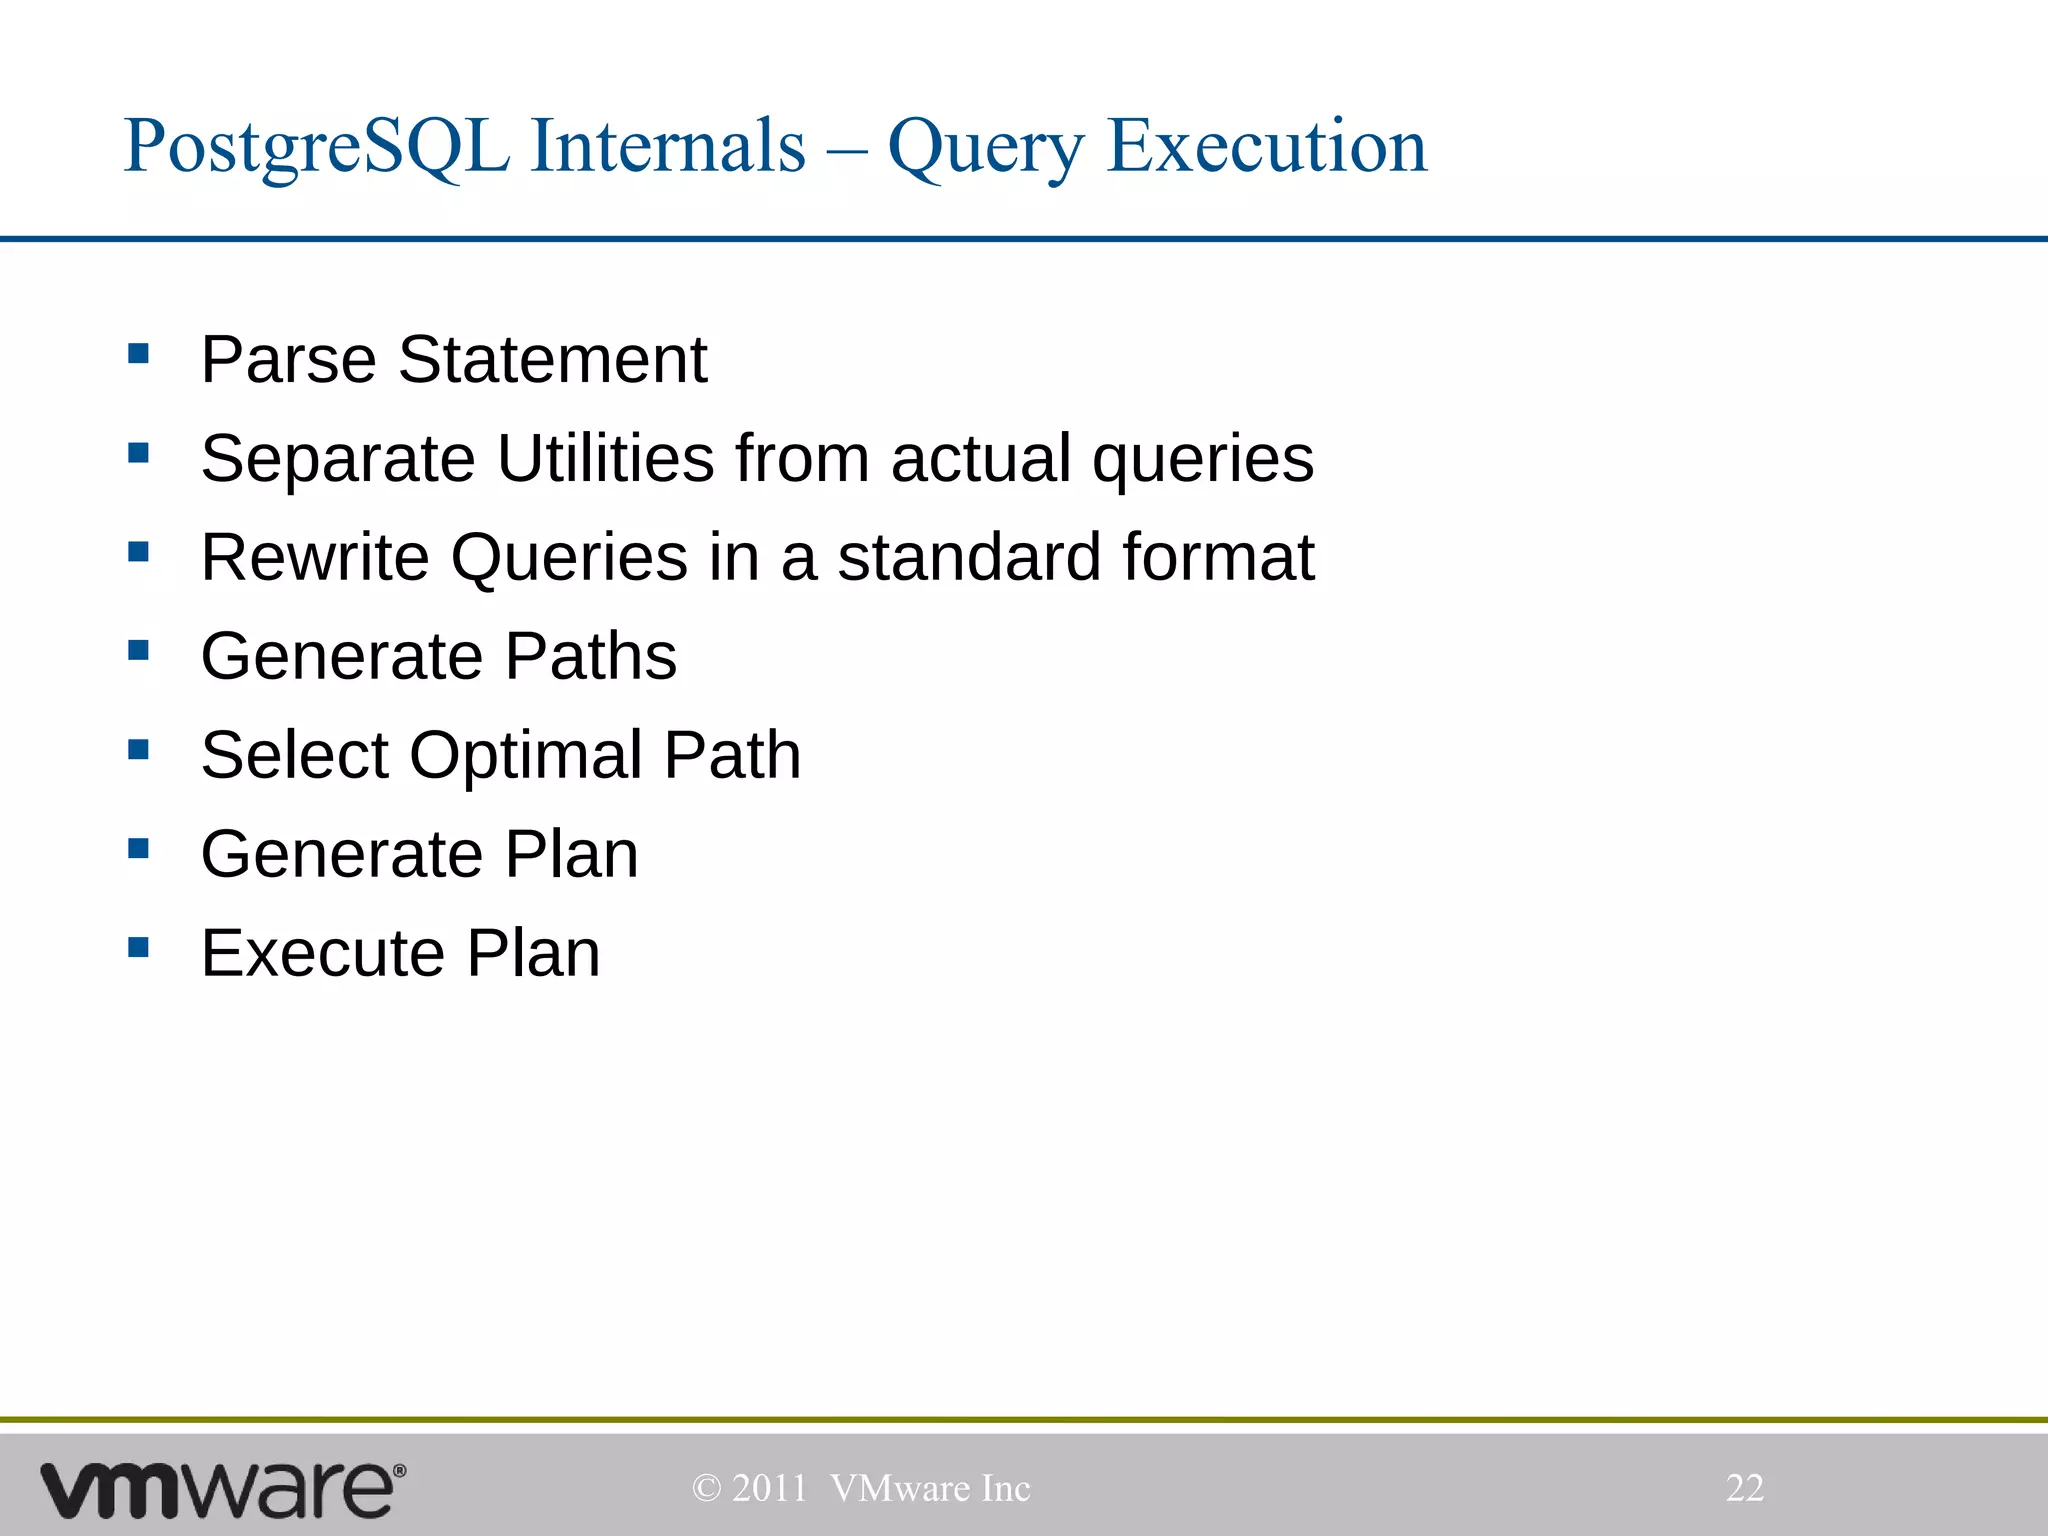
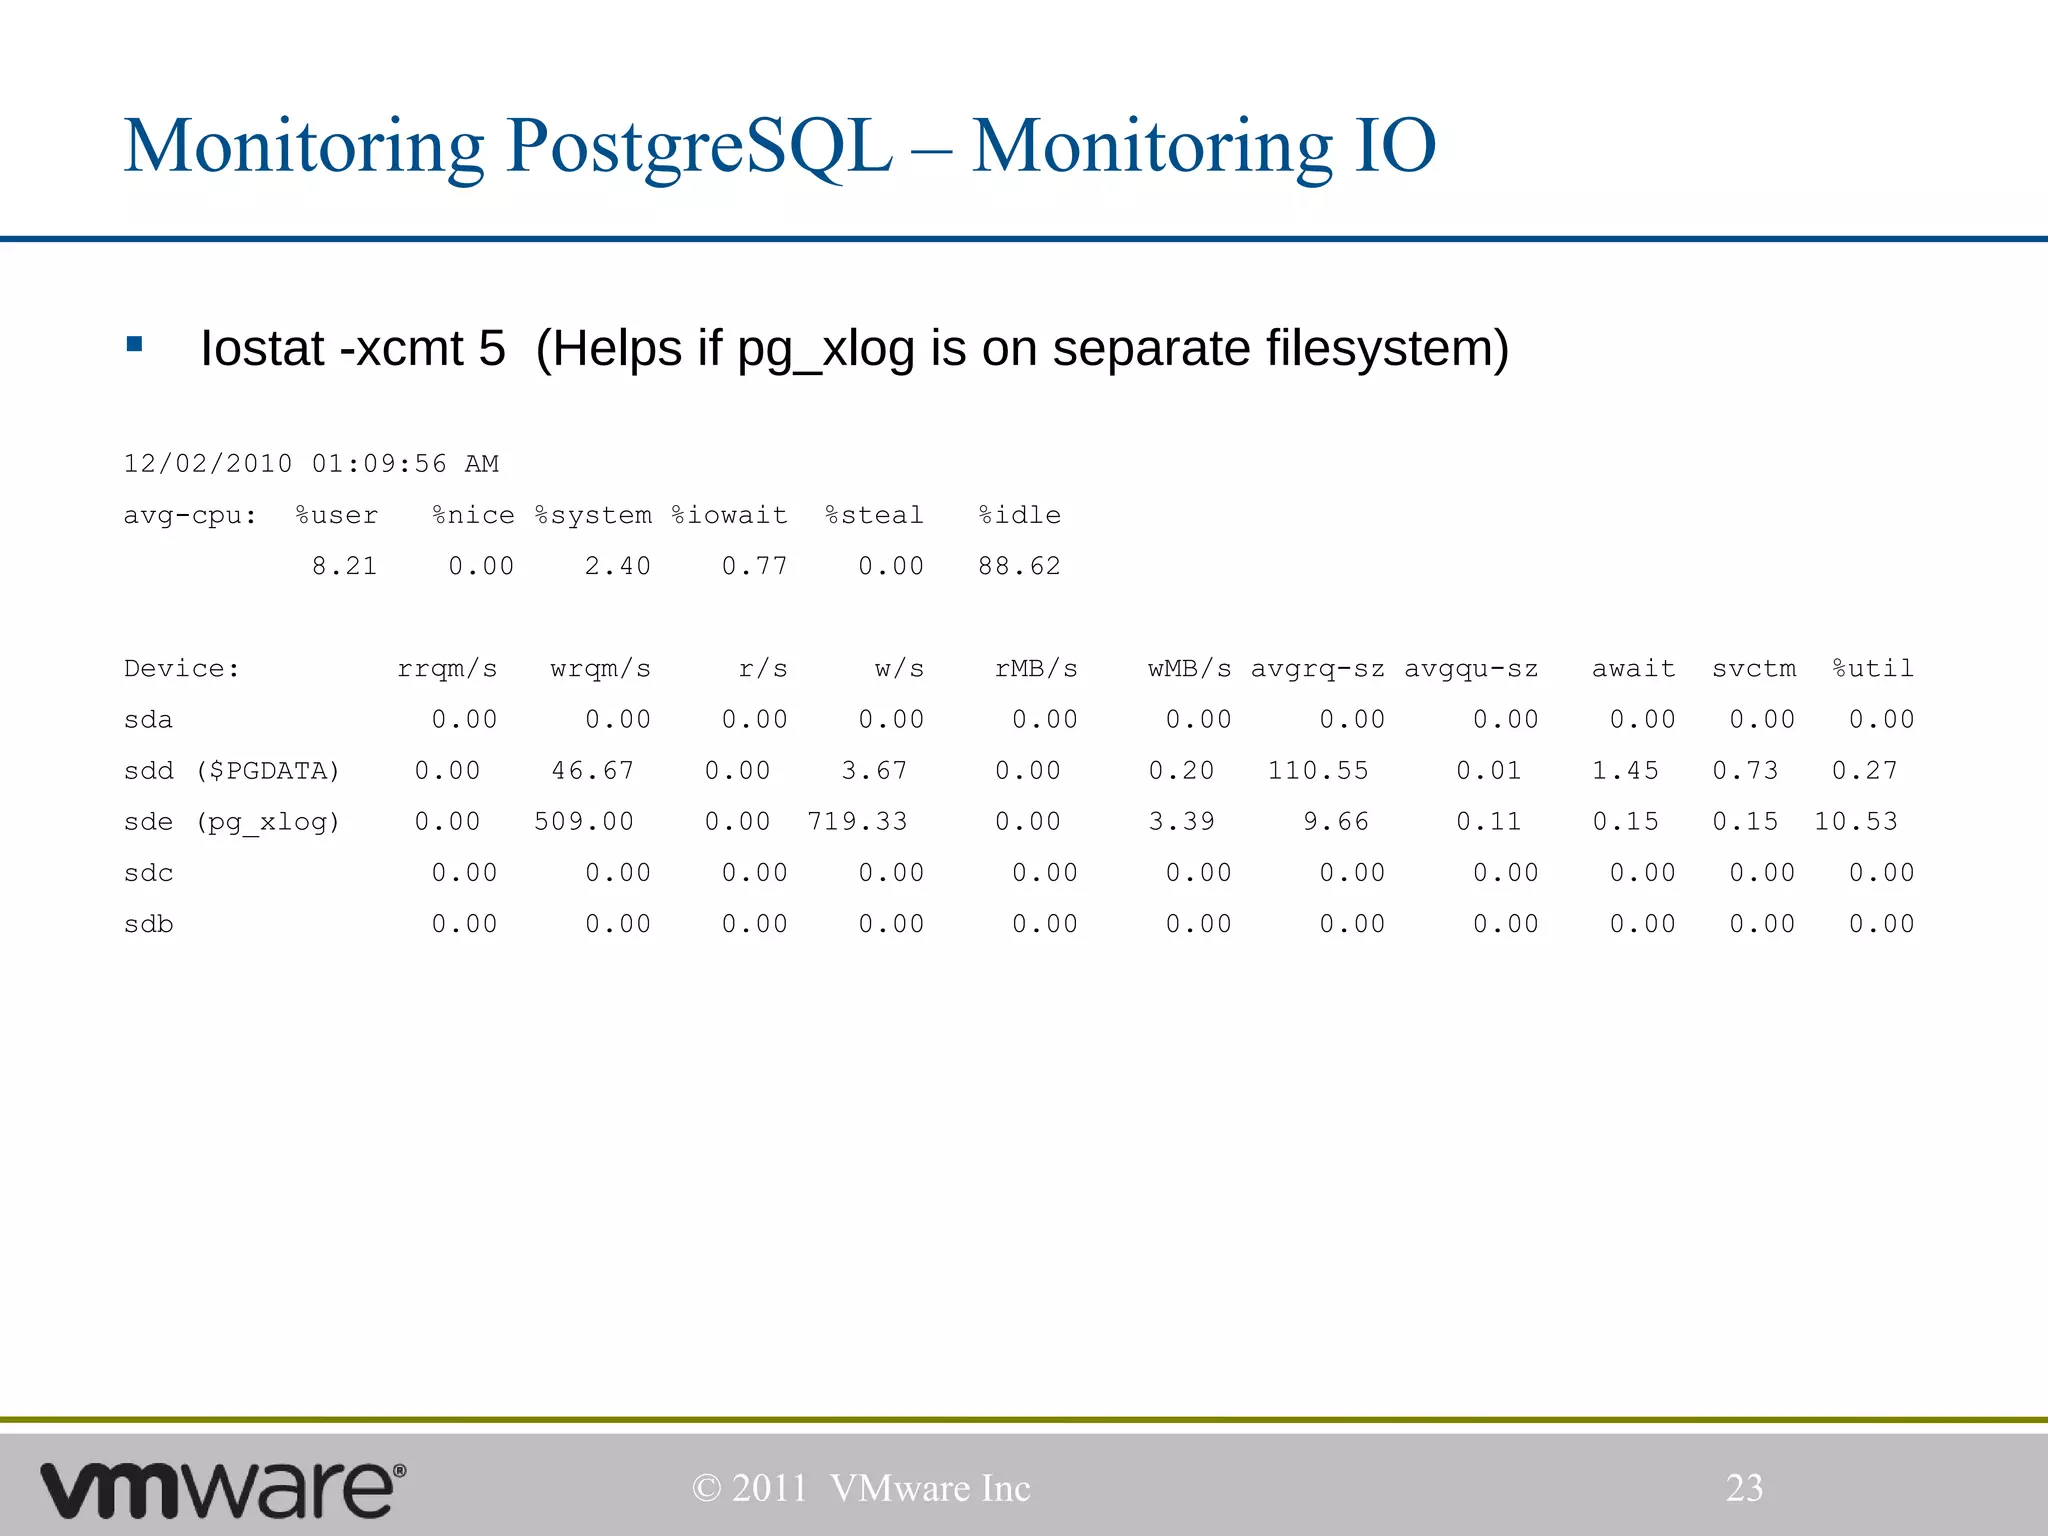
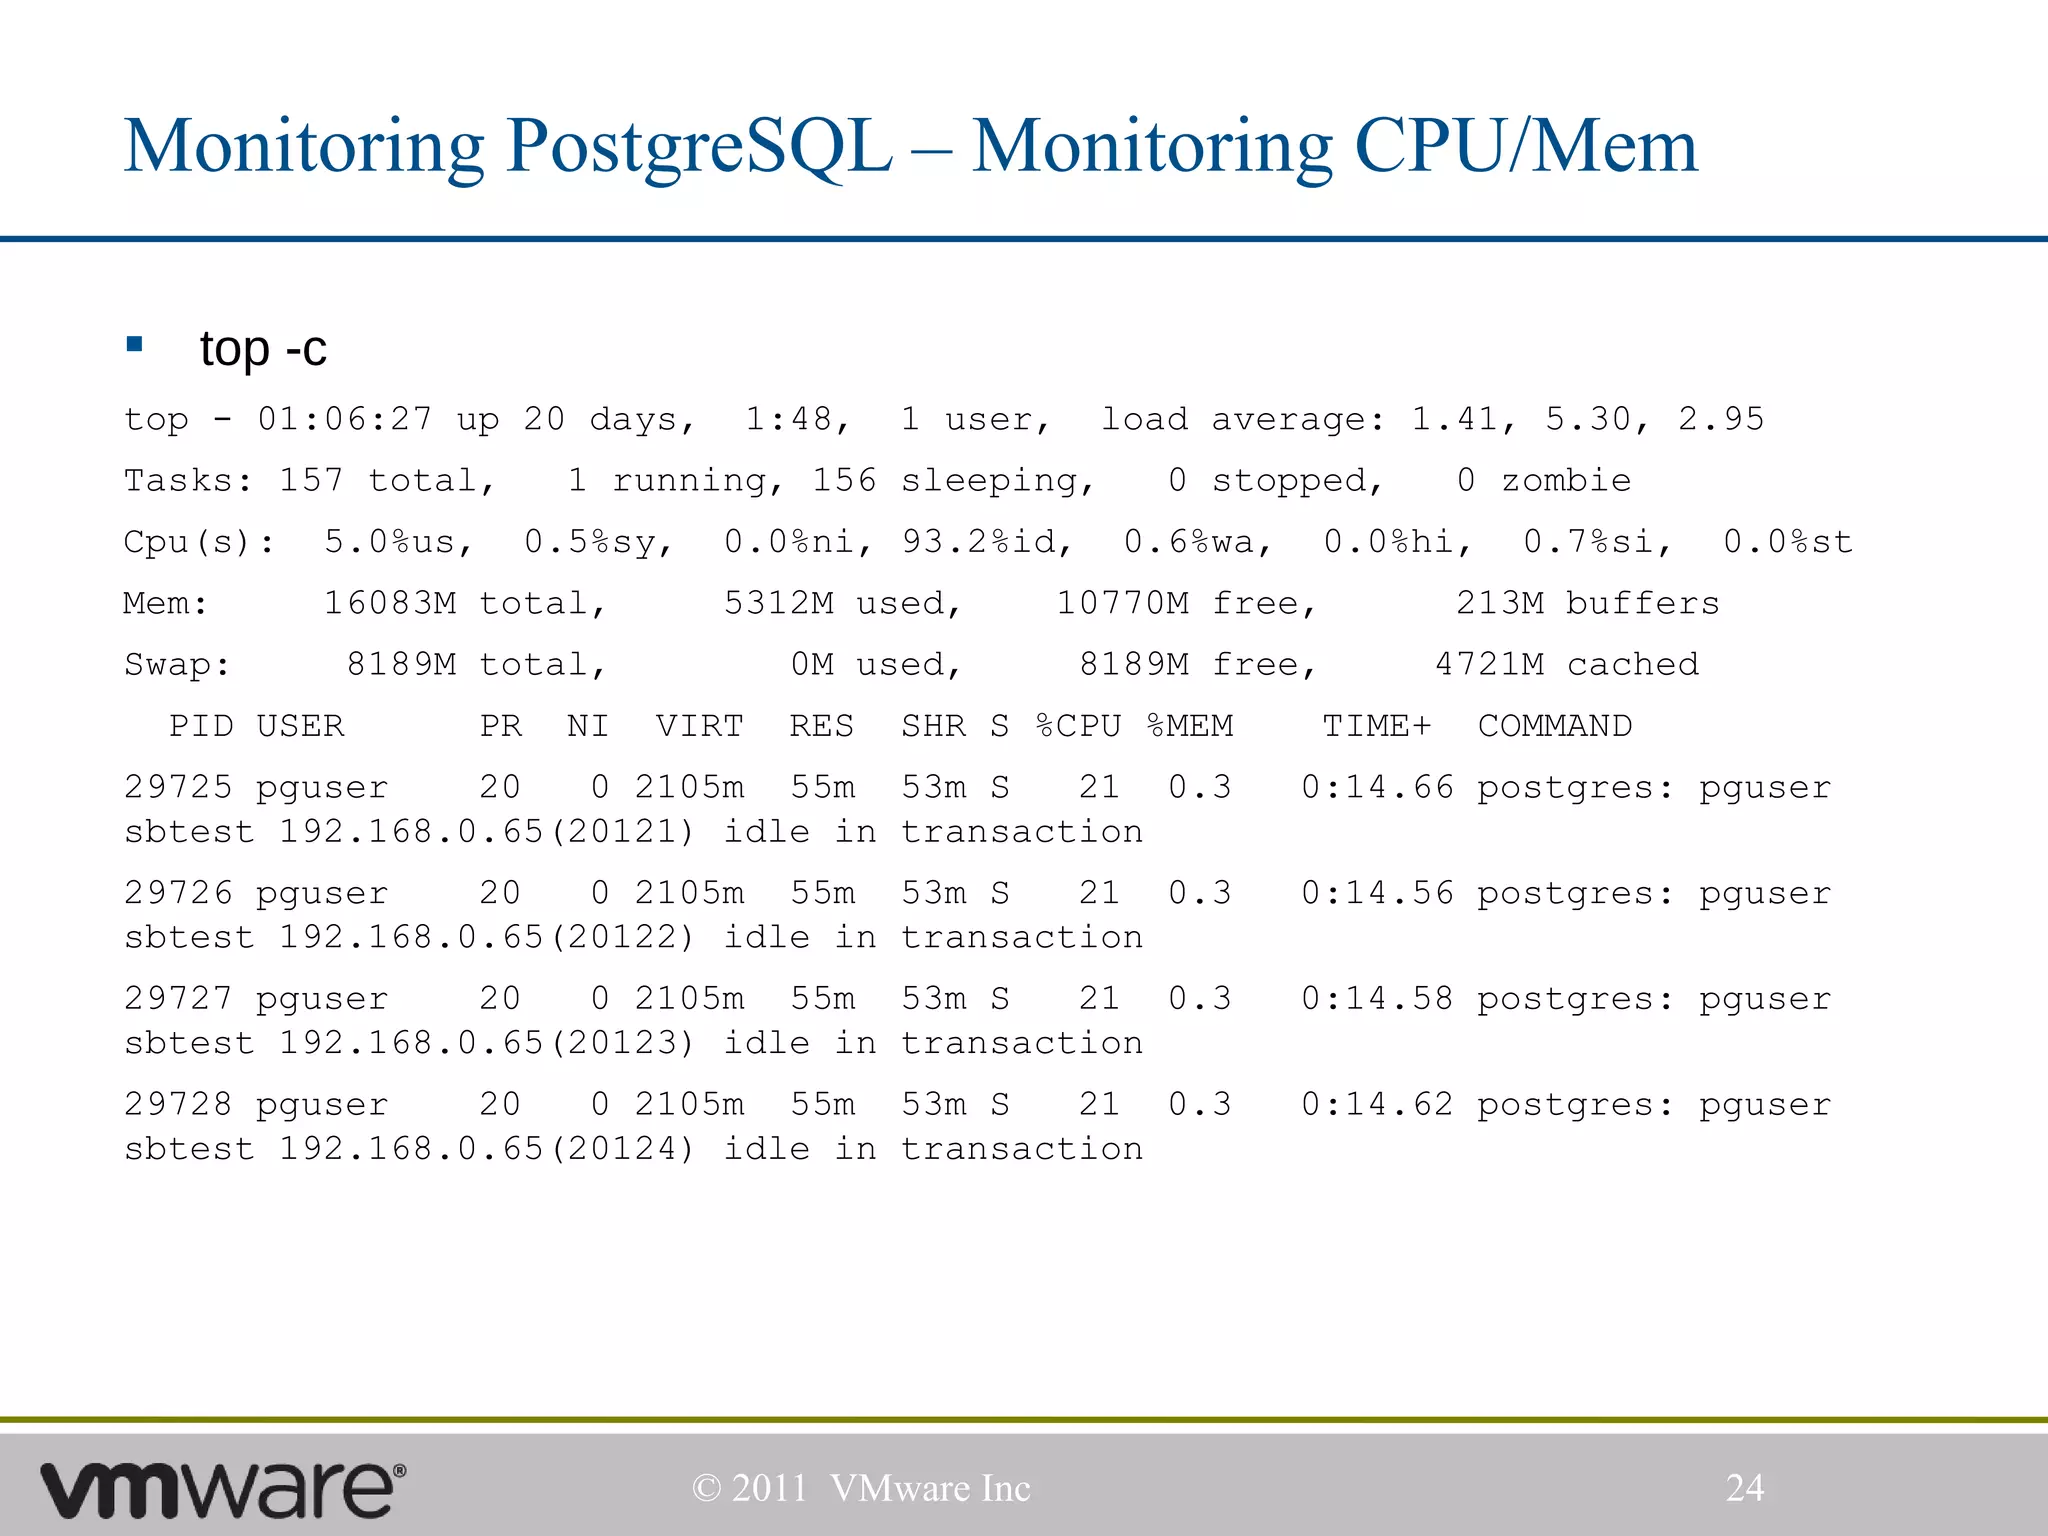
This document provides an introduction and overview of PostgreSQL for system administrators. It covers why to use open source databases like PostgreSQL, a quick start guide to installing and configuring PostgreSQL, PostgreSQL internals like file system layout and processes, and monitoring PostgreSQL performance using tools like iostat and top. The presentation is aimed at helping system administrators get started with managing PostgreSQL databases.


