Downloaded 636 times


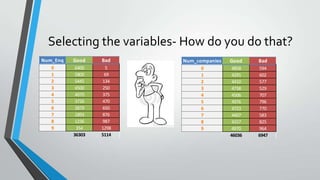
![Information value
%Good %Bad
[x] [Y]
< 5 1850 150 29% 5% 6.31 0.25 0.80 0.20
5-30 1600 400 25% 12% 2.05 0.13 0.31 0.04
31 - 60 1200 600 19% 18% 1.02 0.00 0.01 0.00
60 - 90 900 900 14% 28% 0.51 (0.14) -0.29 0.04
>= 91 800 1200 13% 37% 0.34 (0.24) -0.47 0.11
Total 6350 3250 0.39
IV
Utilizatio
n %
# of
Good
# of Bad
%Good /
%Bad
X -Y
WOE =
Log (X/Y)](https://image.slidesharecdn.com/introductiontopredictivemodelingv1-130520024629-phpapp02/85/Introduction-to-predictive-modeling-v1-28-320.jpg)


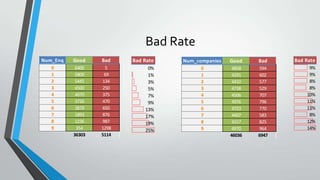
![Information value
%Good %Bad
[x] [Y]
< 5 1850 150 29% 5% 6.31 0.25 0.80 0.20
5-30 1600 400 25% 12% 2.05 0.13 0.31 0.04
31 - 60 1200 600 19% 18% 1.02 0.00 0.01 0.00
60 - 90 900 900 14% 28% 0.51 (0.14) -0.29 0.04
>= 91 800 1200 13% 37% 0.34 (0.24) -0.47 0.11
Total 6350 3250 0.39
IV
Utilizatio
n %
# of
Good
# of Bad
%Good /
%Bad
X -Y
WOE =
Log (X/Y)](https://image.slidesharecdn.com/introductiontopredictivemodelingv1-130520024629-phpapp02/75/Introduction-to-predictive-modeling-v1-28-2048.jpg)


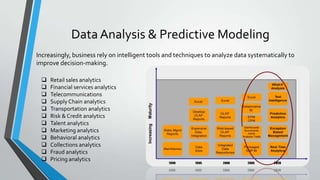
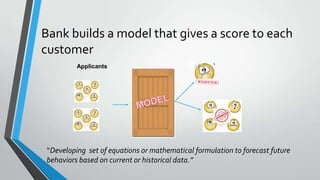
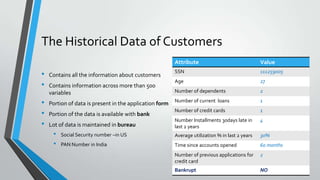
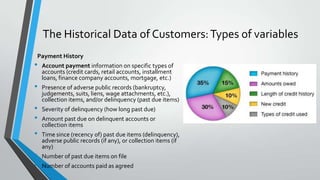
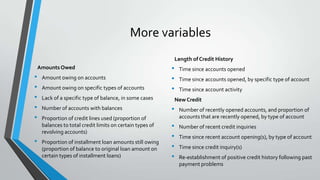
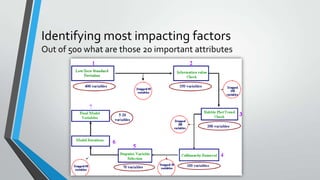
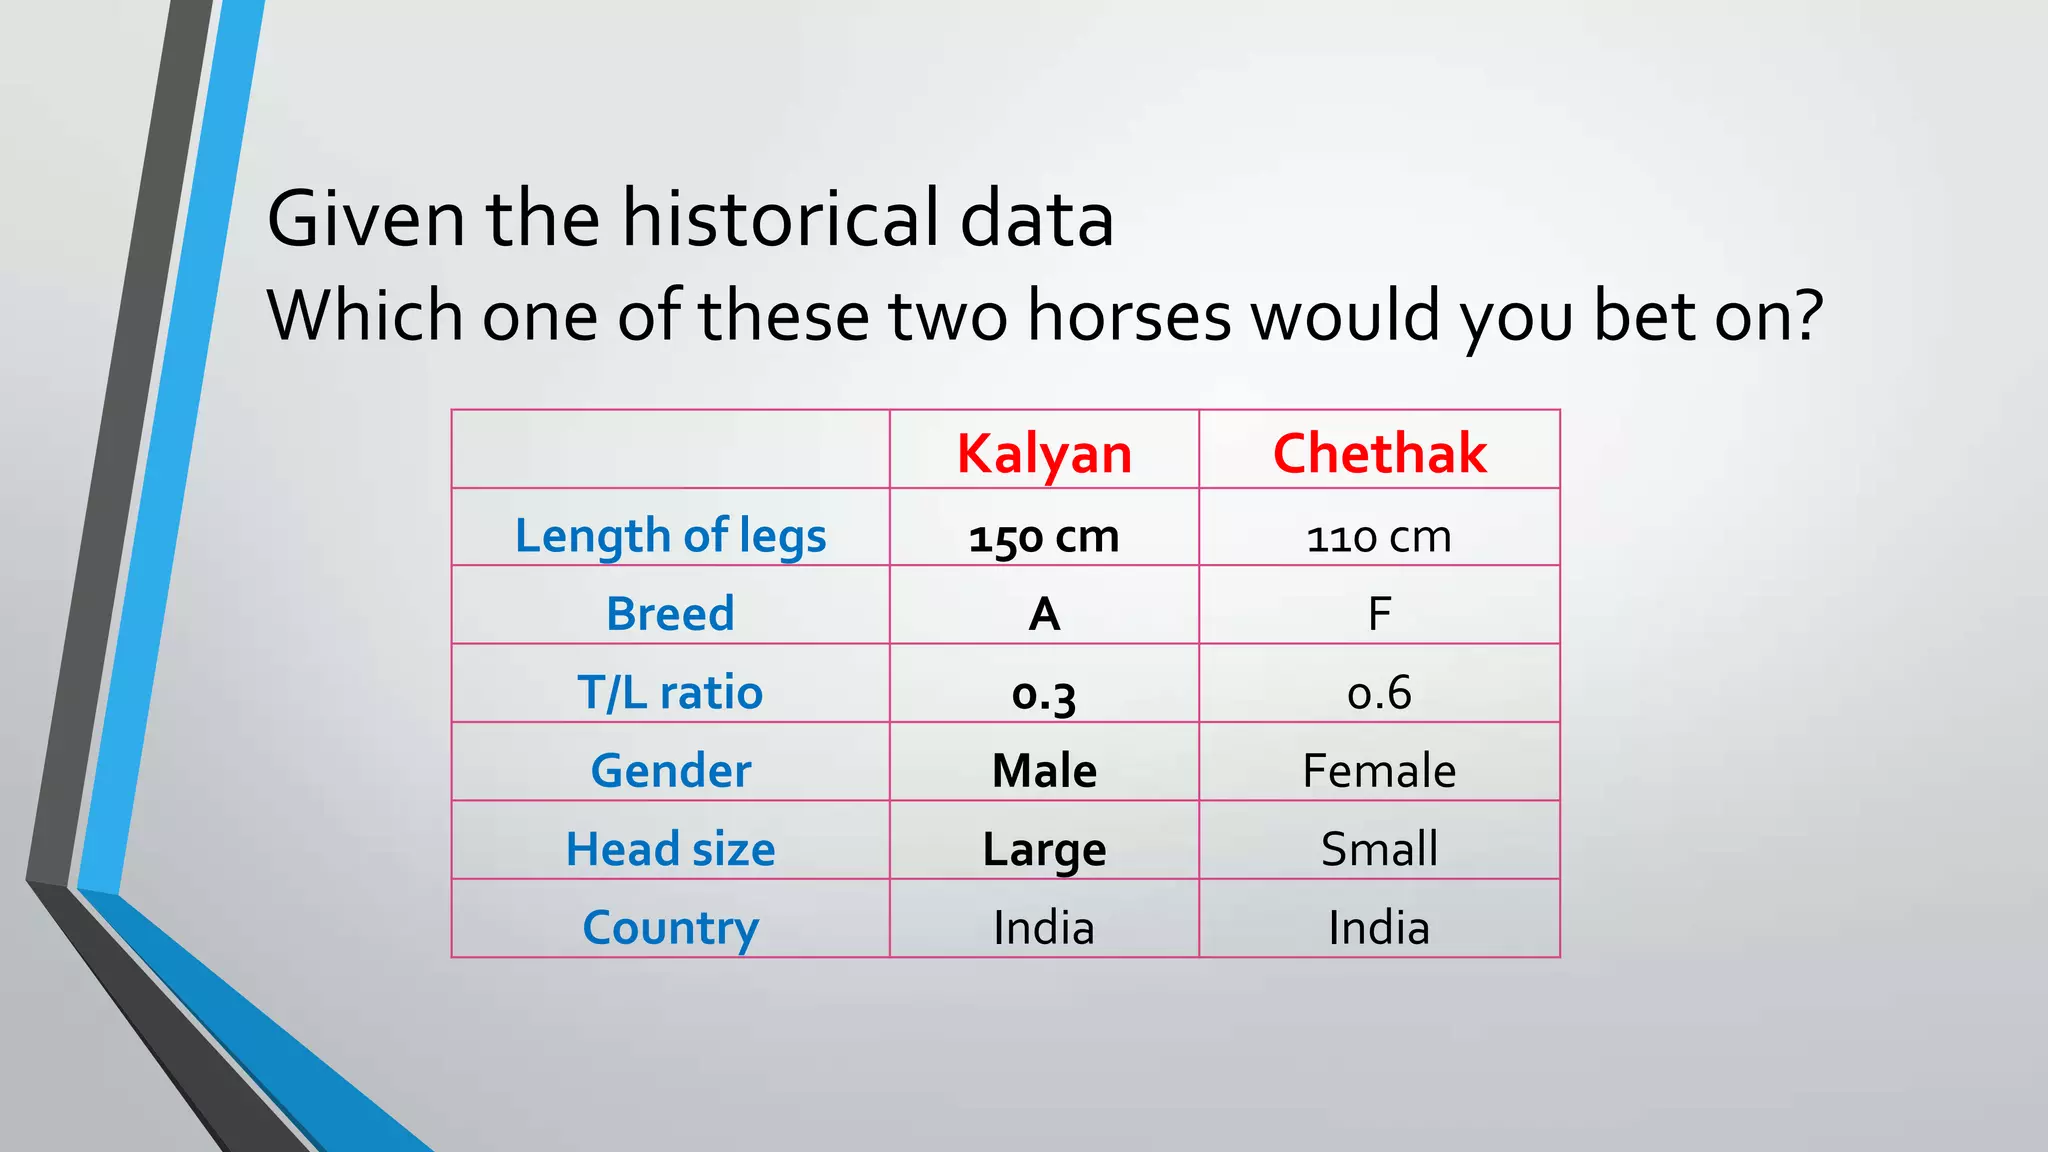
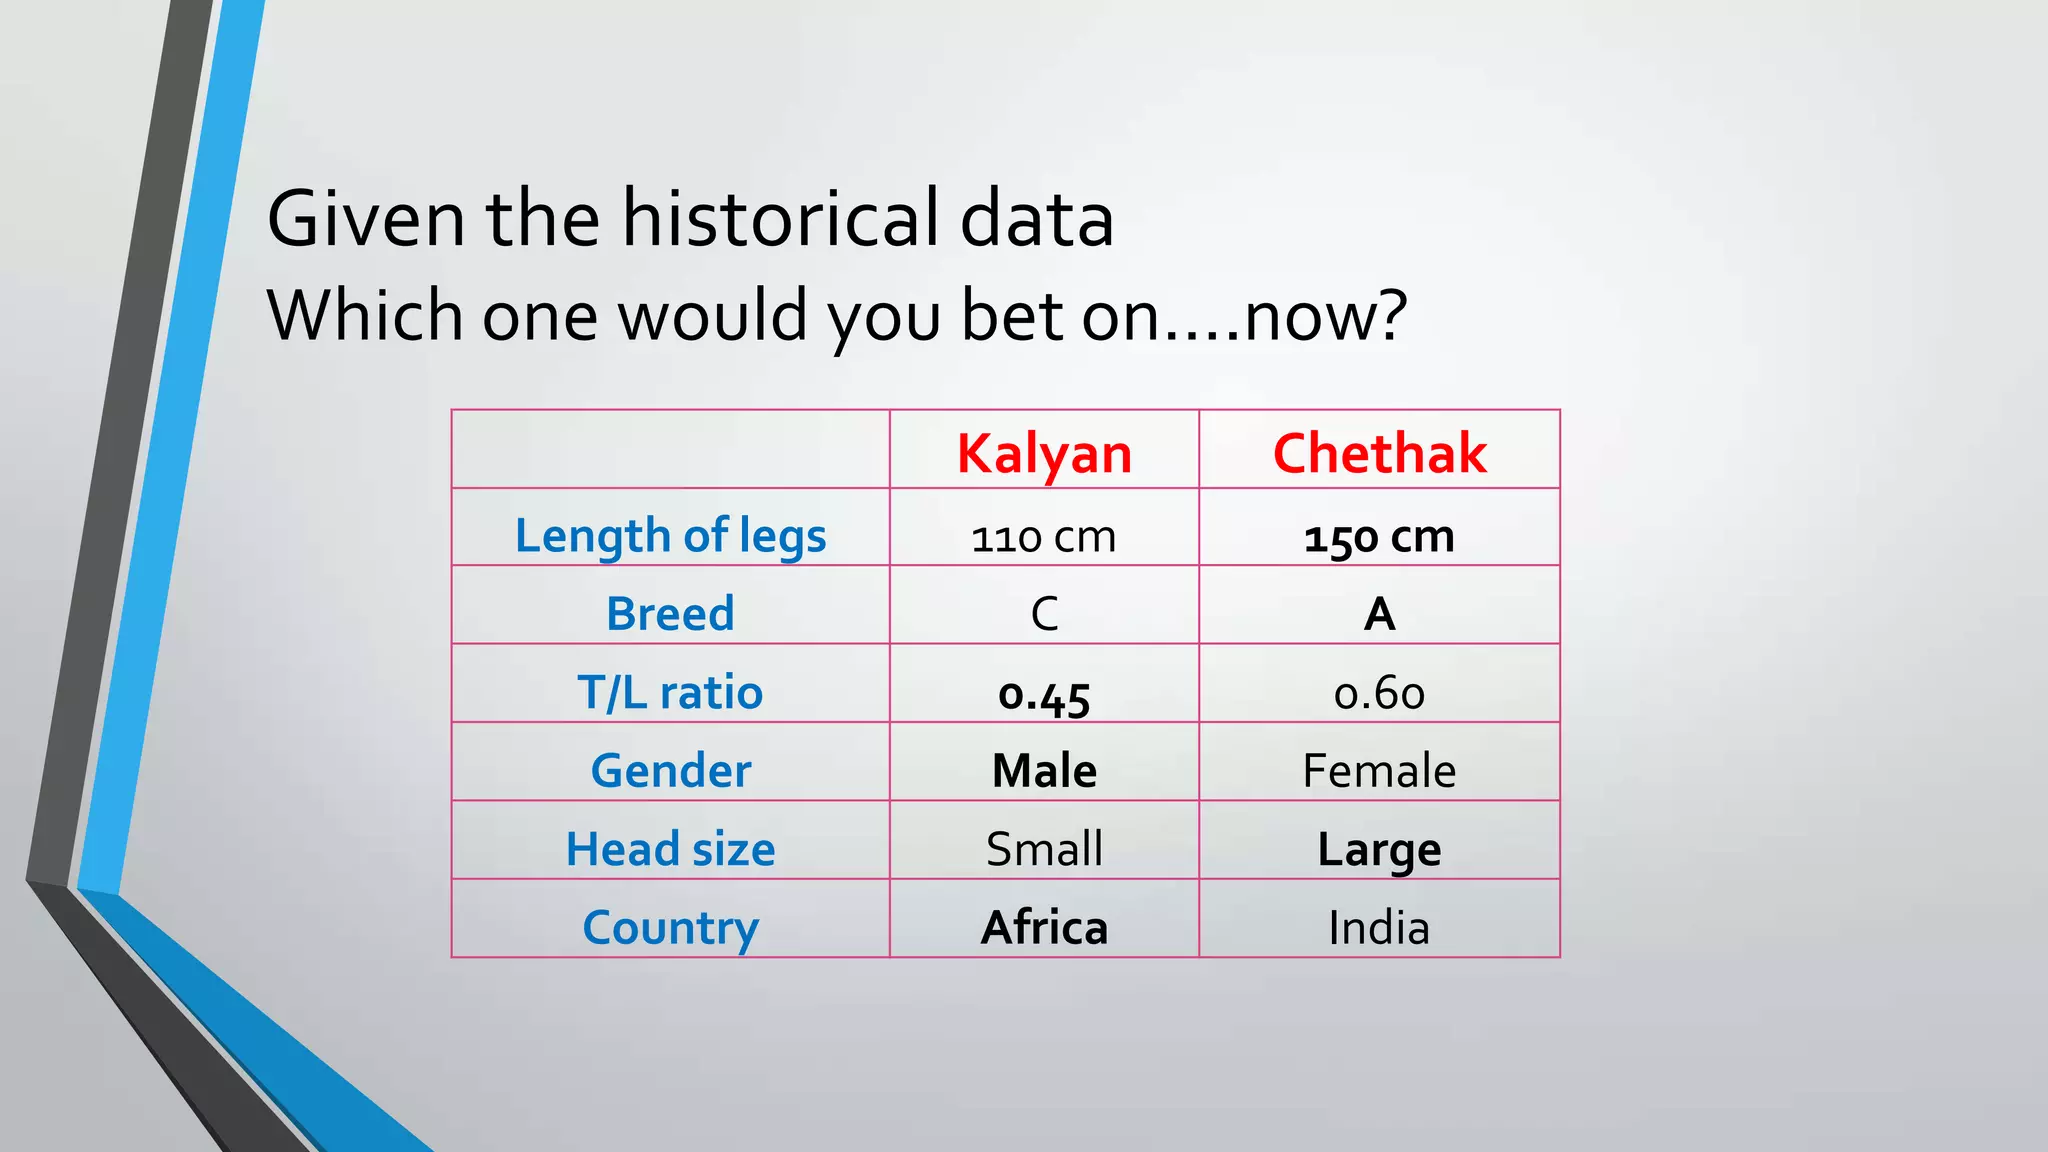
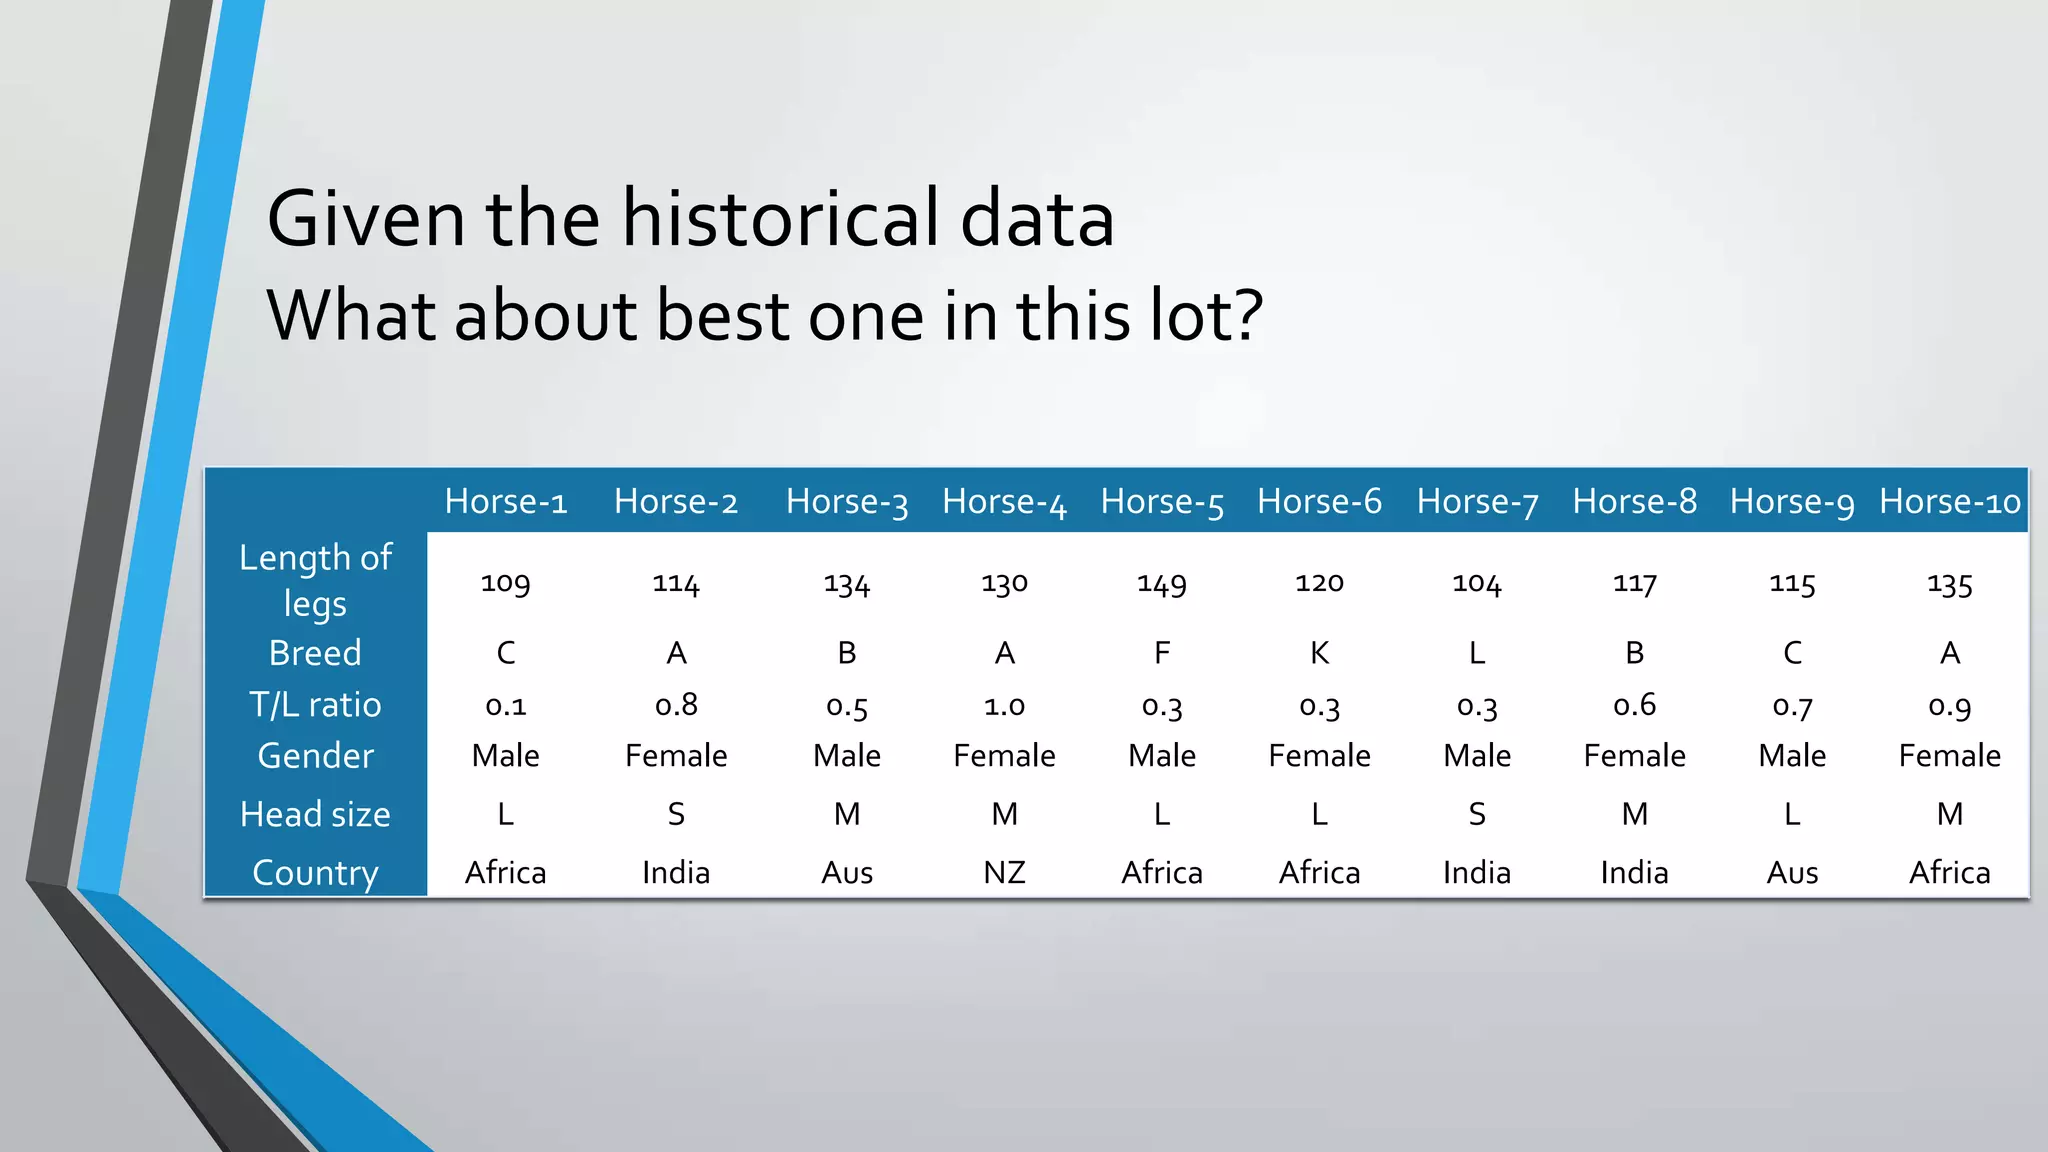
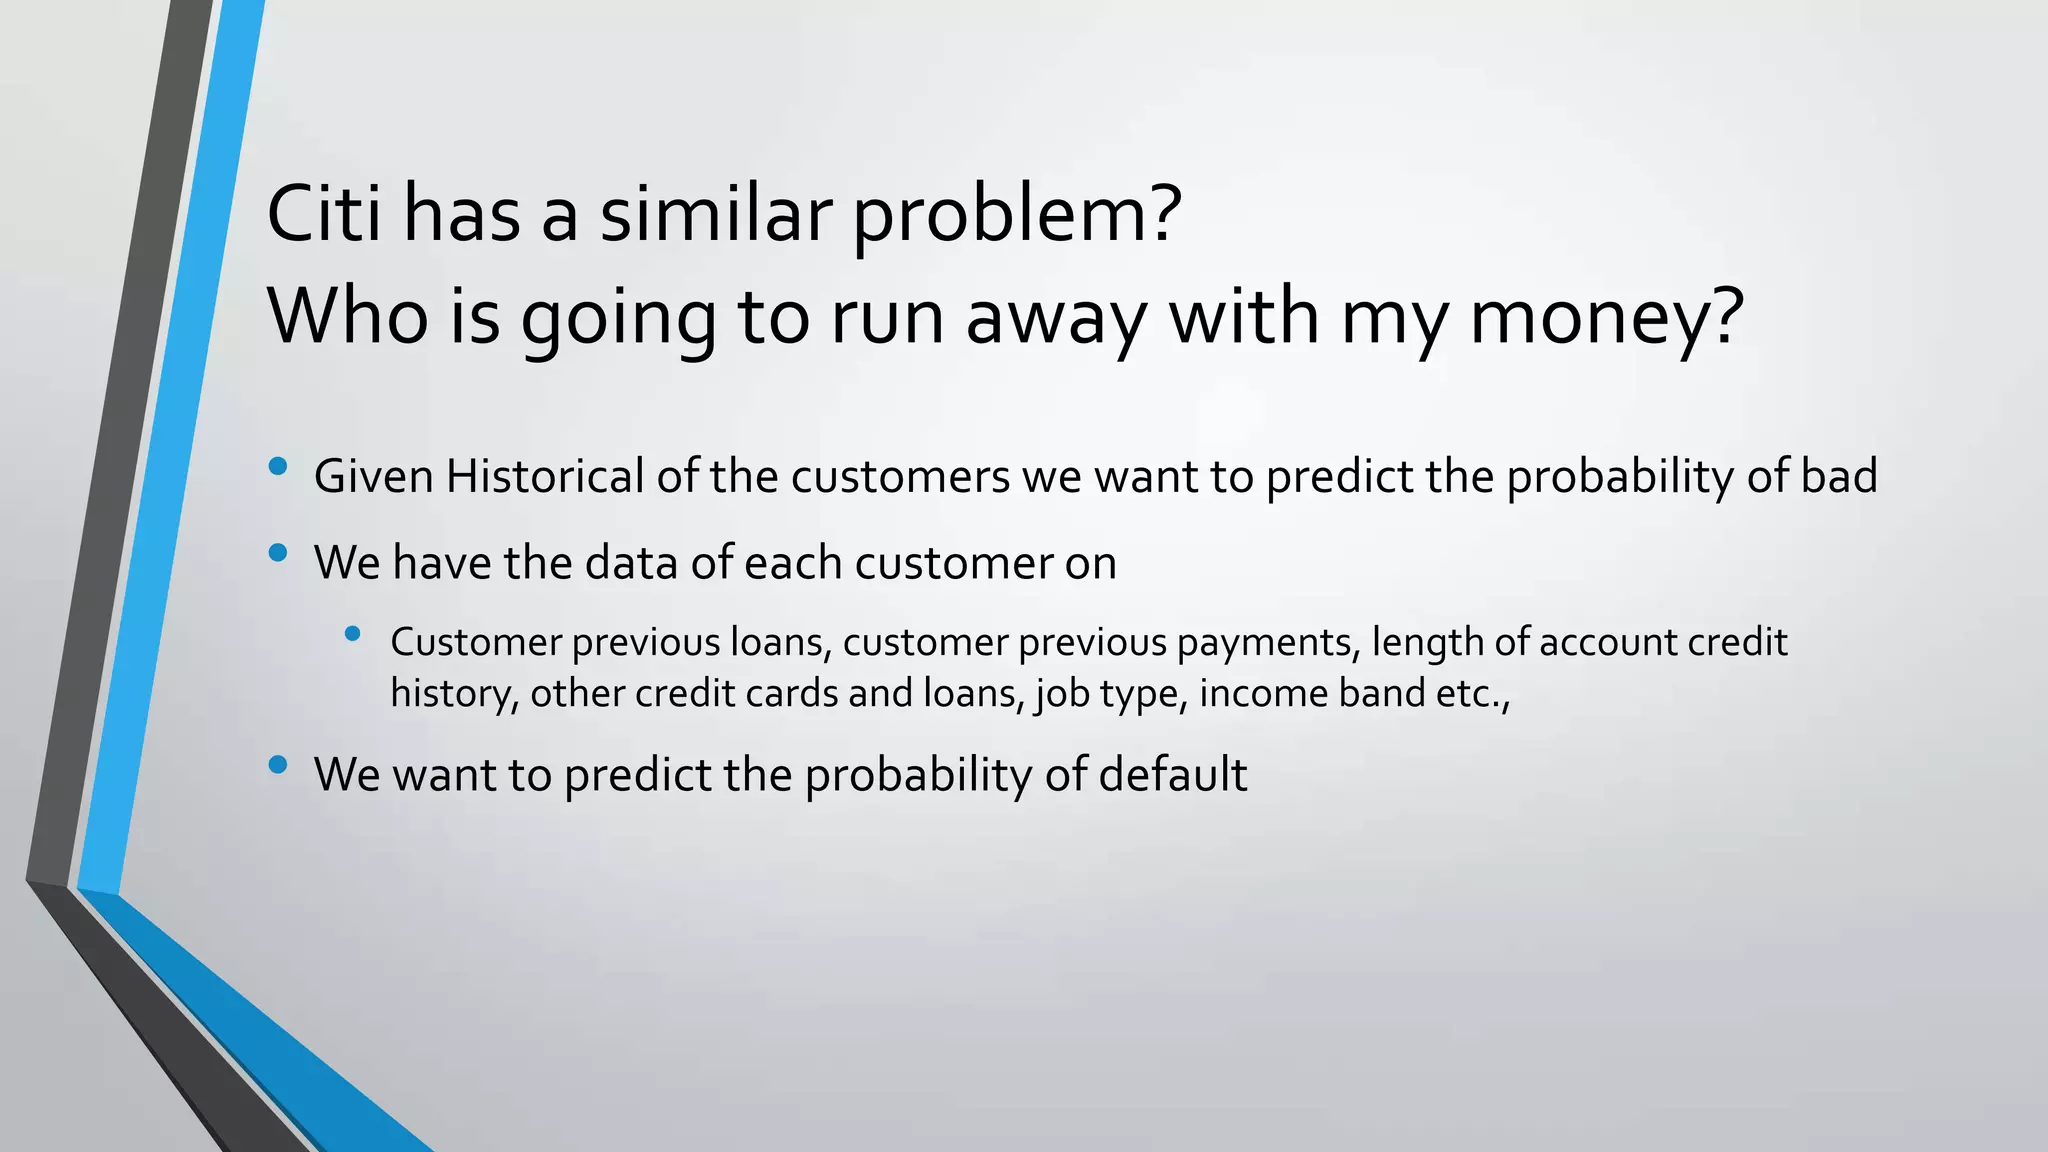
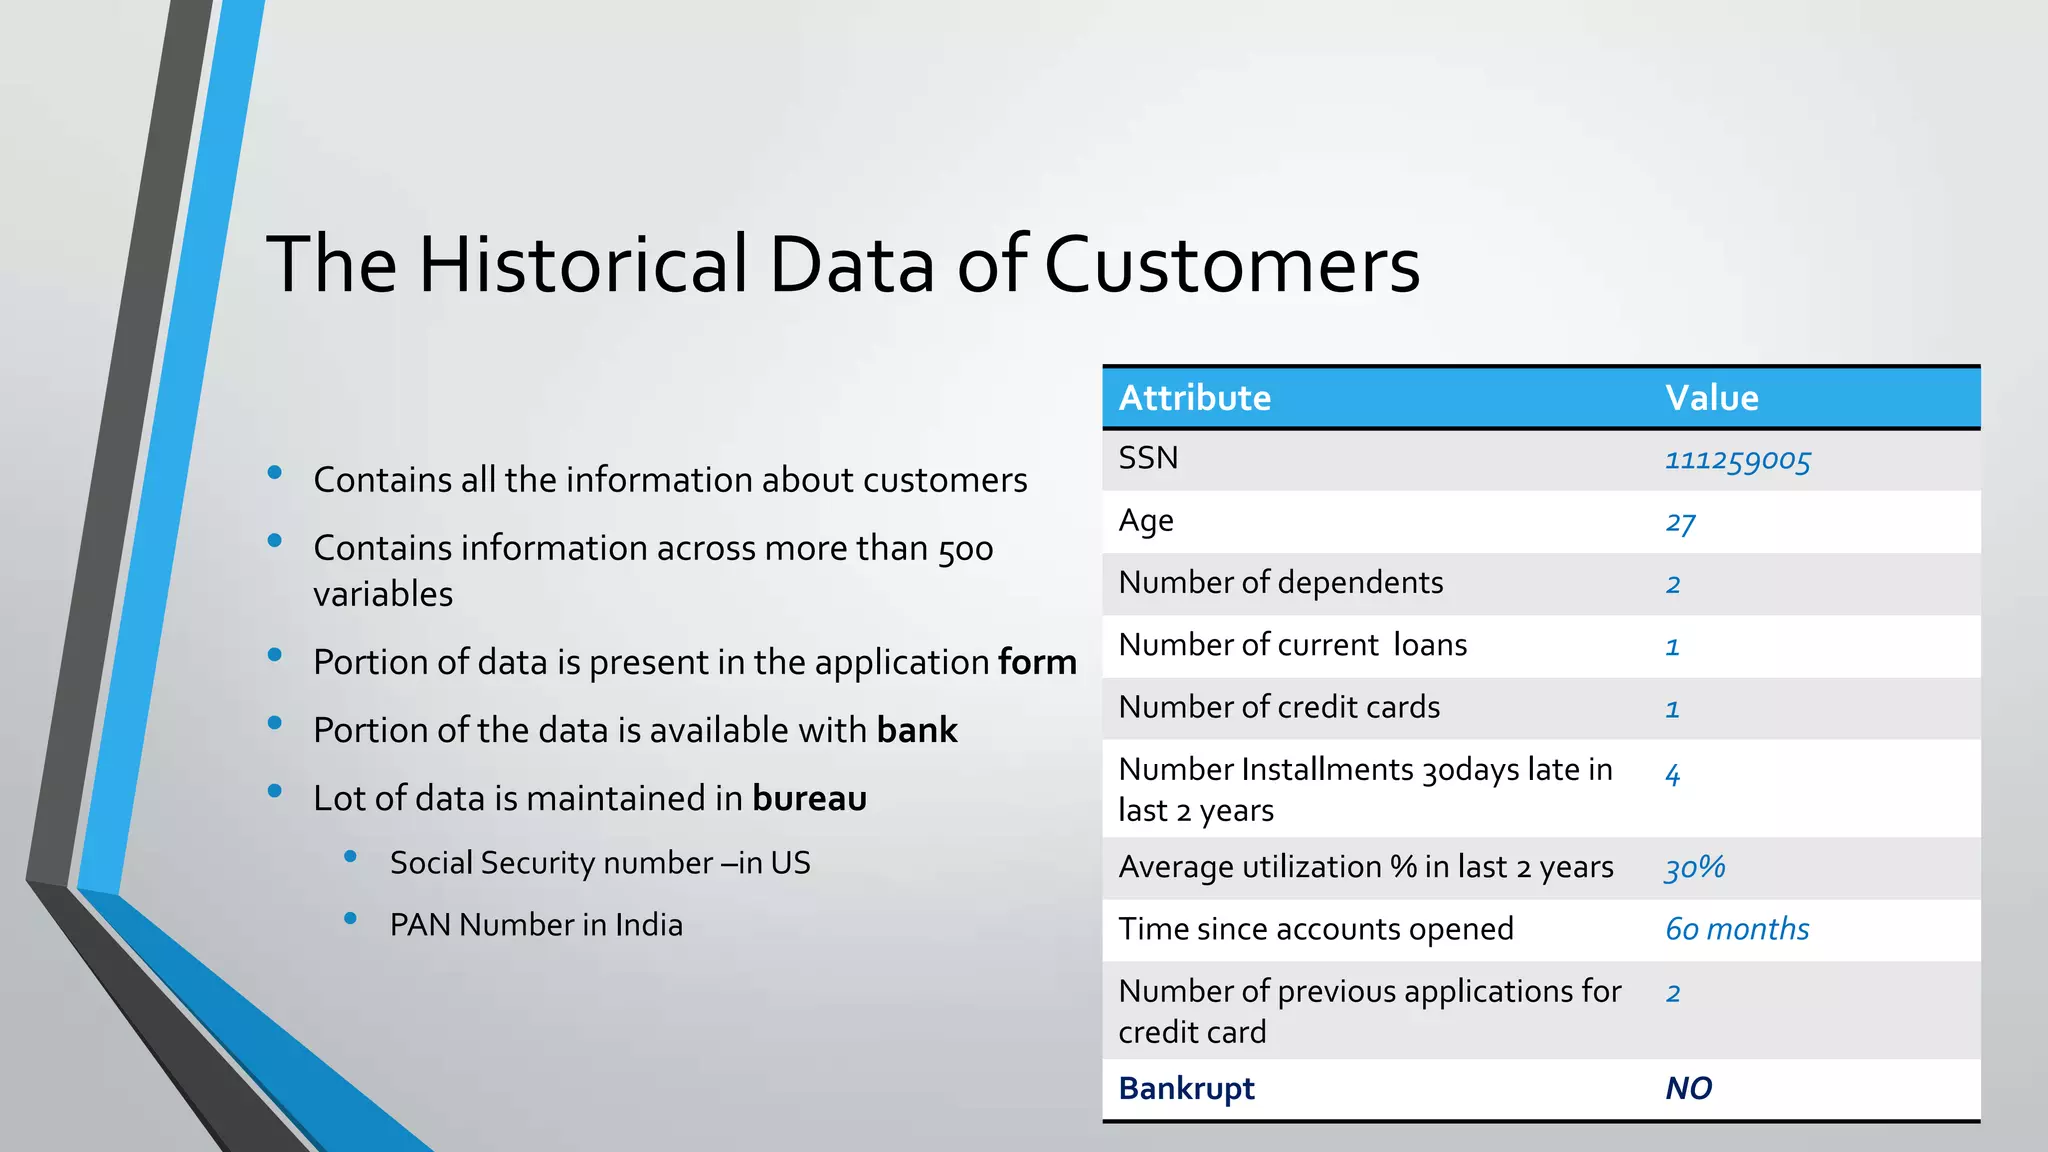
The document introduces predictive modeling, explaining its application in various business sectors, especially in credit risk assessment. It describes how banks use historical data to predict loan application outcomes, employing a statistical model to forecast customer behavior and potential defaults. The document also outlines the processes involved in model building, including data analysis and variable selection, with real-world examples illustrating the importance of predictive analytics.


