Downloaded 45 times


![JSON Styling
● Easy to manipulate using standard
web tools
● Easy to read and write
JSON Styling
{
"version": 8,
"layers": [
{
"id": "default_point",
"type": "circle",
"source": "test-source",
"source-layer": "place_label",
"layout": {
"visibility": "visible"
},
"paint": {
"circle-color": "#FF0000",
"circle-opacity": 1,
"circle-radius": 6,
"circle-stroke-opacity": 0,
}
}
]
}](https://image.slidesharecdn.com/mapboxstylesingeoserverandopenlayers-170829181114/85/Map-box-styles-in-GeoServer-and-OpenLayers-8-320.jpg)

![Root Properties
• Version
• Name
• Sprite
• Glyph
• Sources
• Layers
MapBox Styles - Root Properties
{
"version": 8,
"name": "Mapbox Streets",
"sprite": "mapbox://sprites/mapbox/streets-v8",
"glyphs": "mapbox://fonts/mapbox/{fontstack}/{range}.pbf",
"sources": {...},
"layers": [...]
}](https://image.slidesharecdn.com/mapboxstylesingeoserverandopenlayers-170829181114/85/Map-box-styles-in-GeoServer-and-OpenLayers-12-320.jpg)
![MapBox Styles - Layers
A Style’s layers property list all of the layers available in that style. The type of layer is specified by the
type property.
• Background
• Fill
• Line
• Symbol
• Raster
• Circle
• Fill Extrusion
"layers": [
{
"id": "water",
"source": "mapbox-streets",
"source-layer": "water",
"type": "fill",
"paint": {
"fill-color": "#00ffff"
}
}
]](https://image.slidesharecdn.com/mapboxstylesingeoserverandopenlayers-170829181114/85/Map-box-styles-in-GeoServer-and-OpenLayers-14-320.jpg)
![Data-driven Styling
MapBox Styles support the concept of Data-Driven Styling through
the use of Property Functions.
Constant: Property Function:
{
“Circle-color”: {
“Property”: “temperature”,
“Stops”: [
[0, ‘blue’],
[100, ‘red’]
]
}
}
{
“Circle-color”: “blue”
}](https://image.slidesharecdn.com/mapboxstylesingeoserverandopenlayers-170829181114/85/Map-box-styles-in-GeoServer-and-OpenLayers-15-320.jpg)
![Functions and Zoom
Zoom-and-property functions allow the appearance of a map feature to change with both its properties and
zoom. Each stop is an array with two elements, the first is an object with a property input value and a zoom, and
the second is a function output value.
{
"circle-radius": {
"property": "rating",
"stops": [
// zoom is 0 and "rating" is 0 -> circle radius will be 0px
[{zoom: 0, value: 0}, 0],
// zoom is 0 and "rating" is 5 -> circle radius will be 5px
[{zoom: 0, value: 5}, 5],
// zoom is 20 and "rating" is 0 -> circle radius will be 0px
[{zoom: 20, value: 0}, 0],
// zoom is 20 and "rating" is 5 -> circle radius will be 20px
[{zoom: 20, value: 5}, 20]
]
}
}](https://image.slidesharecdn.com/mapboxstylesingeoserverandopenlayers-170829181114/85/Map-box-styles-in-GeoServer-and-OpenLayers-16-320.jpg)

![Supported / Unsupported MapBox properties
Implemented in GeoTools as a module consumed by GeoServer
Implemented properties
• Sources
• GeoServer does not use the Sources property in the style document at this time. The style is
applied to whichever GeoServer layer the user selects.
• Supported Layer Types
• [Background, Fill, Line, Symbol, Raster, Circle, Fill-Extrusion]
• Supported Data Types
• [Color, Enum, String, Boolean, Number, Array, Function, Filter]
• Layer Properties Not Supported
• *-translate-anchor, icon-rotation-alignment, icon-pitch-alignment
GeoServer MapBox Style Specification](https://image.slidesharecdn.com/mapboxstylesingeoserverandopenlayers-170829181114/85/Map-box-styles-in-GeoServer-and-OpenLayers-18-320.jpg)


![JSON Styling
● Easy to manipulate using standard
web tools
● Easy to read and write
JSON Styling
{
"version": 8,
"layers": [
{
"id": "default_point",
"type": "circle",
"source": "test-source",
"source-layer": "place_label",
"layout": {
"visibility": "visible"
},
"paint": {
"circle-color": "#FF0000",
"circle-opacity": 1,
"circle-radius": 6,
"circle-stroke-opacity": 0,
}
}
]
}](https://image.slidesharecdn.com/mapboxstylesingeoserverandopenlayers-170829181114/75/Map-box-styles-in-GeoServer-and-OpenLayers-8-2048.jpg)
![Root Properties
• Version
• Name
• Sprite
• Glyph
• Sources
• Layers
MapBox Styles - Root Properties
{
"version": 8,
"name": "Mapbox Streets",
"sprite": "mapbox://sprites/mapbox/streets-v8",
"glyphs": "mapbox://fonts/mapbox/{fontstack}/{range}.pbf",
"sources": {...},
"layers": [...]
}](https://image.slidesharecdn.com/mapboxstylesingeoserverandopenlayers-170829181114/75/Map-box-styles-in-GeoServer-and-OpenLayers-12-2048.jpg)

![MapBox Styles - Layers
A Style’s layers property list all of the layers available in that style. The type of layer is specified by the
type property.
• Background
• Fill
• Line
• Symbol
• Raster
• Circle
• Fill Extrusion
"layers": [
{
"id": "water",
"source": "mapbox-streets",
"source-layer": "water",
"type": "fill",
"paint": {
"fill-color": "#00ffff"
}
}
]](https://image.slidesharecdn.com/mapboxstylesingeoserverandopenlayers-170829181114/75/Map-box-styles-in-GeoServer-and-OpenLayers-14-2048.jpg)
![Data-driven Styling
MapBox Styles support the concept of Data-Driven Styling through
the use of Property Functions.
Constant: Property Function:
{
“Circle-color”: {
“Property”: “temperature”,
“Stops”: [
[0, ‘blue’],
[100, ‘red’]
]
}
}
{
“Circle-color”: “blue”
}](https://image.slidesharecdn.com/mapboxstylesingeoserverandopenlayers-170829181114/75/Map-box-styles-in-GeoServer-and-OpenLayers-15-2048.jpg)
![Functions and Zoom
Zoom-and-property functions allow the appearance of a map feature to change with both its properties and
zoom. Each stop is an array with two elements, the first is an object with a property input value and a zoom, and
the second is a function output value.
{
"circle-radius": {
"property": "rating",
"stops": [
// zoom is 0 and "rating" is 0 -> circle radius will be 0px
[{zoom: 0, value: 0}, 0],
// zoom is 0 and "rating" is 5 -> circle radius will be 5px
[{zoom: 0, value: 5}, 5],
// zoom is 20 and "rating" is 0 -> circle radius will be 0px
[{zoom: 20, value: 0}, 0],
// zoom is 20 and "rating" is 5 -> circle radius will be 20px
[{zoom: 20, value: 5}, 20]
]
}
}](https://image.slidesharecdn.com/mapboxstylesingeoserverandopenlayers-170829181114/75/Map-box-styles-in-GeoServer-and-OpenLayers-16-2048.jpg)

![Supported / Unsupported MapBox properties
Implemented in GeoTools as a module consumed by GeoServer
Implemented properties
• Sources
• GeoServer does not use the Sources property in the style document at this time. The style is
applied to whichever GeoServer layer the user selects.
• Supported Layer Types
• [Background, Fill, Line, Symbol, Raster, Circle, Fill-Extrusion]
• Supported Data Types
• [Color, Enum, String, Boolean, Number, Array, Function, Filter]
• Layer Properties Not Supported
• *-translate-anchor, icon-rotation-alignment, icon-pitch-alignment
GeoServer MapBox Style Specification](https://image.slidesharecdn.com/mapboxstylesingeoserverandopenlayers-170829181114/75/Map-box-styles-in-GeoServer-and-OpenLayers-18-2048.jpg)


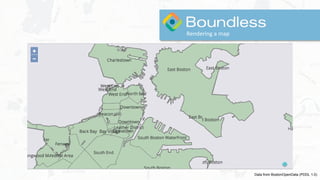
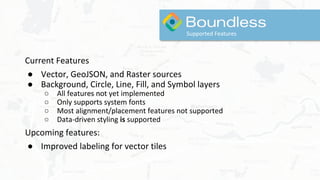
The document discusses the integration of Mapbox styles in GeoServer and OpenLayers, highlighting its benefits for GIS applications. It introduces Mapbox styles as a JSON-based styling language that allows for dynamic client-side styling of vector tiles. Additionally, it outlines features and capabilities of Mapbox styles while emphasizing their implementation in GeoServer and OpenLayers for enhanced GIS functionality.
Overview of MapBox Styles and the expertise of David Vick and Torben Barsballe from Boundless.
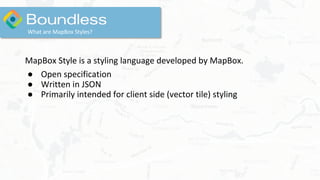
Introduction to MapBox Styles and their significance, including JSON-based styling for client-side applications.
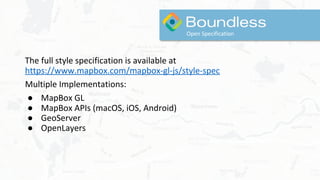
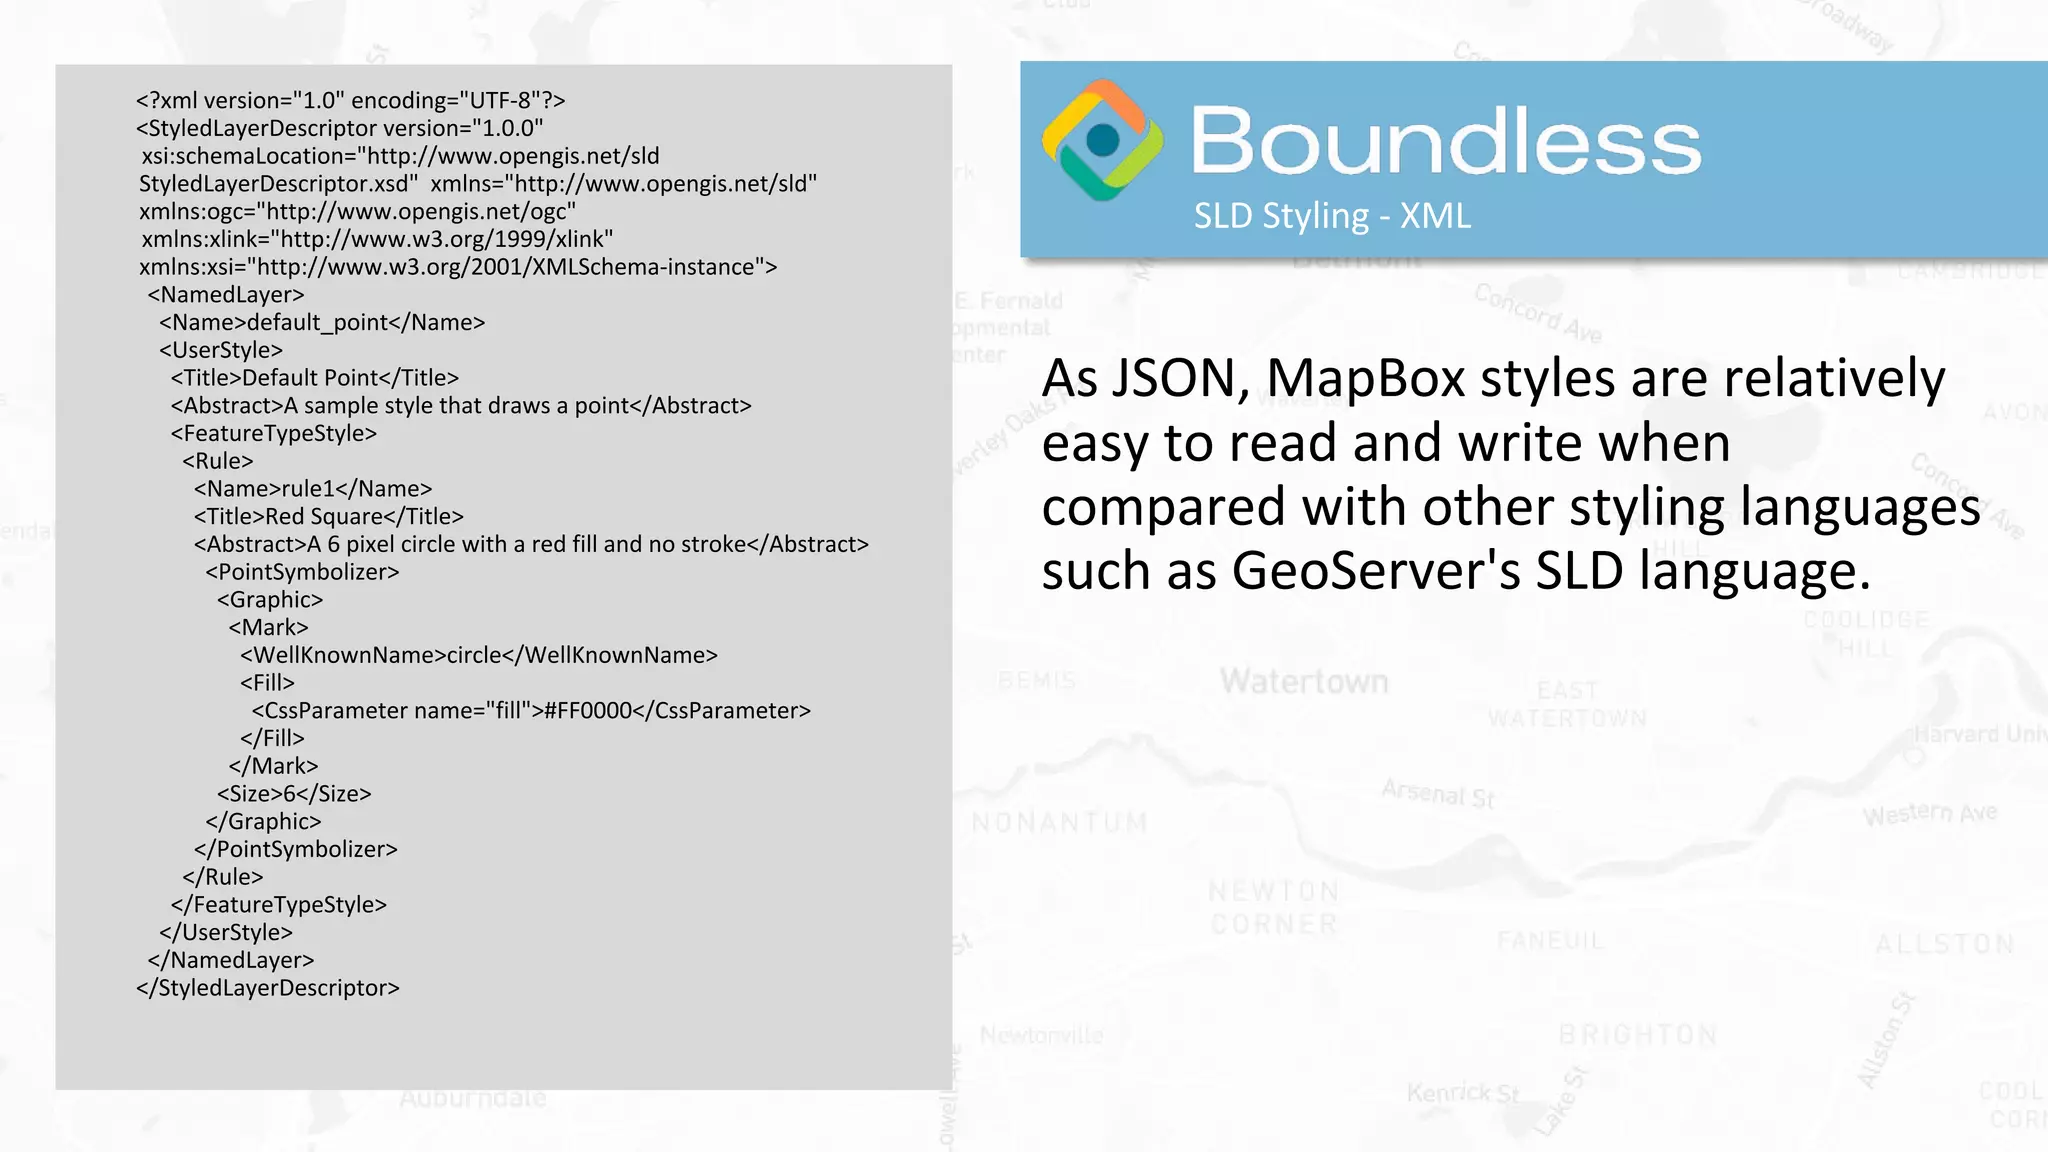
Details about MapBox styles, including various implementations and a comparison with SLD XML.
Explanation of vector tiles, their dynamic styling capabilities, and major features of MapBox Styles.
Description of root properties, sources, and layers in MapBox Styles.
Overview of data-driven styling and functions for zoom interactions in MapBox Styles.
How MapBox Styles are supported in GeoServer, detailing implemented properties and capabilities.
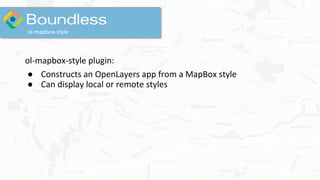
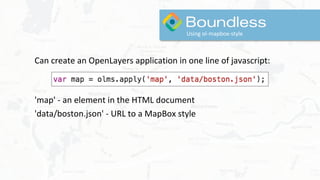
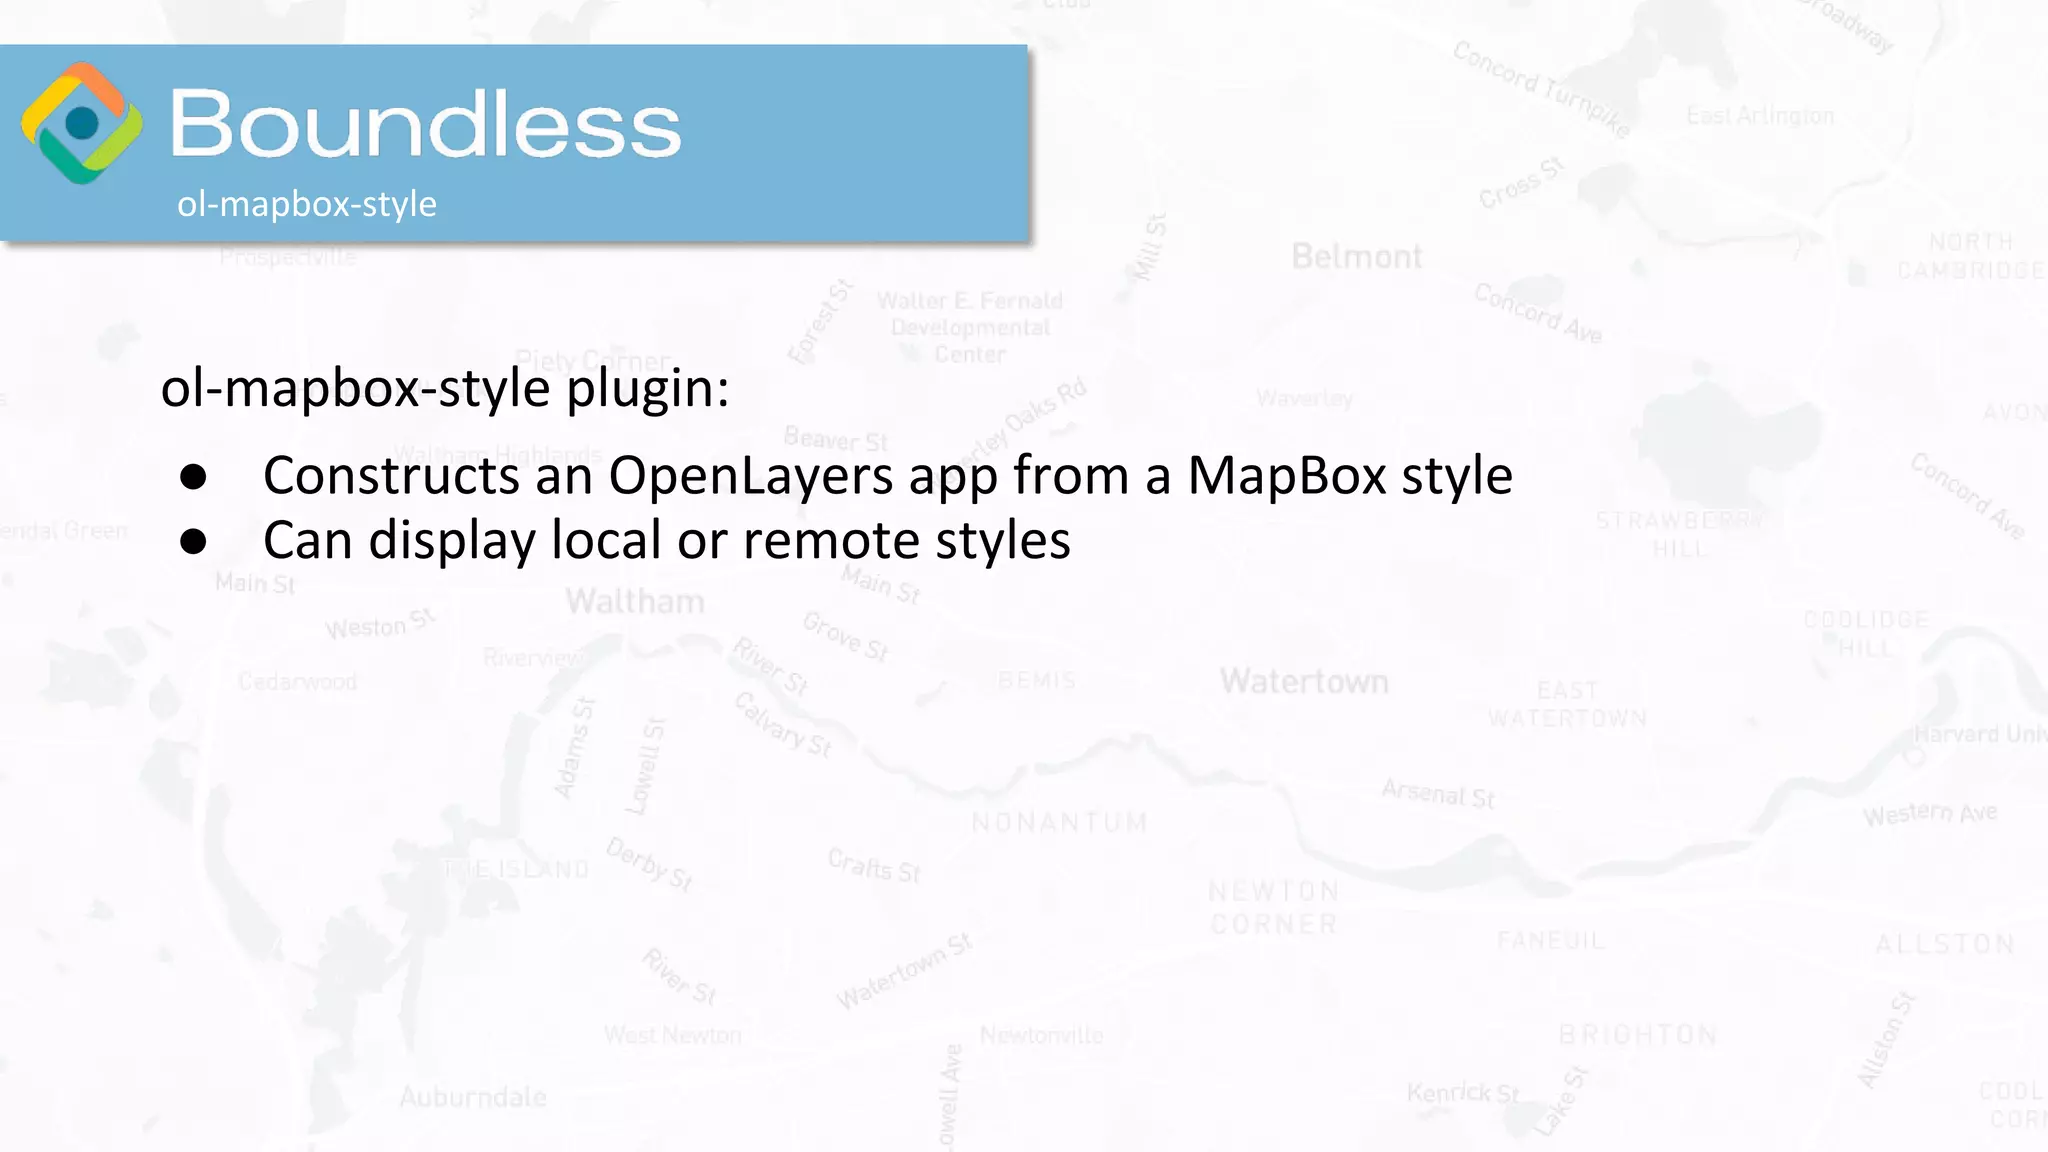
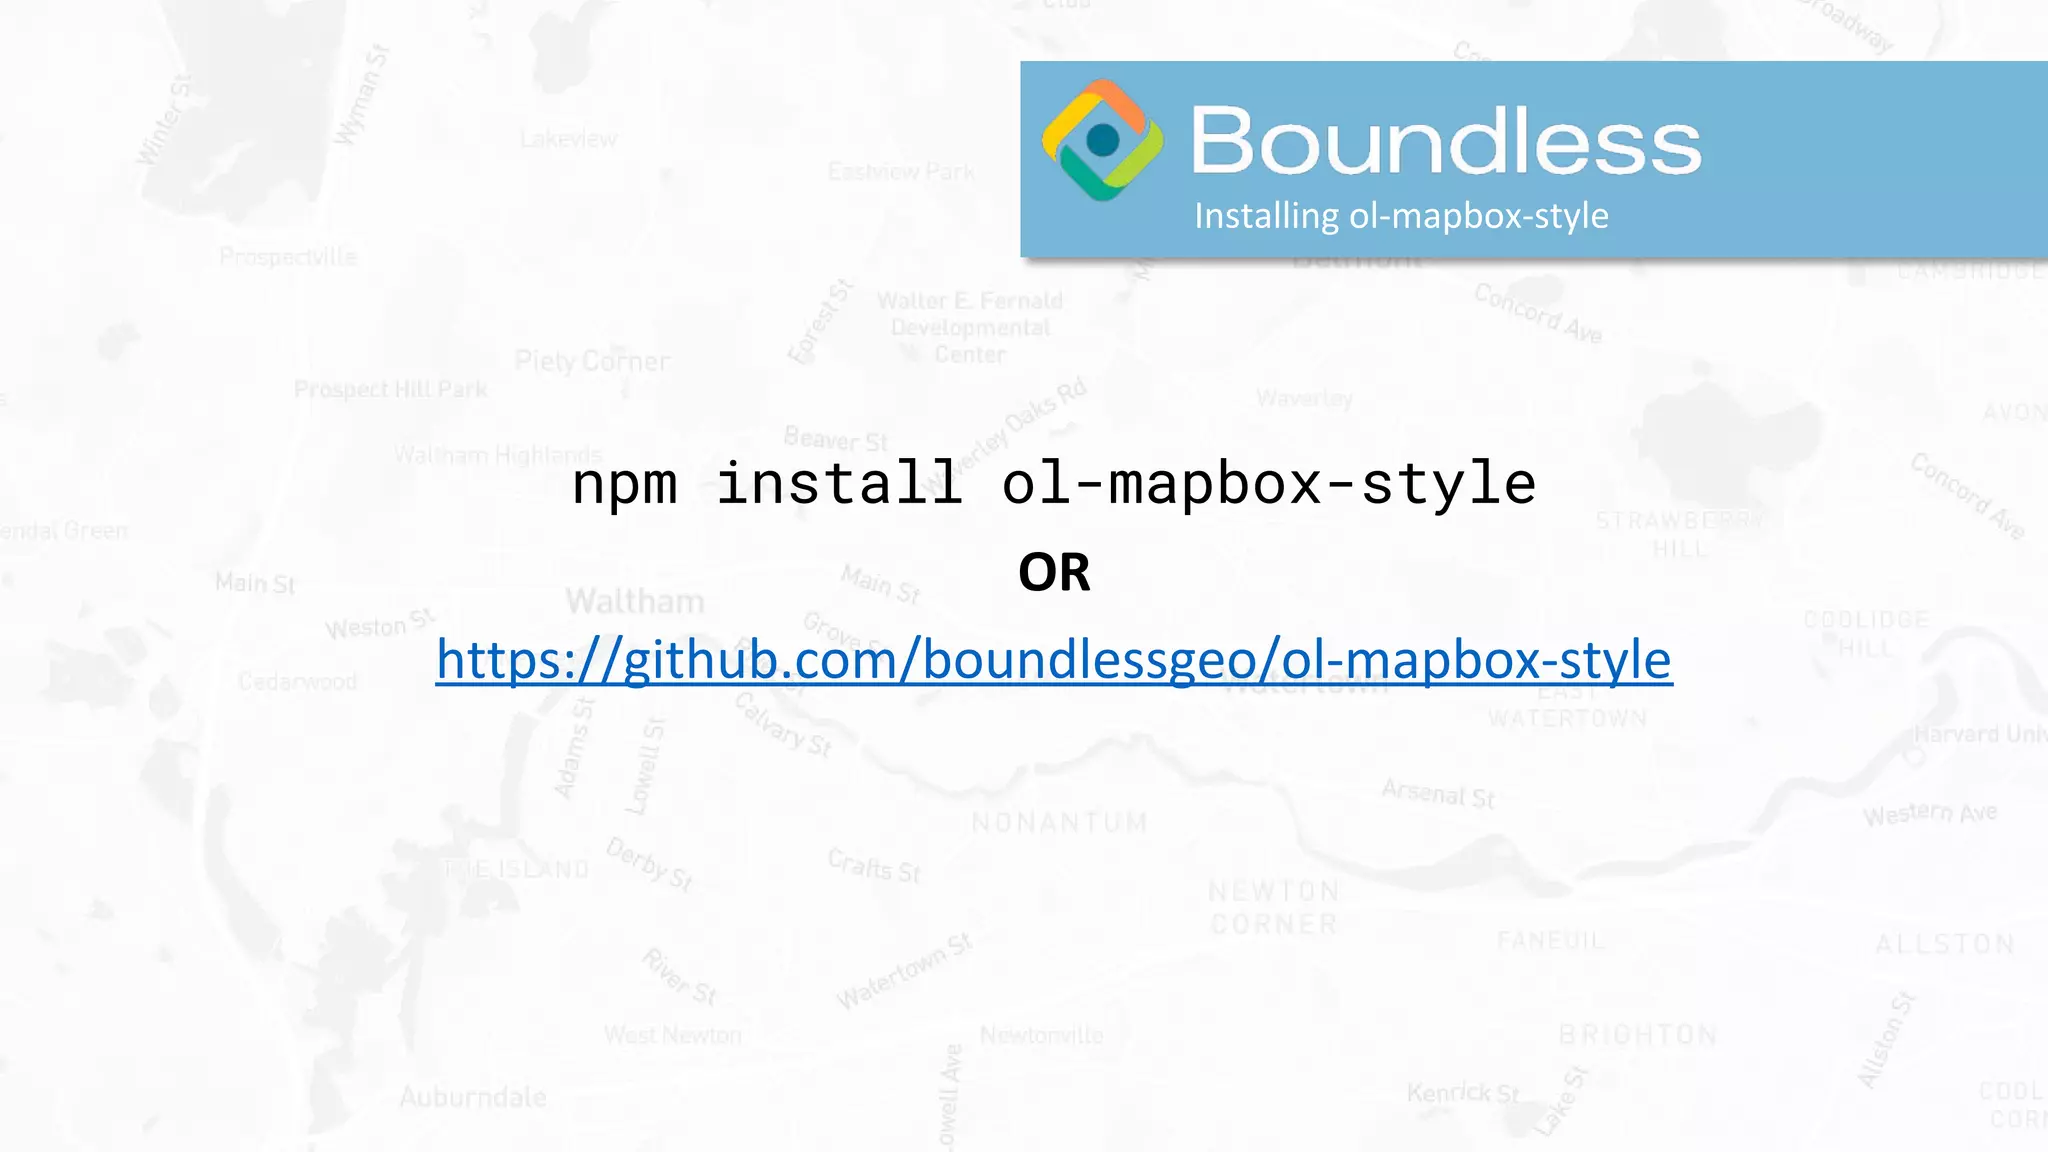
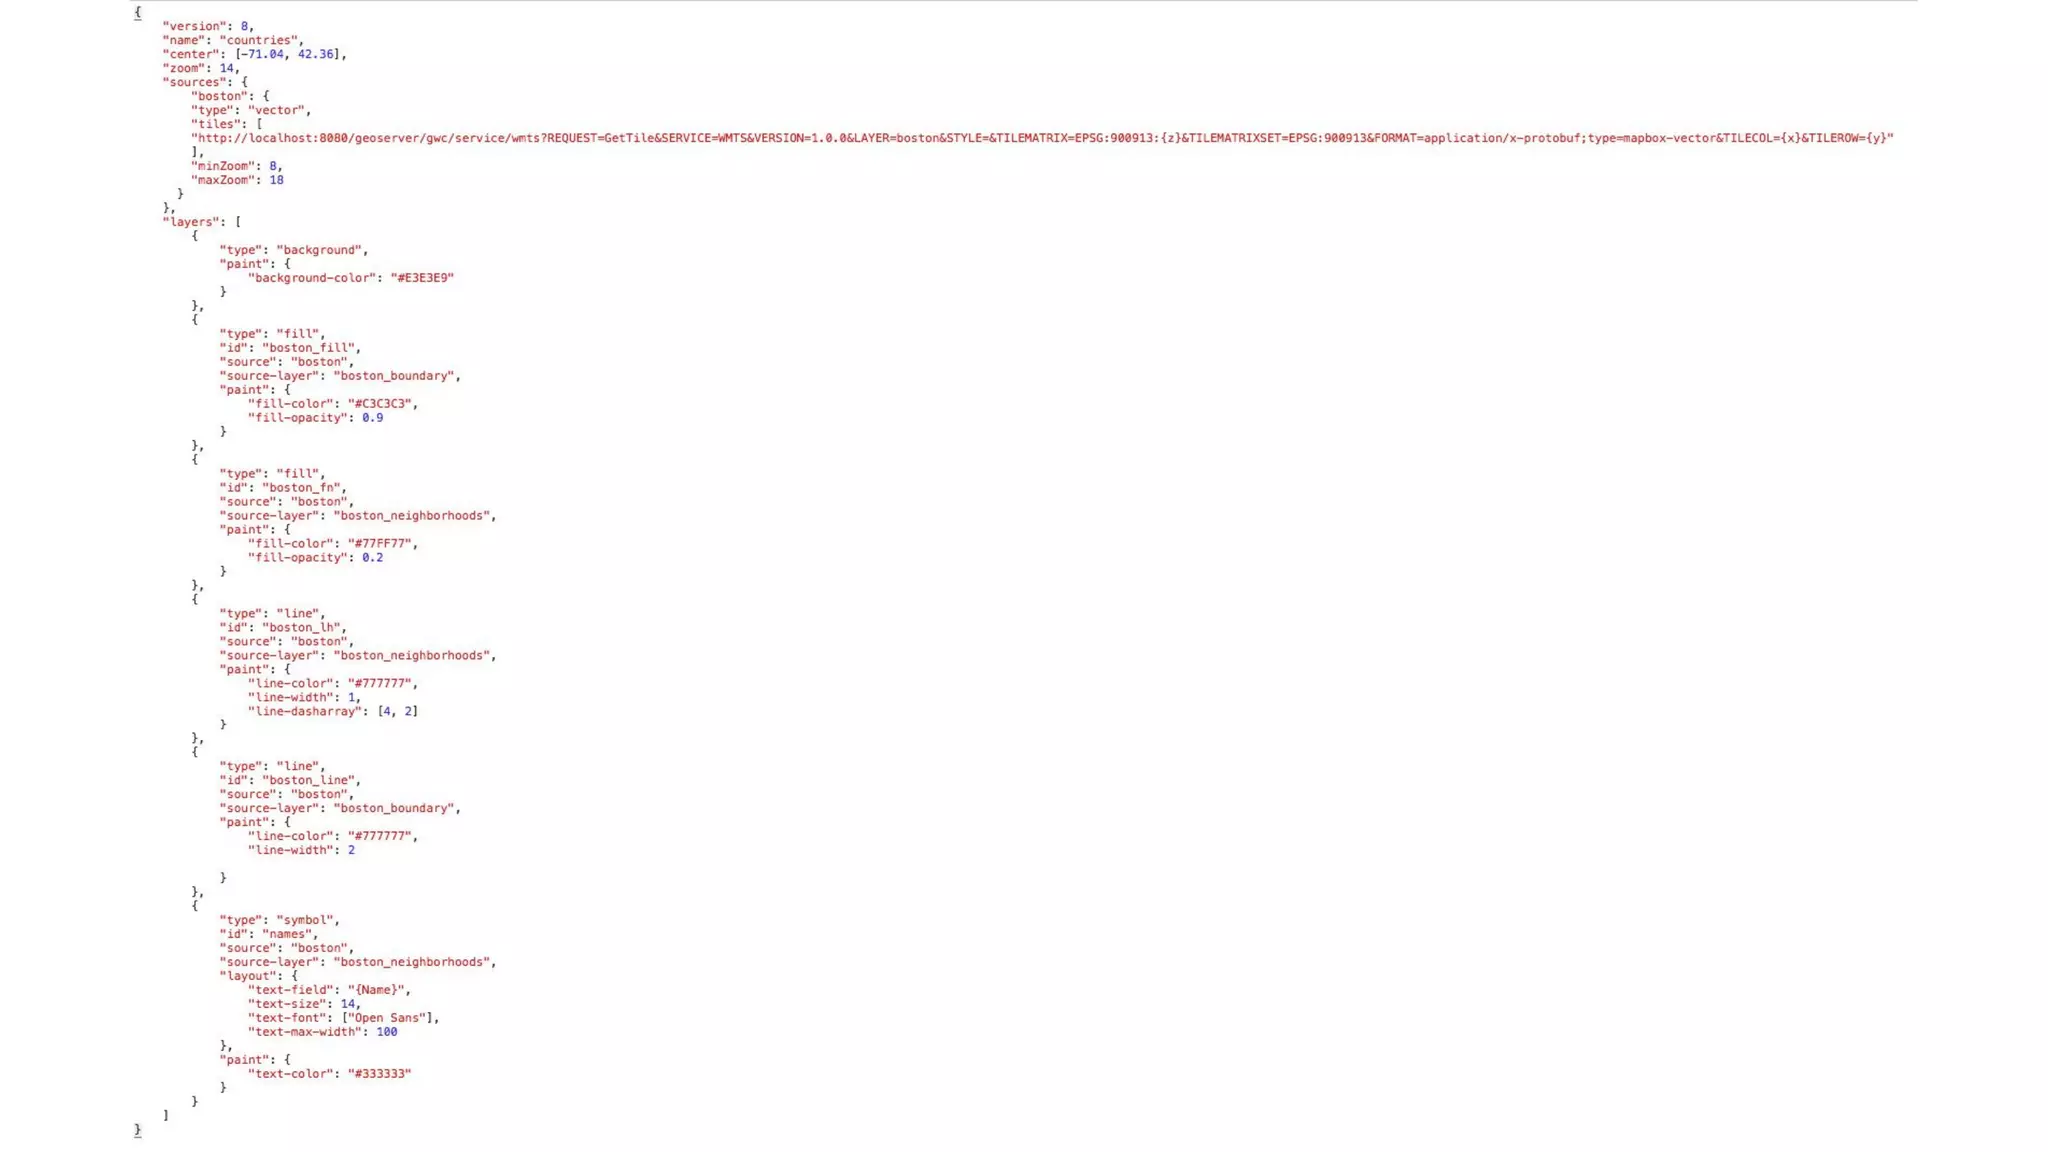
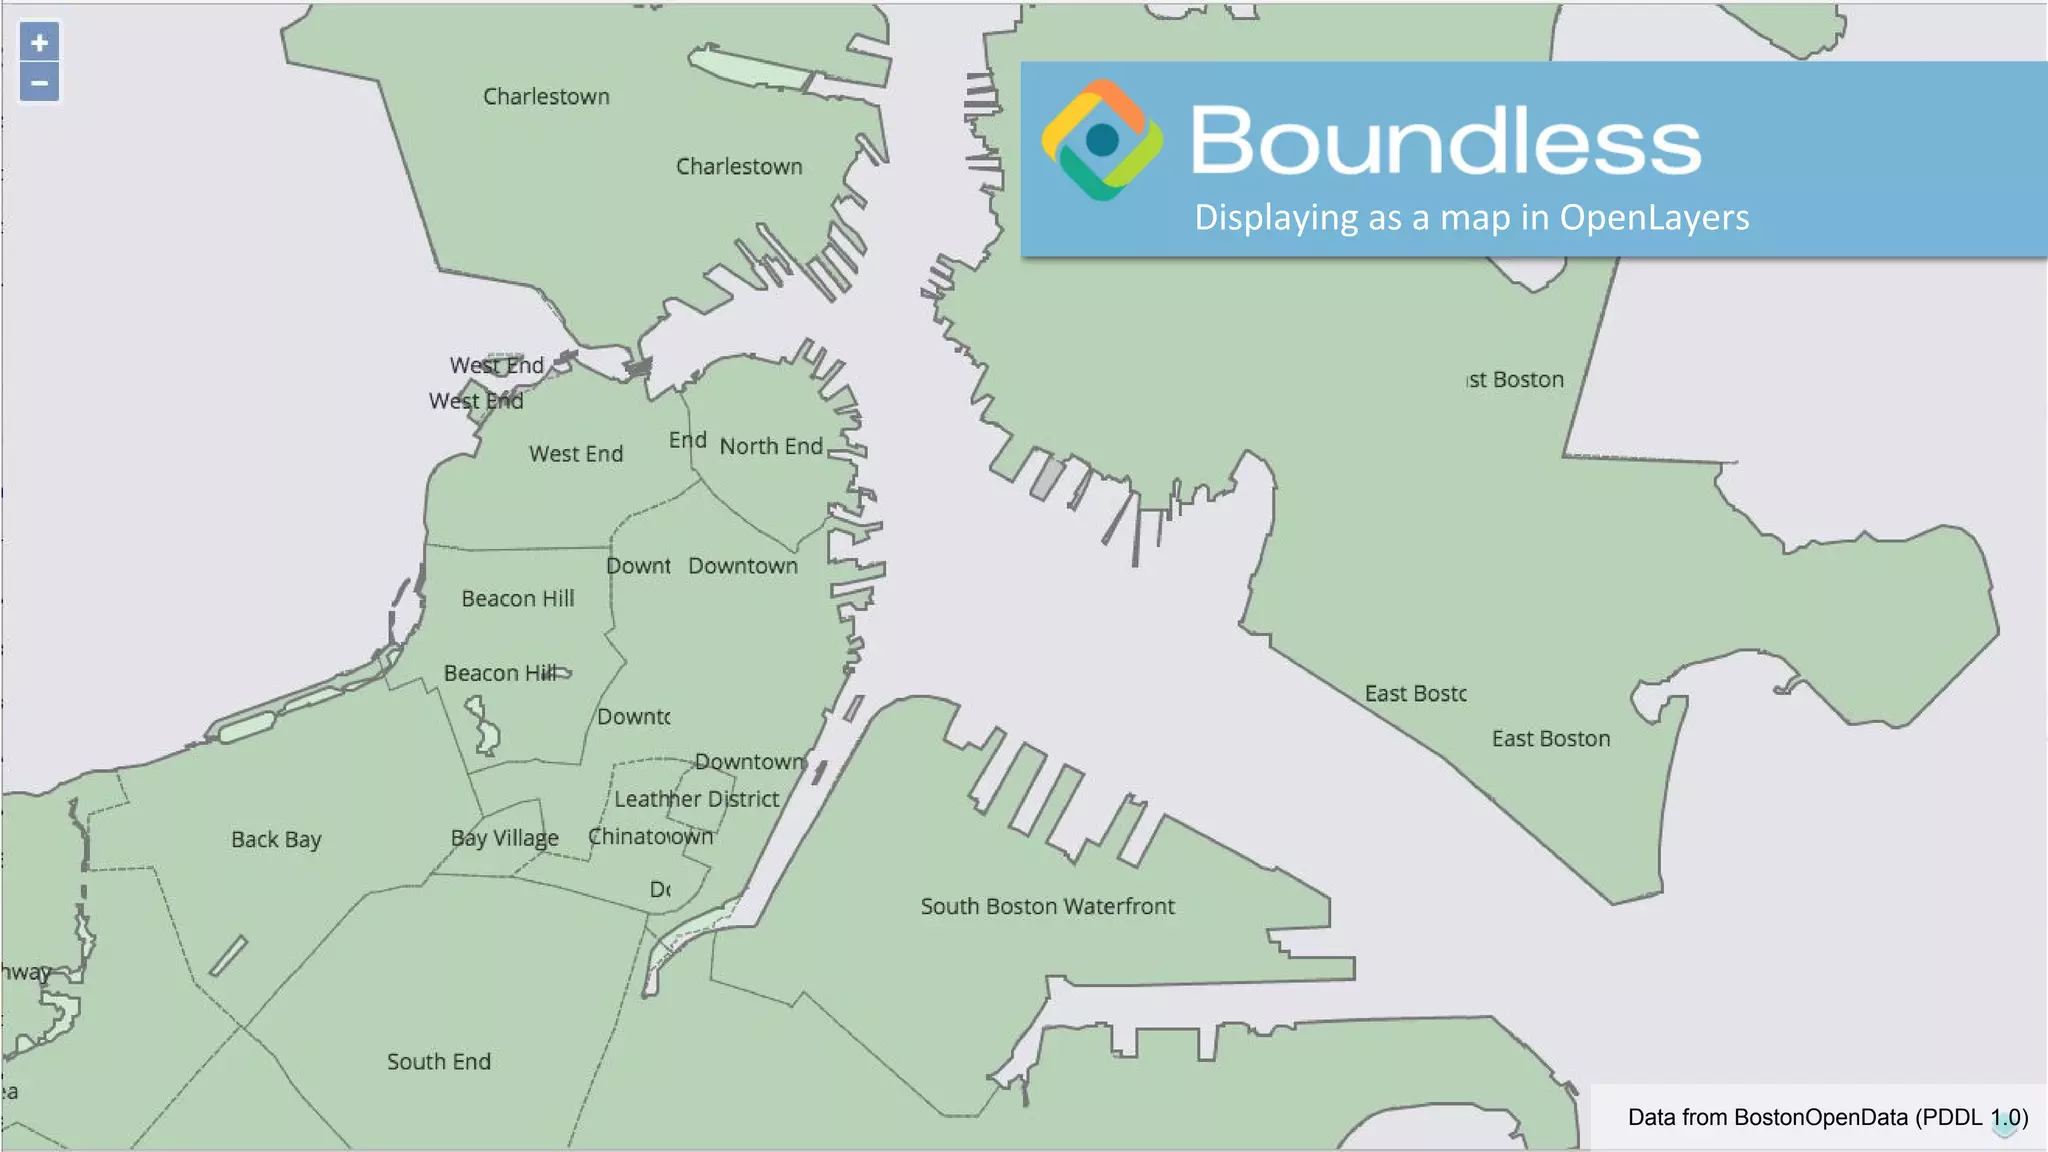
Introduction to using MapBox styles in OpenLayers, including installation and the capabilities of the ol-mapbox-style plugin.
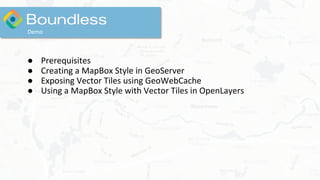
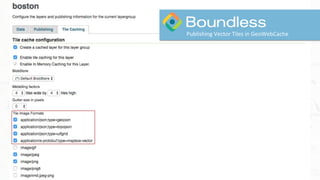
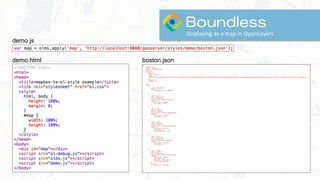
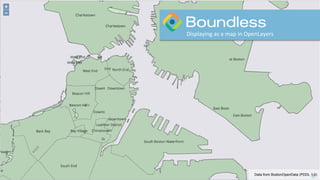
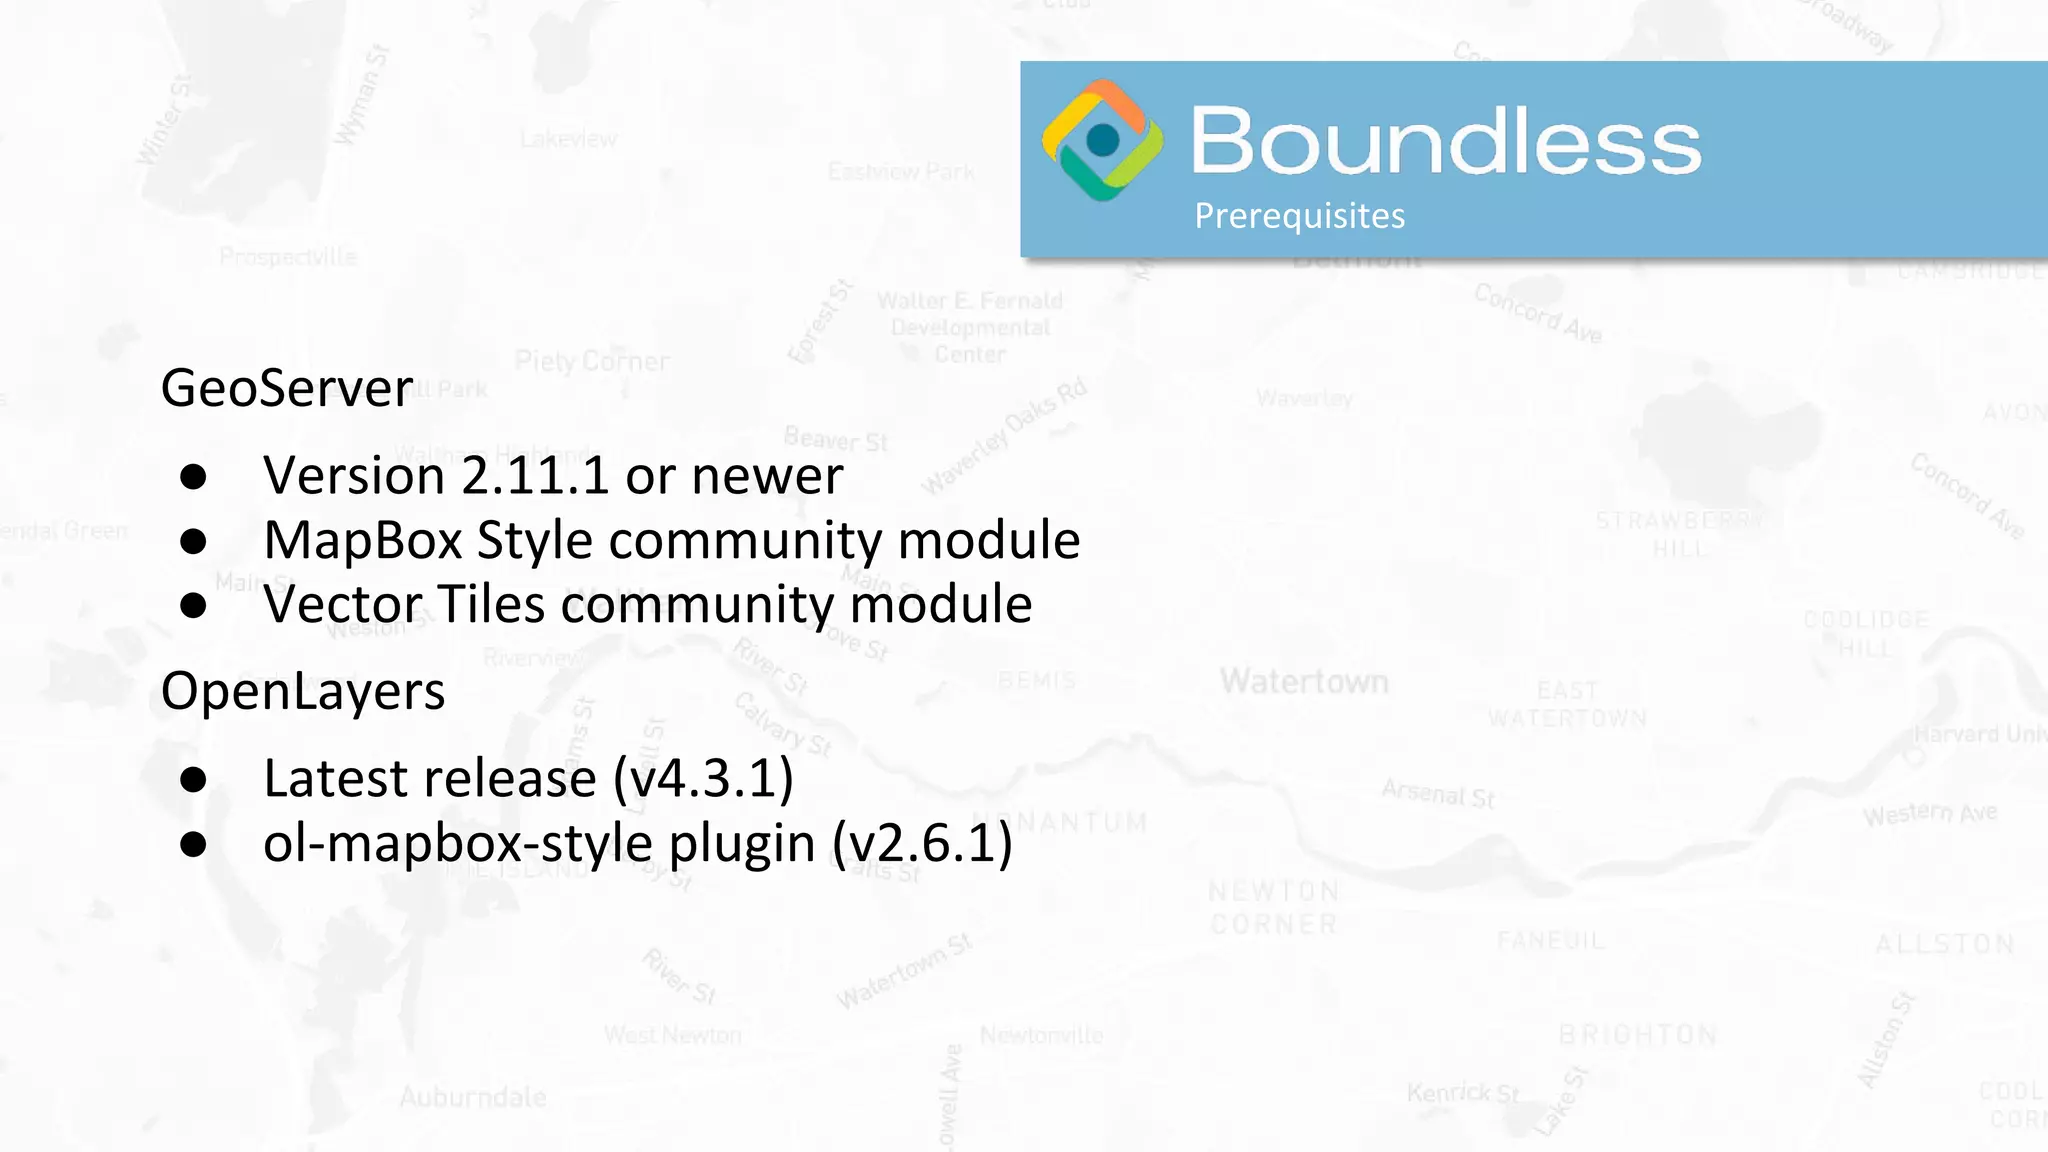
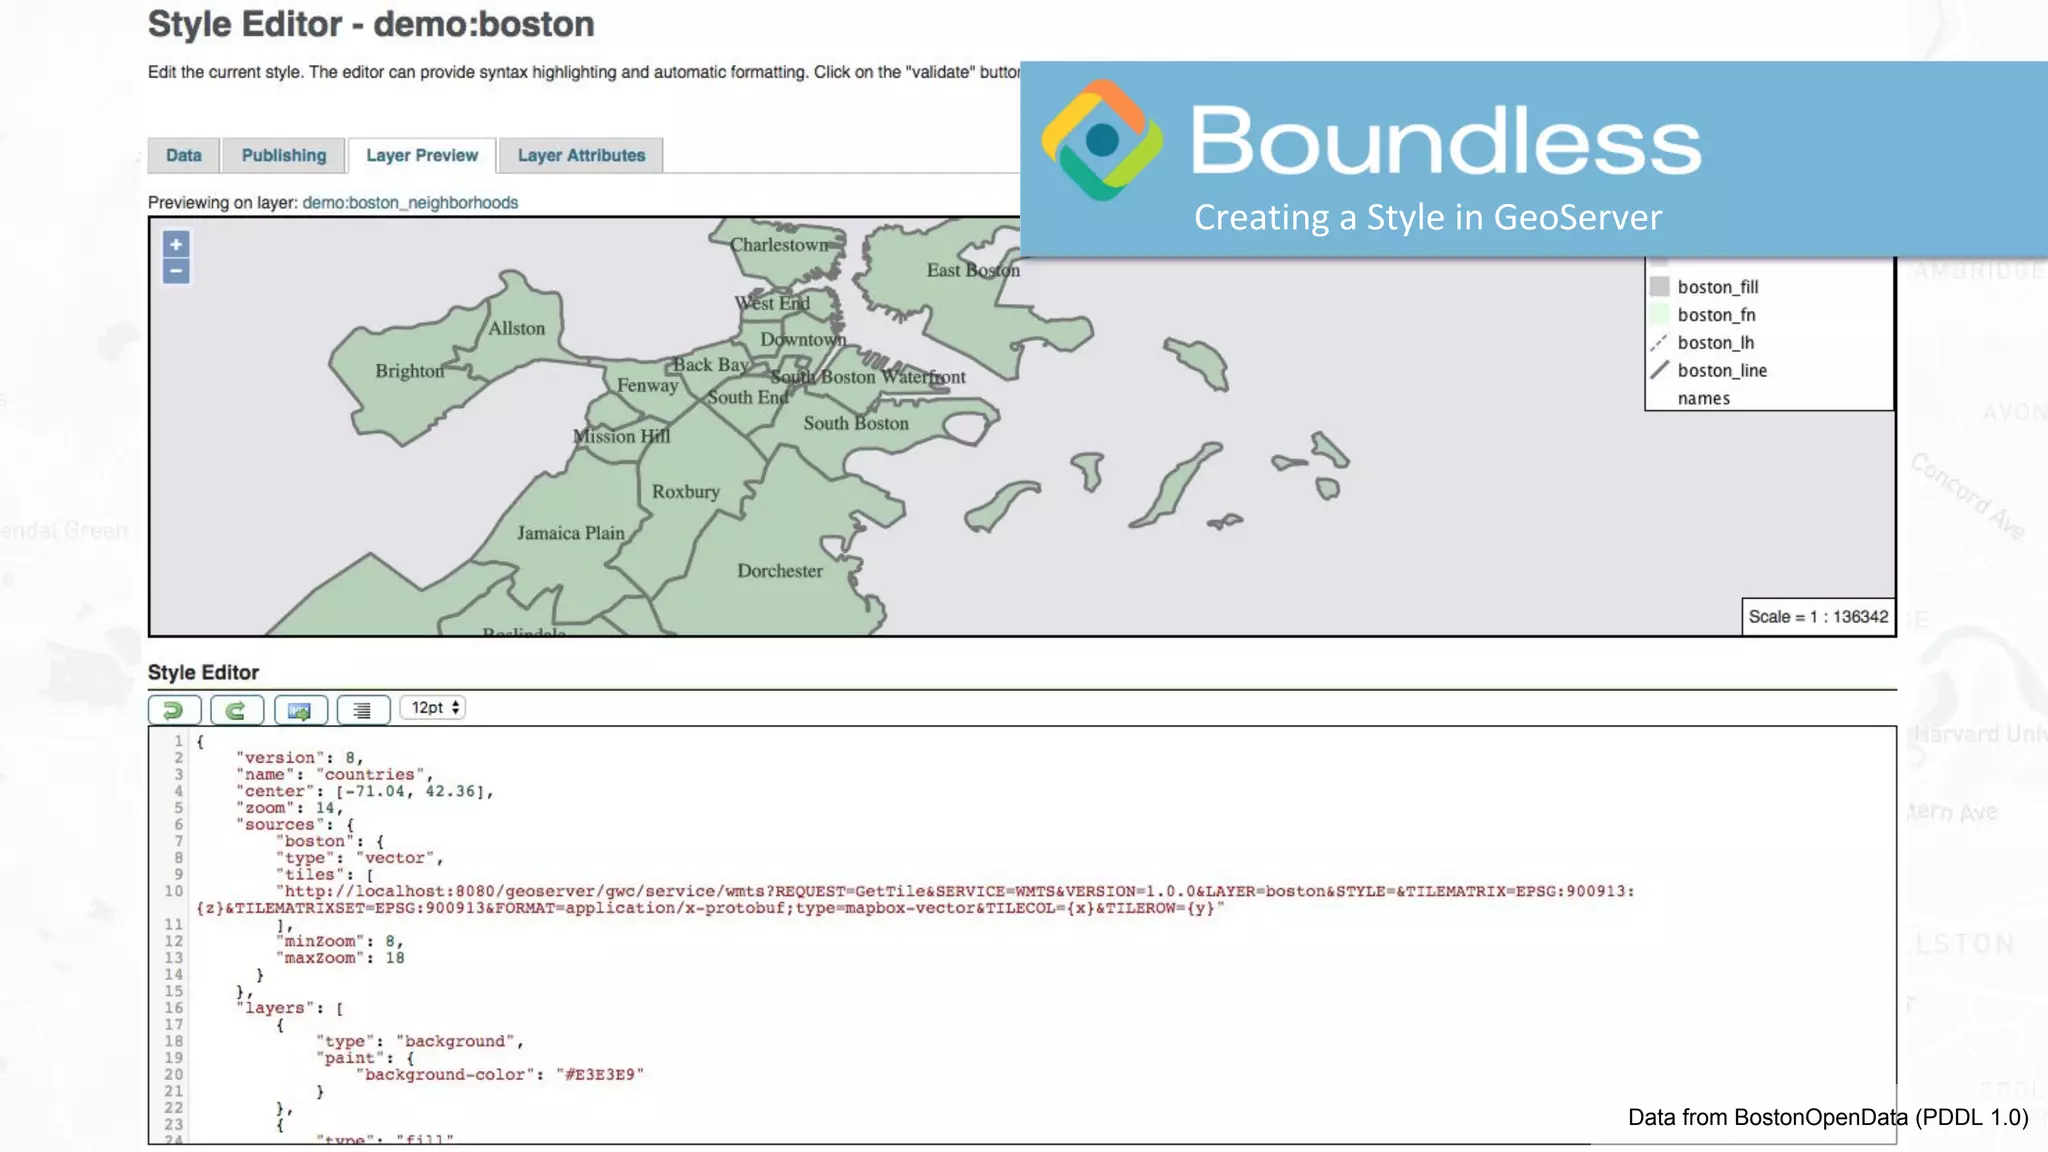
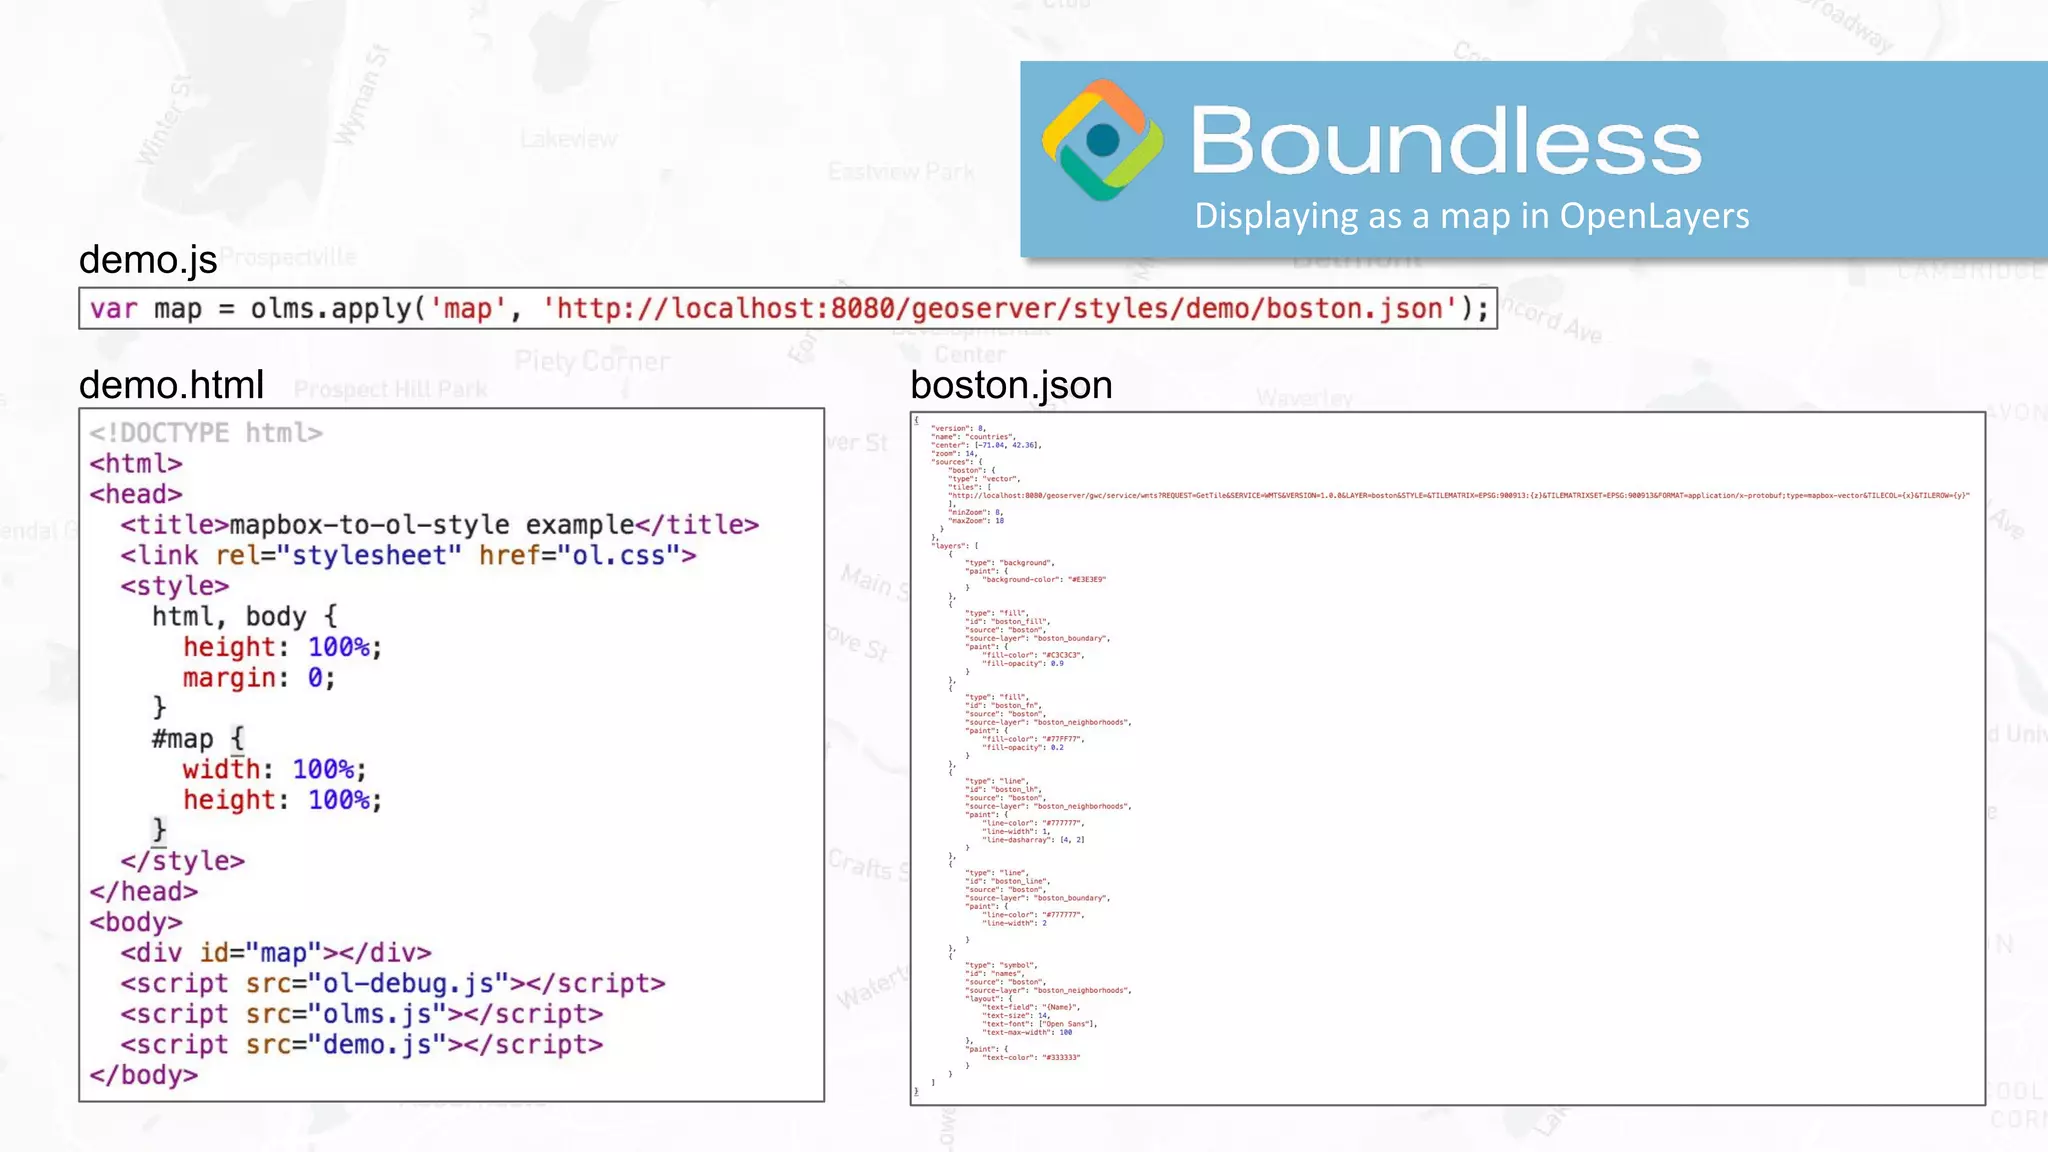
Guidelines for the demo including prerequisites for GeoServer and OpenLayers, as well as creating and displaying maps.Closing with a Q&A session and an encouragement to connect with GIS professionals at Boundless.


