MACHINE LEARNING
Syllabus UNIT-1
INTRODUCTION-Artificial Intelligence, Machine Learning,
Deep learning, Types of Machine Learning Systems, Main
Challenges of Machine Learning.
STATISTICAL LEARNING: Introduction, Supervised and
Unsupervised Learning, Training and Test Loss, Tradeoffs in
Statistical Learning, Estimating Risk Statistics, Sampling
distribution of an estimator, Empirical Risk Minimization
2.
1. ARTIFICIAL INTELLIGENCE,MACHINE LEARNING, DEEP
LEARNING:
Artificial Intelligence is a branch of computer science
that helps us to create smart, intelligent machines.
AI holds a tendency to cause a machine to work like a
human.
What is Artificial Intelligence (AI)?
Artificial Intelligence is defined as a field of science and
engineering that deals with making intelligent machines
or computers to perform human-like activities.
3.
although all thesetechnologies are used to build intelligent
machines or applications that behave like a human.
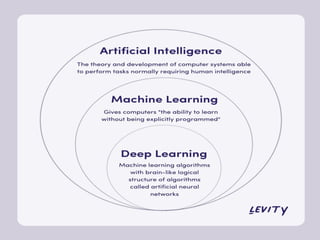
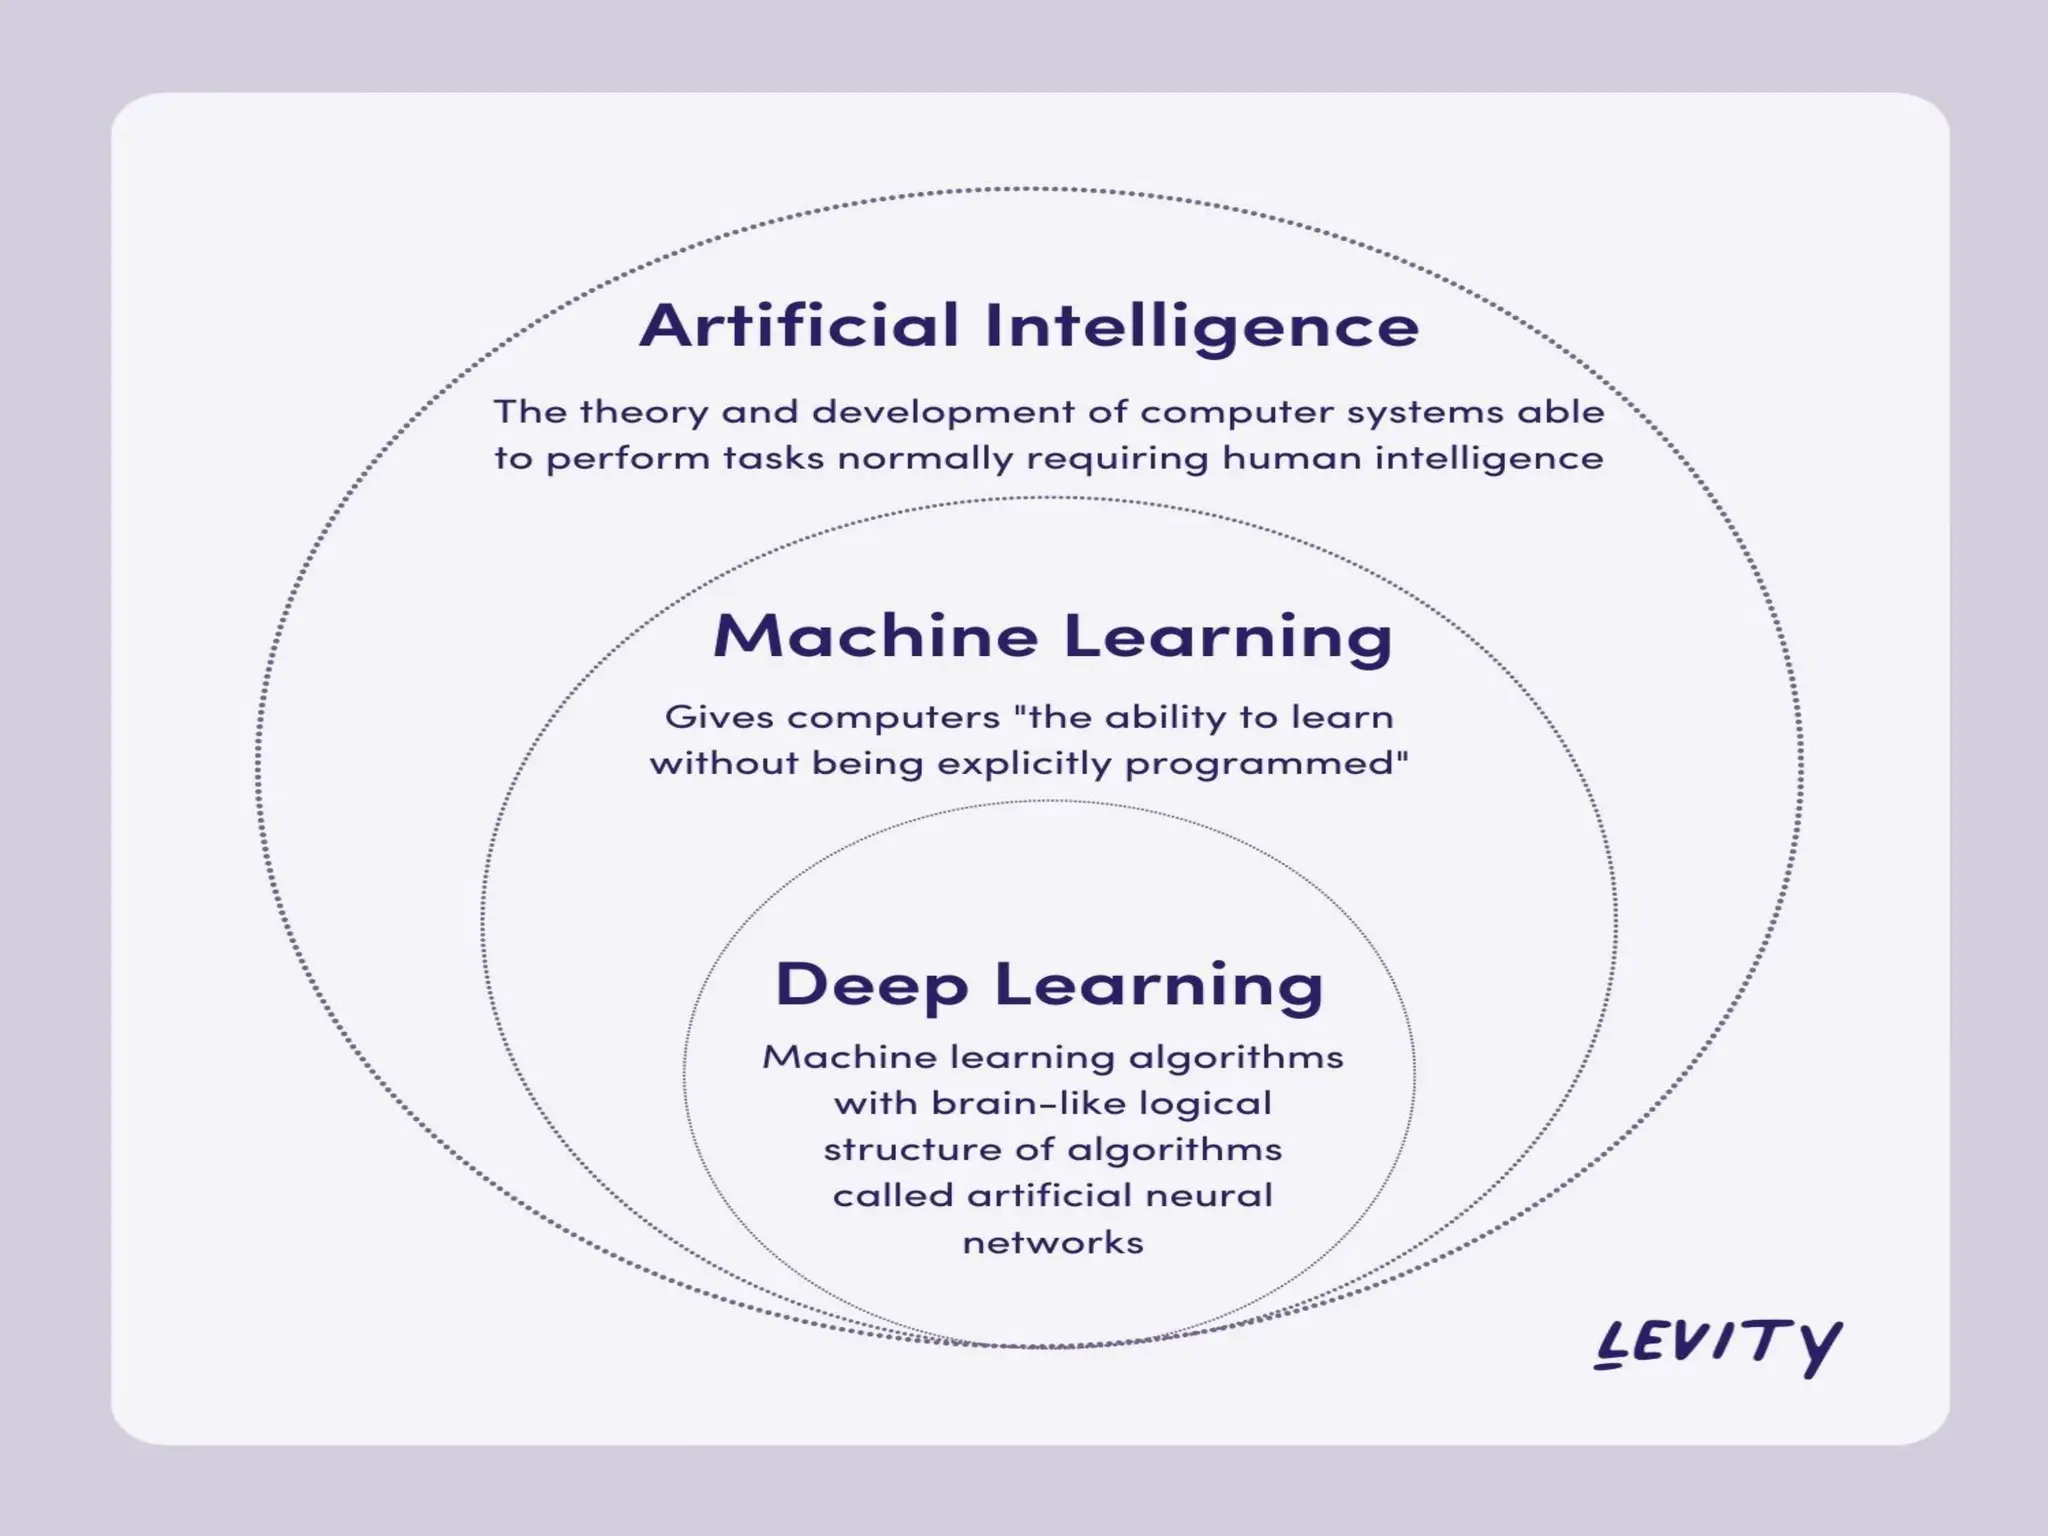
Artificial Intelligence (AI) can be understood as an umbrella
that consists of both Machine learning and deep learning.
We can say deep learning and machine learning both are
subsets of artificial intelligence.
4.
The primarygoal of Artificial Intelligence is to
simulate human-like intelligence in machines,
empowering them to carry out complex tasks
and decision-making processes autonomously.
The objectives of AI encompass a wide range
of applications.
1. Problem-Solving and Decision Making
2. Natural Language Processing (NLP)
5.
3. Machine Learningand Deep Learning
4. Robotics and Automation
5. Enhancing Healthcare and Medicine
6. Fostering Creativity and Innovation
7.
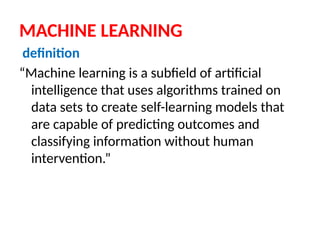
MACHINE LEARNING
definition
“Machine learningis a subfield of artificial
intelligence that uses algorithms trained on
data sets to create self-learning models that
are capable of predicting outcomes and
classifying information without human
intervention.”
8.
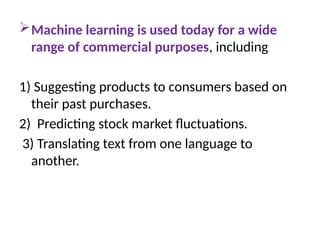
Machine learning isused today for a wide
range of commercial purposes, including
1) Suggesting products to consumers based on
their past purchases.
2) Predicting stock market fluctuations.
3) Translating text from one language to
another.
9.
Deep learningis the sub-branch of ML that
helps to train ML models with a huge amount
of input and complex algorithms and mainly
works with neural networks.
10.
In deep learning,the deep word refers to the
number of layers in a neural network.
Deep Learning is a set of algorithms inspired
by the structure and function of the human
brain.
It uses a huge amount of structured as well as
unstructured data to teach computers and
predicts accurate results.
11.
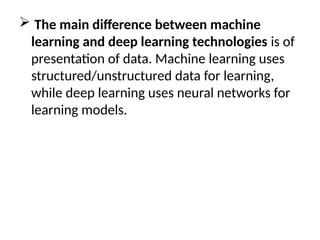
The maindifference between machine
learning and deep learning technologies is of
presentation of data. Machine learning uses
structured/unstructured data for learning,
while deep learning uses neural networks for
learning models.
12.
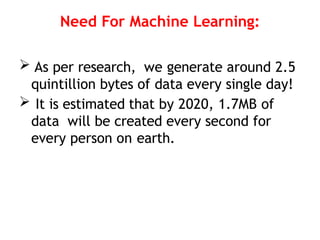
Need For MachineLearning:
As per research, we generate around 2.5
quintillion bytes of data every single day!
It is estimated that by 2020, 1.7MB of
data will be created every second for
every person on earth.
13.
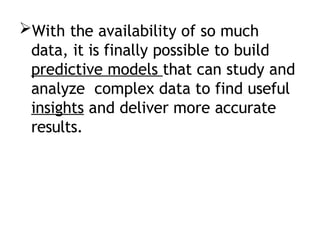
With the availabilityof so much
data, it is finally possible to build
predictive models that can study and
analyze complex data to find useful
insights and deliver more accurate
results.
14.
Top Tier companiessuch as Netflix and
Amazon build such Machine Learning
model by using tons of data in order to
identify profitable opportunities and avoid
unwanted risks.
15.
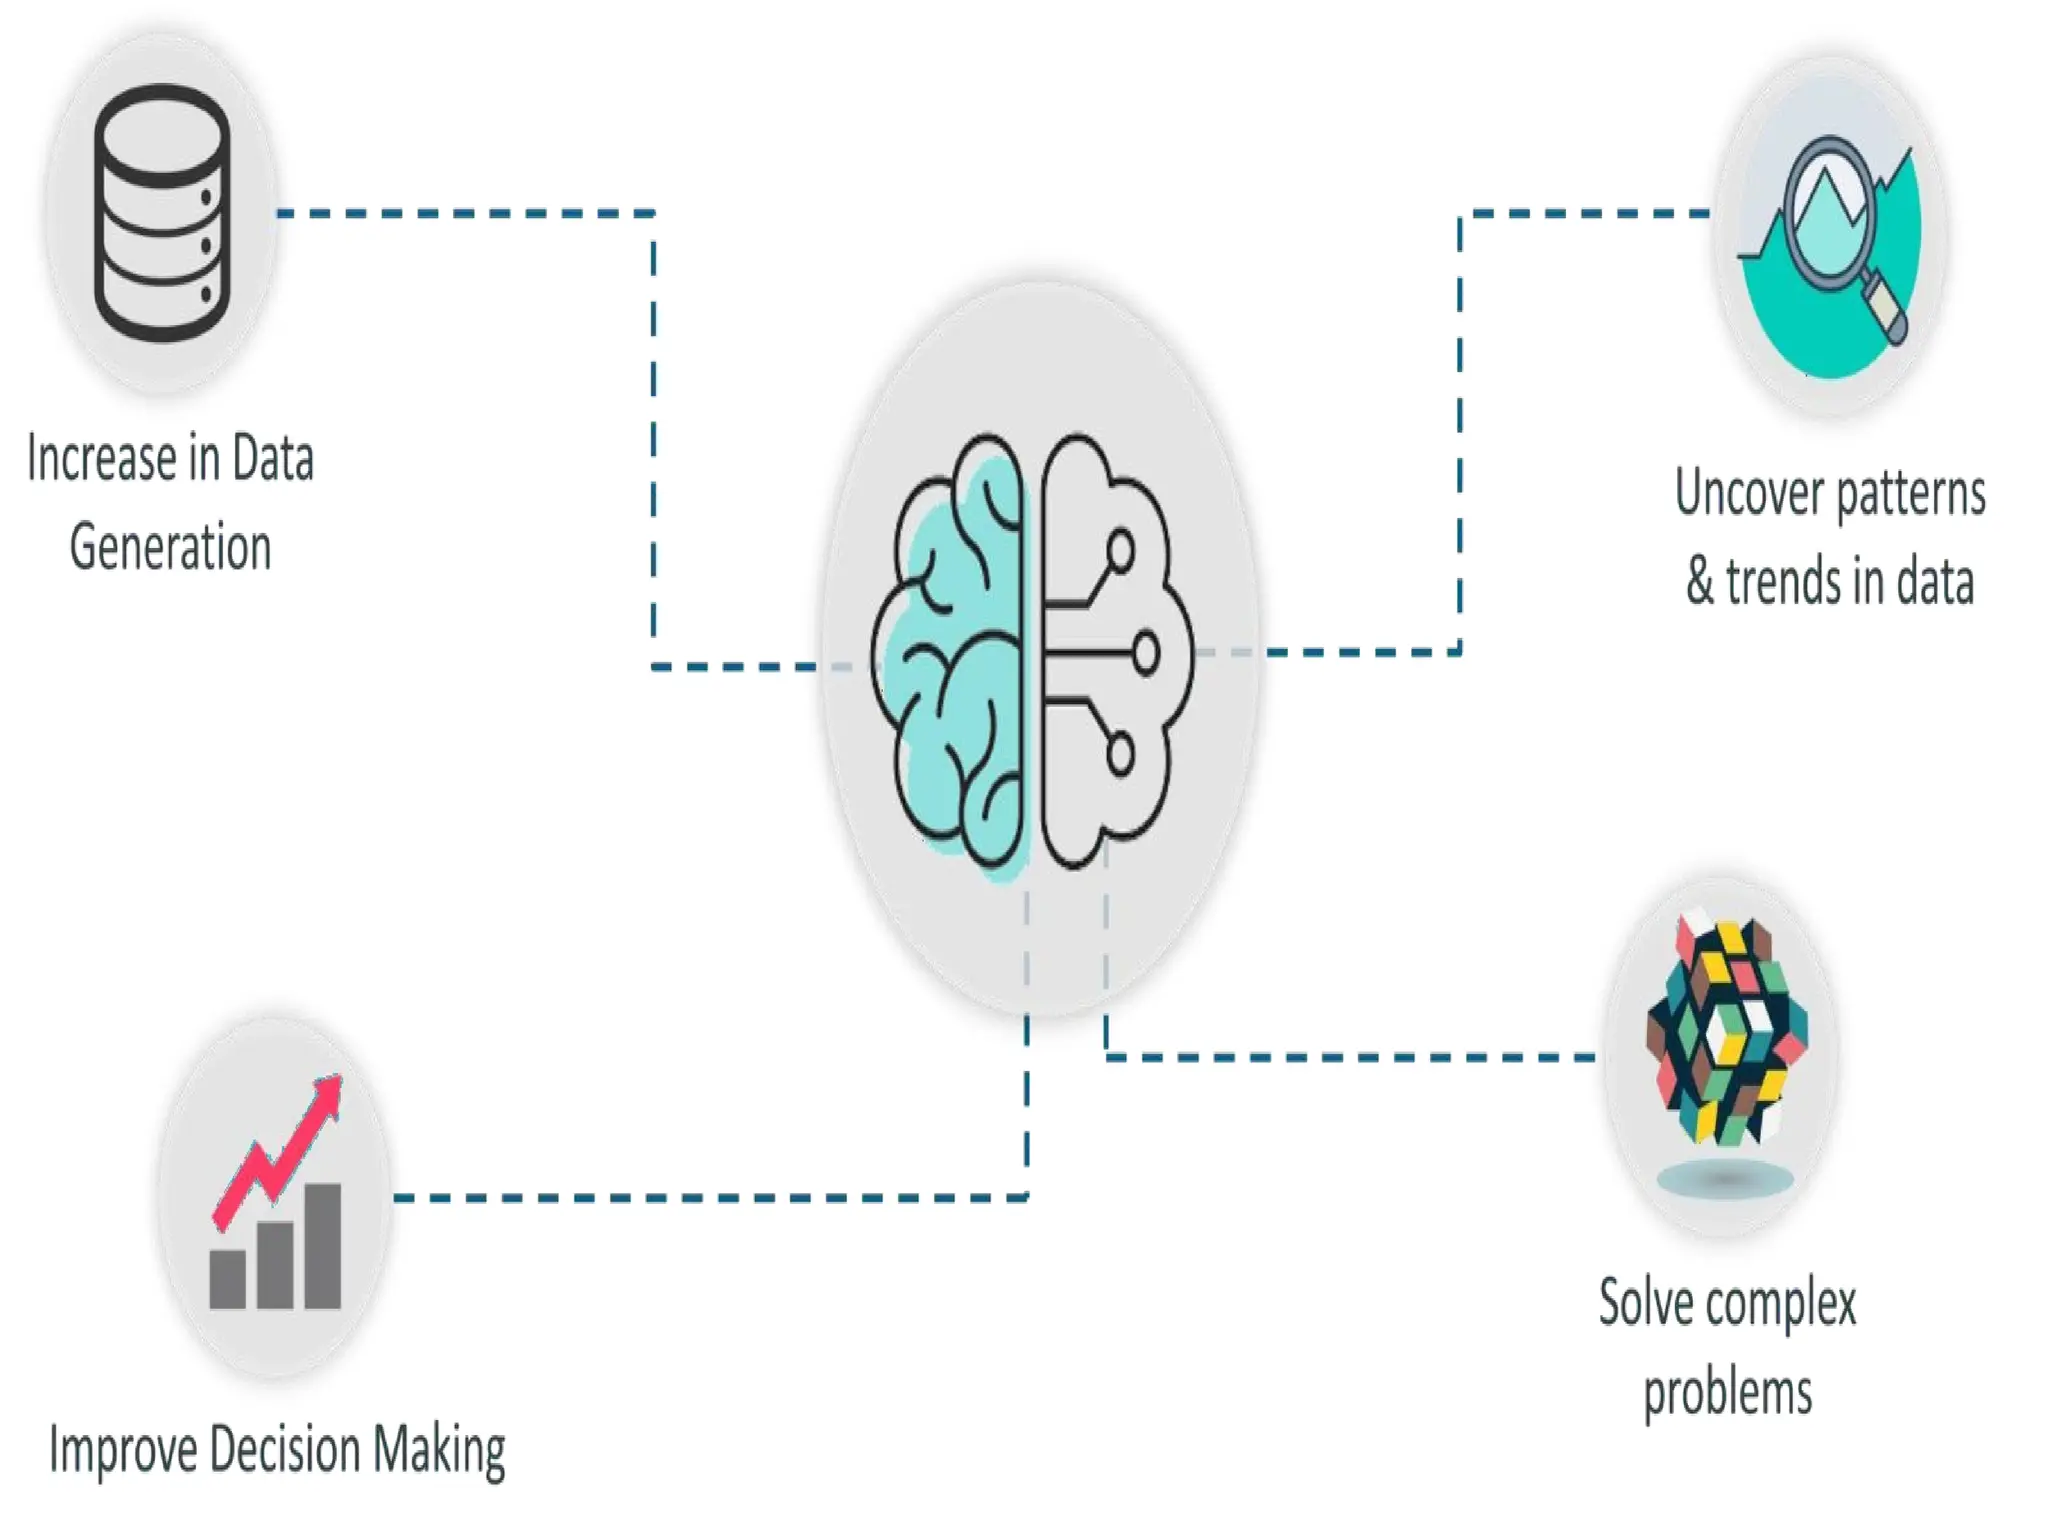
LIST OF REASONSWHY MACHINE
LEARNING IS SO IMPORTANT:
1) INCREASE IN DATA GENERATION: Due to excessive
production of data, we need a method that can be used to
structure, analyze and draw useful insights from data.
2) IMPROVE DECISION MAKING: By making use of
various algorithms, Machine Learning can be used to make better
business decisions.
For example, Machine Learning is used to forecast sales, predict
downfalls in the stock market, identify risks and anomalies, etc.
17.
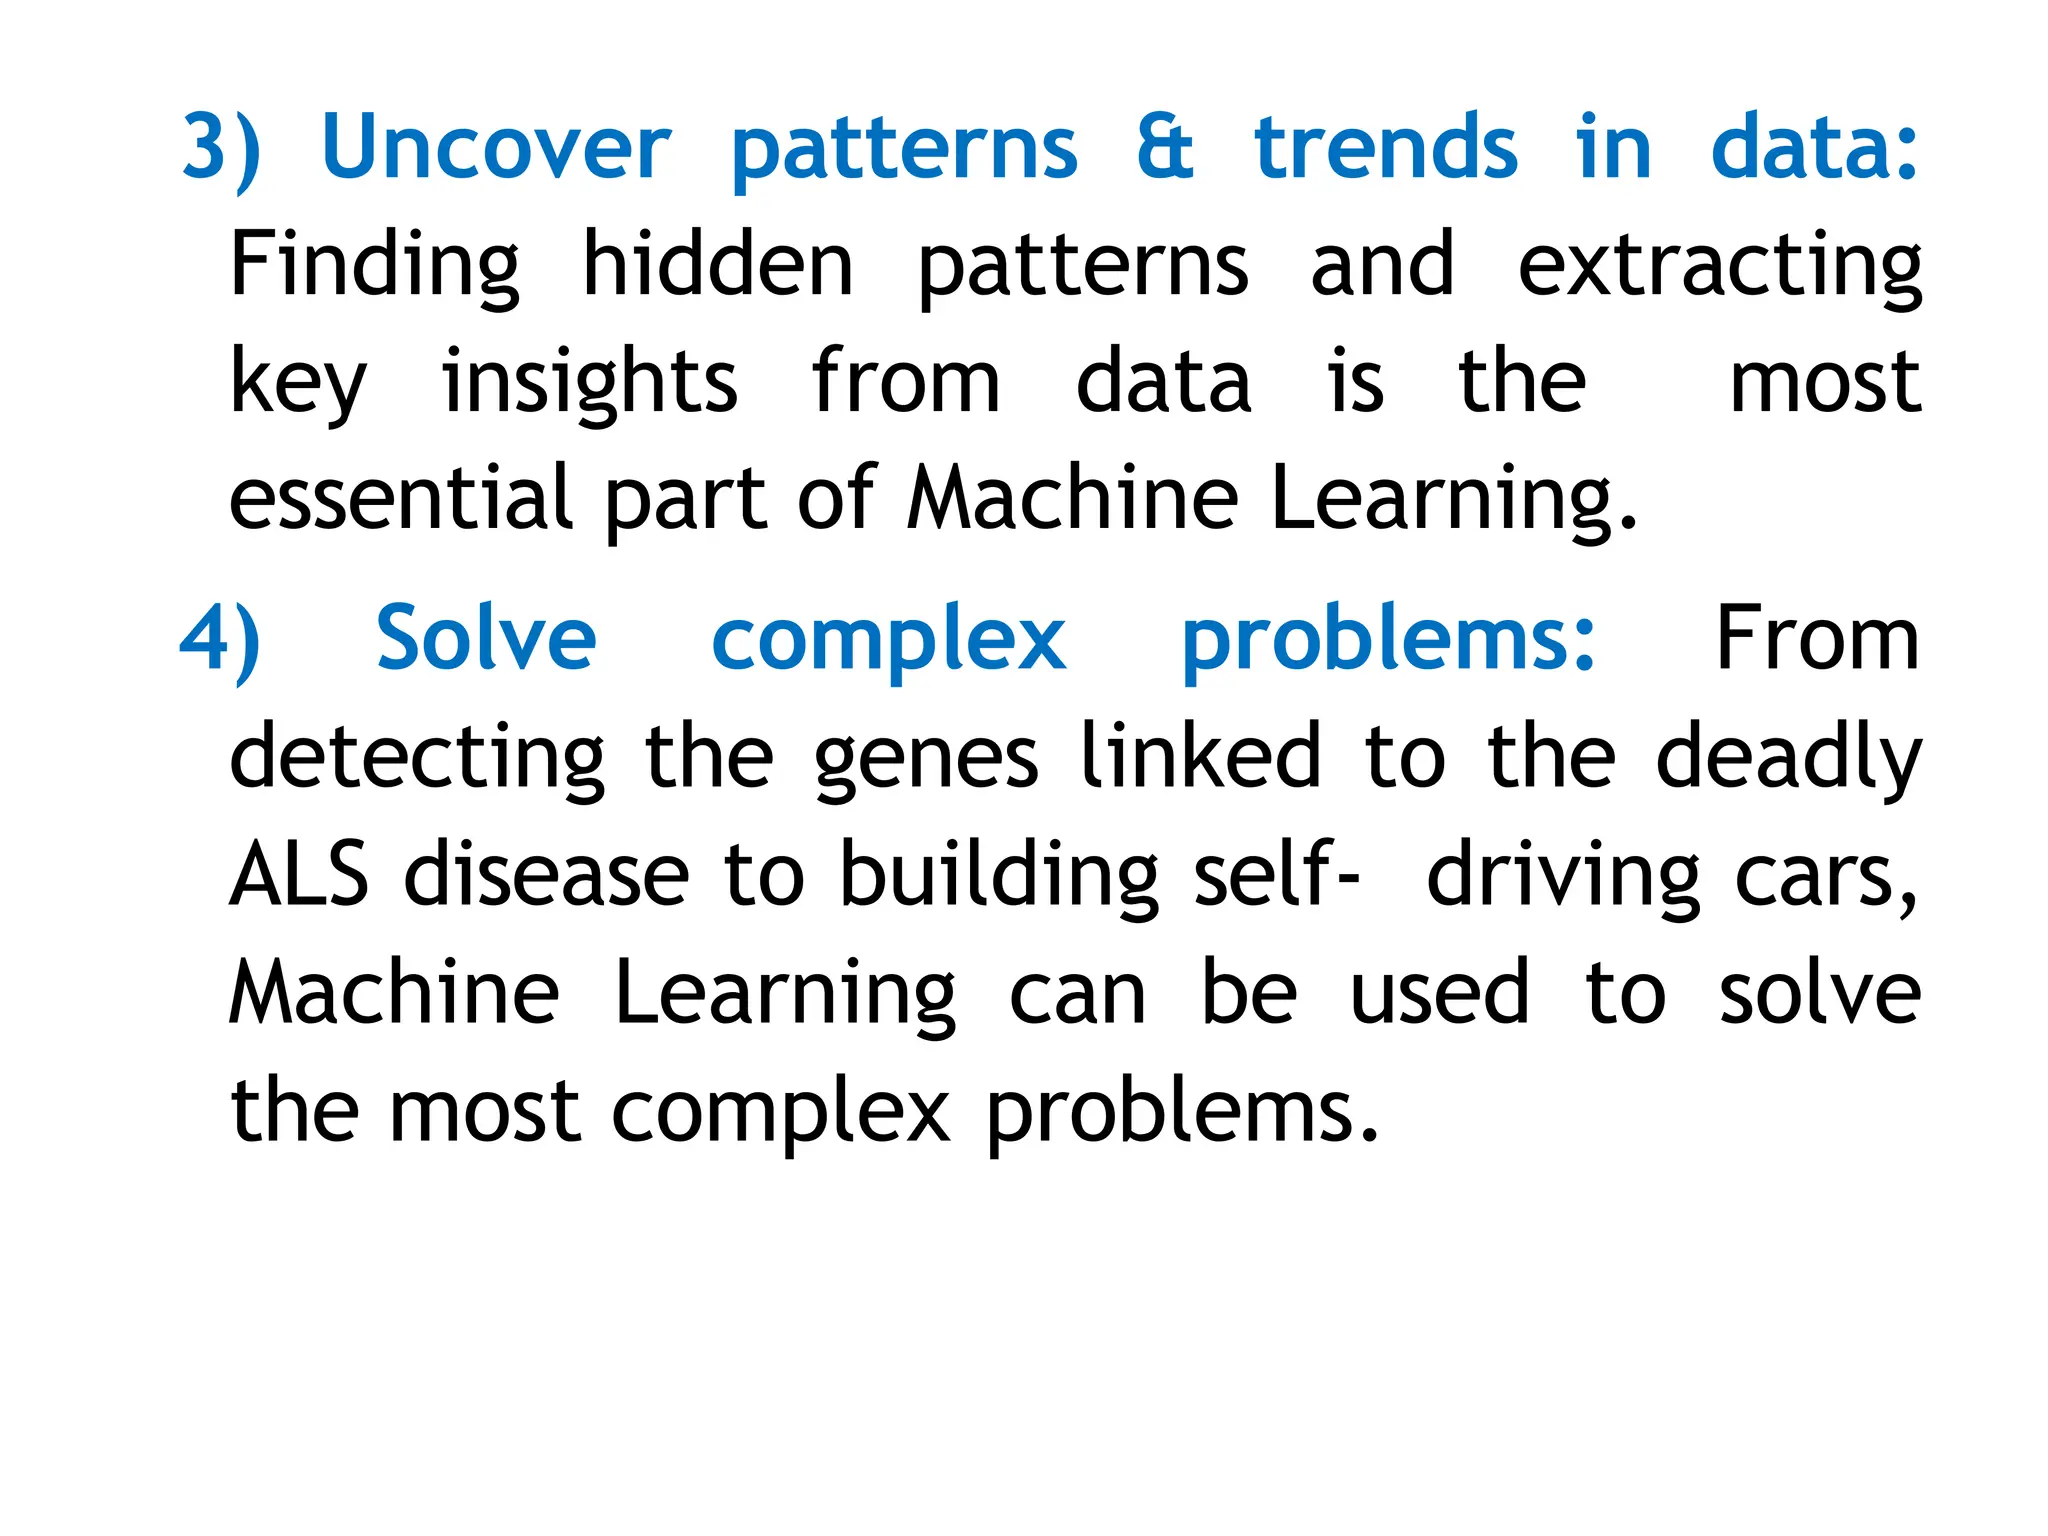
3) Uncover patterns& trends in data:
Finding hidden patterns and extracting
key insights from data is the most
essential part of Machine Learning.
4) Solve complex problems: From
detecting the genes linked to the deadly
ALS disease to building self- driving cars,
Machine Learning can be used to solve
the most complex problems.
18.
Amyotrophic lateral sclerosis(ALS) is a group of
progressive diseases that affect the nerve cells
in the brain and spinal cord that control
muscle movement.
20.
•Machine learning isa subset of Artificial
Intelligence (AI) which provides machines the
ability to learn automatically & improve
from experience without being explicitly
programmed to do so.
21.
KEY DEFINITIONS:
•Algorithm: AMachine Learning algorithm is a
set of rules and statistical techniques used to
learn patterns from data and draw significant
information from it.
22.
Model: A modelis the main component of
Machine Learning.
A model is trained by using a Machine
Learning Algorithm. An algorithm maps
all the decisions that a model is supposed
to take based on the given input, in order
to get the correct output.
23.
•Predictor Variable: Itis a feature(s) of the data that can
be used to predict the output.
•Response Variable: It is the feature or the output variable
that needs to be predicted by using the predictor
variable(s).
24.
•Training Data: TheMachine Learning
model is built using the training data. The
training data helps the model to identify
key trends and patterns essential to predict
the output.
25.
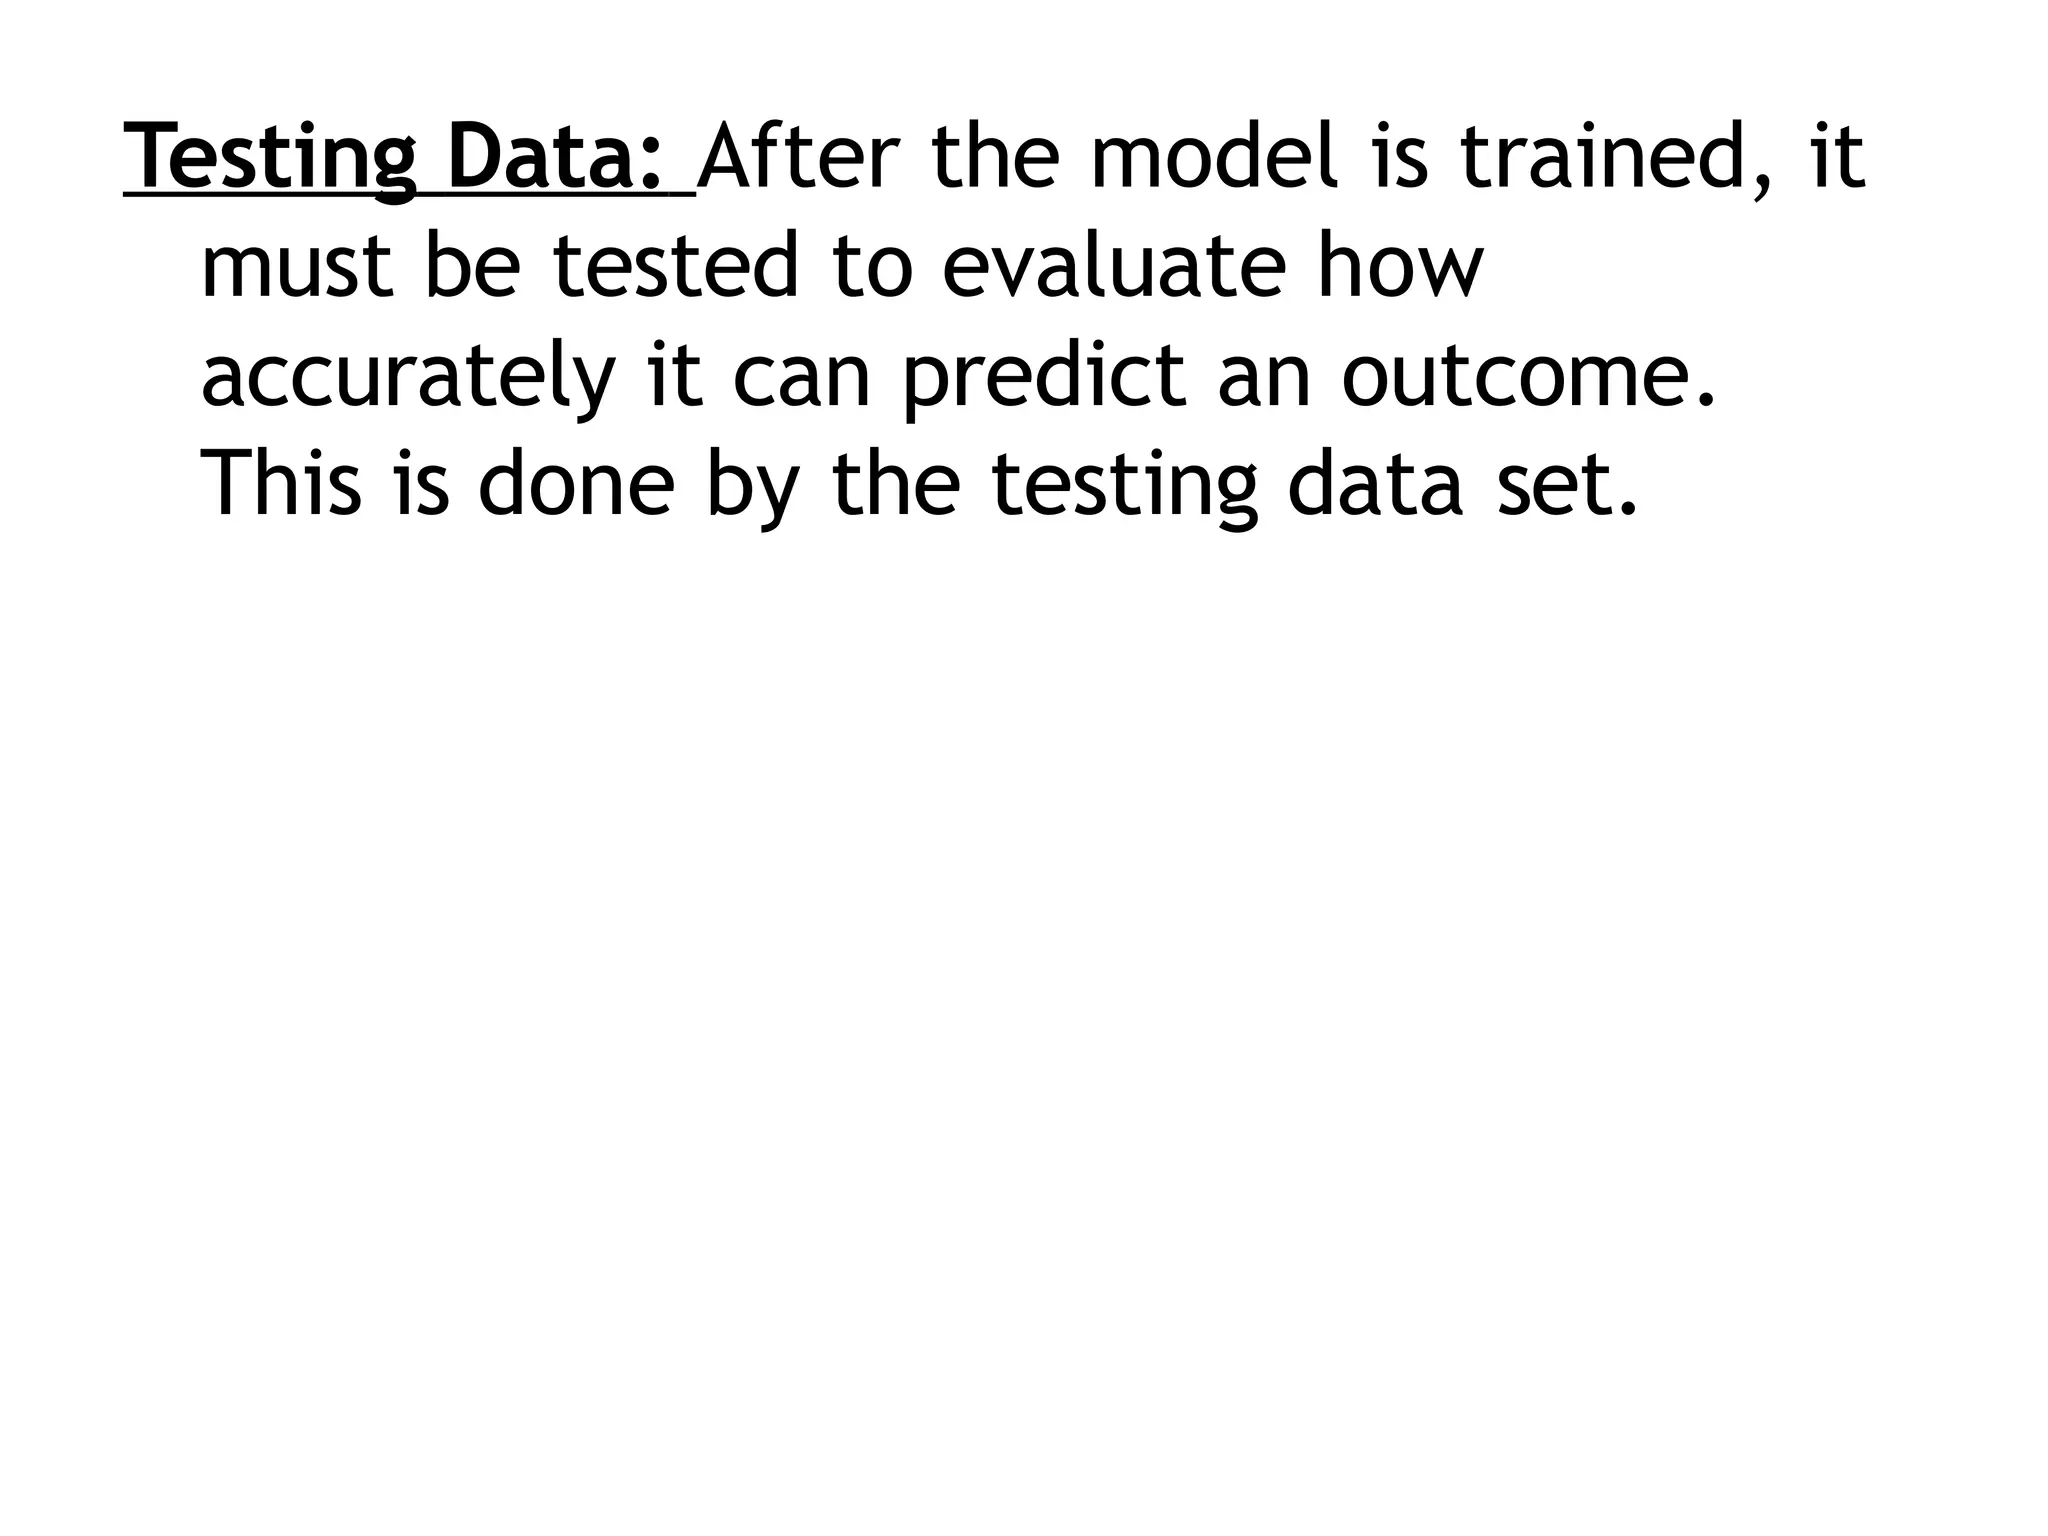
Testing Data: Afterthe model is trained, it
must be tested to evaluate how
accurately it can predict an outcome.
This is done by the testing data set.
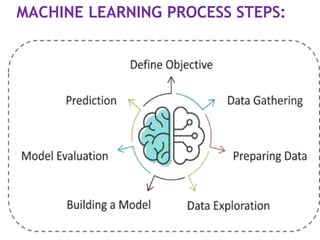
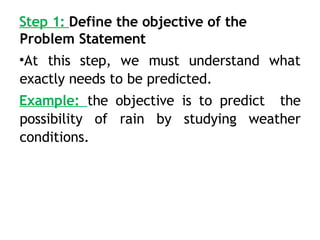
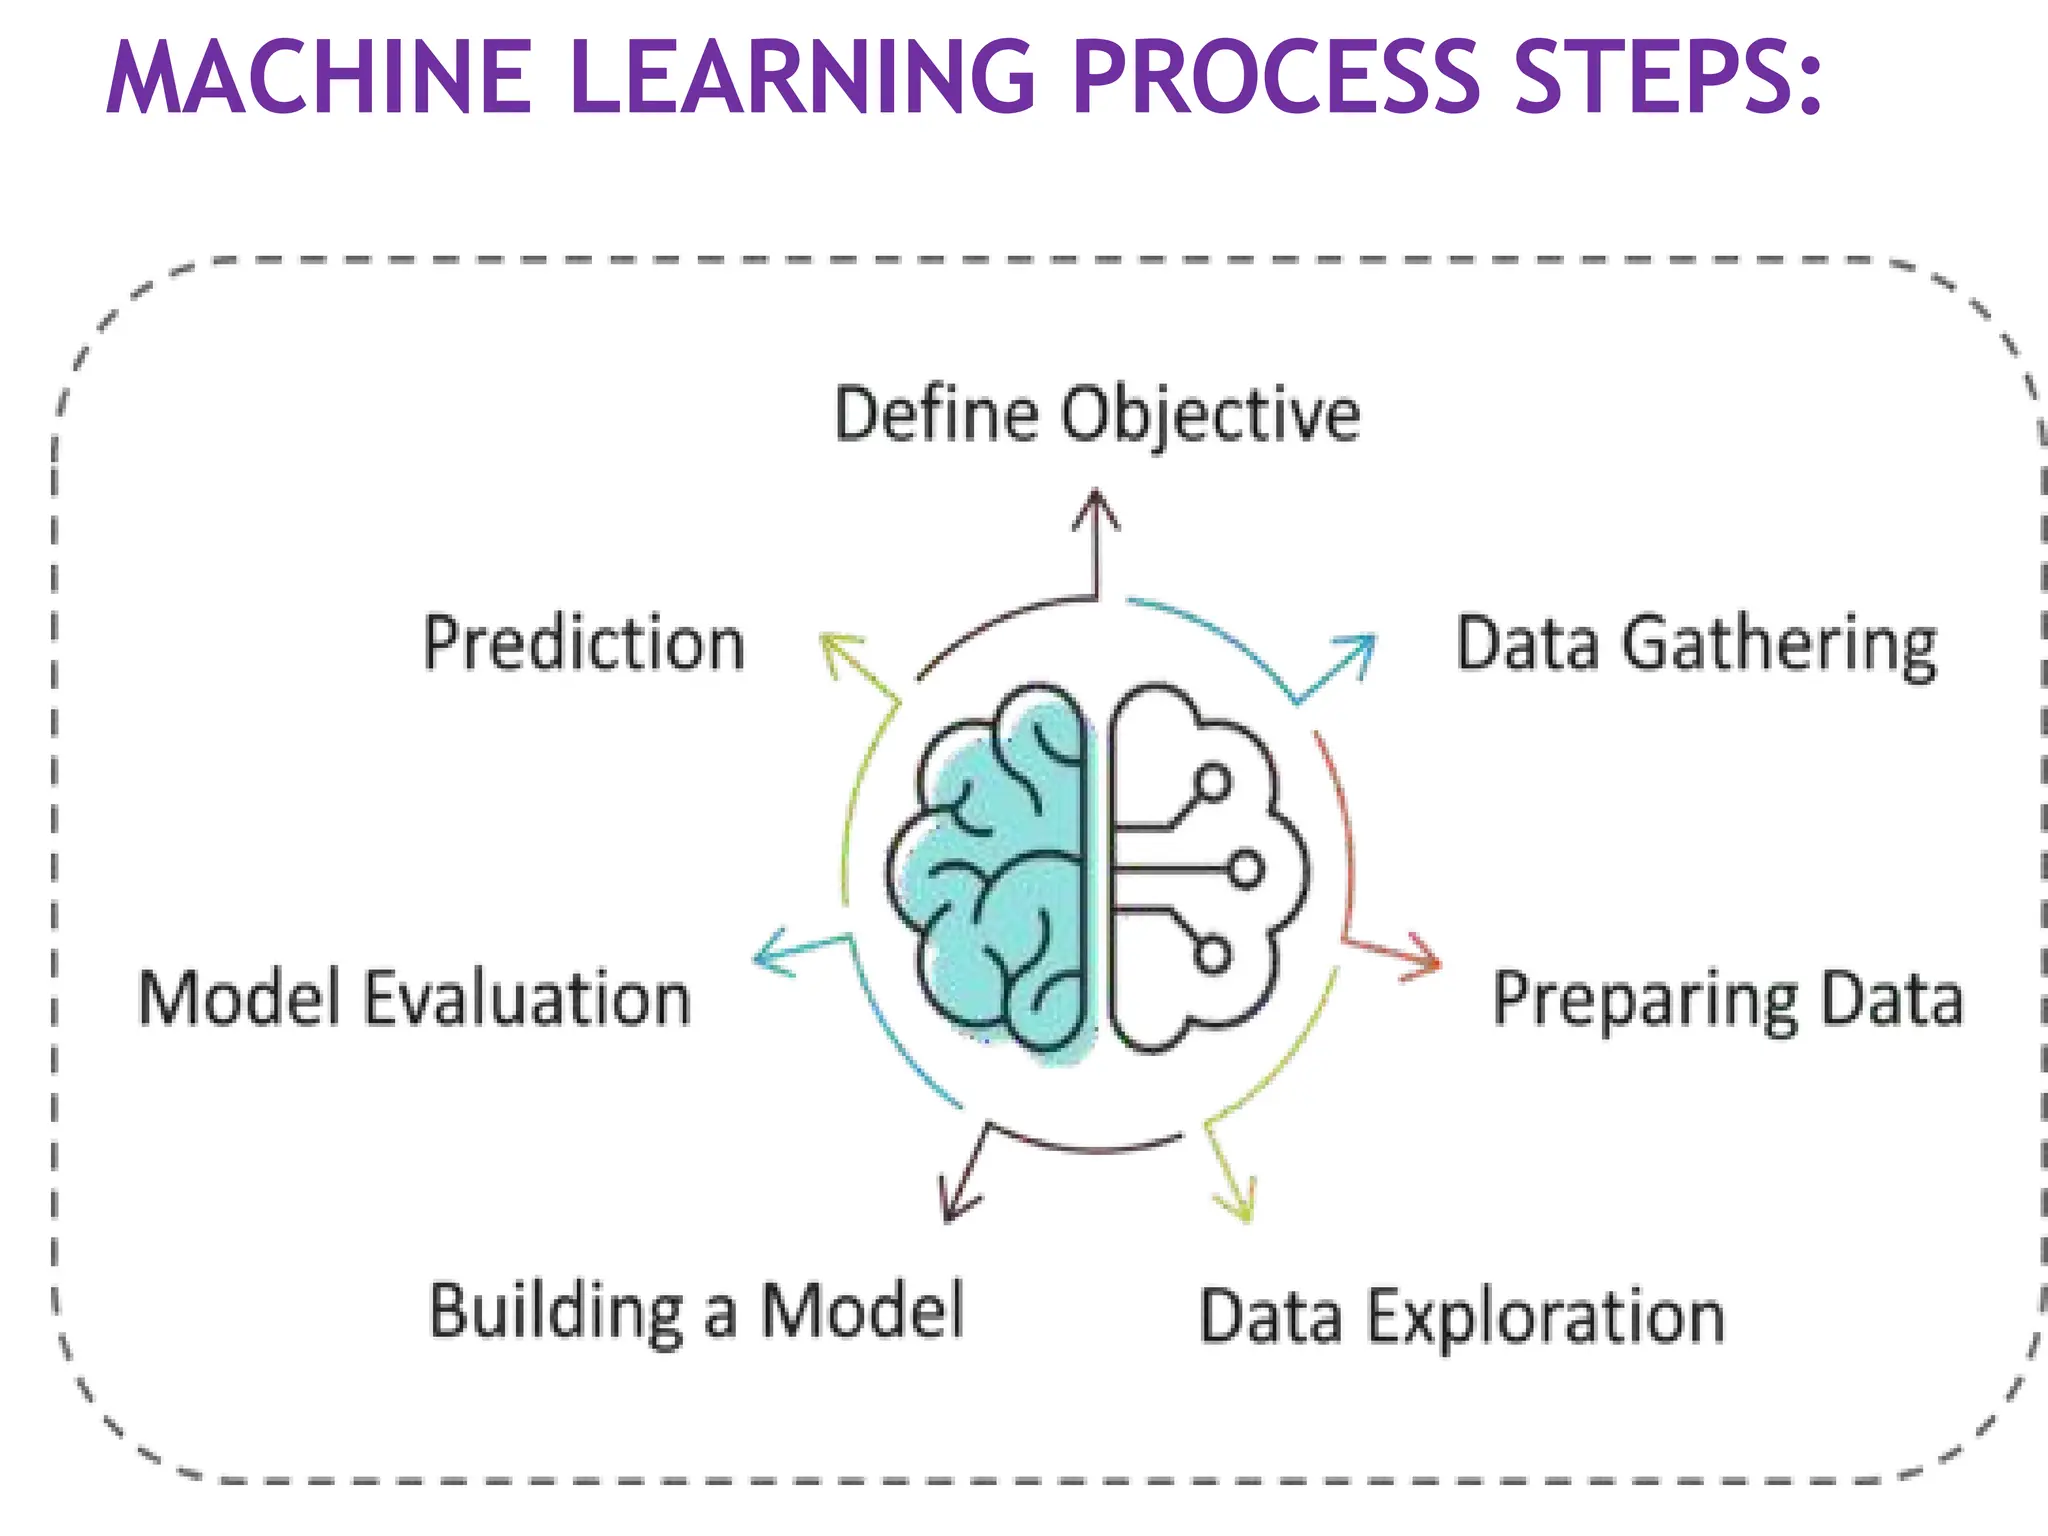
Step 1: Definethe objective of the
Problem Statement
•At this step, we must understand what
exactly needs to be predicted.
Example: the objective is to predict the
possibility of rain by studying weather
conditions.
29.
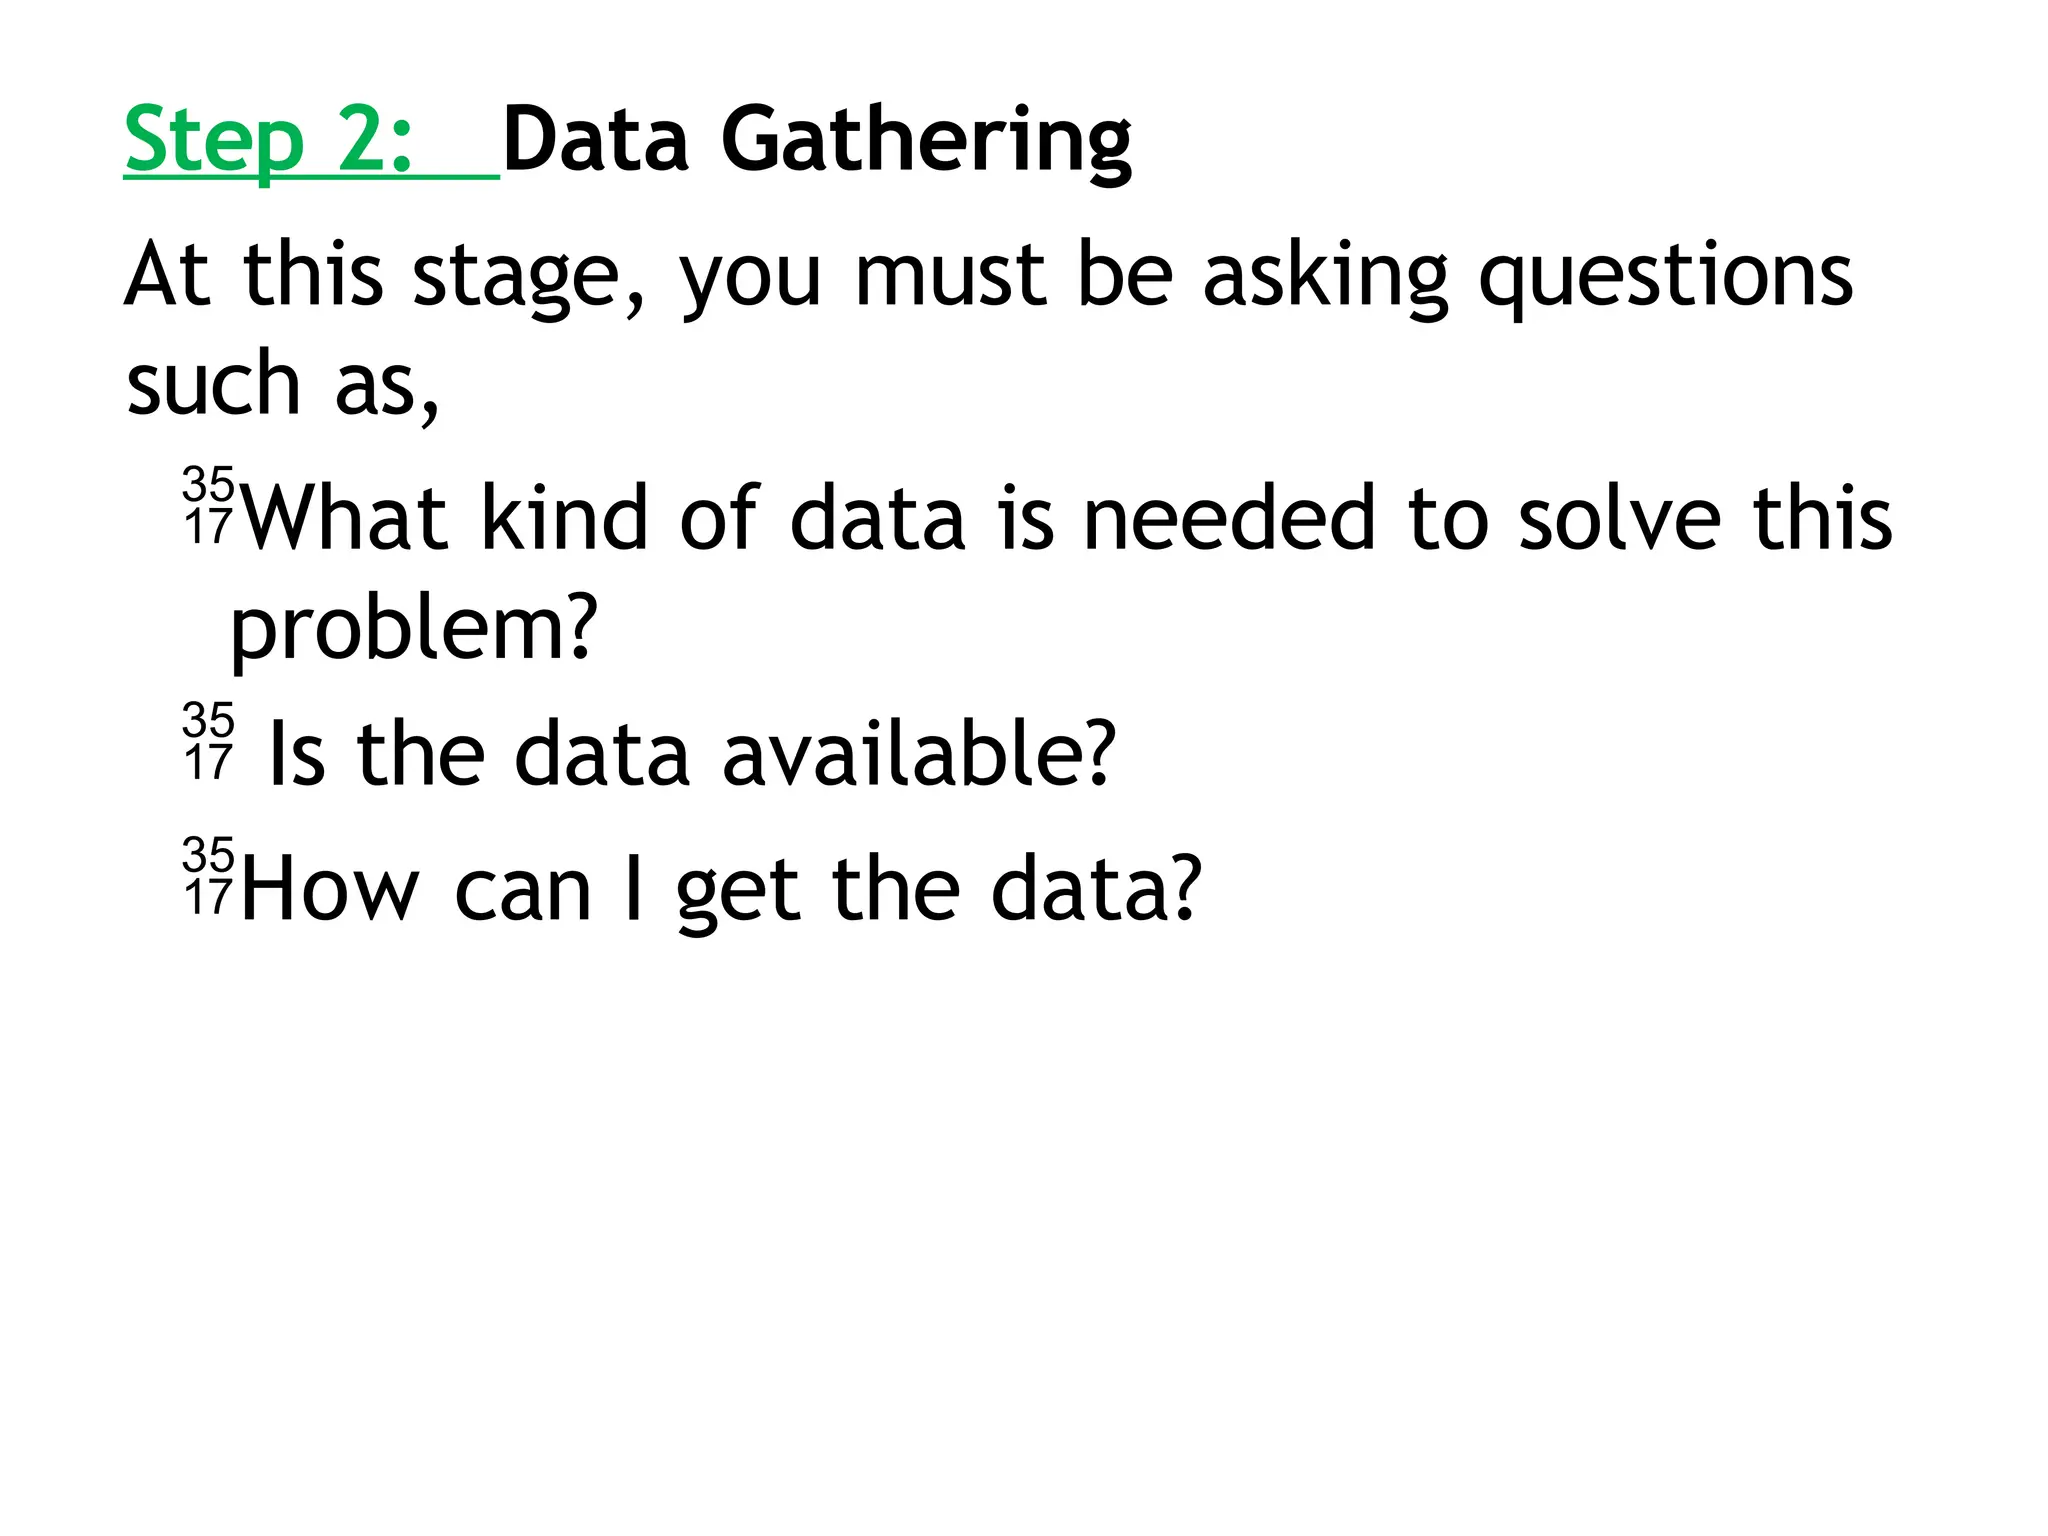
Step 2: DataGathering
At this stage, you must be asking questions
such as,
What kind of data is needed to solve this
problem?
Is the data available?
How can I get the data?
30.
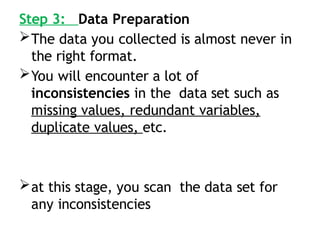
Step 3: DataPreparation
The data you collected is almost never in
the right format.
You will encounter a lot of
inconsistencies in the data set such as
missing values, redundant variables,
duplicate values, etc.
at this stage, you scan the data set for
any inconsistencies
31.
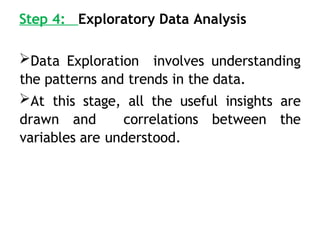
Step 4: ExploratoryData Analysis
Data Exploration involves understanding
the patterns and trends in the data.
At this stage, all the useful insights are
drawn and correlations between the
variables are understood.
32.
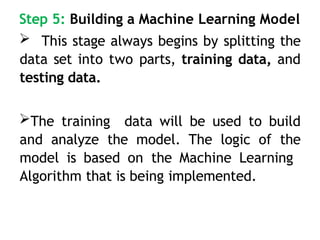
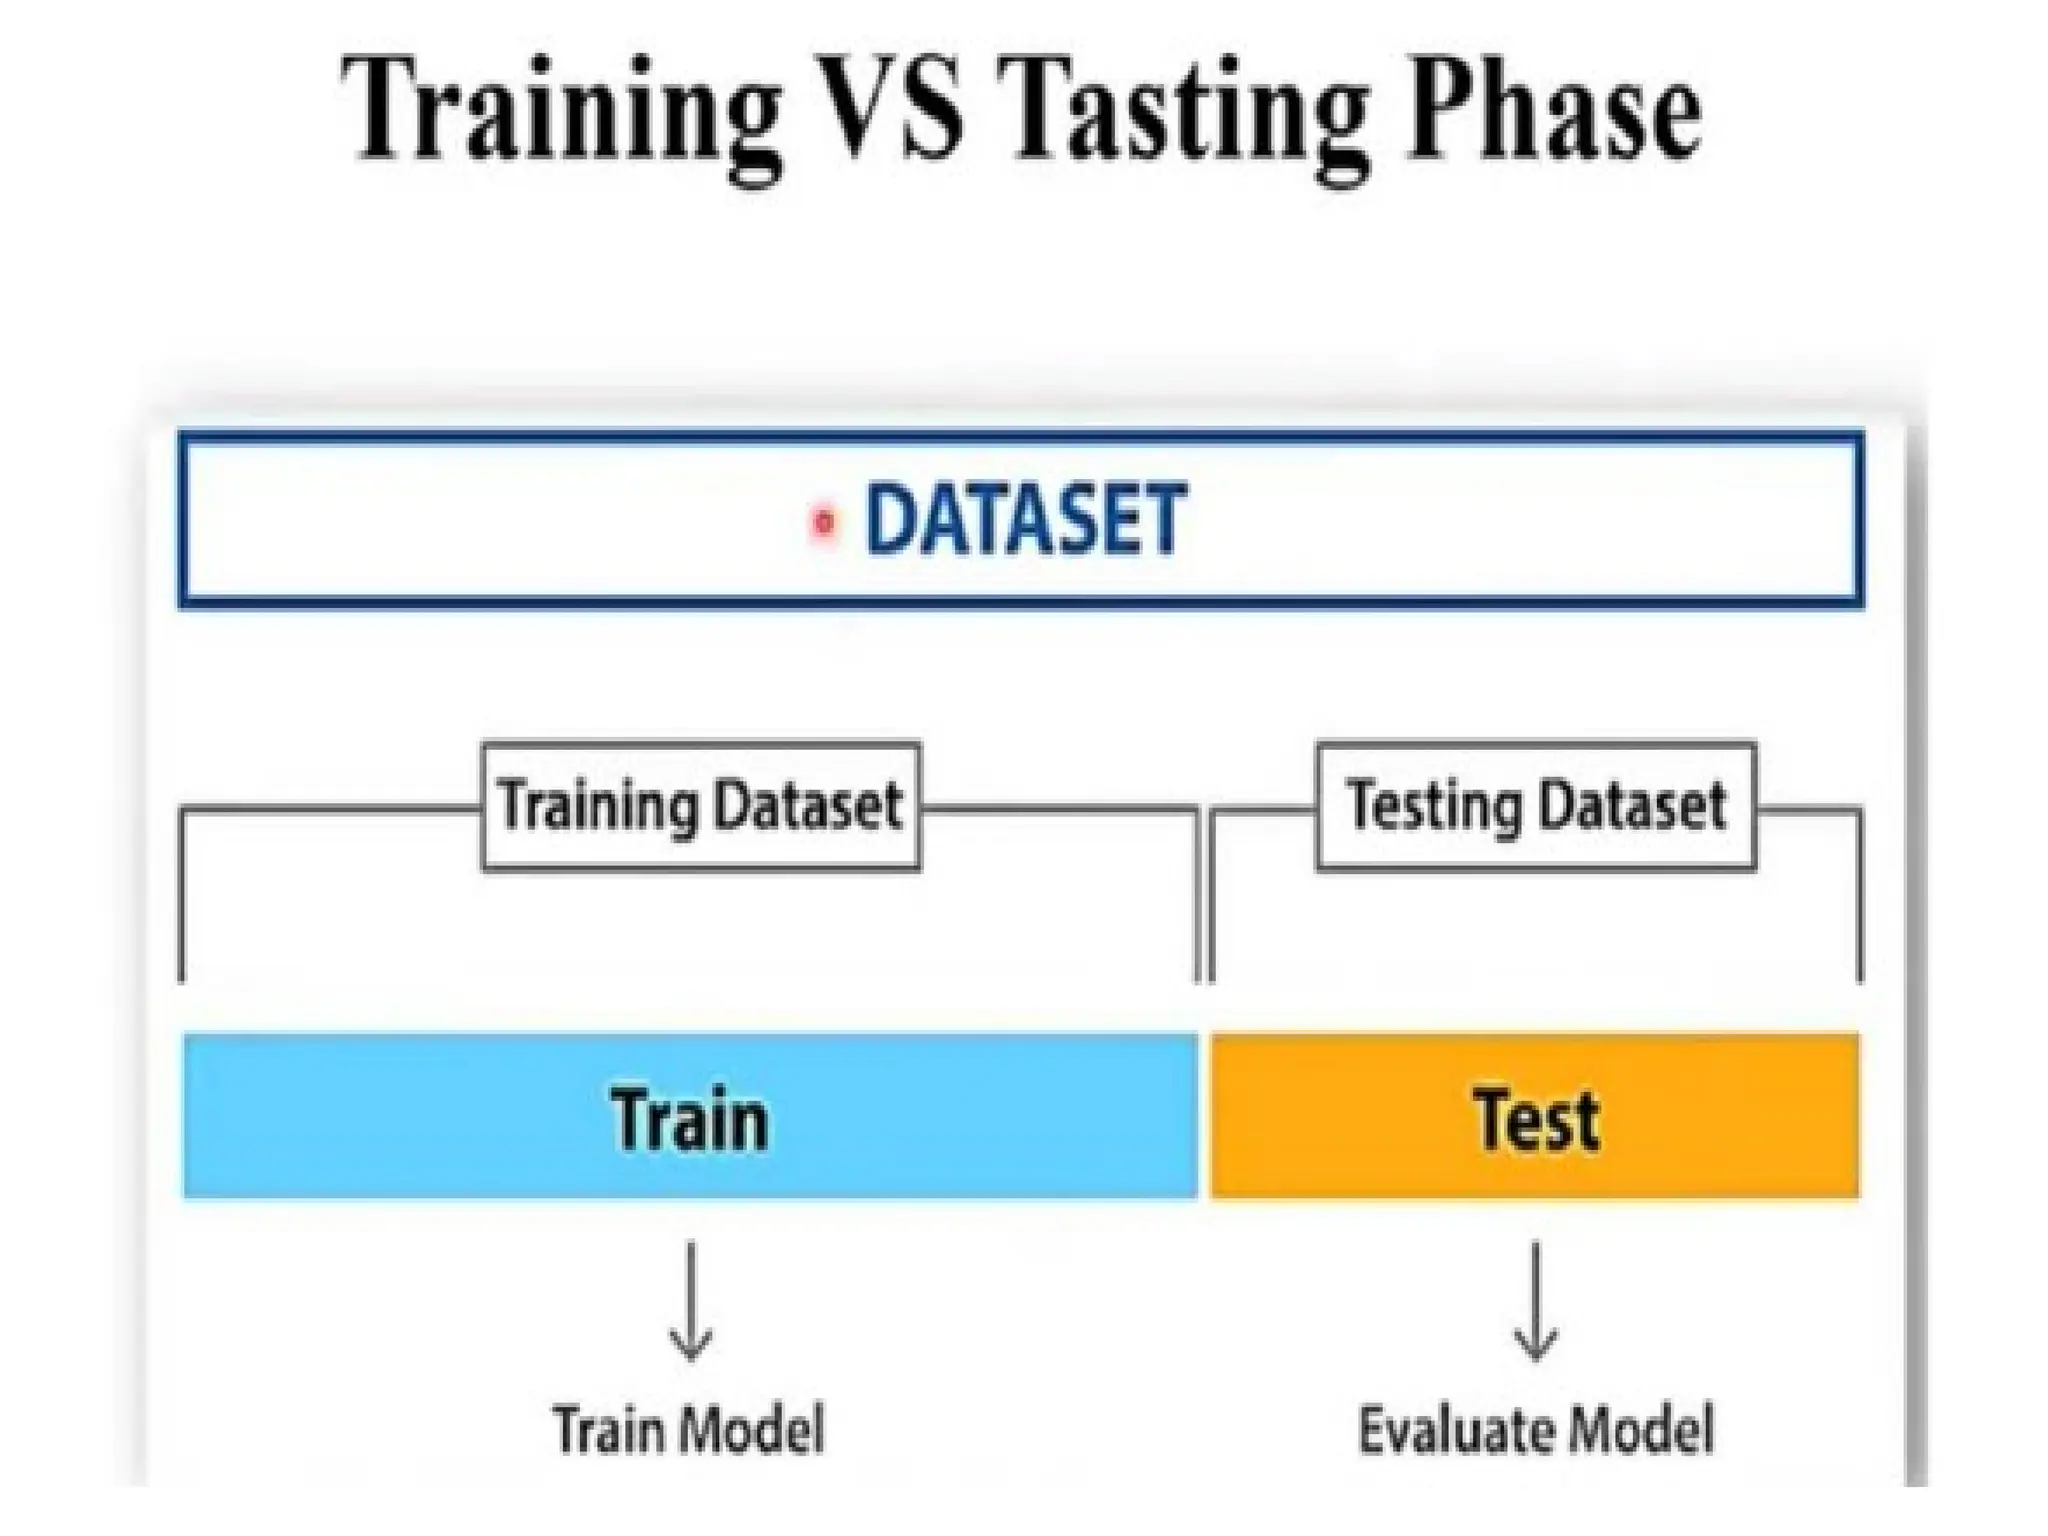
Step 5: Buildinga Machine Learning Model
This stage always begins by splitting the
data set into two parts, training data, and
testing data.
The training data will be used to build
and analyze the model. The logic of the
model is based on the Machine Learning
Algorithm that is being implemented.
33.
Example:
In the caseof predicting rainfall, since the
output will be in the form of True (if it
will rain tomorrow) or
False (no rain tomorrow).
34.
Step 6: ModelEvaluation & Optimization
After building a model by using the training
data set,
it is finally time to put the model to a
test. The testing data set is used to check
the efficiency of the model and how
accurately it can predict the outcome.
35.
Step 7: Predictions
Oncethe model is evaluated and
improved, It is finally used to make
predictions.
•Example: for predicting the occurrence of
rainfall, the output will be a categorical
variable.
36.
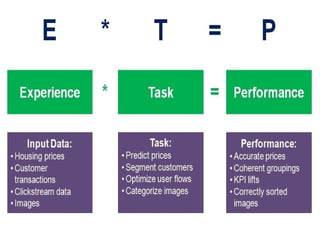
MACHINE LEARNING TYPES:
Amachine can learn to solve a
problem by following any one of the
three approaches.
1. Supervised learning.
2. Unsupervised learning.
3. Reinforcement Learning.
37.
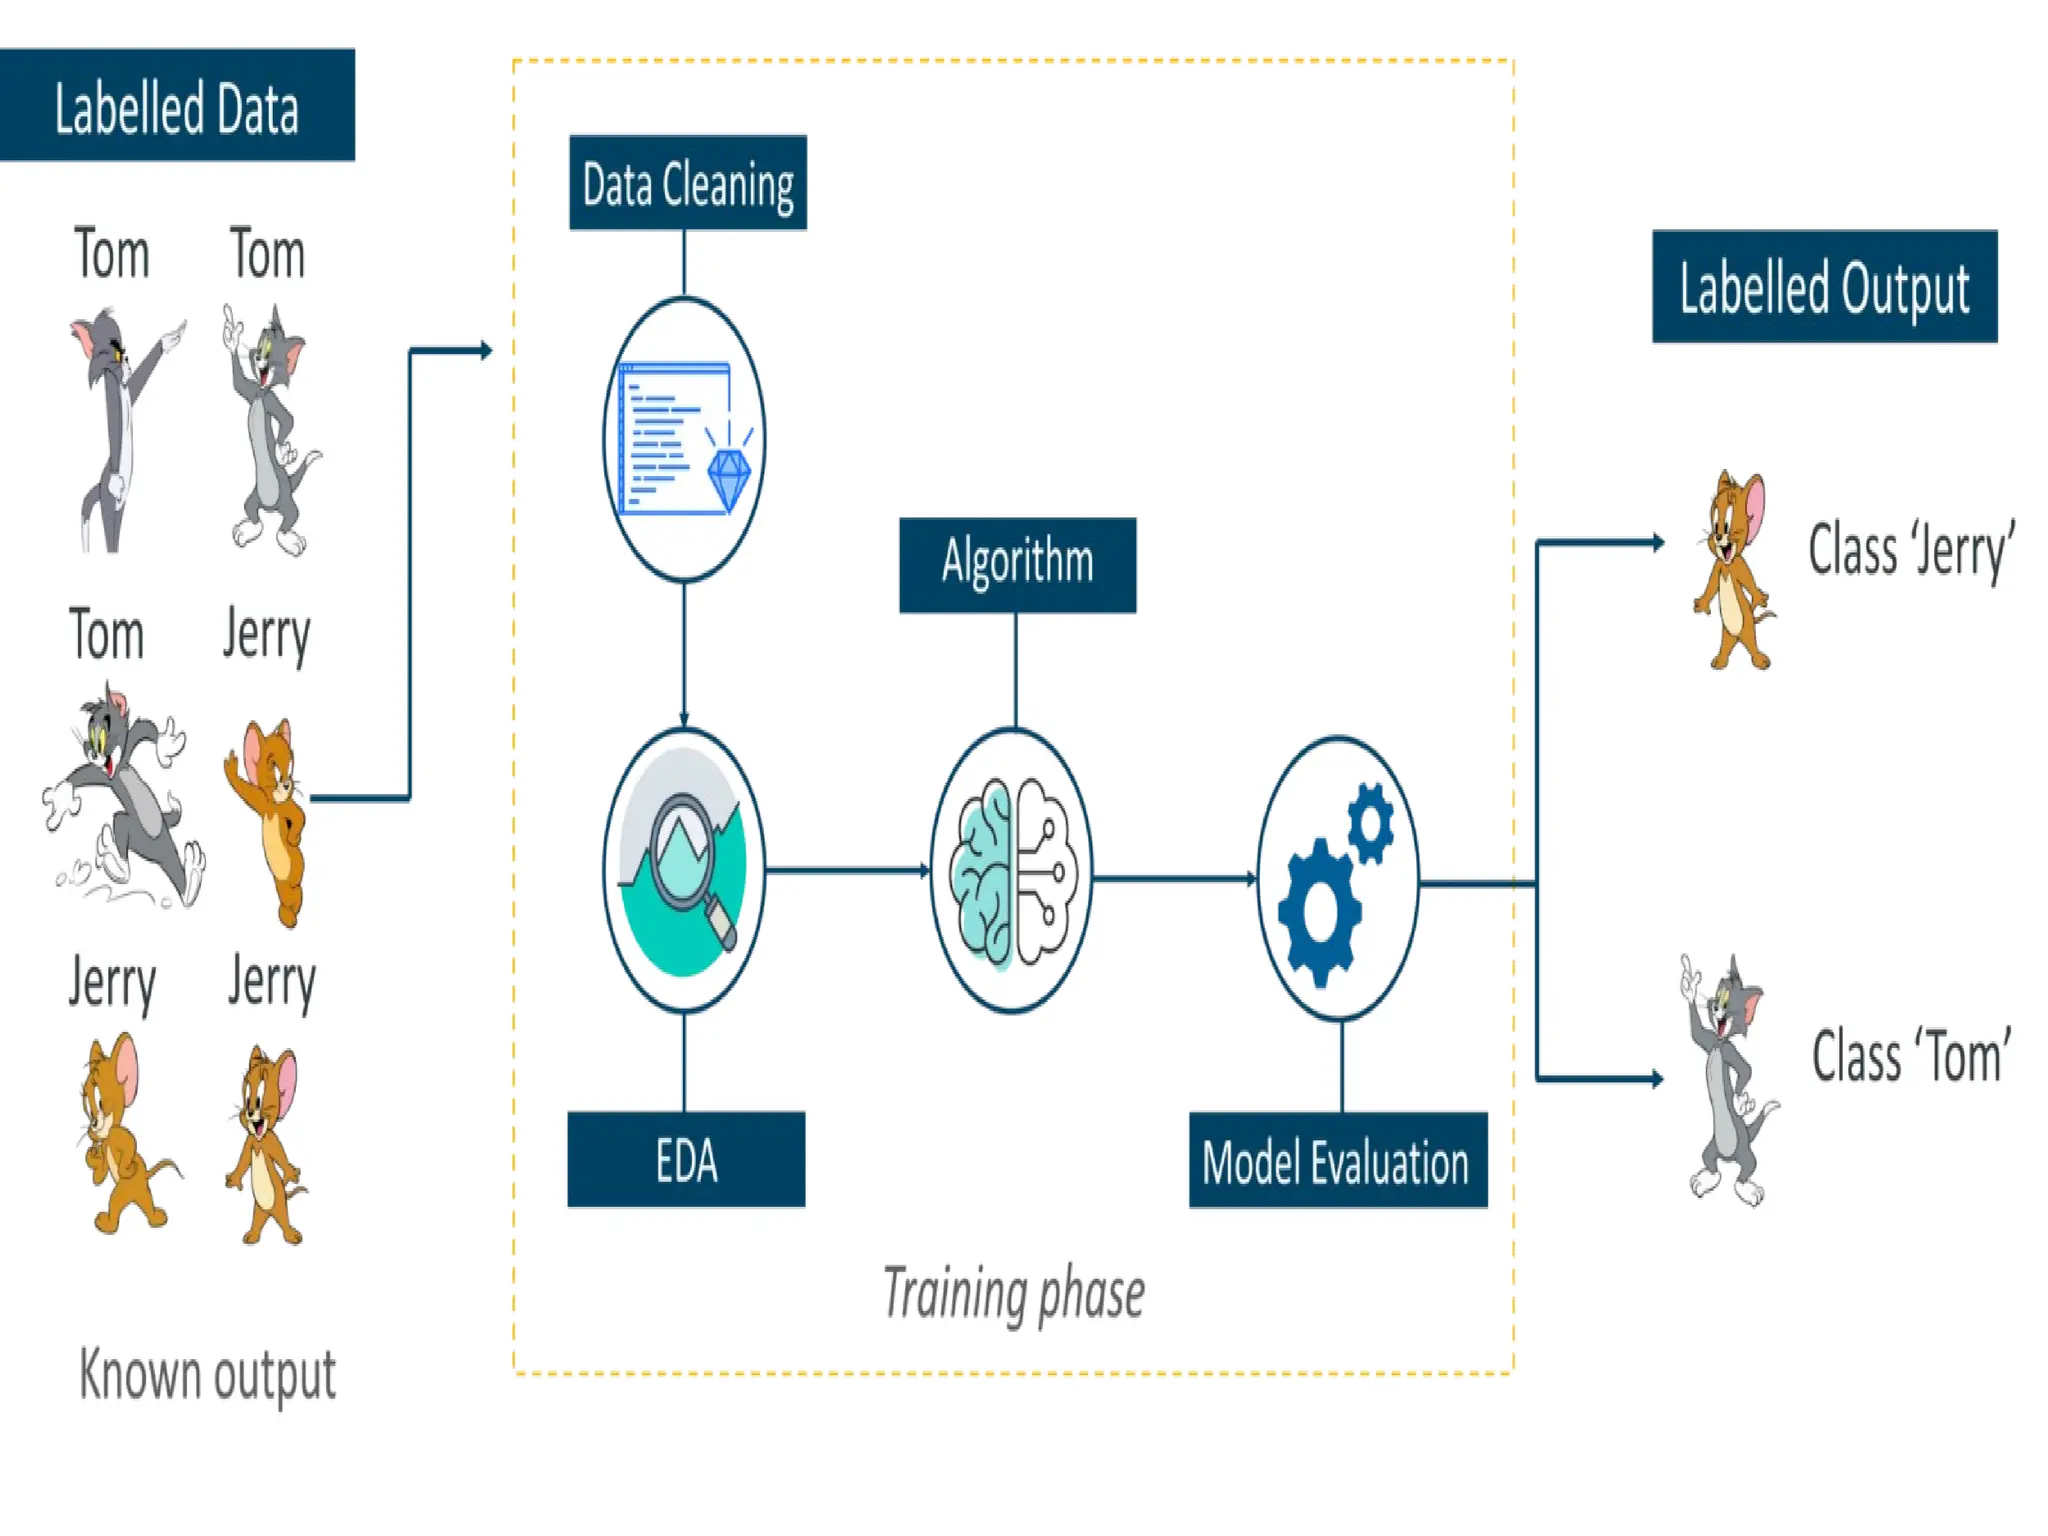
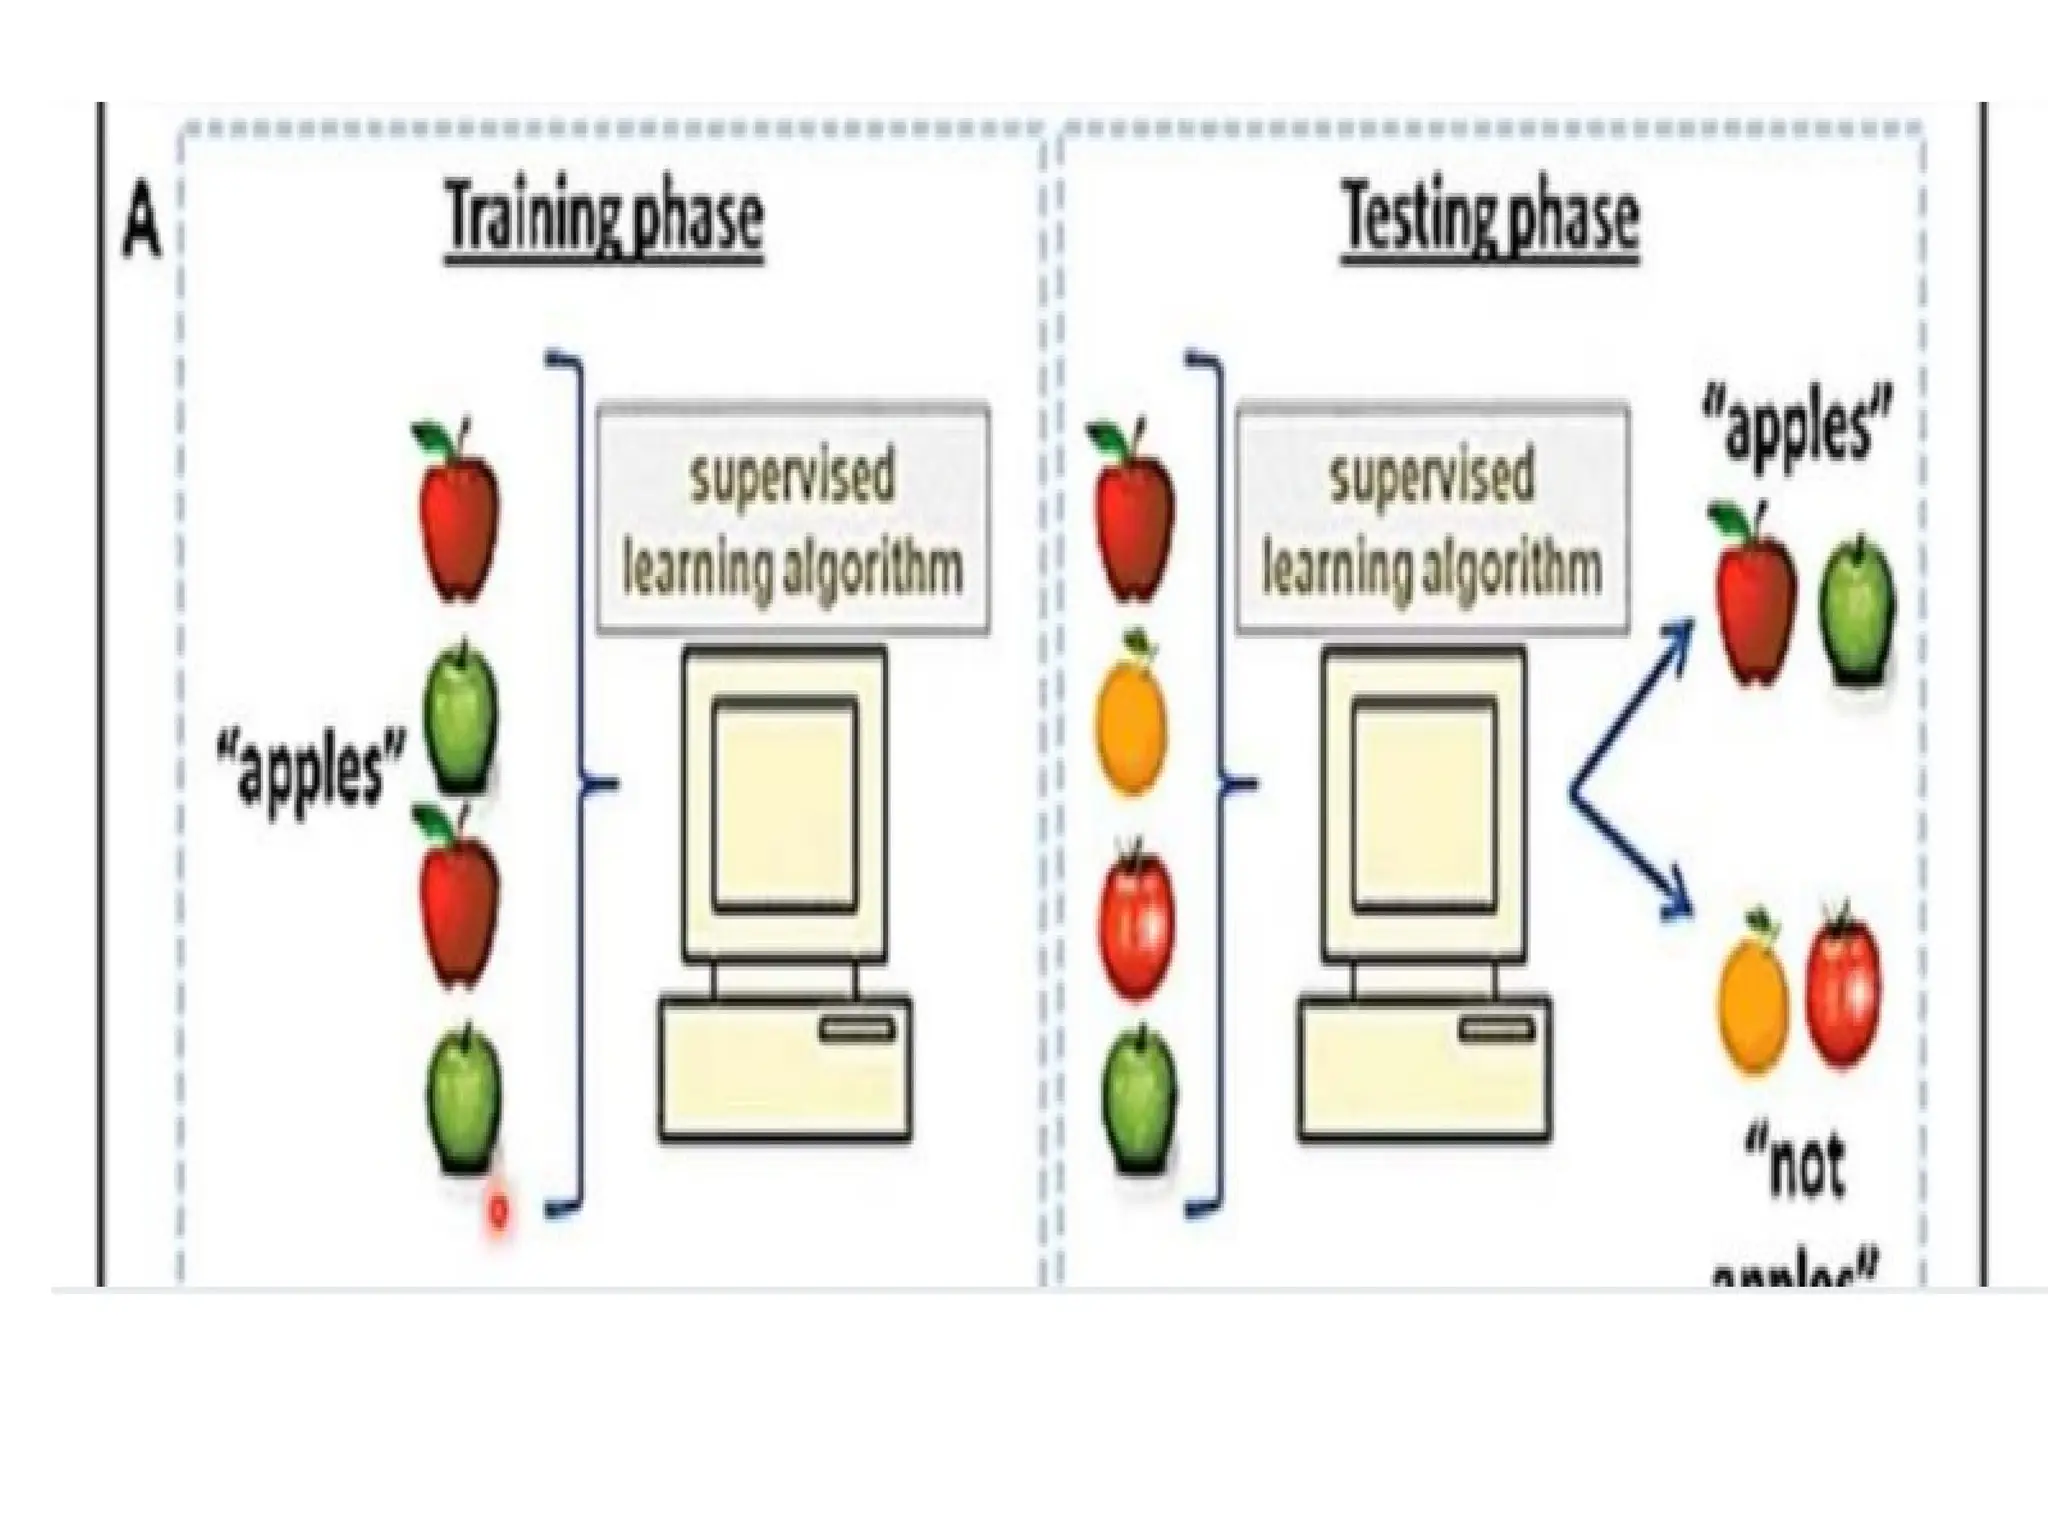
SUPERVISED LEARNING:
“Supervised learningis a technique in
which we teach or train the machine
using data which is well labeled. “
The labeled data set is nothing but the
training data set.
38.
Example:
As kids weall needed guidance to solve math
problems. Our teachers helped us understand
what addition is and how it is done.
Similarly, you can think of supervised learning
as a type of Machine Learning that involves a
guide. The labeled data set is the teacher that
will train you to understand patterns in the
data.
40.
Supervised learning examples:
1)Classification 2) regression
Classification: Classification is a supervised
machine learning method where the model
tries to predict the correct label of a given
input data.
41.
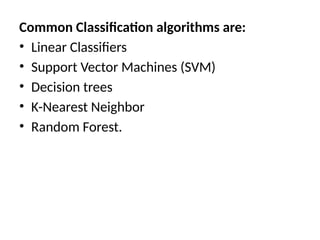
Common Classification algorithmsare:
• Linear Classifiers
• Support Vector Machines (SVM)
• Decision trees
• K-Nearest Neighbor
• Random Forest.
42.
2) Regression: Itis used to understand the
relationship between dependent and
independent variables.
It is commonly used to make projections, such
as for sales revenue for a given business.
Common Regression algorithms are:
1) Linear regression
2) Logistical regression
3) Polynomial regression
43.
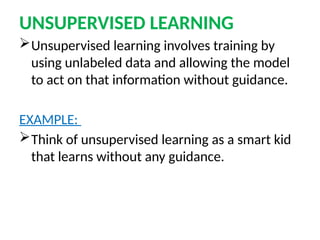
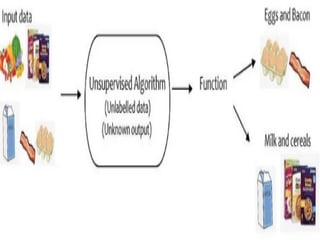
UNSUPERVISED LEARNING
Unsupervised learninginvolves training by
using unlabeled data and allowing the model
to act on that information without guidance.
EXAMPLE:
Think of unsupervised learning as a smart kid
that learns without any guidance.
45.
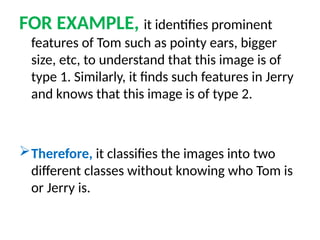
FOR EXAMPLE, itidentifies prominent
features of Tom such as pointy ears, bigger
size, etc, to understand that this image is of
type 1. Similarly, it finds such features in Jerry
and knows that this image is of type 2.
Therefore, it classifies the images into two
different classes without knowing who Tom is
or Jerry is.
46.
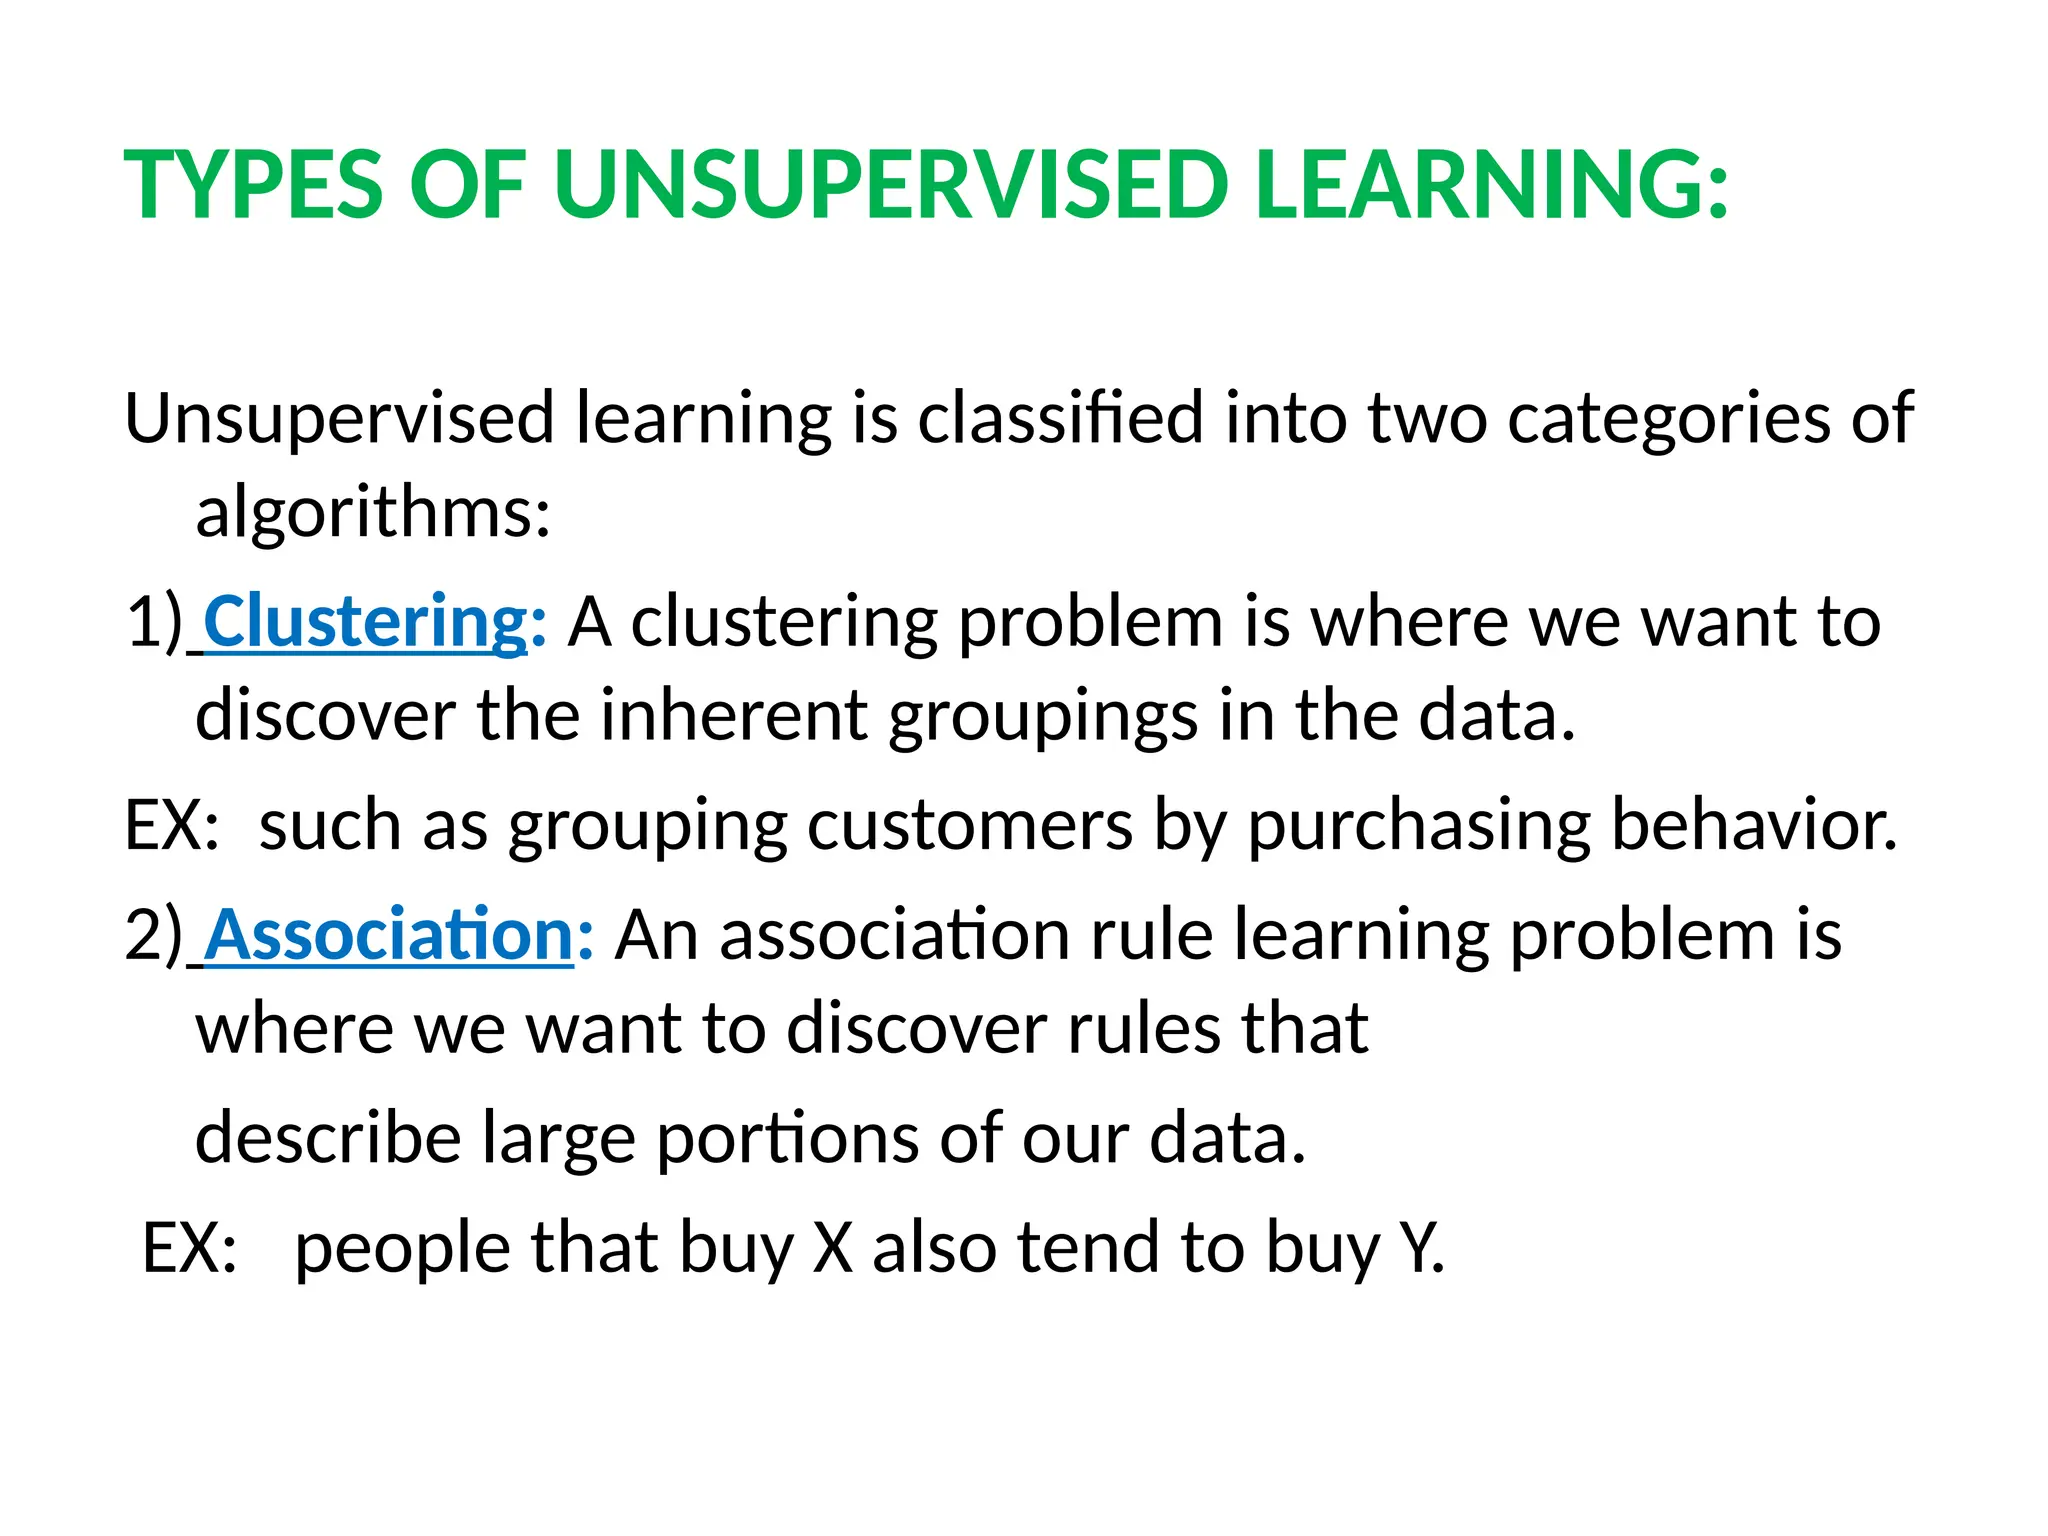
TYPES OF UNSUPERVISEDLEARNING:
Unsupervised learning is classified into two categories of
algorithms:
1) Clustering: A clustering problem is where we want to
discover the inherent groupings in the data.
EX: such as grouping customers by purchasing behavior.
2) Association: An association rule learning problem is
where we want to discover rules that
describe large portions of our data.
EX: people that buy X also tend to buy Y.
47.
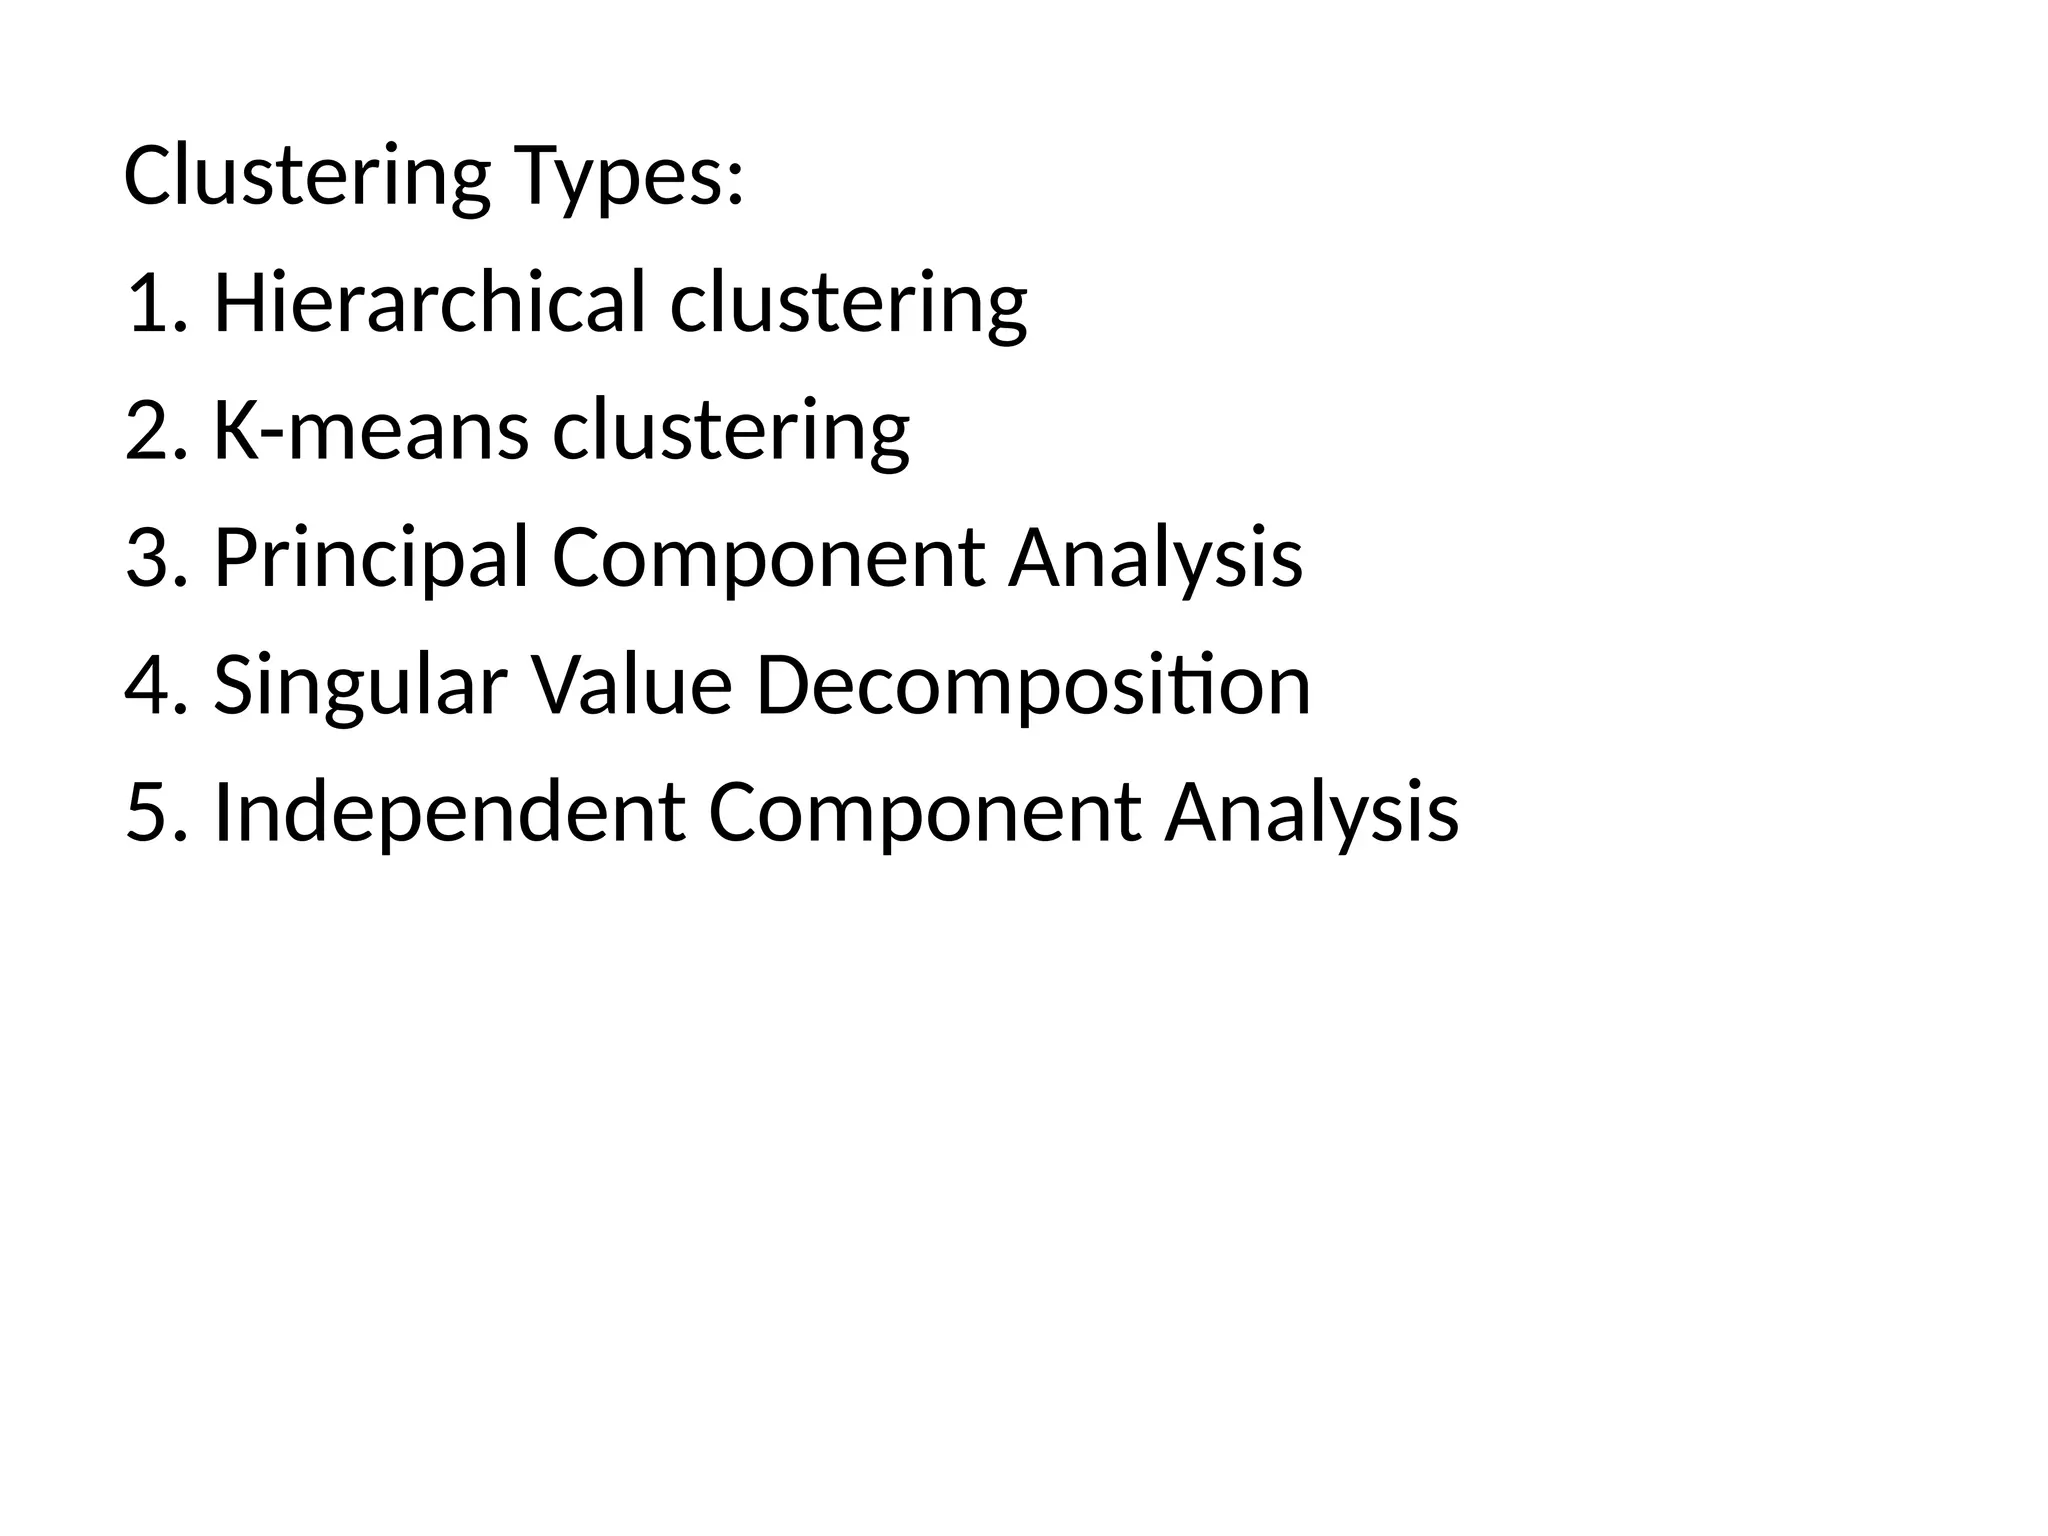
Clustering Types:
1. Hierarchicalclustering
2. K-means clustering
3. Principal Component Analysis
4. Singular Value Decomposition
5. Independent Component Analysis
MAIN CHALLENGES OFMACHINE
LEARNING
During the development phase our focus is to
select a learning algorithm and train it on
some data.
The two things that might be a problem are a
bad algorithm or bad data, or perhaps both of
them.
50.
The following aresome of the challenges
of ML
1. Not enough training data.
Even for very simple problems you typically
need thousands of examples, and for
complex problems such as image or speech
recognition you may need millions of
examples
51.
2. Poor Qualityof data:
if your training data has lots of errors,
outliers, and noise, it will make it impossible
for your machine learning model to detect a
proper underlying pattern. Hence, it will not
perform well.
“Most Data Scientists spend a significant part
of their time in cleaning data”.
52.
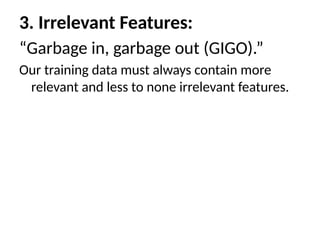
3. Irrelevant Features:
“Garbagein, garbage out (GIGO).”
Our training data must always contain more
relevant and less to none irrelevant features.
53.
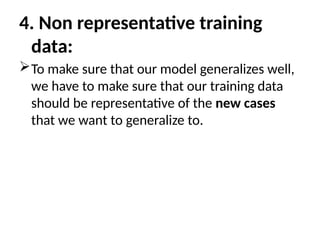
4. Non representativetraining
data:
To make sure that our model generalizes well,
we have to make sure that our training data
should be representative of the new cases
that we want to generalize to.
54.
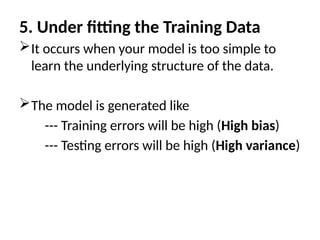
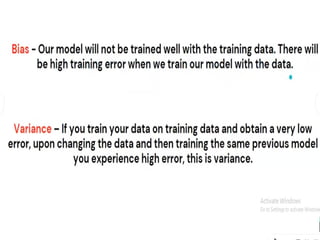
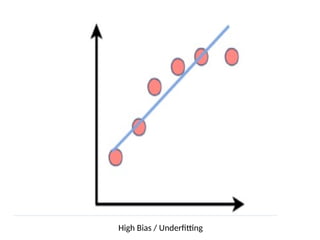
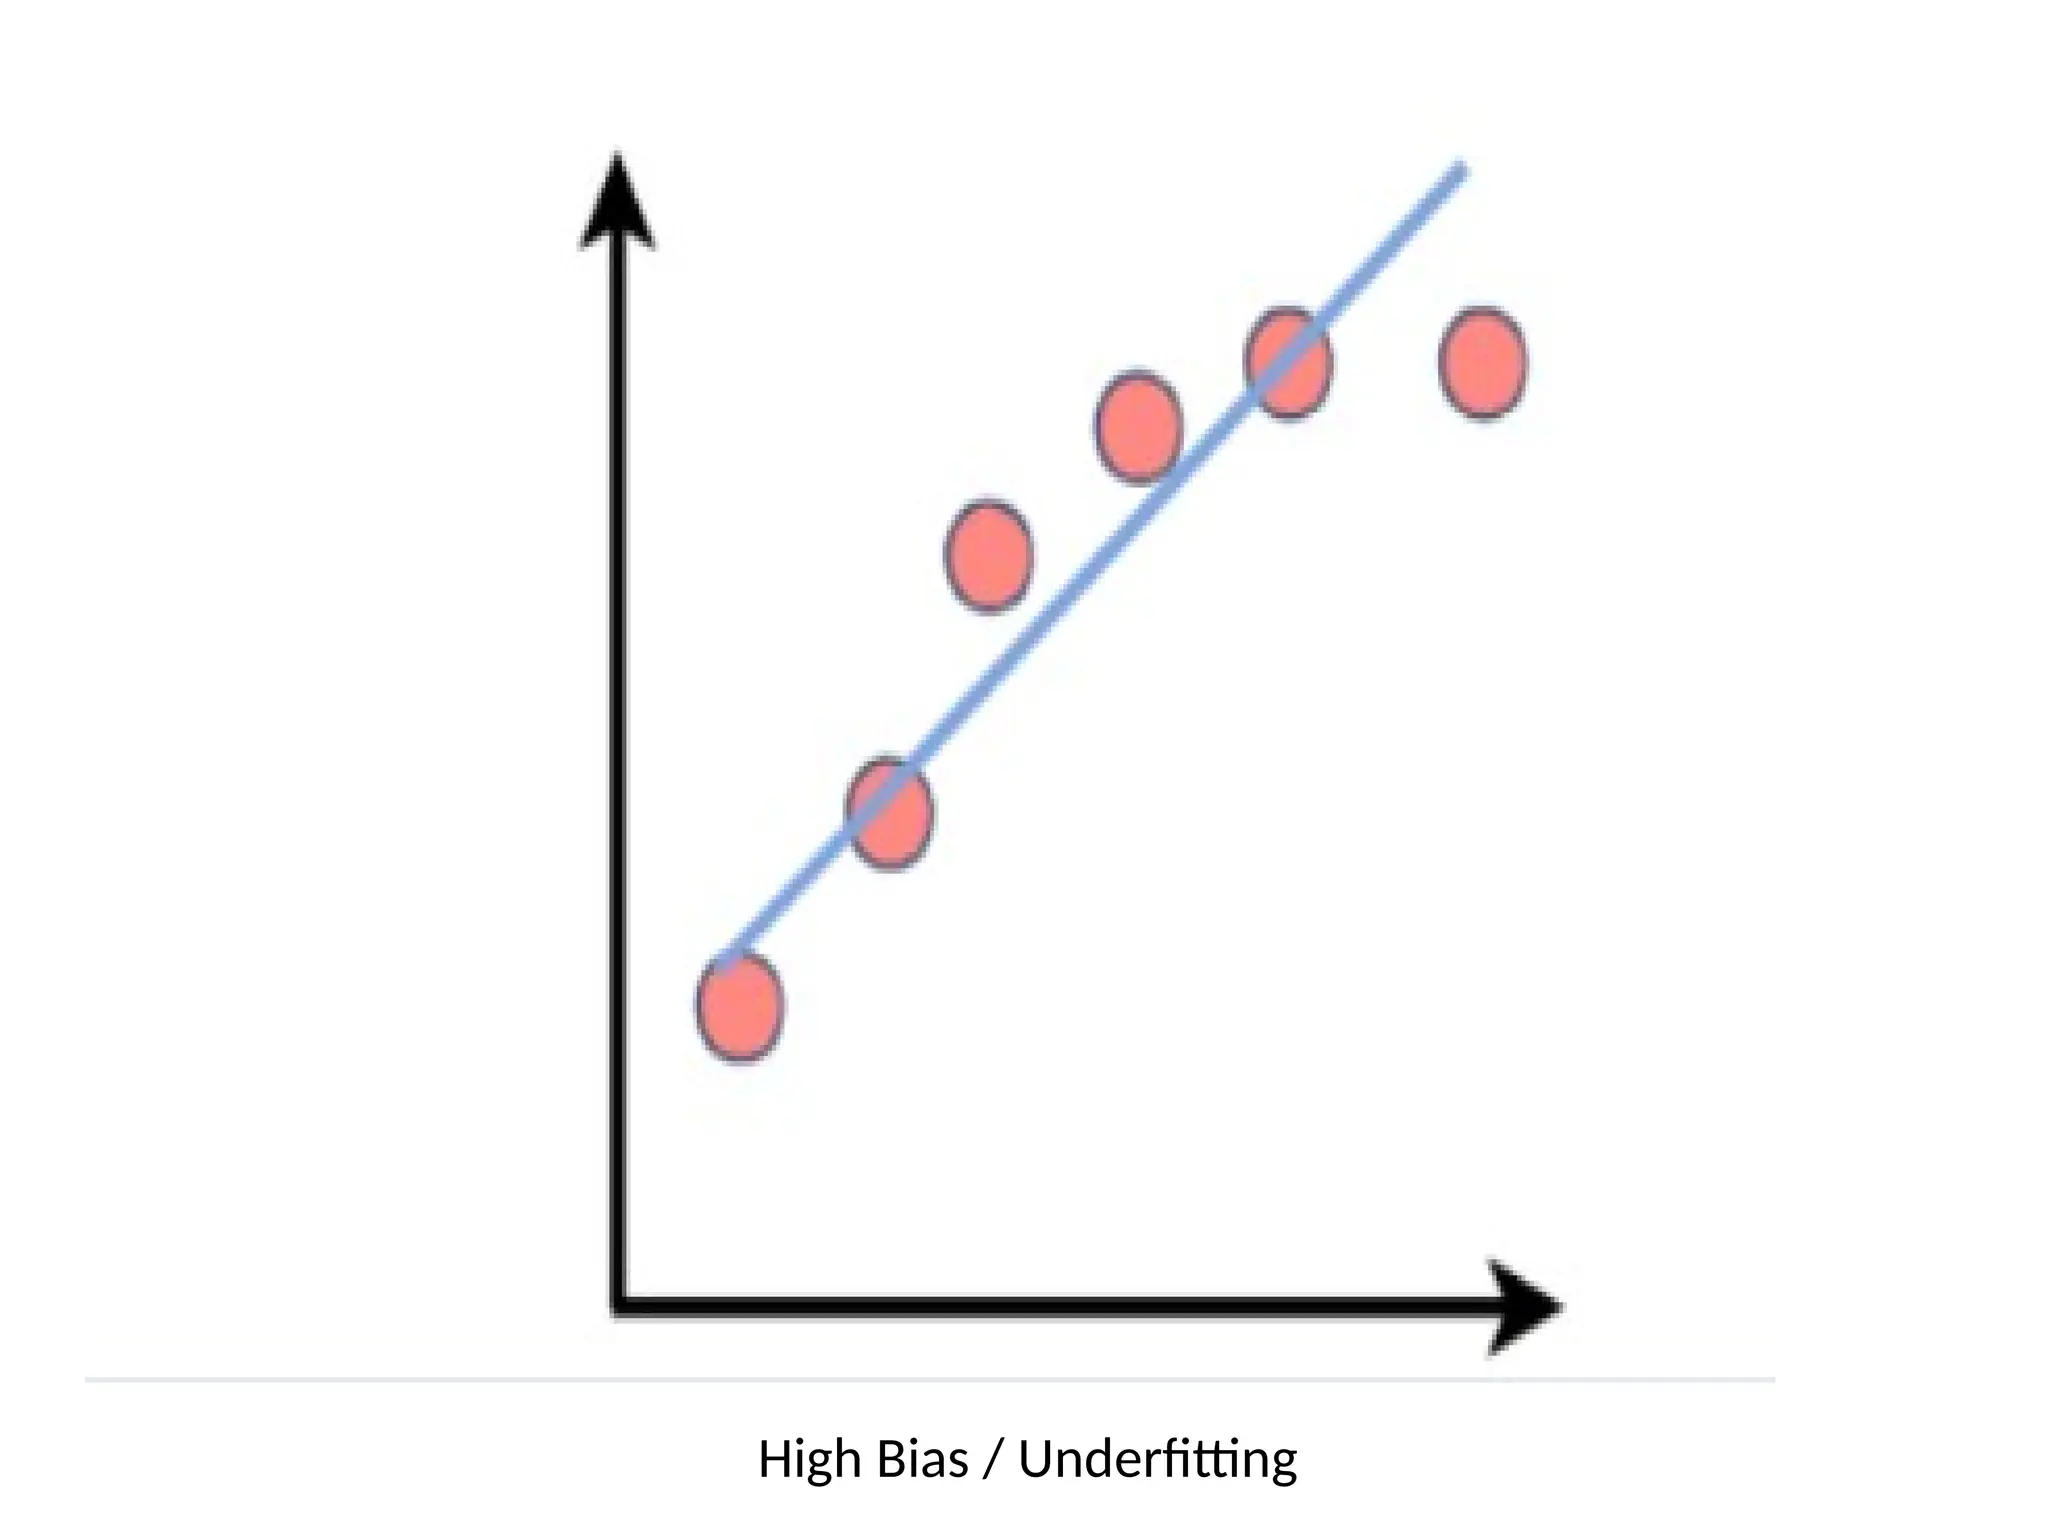
5. Under fittingthe Training Data
It occurs when your model is too simple to
learn the underlying structure of the data.
The model is generated like
--- Training errors will be high (High bias)
--- Testing errors will be high (High variance)
57.
Variance (definition)
“The amountof variability in the target function
in response to a change in the training data is
known as Variance”.
58.
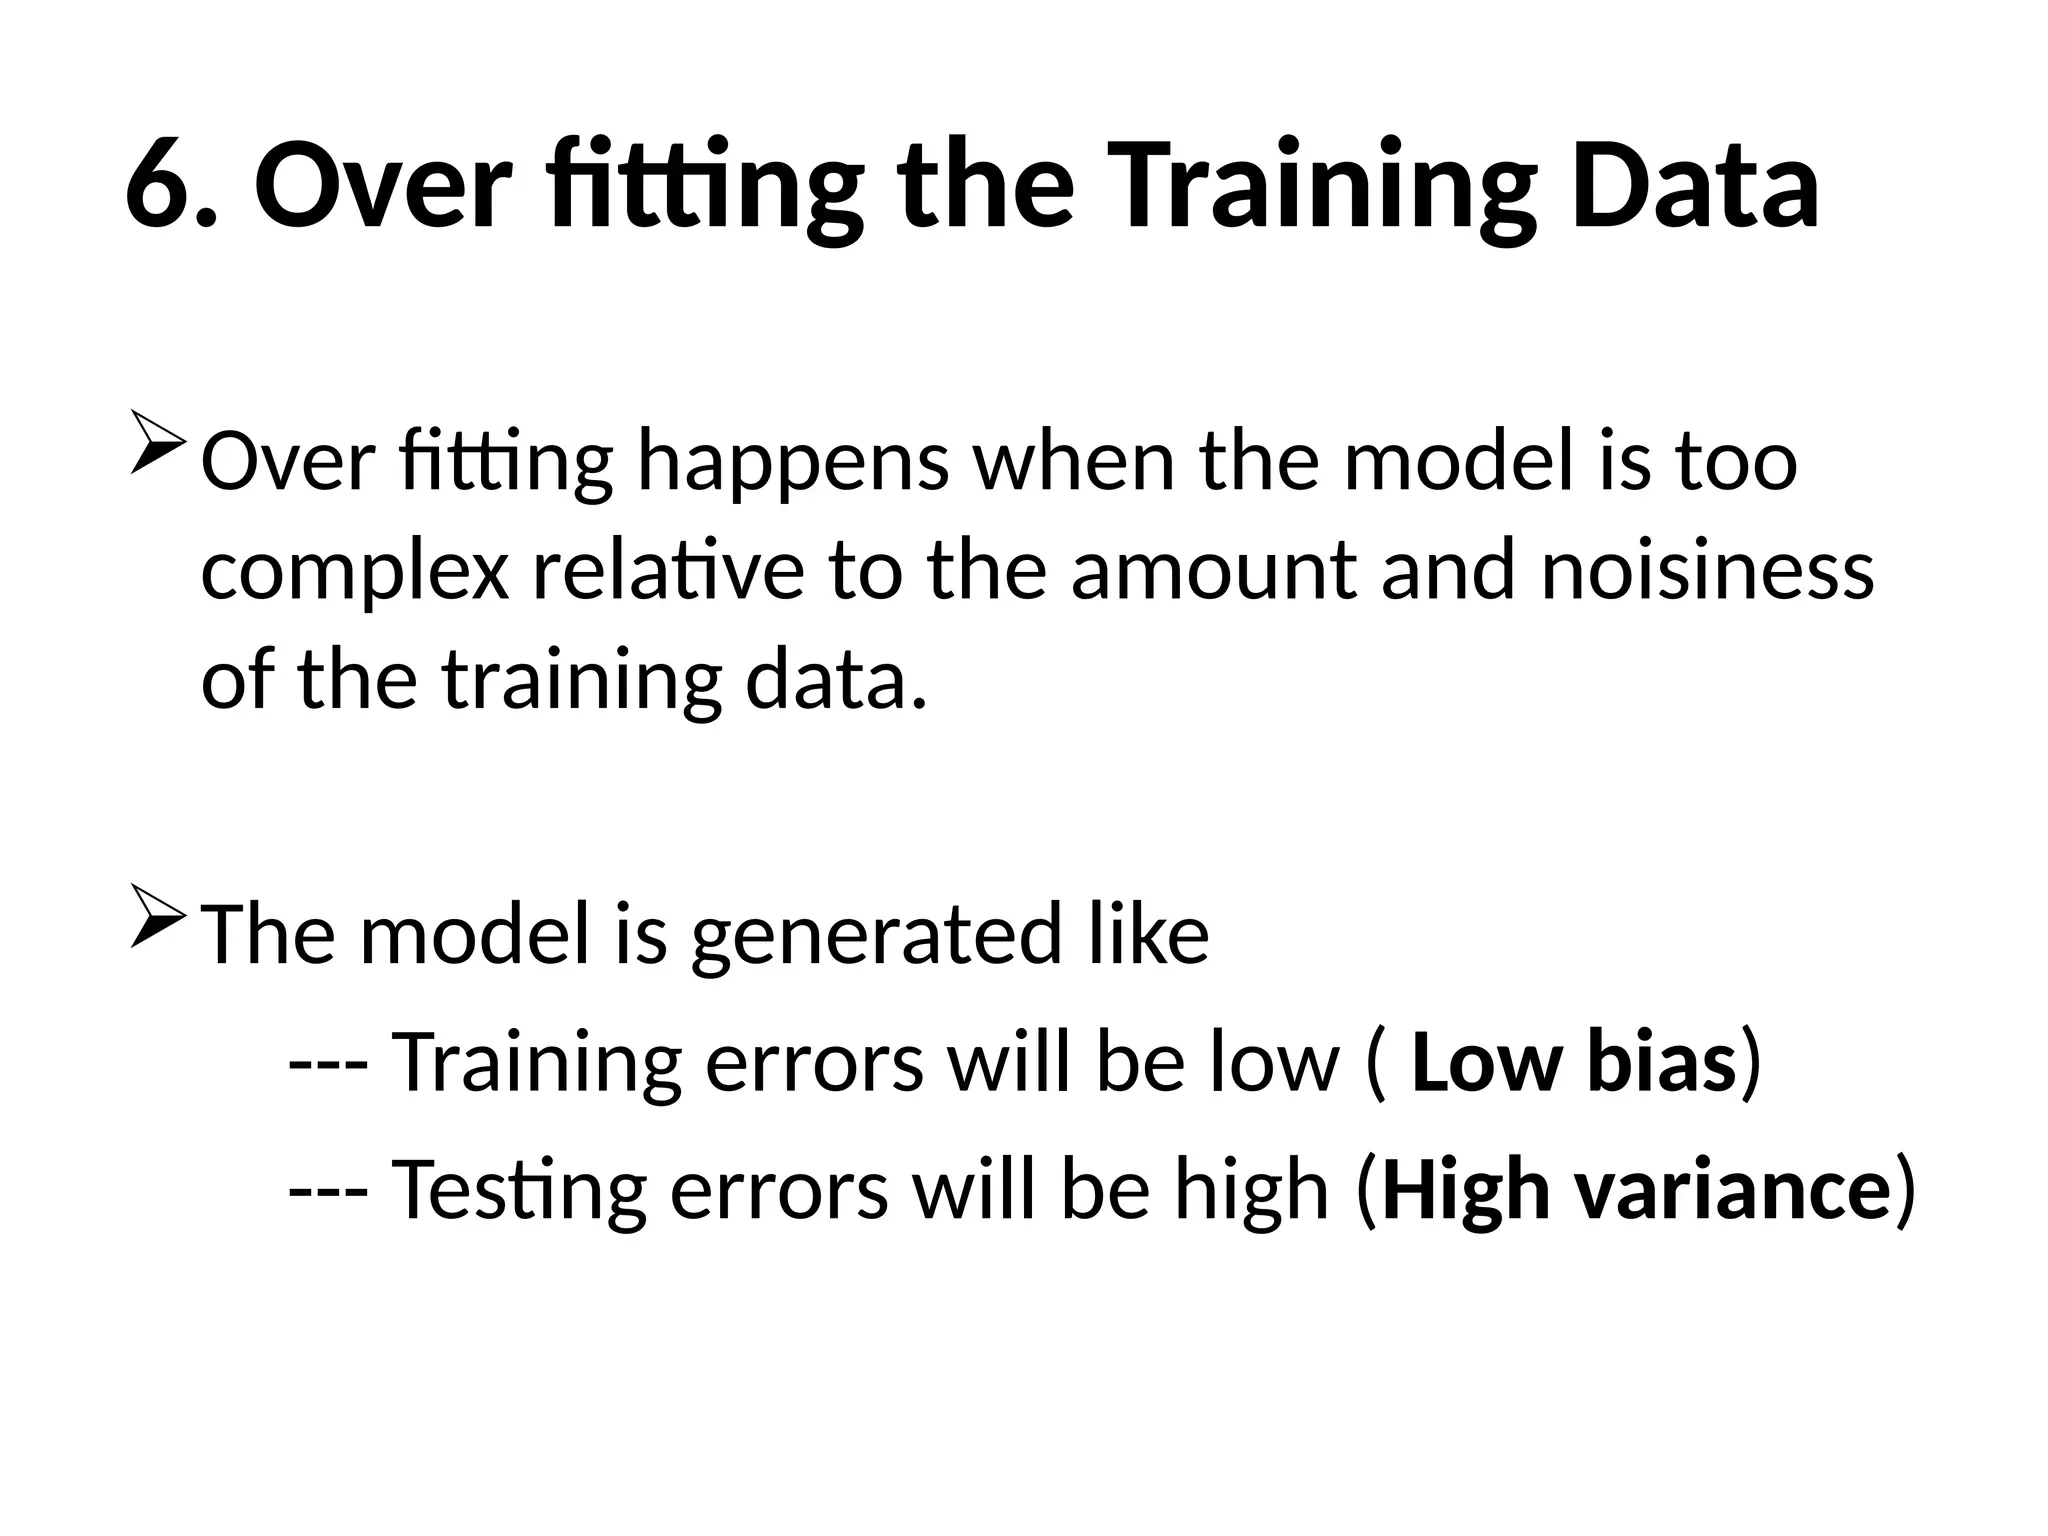
6. Over fittingthe Training Data
Over fitting happens when the model is too
complex relative to the amount and noisiness
of the training data.
The model is generated like
--- Training errors will be low ( Low bias)
--- Testing errors will be high (High variance)
59.
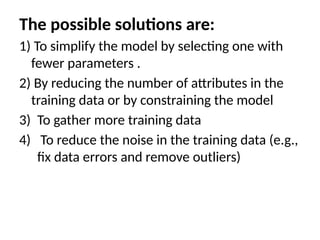
The possible solutionsare:
1) To simplify the model by selecting one with
fewer parameters .
2) By reducing the number of attributes in the
training data or by constraining the model
3) To gather more training data
4) To reduce the noise in the training data (e.g.,
fix data errors and remove outliers)
60.
STATISTICAL LEARNING:
“When thegoal is to interpret the model and
quantify the uncertainty in the data, this
analysis is usually referred to as statistical
learning”.
TRAINING LOSS ANDTESTING LOSS:
• Training loss and testing loss are essential
concepts in machine learning that reflect how
well a model is performing during training
and generalizing to new, unseen data.
64.
What is loss?
•Loss is the penalty for a bad prediction.
• That is, loss is a number indicating how bad
the model's prediction was on a single
example.
NOTE: If the model's prediction is perfect, the
loss is zero; otherwise, the loss is greater.
• The goal of training a model is to find a set of
weights and biases that have low loss.
65.
TRAINING LOSS:
• Trainingloss, also known as the training error
or training cost, measures how well a machine
learning model fits the training data.
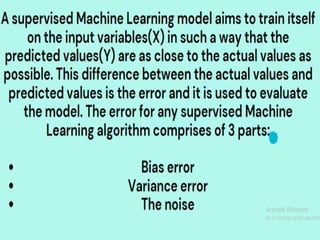
• In supervised learning, a machine learning
algorithm builds a model by examining many
examples and attempting to find a model that
minimizes loss; this process is called empirical
risk minimization
66.
• It quantifiesthe difference between the
model's predictions and the actual target
values in the training dataset.
67.
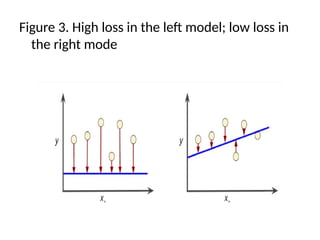
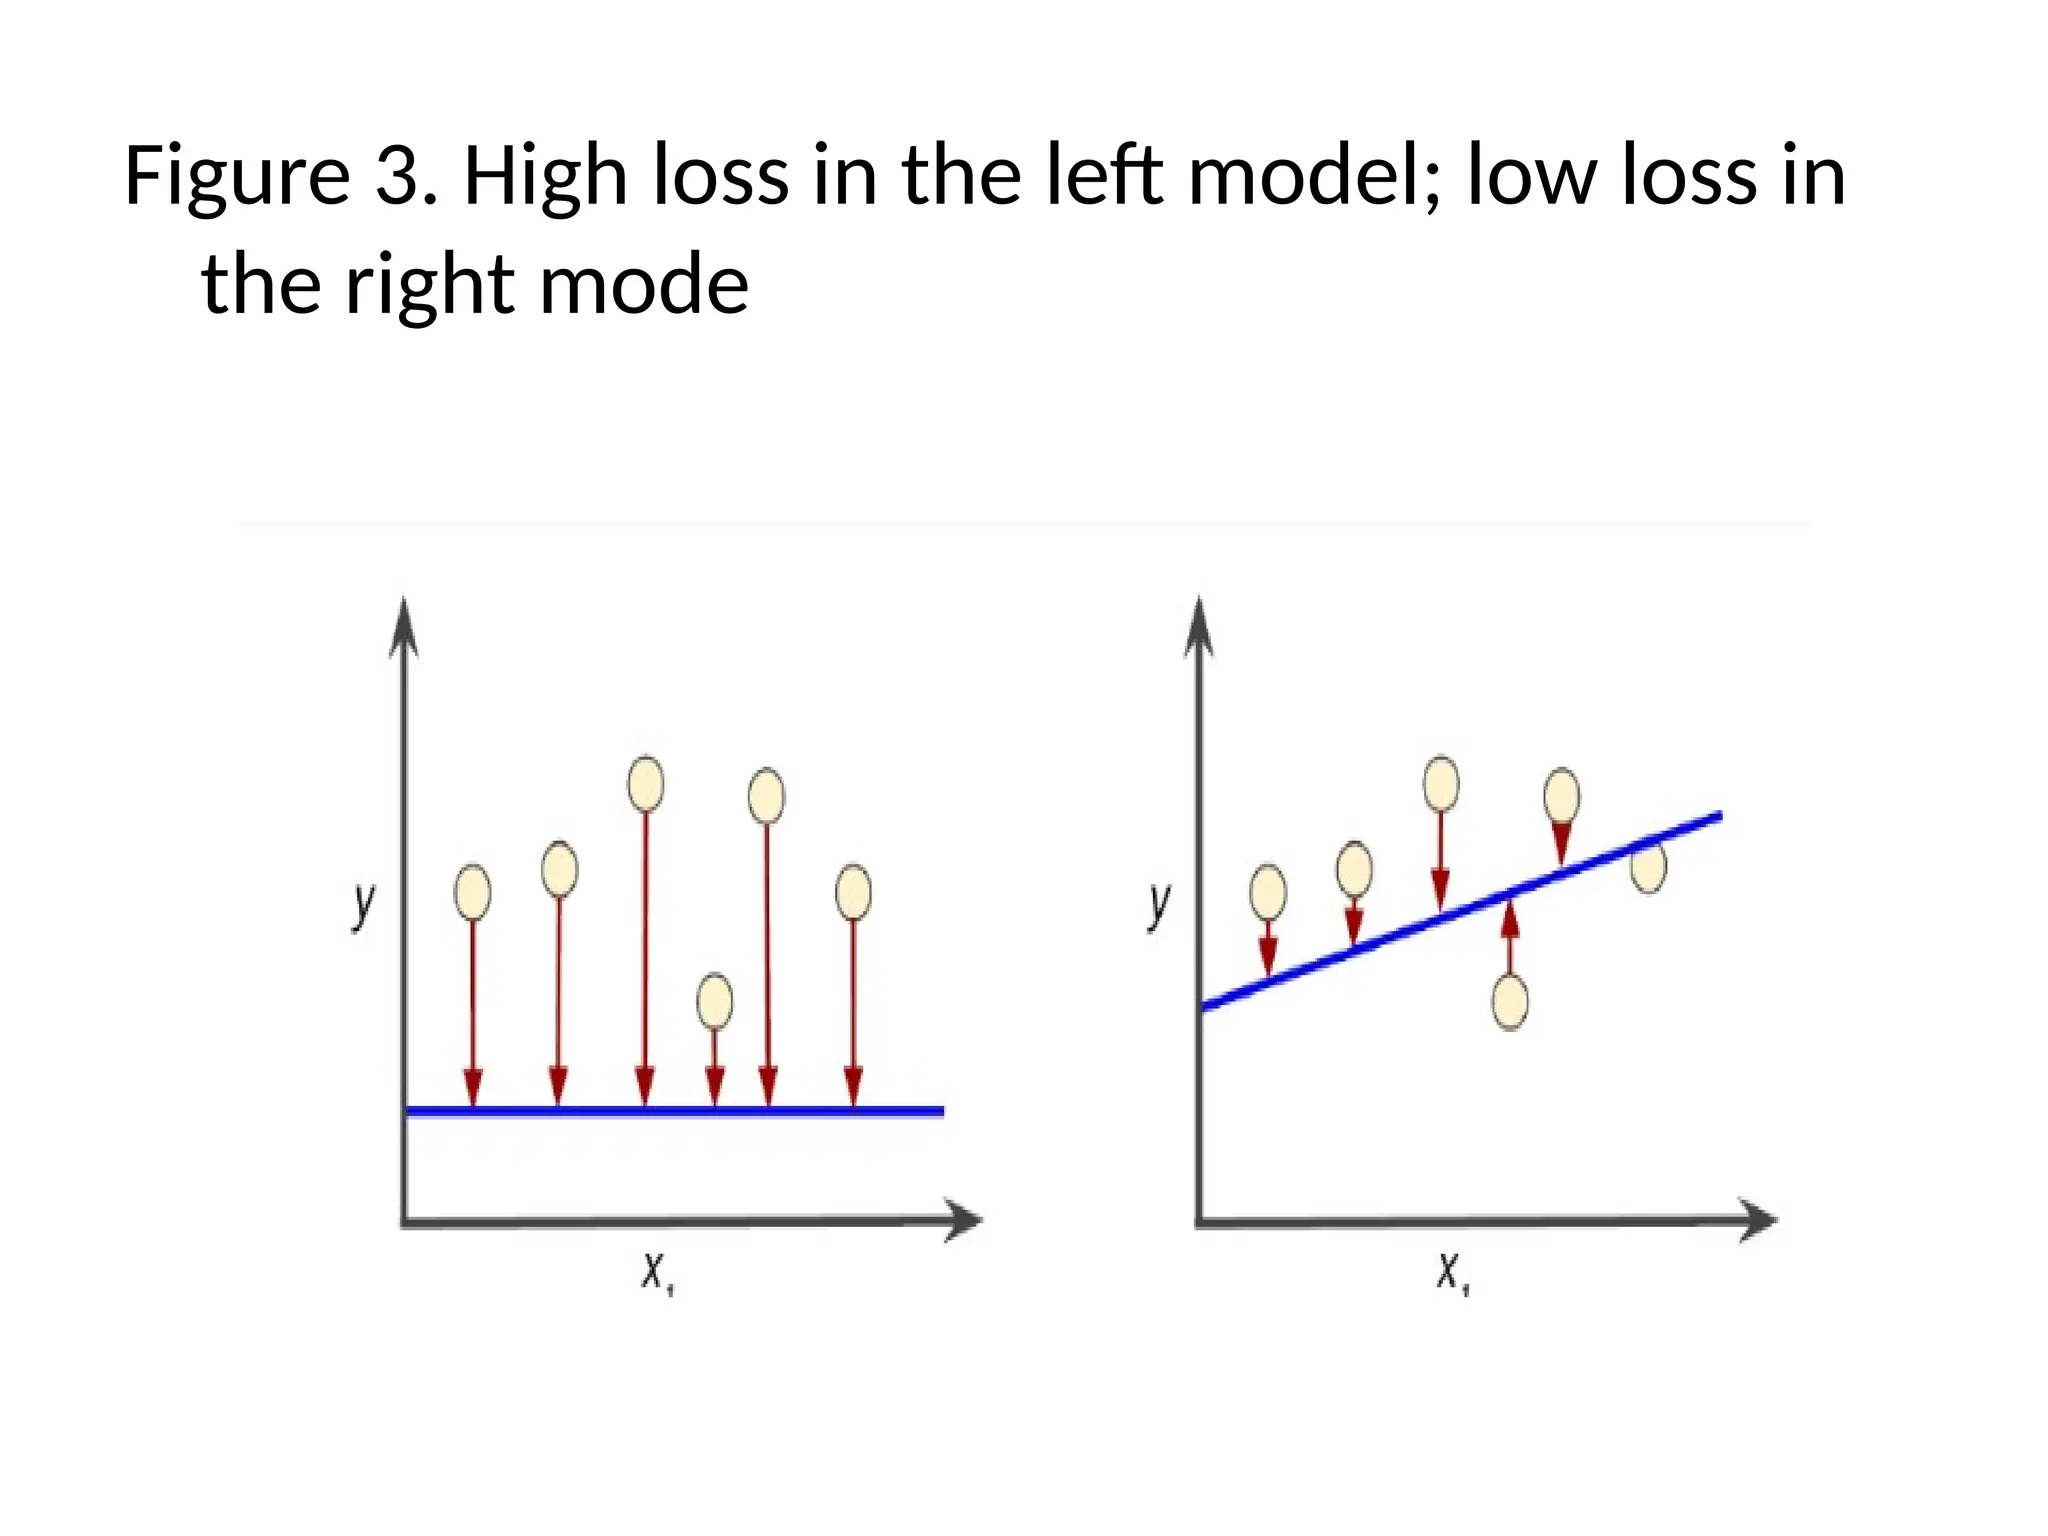
Figure 3. Highloss in the left model; low loss in
the right mode
68.
The arrows representloss.
The blue lines represent predictions.
• Clearly, the line in the right plot is a much
better predictive model than the line in the
left plot.
69.
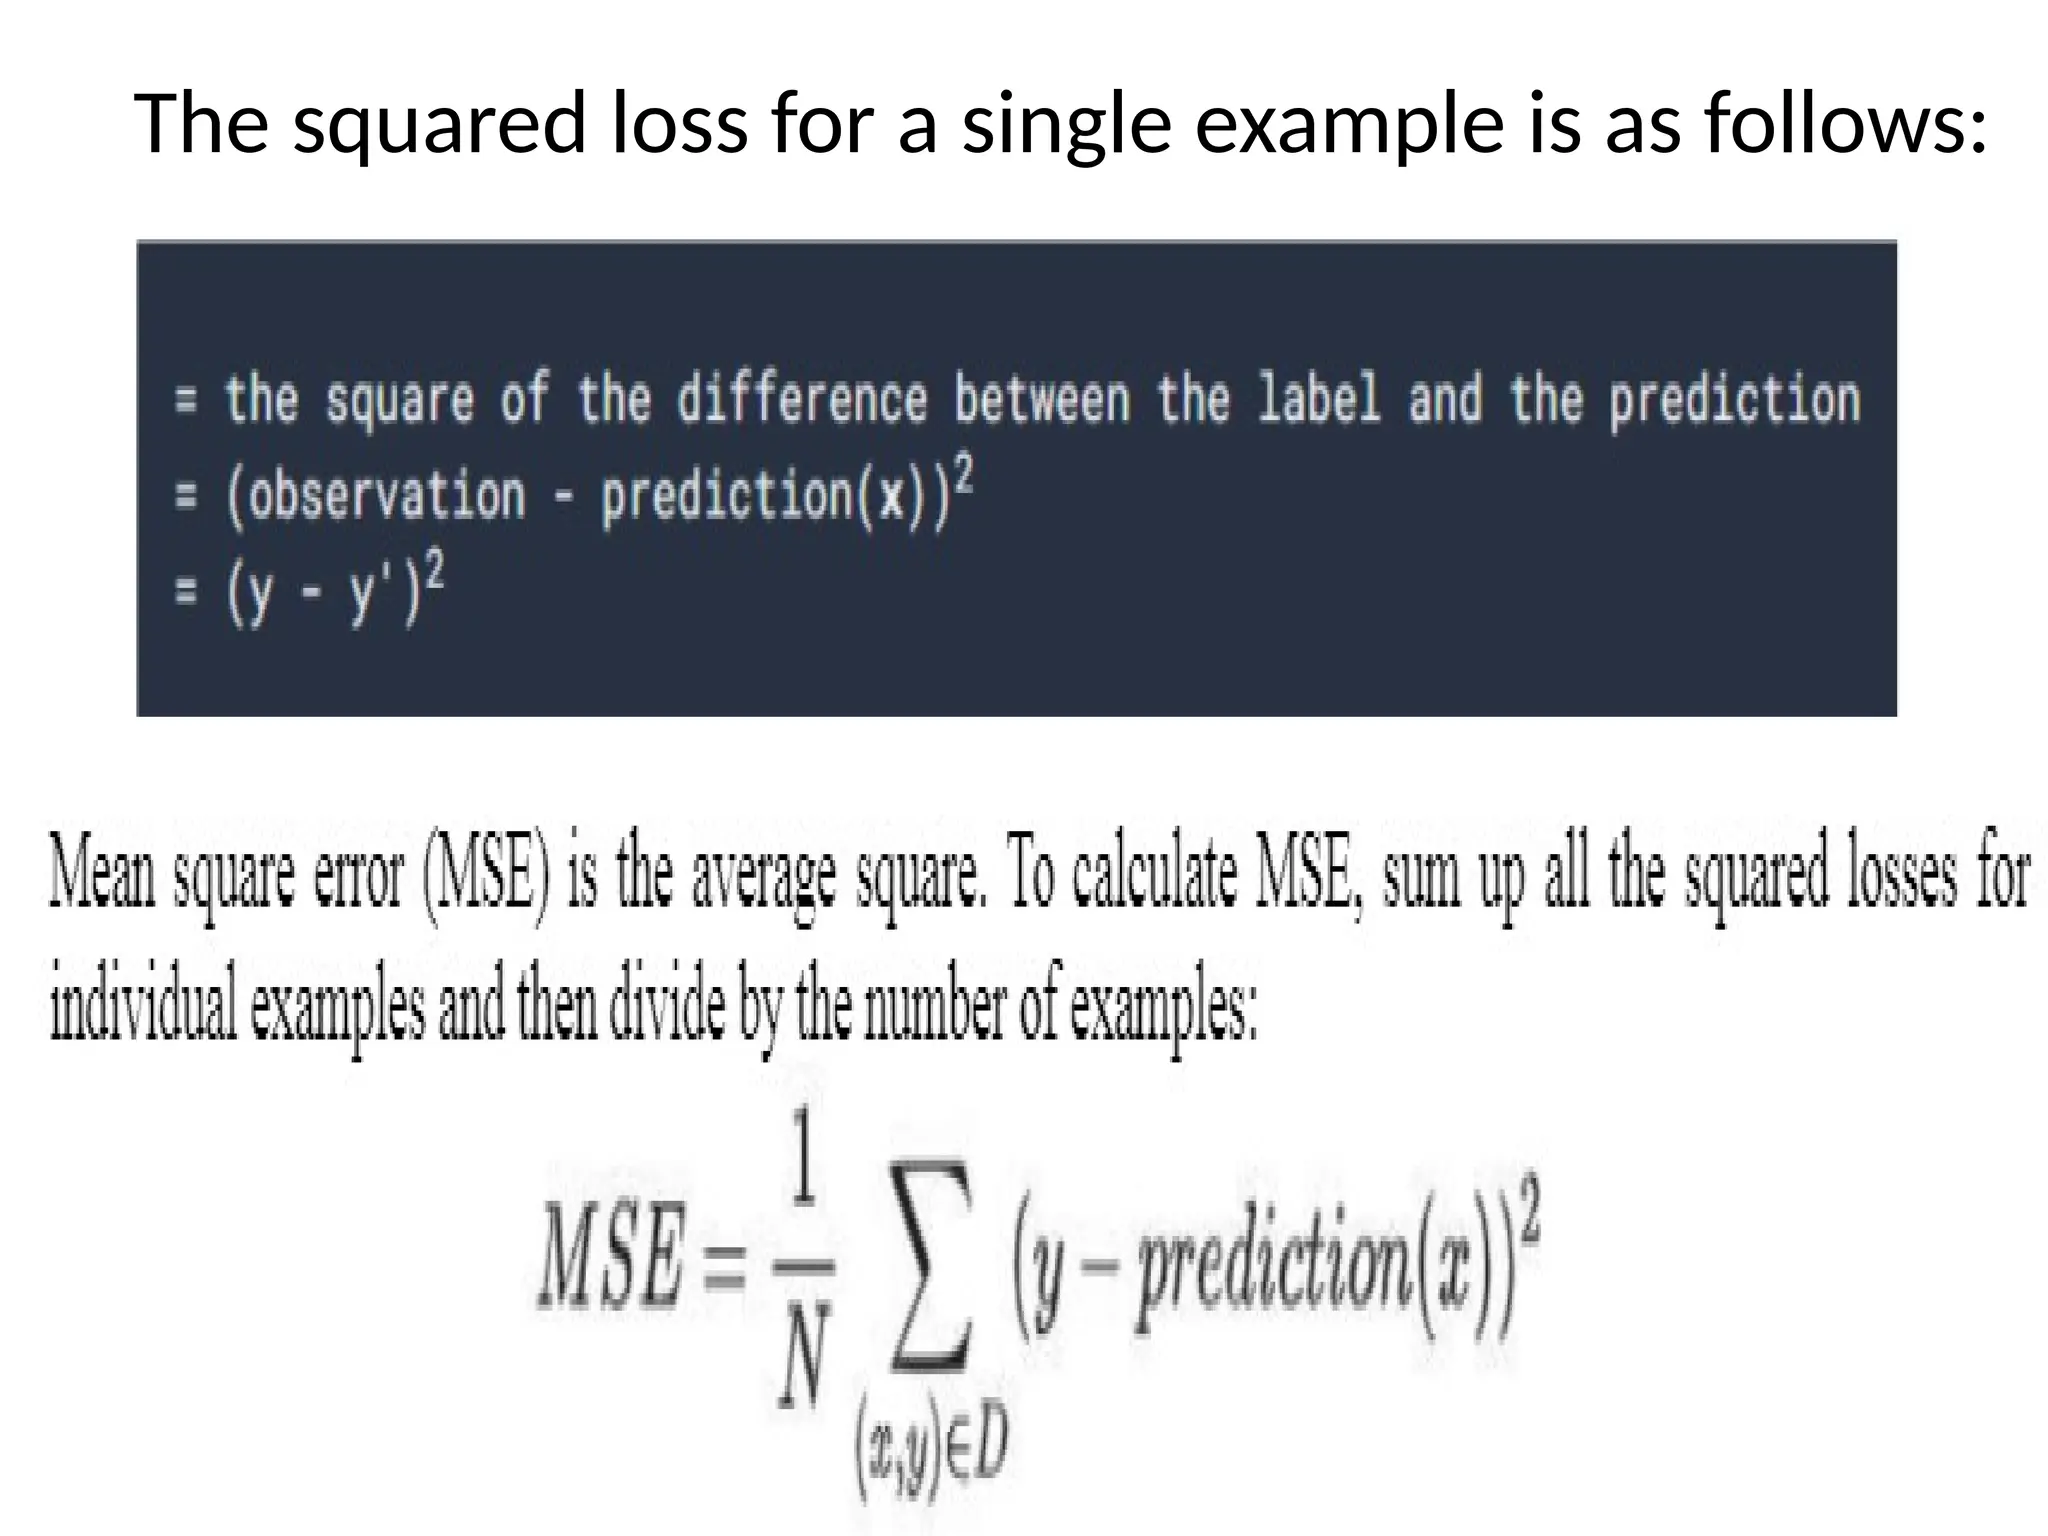
• we mightbe wondering whether we could
create a mathematical function—a loss
function—that would aggregate the individual
losses in a meaningful fashion.
1)SQUARED LOSS:
a popular loss function
• The linear regression models we'll examine
here use a loss function called squared loss
(also known as L2loss).
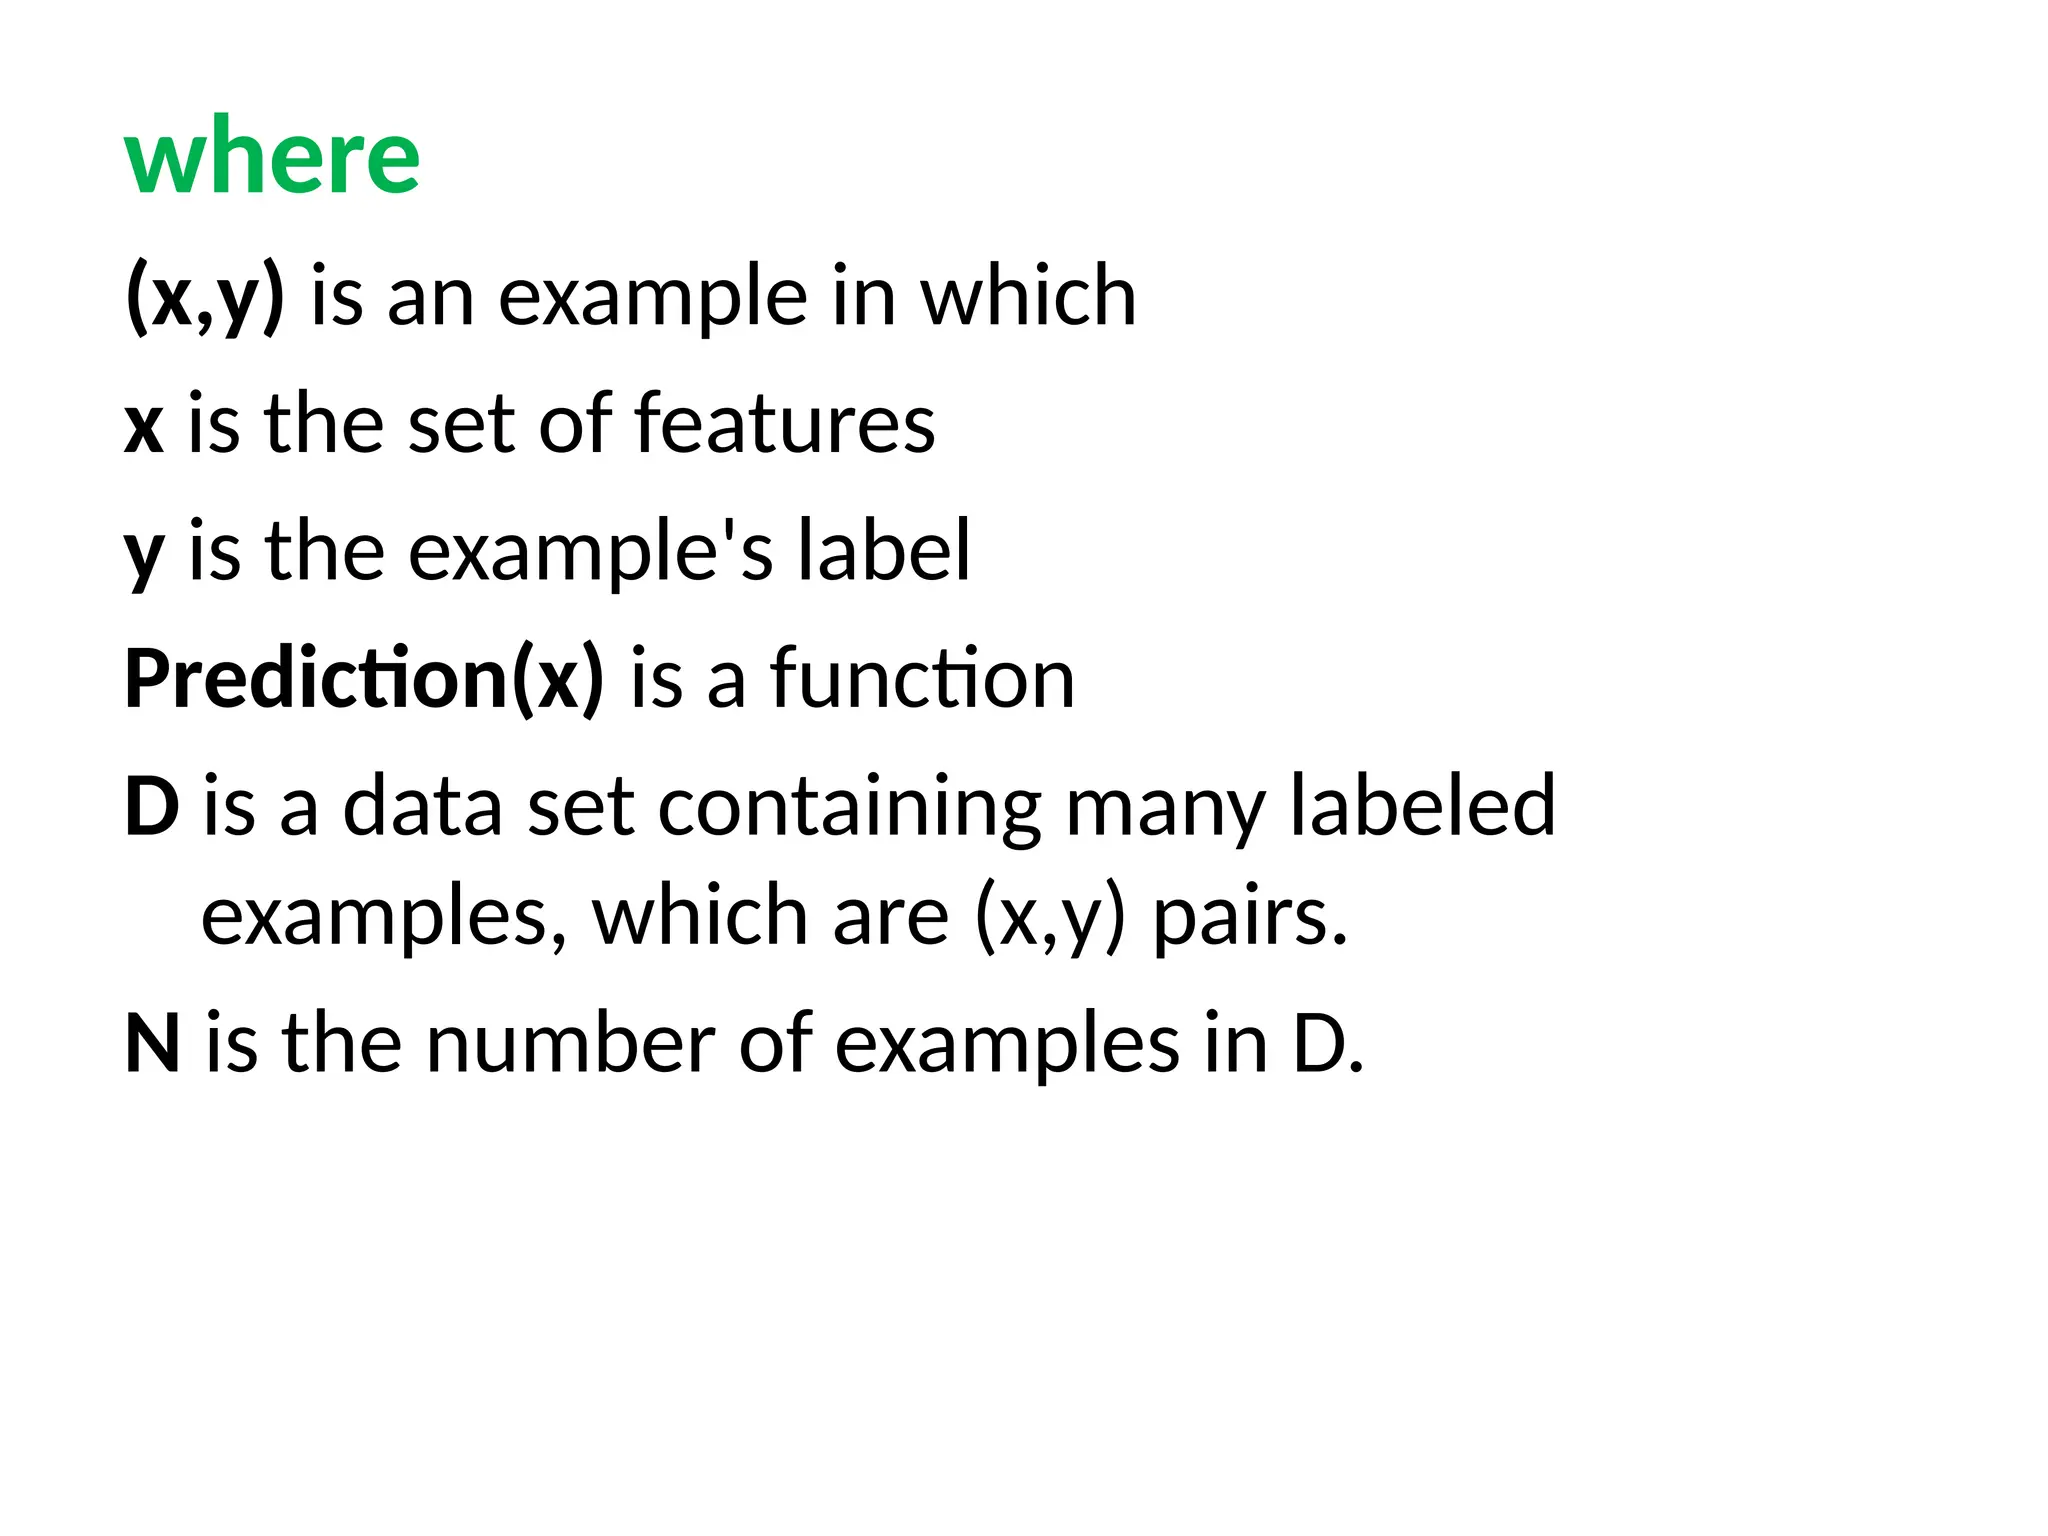
where
(x,y) is anexample in which
x is the set of features
y is the example's label
Prediction(x) is a function
D is a data set containing many labeled
examples, which are (x,y) pairs.
N is the number of examples in D.
72.
• Low TrainingLoss: A low training loss
indicates that the model is fitting the training
data well.
73.
• High TrainingLoss: A high training loss
suggests that the model is struggling to
capture the patterns in the data. It might be
underfitting, where the model is too simplistic
to learn the complexities of the data.
74.
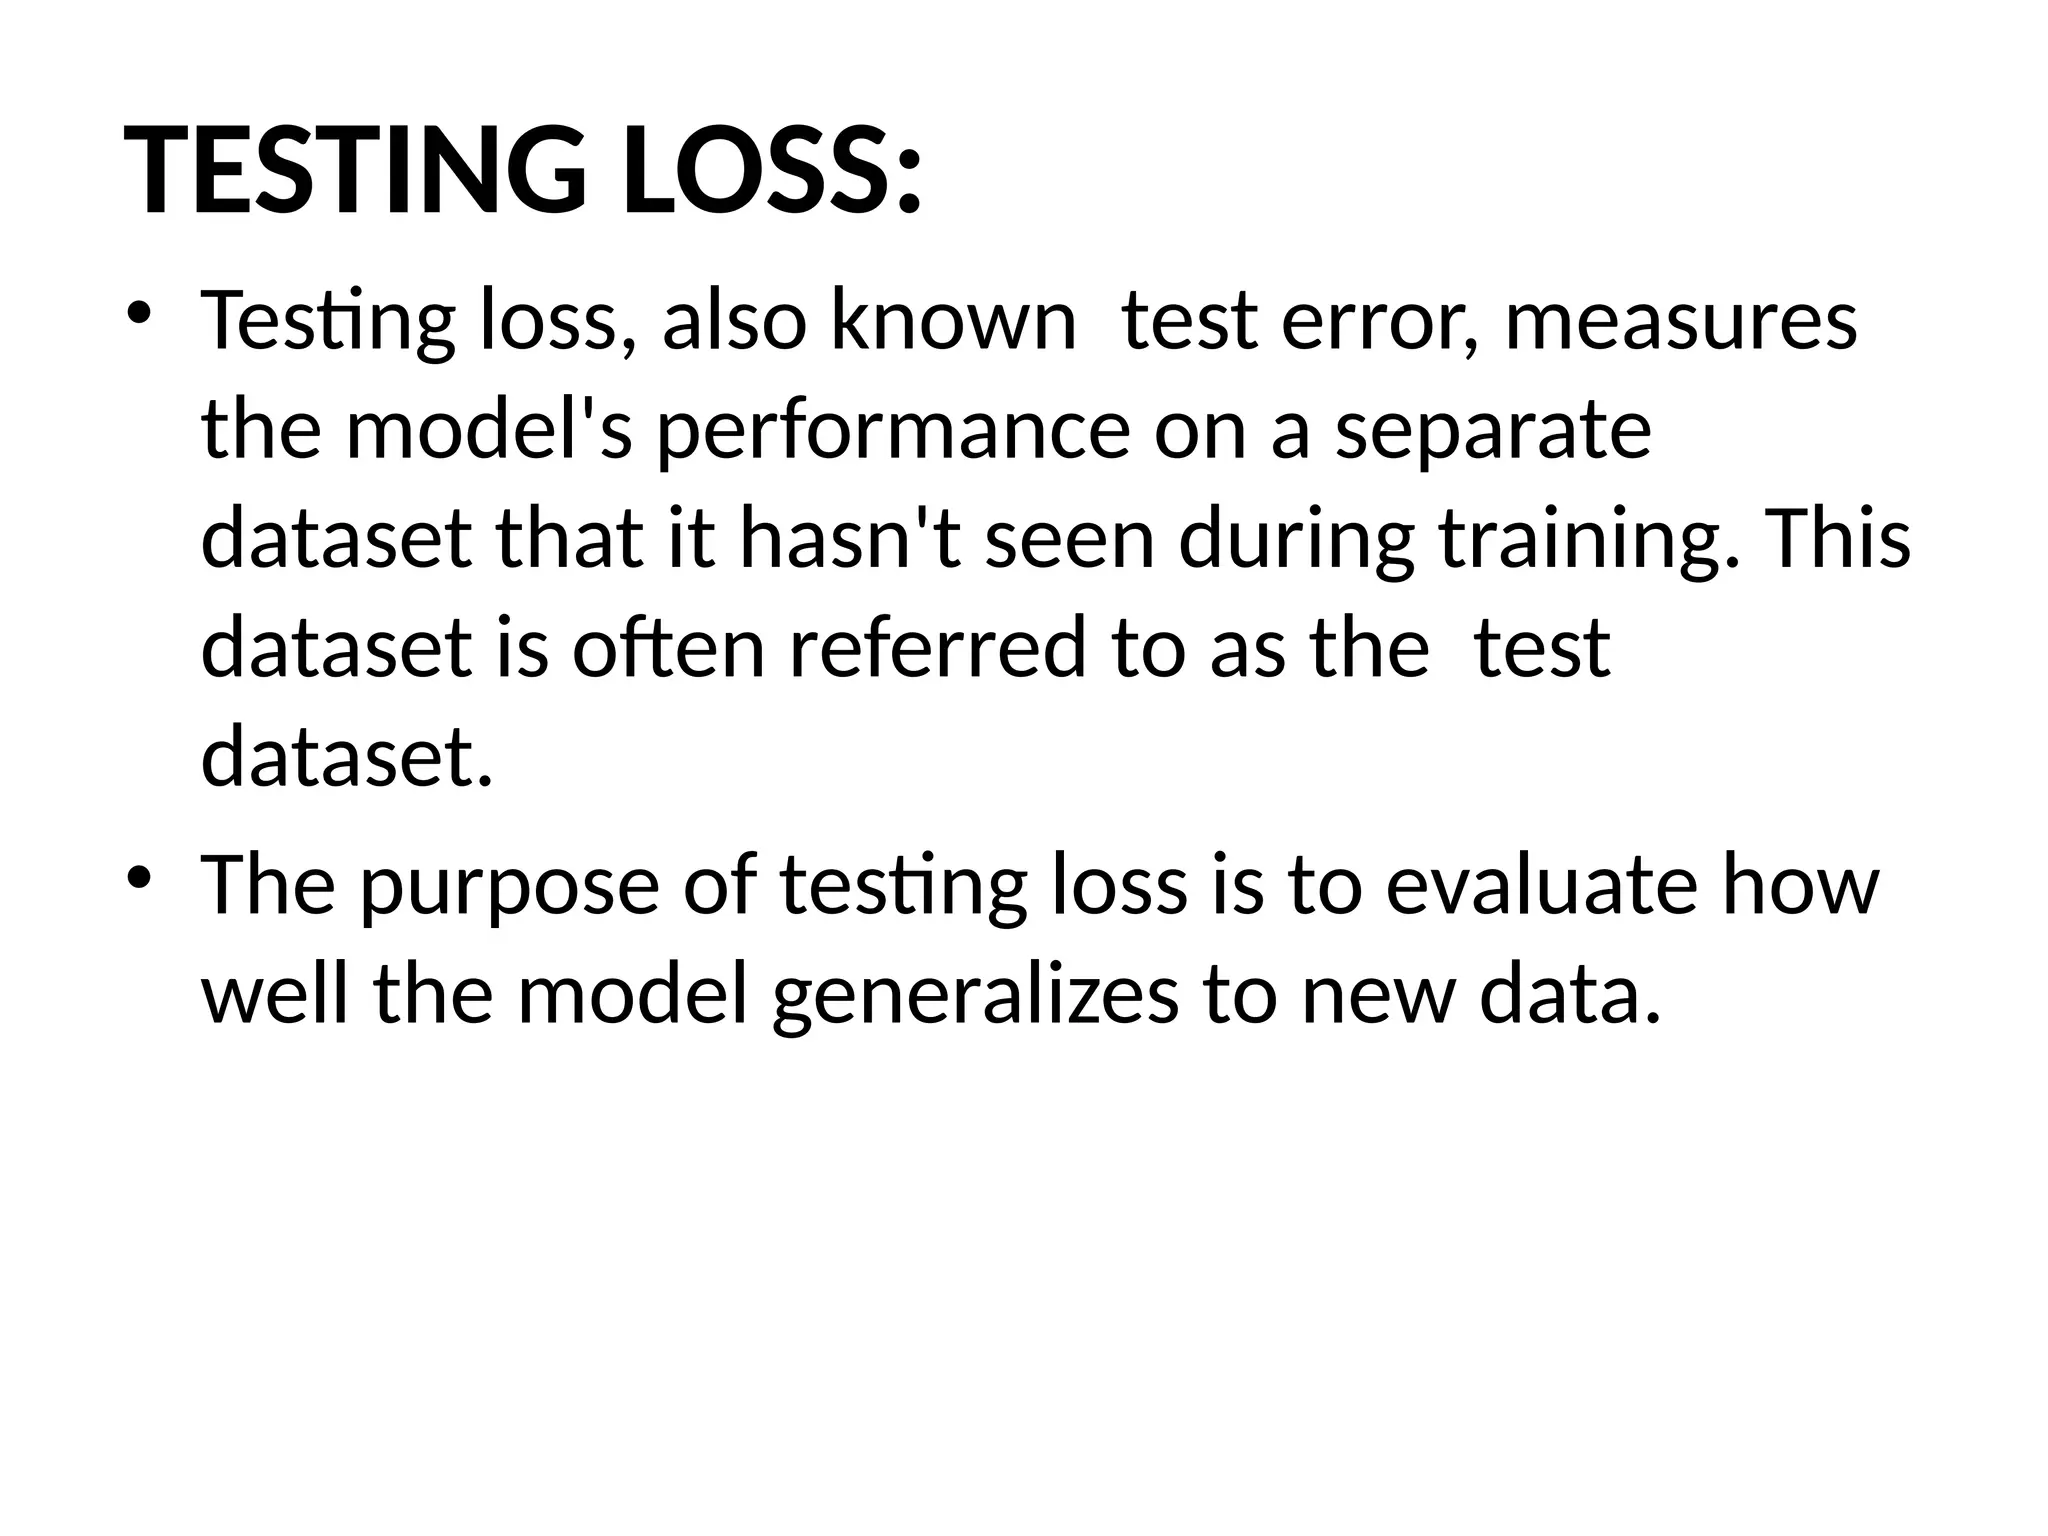
TESTING LOSS:
• Testingloss, also known test error, measures
the model's performance on a separate
dataset that it hasn't seen during training. This
dataset is often referred to as the test
dataset.
• The purpose of testing loss is to evaluate how
well the model generalizes to new data.
Bias
“Bias is simplydefined as the inability of the
model because of that there is some difference
or error occurring between the model’s
predicted value and the actual value.”
Low Bias:
In thiscase, the model will closely match the
training dataset.
• High Bias:
In this case, the model will not match the
training dataset closely.
82.
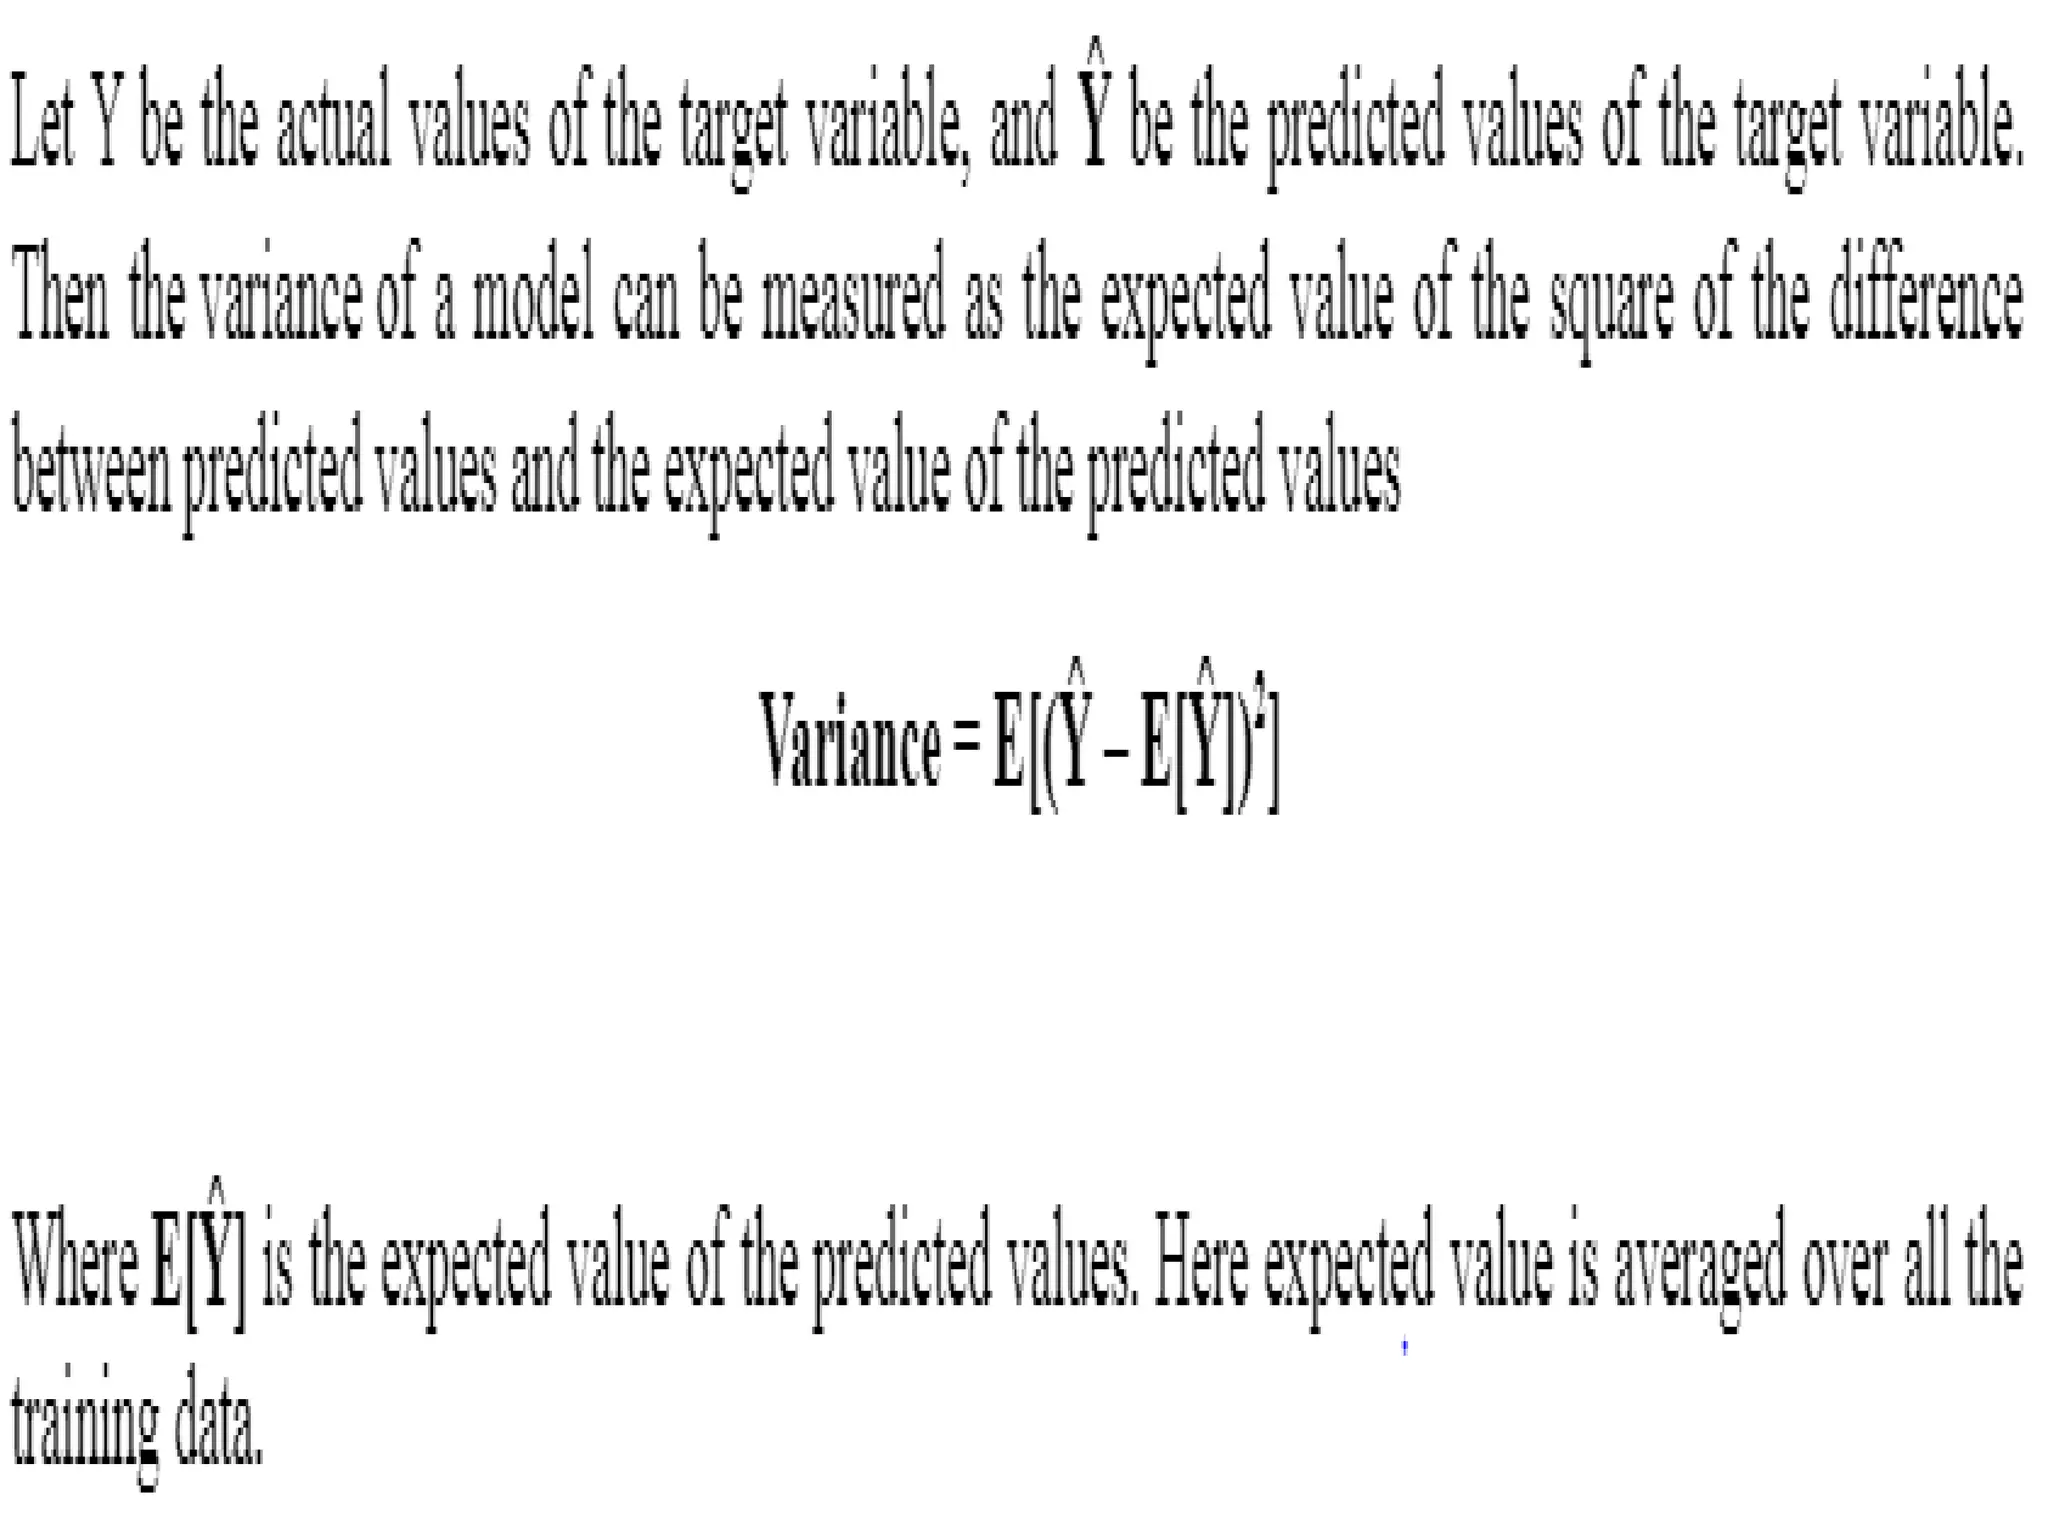
Variance
“The amount ofvariability in the target function
in response to a change in the training data is
known as Variance. “
83.
• When amodel takes into consideration the
noise and fluctuation in the data, it is said to
be of High Variance.
85.
DIFFERENT TRADE-OFFS INSTATISTICAL
LEARNING
• These trade-offs involve making decisions that
balance various factors to achieve the best
possible model performance, generalization,
and practicality.
86.
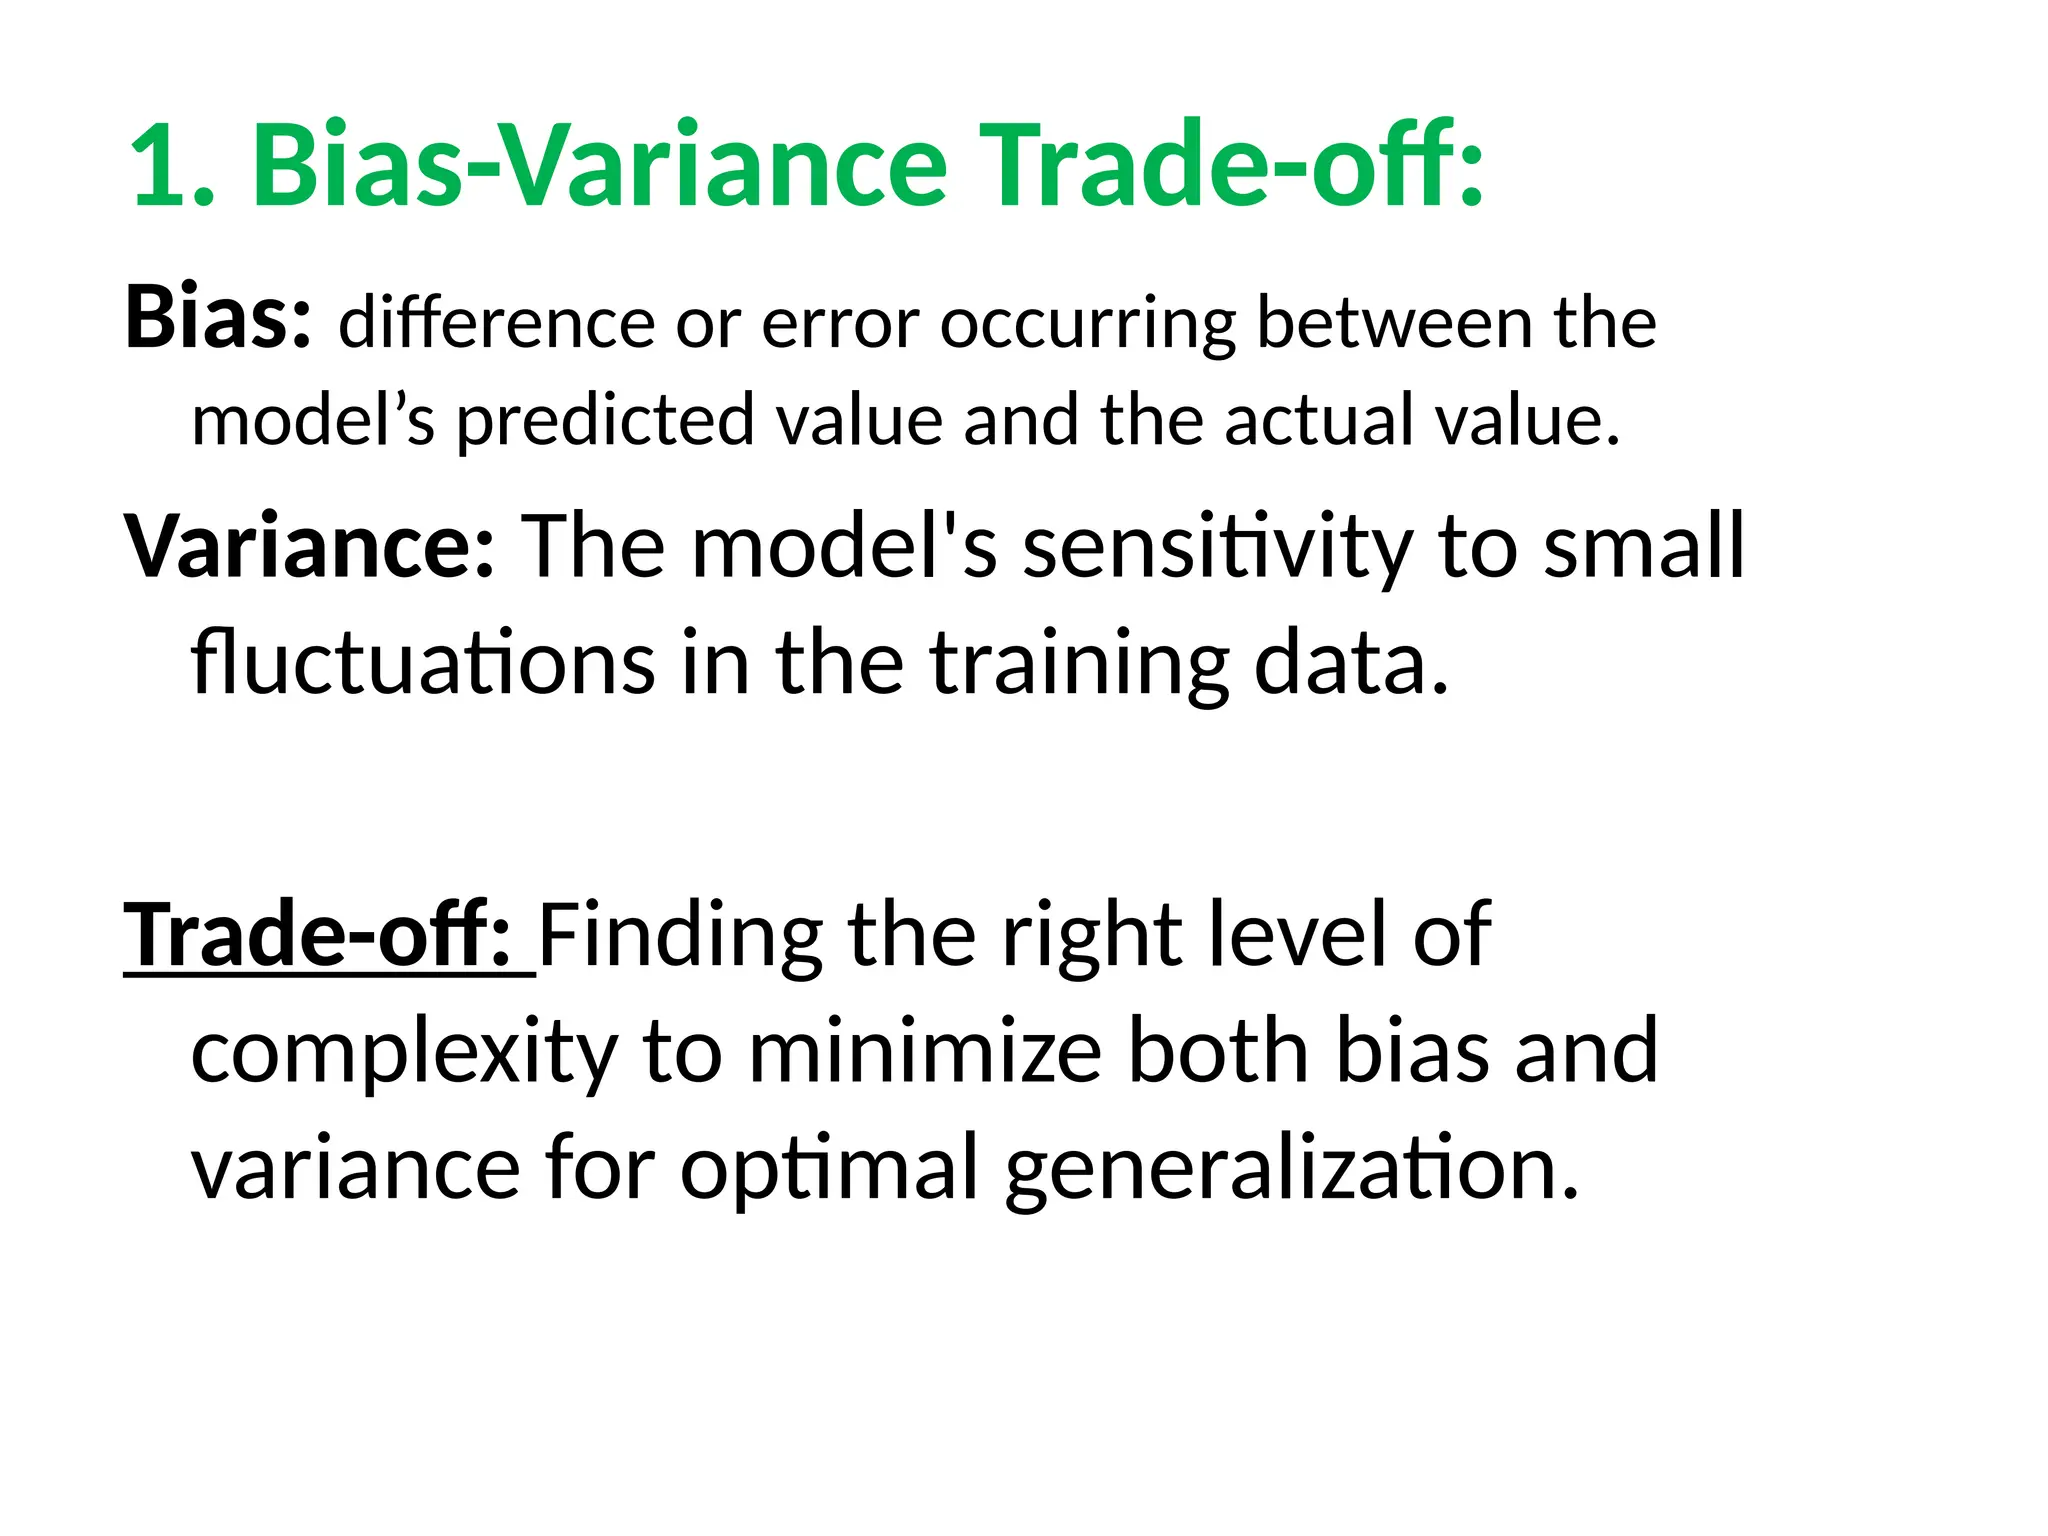
1. Bias-Variance Trade-off:
Bias:difference or error occurring between the
model’s predicted value and the actual value.
Variance: The model's sensitivity to small
fluctuations in the training data.
Trade-off: Finding the right level of
complexity to minimize both bias and
variance for optimal generalization.
87.
2. Overfitting vs.Underfitting:
Overfitting: Over fitting happens when the model is
too complex relative to the amount and noisiness
of the training data.
Underfitting: Occurs when a model is too simple to
capture the patterns in the data, resulting in poor
performance on both training and testing data.
Trade-off: Balancing model complexity to avoid
overfitting (high variance) while ensuring that the
model can capture the true patterns.
88.
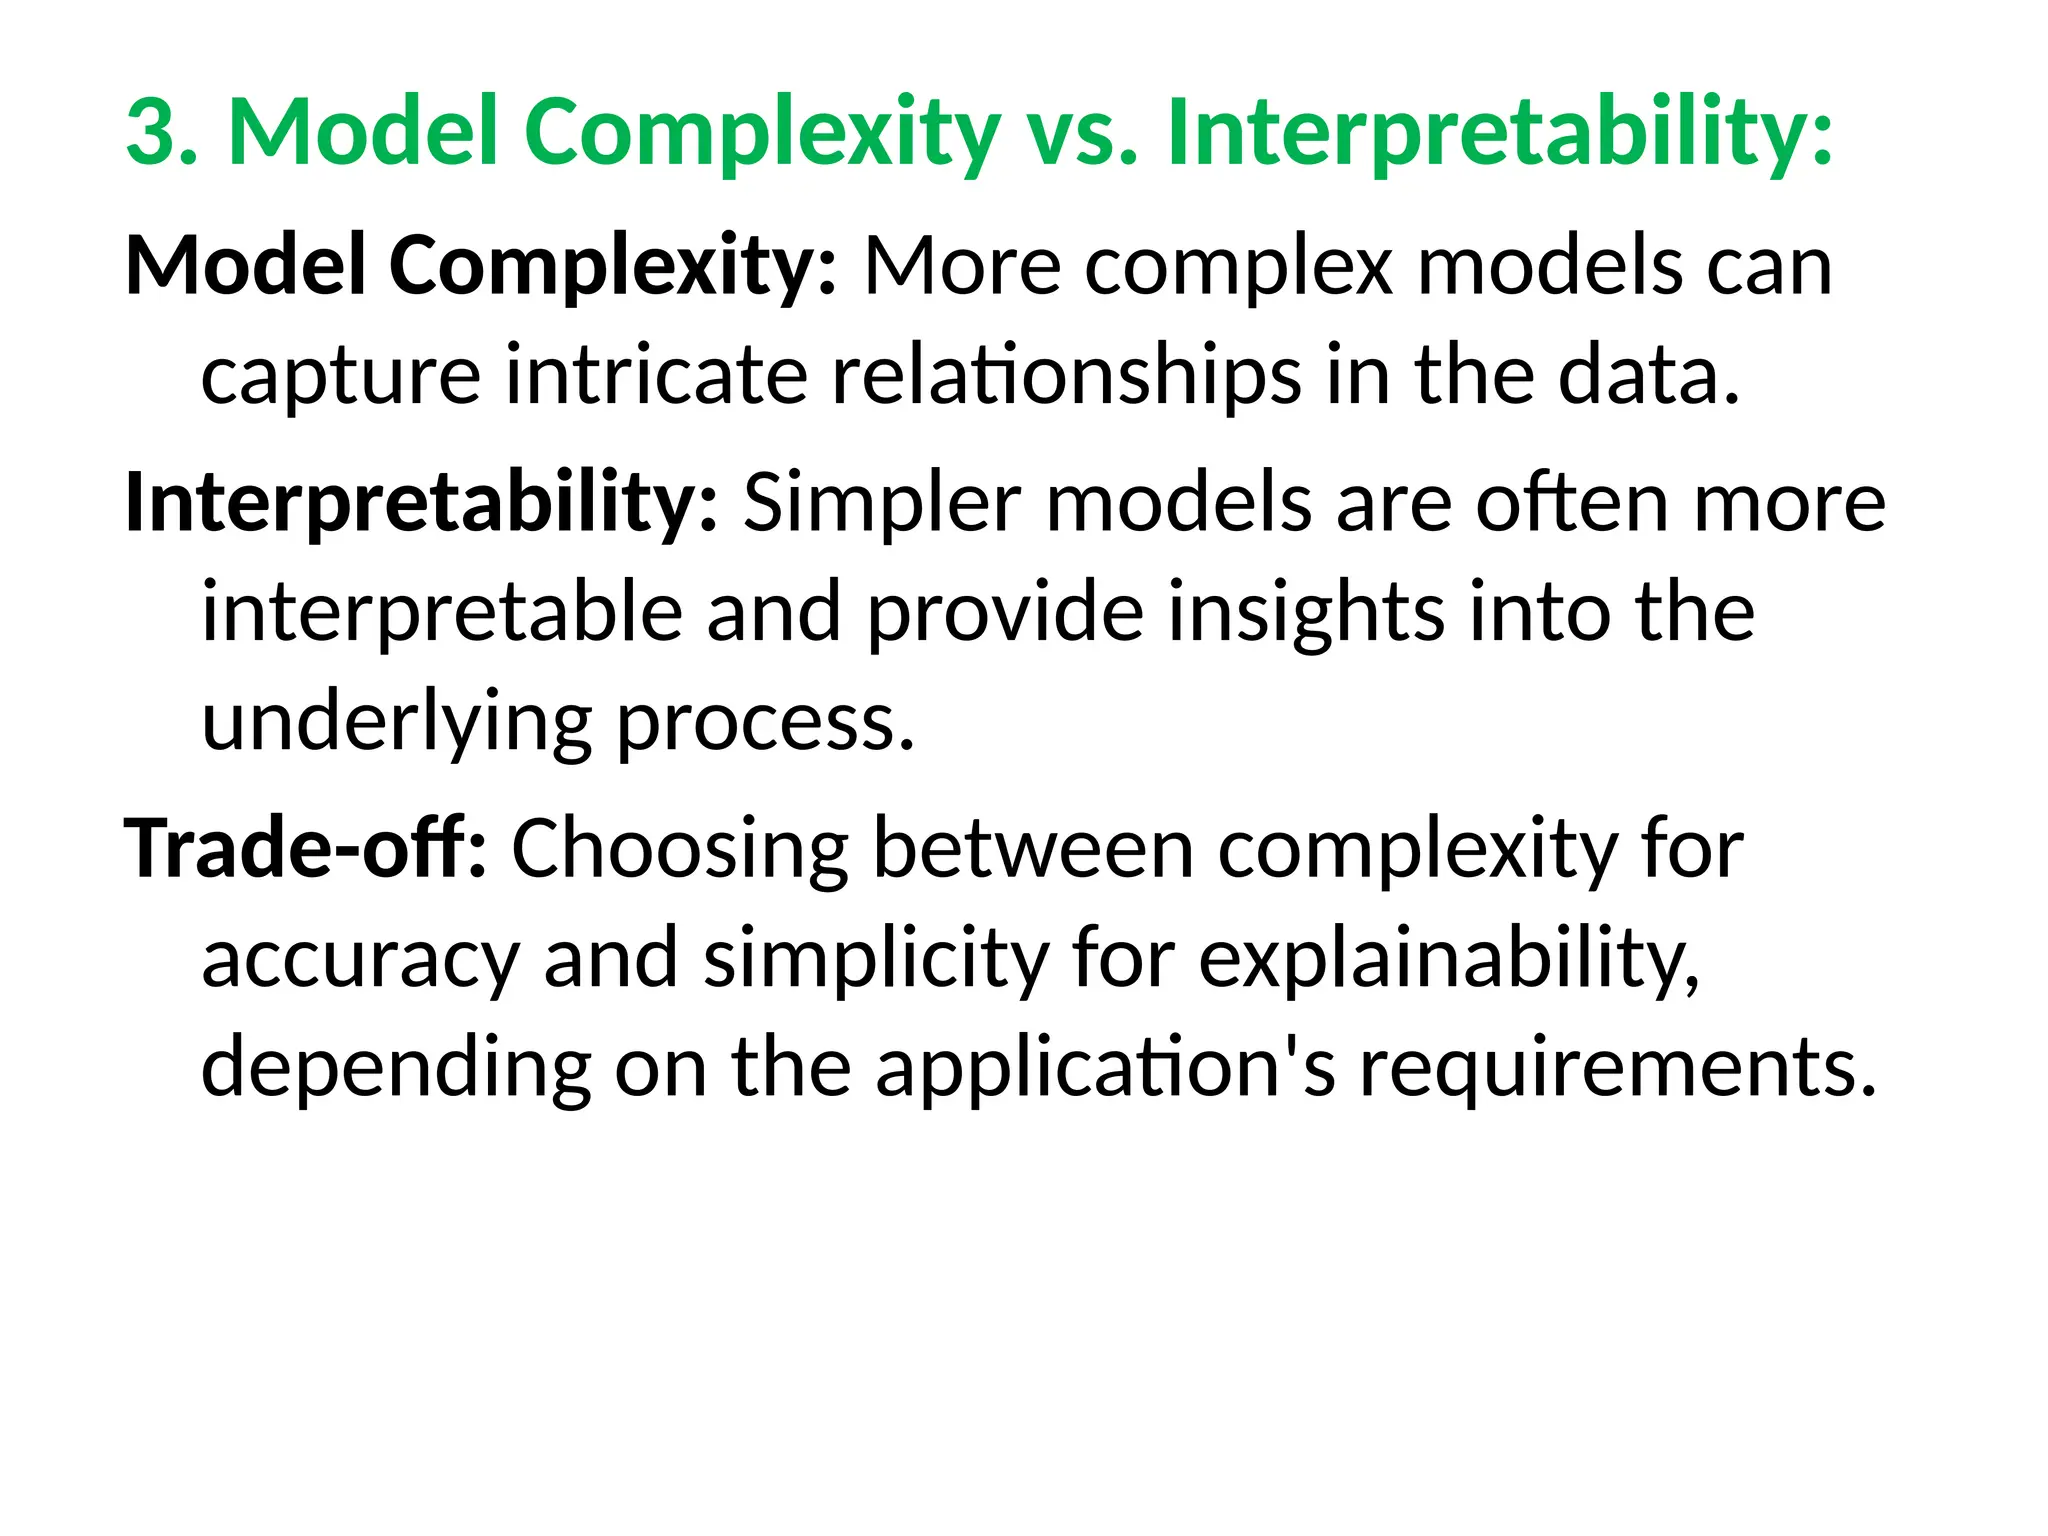
3. Model Complexityvs. Interpretability:
Model Complexity: More complex models can
capture intricate relationships in the data.
Interpretability: Simpler models are often more
interpretable and provide insights into the
underlying process.
Trade-off: Choosing between complexity for
accuracy and simplicity for explainability,
depending on the application's requirements.
89.
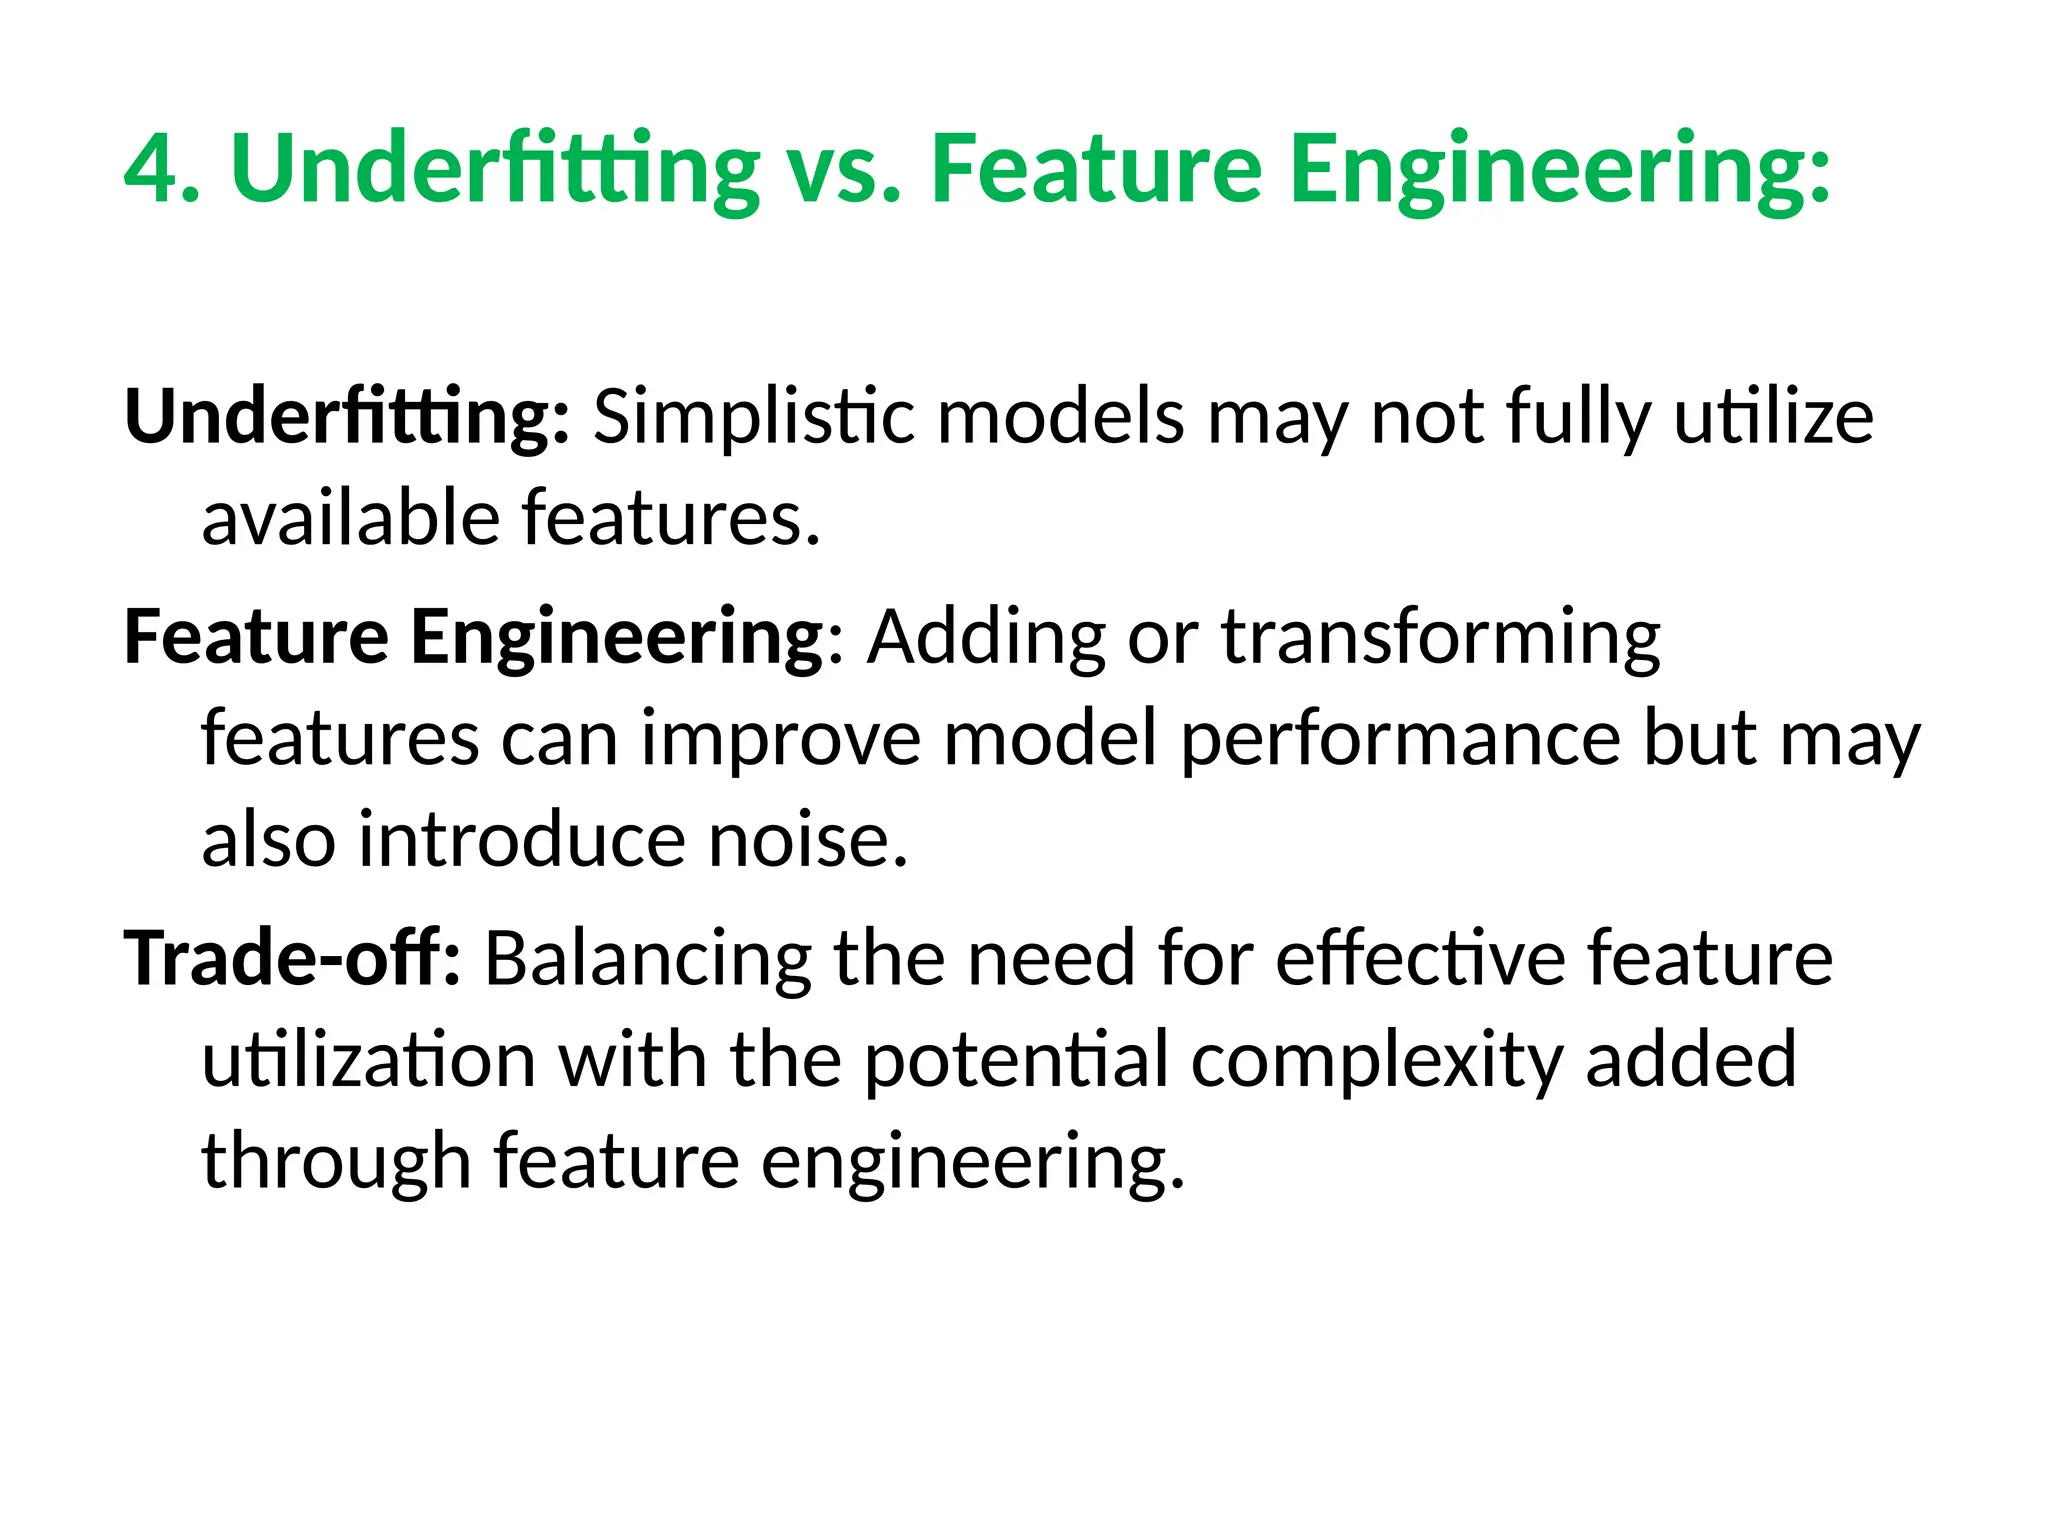
4. Underfitting vs.Feature Engineering:
Underfitting: Simplistic models may not fully utilize
available features.
Feature Engineering: Adding or transforming
features can improve model performance but may
also introduce noise.
Trade-off: Balancing the need for effective feature
utilization with the potential complexity added
through feature engineering.
90.
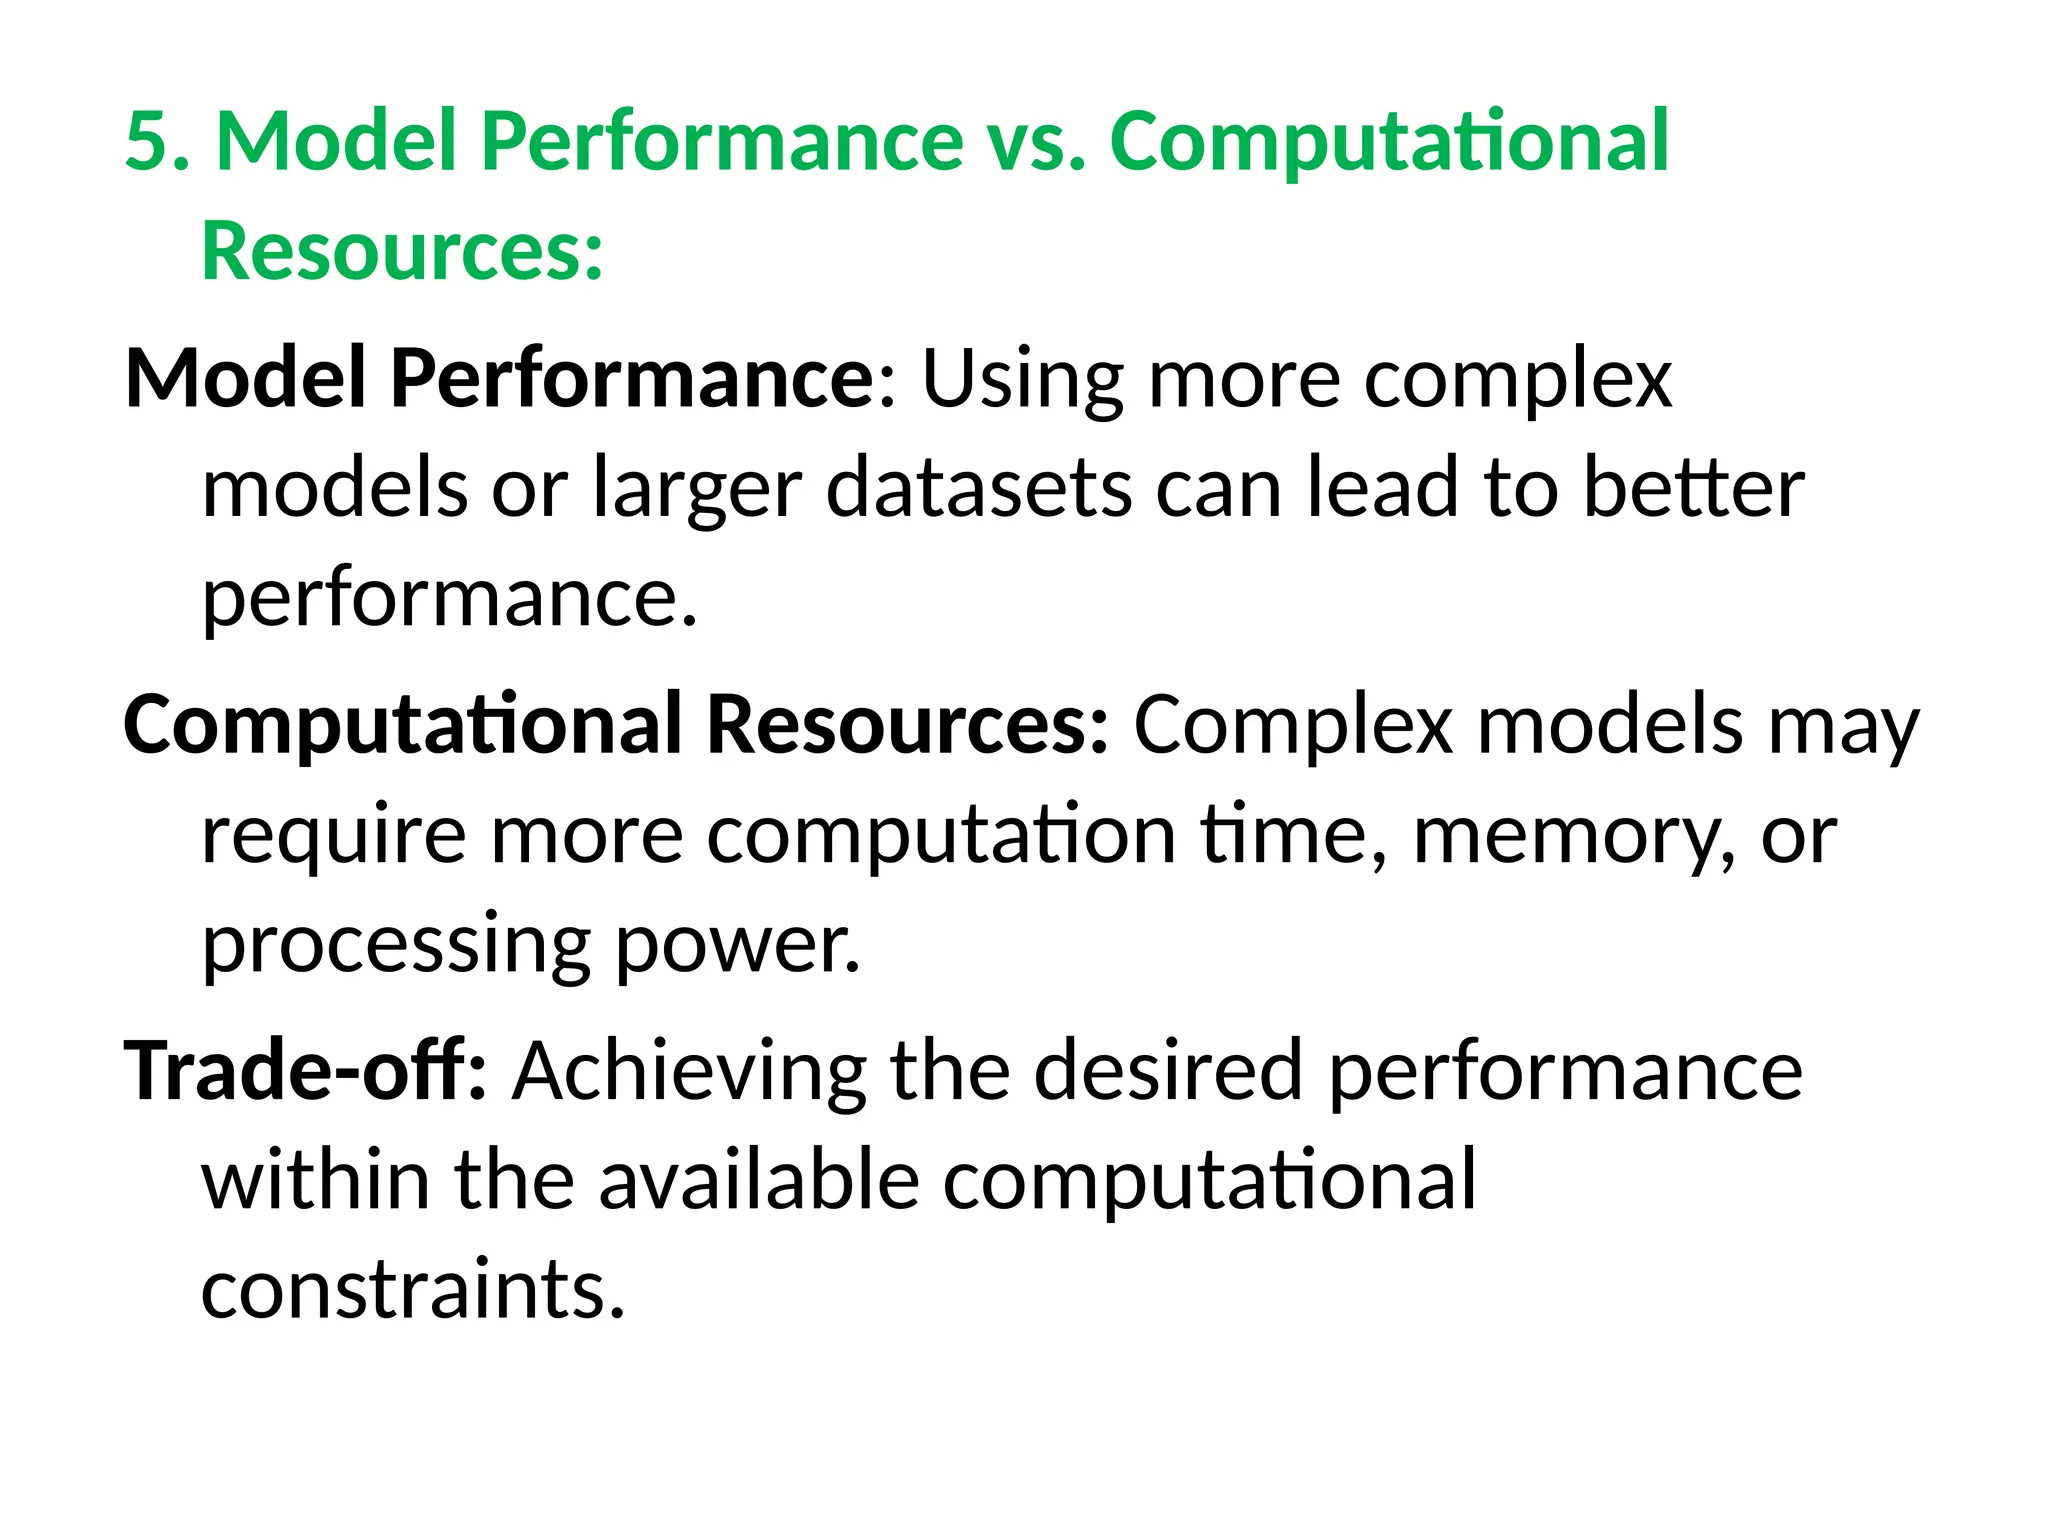
5. Model Performancevs. Computational
Resources:
Model Performance: Using more complex
models or larger datasets can lead to better
performance.
Computational Resources: Complex models may
require more computation time, memory, or
processing power.
Trade-off: Achieving the desired performance
within the available computational
constraints.
91.
6. Data Qualityvs. Model Performance:
Data Quality: High-quality, clean data leads to
more accurate models.
Model Performance: Models can't perform
better than the data they're trained on; noisy
or inaccurate data can degrade performance.
Trade-off: Balancing the effort invested in
improving data quality with the expected
improvements in model performance.
92.
7. Model Selectionvs. Model Complexity:
Model Selection: Choosing the best algorithm or
model for a given task.
Model Complexity: Different models have
varying levels of complexity and may perform
differently on different datasets.
Trade-off: Evaluating different models while
considering their complexity and performance
on the available data.
93.
ESTIMATING RISK STATISTICS:
Althoughmachine learning can be used as a risk
management tool, it also contains many risks
itself.
“To quantify the generalization risk is done by
the estimation of the loss this process is called
as Risk Estimation or risk Characterization”
94.
Below are afew risks associated with
Machine Learning:
1. Poor Data:
Poor data or dirty data includes errors in training
data, outliers, and unstructured data, which
cannot be adequately interpreted by the
model.
95.
2. Over fitting
•An over fitted model fits the training data so
perfectly that it becomes unable to learn the
variability for the algorithm.
• It means it won't be able to generalize well
when it comes to testing real data
96.
3. Biased data
•Biased (Bias means a systematic error that
occurs in the machine learning model itself
due to incorrect assumptions in the ML
process).
97.
4. Lack ofstrategy and experience:
• Further, lack of strategy and experience due to
fewer resources leads to wastage of time and
money as well as negatively affect the
organization's production and revenue.
98.
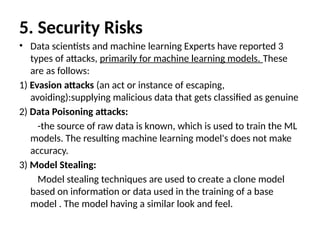
5. Security Risks
•Data scientists and machine learning Experts have reported 3
types of attacks, primarily for machine learning models. These
are as follows:
1) Evasion attacks (an act or instance of escaping,
avoiding):supplying malicious data that gets classified as genuine
2) Data Poisoning attacks:
-the source of raw data is known, which is used to train the ML
models. The resulting machine learning model's does not make
accuracy.
3) Model Stealing:
Model stealing techniques are used to create a clone model
based on information or data used in the training of a base
model . The model having a similar look and feel.
99.
6. Data privacyand confidentiality:
To achieve good results, we need to secure data
by defining some privacy terms and conditions
as well as making it confidential.
100.
7. Third-party risks
•Third-party risks generally exist when
someone outsources their business to third-
party service providers who may fail to
properly govern a machine learning solution.
101.
SAMPLING DISTRIBUTION OFAN ESTIMATOR:
a sample is a smaller part of a larger group.
This smaller portion is meant to be
representative of the population as a whole.
Sampling distribution (or the distribution of
data) is a statistical metric that determine
whether an event or certain outcome will take
place.
102.
• An estimatoris a rule or formula used to
calculate an estimate of a population
parameter based on sample data.
103.
how the conceptof the sampling distribution of
an estimator works:
1. Population Parameter:
- Consider a population with an unknown
parameter, such as the population mean (μ) or
population proportion (p).
104.
2. Random Sampling:
•- Draw multiple random samples of a fixed size
(n) from the population. Each sample provides
a set of observed data.
105.
EMPIRICAL RISK MINIMIZATION:
•Empirical risk refers to the training error,
which is the difference between the model's
predictions and the actual target values in the
training dataset.
• Minimizing empirical risk is a key objective in
training machine learning models to ensure
that they learn patterns from the training data.
Strategies to MinimizeEmpirical Risk:
1) Regularization: Regularization helps prevent
over fitting by balancing between fitting the
training data and keeping the model's
parameters small.
2) Feature Engineering: Create meaningful
features or representations that capture the
essential information from the data.
108.
3) Cross-Validation: Usetechniques like k-fold
cross-validation to estimate the model's
generalization performance on different data
splits. This helps detect over fitting and aids in
model selection.
4) Early Stopping: Monitor the model's
performance on a validation set during
training. Stop training when the validation
performance starts deteriorating, preventing
over fitting.


![1_Introduction to Machine Learning [Autosaved].pptx](https://cdn.slidesharecdn.com/ss_thumbnails/1introductiontomachinelearningautosaved-250910004933-3913b711-thumbnail.jpg?width=600ounds&width=560&fit=bounds)


