Unit II:
SUPERVISEDLEARNING(REGRESSION/CLASSIFICATION):
1) BasicMethods:
Distance based Methods,
Nearest Neighbours,
Decision Trees,
Naive Bayes,
2)Linear Models:
Linear Regression,
Logistic Regression,
Generalized Linear Models,
Support Vector Machines,
3) Binary Classification:
Multiclass/Structured outputs,
MNIST,
Ranking.
2.
I) Basic Methods:
DISTANCEBASED METHODS:
Distanced based algorithms are machine
learning algorithms that classify queries by
computing distances between these
points(queries).
3.
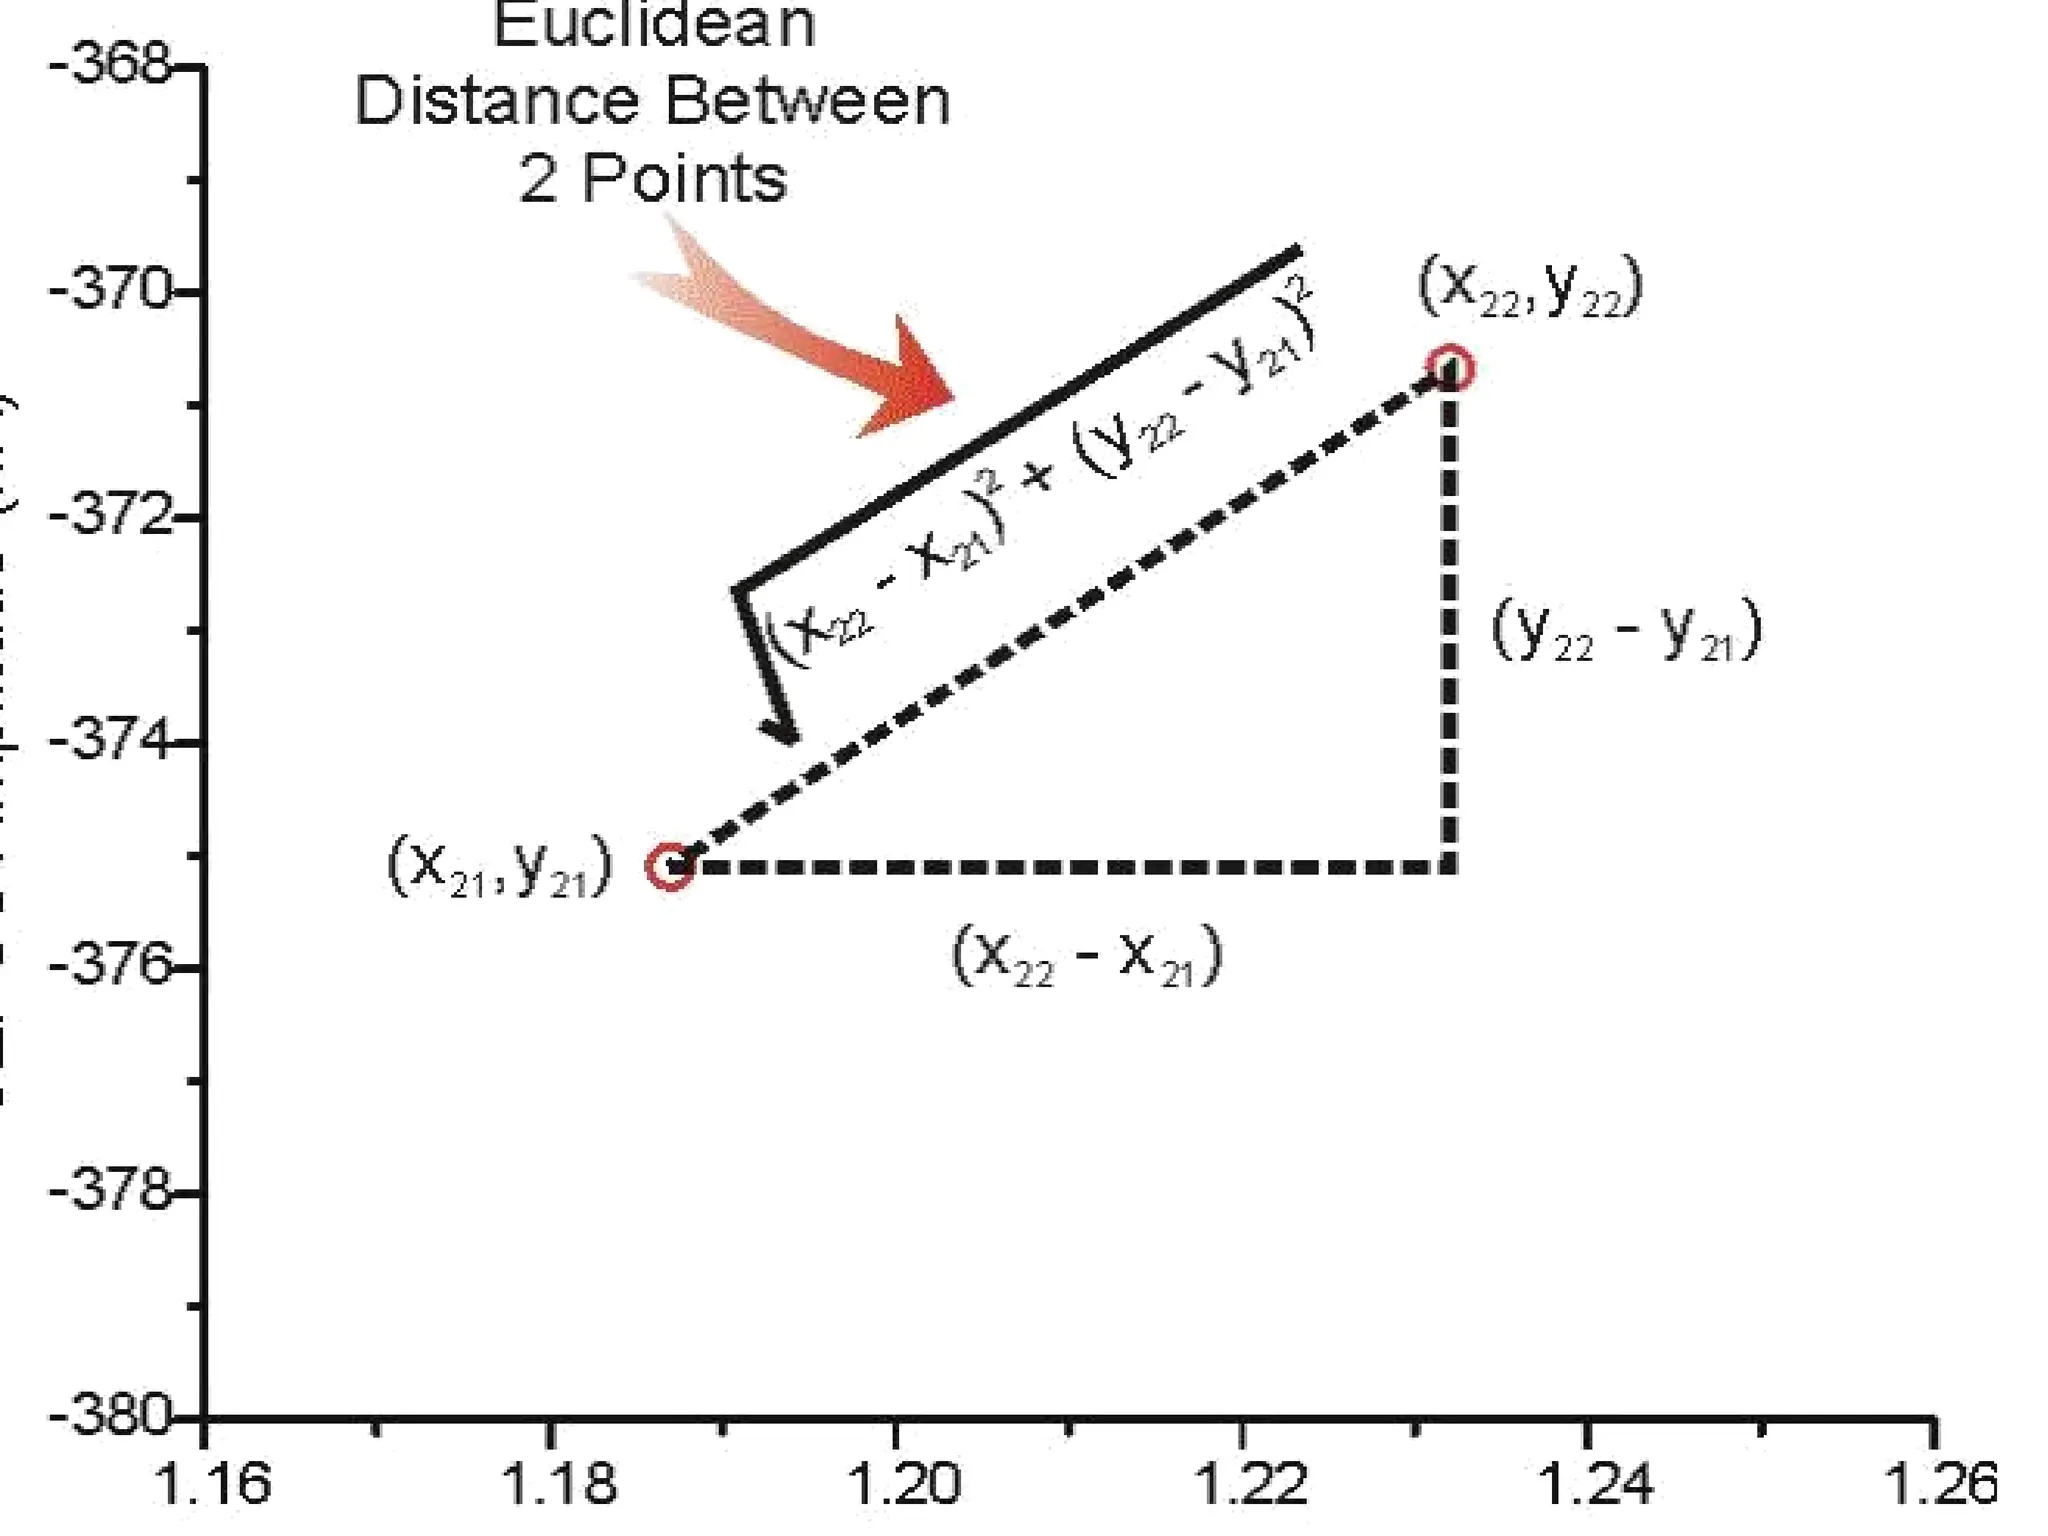
1) Euclidean Distance
Itis the most common use of distance.
Euclidean distance is also known as simply
distance.
When data is dense or continuous, this is the
best proximity measure.
4.
The Euclidean distancebetween two points is
the length of the path connecting them.
The Pythagorean theory gives distance
between two points.
6.
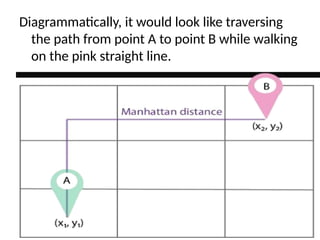
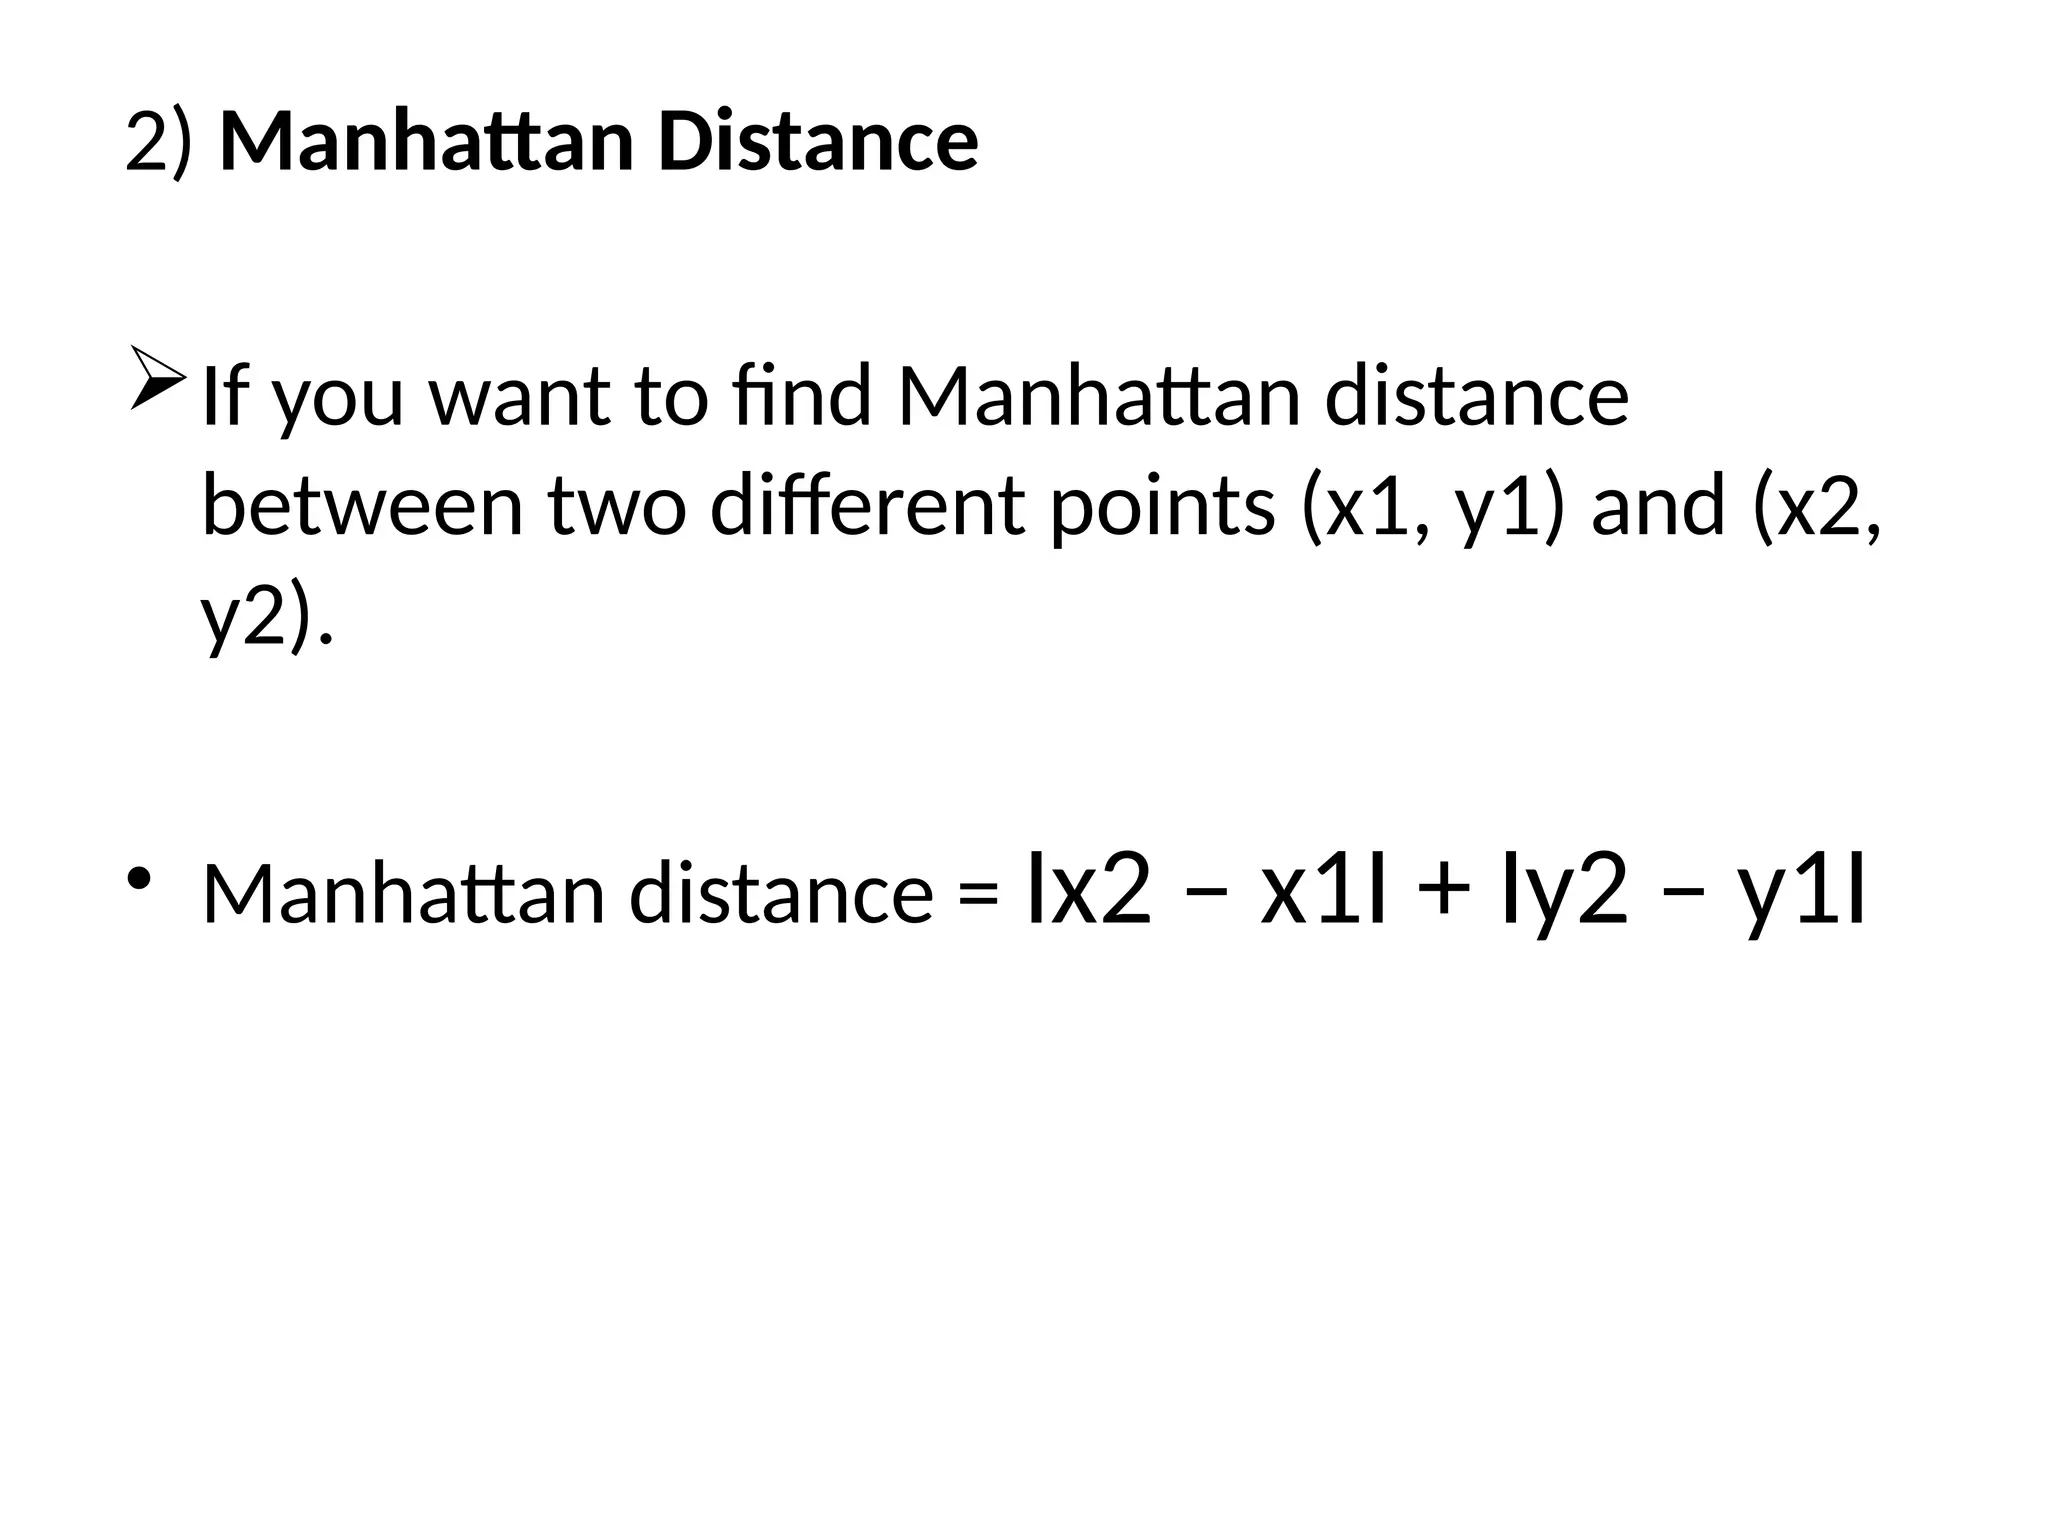
2) Manhattan Distance
Ifyou want to find Manhattan distance
between two different points (x1, y1) and (x2,
y2).
• Manhattan distance = Ix2 – x1I + Iy2 – y1I
7.
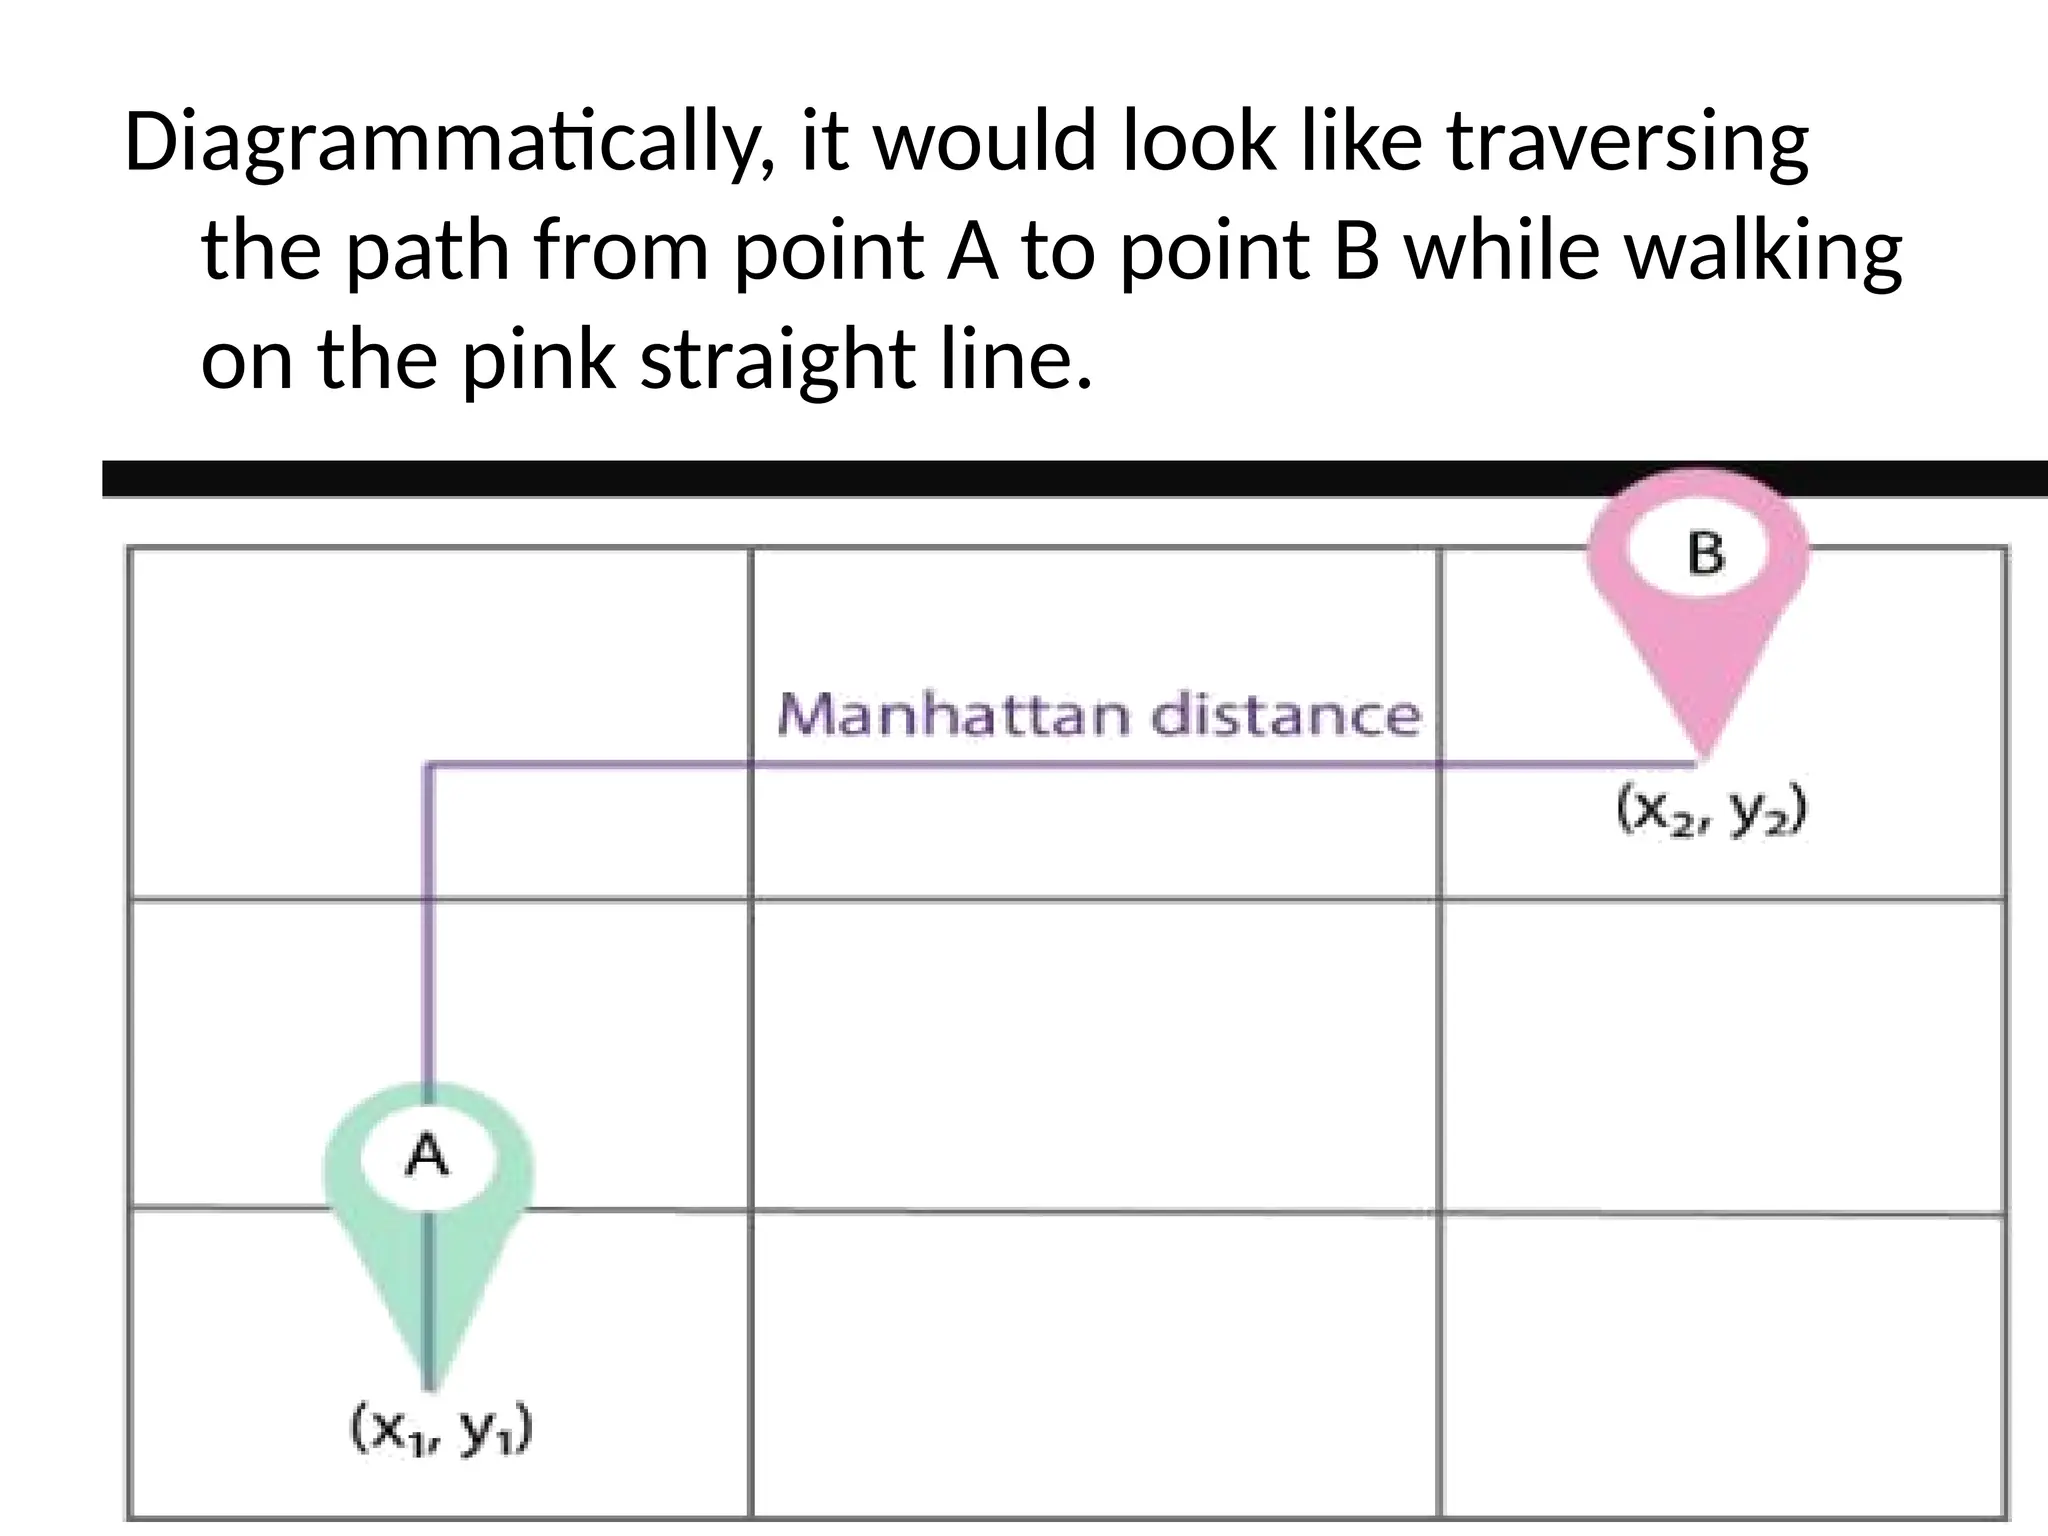
Diagrammatically, it wouldlook like traversing
the path from point A to point B while walking
on the pink straight line.
8.
3) Minkowski Distance
•The generalized form of the Euclidean and
Manhattan Distances is the Minkowski
Distance.
• You can express the Minkowski distance as
9.
If h= 1,Manhattan Distance is represented.
If h=2 in the above formula, Euclidean
Distance is represented.
10.
NEAREST NEIGHBOURS (KNN)
Theabbreviation KNN stands for “K-Nearest
Neighbour”.
It is a supervised machine learning algorithm.
The algorithm can be used to solve both
classification and regression problem
statements.
11.
The number ofnearest neighbours to a new
unknown variable that has to be predicted or
classified is denoted by the symbol ‘K’.
12.
KNN calculates thedistance from all points in
the proximity of the unknown data and filters
out the ones with the shortest distances to it.
As a result, it’s often referred to as a distance-
based algorithm.
13.
In order tocorrectly classify the results, we
must first determine the value of K (Number
of Nearest Neighbours).
• It is recommended to always select an odd
value of K
14.
NAÏVE BAYES CLASSIFIERALGORITHM
Naïve Bayes algorithm is a
supervised learning algorithm, which
is based on Bayes theorem and used
for solving classification problems.
15.
• It ismainly used in text classification that
includes a high-dimensional training dataset.
• which helps in building the fast machine
learning models that can make quick
predictions.
16.
It is aprobabilistic classifier, which means it
predicts on the basis of the probability of an
object.
17.
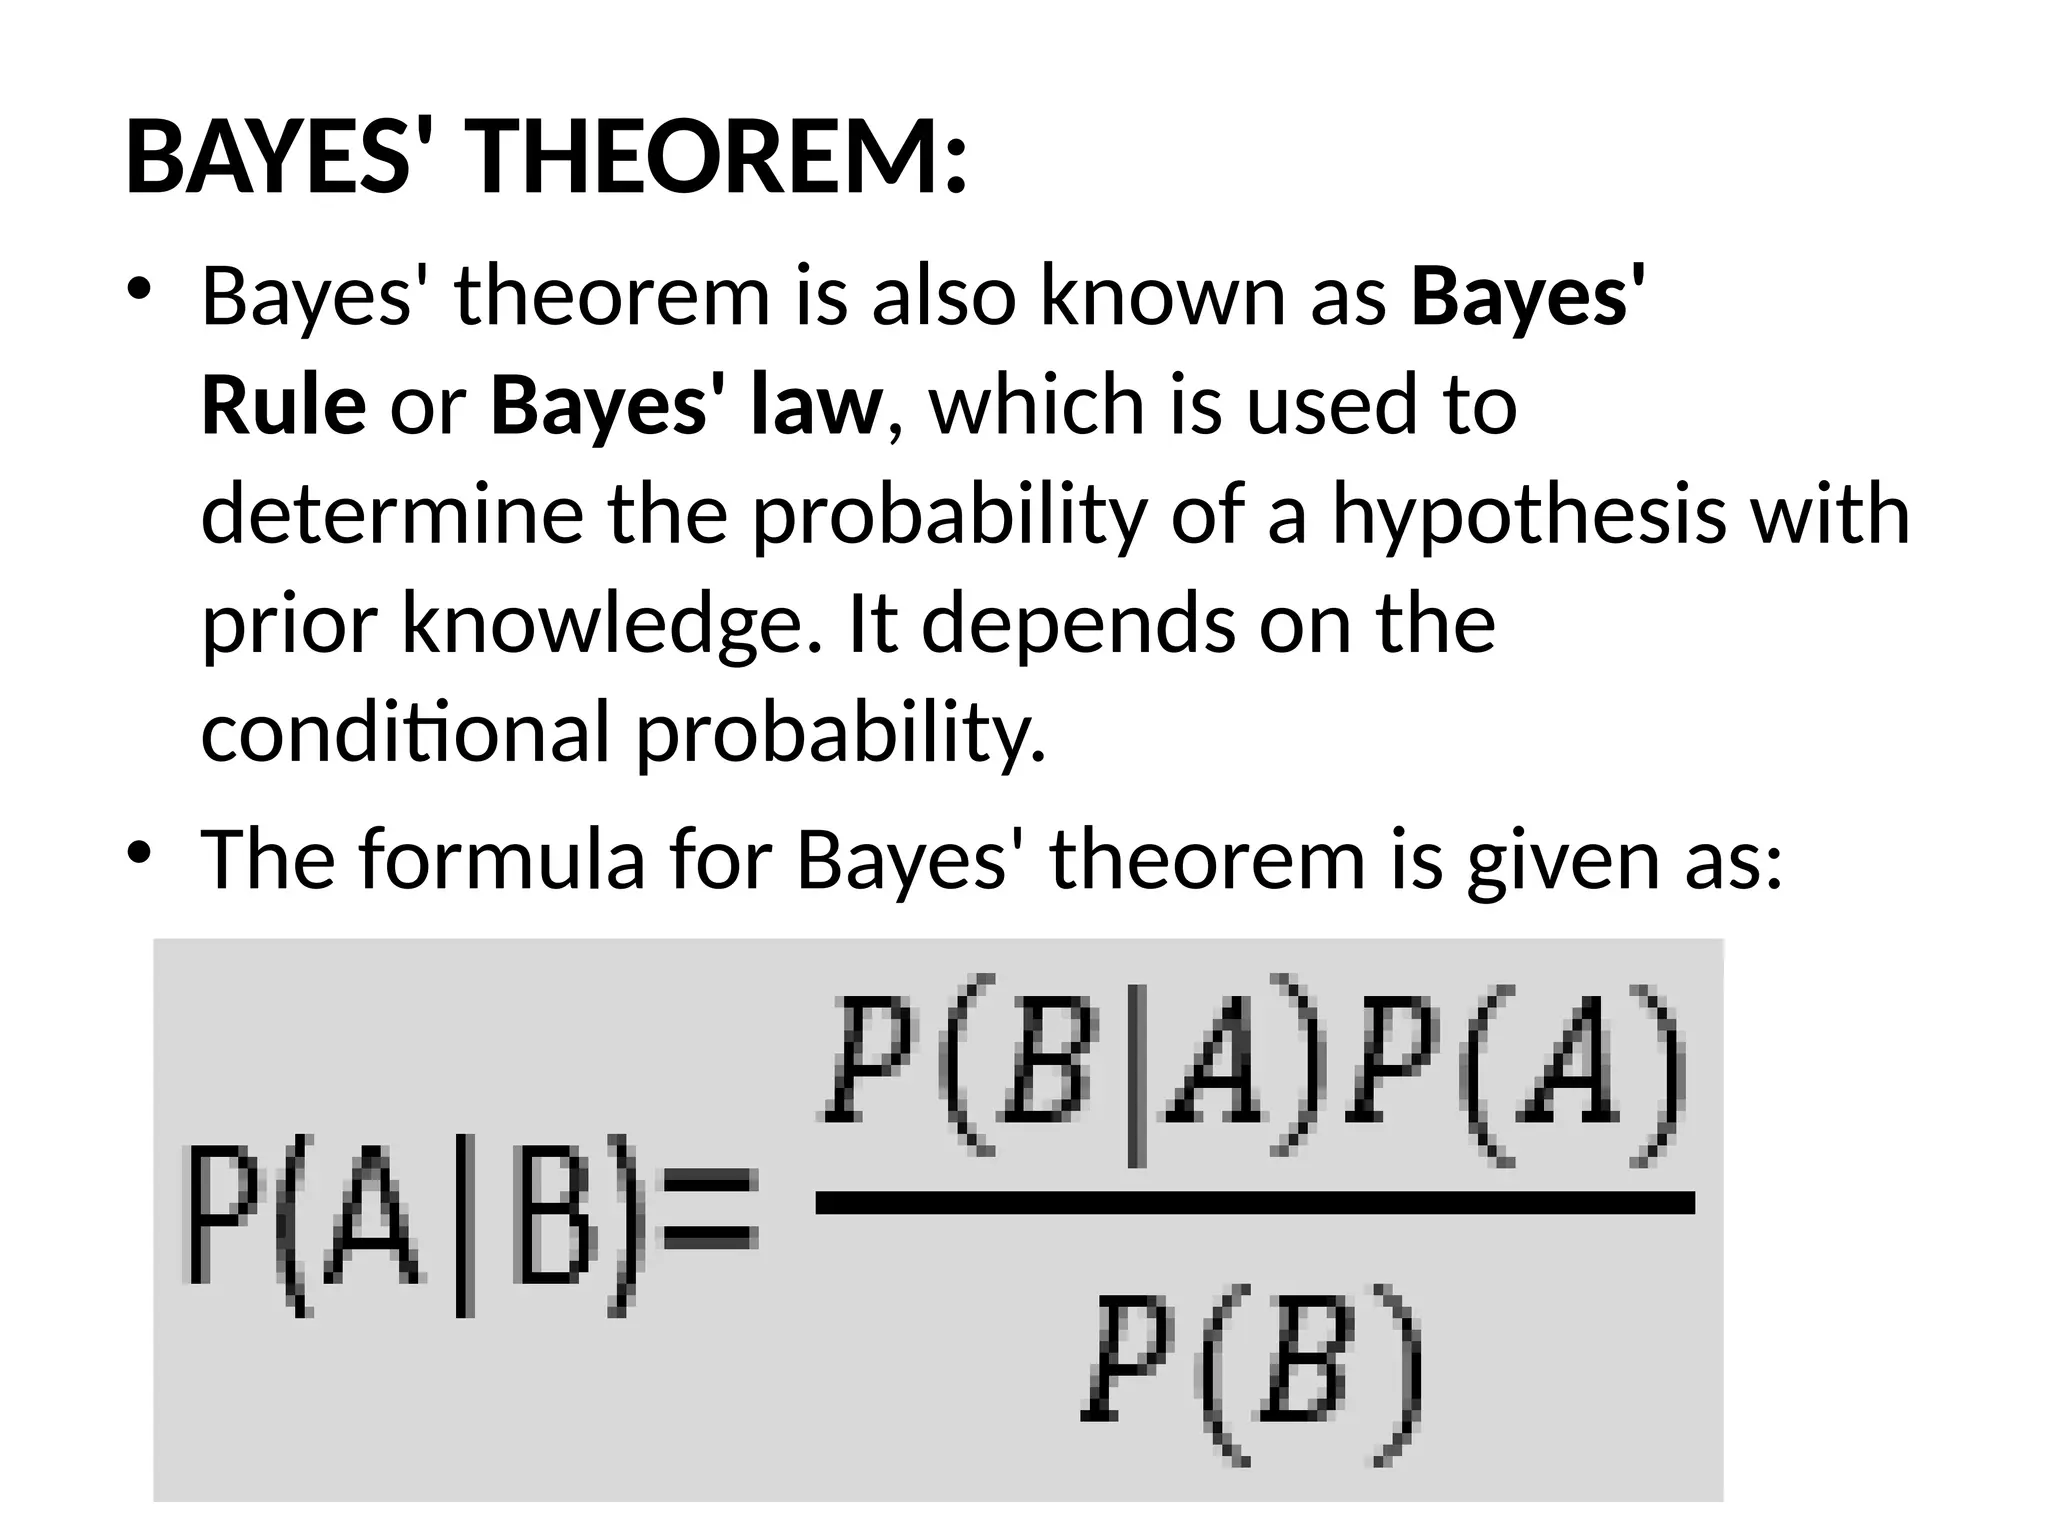
BAYES' THEOREM:
• Bayes'theorem is also known as Bayes'
Rule or Bayes' law, which is used to
determine the probability of a hypothesis with
prior knowledge. It depends on the
conditional probability.
• The formula for Bayes' theorem is given as:
18.
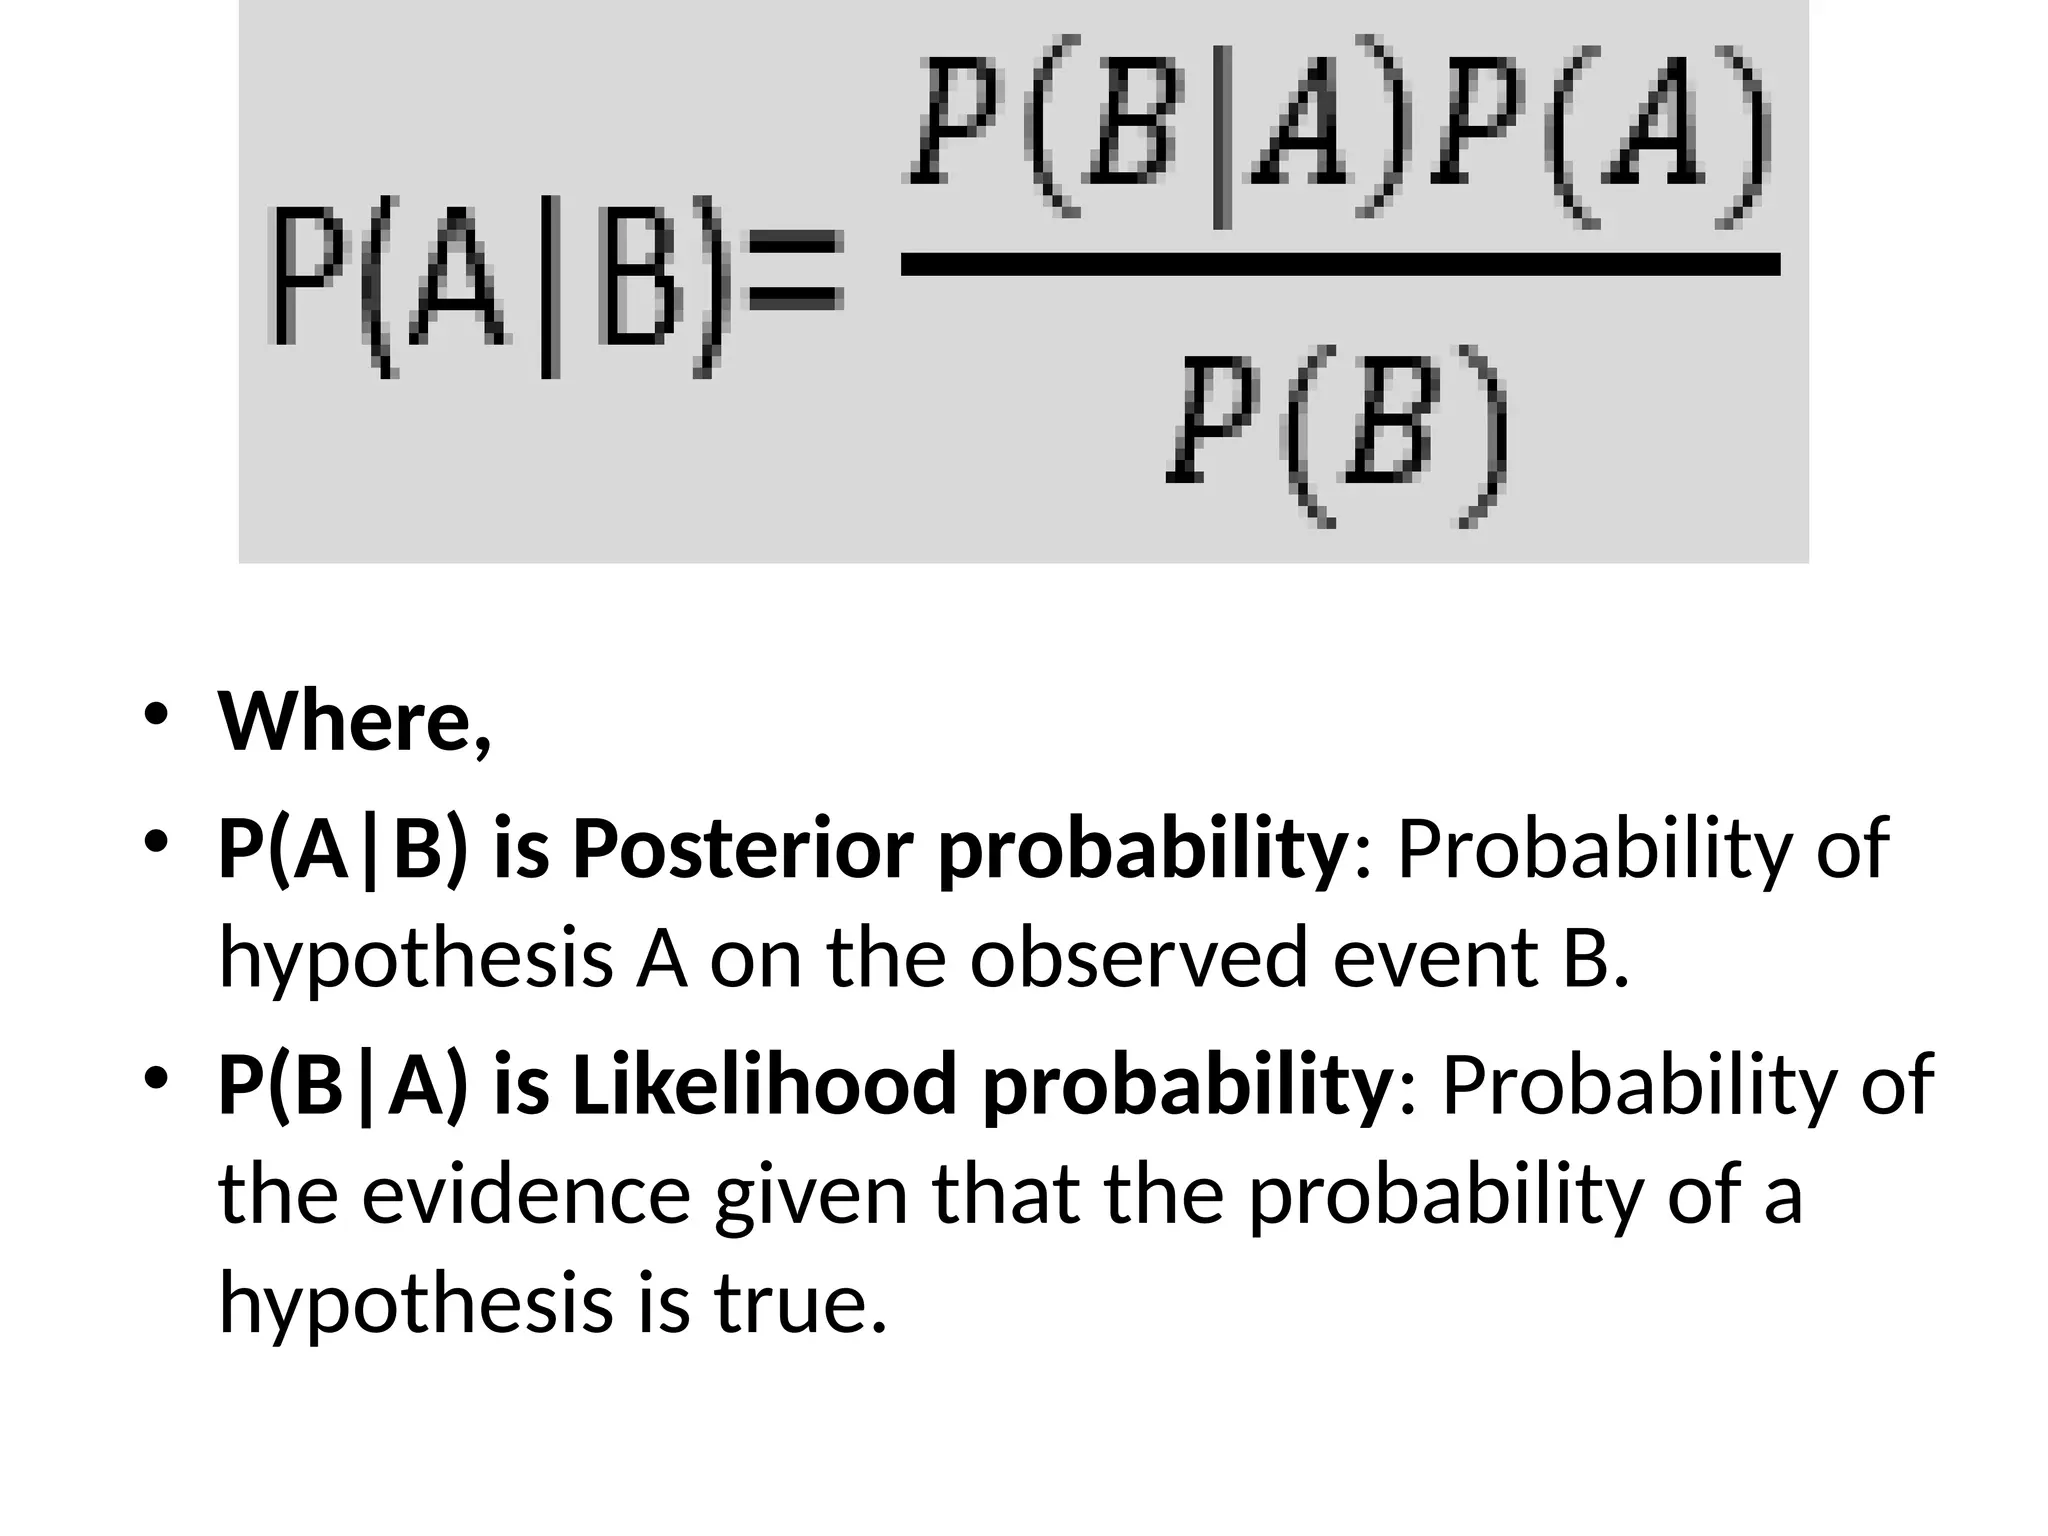
• Where,
• P(A|B)is Posterior probability: Probability of
hypothesis A on the observed event B.
• P(B|A) is Likelihood probability: Probability of
the evidence given that the probability of a
hypothesis is true.
19.
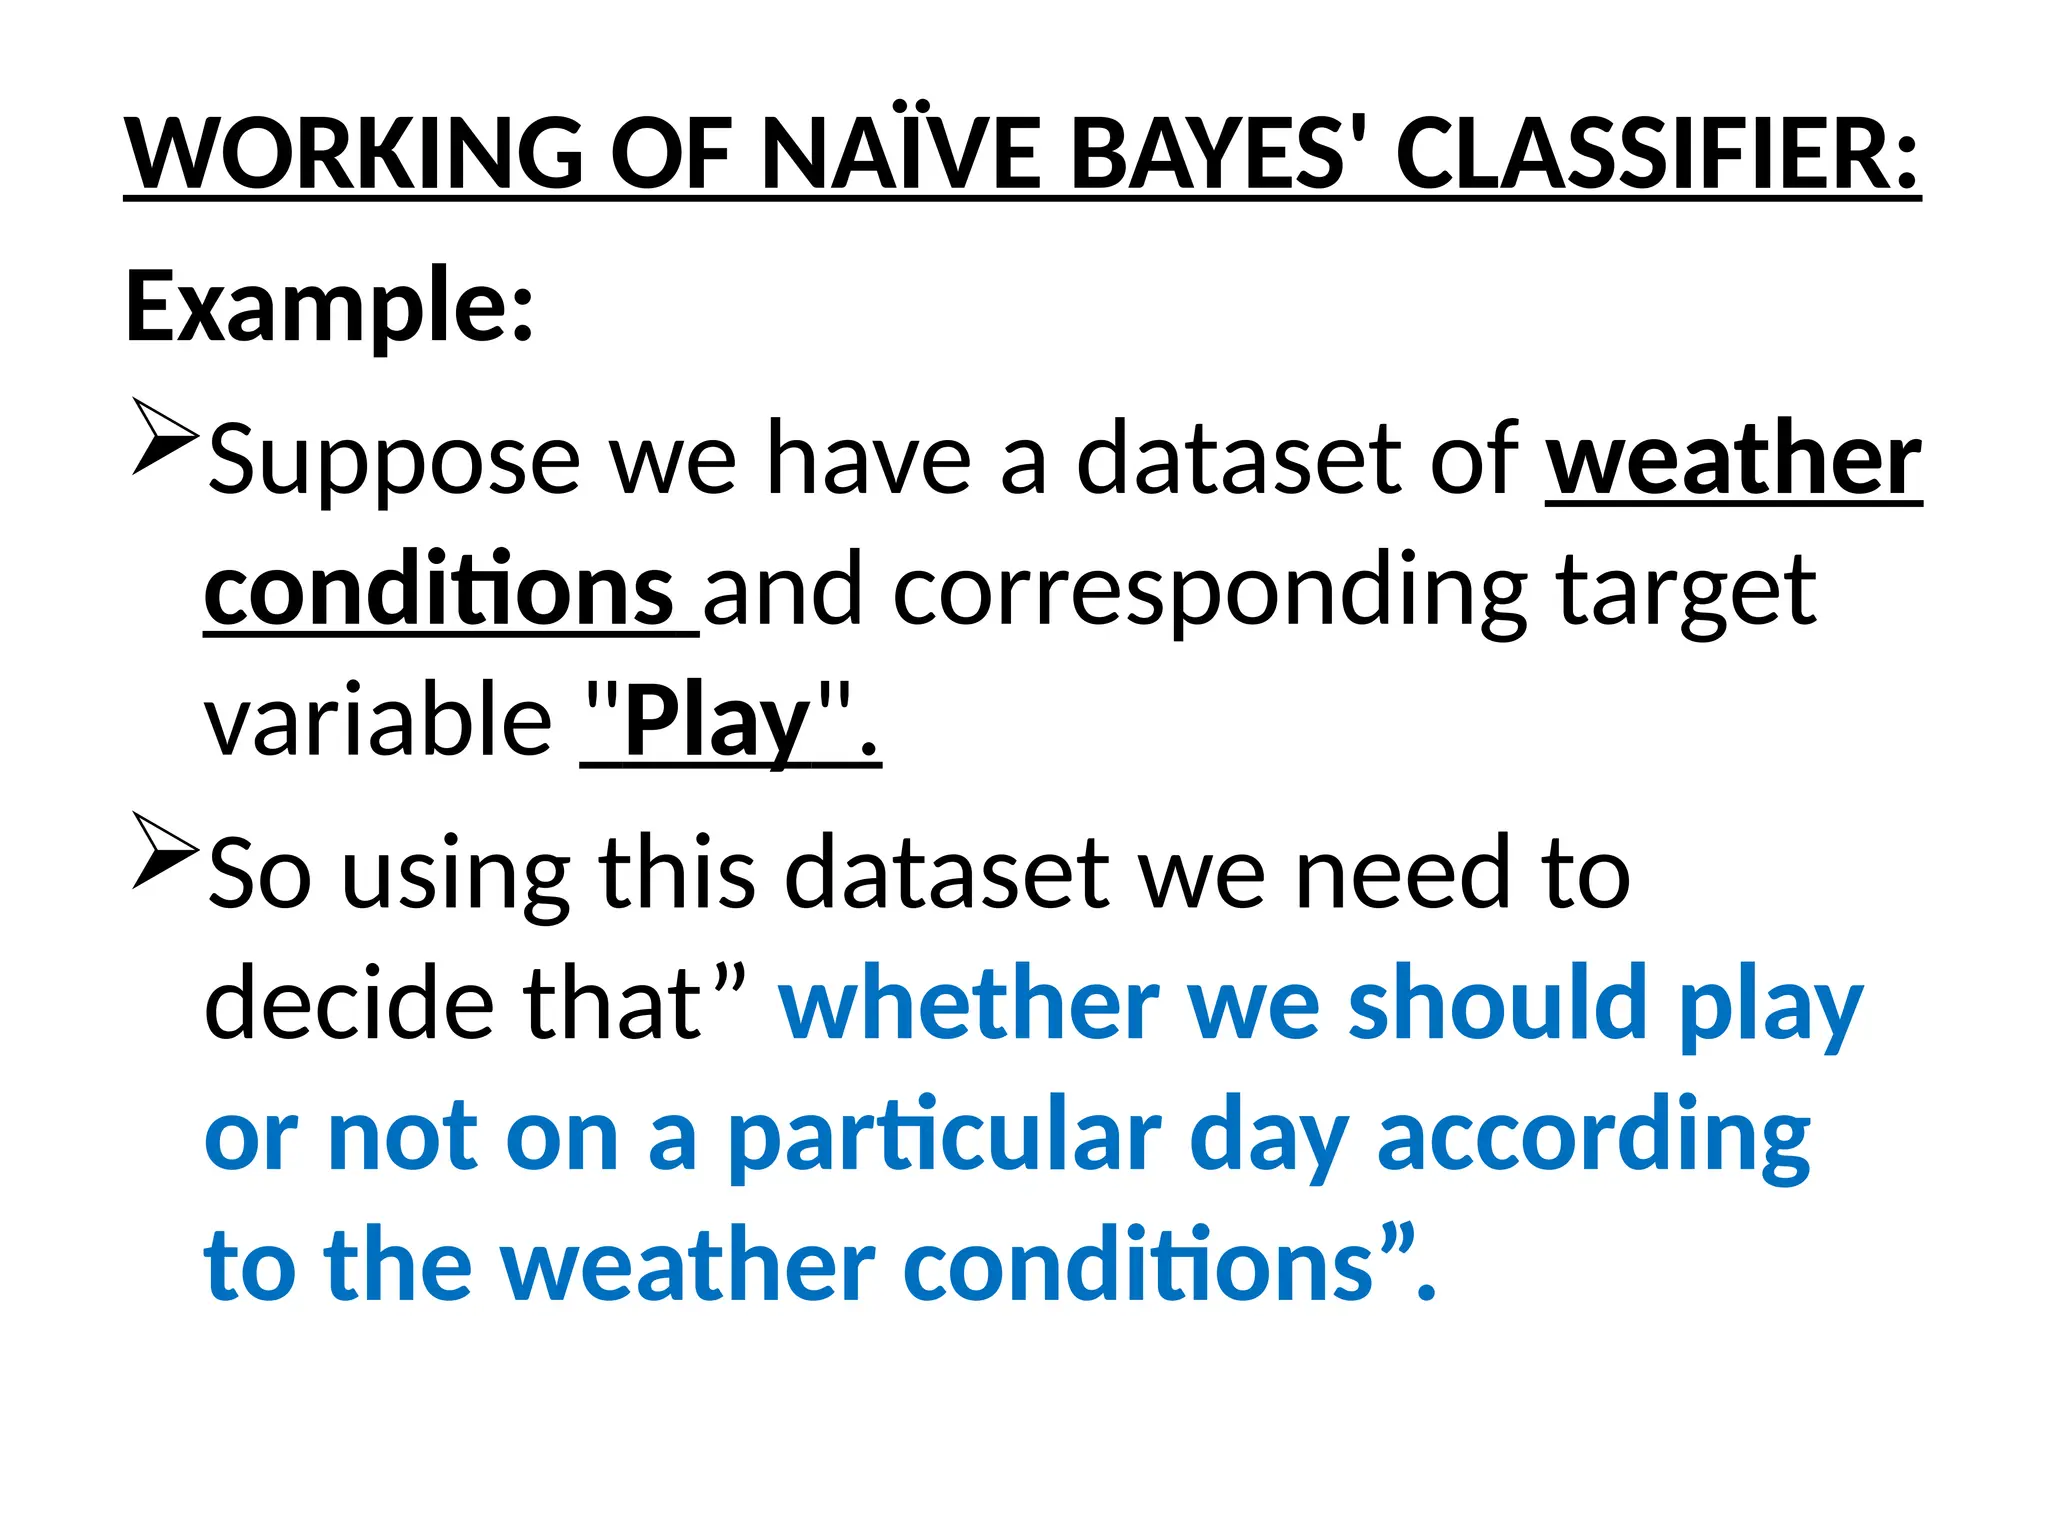
WORKING OF NAÏVEBAYES' CLASSIFIER:
Example:
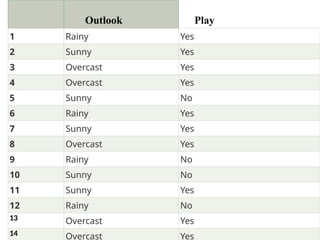
Suppose we have a dataset of weather
conditions and corresponding target
variable "Play".
So using this dataset we need to
decide that” whether we should play
or not on a particular day according
to the weather conditions”.
20.
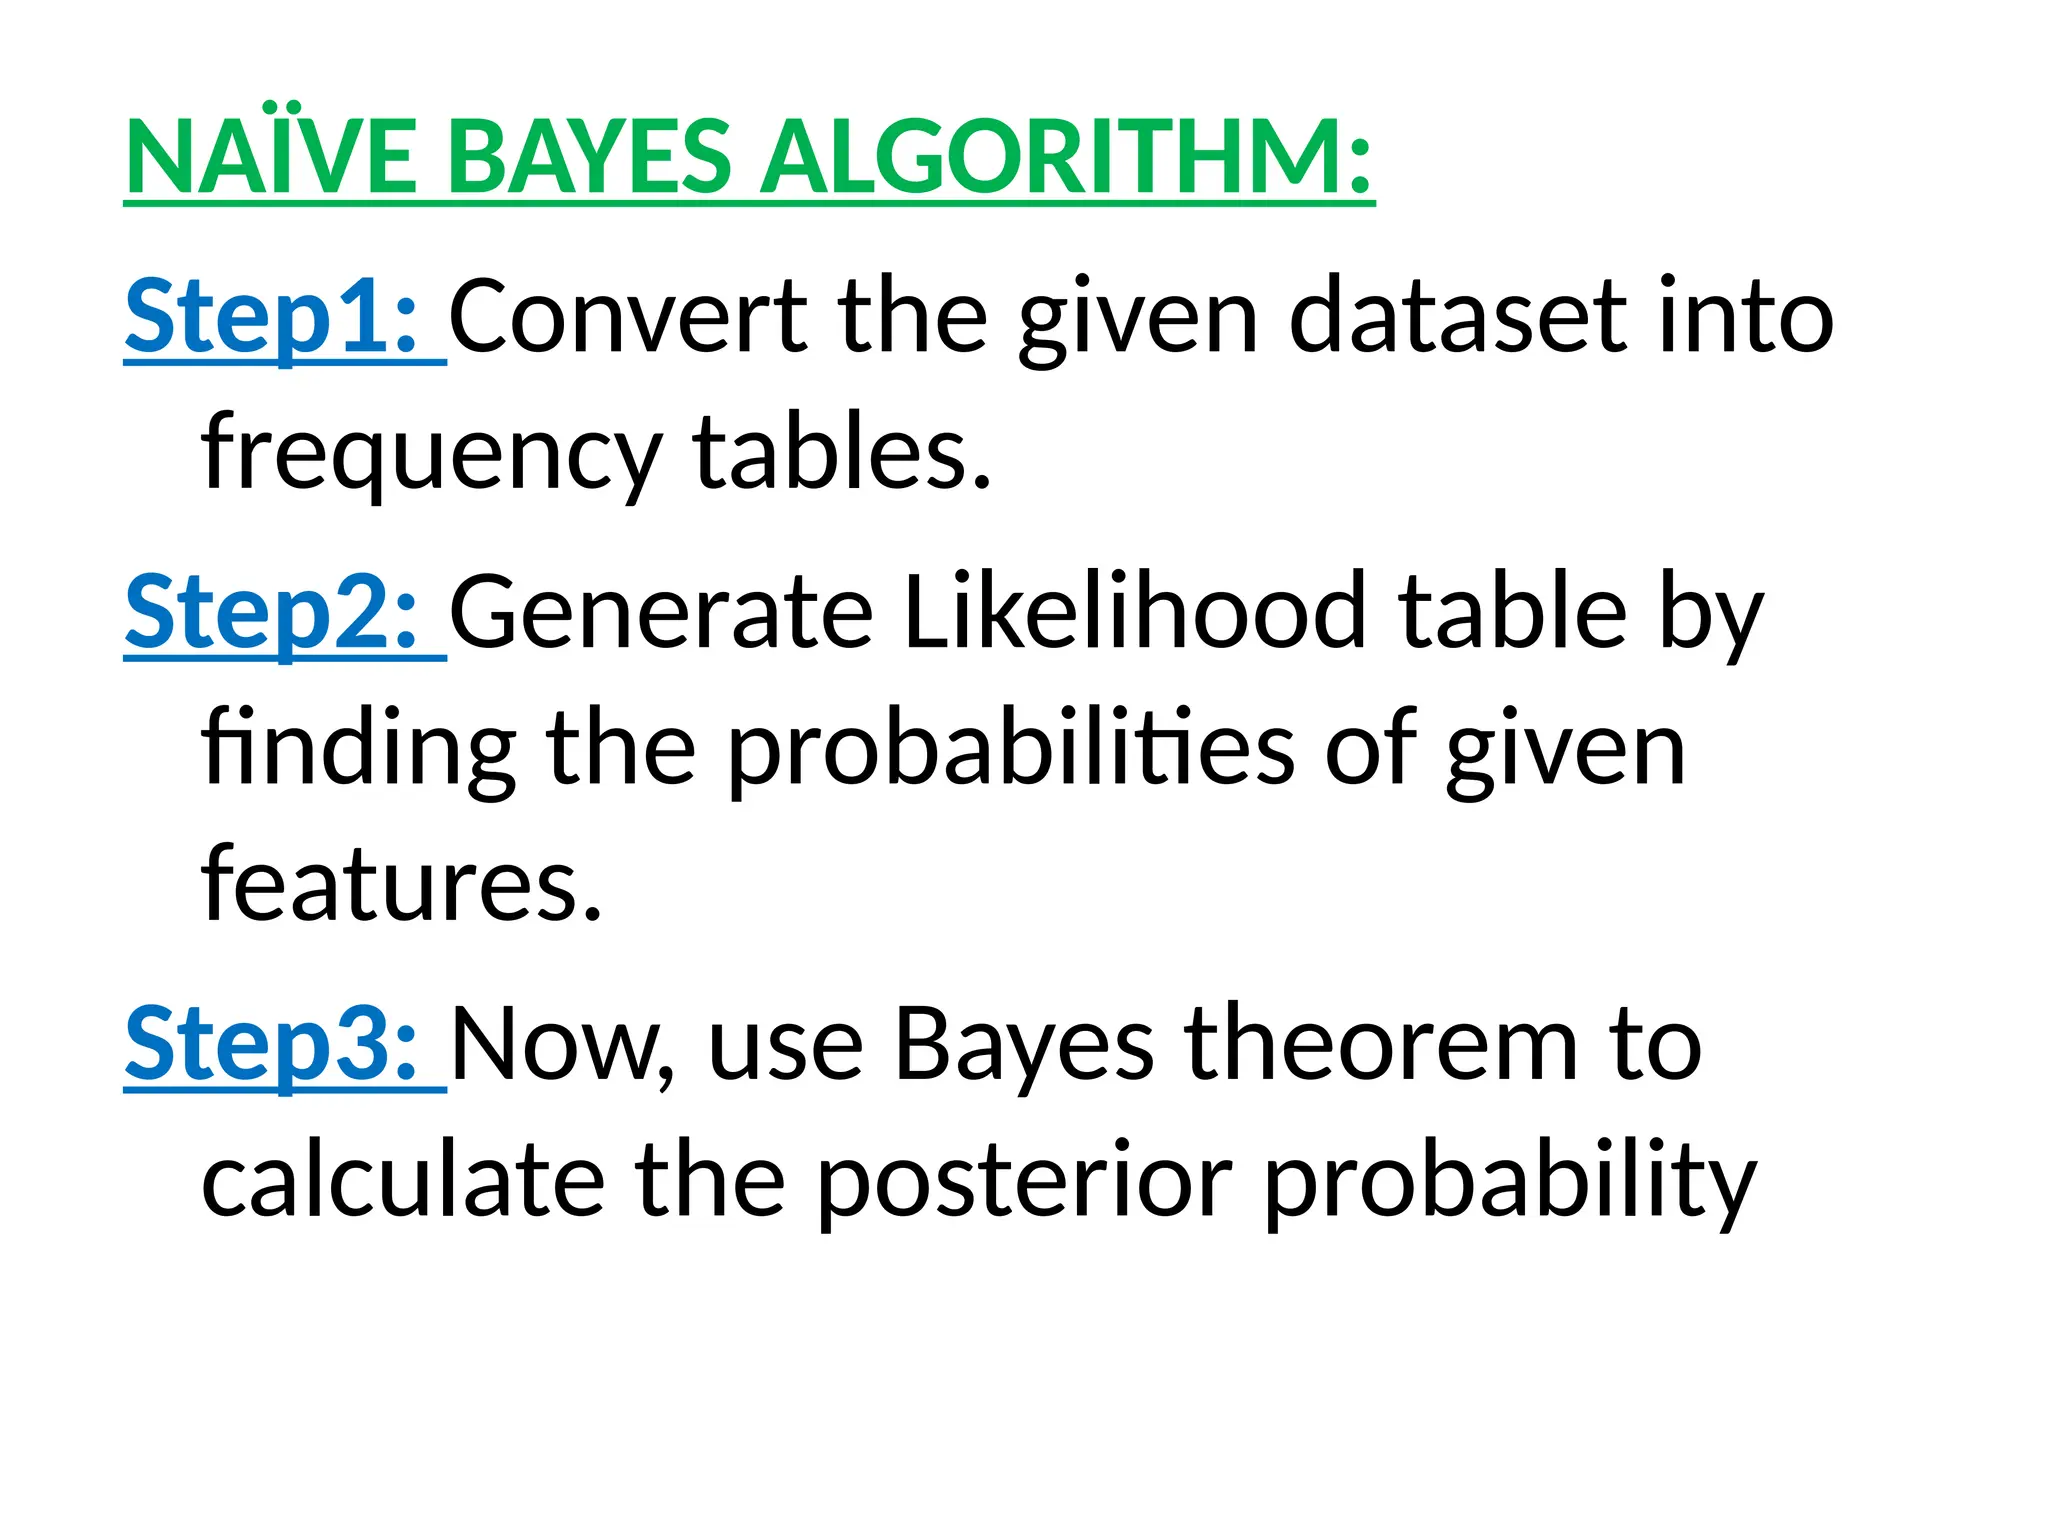
NAÏVE BAYES ALGORITHM:
Step1:Convert the given dataset into
frequency tables.
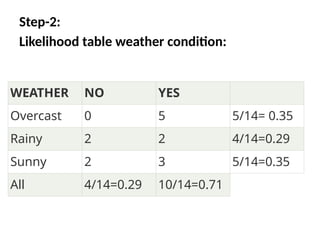
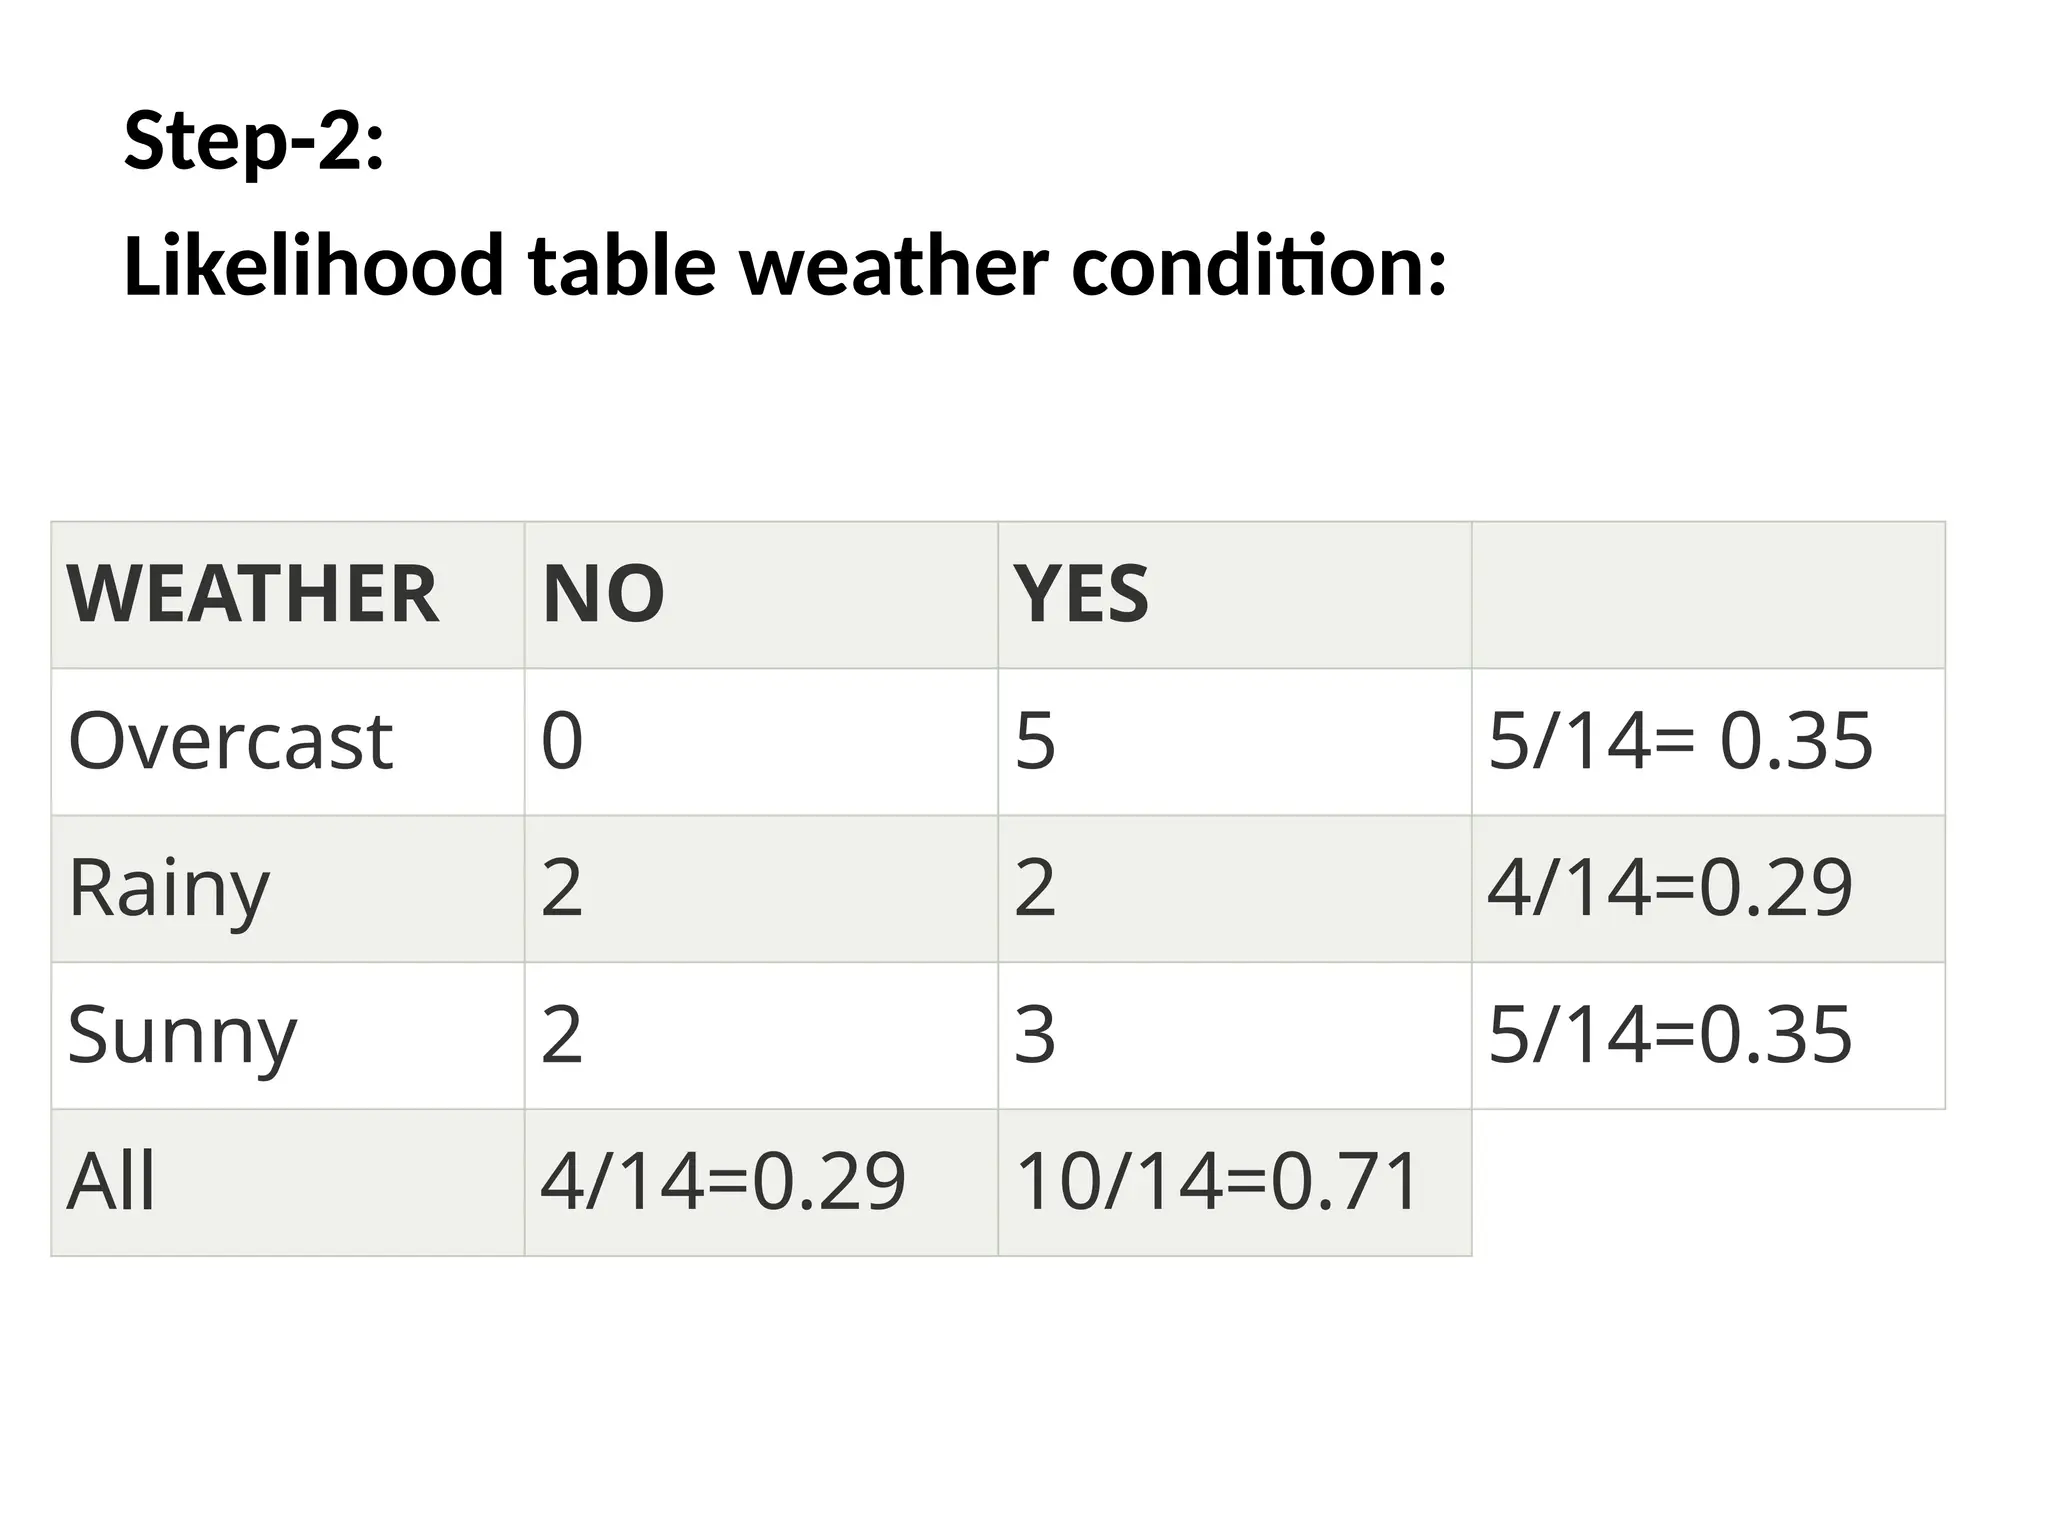
Step2: Generate Likelihood table by
finding the probabilities of given
features.
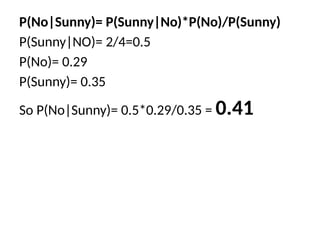
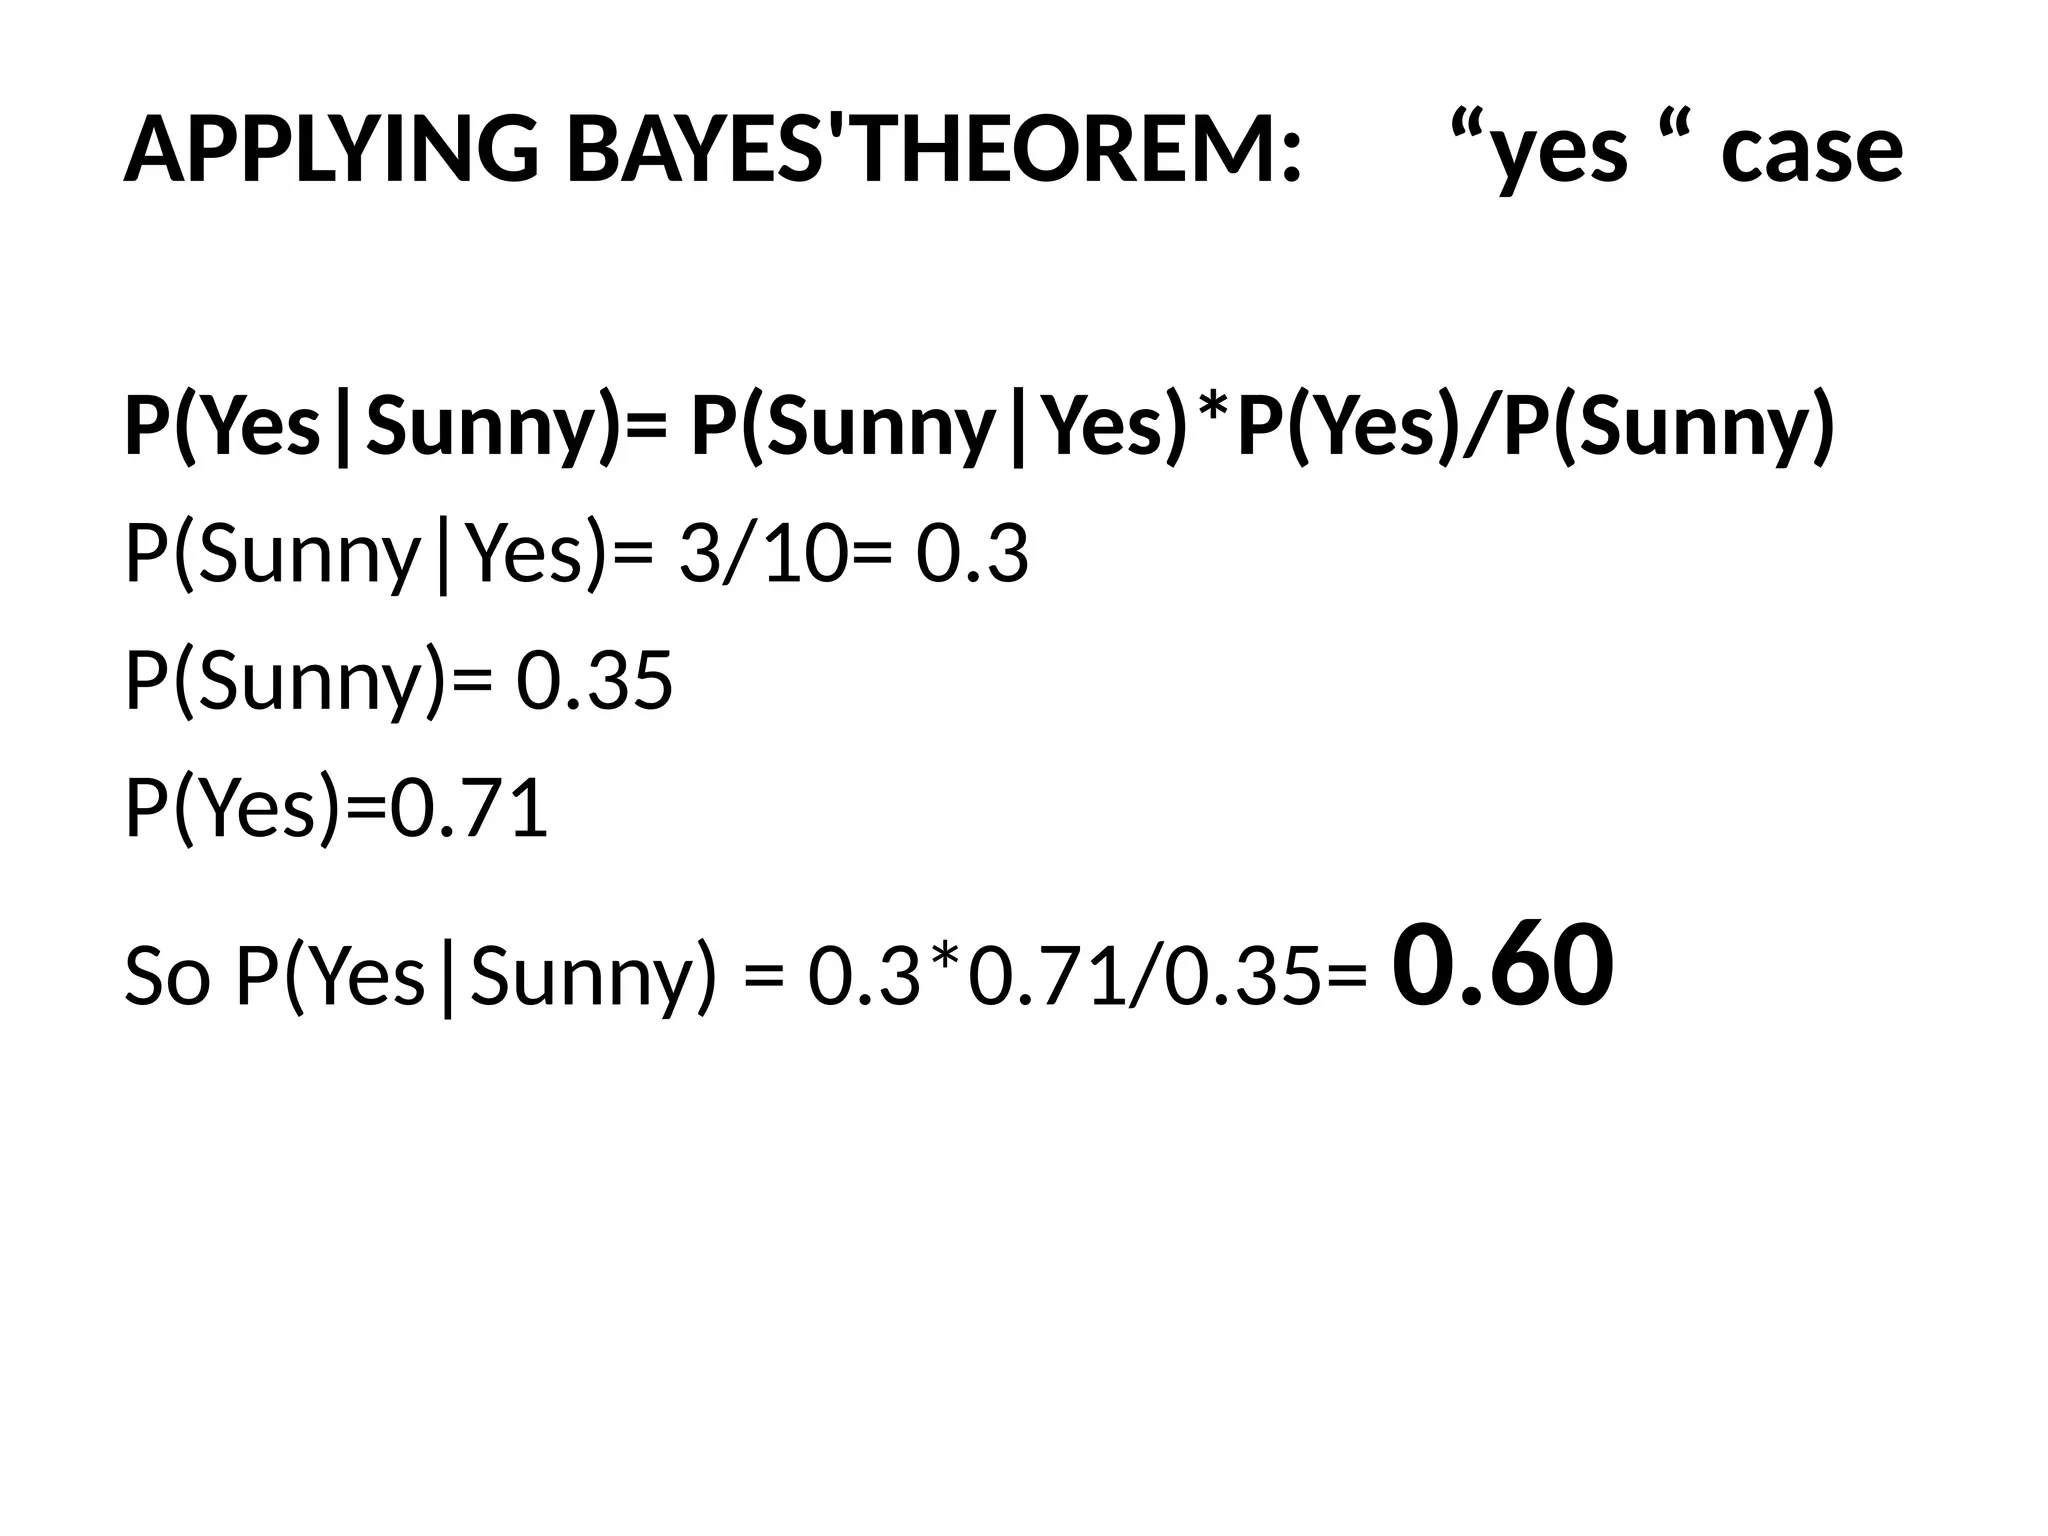
Step3: Now, use Bayes theorem to
calculate the posterior probability
21.
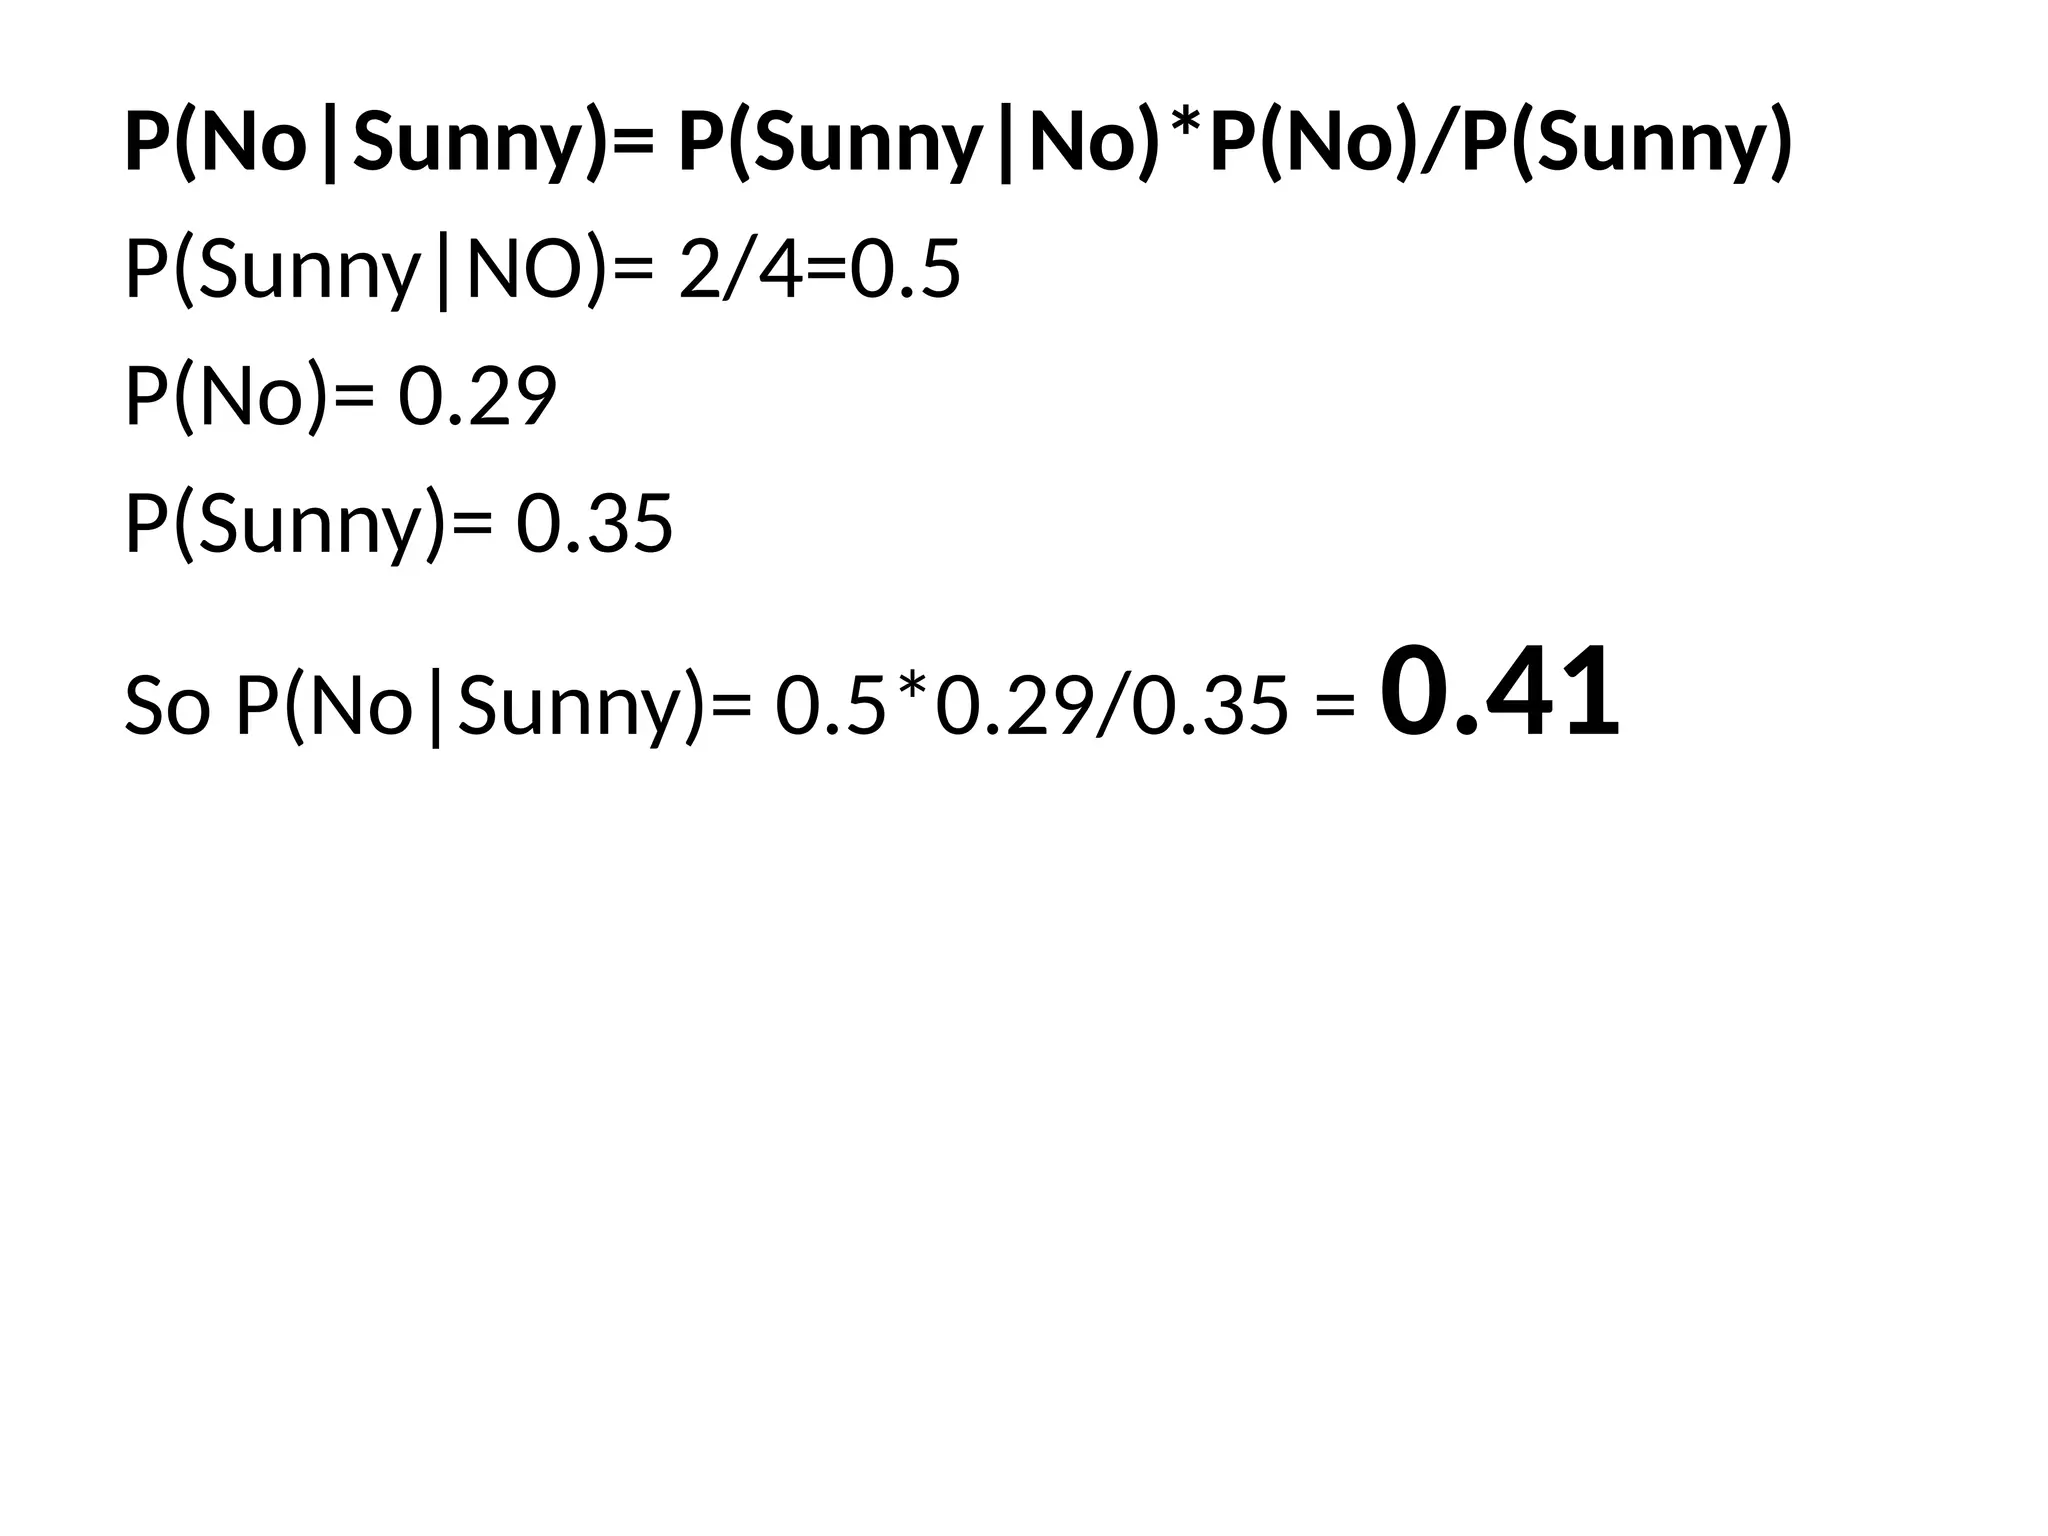
• Problem: Ifthe weather is sunny, then the
Player should play or not?
• Solution: To solve this, first consider the below
dataset:
22.
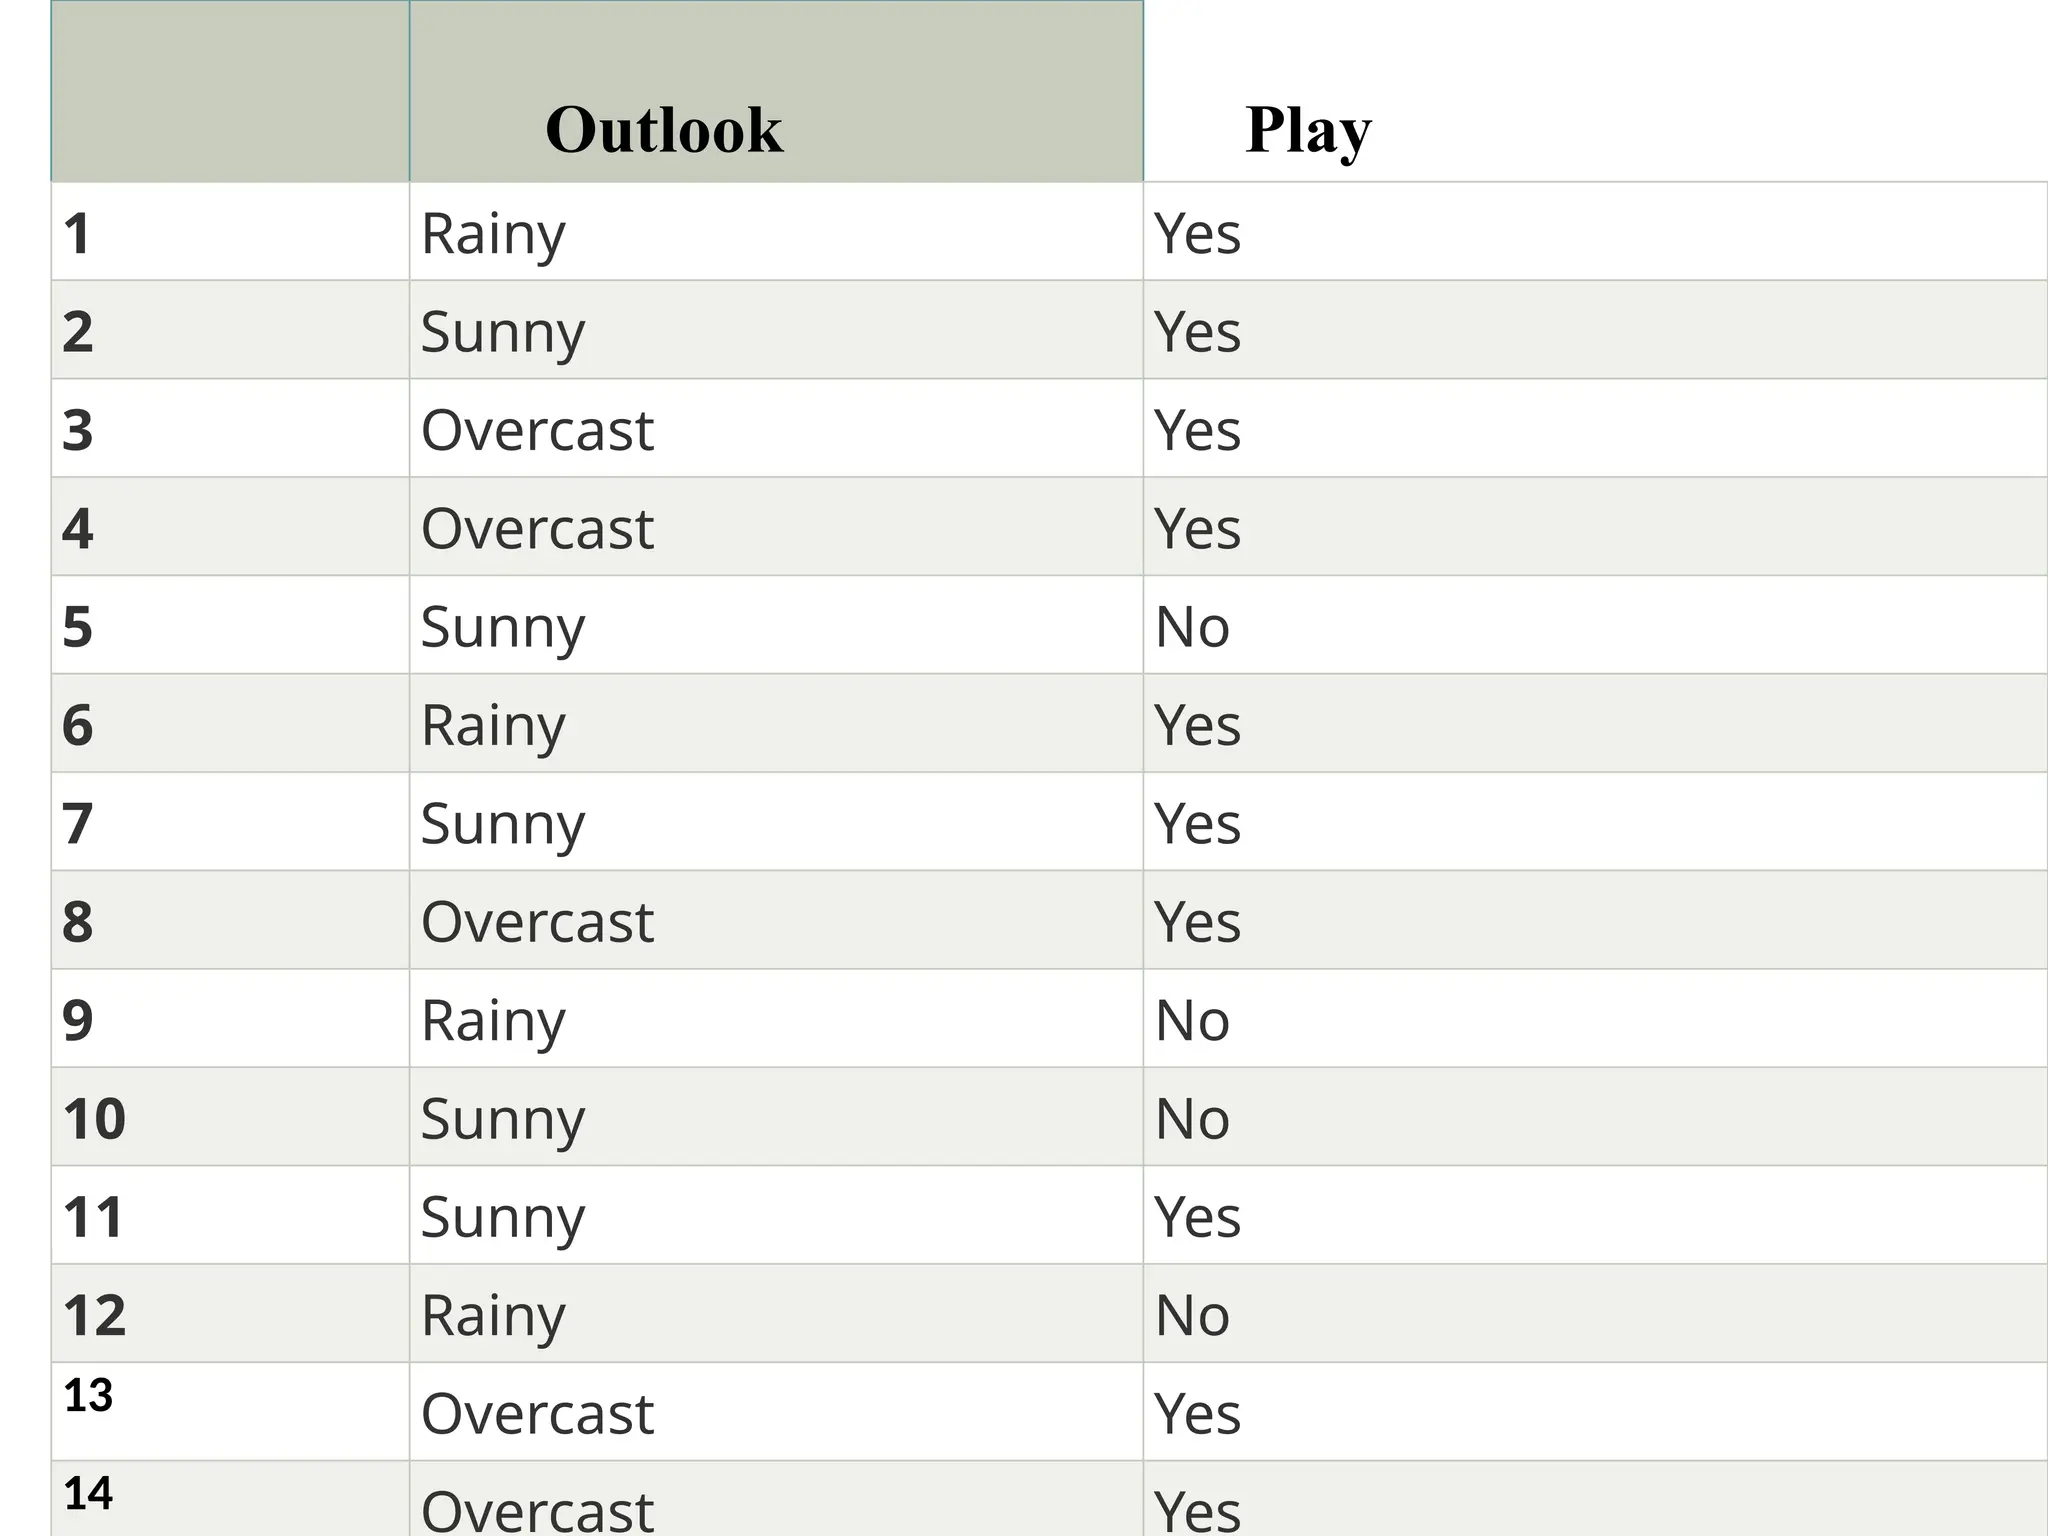
Outlook Play
1 RainyYes
2 Sunny Yes
3 Overcast Yes
4 Overcast Yes
5 Sunny No
6 Rainy Yes
7 Sunny Yes
8 Overcast Yes
9 Rainy No
10 Sunny No
11 Sunny Yes
12 Rainy No
13 Overcast Yes
14 Overcast Yes
23.
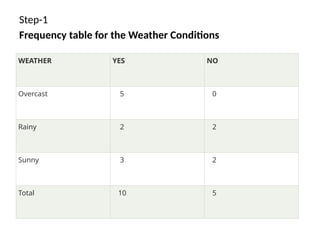
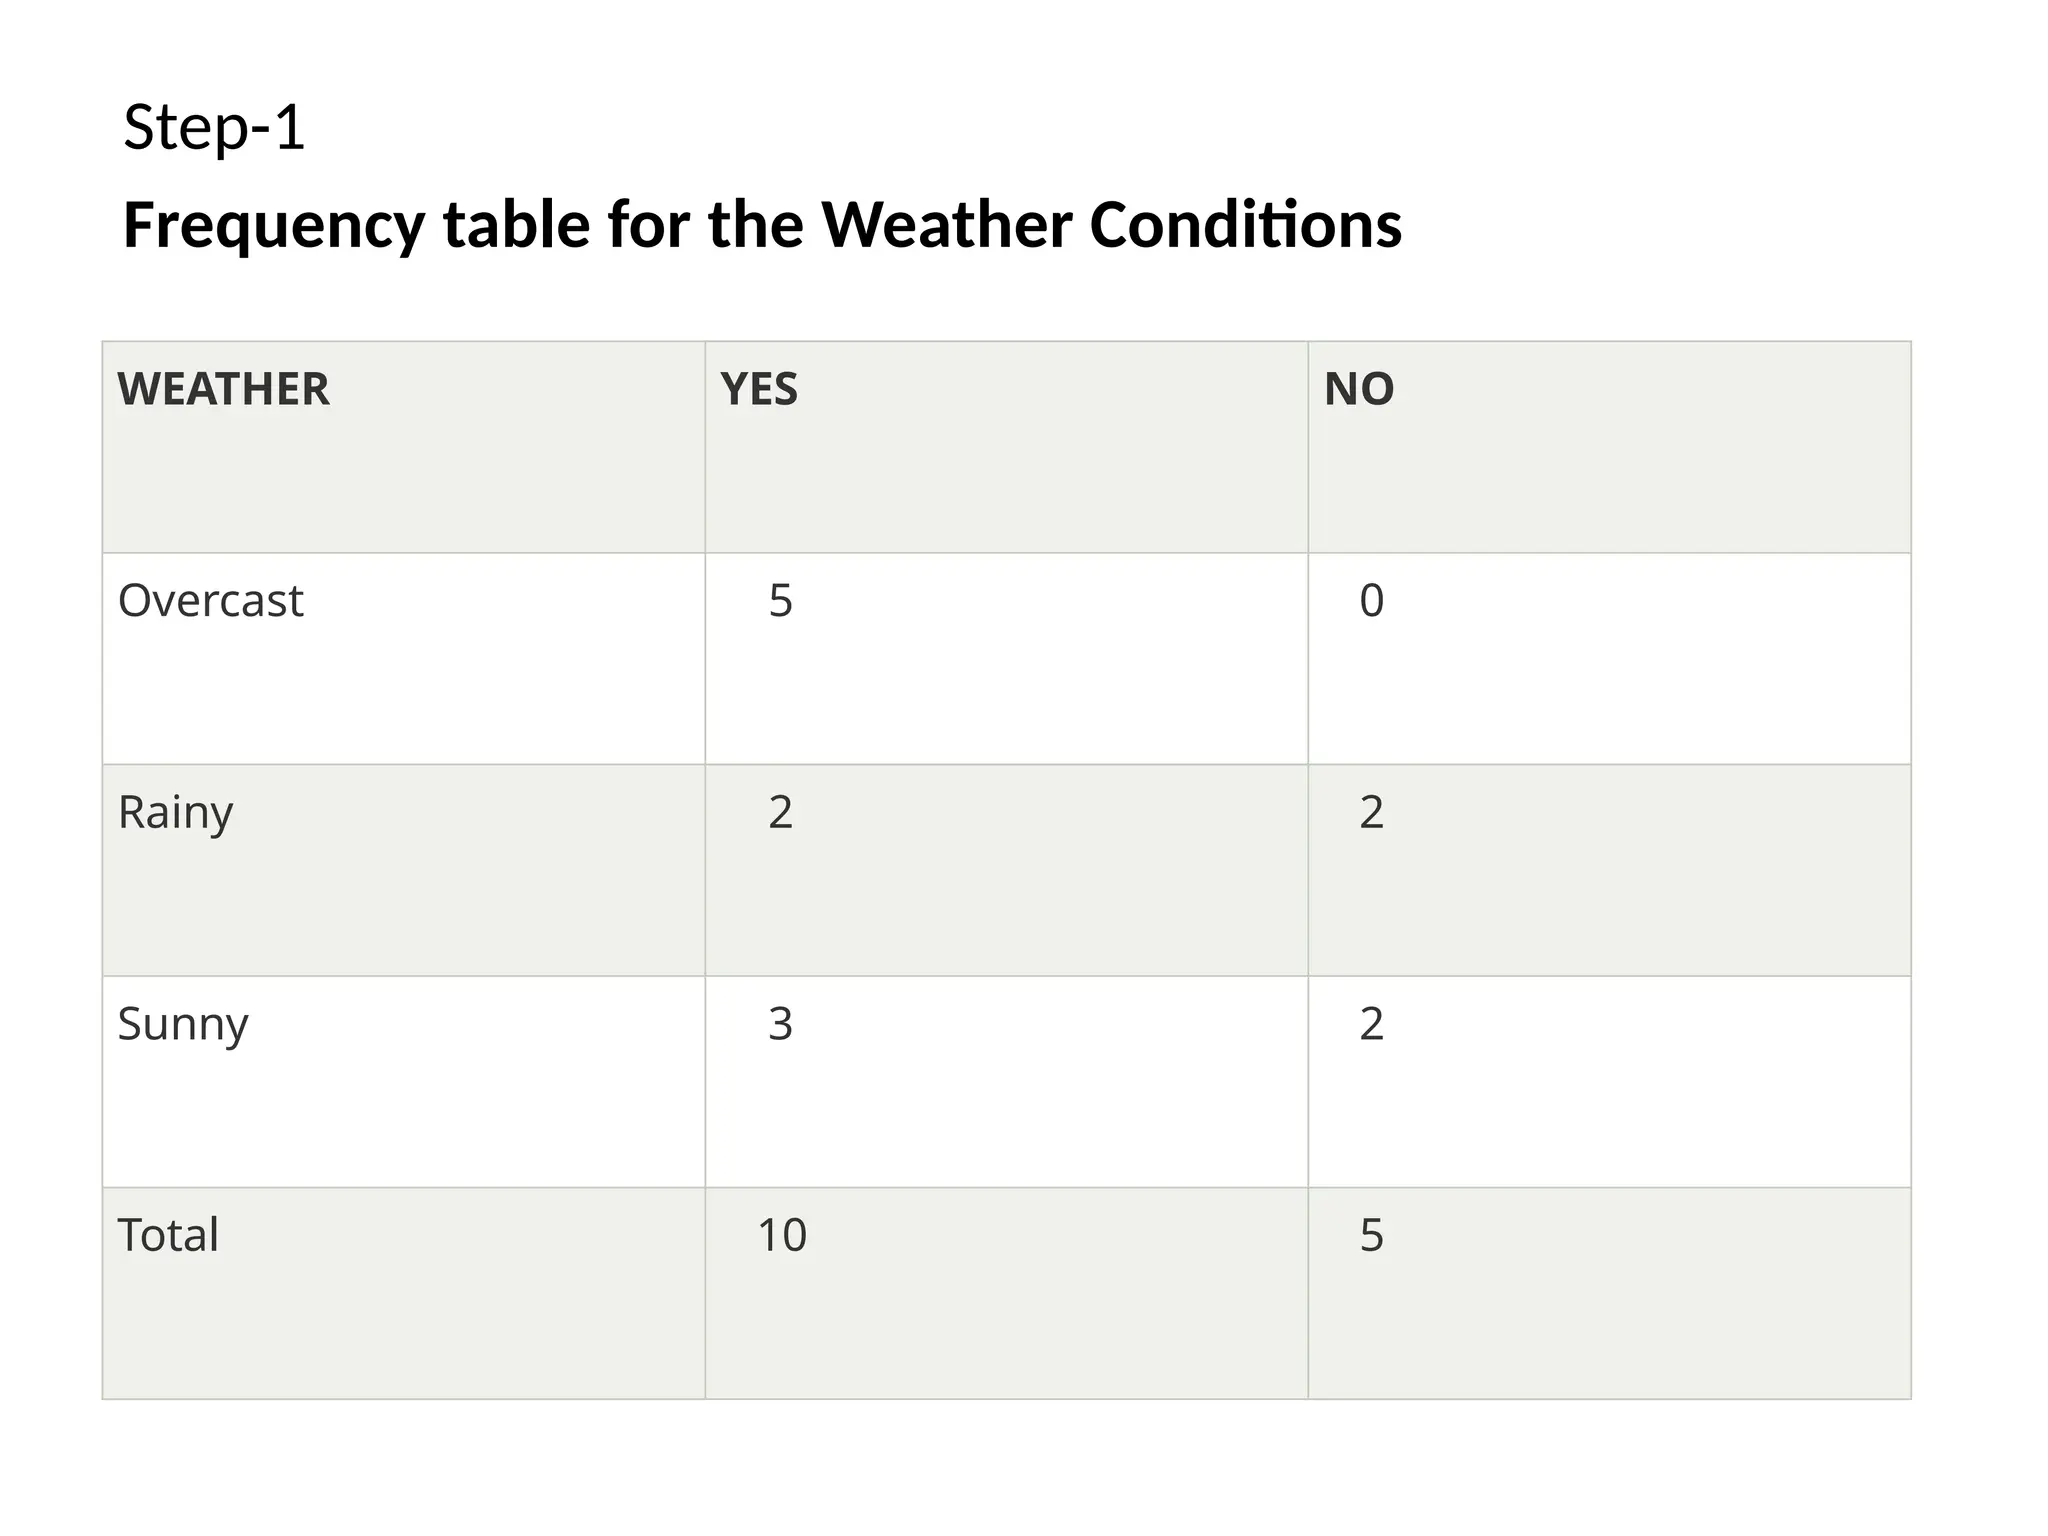
Step-1
Frequency table forthe Weather Conditions
WEATHER YES NO
Overcast 5 0
Rainy 2 2
Sunny 3 2
Total 10 5
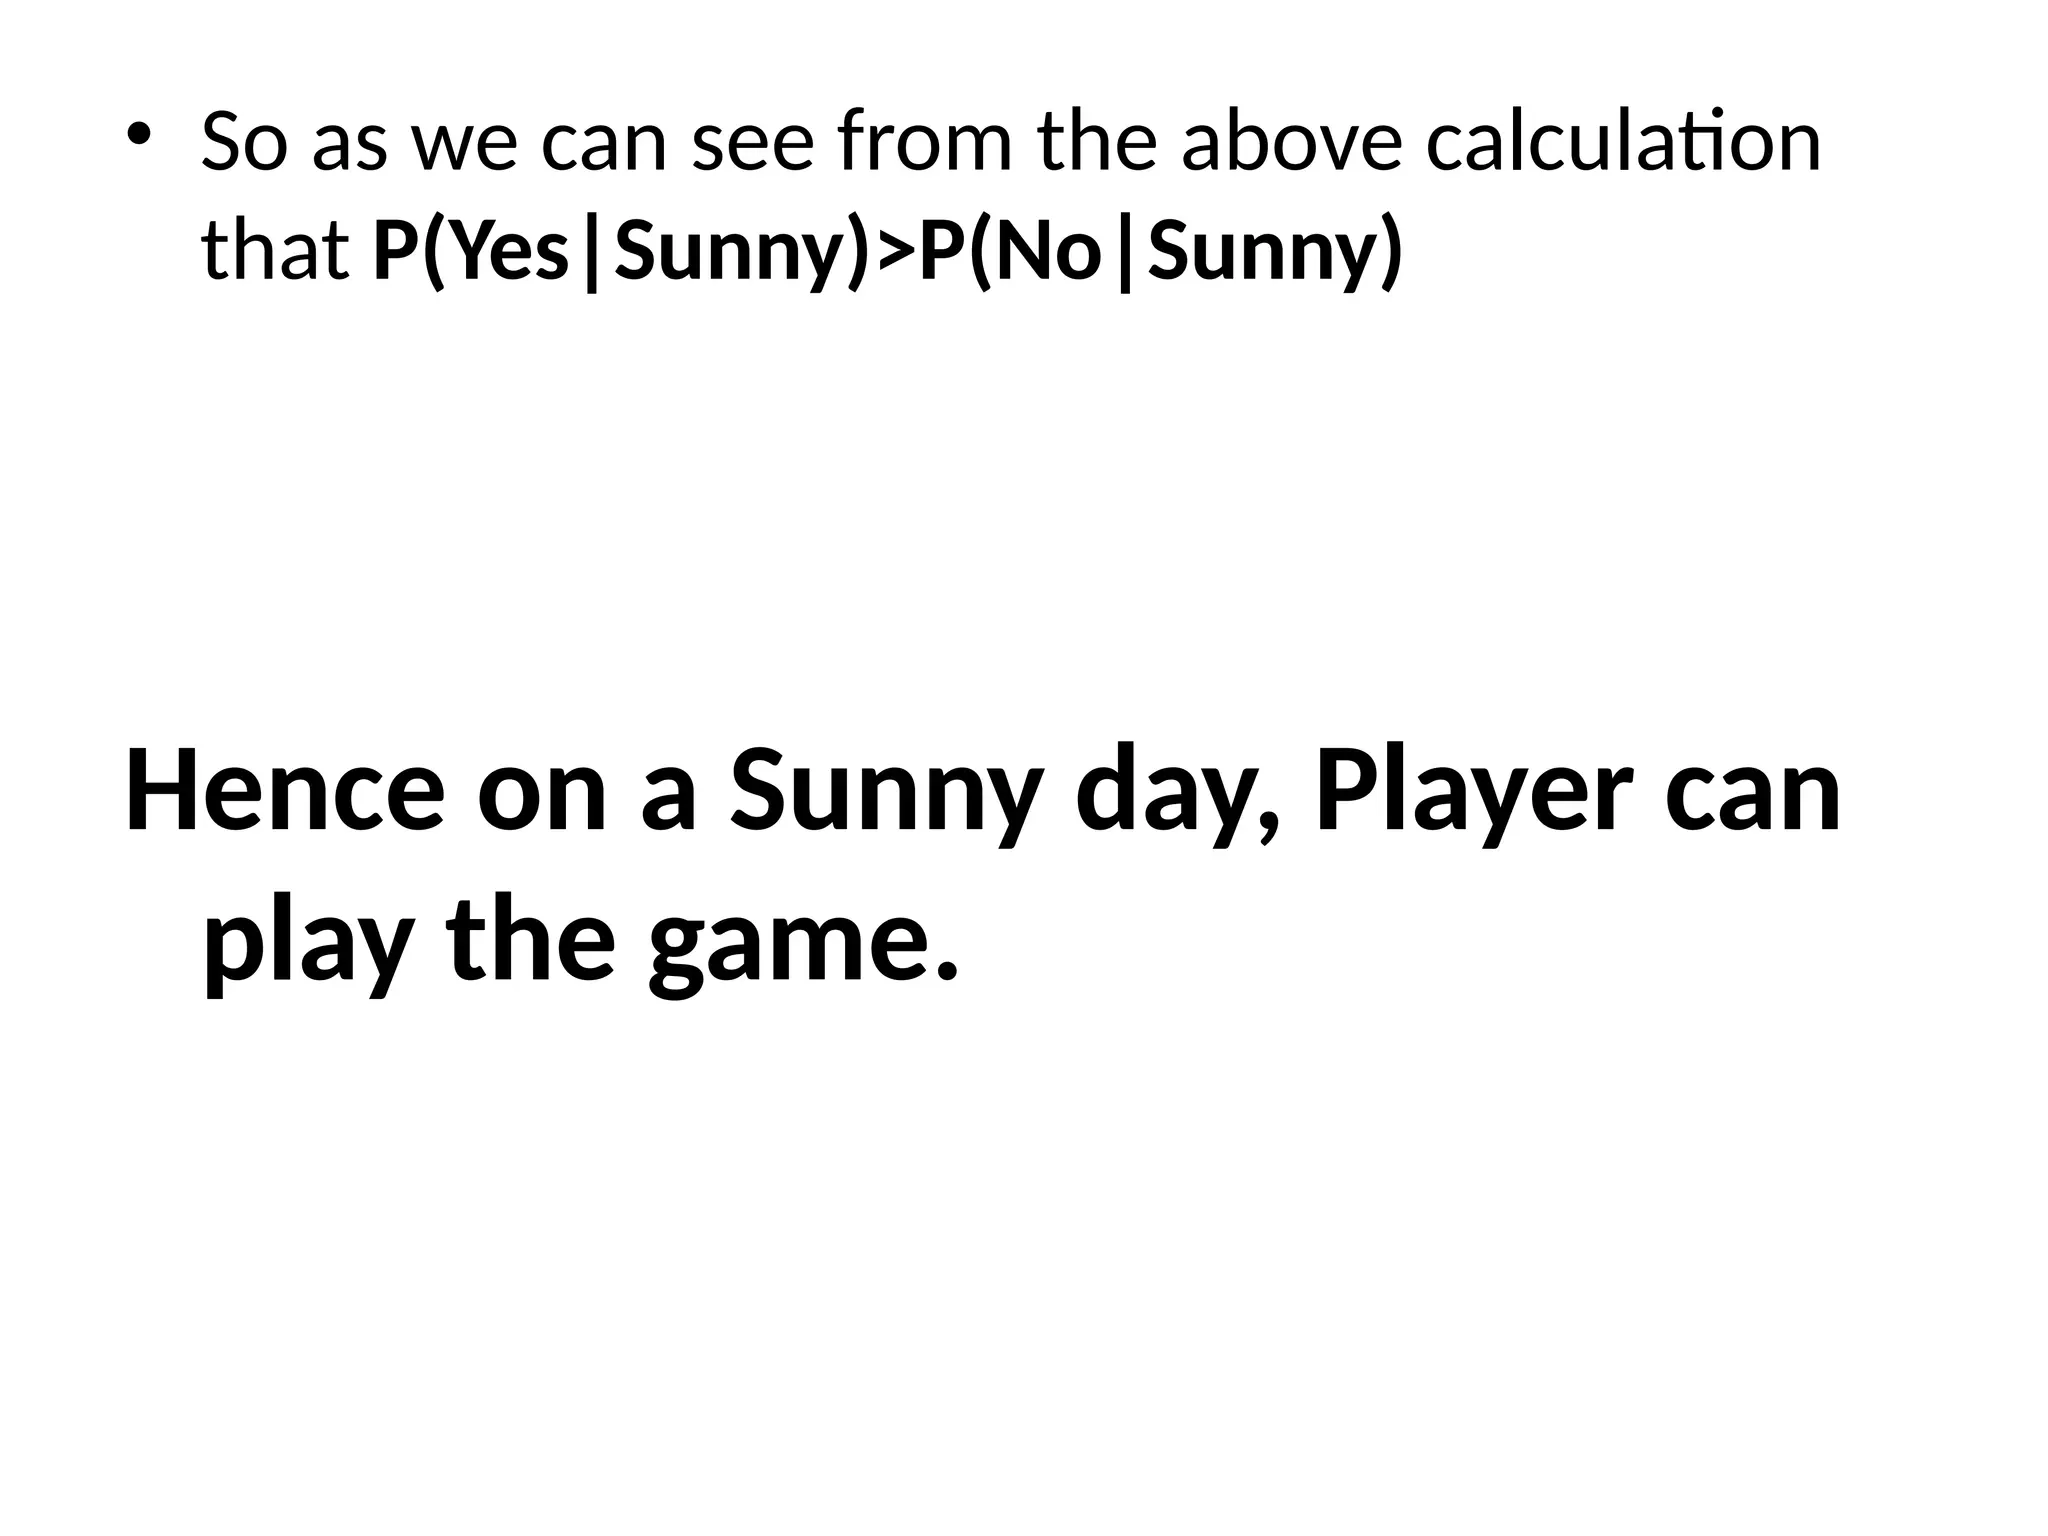
• So aswe can see from the above calculation
that P(Yes|Sunny)>P(No|Sunny)
Hence on a Sunny day, Player can
play the game.
28.
• DECISION TREE
•A decision tree is a structure that includes a
root node, branches, and leaf nodes.
• Each internal node denotes a test on an
attribute, each branch denotes the outcome
of a test.
• each leaf node holds a class label. The
topmost node in the tree is the root node.
29.
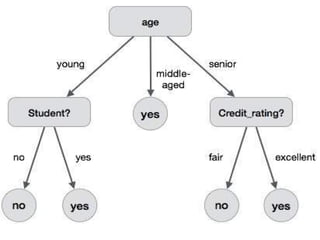
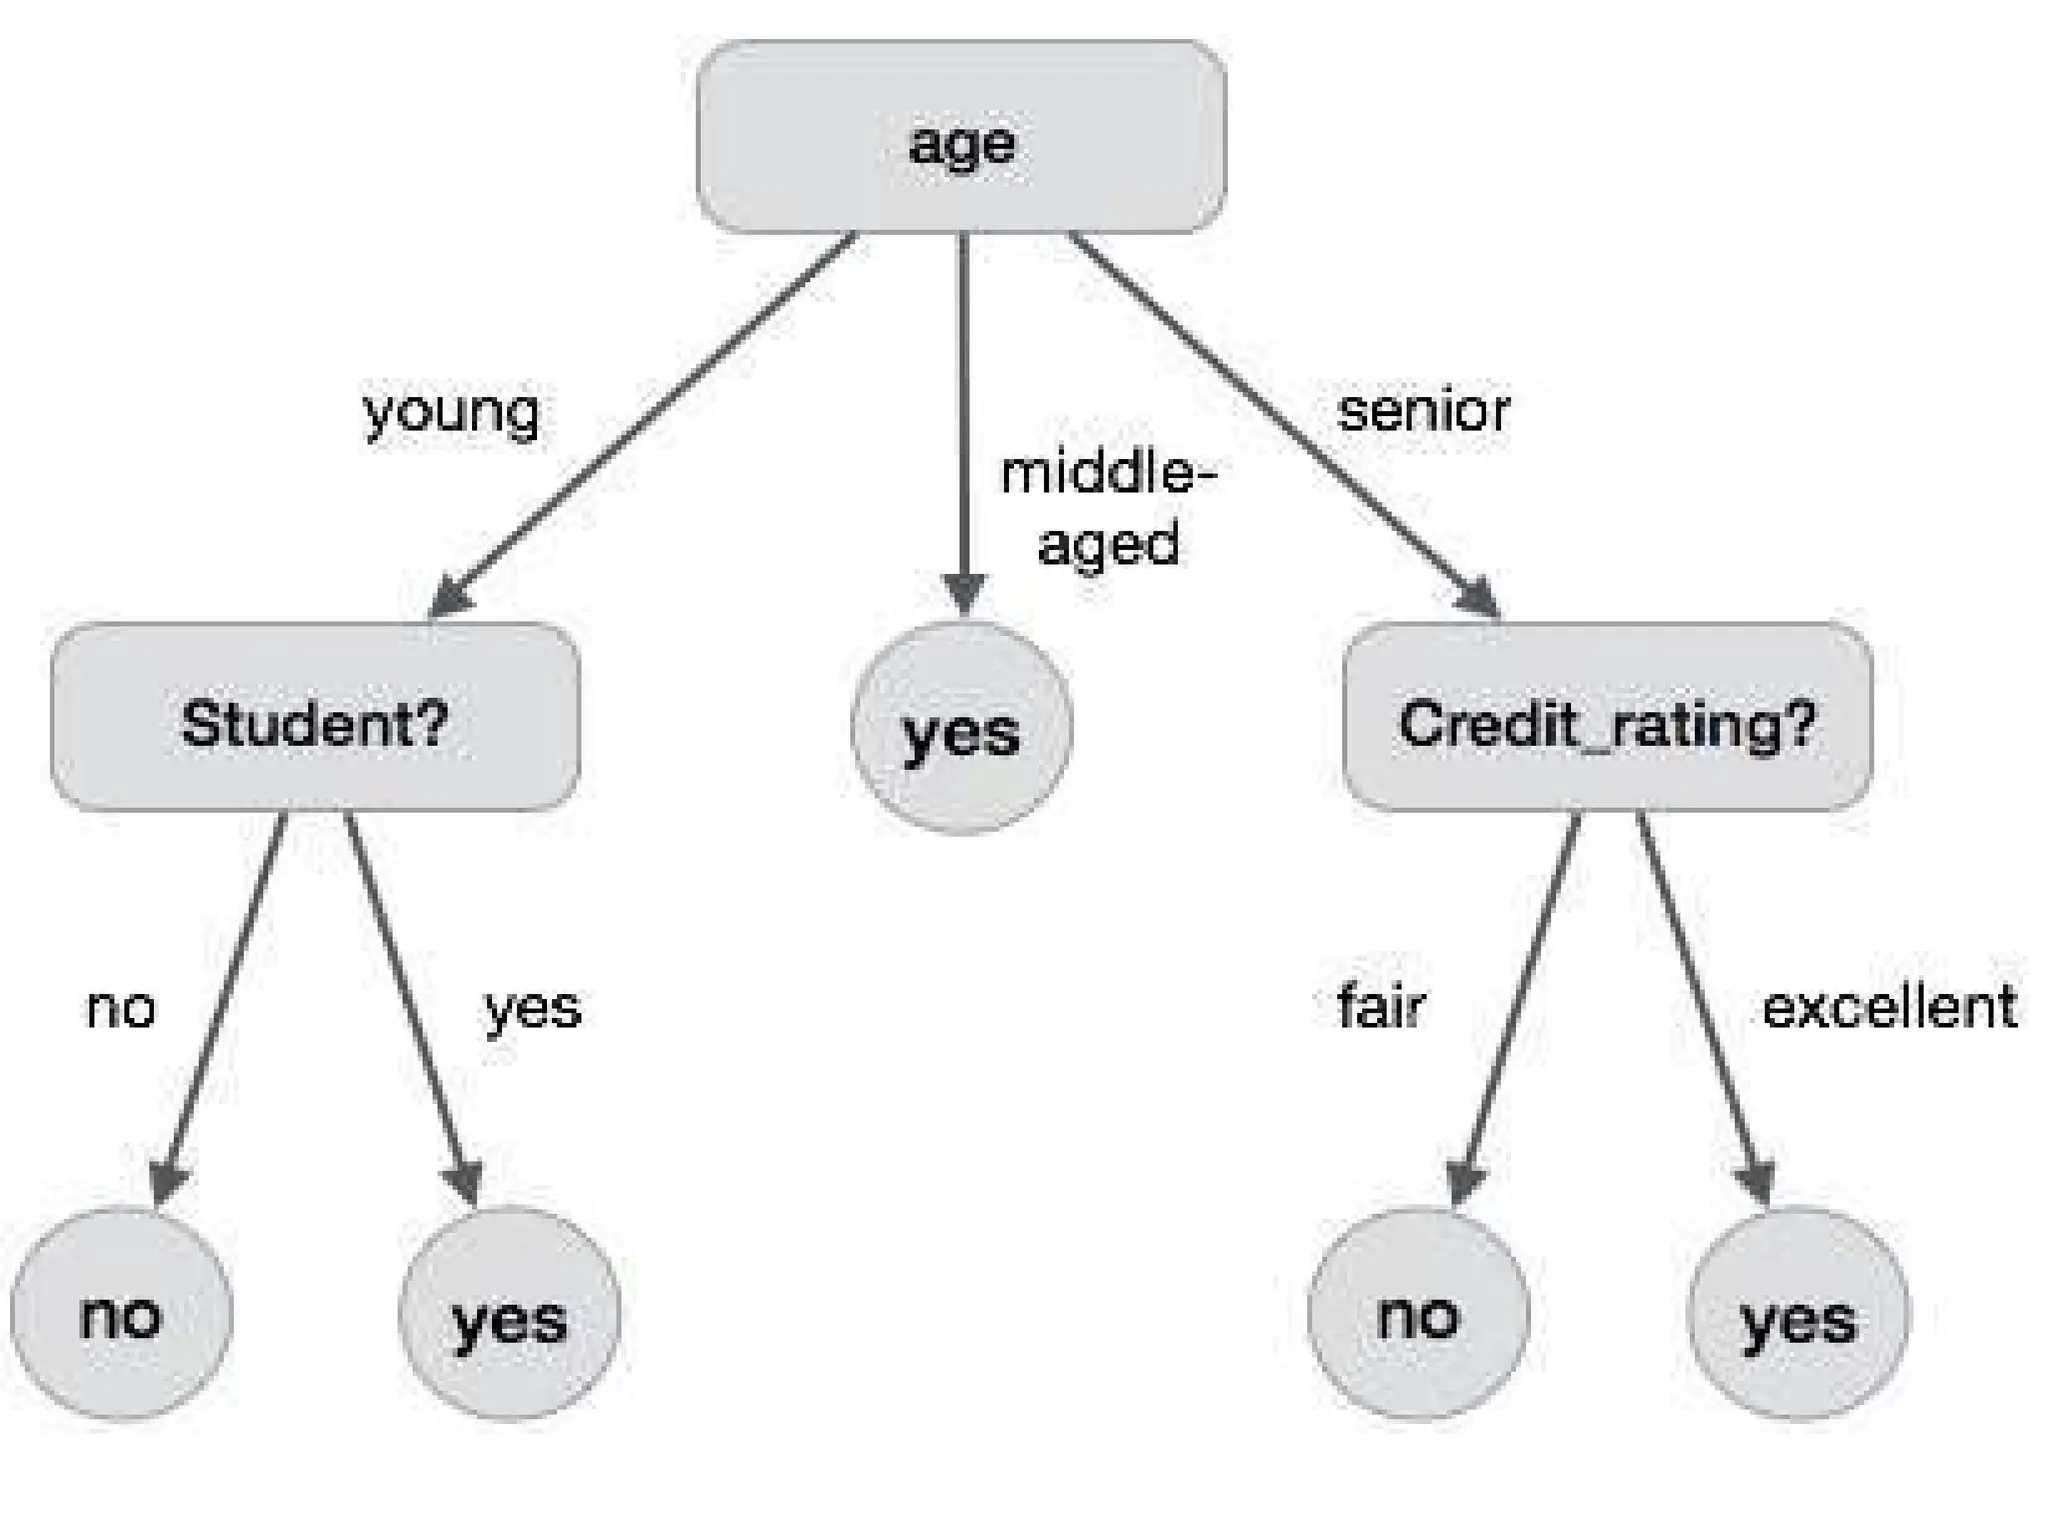
• The followingdecision tree is for the concept
buy_computer that indicates whether a customer at
a company is likely to buy a computer or not.
• Each internal node represents a test on an attribute.
Each leaf node represents a class.
31.
LINEAR MODELS:
LinearRegression.
Logistic Regression.
Generalized Linear Models.
Support Vector Machines.
32.
What is LinearRegression?
“Linear regression is a statistical method that
is used to predict a continuous dependent
variable(target variable) based on one or more
independent variables”.
33.
This technique assumesa linear relationship
between the dependent and independent
variables.
which implies that the dependent variable
changes proportionally with changes in the
independent variables.
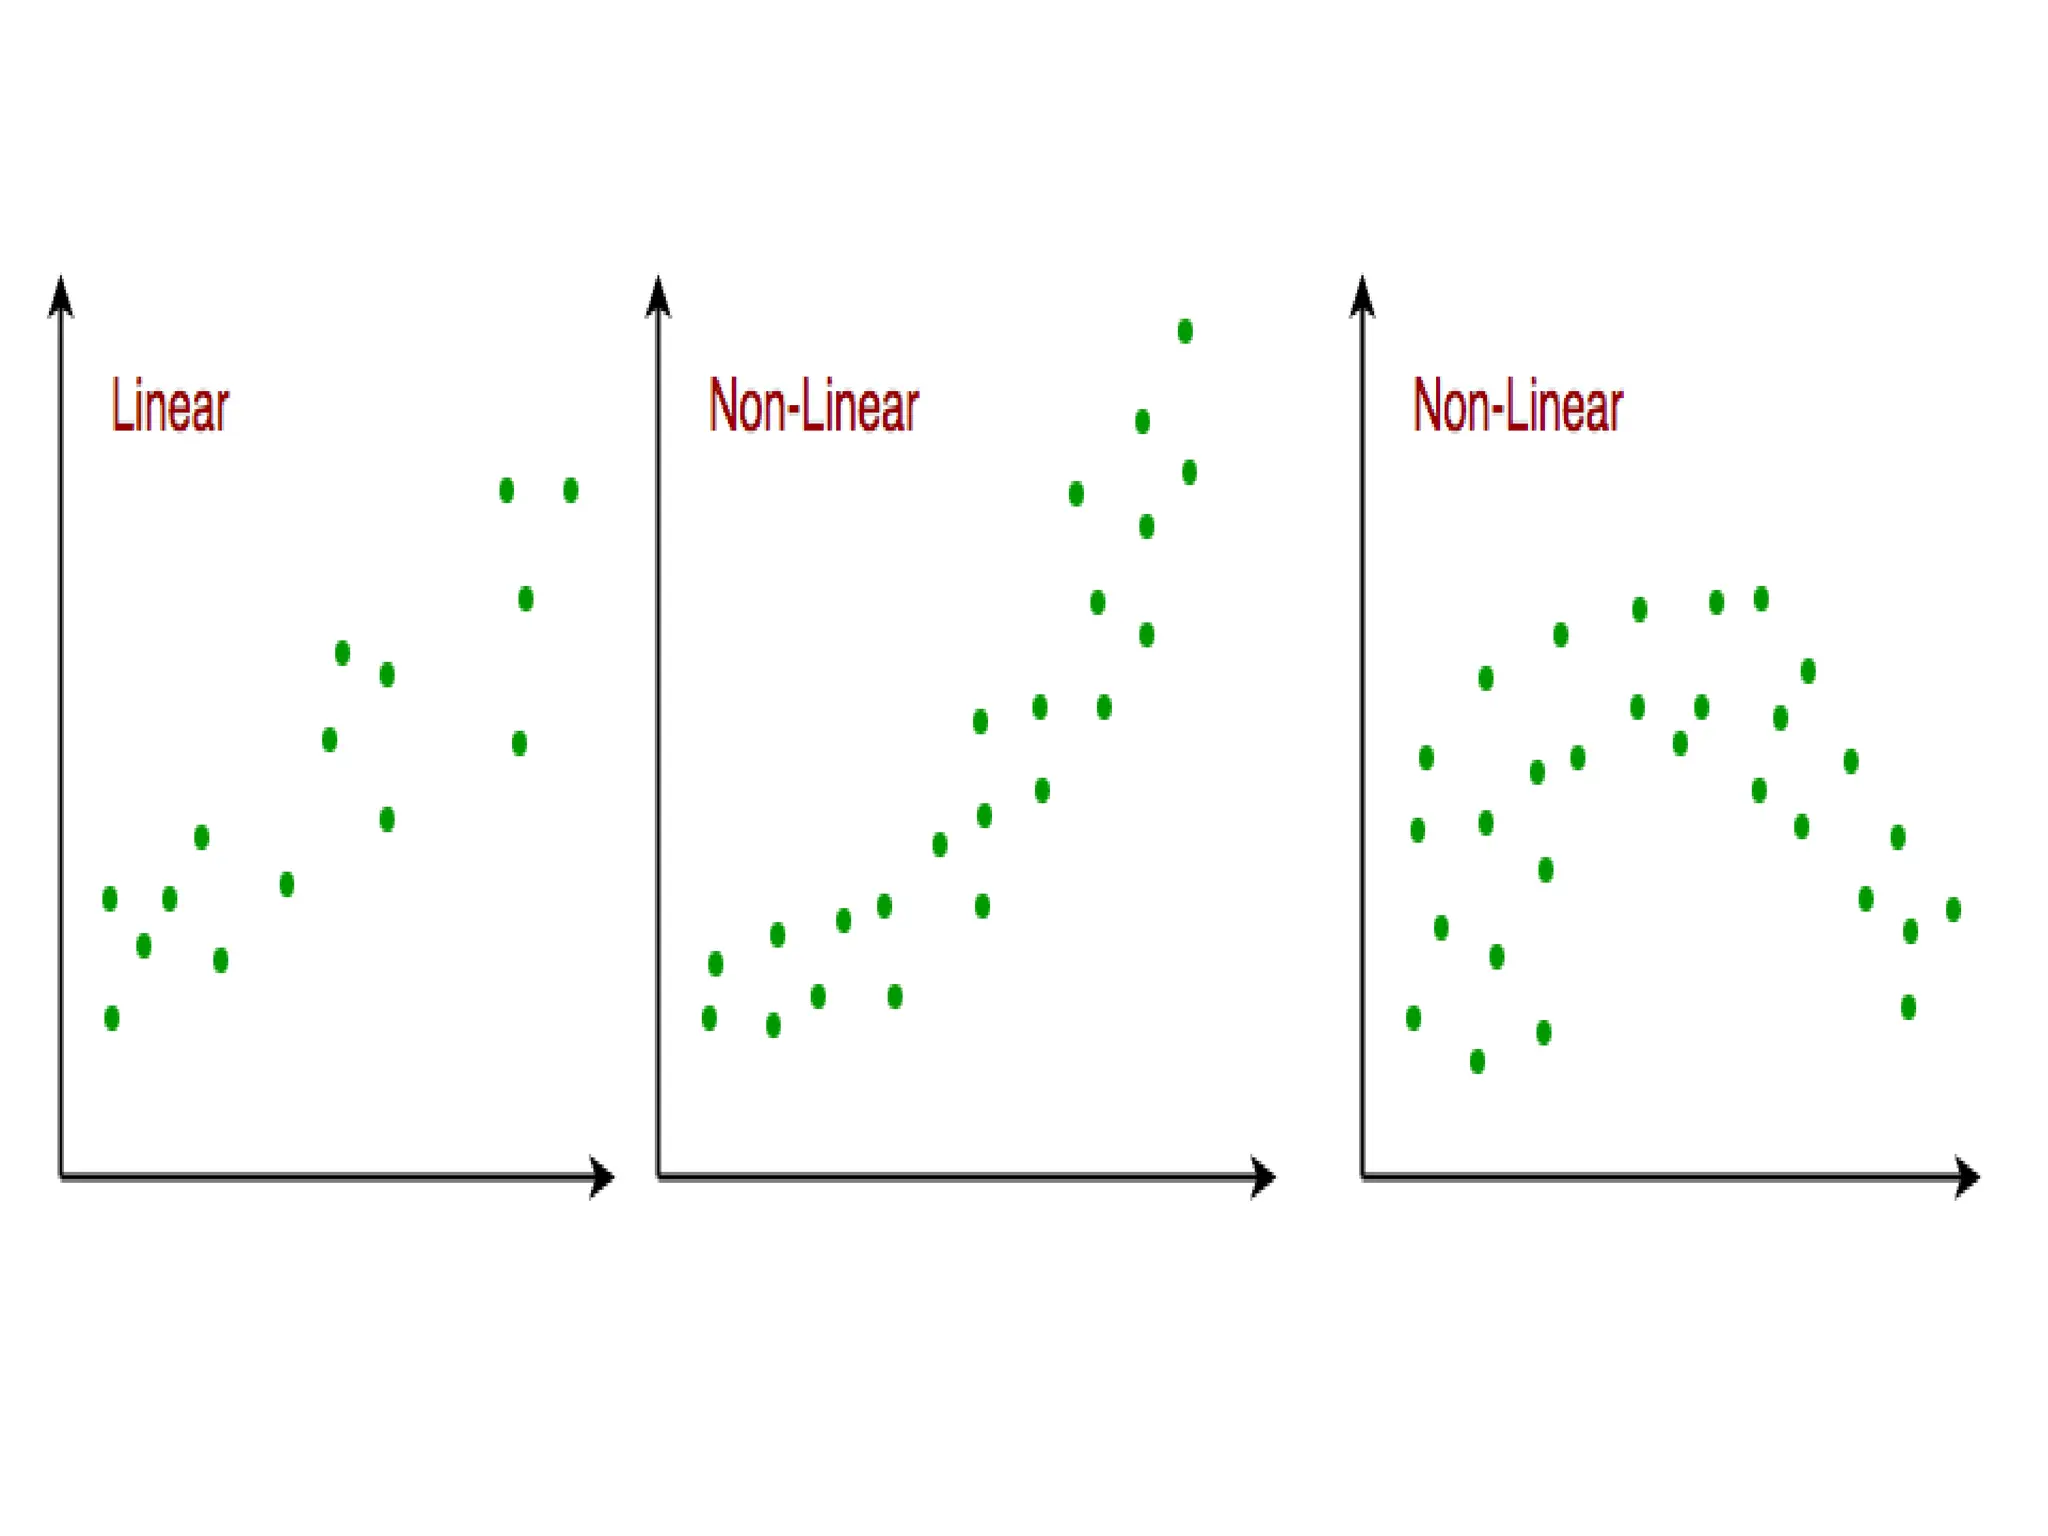
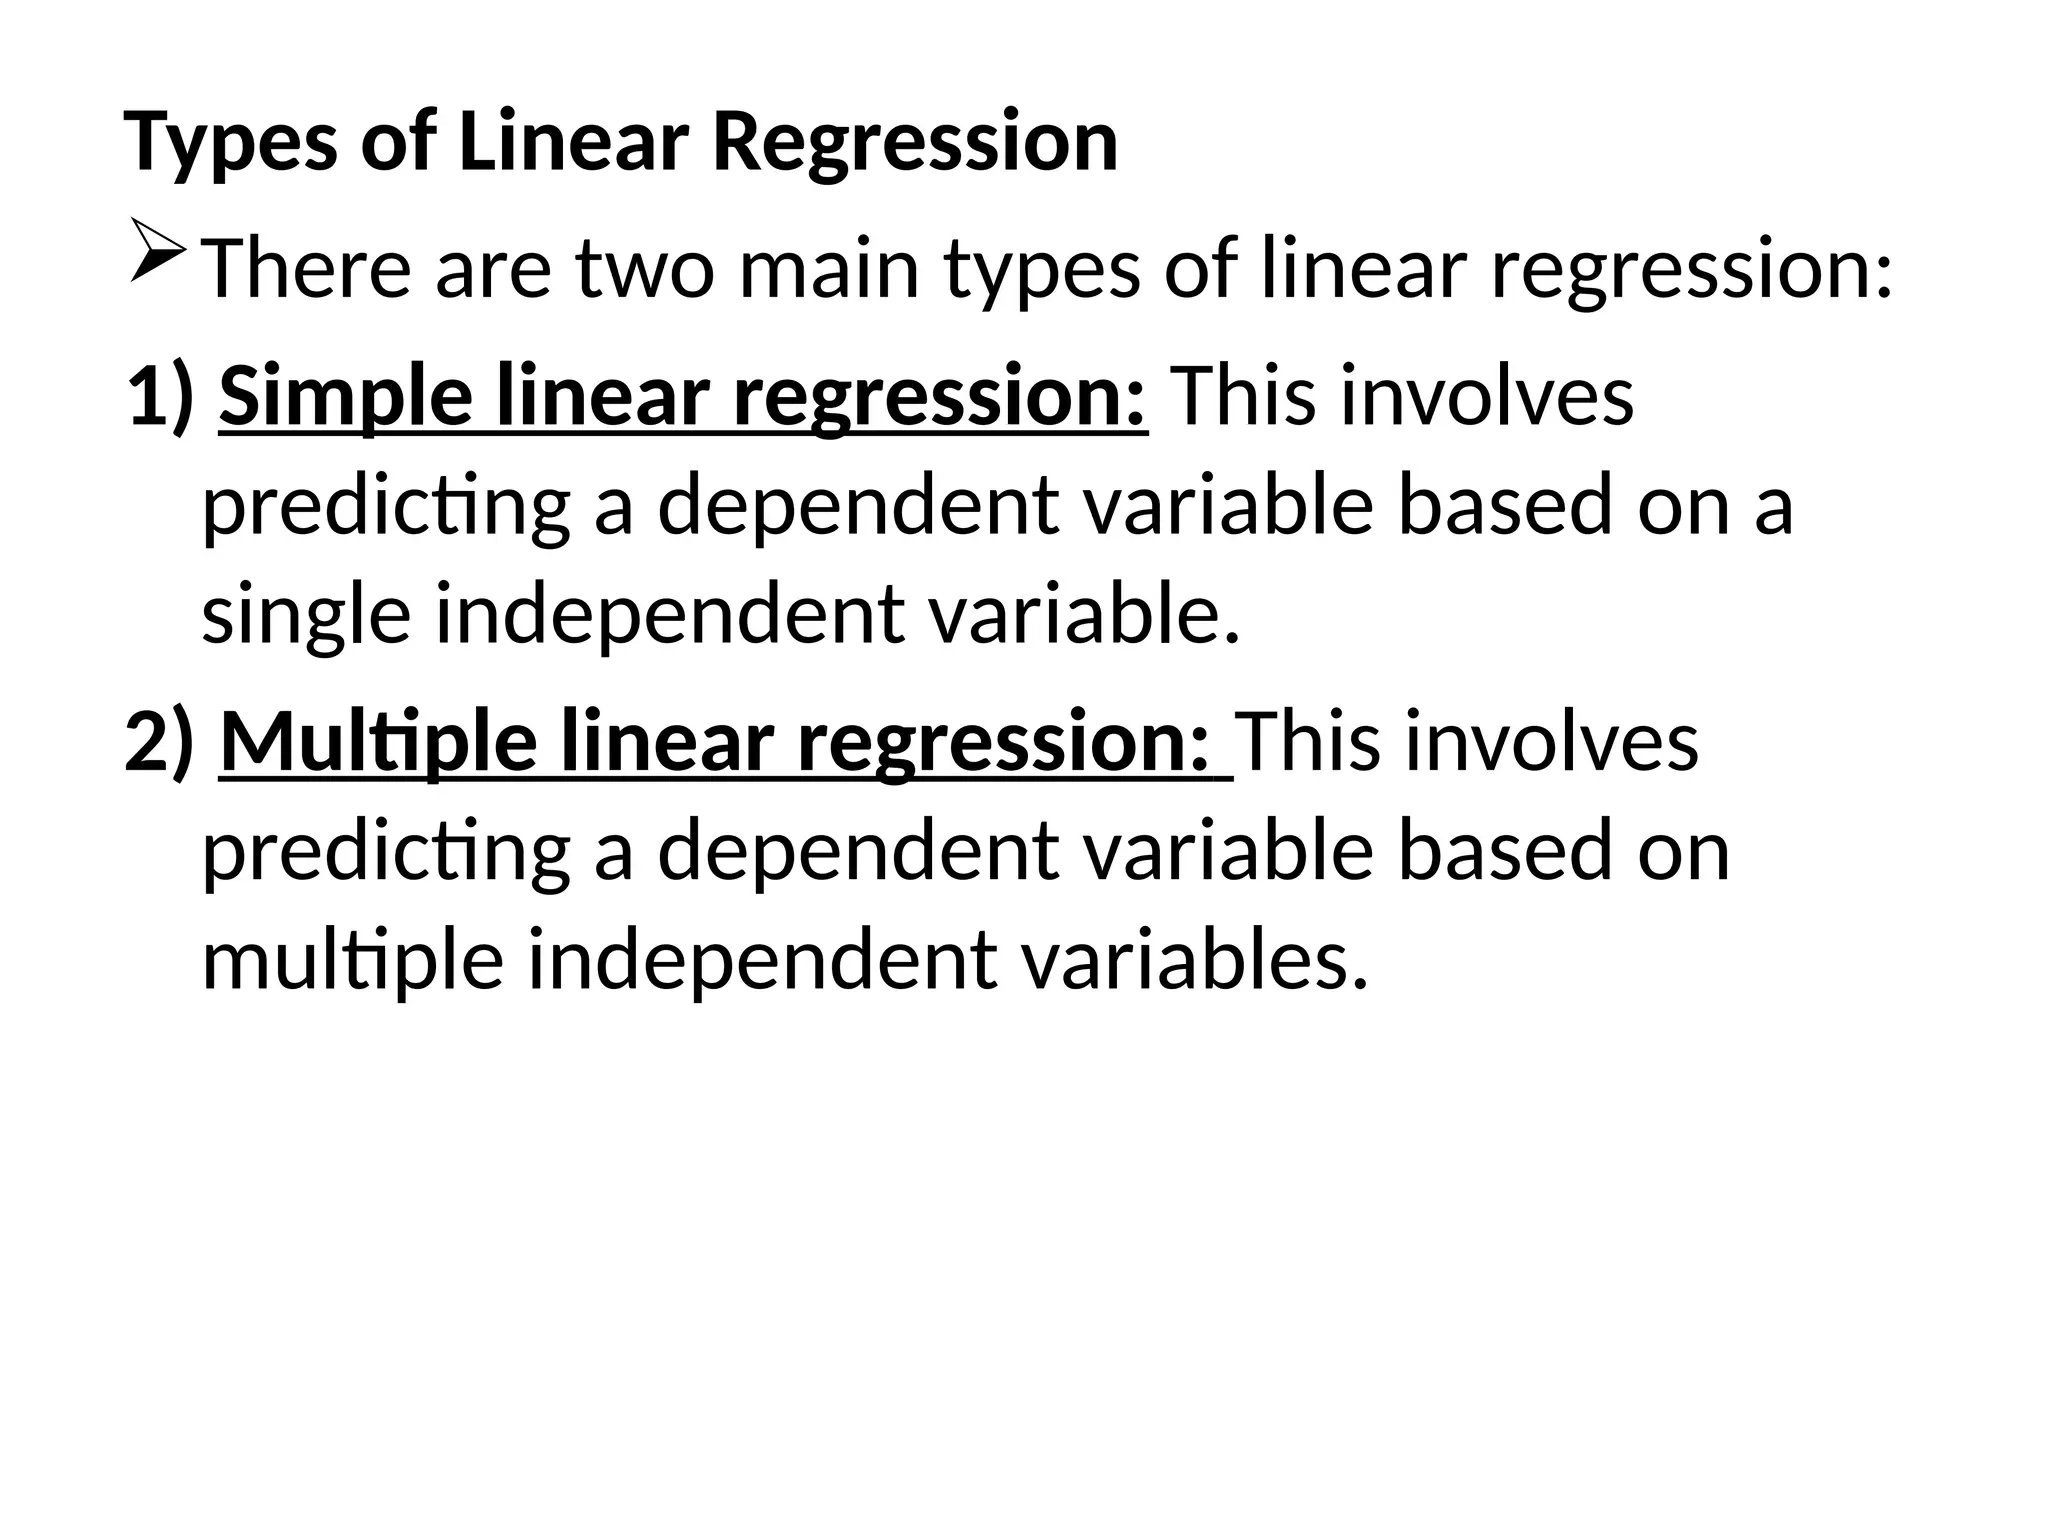
35.
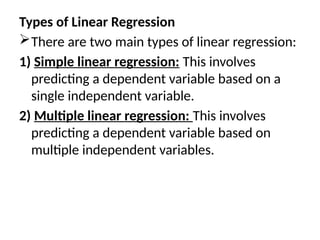
Types of LinearRegression
There are two main types of linear regression:
1) Simple linear regression: This involves
predicting a dependent variable based on a
single independent variable.
2) Multiple linear regression: This involves
predicting a dependent variable based on
multiple independent variables.
36.
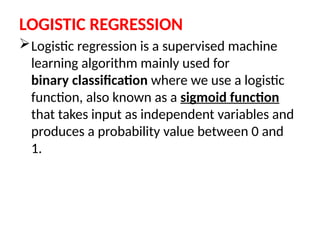
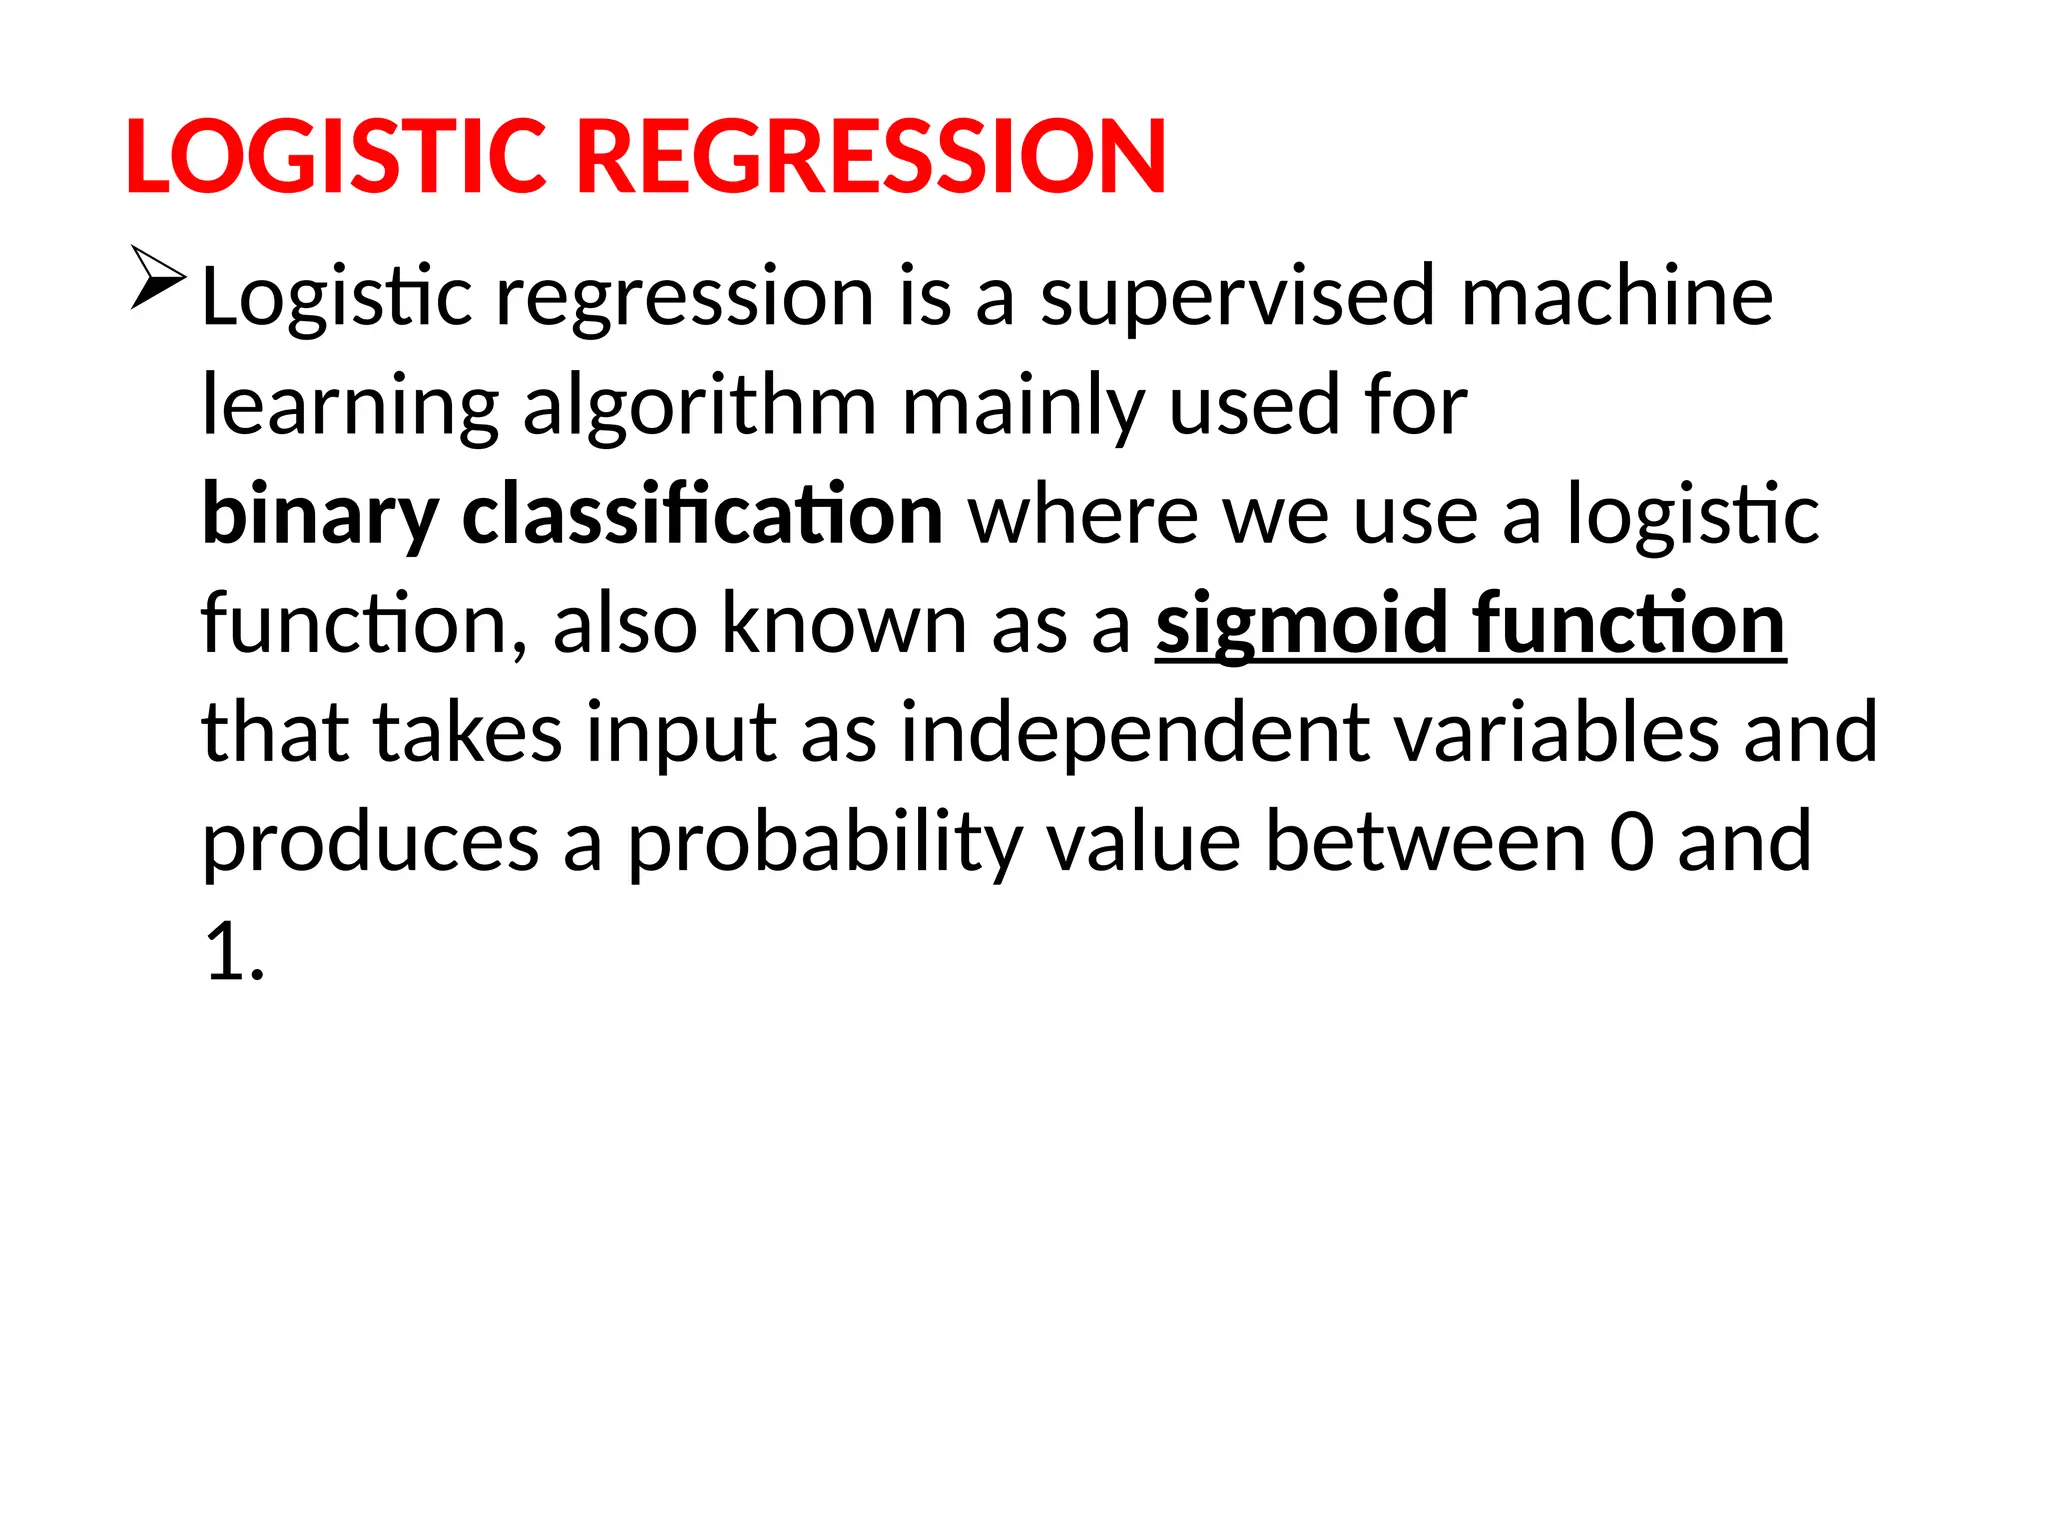
LOGISTIC REGRESSION
Logistic regressionis a supervised machine
learning algorithm mainly used for
binary classification where we use a logistic
function, also known as a sigmoid function
that takes input as independent variables and
produces a probability value between 0 and
1.
37.
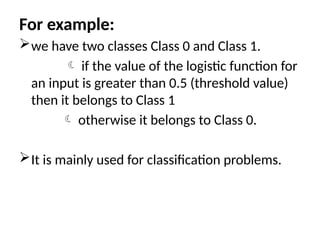
For example:
we havetwo classes Class 0 and Class 1.
if the value of the logistic function for
an input is greater than 0.5 (threshold value)
then it belongs to Class 1
otherwise it belongs to Class 0.
It is mainly used for classification problems.
38.
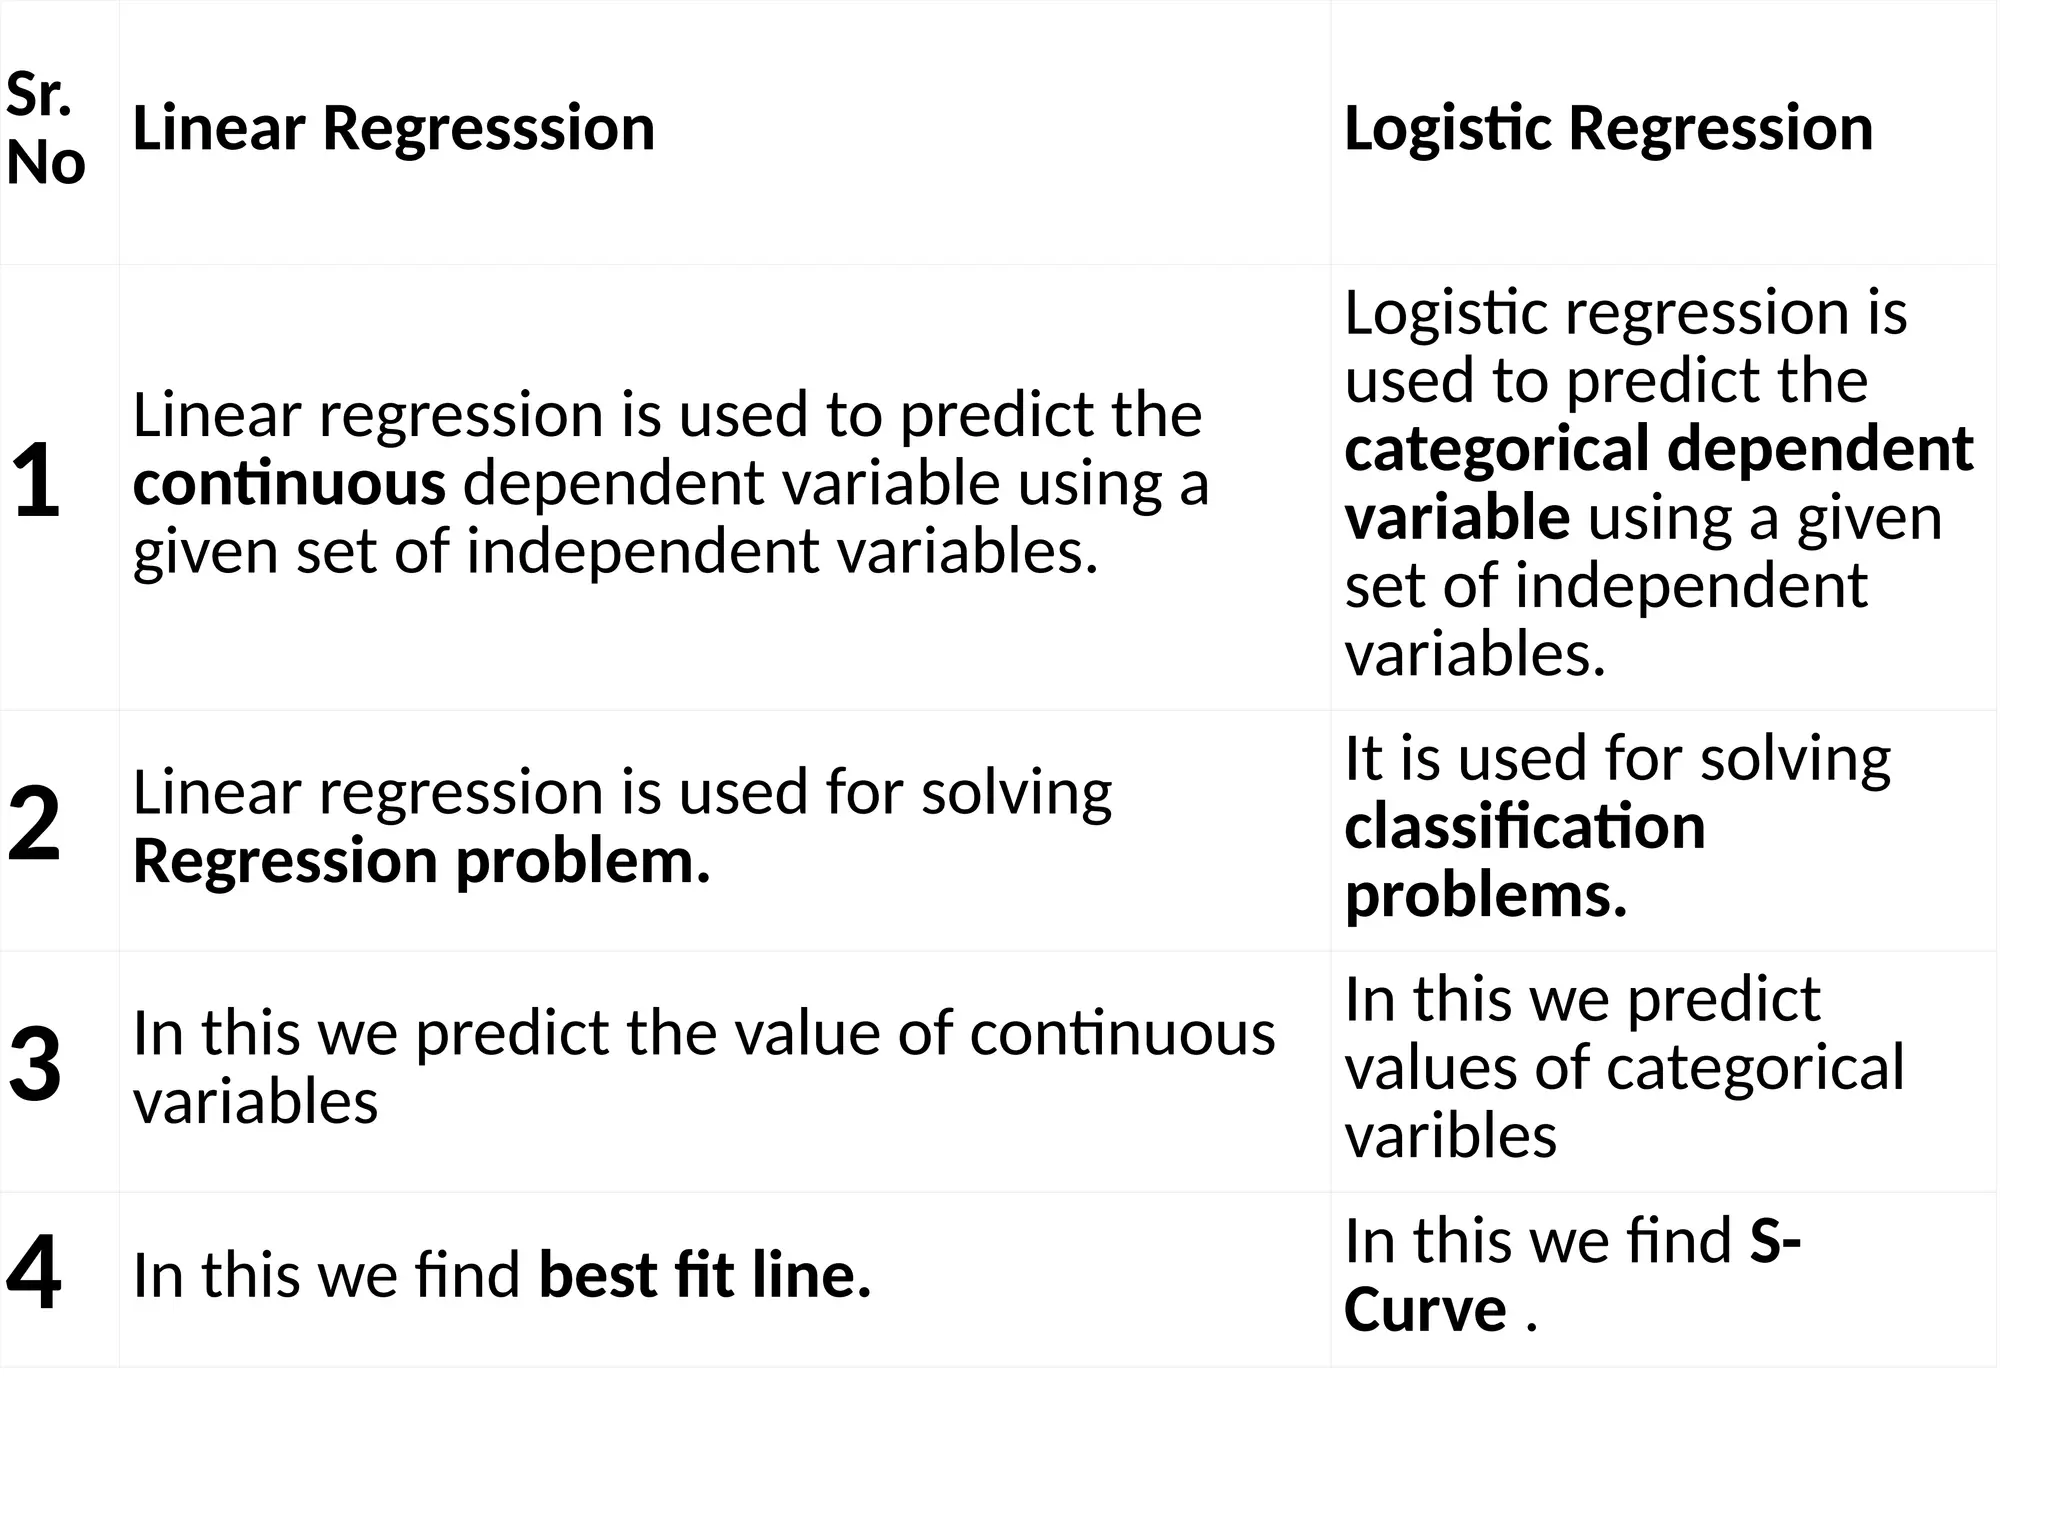
Sr.
No Linear RegresssionLogistic Regression
1
Linear regression is used to predict the
continuous dependent variable using a
given set of independent variables.
Logistic regression is
used to predict the
categorical dependent
variable using a given
set of independent
variables.
2 Linear regression is used for solving
Regression problem.
It is used for solving
classification
problems.
3 In this we predict the value of continuous
variables
In this we predict
values of categorical
varibles
4 In this we find best fit line.
In this we find S-
Curve .
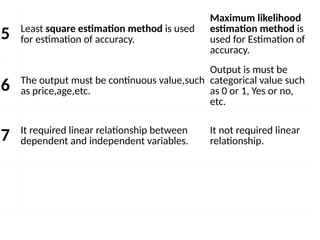
39.
5 Least squareestimation method is used
for estimation of accuracy.
Maximum likelihood
estimation method is
used for Estimation of
accuracy.
6 The output must be continuous value,such
as price,age,etc.
Output is must be
categorical value such
as 0 or 1, Yes or no,
etc.
7 It required linear relationship between
dependent and independent variables.
It not required linear
relationship.
40.
GENERALIZED LINEAR MODELS
GeneralizedLinear Models (GLMs) are a class
of regression models that can be used to
model a wide range of relationships between
a response variable and one or more predictor
variables.
41.
SUPPORT VECTOR MACHINE
ALGORITHM:
“SupportVector Machine or SVM is
one of the most popular Supervised
Learning algorithms, which is used
for Classification as well as
Regression problems”.
42.
THE GOAL ofthe SVM algorithm is to
create the best line or decision boundary that
can segregate n-dimensional space into
classes so that we can easily put the new data
point in the correct category in the future.
This best decision boundary is called a hyper
plane.
43.
SVM chooses theextreme points/vectors that
help in creating the hyper plane.
These extreme cases are called as support
vectors, and hence algorithm is termed as
Support Vector Machine.
44.
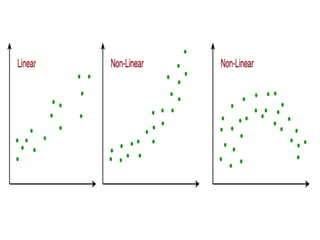
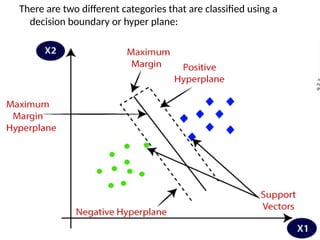
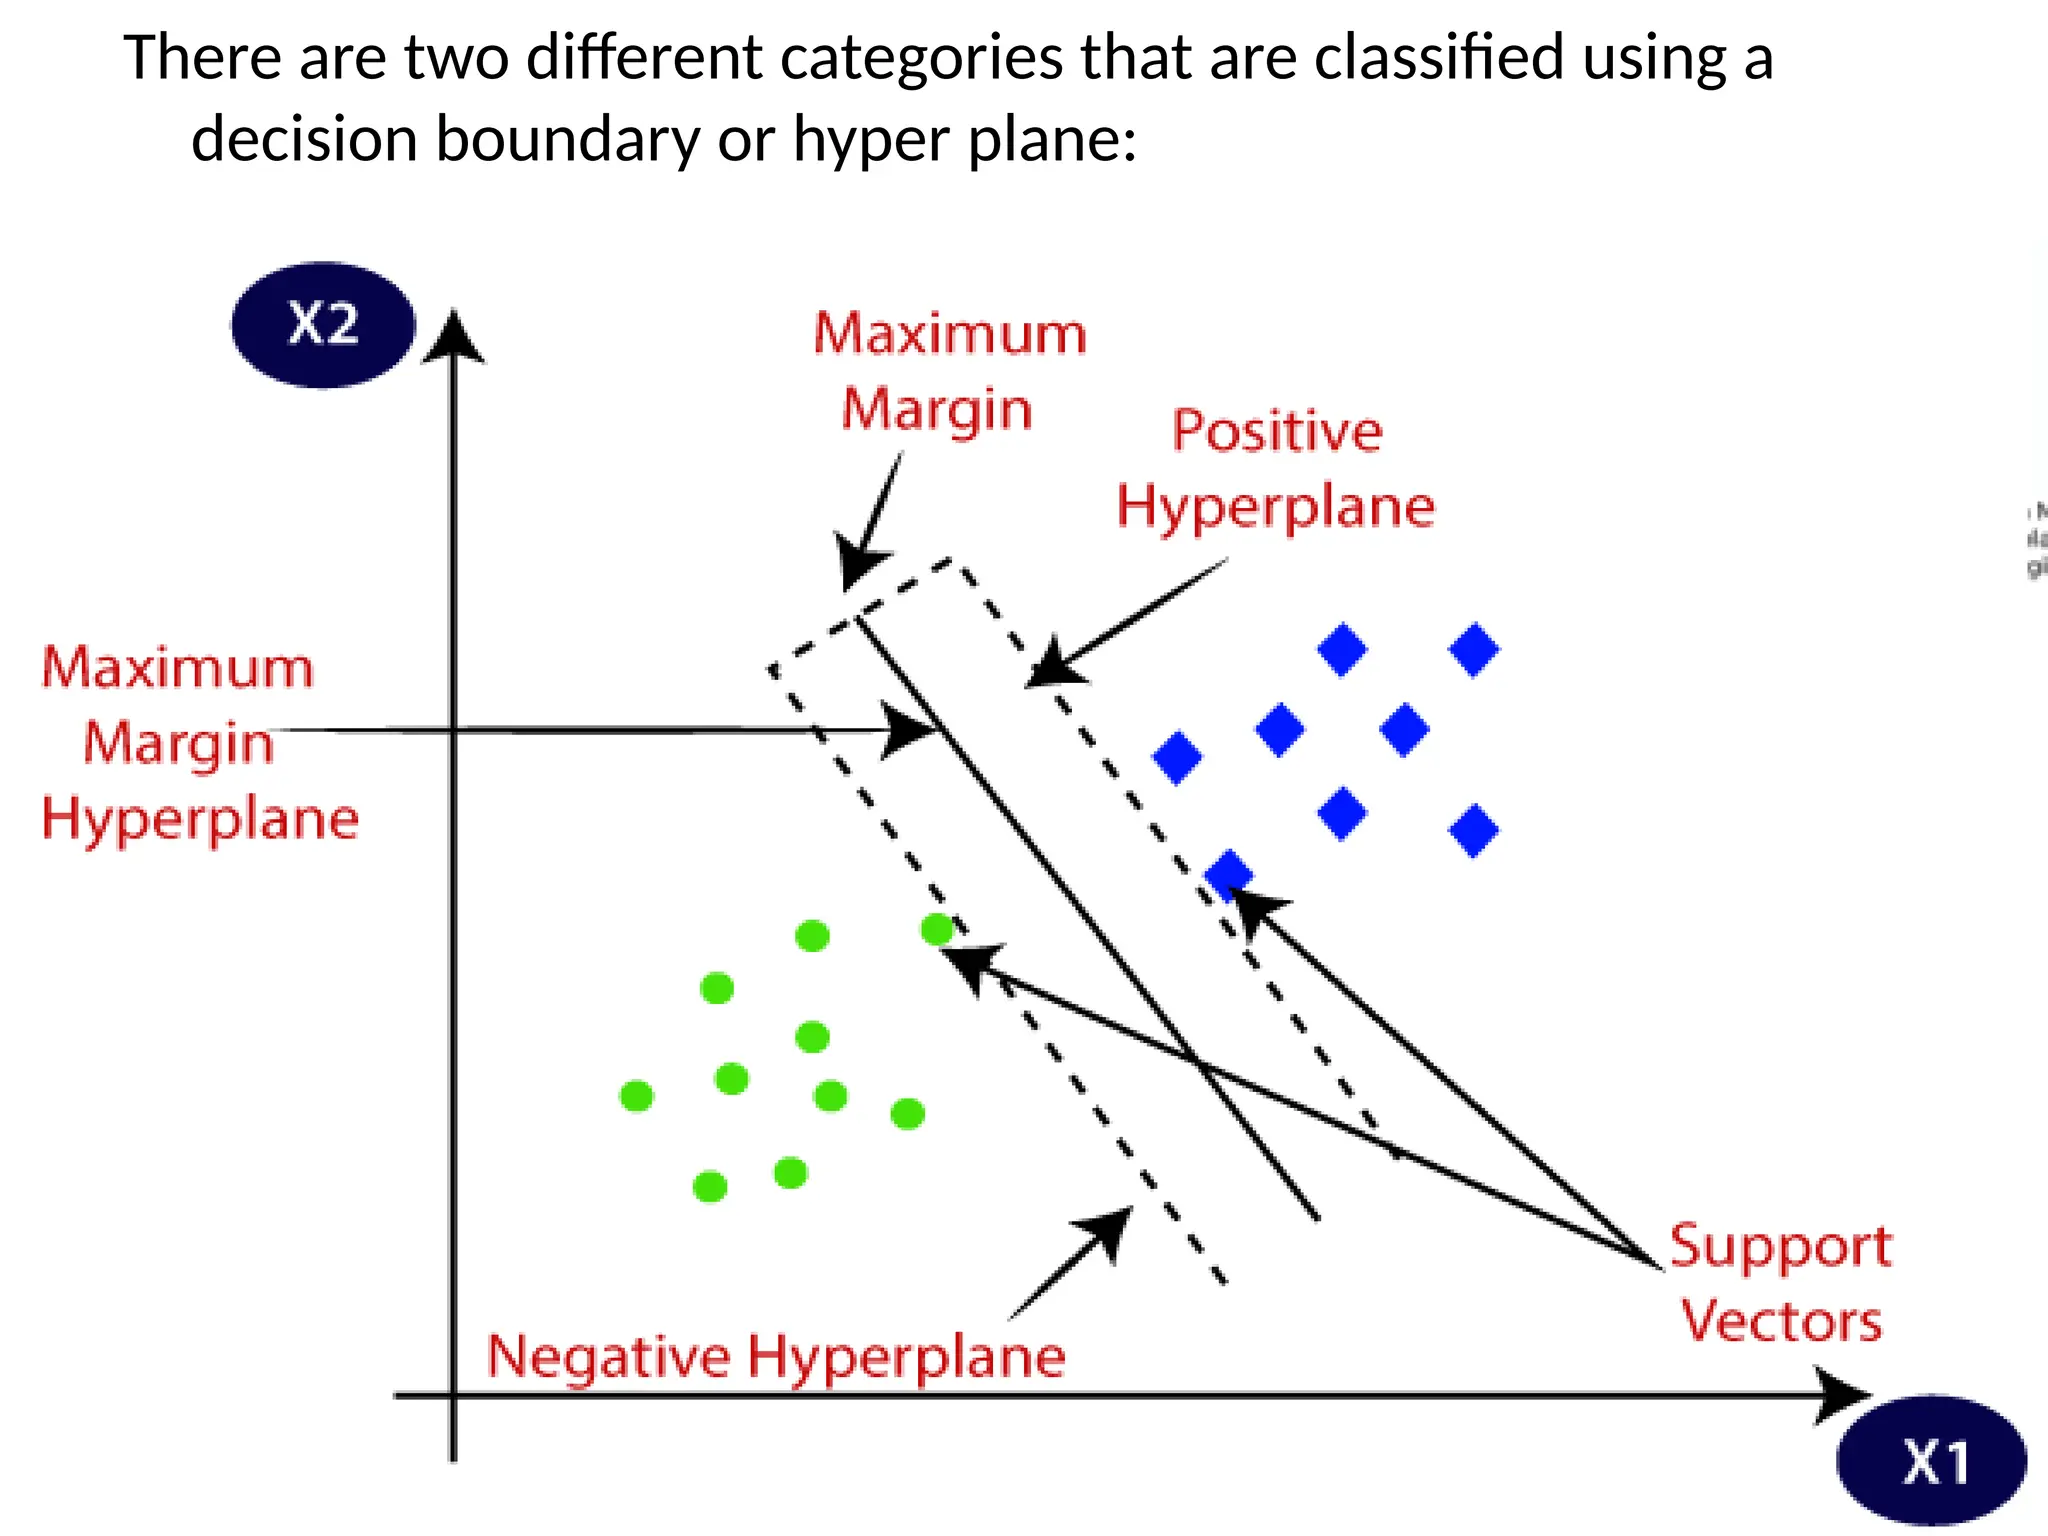
There are twodifferent categories that are classified using a
decision boundary or hyper plane:
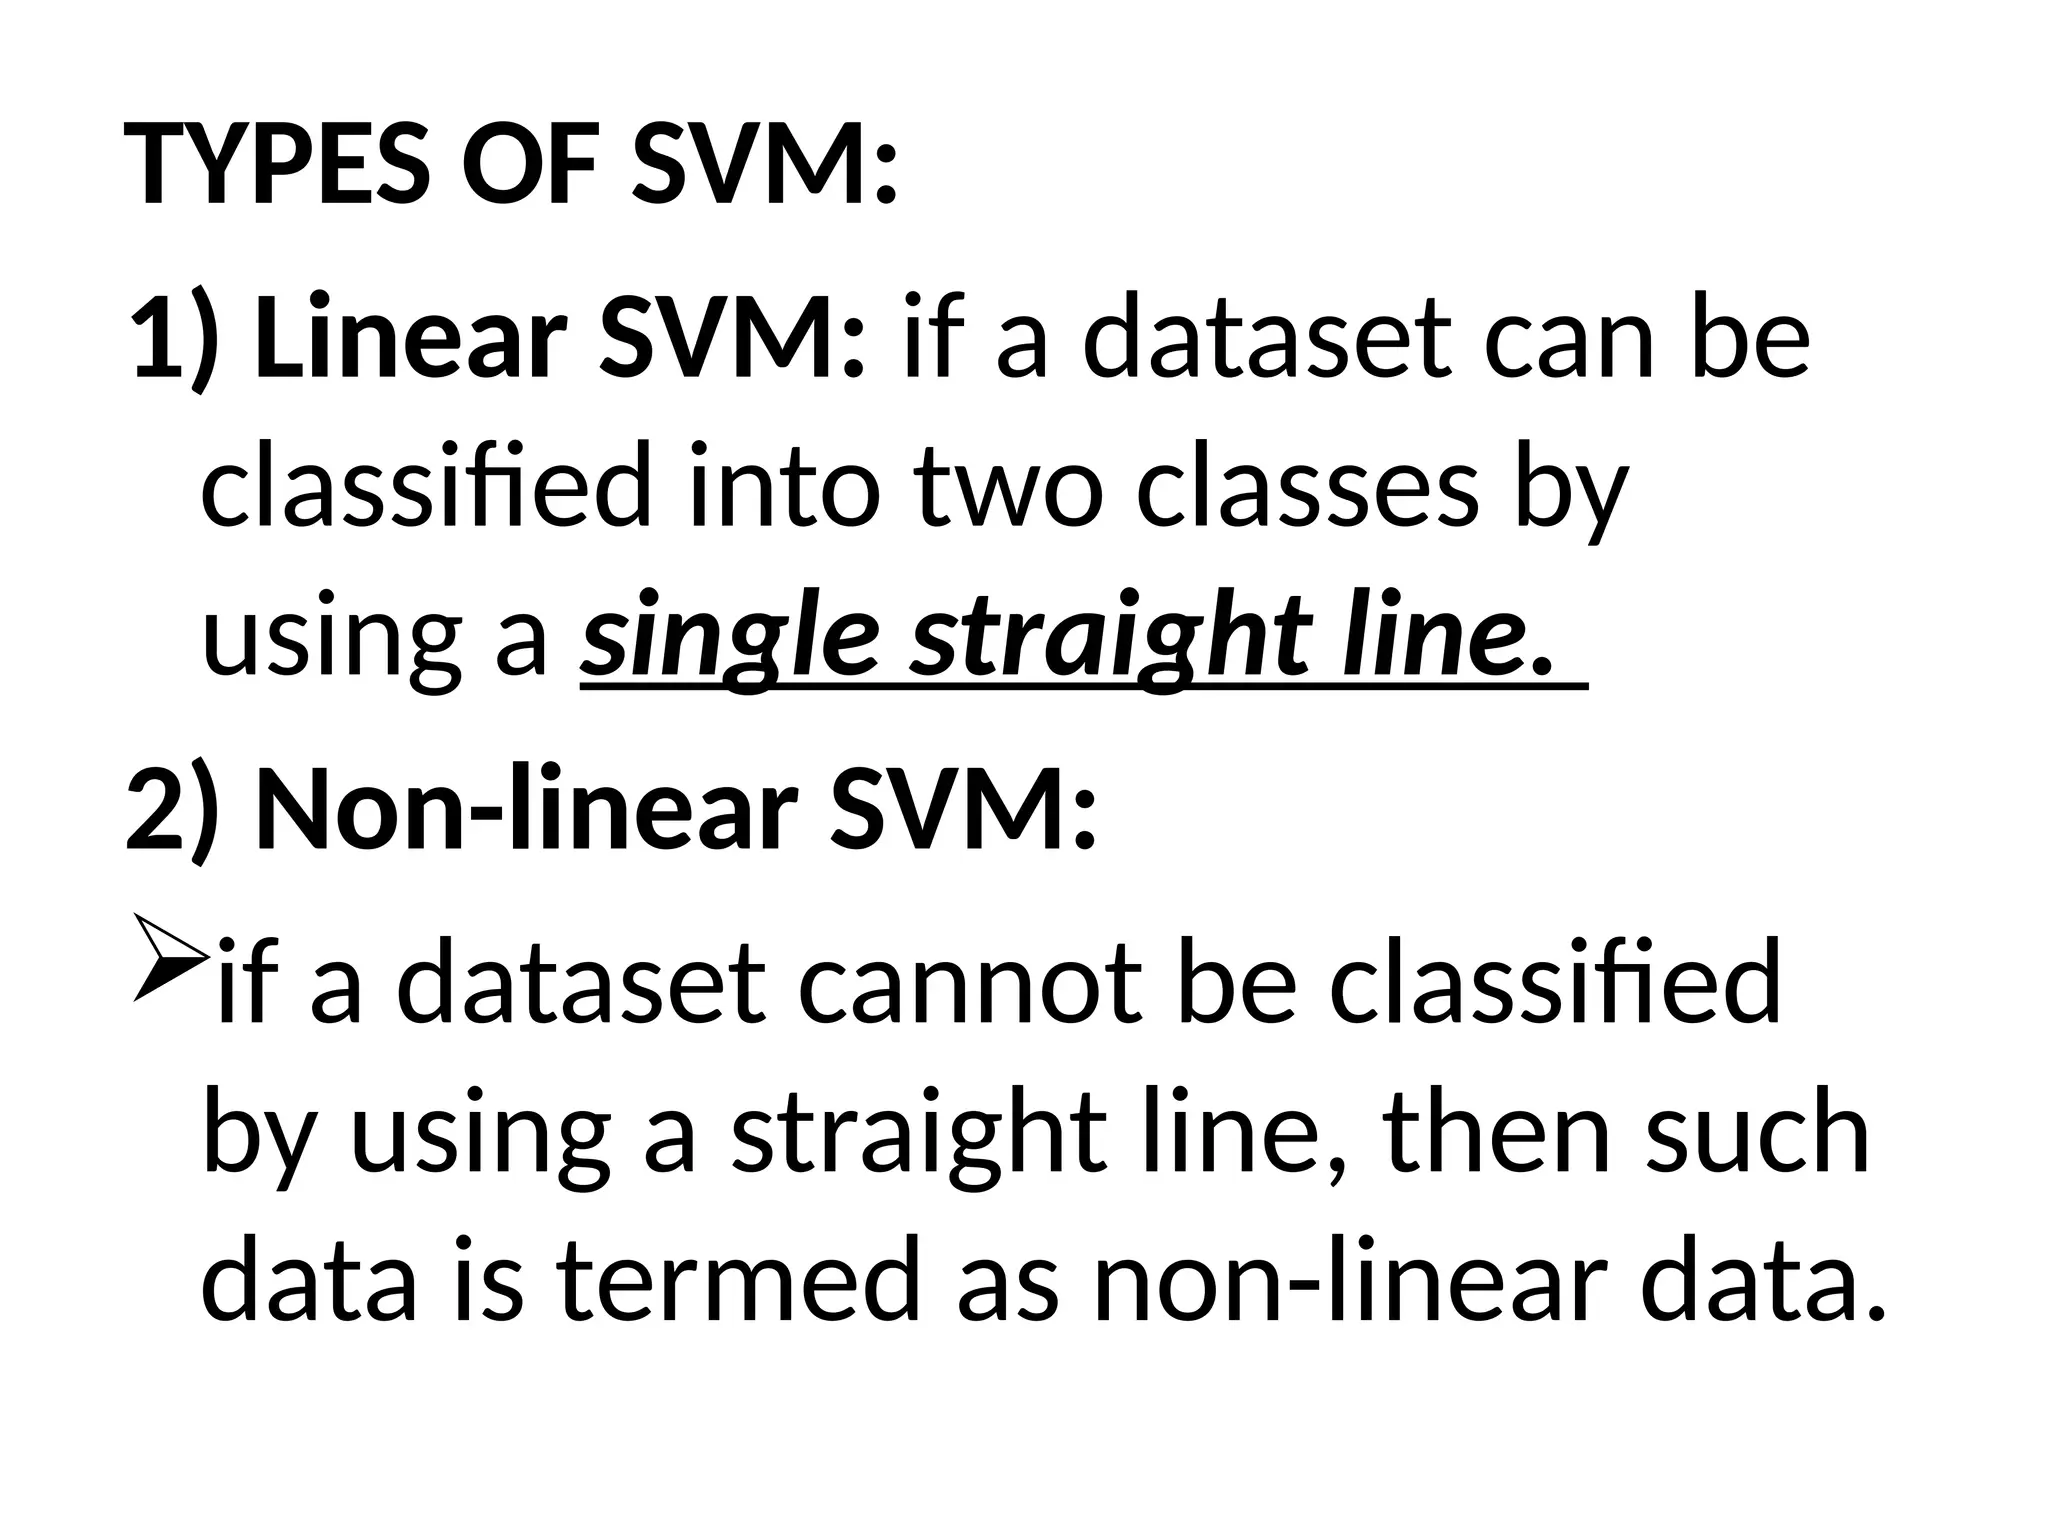
TYPES OF SVM:
1)Linear SVM: if a dataset can be
classified into two classes by
using a single straight line.
2) Non-linear SVM:
if a dataset cannot be classified
by using a straight line, then such
data is termed as non-linear data.
48.
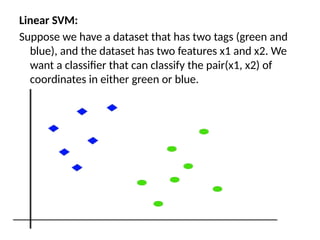
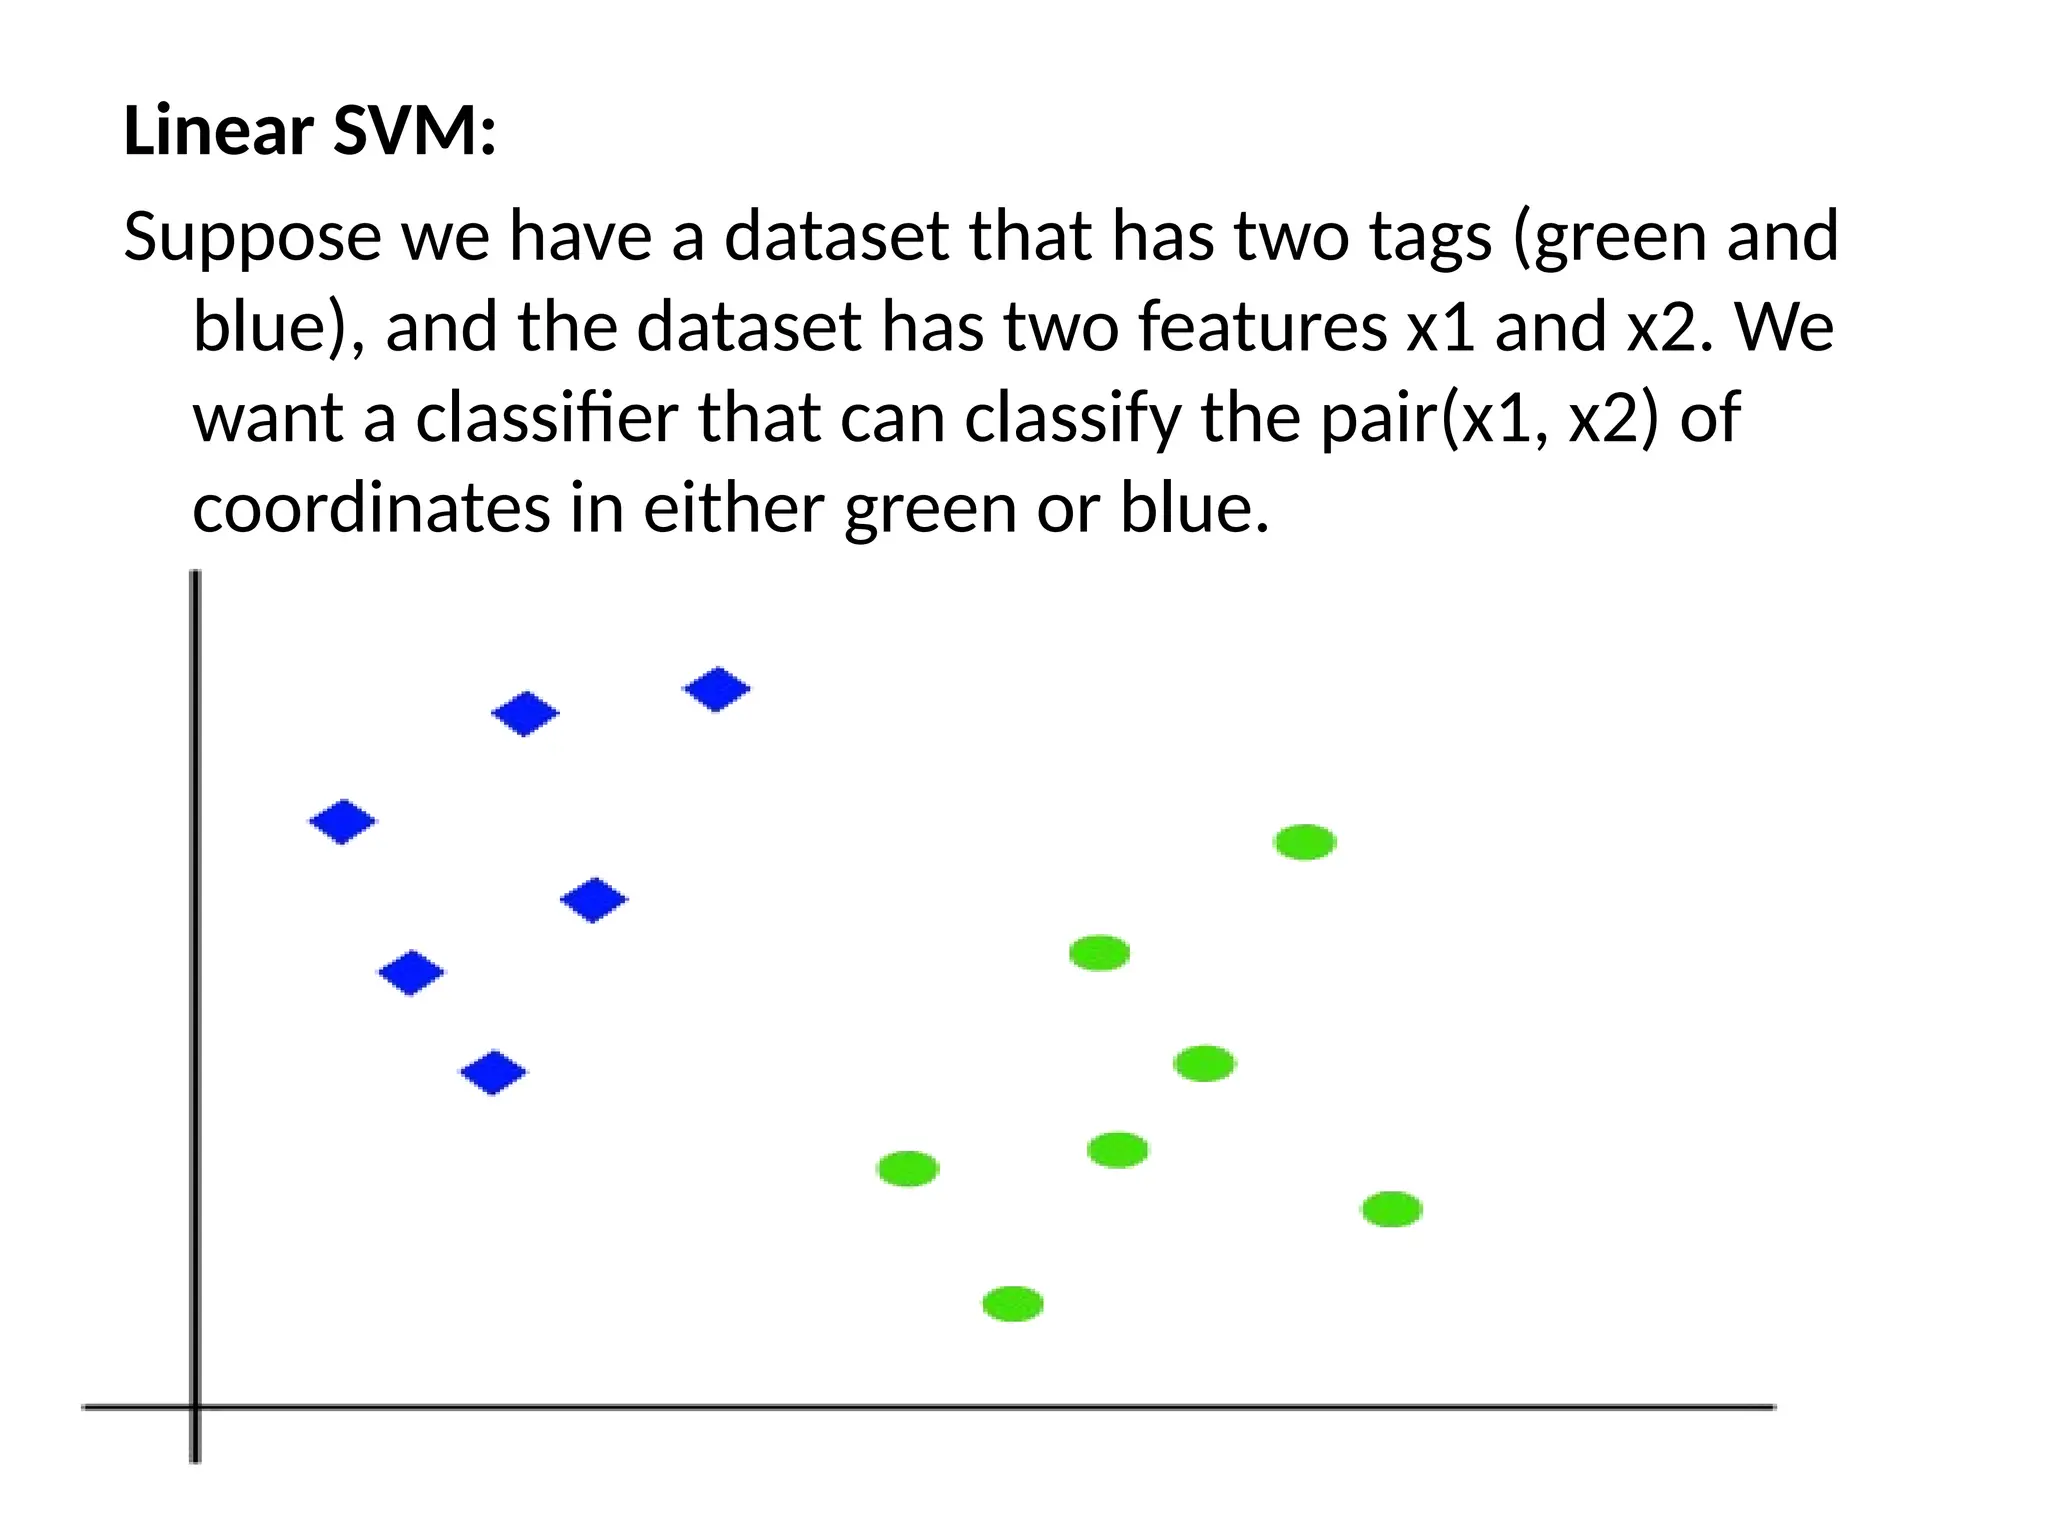
Linear SVM:
Suppose wehave a dataset that has two tags (green and
blue), and the dataset has two features x1 and x2. We
want a classifier that can classify the pair(x1, x2) of
coordinates in either green or blue.
49.
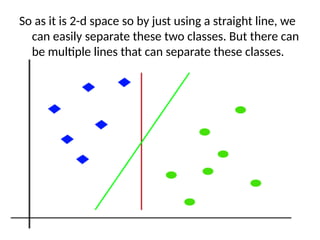
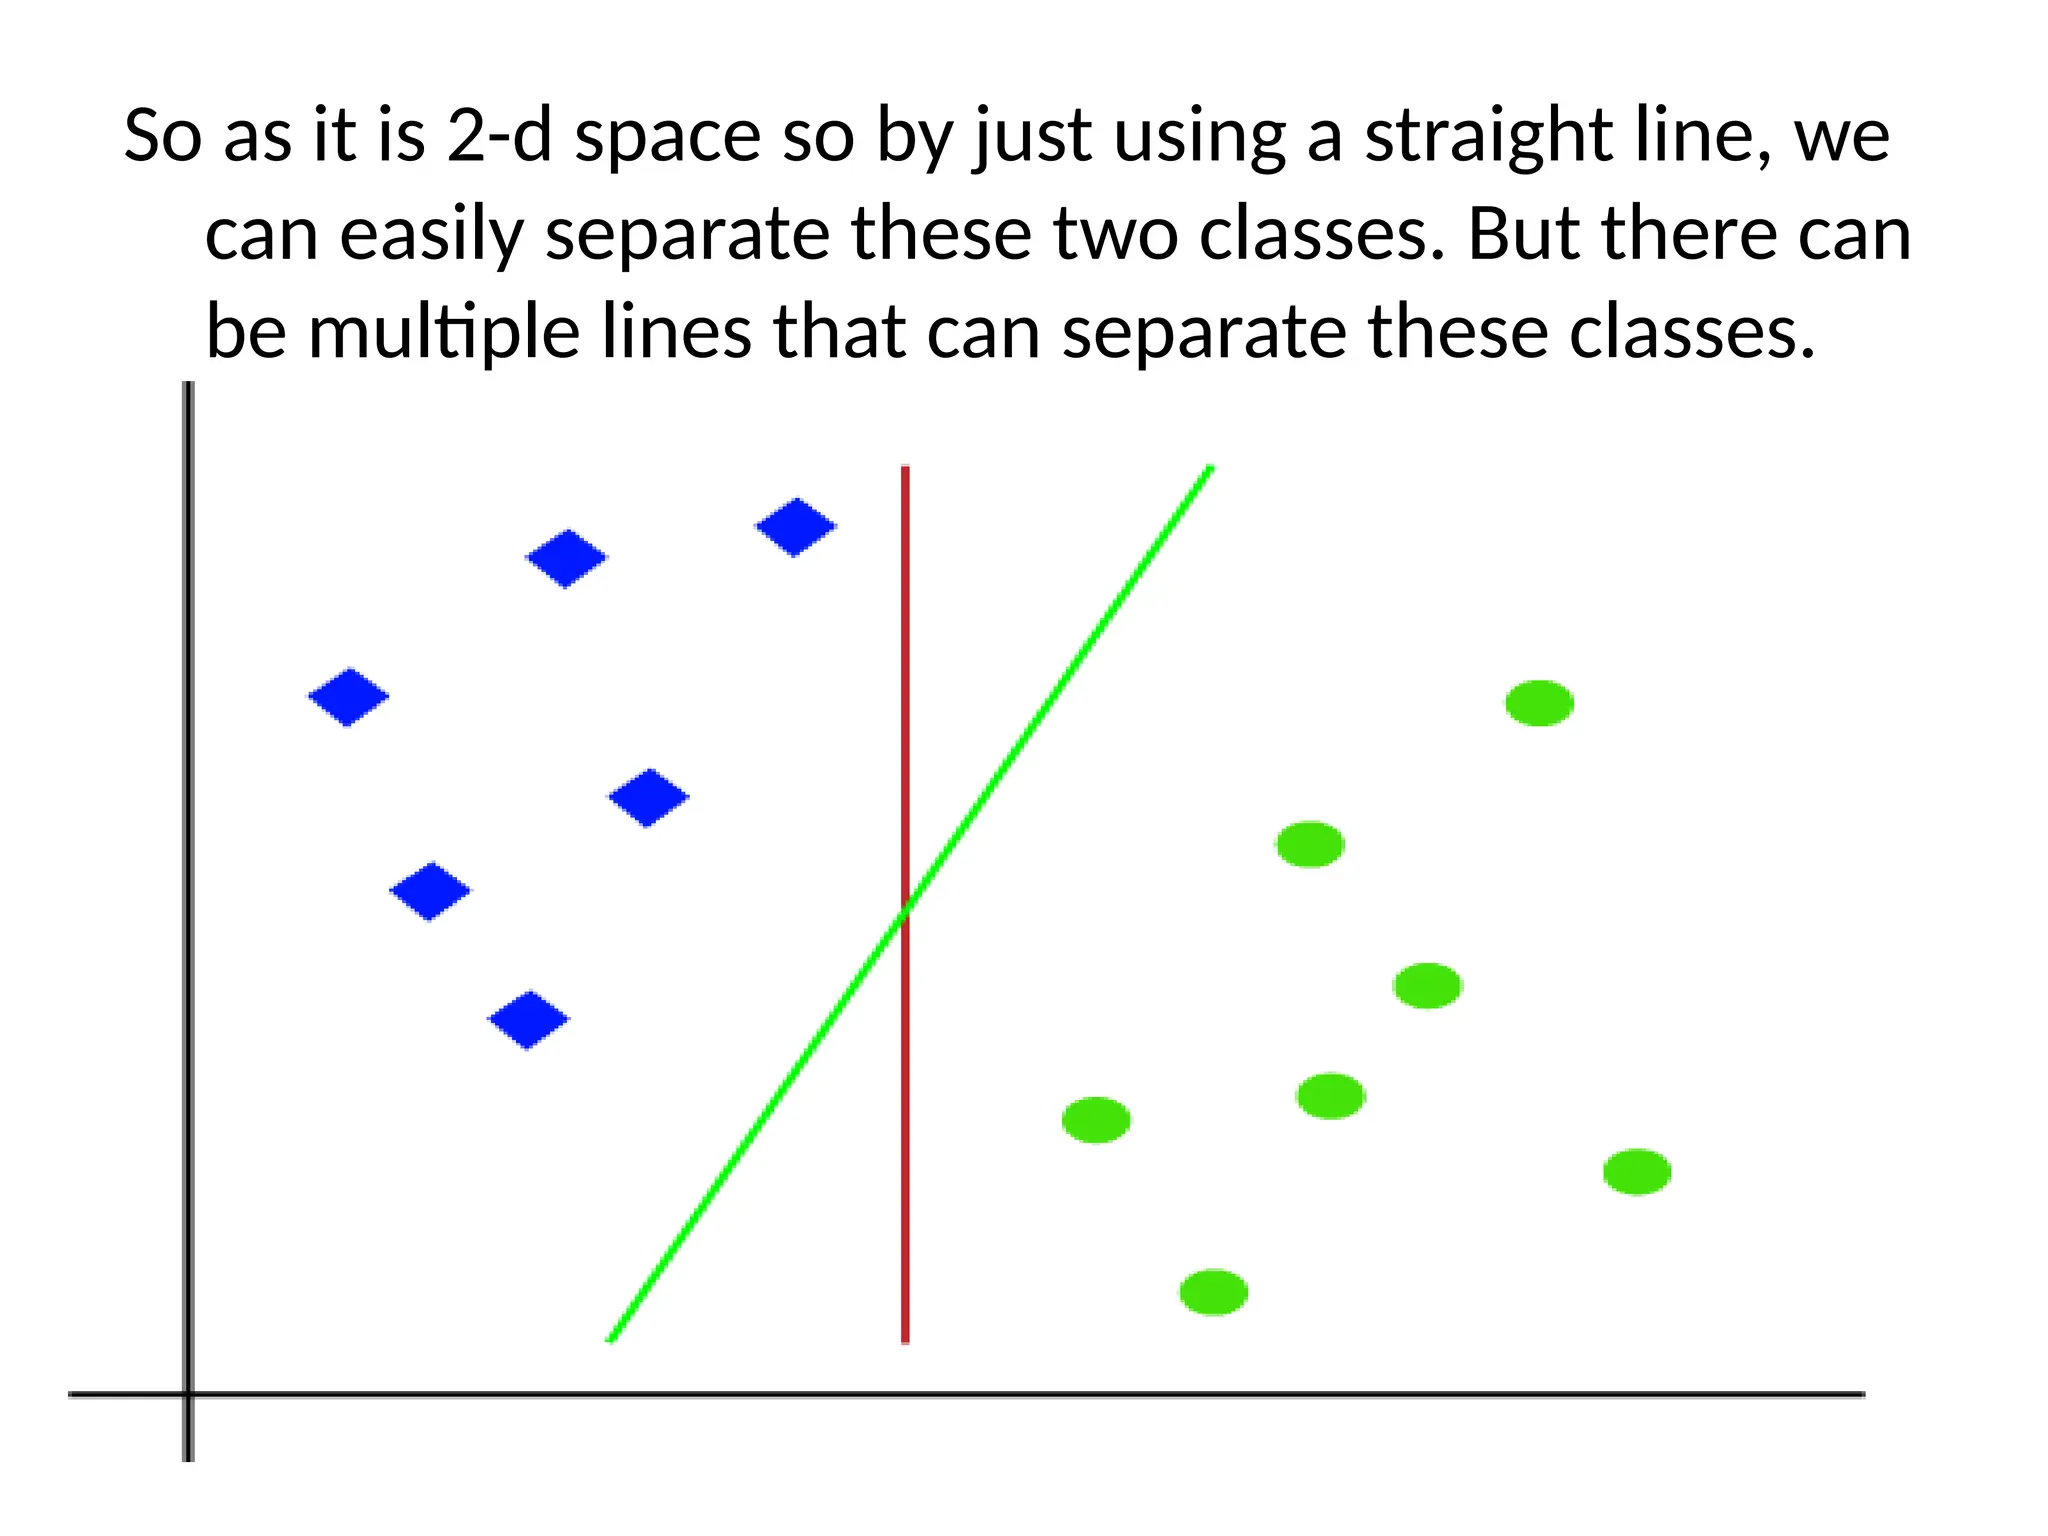
So as itis 2-d space so by just using a straight line, we
can easily separate these two classes. But there can
be multiple lines that can separate these classes.
50.
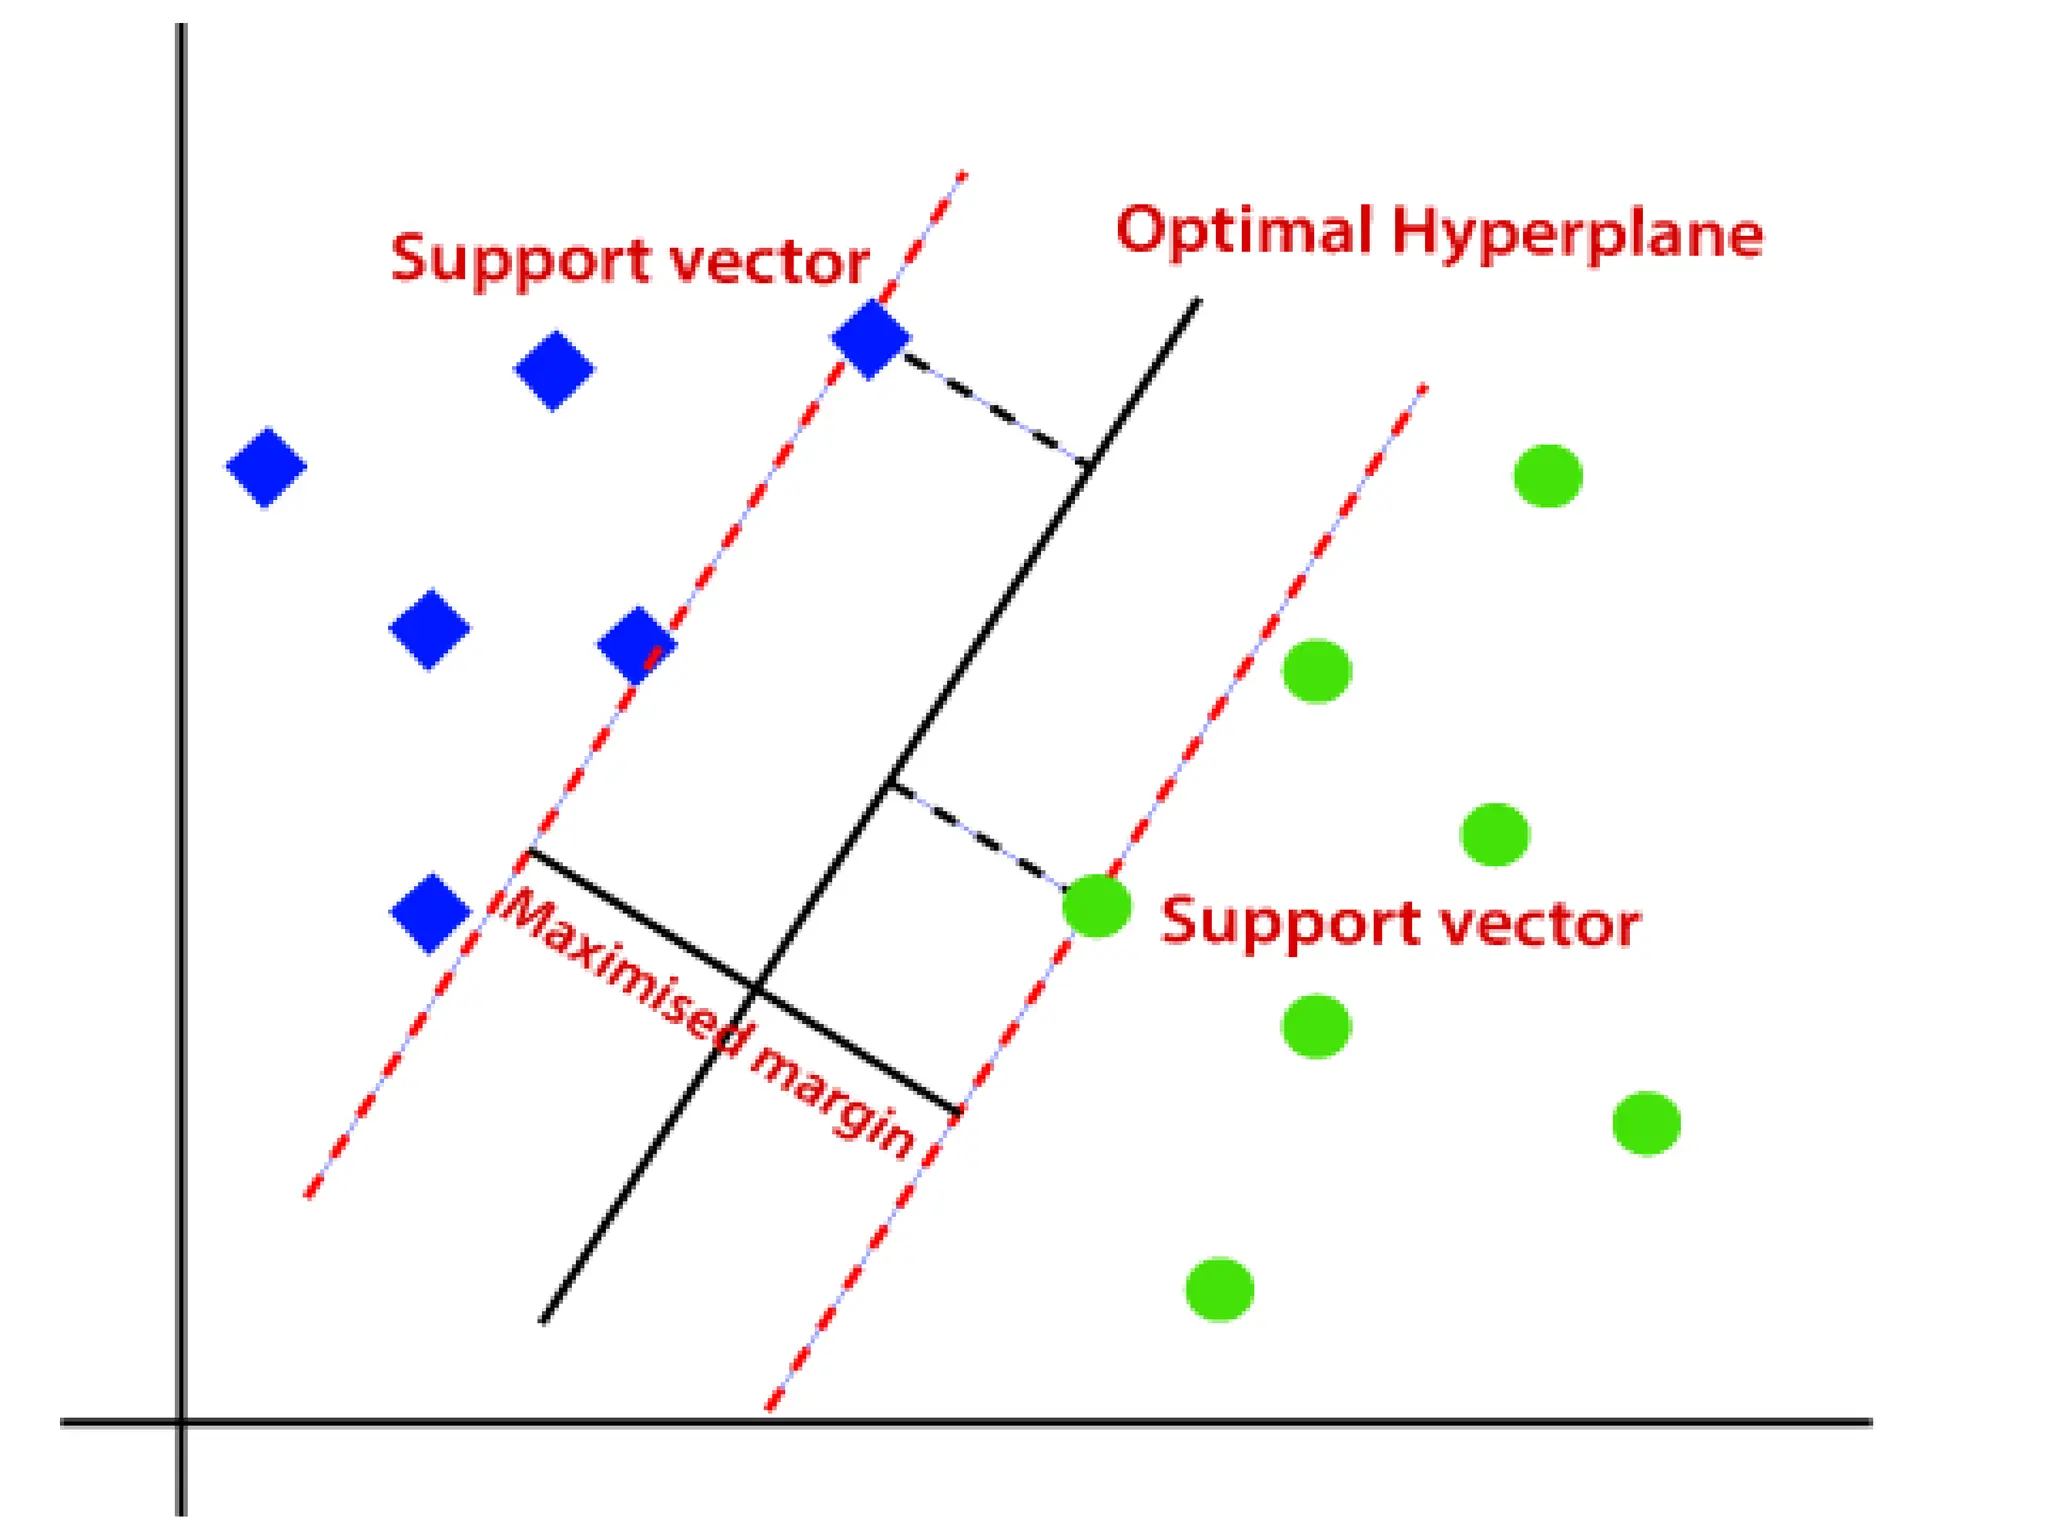
The SVM algorithmhelps to find the best line
or decision boundary; this best boundary or
region is called as a hyperplane.
SVM algorithm finds the closest point of the
lines from both the classes.
These points are called support vectors.
51.
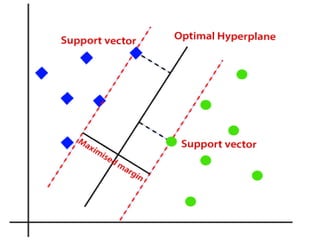
The distance betweenthe vectors and the
hyperplane is called as margin.
And the goal of SVM is to maximize this
margin.
The hyperplane with maximum margin is
called the optimal hyperplane.
53.
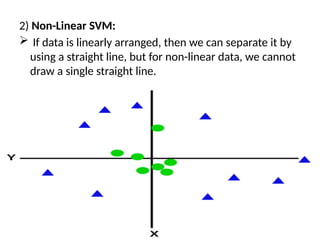
2) Non-Linear SVM:
If data is linearly arranged, then we can separate it by
using a straight line, but for non-linear data, we cannot
draw a single straight line.
54.
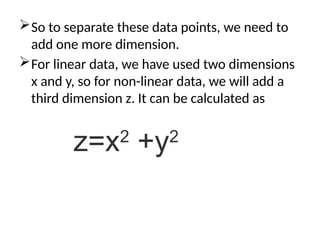
So to separatethese data points, we need to
add one more dimension.
For linear data, we have used two dimensions
x and y, so for non-linear data, we will add a
third dimension z. It can be calculated as
z=x2
+y2
55.
By adding thethird dimension, the sample space
will become as below image:
56.
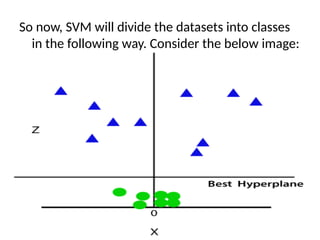
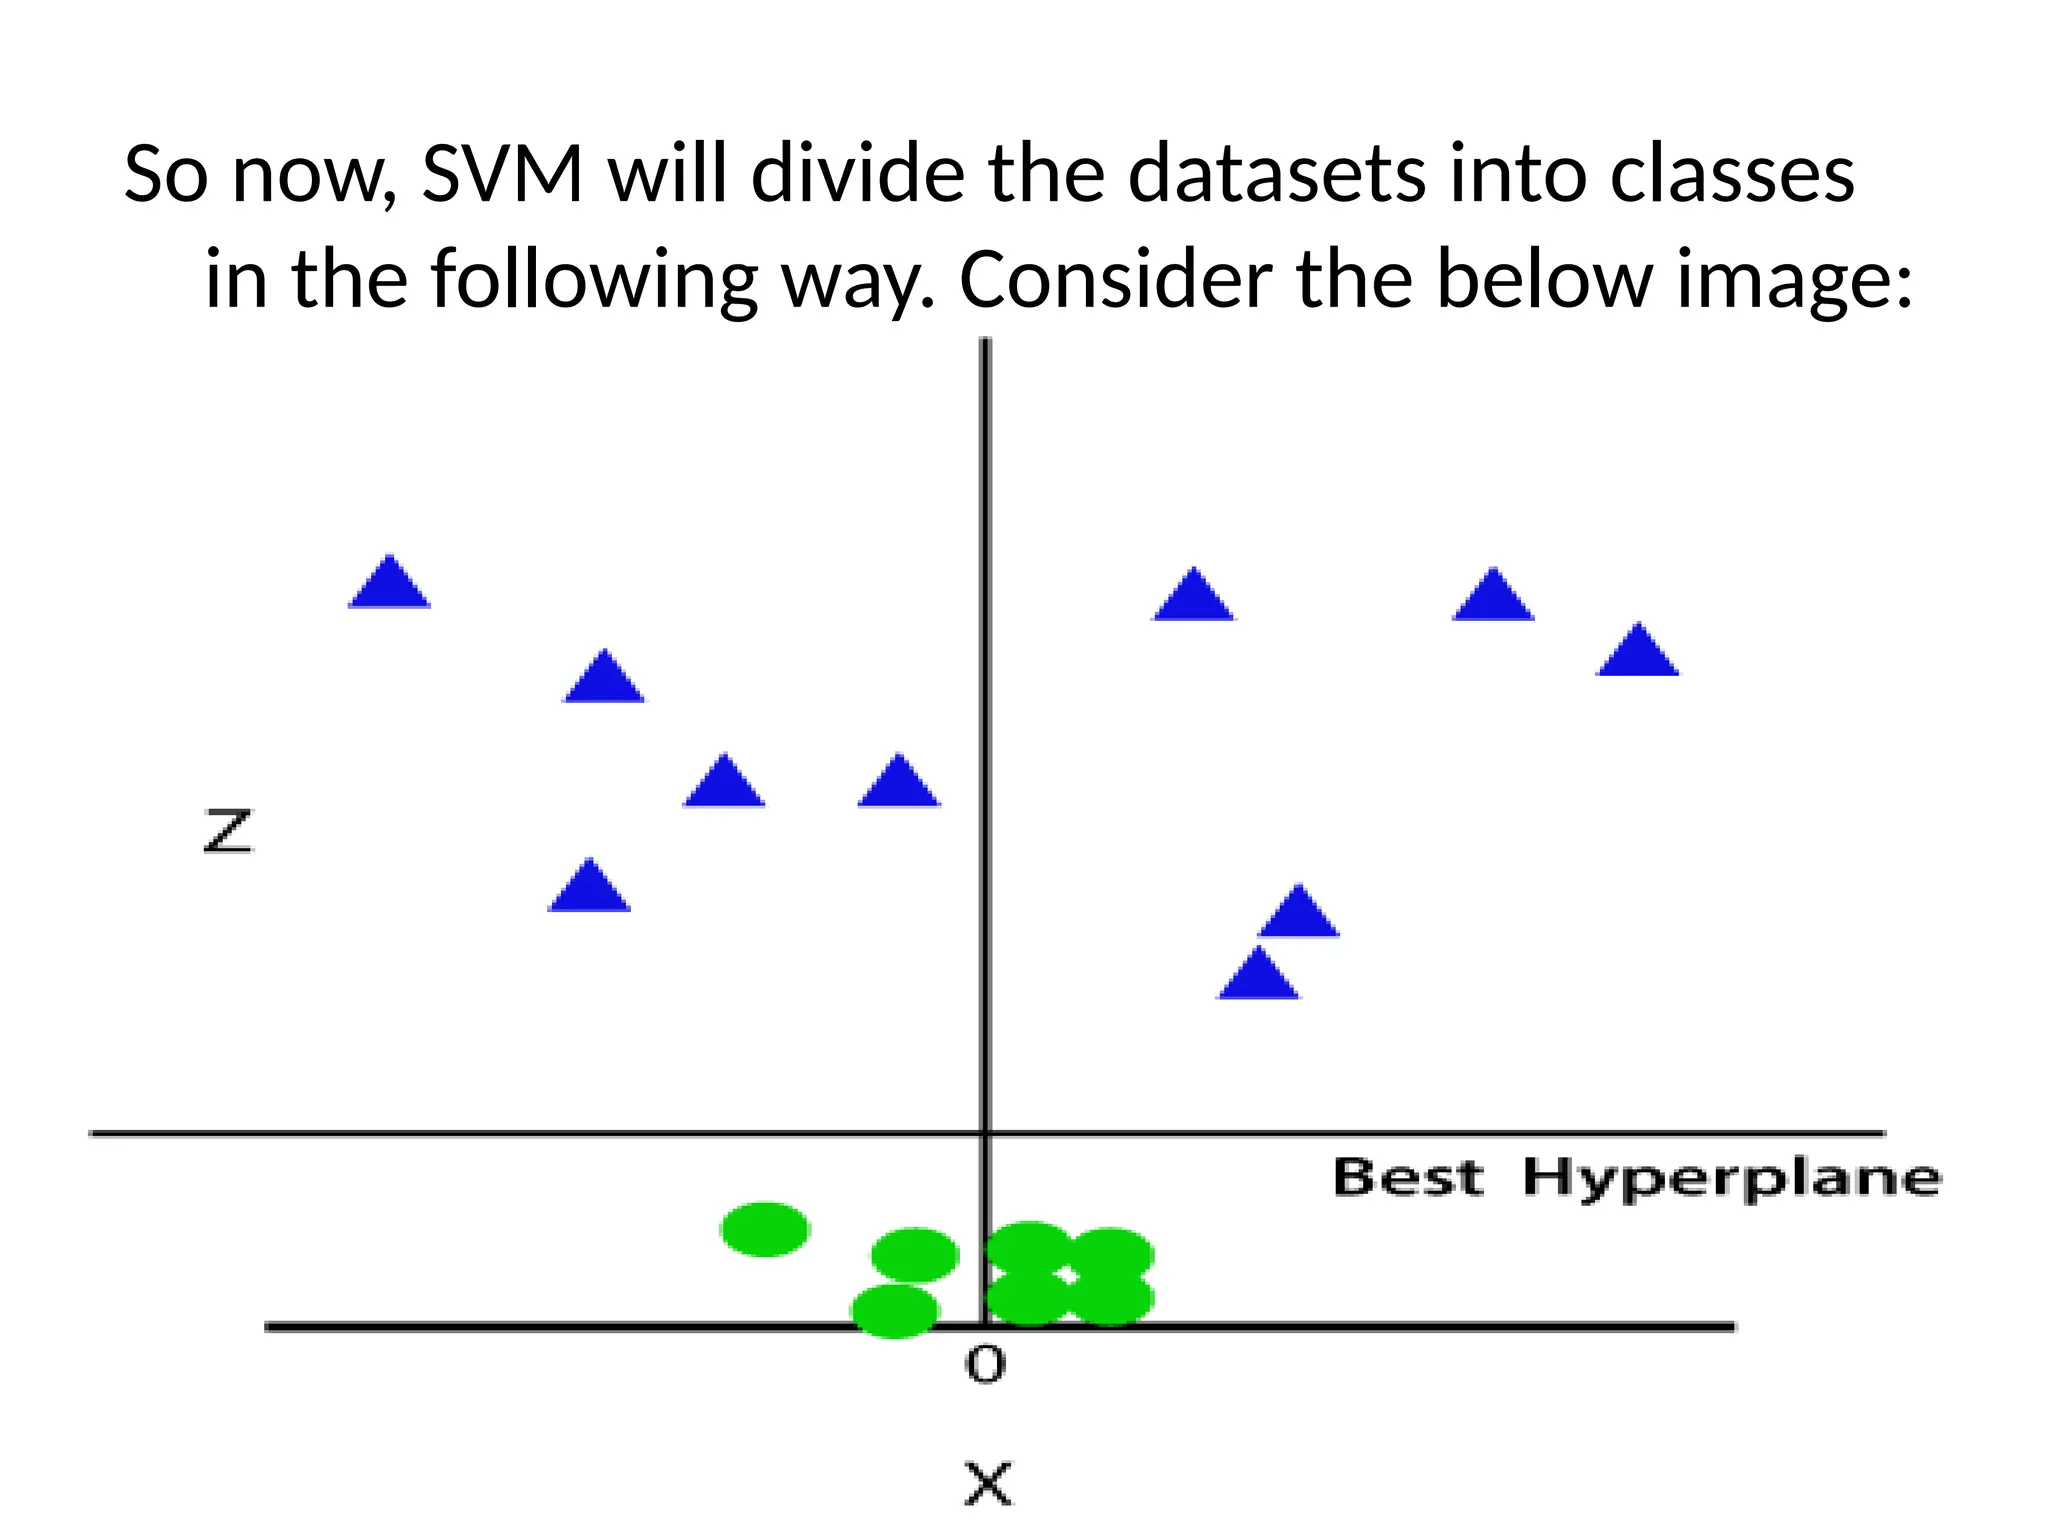
So now, SVMwill divide the datasets into classes
in the following way. Consider the below image:
Definition of Classification
“Classificationis the process of assigning new
input variables (X) to the class they most likely
belong to, based on a classification model, as
constructed from previously labeled training
data”.
59.
For example:
ifwe are taking a dataset of scores of a
cricketer in the past few matches, along with
average, strike rate, not outs etc, we can
classify him as “in form” or “out of form”.
60.
Types of Classification
Thereare two types of classifications;
1) Binary classification
2) Multi-class classification
61.
Binary Classification
It isa process or task of classification, in which
a given data is being classified into two
classes. It’s basically a kind of prediction
about which of two groups the thing belongs
to.
62.
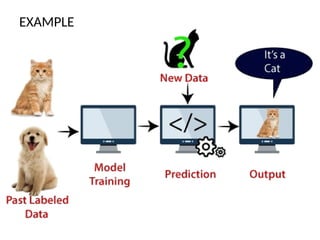
EXAMPLE:
Let us suppose,two emails are sent to you,
one is sent by an insurance company that
keeps sending their ads, and the other is from
your bank regarding your credit card bill.
The email service provider will classify the two
emails, the first one will be sent to the spam
folder and the second one will be kept in the
primary one.
63.
This process isknown as binary classification,
as there are two discrete classes, one is spam
and the other is primary.
64.
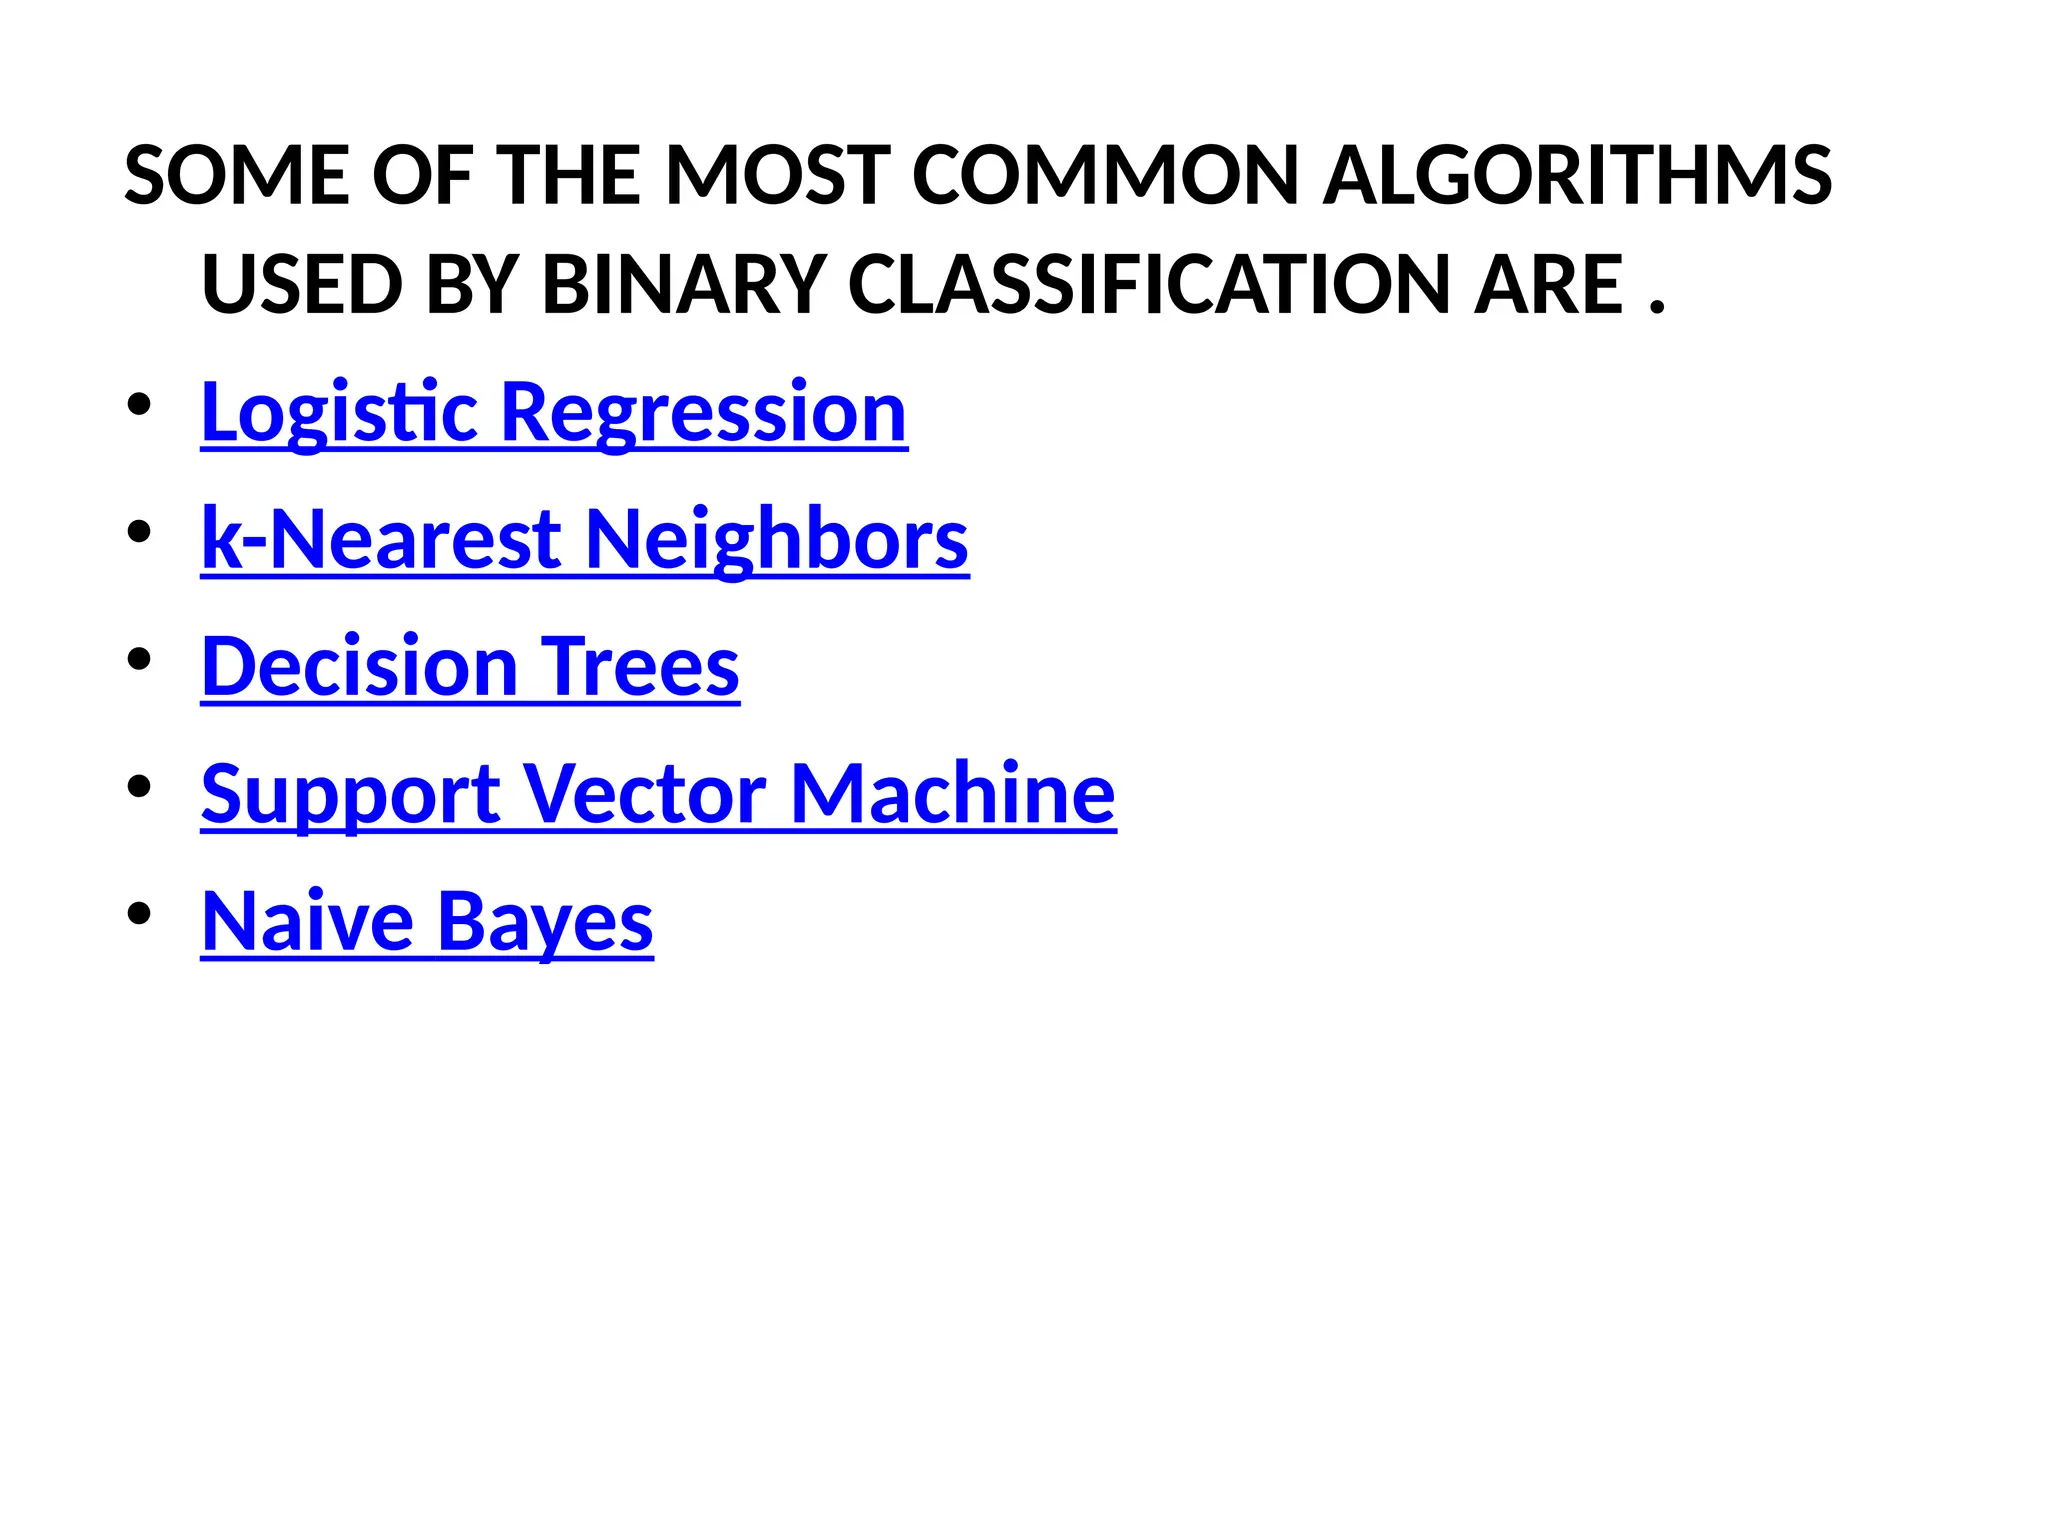
SOME OF THEMOST COMMON ALGORITHMS
USED BY BINARY CLASSIFICATION ARE .
• Logistic Regression
• k-Nearest Neighbors
• Decision Trees
• Support Vector Machine
• Naive Bayes
65.
Multiclass Classification
• Multi-classclassification is the task of
classifying elements into different classes.
Unlike binary, it doesn’t restrict itself to any
number of classes.
66.
EXAMPLES OF MULTI-CLASSCLASSIFICATION
ARE :
1) classification of news in different categories,
2) classifying books according to the subject,
3) classifying students according to their streams
etc.
67.
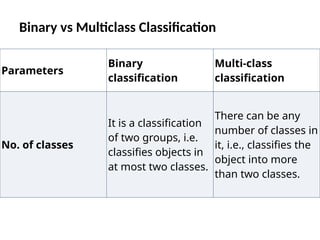
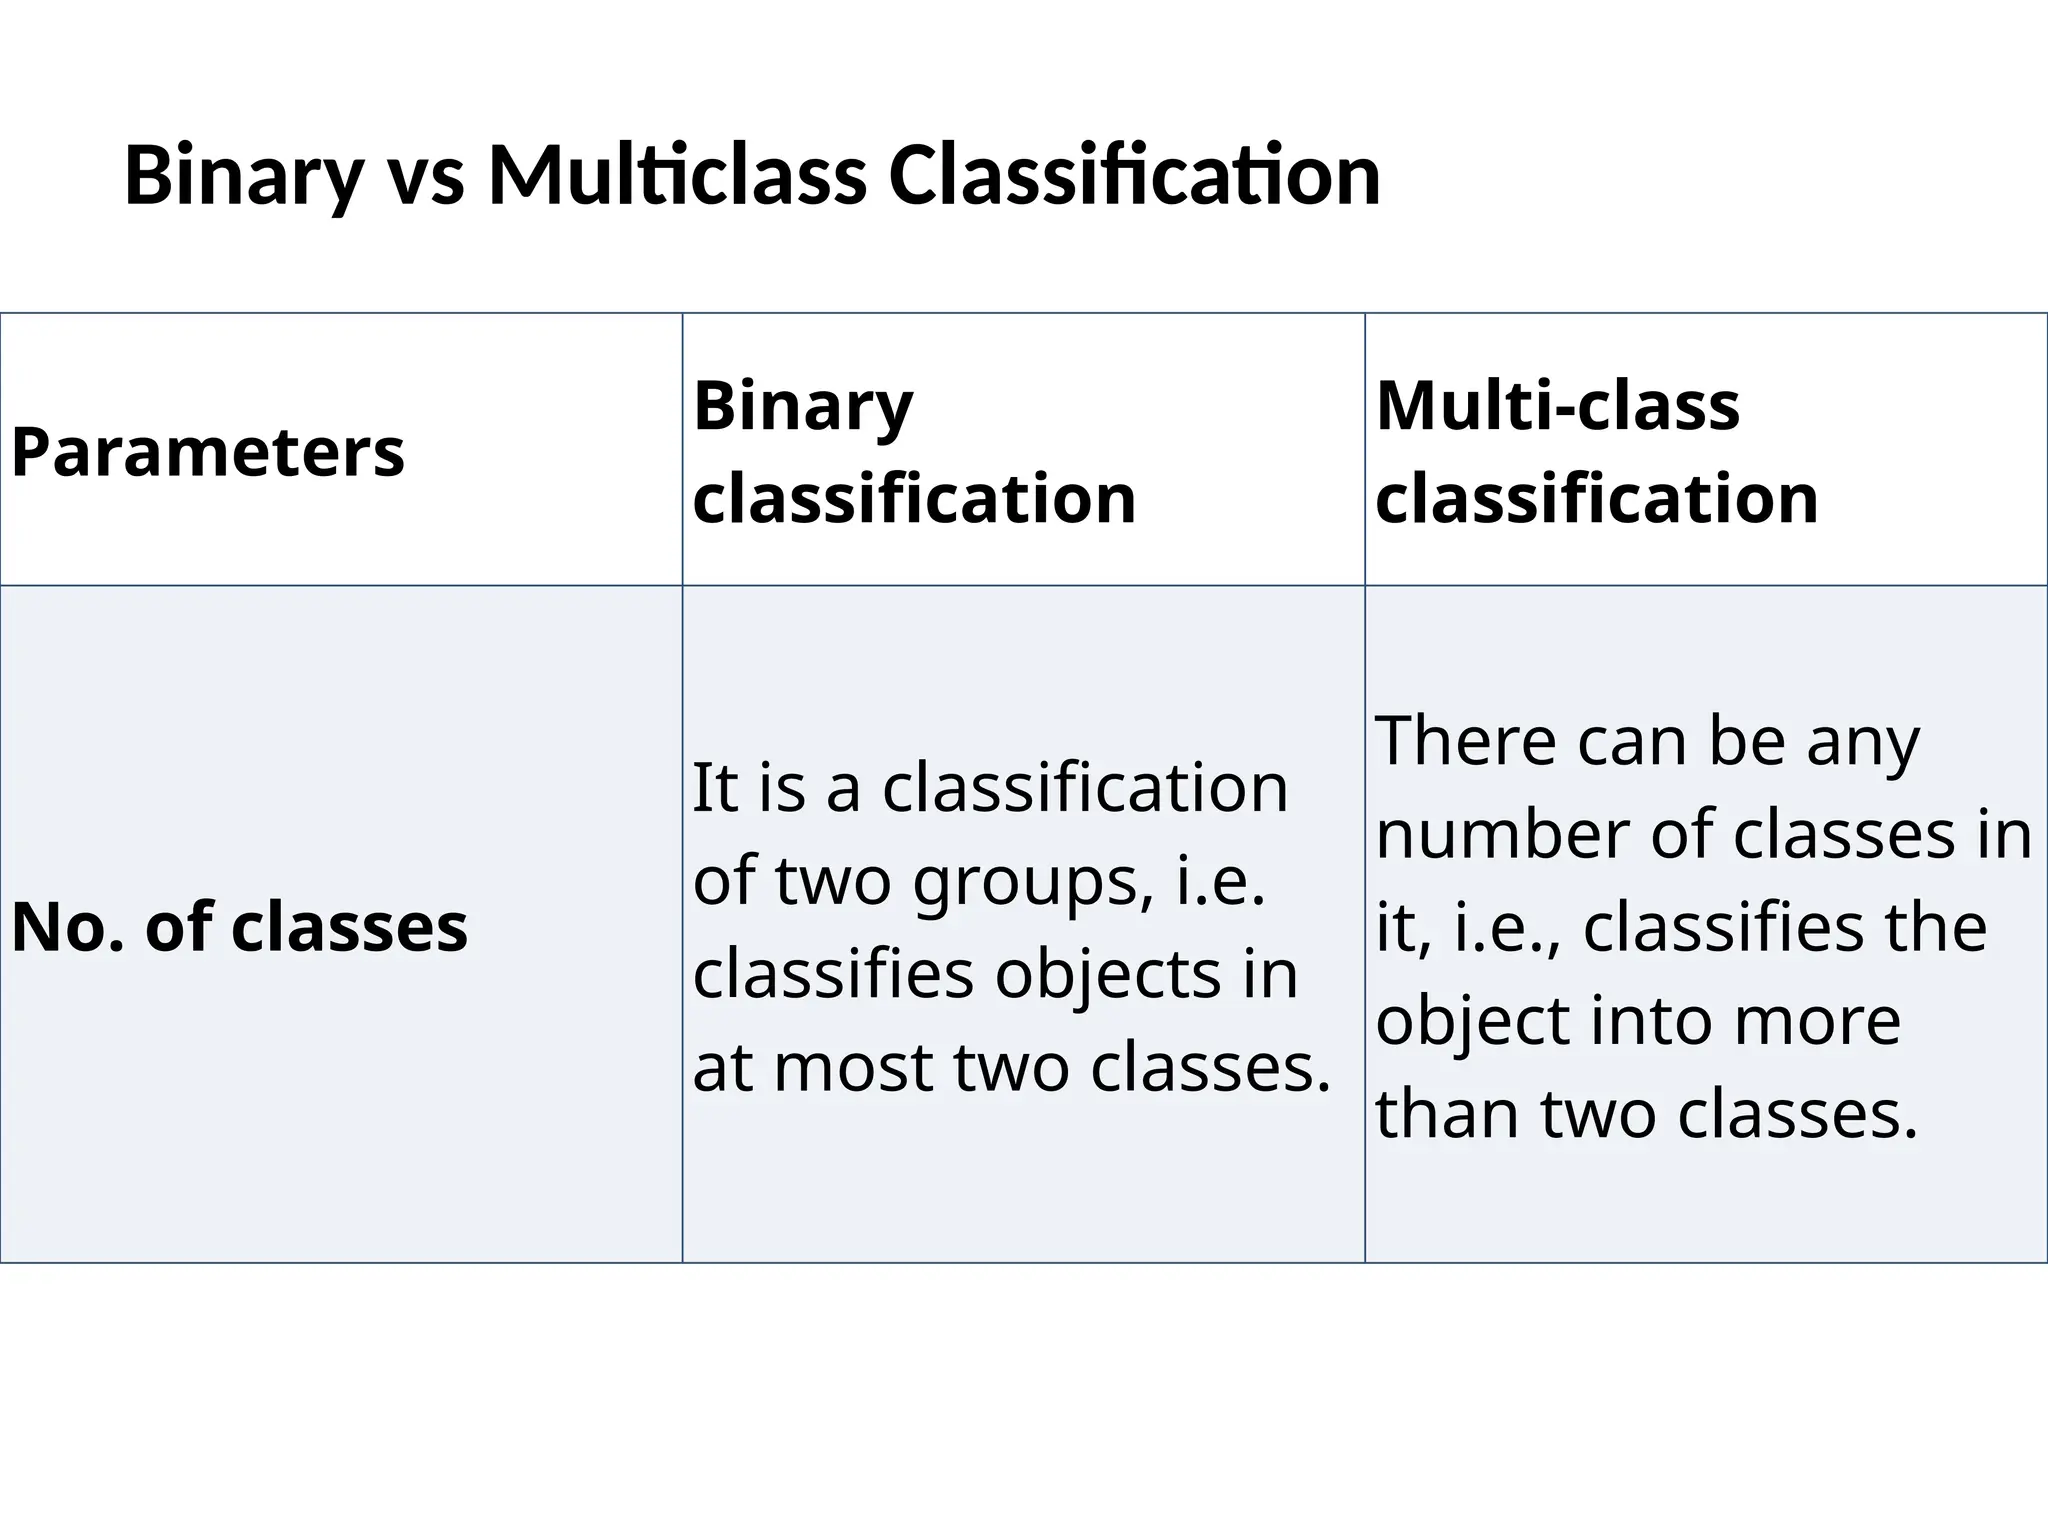
Binary vs MulticlassClassification
Parameters
Binary
classification
Multi-class
classification
No. of classes
It is a classification
of two groups, i.e.
classifies objects in
at most two classes.
There can be any
number of classes in
it, i.e., classifies the
object into more
than two classes.
68.
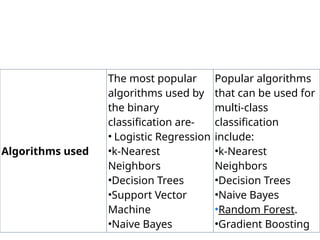
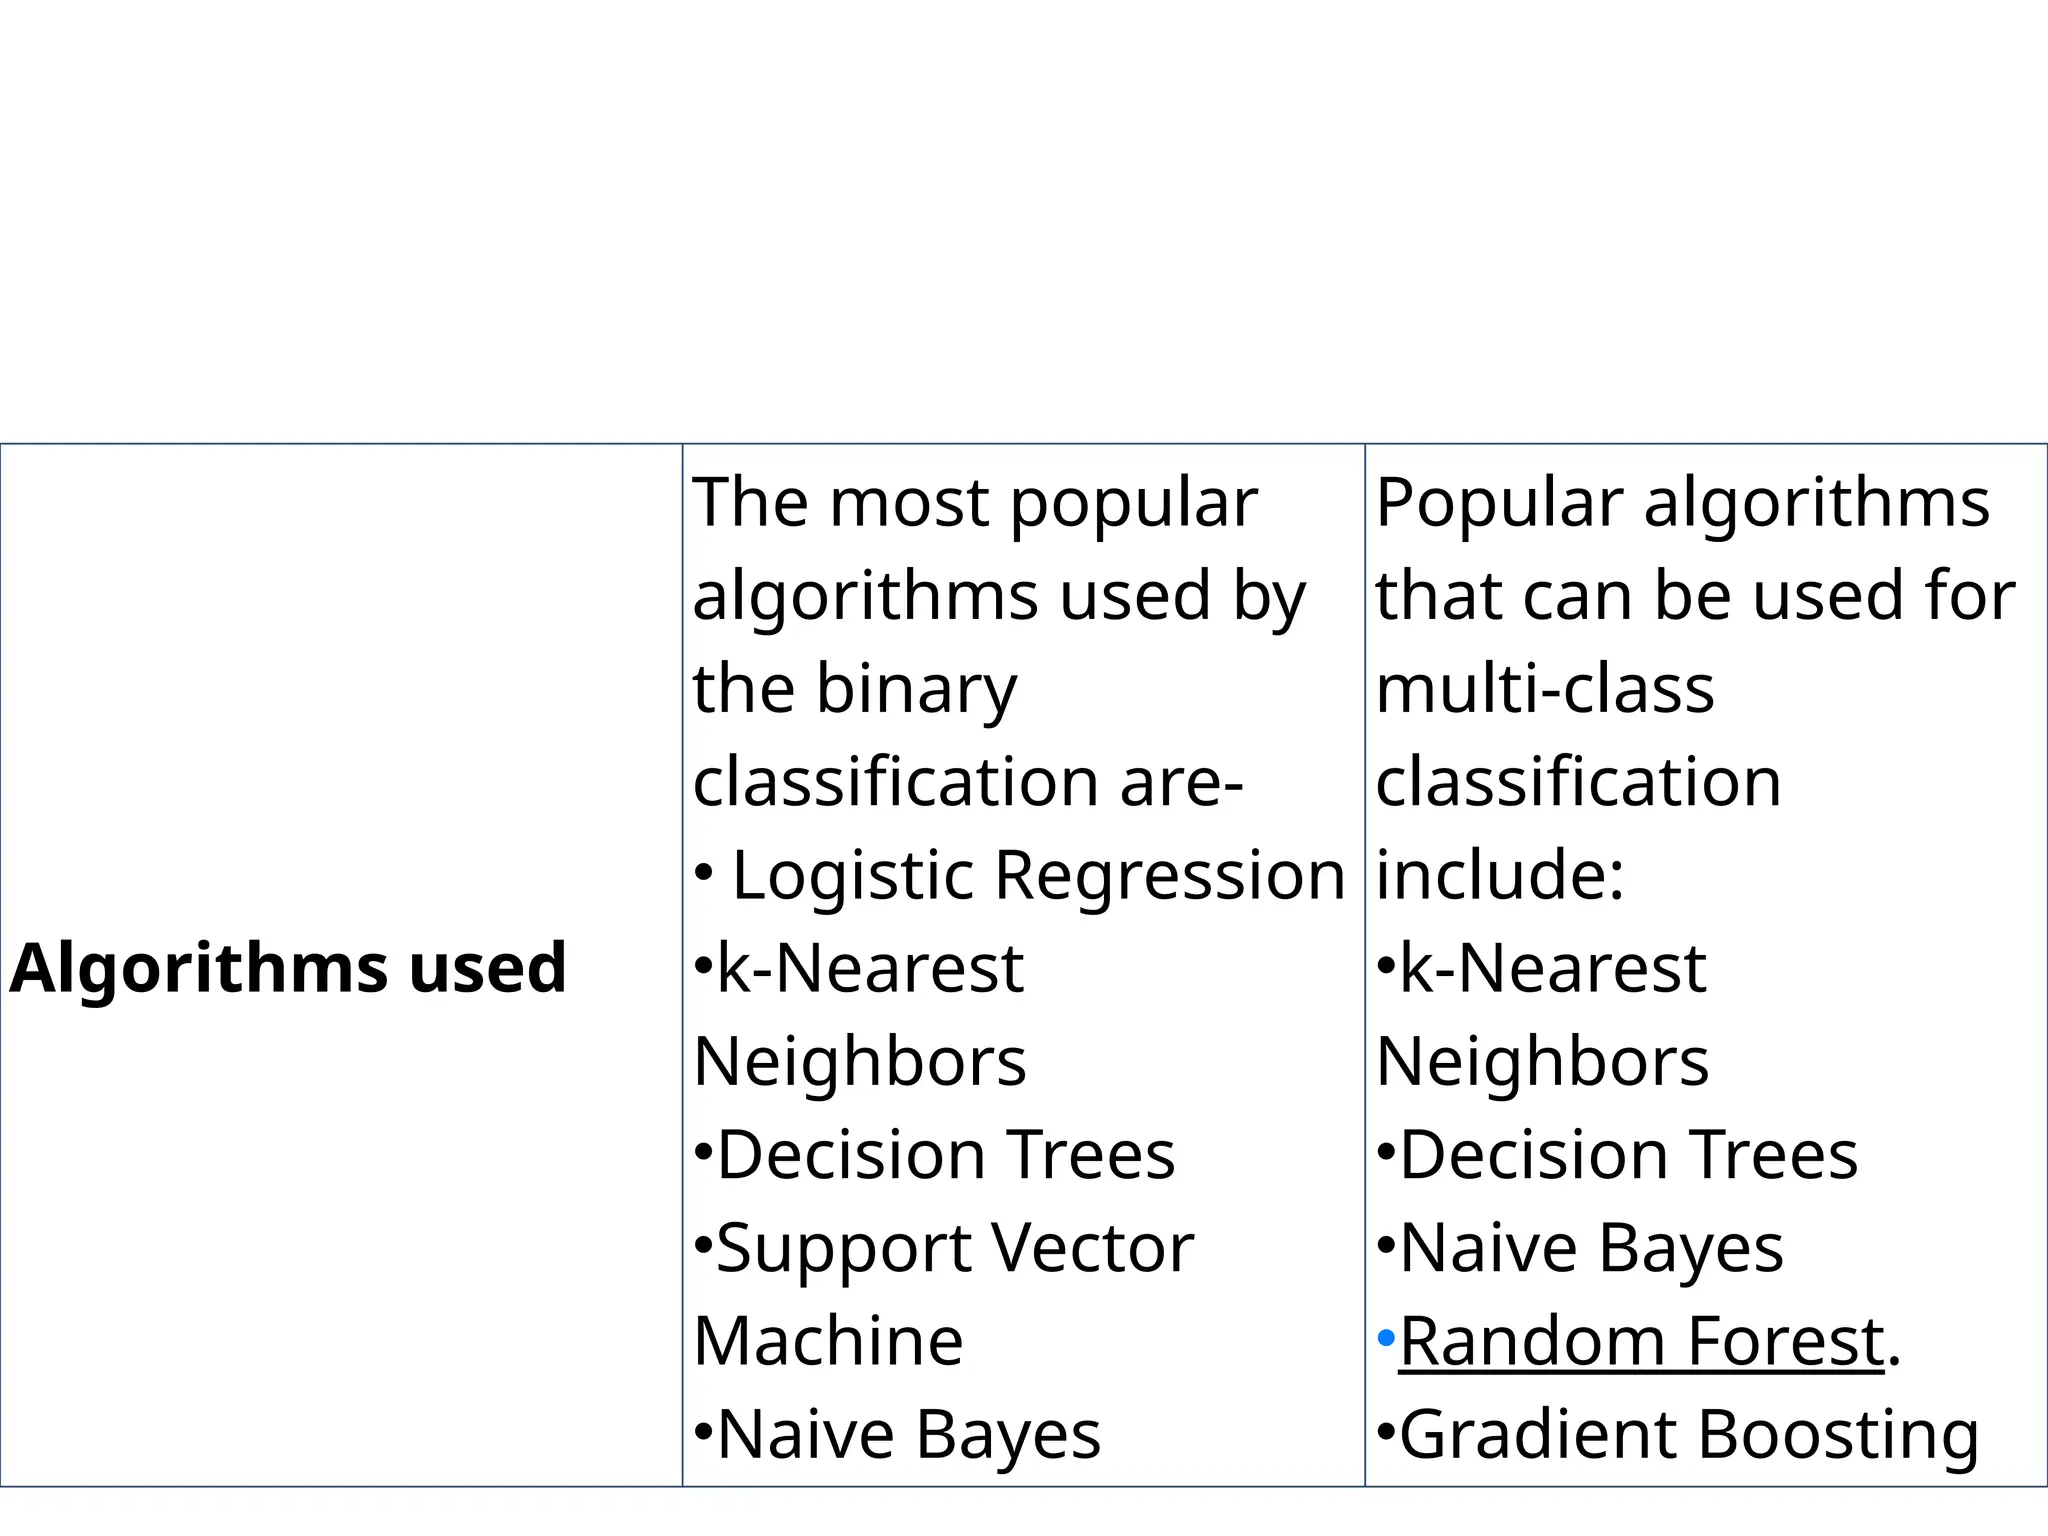
Algorithms used
The mostpopular
algorithms used by
the binary
classification are-
• Logistic Regression
•k-Nearest
Neighbors
•Decision Trees
•Support Vector
Machine
•Naive Bayes
Popular algorithms
that can be used for
multi-class
classification
include:
•k-Nearest
Neighbors
•Decision Trees
•Naive Bayes
•Random Forest.
•Gradient Boosting
69.
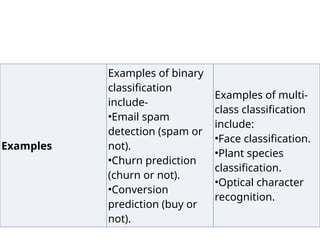
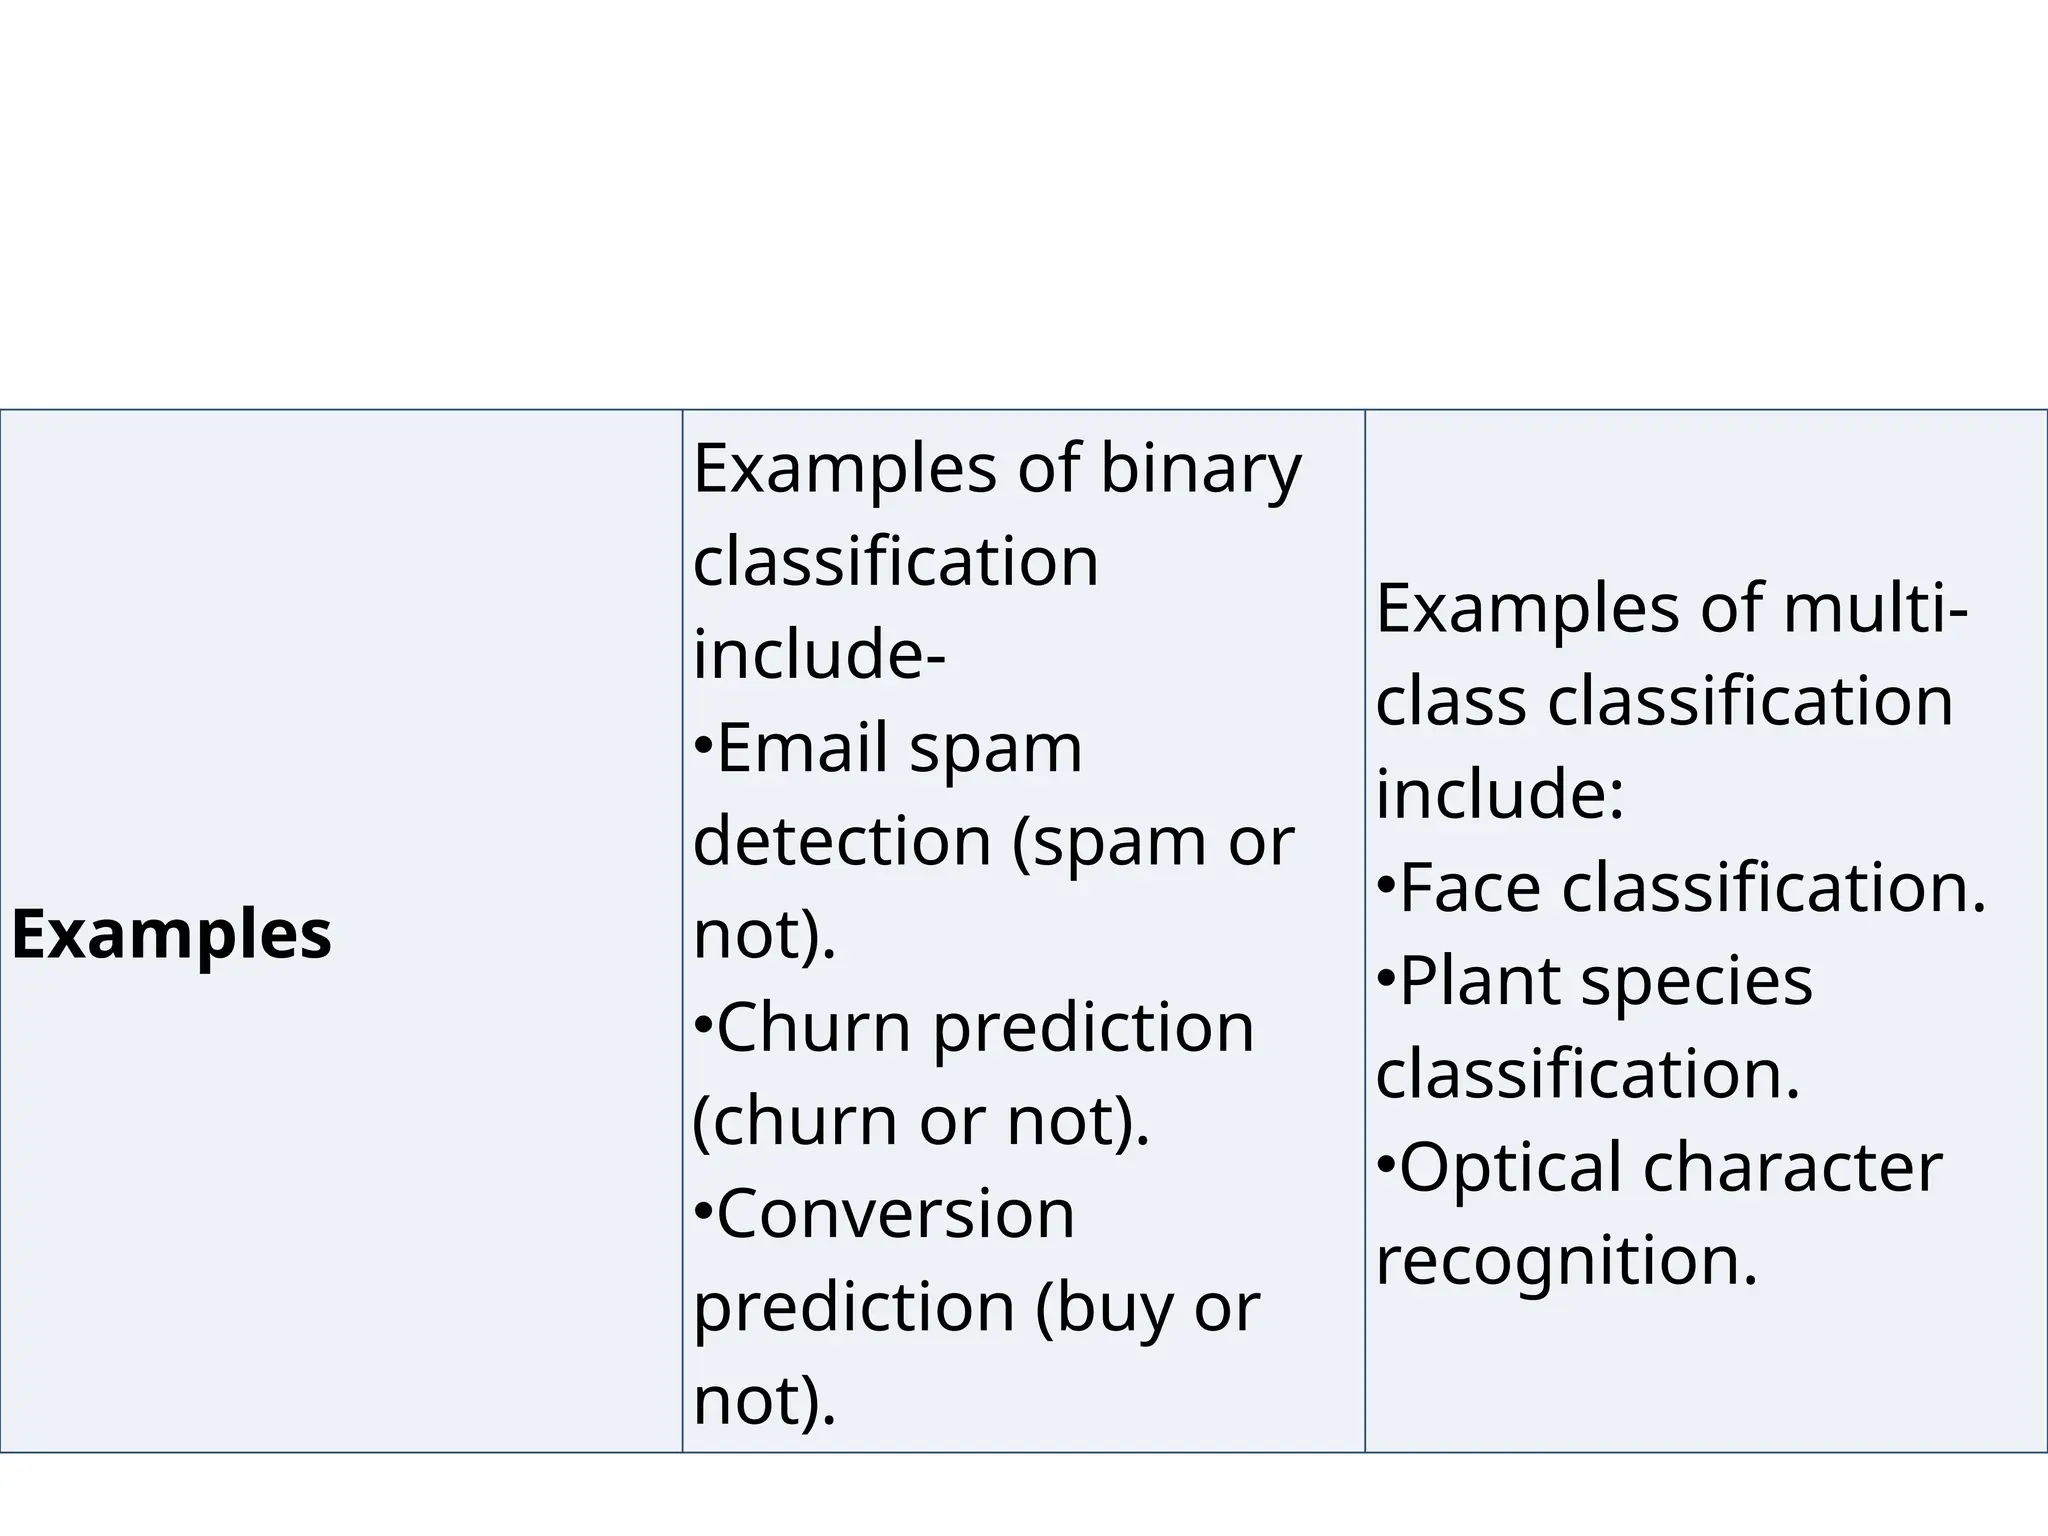
Examples
Examples of binary
classification
include-
•Emailspam
detection (spam or
not).
•Churn prediction
(churn or not).
•Conversion
prediction (buy or
not).
Examples of multi-
class classification
include:
•Face classification.
•Plant species
classification.
•Optical character
recognition.
70.
MNIST
The MNIST database(Modified National
Institute of Standards and Technology
database) is a large database.
The database is also widely used for training
and testing in the field of machine learning.
71.
The MNIST databasecontains 60,000 training
images and 10,000 testing images.
Half of the training set and half of the test set
were taken from NIST's training dataset,
while the other half of the training set and the
other half of the test set were taken from
NIST's testing dataset.
72.
RANKING
A binary classificationsystem involves
a system that generates ratings for
each occurrence, which, by ordering
them, are turned into rankings, which
are then compared to a threshold..
73.
Occurrences with rankingsabove the
threshold are declared positive, and
occurrences below the threshold are declared
negative