KEMBAR78
Pandas Data Cleaning and Preprocessing PPT.pptx
Data Cleaning and
Preprocessing with
Pandas
Data Cleaning
• Data preprocessing involves a broader set of
activities that prepare raw data for analysis. It
includes cleaning, but also encompasses tasks
such as feature scaling, handling categorical
variables, data transformation, and splitting
data into training and testing sets. The purpose
is to make the data more suitable for machine
learning algorithms and statistical analysis.
Data Preprocessing
• Data cleaning, also known as data cleansing or
scrubbing, is the process of identifying and
correcting errors or inconsistencies in datasets.
It involves handling missing values, removing
duplicates, correcting inaccuracies, and
ensuring data consistency. The goal is to
improve the quality and reliability of the data,
making it suitable for analysis.
Importance of Data Quality:
1 Reliable Insights
High-quality data ensures that the insights and
conclusions drawn from the analysis are reliable.
Inaccuracies or inconsistencies in the data can lead to
incorrect interpretations.
2
Better Decision-Making
Organizations rely on data-driven decision-
making. Clean and high-quality data
provides a solid foundation for making
informed and effective decisions.
3 Trust in Analytics
Stakeholders and decision-makers must trust the data
used in analytics. Quality data instills confidence in
the results and recommendations generated by
analytical models.
4
Avoiding Bias
Biased or incomplete data can lead to
biased results. Data quality is crucial to
avoid reinforcing existing biases and to
ensure fairness in decision-making
processes.
Roles in Data Analytics and Machine Learning
1 Improved Model Performance
Clean and preprocessed data is essential for
training accurate machine learning models. It
helps models generalize well to new, unseen
data, improving their performance.
2 Feature Engineering
Data preprocessing includes feature scaling,
handling categorical variables, and transforming
data. These activities contribute to creating
meaningful features, enhancing the model's ability
to capture patterns.
3 Efficient Analysis
Clean data accelerates the analysis process.
Analysts and data scientists can focus on
extracting insights rather than dealing with
data inconsistencies.
4 Enhanced Interpretability
Well-preprocessed data leads to models that are
easier to interpret. This is crucial for understanding
the factors influencing predictions or outcomes.
Key Concepts in Artificial Intelligence
Machine Perception
📷
AI systems can perceive
and interpret the world
through computer vision,
speech recognition, and
natural language
processing.
Knowledge
Representation and
Reasoning 📚
AI uses techniques to
represent and store
knowledge and apply logical
reasoning to solve complex
problems.
Planning and
Decision Making 🧭
AI systems can plan
sequences of actions and
make optimal decisions by
considering various factors
and constraints.
Applications of Machine Learning
Recommendation
Systems
ML algorithms personalize
recommendations on platforms
like Netflix and Amazon.
Speech Recognition
ML techniques transcribe
speech into text and power
voice-controlled systems.
Image Classification
ML models identify objects,
scenes, and people in images
for various applications.
Data Cleaning
Data cleaning means fixing bad data in your data set.
Bad data could be:
• Empty cells
• Data in wrong format
• Wrong data
• Duplicates
Remove Rows
new_df = df.dropna()
print(new_df.to_string())
Remove all Rows with NULL Values
df.dropna(inplace = True)
Remove NULL Values with 200
df.fillna(200, inplace = True)
Remove NULL values in Specific Co
df[“col_name"].fillna(130, inplace = True)
Replace using Mean, Median and M
df[" col_name "].fillna(df[" col_name "].mean(), inplace = True)
df[" col_name "].fillna(df[" col_name "].median(), inplace = True)
df[" col_name "].fillna(df[" col_name "].mode()[0], inplace = True)
Convert into a Correct Format
pd.to_datetime(df['Date'])
Discovering Duplicates
print(df.duplicated())
Removing Duplicates
df.drop_duplicates(inplace = True)
Dealing with Outliers
Outliers are data points that significantly deviate from the rest of the dataset.
Dealing with outliers involves identifying them, understanding their impact,
and deciding whether to remove or transform them.
Identifying Outliers using
Descriptive Statistics
Descriptive statistics, such as mean, median, and standard deviation, can be used to
identify outliers. Data points that fall far from the mean or median may be considered
outliers.
import pandas as pd
# Creating a DataFrame with outliers
data = {'Values': [1, 2, 3, 20, 25, 30, 35, 40]}
df = pd.DataFrame(data)
# Calculate mean and standard deviation
mean_val = df['Values'].mean()
std_dev = df['Values'].std()
# Identify outliers based on z-scores
outliers = df[(df['Values'] < mean_val - 2 * std_dev) | (df['Values'] > mean_val + 2 *
std_dev)]
print("Original DataFrame:")
print(df)
print("nOutliers identified using descriptive statistics:")
Handling Outliers
(Removing or
Transforming)
Handling outliers involves deciding whether to remove them or transform
them to mitigate their impact on analysis or modeling.
# Remove outliers using z-scores
df_no_outliers = df[(df['Values'] >= mean_val - 2 * std_dev) & (df['Values'] <=
mean_val + 2 * std_dev)]
print("DataFrame after removing outliers:")
print(df_no_outliers)
# Transformation to handle positively skewed data
df['Values_log'] = df['Values'].apply(lambda x: 0 if x == 0 else np.log(x))
print("DataFrame after log transformation:")
print(df)
Data Preprocessing
Data preprocessing is a crucial step in data preparation that involves cleaning
and transforming raw data into a format suitable for analysis, modeling, or
machine learning. The purpose of data preprocessing is to enhance data
quality, handle inconsistencies, and create a structured dataset that facilitates
accurate and meaningful analysis.
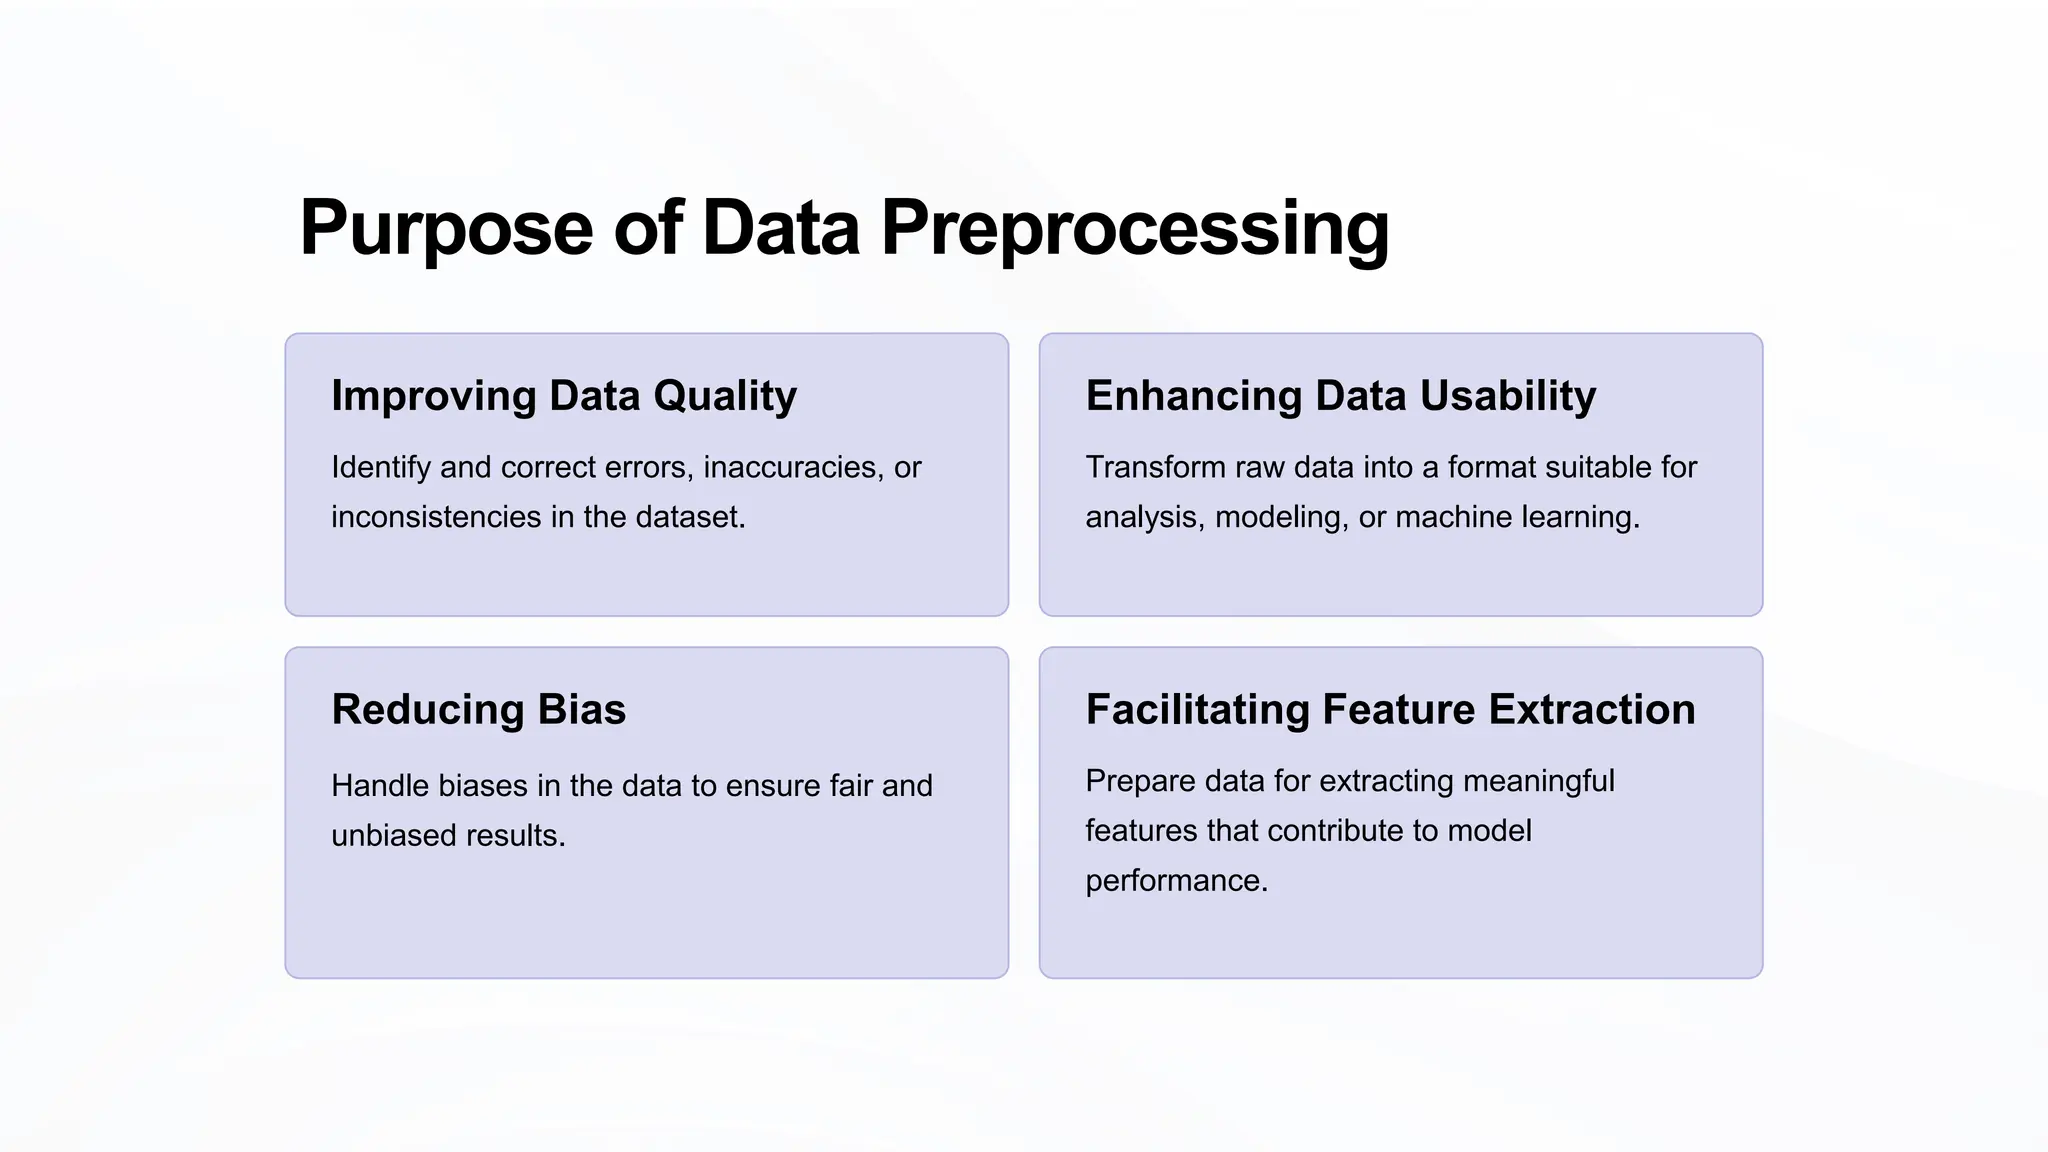
Purpose of Data Preprocessing
Improving Data Quality
Identify and correct errors, inaccuracies, or
inconsistencies in the dataset.
Enhancing Data Usability
Transform raw data into a format suitable for
analysis, modeling, or machine learning.
Reducing Bias
Handle biases in the data to ensure fair and
unbiased results.
Facilitating Feature Extraction
Prepare data for extracting meaningful
features that contribute to model
performance.
Key Steps in Data Preprocessing
Handling Missing Values:
Identify and handle missing values using
methods like imputation or removal.
Standardizing Formatting:
Standardize data formats, such as date
formats or units, to ensure consistency.
Data Transformation:
Apply transformations such as log
transformations or feature engineering
to create informative features.
Dealing Duplicate Records:
Identify and remove duplicate records to
ensure each observation is unique.
Feature Scaling:
Scale numeric features to a standard
range to avoid dominance of certain
features in modeling.
Data Sampling:
If needed, perform data sampling
techniques like random sampling or
stratified sampling.
Handling Outliers:
Detect and handle outliers to prevent them
from unduly influencing analysis or
modeling.
Handling Categorical Data:
Encode categorical variables using
techniques like one-hot encoding or
label encoding.
Data Splitting:
Split the dataset into training and testing
sets for model evaluation.
Feature Scaling
Feature scaling is a preprocessing technique used to standardize the
range of independent variables or features of a dataset. It ensures that
no single feature dominates the others, making the dataset more
amenable to machine learning algorithms that are sensitive to the scale
of input features.
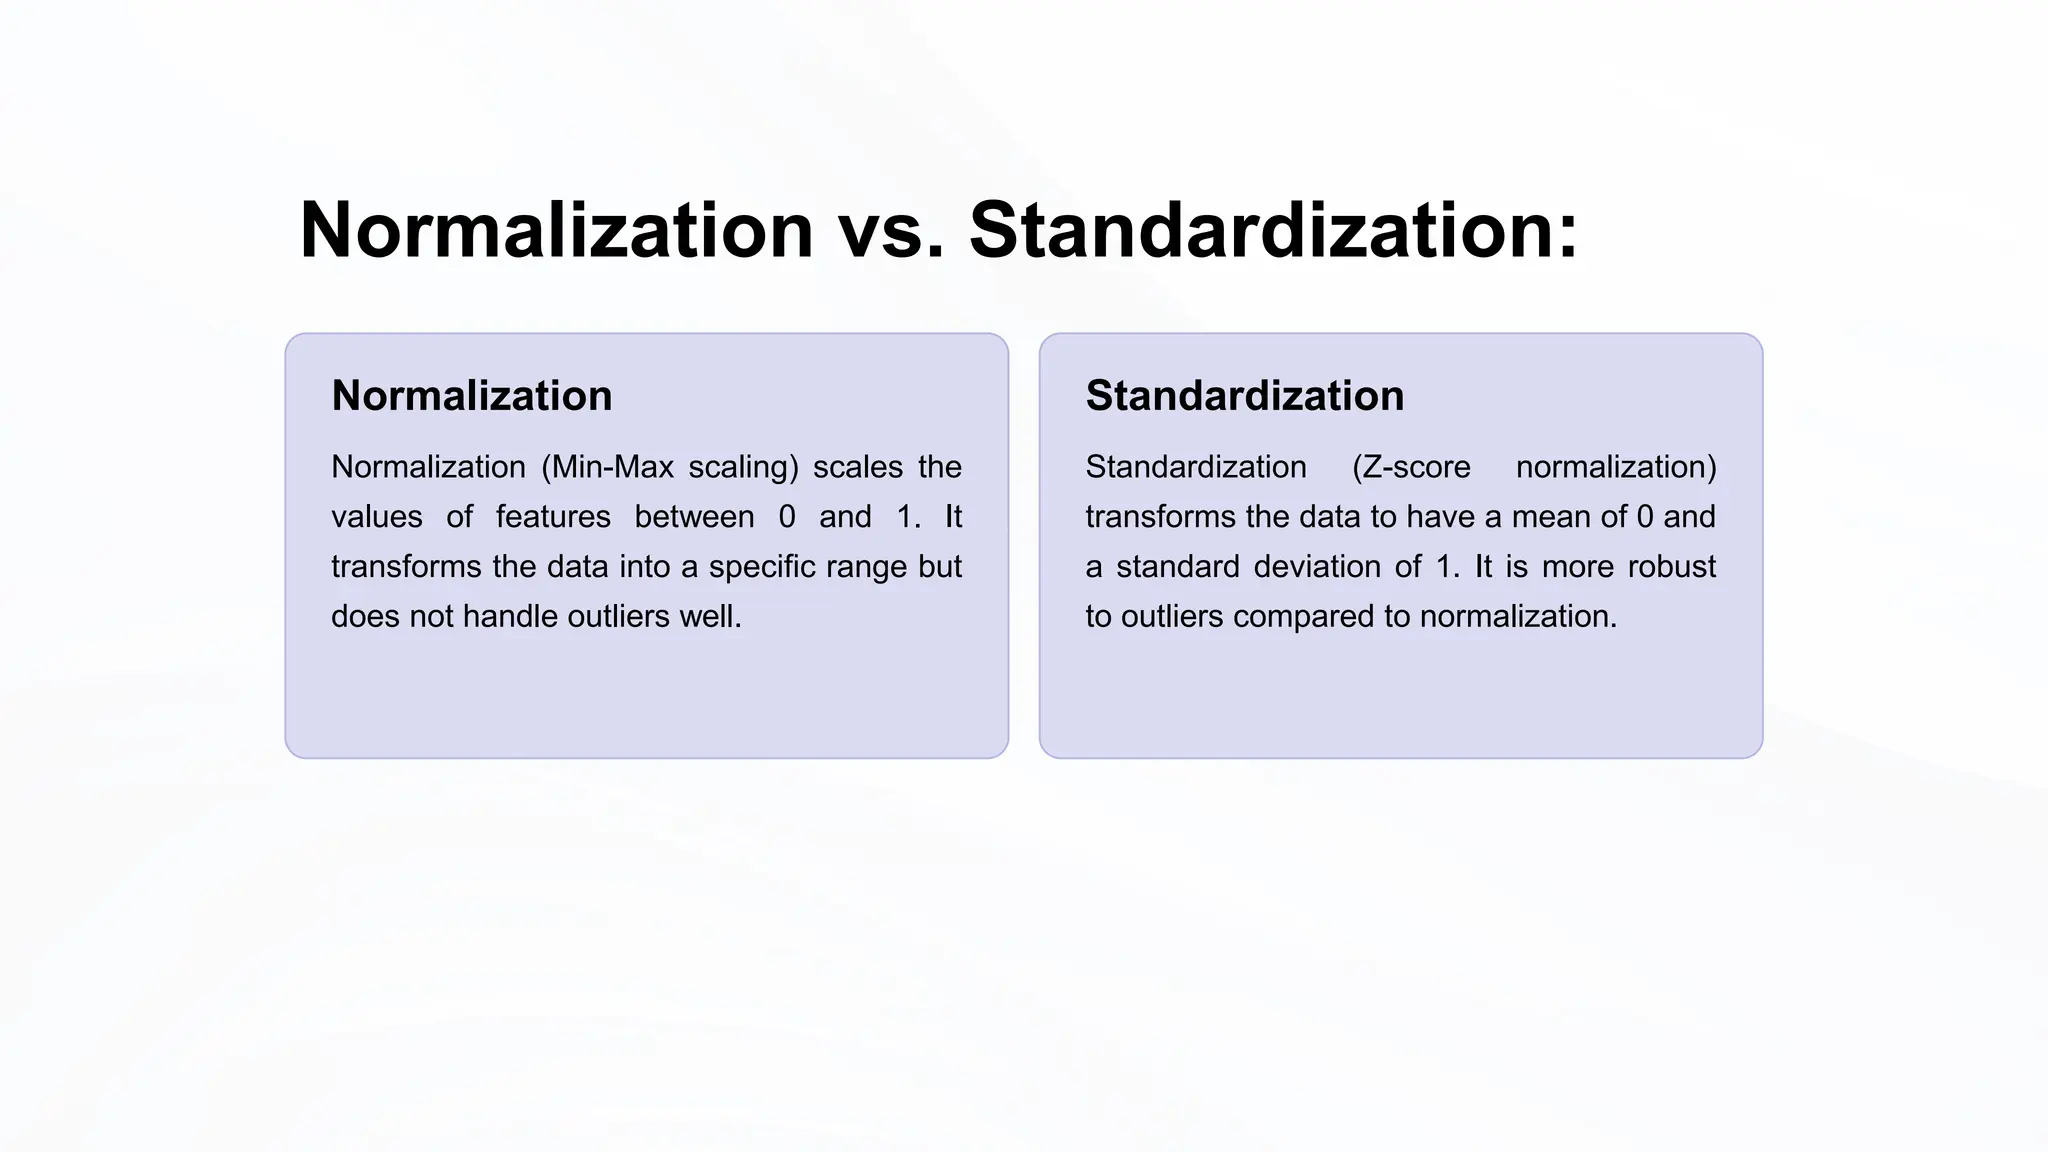
Normalization vs. Standardization:
Normalization
Normalization (Min-Max scaling) scales the
values of features between 0 and 1. It
transforms the data into a specific range but
does not handle outliers well.
Standardization
Standardization (Z-score normalization)
transforms the data to have a mean of 0 and
a standard deviation of 1. It is more robust
to outliers compared to normalization.
Scaling Numeric Features using Pandas:
import pandas as pd
# Creating a DataFrame with numeric features
data = {'Feature1': [10, 20, 15, 25], 'Feature2': [500, 1000, 750, 1250]}
df = pd.DataFrame(data)
# Min-Max scaling using Pandas
df_normalized = (df - df.min()) / (df.max() - df.min())
print("Original DataFrame:")
print(df)
print("nDataFrame after Min-Max scaling (Normalization):")
print(df_normalized)
Min-Max Scaling (Normalization)
Scaling Numeric Features using Pandas:
import pandas as pd
# Creating a DataFrame with numeric features
data = {'Feature1': [10, 20, 15, 25], 'Feature2': [500, 1000, 750, 1250]}
df = pd.DataFrame(data)
# Z-score normalization using Pandas
df_standardized = (df - df.mean()) / df.std()
print("Original DataFrame:")
print(df)
print("nDataFrame after Z-score normalization (Standardization):")
print(df_standardized)
Z-score Normalization (Standardization)
Handling Categorical
Data
Categorical data represents variables that can take on a limited and
usually fixed number of values, often representing categories. Handling
categorical data involves encoding these variables into a format suitable
for machine learning models.
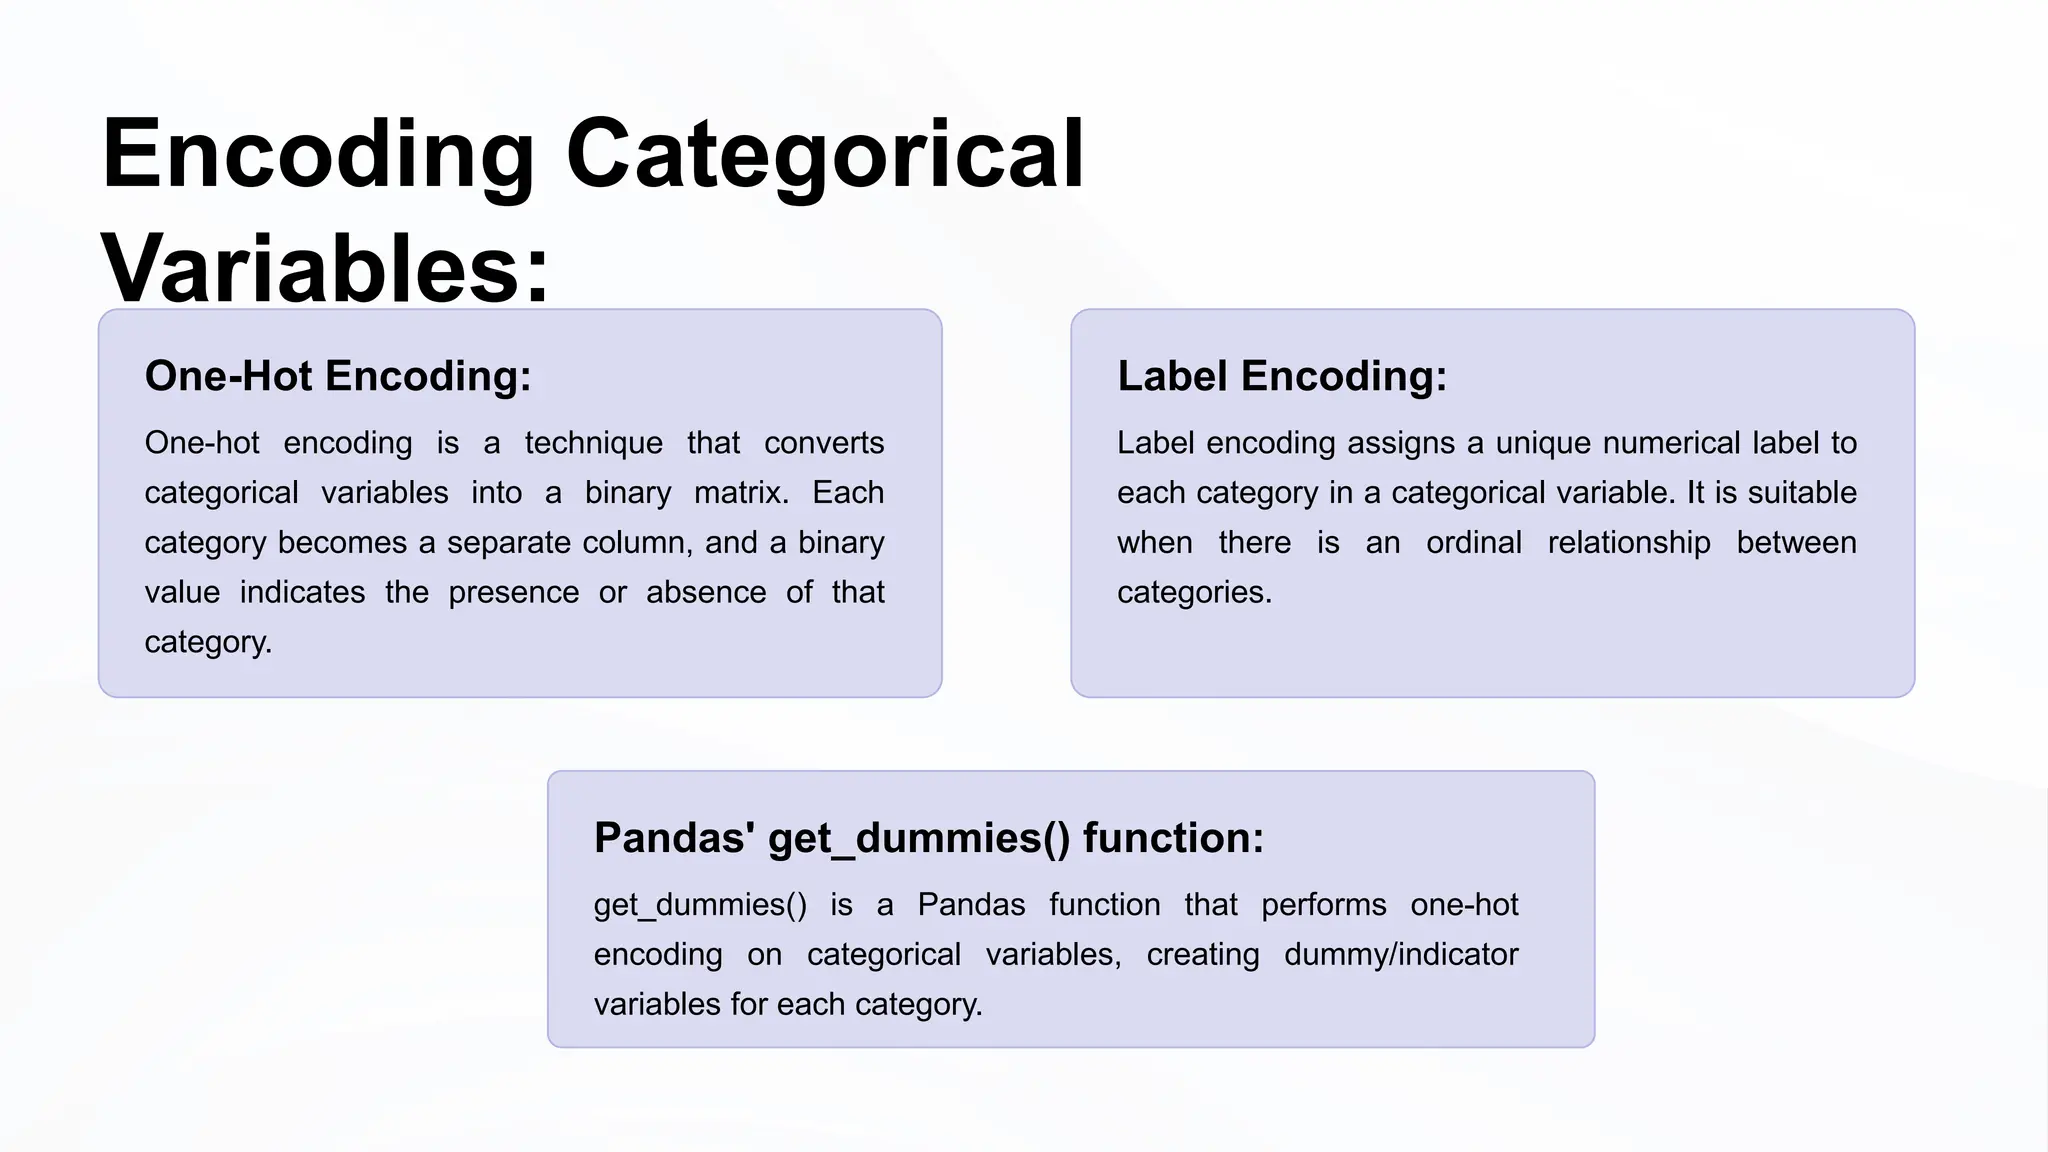
Encoding Categorical
Variables:
One-Hot Encoding:
One-hot encoding is a technique that converts
categorical variables into a binary matrix. Each
category becomes a separate column, and a binary
value indicates the presence or absence of that
category.
Pandas' get_dummies() function:
get_dummies() is a Pandas function that performs one-hot
encoding on categorical variables, creating dummy/indicator
variables for each category.
Label Encoding:
Label encoding assigns a unique numerical label to
each category in a categorical variable. It is suitable
when there is an ordinal relationship between
categories.
Data Transformation
Log Transformation:
Log transformation involves applying the natural
logarithm to the values of a variable. It is useful for
handling positively skewed data and reducing the
impact of outliers.
Pandas' apply() function:
apply() is a Pandas function that applies a function along the axis
of a DataFrame. It can be used for custom transformations on
data.
Handling Skewed Data:
Skewed data refers to a distribution that is not
symmetrical. Handling skewed data involves
transforming it to achieve a more normal
distribution.
Data Sampling
Importance of Sampling
Data sampling is the process of selecting a subset
of data from a larger dataset. It is crucial for tasks
like model training and evaluation, especially when
dealing with large datasets.
Pandas' sample() method
sample() is a Pandas method that is used to
randomly select a specified number of rows or a
fraction of rows from a DataFrame.
Data Splitting (Training and Testing Data)
Data splitting involves dividing a dataset into two parts: a training set used to train a machine learning model and a
testing set used to evaluate the model's performance on unseen data.
Using Pandas for Data Splitting
import pandas as pd
from sklearn.model_selection import train_test_split
# Creating a DataFrame
data = {'Feature1': [1, 2, 3, 4, 5], 'Target': [0, 1, 0, 1, 0]}
df = pd.DataFrame(data)
# Splitting data into features (X) and target variable (y)
X = df[['Feature1']]
y = df['Target']
# Using train_test_split for data splitting
X_train, X_test, y_train, y_test = train_test_split(X, y, test_size=0.2, random_state=42)
print("Training Data:")
print(X_train, y_train)
print("nTesting Data:")
print(X_test, y_test)

Pandas Data Cleaning and Preprocessing PPT.pptx

  • 1.
  • 2.
    Data Cleaning • Datapreprocessing involves a broader set of activities that prepare raw data for analysis. It includes cleaning, but also encompasses tasks such as feature scaling, handling categorical variables, data transformation, and splitting data into training and testing sets. The purpose is to make the data more suitable for machine learning algorithms and statistical analysis. Data Preprocessing • Data cleaning, also known as data cleansing or scrubbing, is the process of identifying and correcting errors or inconsistencies in datasets. It involves handling missing values, removing duplicates, correcting inaccuracies, and ensuring data consistency. The goal is to improve the quality and reliability of the data, making it suitable for analysis.
  • 3.
    Importance of DataQuality: 1 Reliable Insights High-quality data ensures that the insights and conclusions drawn from the analysis are reliable. Inaccuracies or inconsistencies in the data can lead to incorrect interpretations. 2 Better Decision-Making Organizations rely on data-driven decision- making. Clean and high-quality data provides a solid foundation for making informed and effective decisions. 3 Trust in Analytics Stakeholders and decision-makers must trust the data used in analytics. Quality data instills confidence in the results and recommendations generated by analytical models. 4 Avoiding Bias Biased or incomplete data can lead to biased results. Data quality is crucial to avoid reinforcing existing biases and to ensure fairness in decision-making processes.
  • 4.
    Roles in DataAnalytics and Machine Learning 1 Improved Model Performance Clean and preprocessed data is essential for training accurate machine learning models. It helps models generalize well to new, unseen data, improving their performance. 2 Feature Engineering Data preprocessing includes feature scaling, handling categorical variables, and transforming data. These activities contribute to creating meaningful features, enhancing the model's ability to capture patterns. 3 Efficient Analysis Clean data accelerates the analysis process. Analysts and data scientists can focus on extracting insights rather than dealing with data inconsistencies. 4 Enhanced Interpretability Well-preprocessed data leads to models that are easier to interpret. This is crucial for understanding the factors influencing predictions or outcomes.
  • 5.
    Key Concepts inArtificial Intelligence Machine Perception 📷 AI systems can perceive and interpret the world through computer vision, speech recognition, and natural language processing. Knowledge Representation and Reasoning 📚 AI uses techniques to represent and store knowledge and apply logical reasoning to solve complex problems. Planning and Decision Making 🧭 AI systems can plan sequences of actions and make optimal decisions by considering various factors and constraints.
  • 6.
    Applications of MachineLearning Recommendation Systems ML algorithms personalize recommendations on platforms like Netflix and Amazon. Speech Recognition ML techniques transcribe speech into text and power voice-controlled systems. Image Classification ML models identify objects, scenes, and people in images for various applications.
  • 7.
    Data Cleaning Data cleaningmeans fixing bad data in your data set. Bad data could be: • Empty cells • Data in wrong format • Wrong data • Duplicates
  • 8.
    Remove Rows new_df =df.dropna() print(new_df.to_string()) Remove all Rows with NULL Values df.dropna(inplace = True) Remove NULL Values with 200 df.fillna(200, inplace = True)
  • 9.
    Remove NULL valuesin Specific Co df[“col_name"].fillna(130, inplace = True) Replace using Mean, Median and M df[" col_name "].fillna(df[" col_name "].mean(), inplace = True) df[" col_name "].fillna(df[" col_name "].median(), inplace = True) df[" col_name "].fillna(df[" col_name "].mode()[0], inplace = True) Convert into a Correct Format pd.to_datetime(df['Date'])
  • 10.
  • 11.
    Dealing with Outliers Outliersare data points that significantly deviate from the rest of the dataset. Dealing with outliers involves identifying them, understanding their impact, and deciding whether to remove or transform them.
  • 12.
    Identifying Outliers using DescriptiveStatistics Descriptive statistics, such as mean, median, and standard deviation, can be used to identify outliers. Data points that fall far from the mean or median may be considered outliers. import pandas as pd # Creating a DataFrame with outliers data = {'Values': [1, 2, 3, 20, 25, 30, 35, 40]} df = pd.DataFrame(data) # Calculate mean and standard deviation mean_val = df['Values'].mean() std_dev = df['Values'].std() # Identify outliers based on z-scores outliers = df[(df['Values'] < mean_val - 2 * std_dev) | (df['Values'] > mean_val + 2 * std_dev)] print("Original DataFrame:") print(df) print("nOutliers identified using descriptive statistics:")
  • 13.
    Handling Outliers (Removing or Transforming) Handlingoutliers involves deciding whether to remove them or transform them to mitigate their impact on analysis or modeling. # Remove outliers using z-scores df_no_outliers = df[(df['Values'] >= mean_val - 2 * std_dev) & (df['Values'] <= mean_val + 2 * std_dev)] print("DataFrame after removing outliers:") print(df_no_outliers) # Transformation to handle positively skewed data df['Values_log'] = df['Values'].apply(lambda x: 0 if x == 0 else np.log(x)) print("DataFrame after log transformation:") print(df)
  • 14.
    Data Preprocessing Data preprocessingis a crucial step in data preparation that involves cleaning and transforming raw data into a format suitable for analysis, modeling, or machine learning. The purpose of data preprocessing is to enhance data quality, handle inconsistencies, and create a structured dataset that facilitates accurate and meaningful analysis.
  • 15.
    Purpose of DataPreprocessing Improving Data Quality Identify and correct errors, inaccuracies, or inconsistencies in the dataset. Enhancing Data Usability Transform raw data into a format suitable for analysis, modeling, or machine learning. Reducing Bias Handle biases in the data to ensure fair and unbiased results. Facilitating Feature Extraction Prepare data for extracting meaningful features that contribute to model performance.
  • 16.
    Key Steps inData Preprocessing Handling Missing Values: Identify and handle missing values using methods like imputation or removal. Standardizing Formatting: Standardize data formats, such as date formats or units, to ensure consistency. Data Transformation: Apply transformations such as log transformations or feature engineering to create informative features. Dealing Duplicate Records: Identify and remove duplicate records to ensure each observation is unique. Feature Scaling: Scale numeric features to a standard range to avoid dominance of certain features in modeling. Data Sampling: If needed, perform data sampling techniques like random sampling or stratified sampling. Handling Outliers: Detect and handle outliers to prevent them from unduly influencing analysis or modeling. Handling Categorical Data: Encode categorical variables using techniques like one-hot encoding or label encoding. Data Splitting: Split the dataset into training and testing sets for model evaluation.
  • 17.
    Feature Scaling Feature scalingis a preprocessing technique used to standardize the range of independent variables or features of a dataset. It ensures that no single feature dominates the others, making the dataset more amenable to machine learning algorithms that are sensitive to the scale of input features.
  • 18.
    Normalization vs. Standardization: Normalization Normalization(Min-Max scaling) scales the values of features between 0 and 1. It transforms the data into a specific range but does not handle outliers well. Standardization Standardization (Z-score normalization) transforms the data to have a mean of 0 and a standard deviation of 1. It is more robust to outliers compared to normalization.
  • 19.
    Scaling Numeric Featuresusing Pandas: import pandas as pd # Creating a DataFrame with numeric features data = {'Feature1': [10, 20, 15, 25], 'Feature2': [500, 1000, 750, 1250]} df = pd.DataFrame(data) # Min-Max scaling using Pandas df_normalized = (df - df.min()) / (df.max() - df.min()) print("Original DataFrame:") print(df) print("nDataFrame after Min-Max scaling (Normalization):") print(df_normalized) Min-Max Scaling (Normalization)
  • 20.
    Scaling Numeric Featuresusing Pandas: import pandas as pd # Creating a DataFrame with numeric features data = {'Feature1': [10, 20, 15, 25], 'Feature2': [500, 1000, 750, 1250]} df = pd.DataFrame(data) # Z-score normalization using Pandas df_standardized = (df - df.mean()) / df.std() print("Original DataFrame:") print(df) print("nDataFrame after Z-score normalization (Standardization):") print(df_standardized) Z-score Normalization (Standardization)
  • 21.
    Handling Categorical Data Categorical datarepresents variables that can take on a limited and usually fixed number of values, often representing categories. Handling categorical data involves encoding these variables into a format suitable for machine learning models.
  • 22.
    Encoding Categorical Variables: One-Hot Encoding: One-hotencoding is a technique that converts categorical variables into a binary matrix. Each category becomes a separate column, and a binary value indicates the presence or absence of that category. Pandas' get_dummies() function: get_dummies() is a Pandas function that performs one-hot encoding on categorical variables, creating dummy/indicator variables for each category. Label Encoding: Label encoding assigns a unique numerical label to each category in a categorical variable. It is suitable when there is an ordinal relationship between categories.
  • 23.
    Data Transformation Log Transformation: Logtransformation involves applying the natural logarithm to the values of a variable. It is useful for handling positively skewed data and reducing the impact of outliers. Pandas' apply() function: apply() is a Pandas function that applies a function along the axis of a DataFrame. It can be used for custom transformations on data. Handling Skewed Data: Skewed data refers to a distribution that is not symmetrical. Handling skewed data involves transforming it to achieve a more normal distribution.
  • 24.
    Data Sampling Importance ofSampling Data sampling is the process of selecting a subset of data from a larger dataset. It is crucial for tasks like model training and evaluation, especially when dealing with large datasets. Pandas' sample() method sample() is a Pandas method that is used to randomly select a specified number of rows or a fraction of rows from a DataFrame. Data Splitting (Training and Testing Data) Data splitting involves dividing a dataset into two parts: a training set used to train a machine learning model and a testing set used to evaluate the model's performance on unseen data.
  • 25.
    Using Pandas forData Splitting import pandas as pd from sklearn.model_selection import train_test_split # Creating a DataFrame data = {'Feature1': [1, 2, 3, 4, 5], 'Target': [0, 1, 0, 1, 0]} df = pd.DataFrame(data) # Splitting data into features (X) and target variable (y) X = df[['Feature1']] y = df['Target'] # Using train_test_split for data splitting X_train, X_test, y_train, y_test = train_test_split(X, y, test_size=0.2, random_state=42) print("Training Data:") print(X_train, y_train) print("nTesting Data:") print(X_test, y_test)