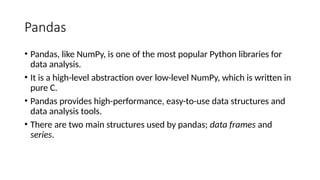
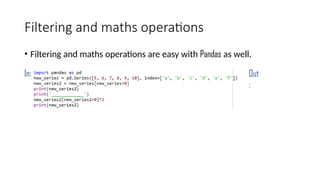
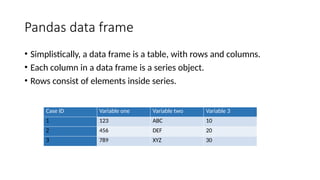
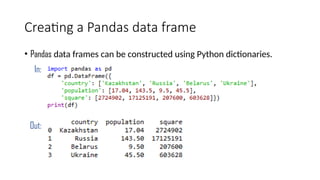
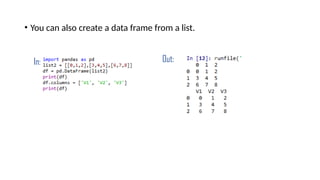
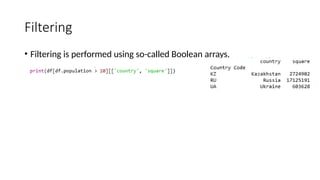
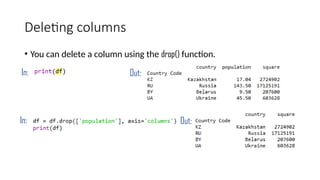
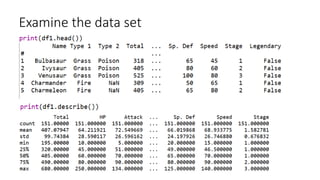
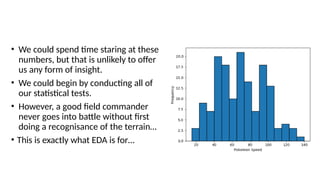
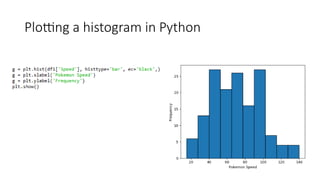
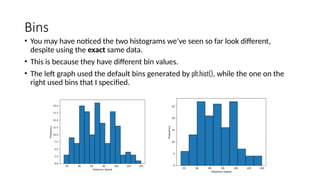
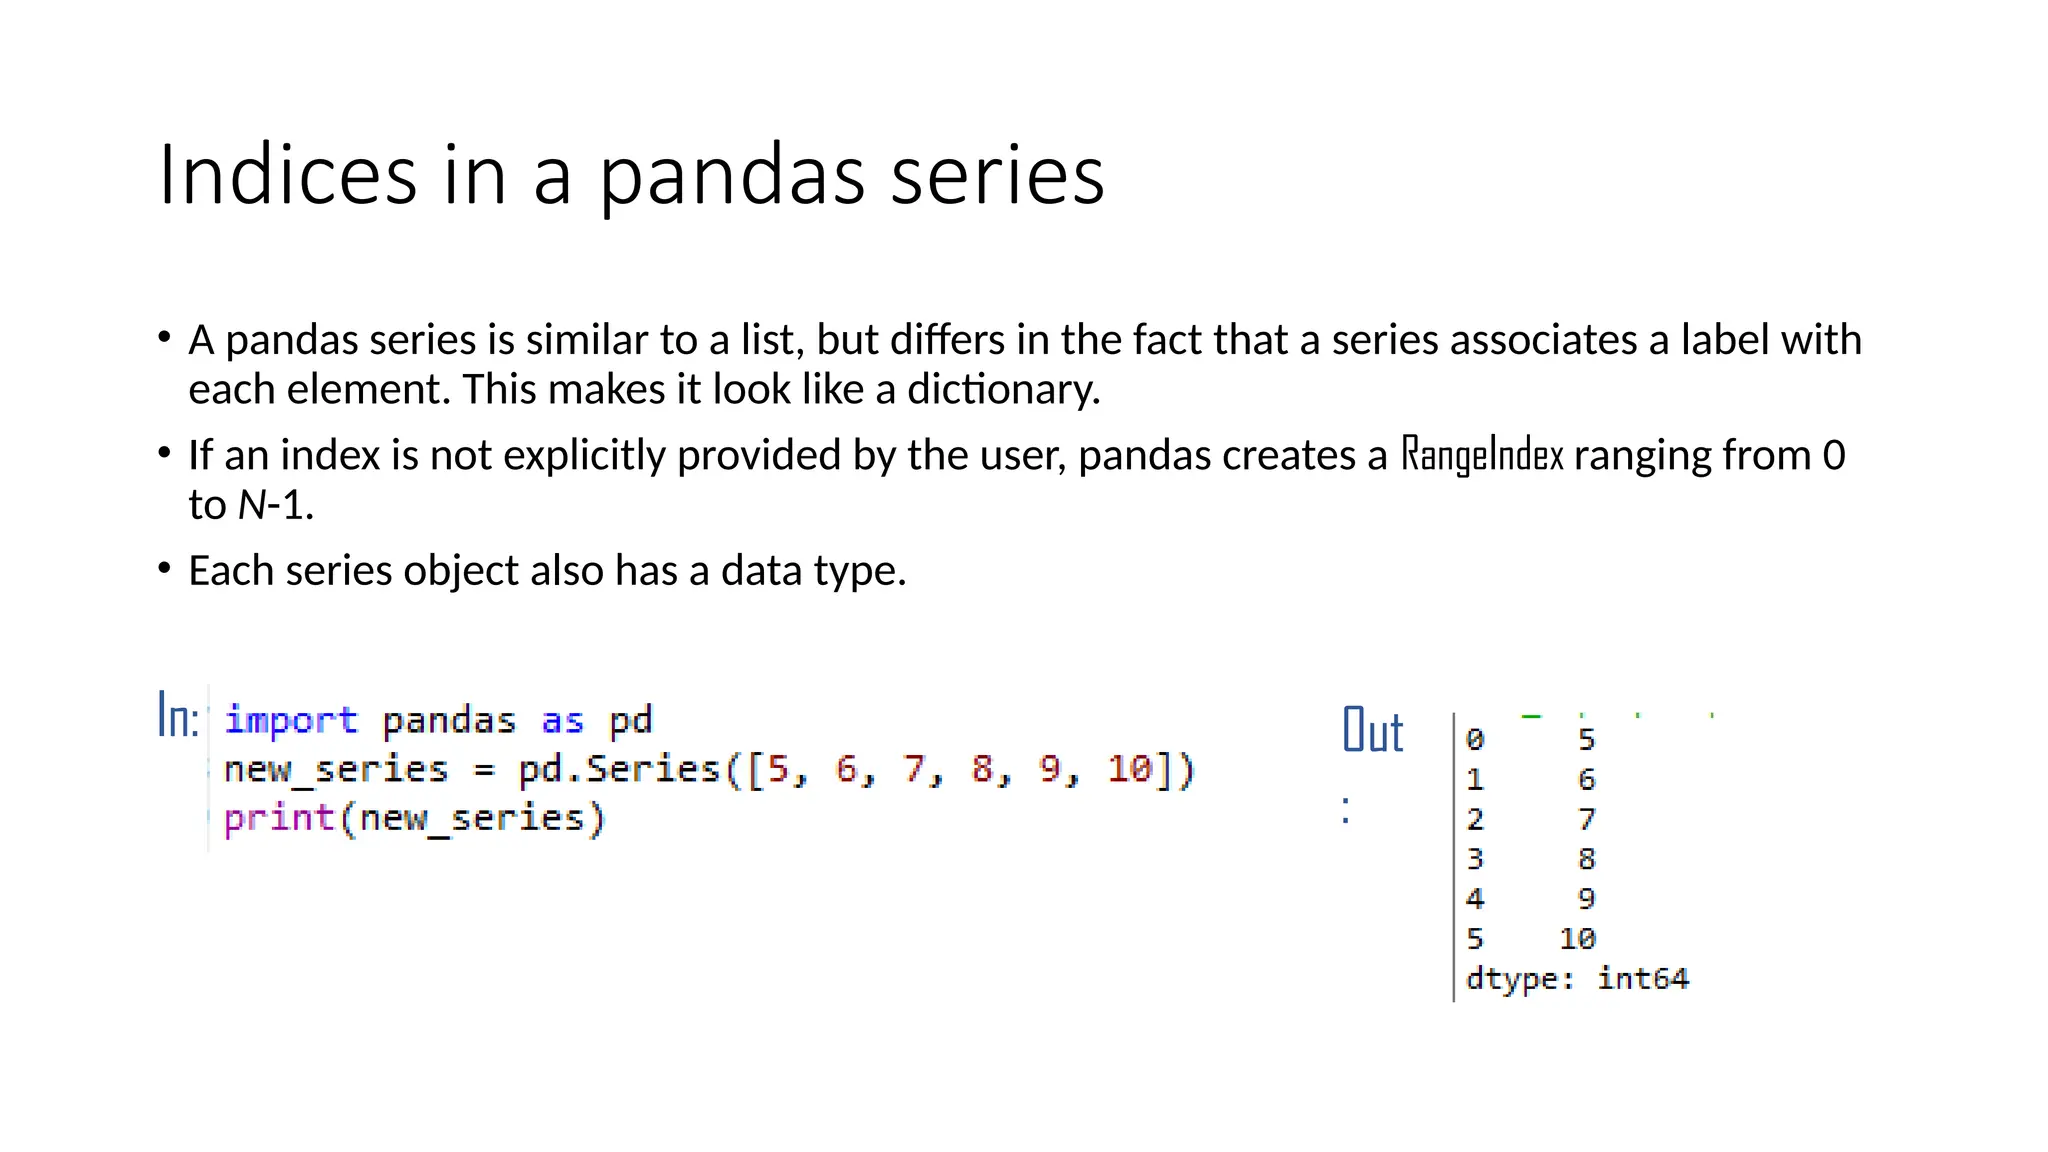
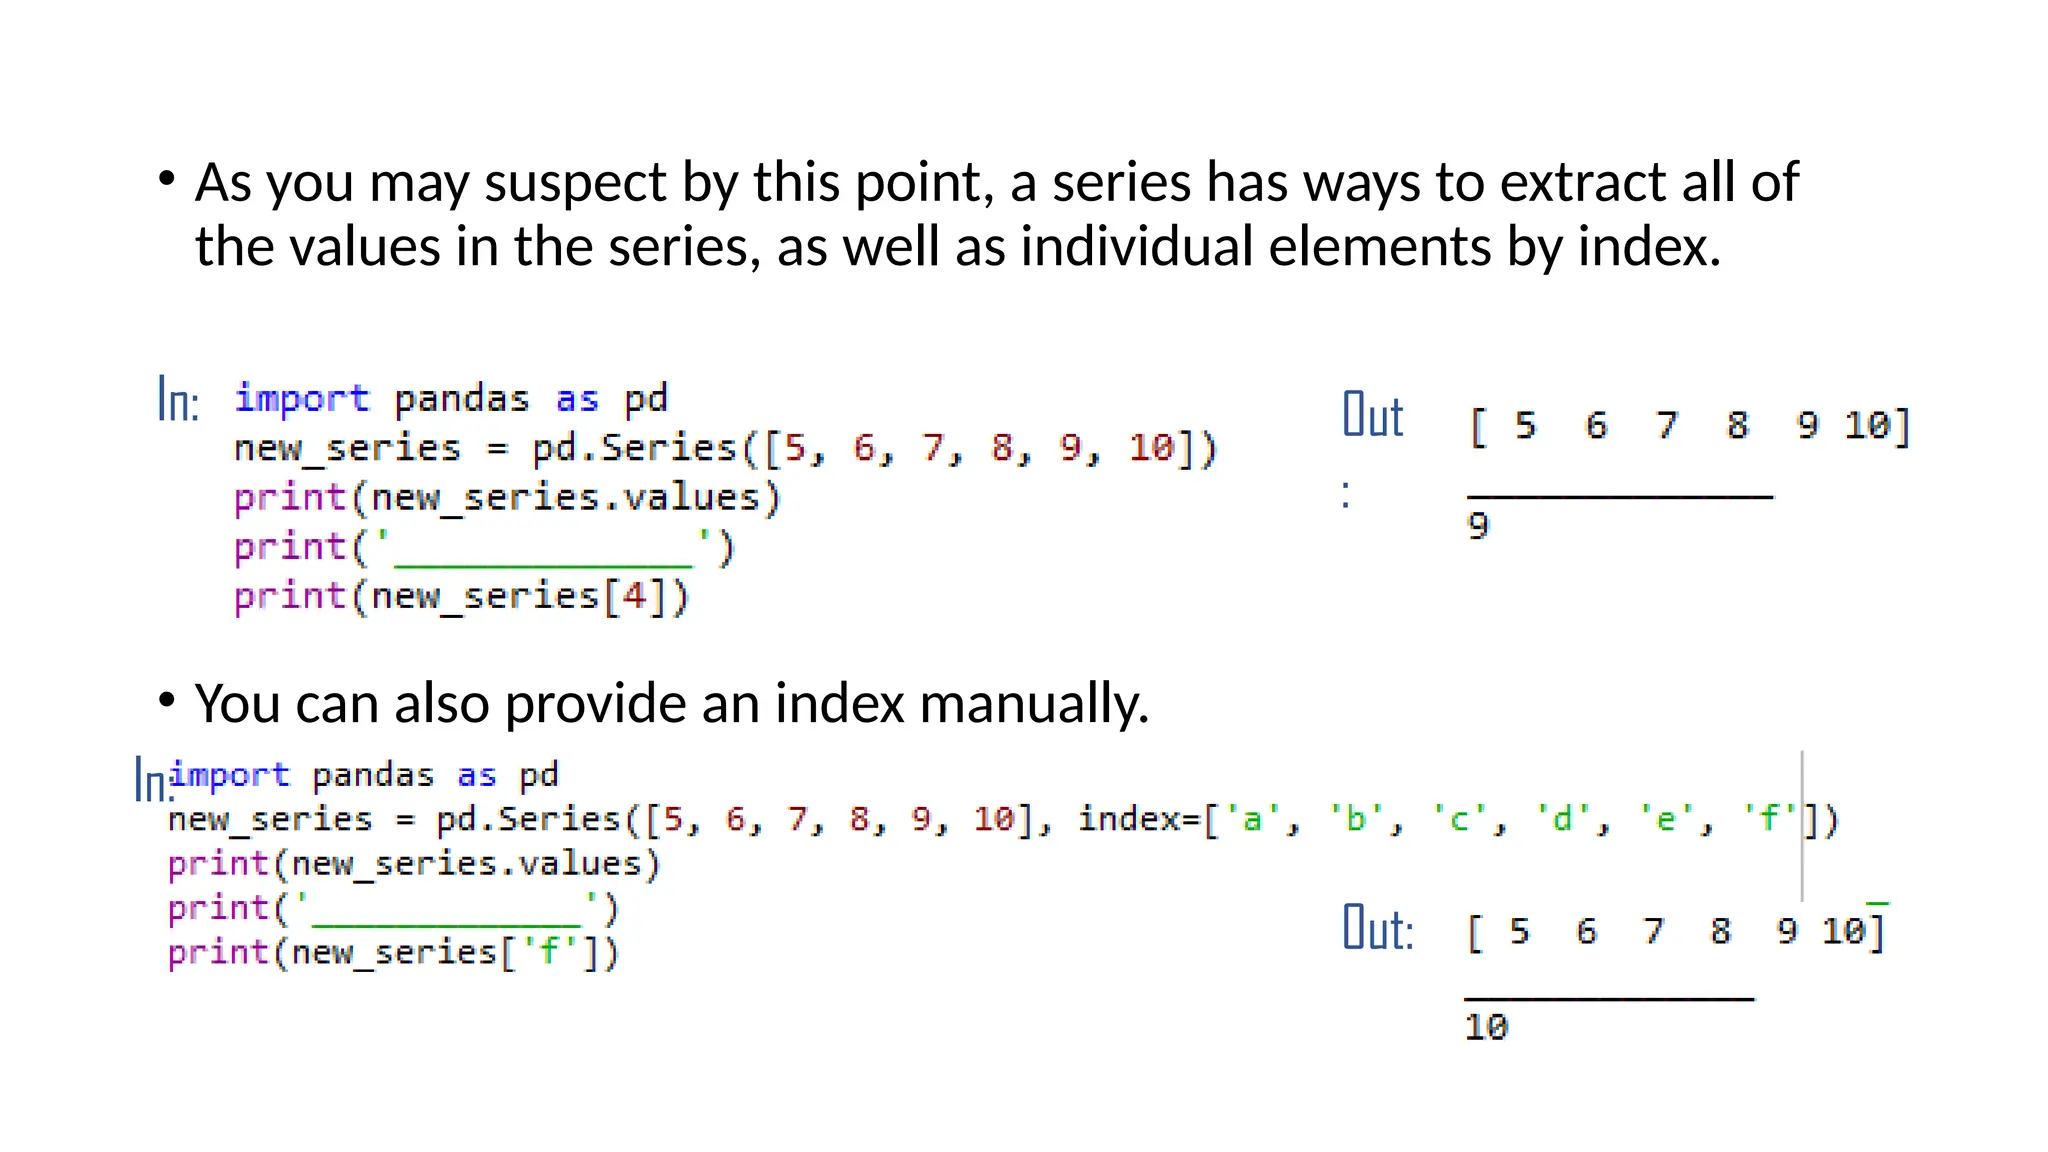
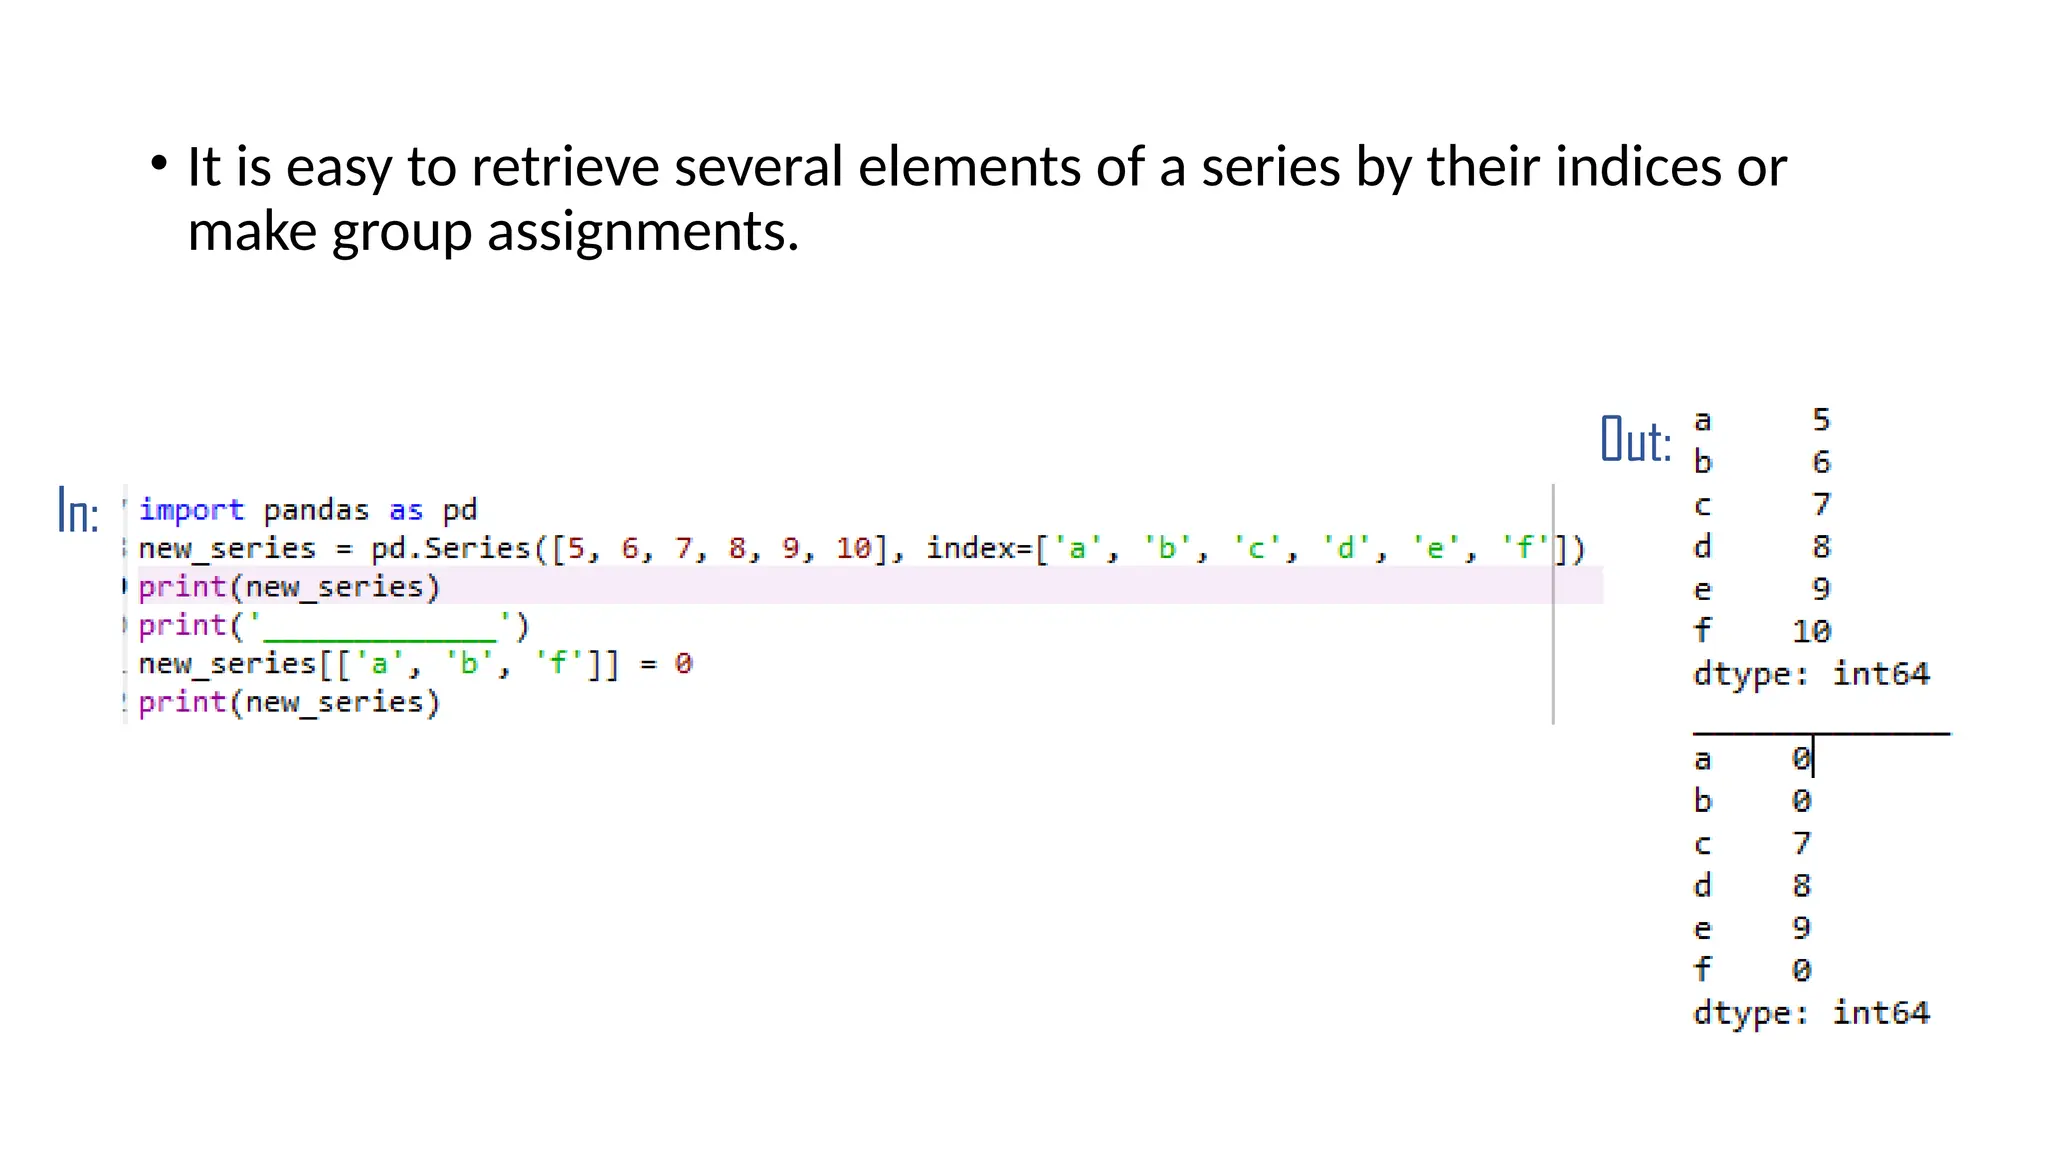
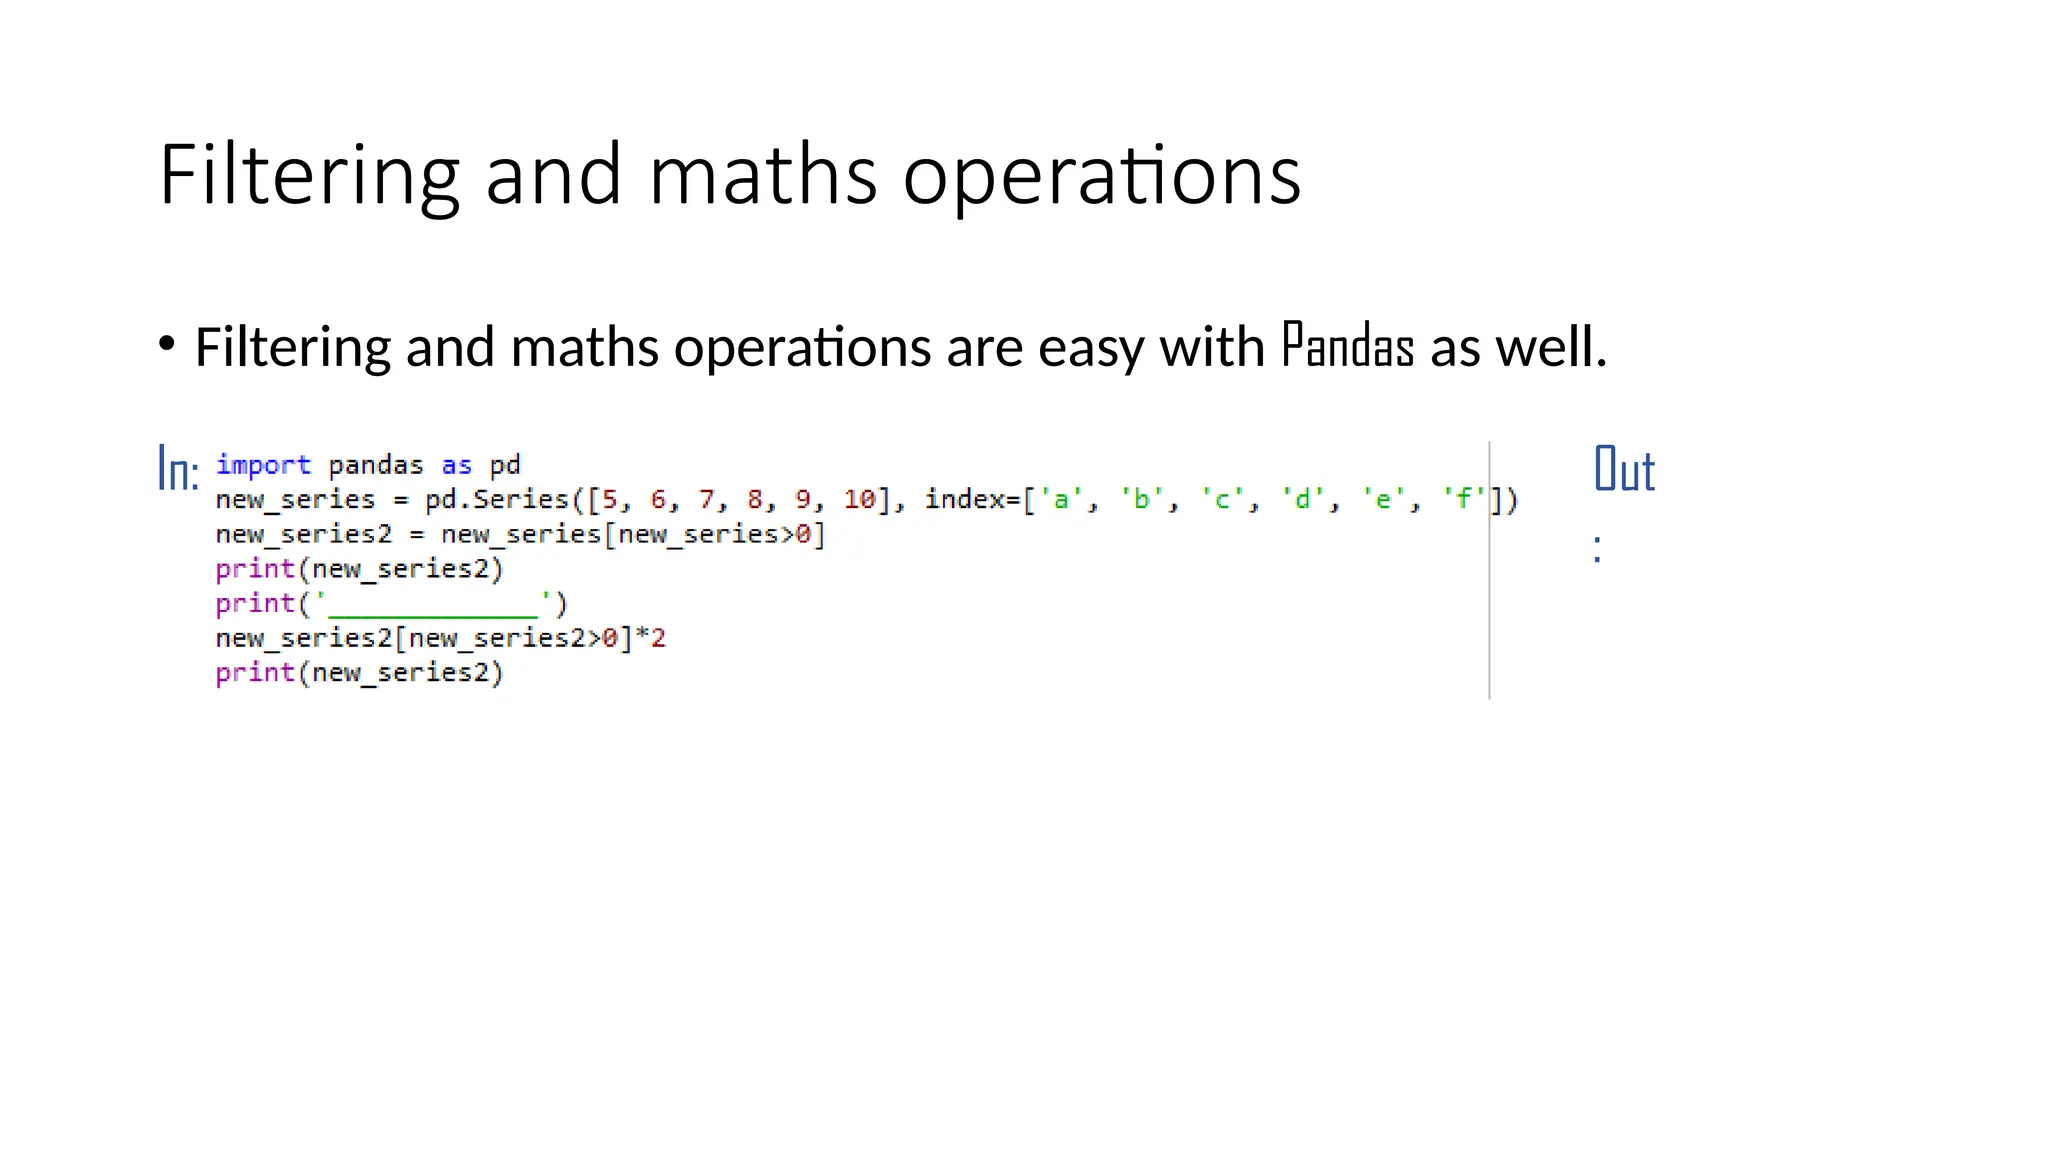
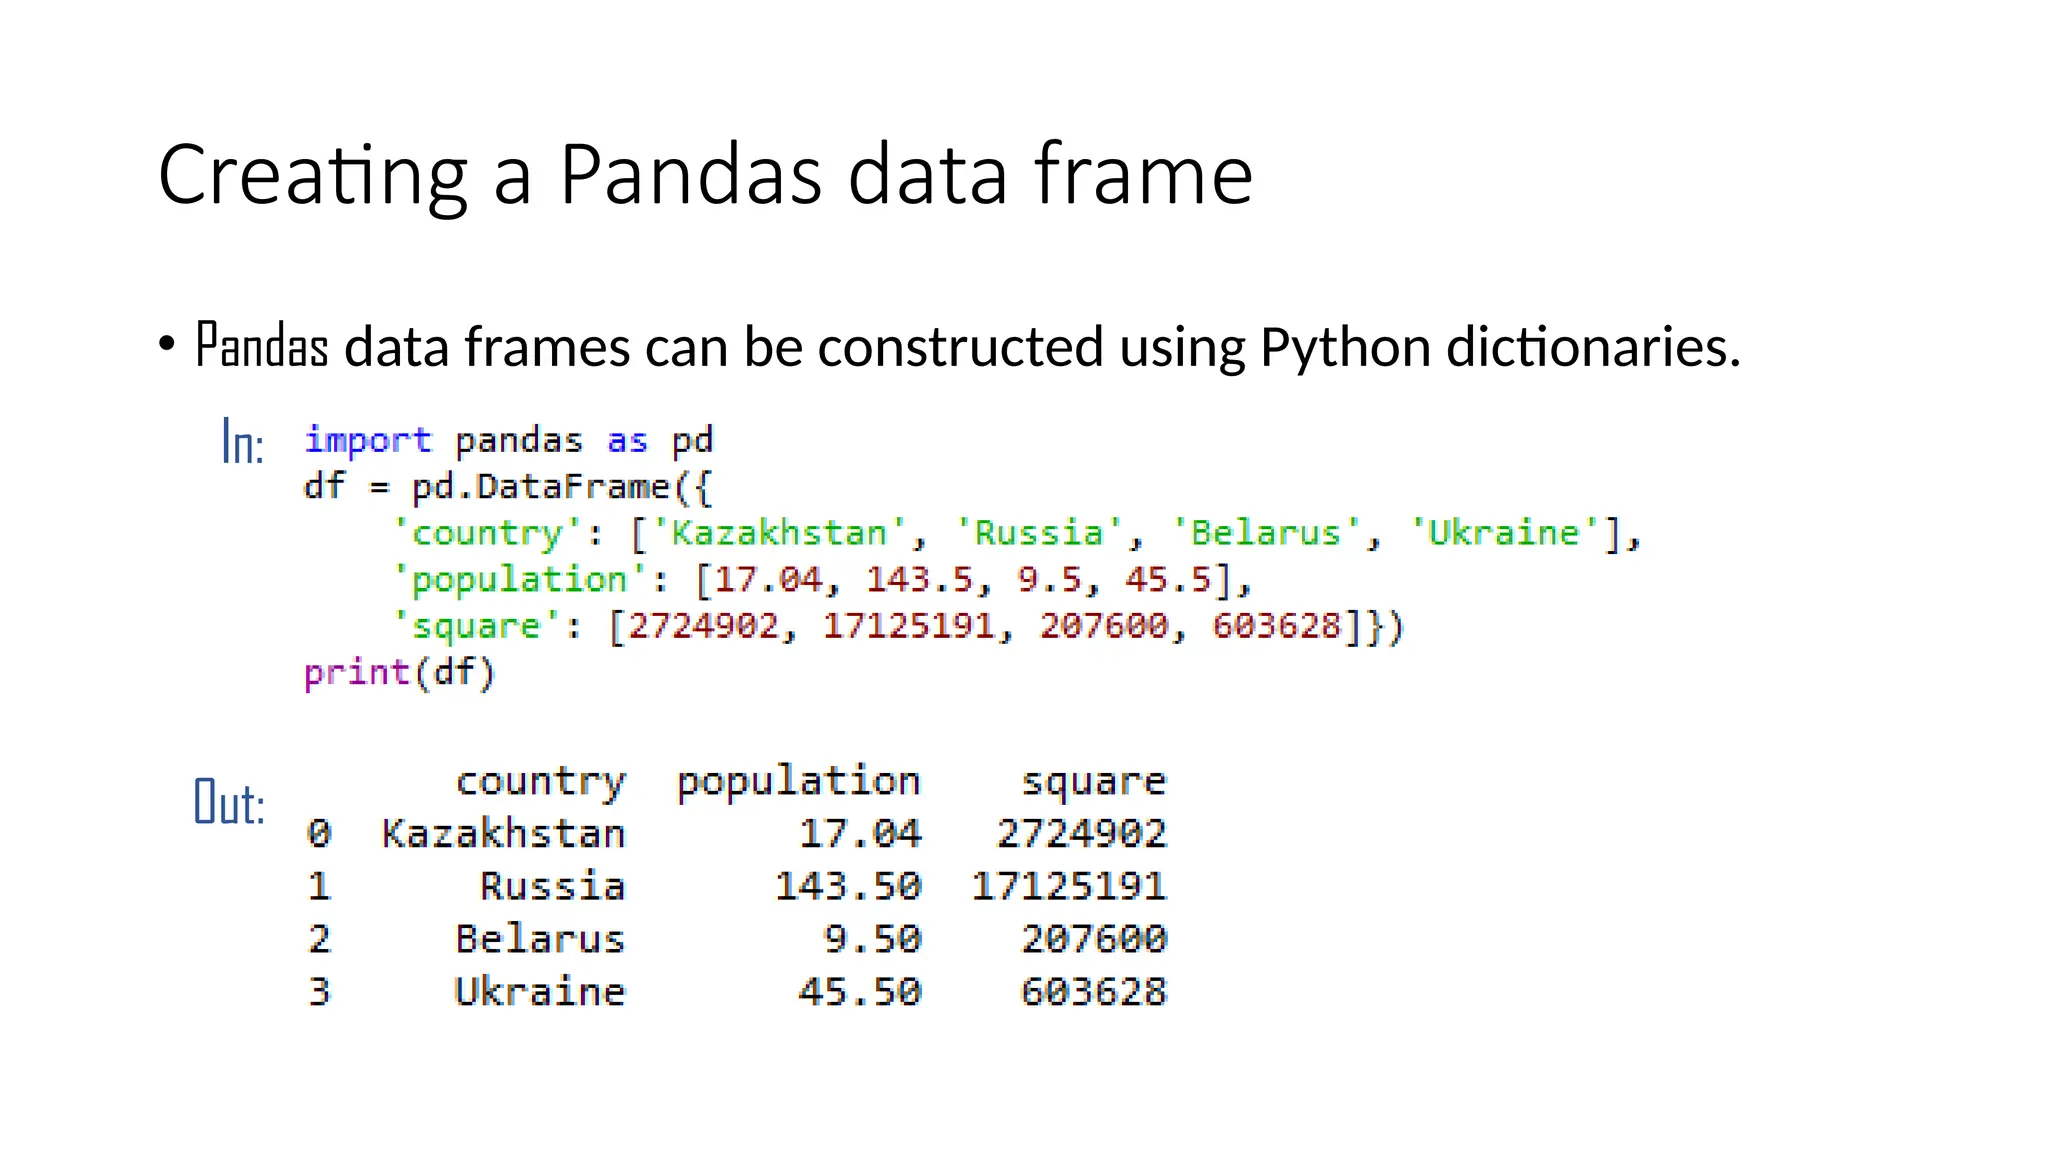
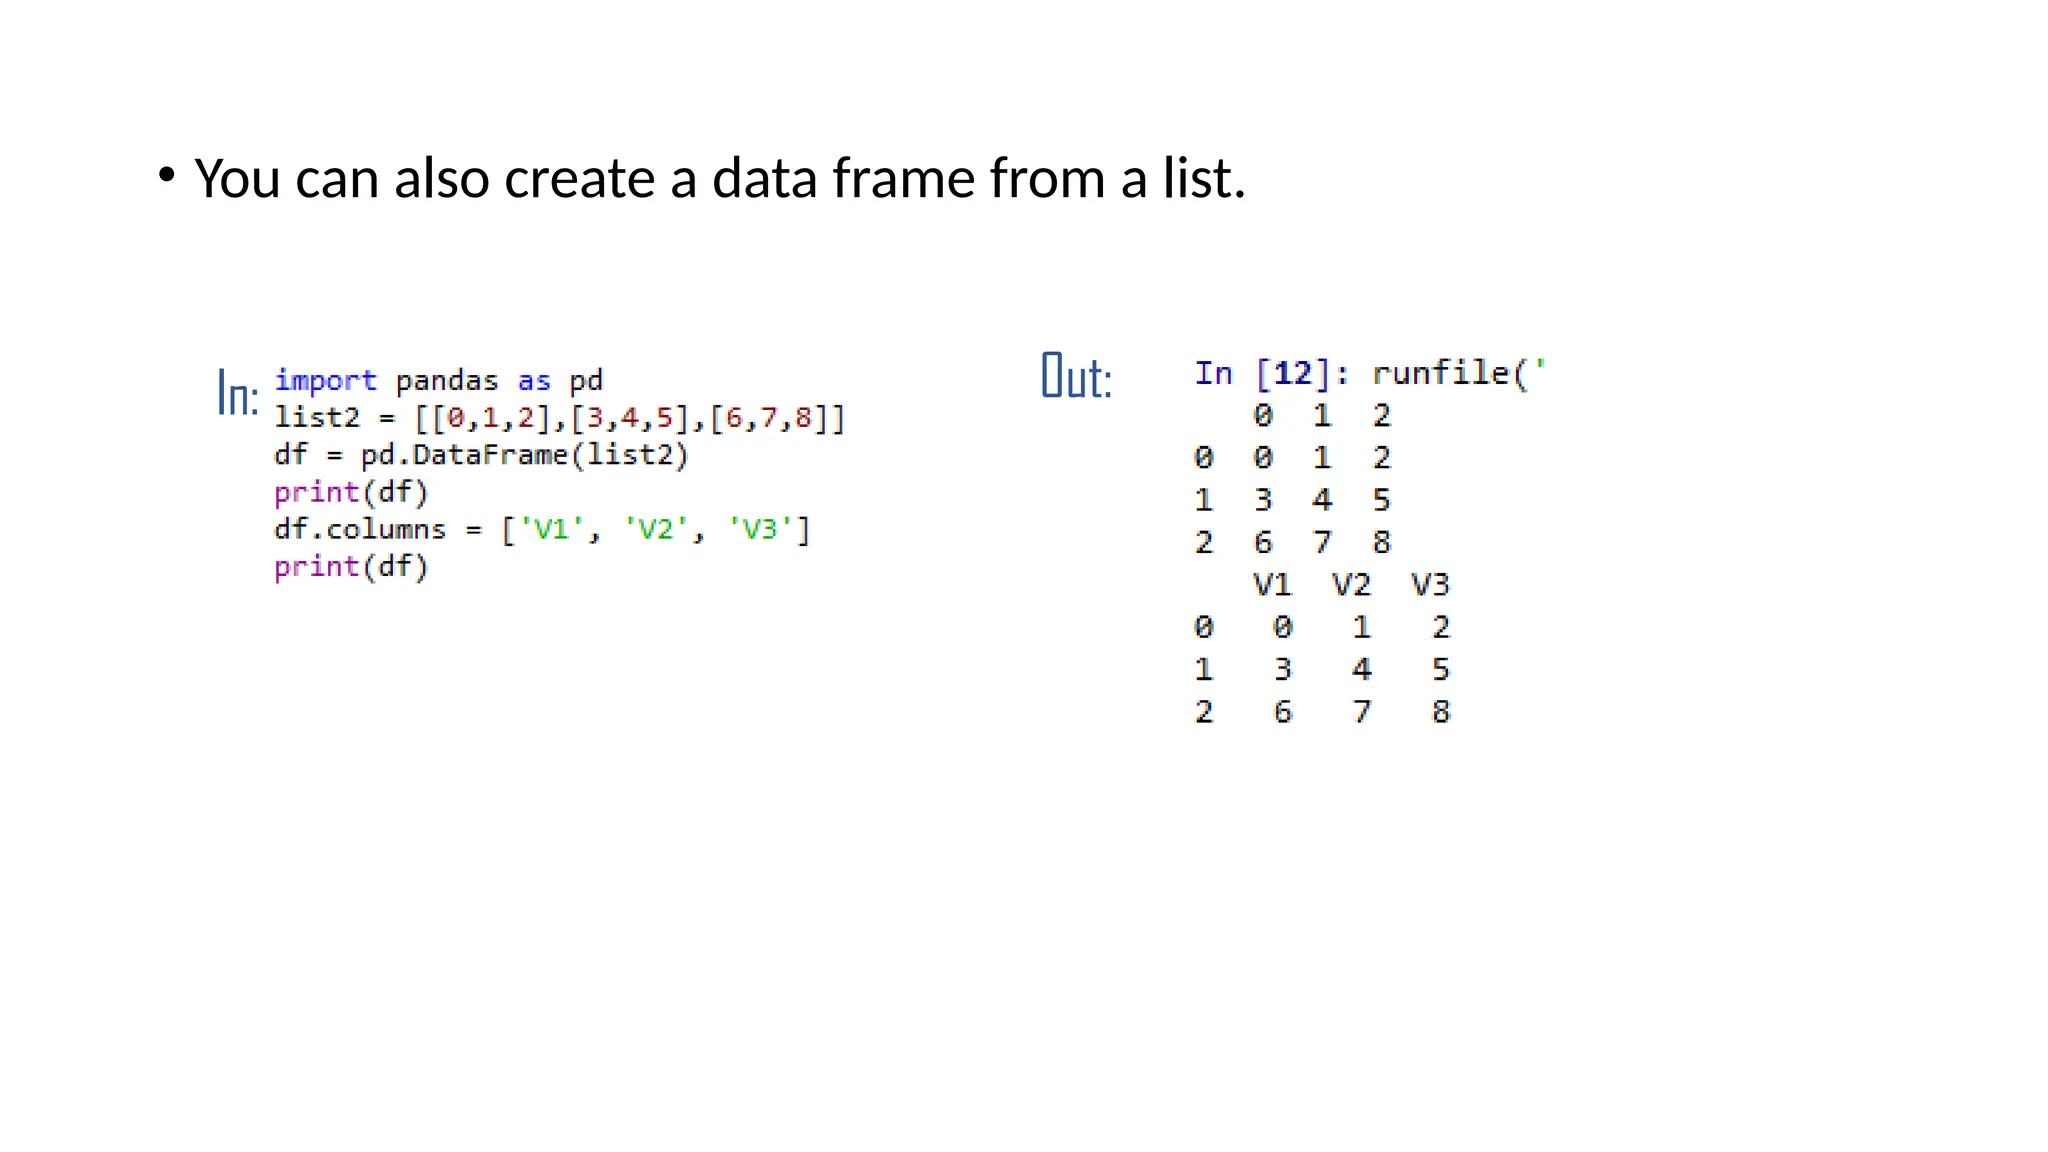
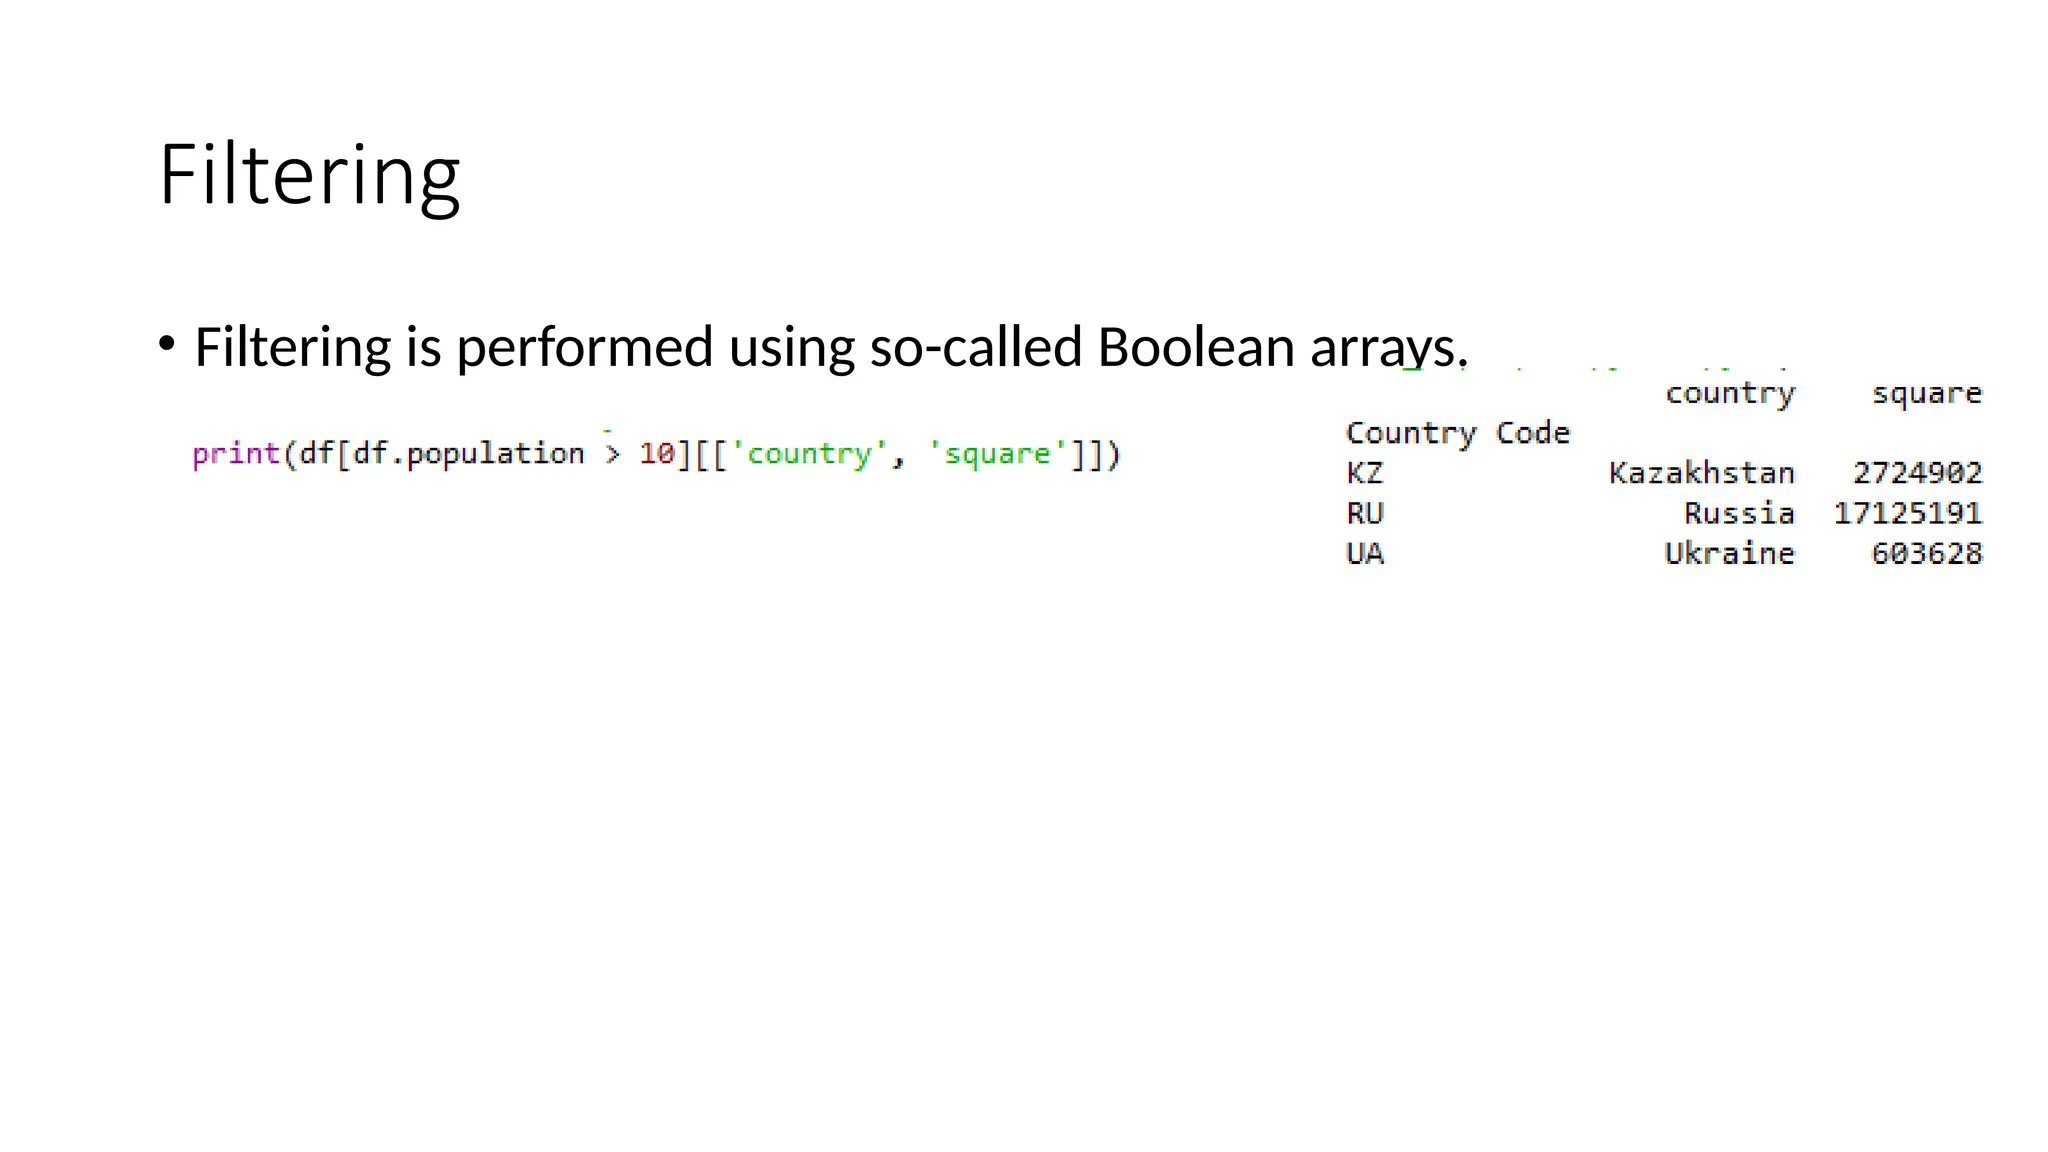
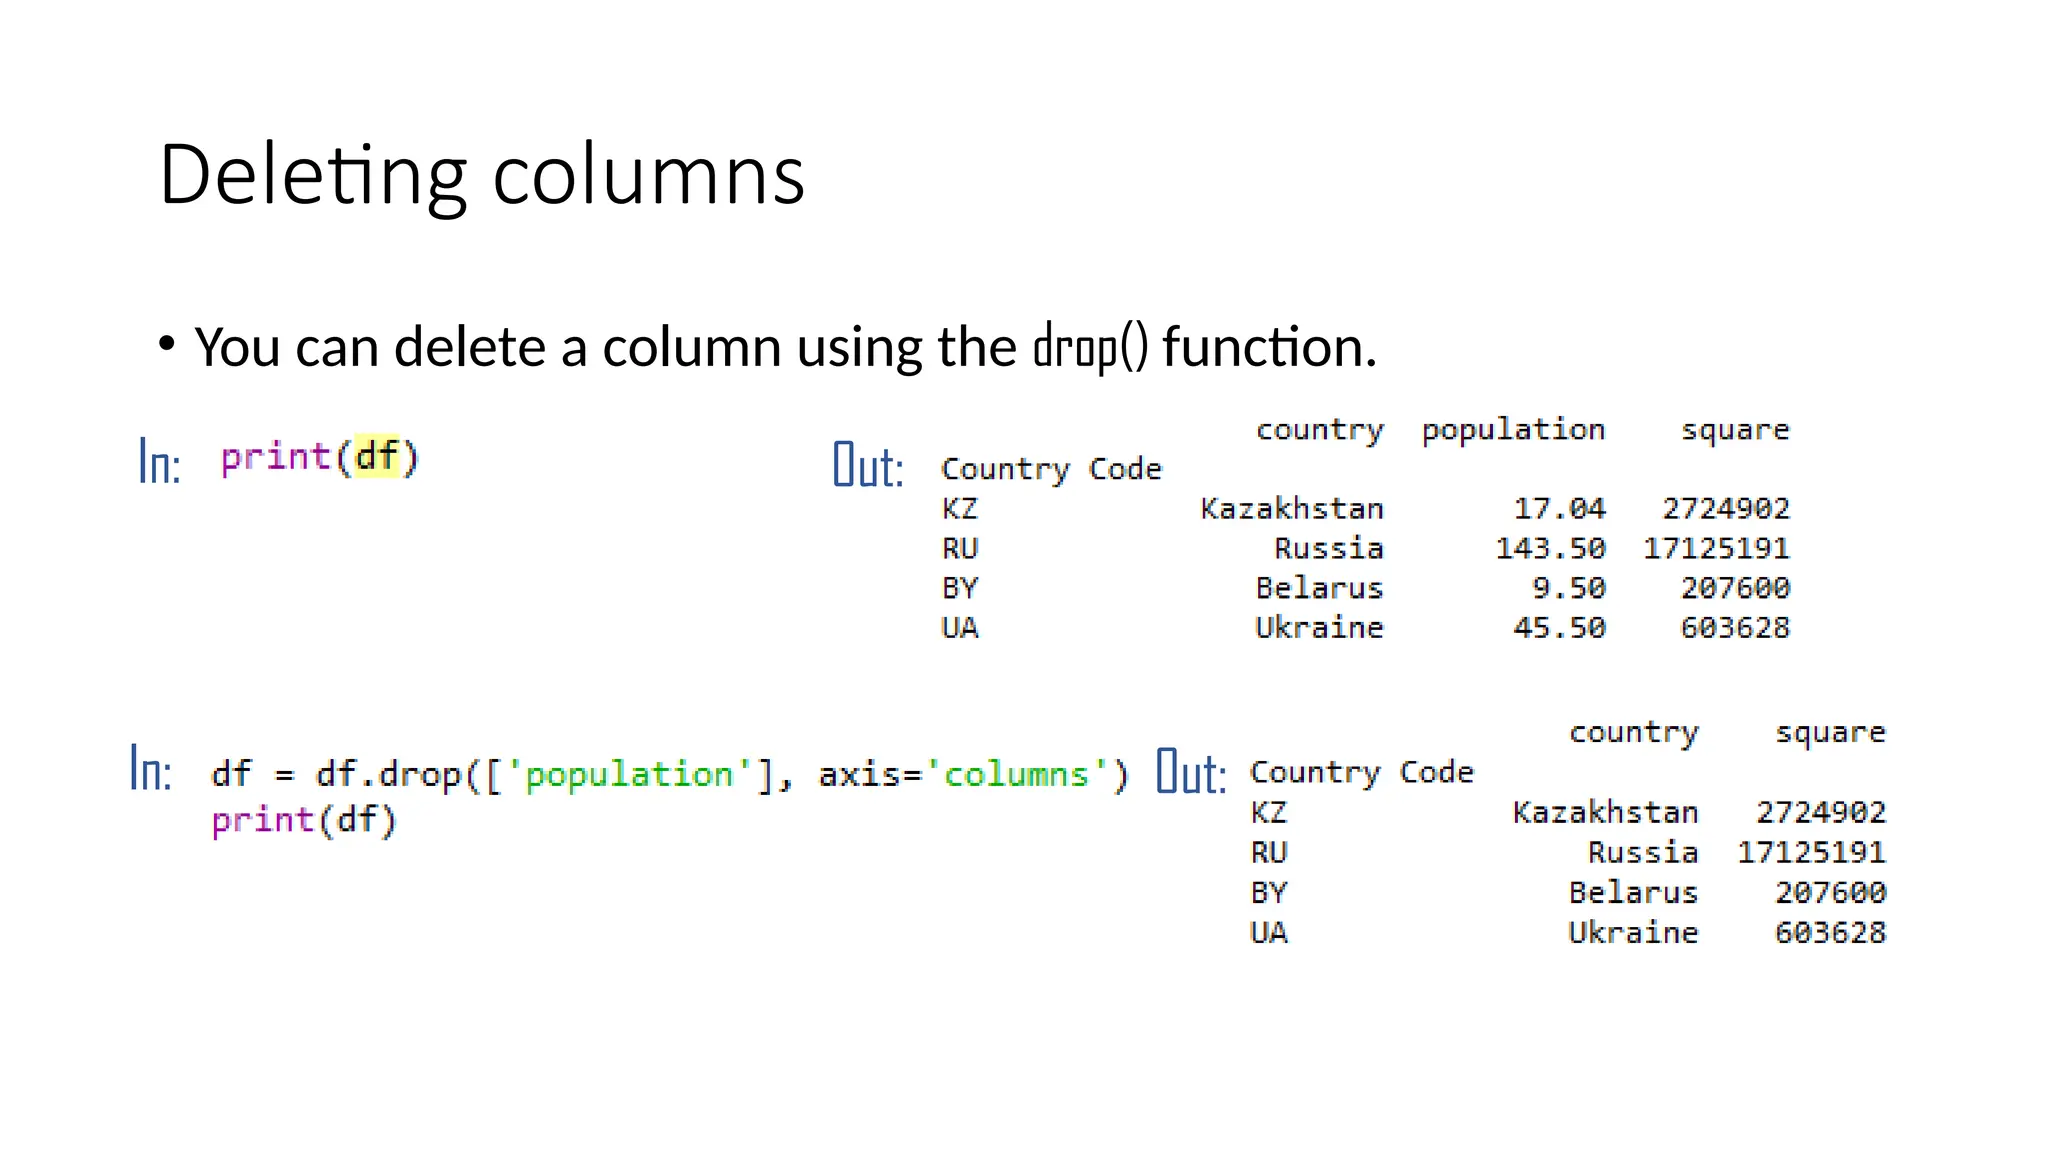
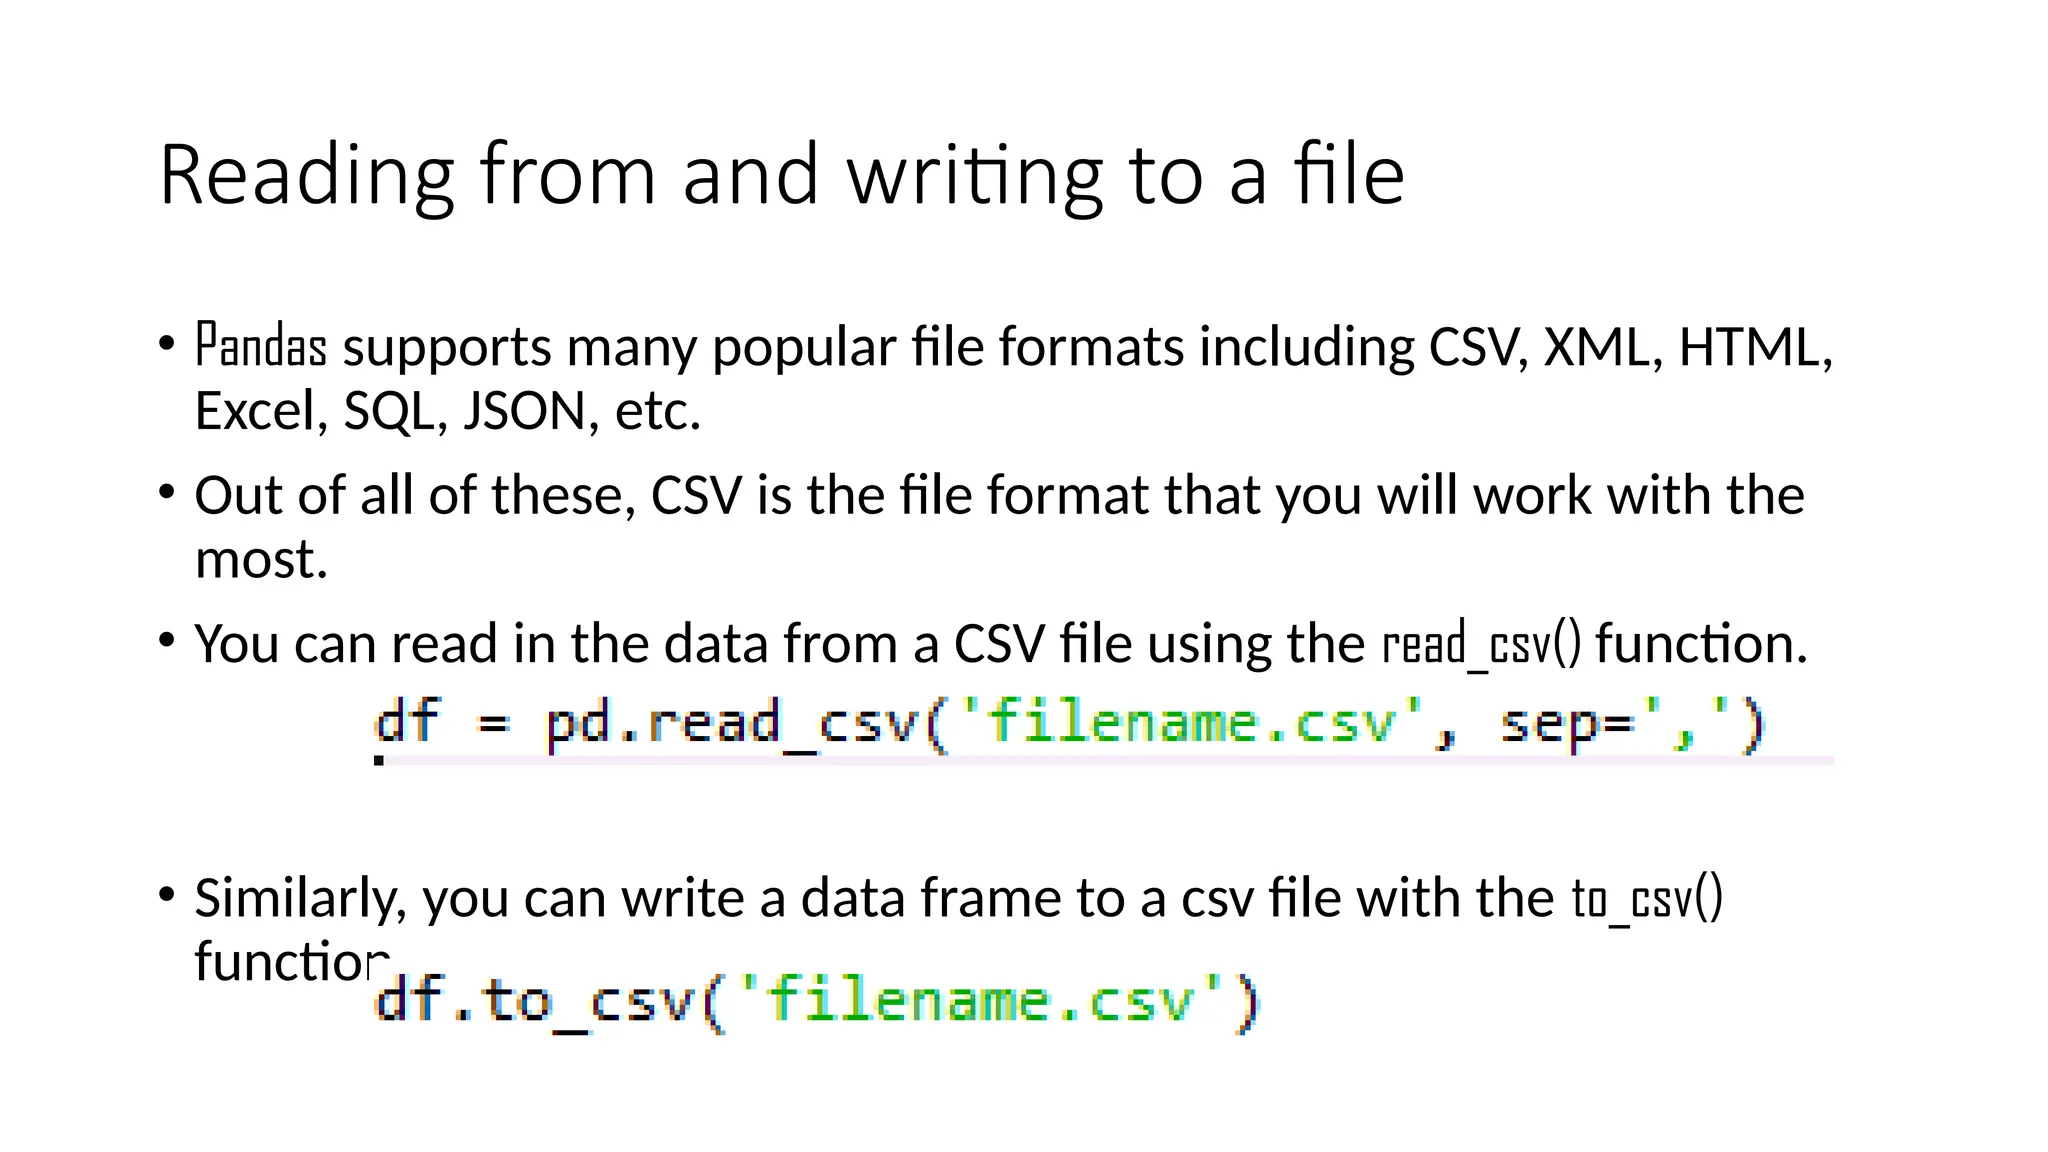
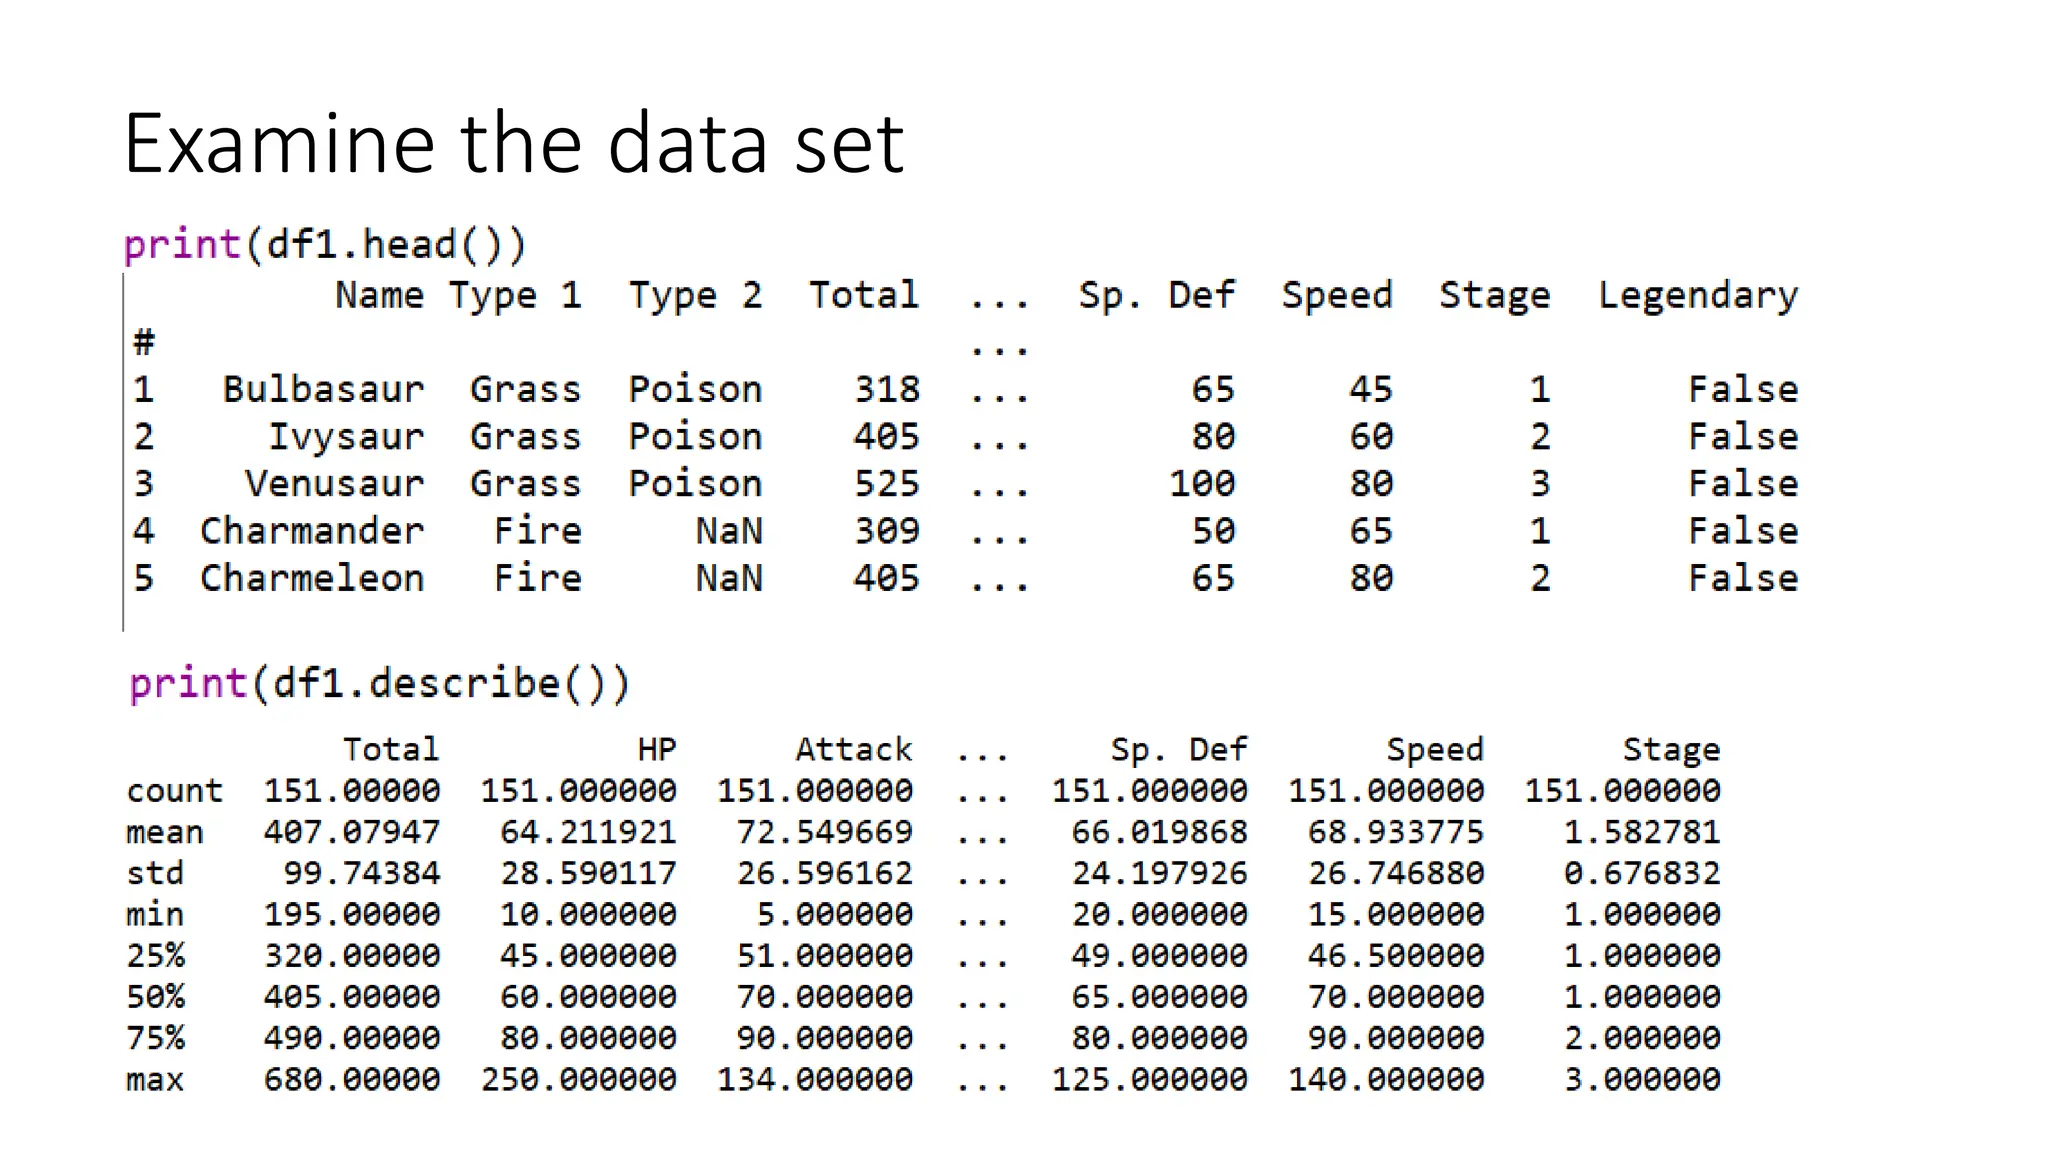
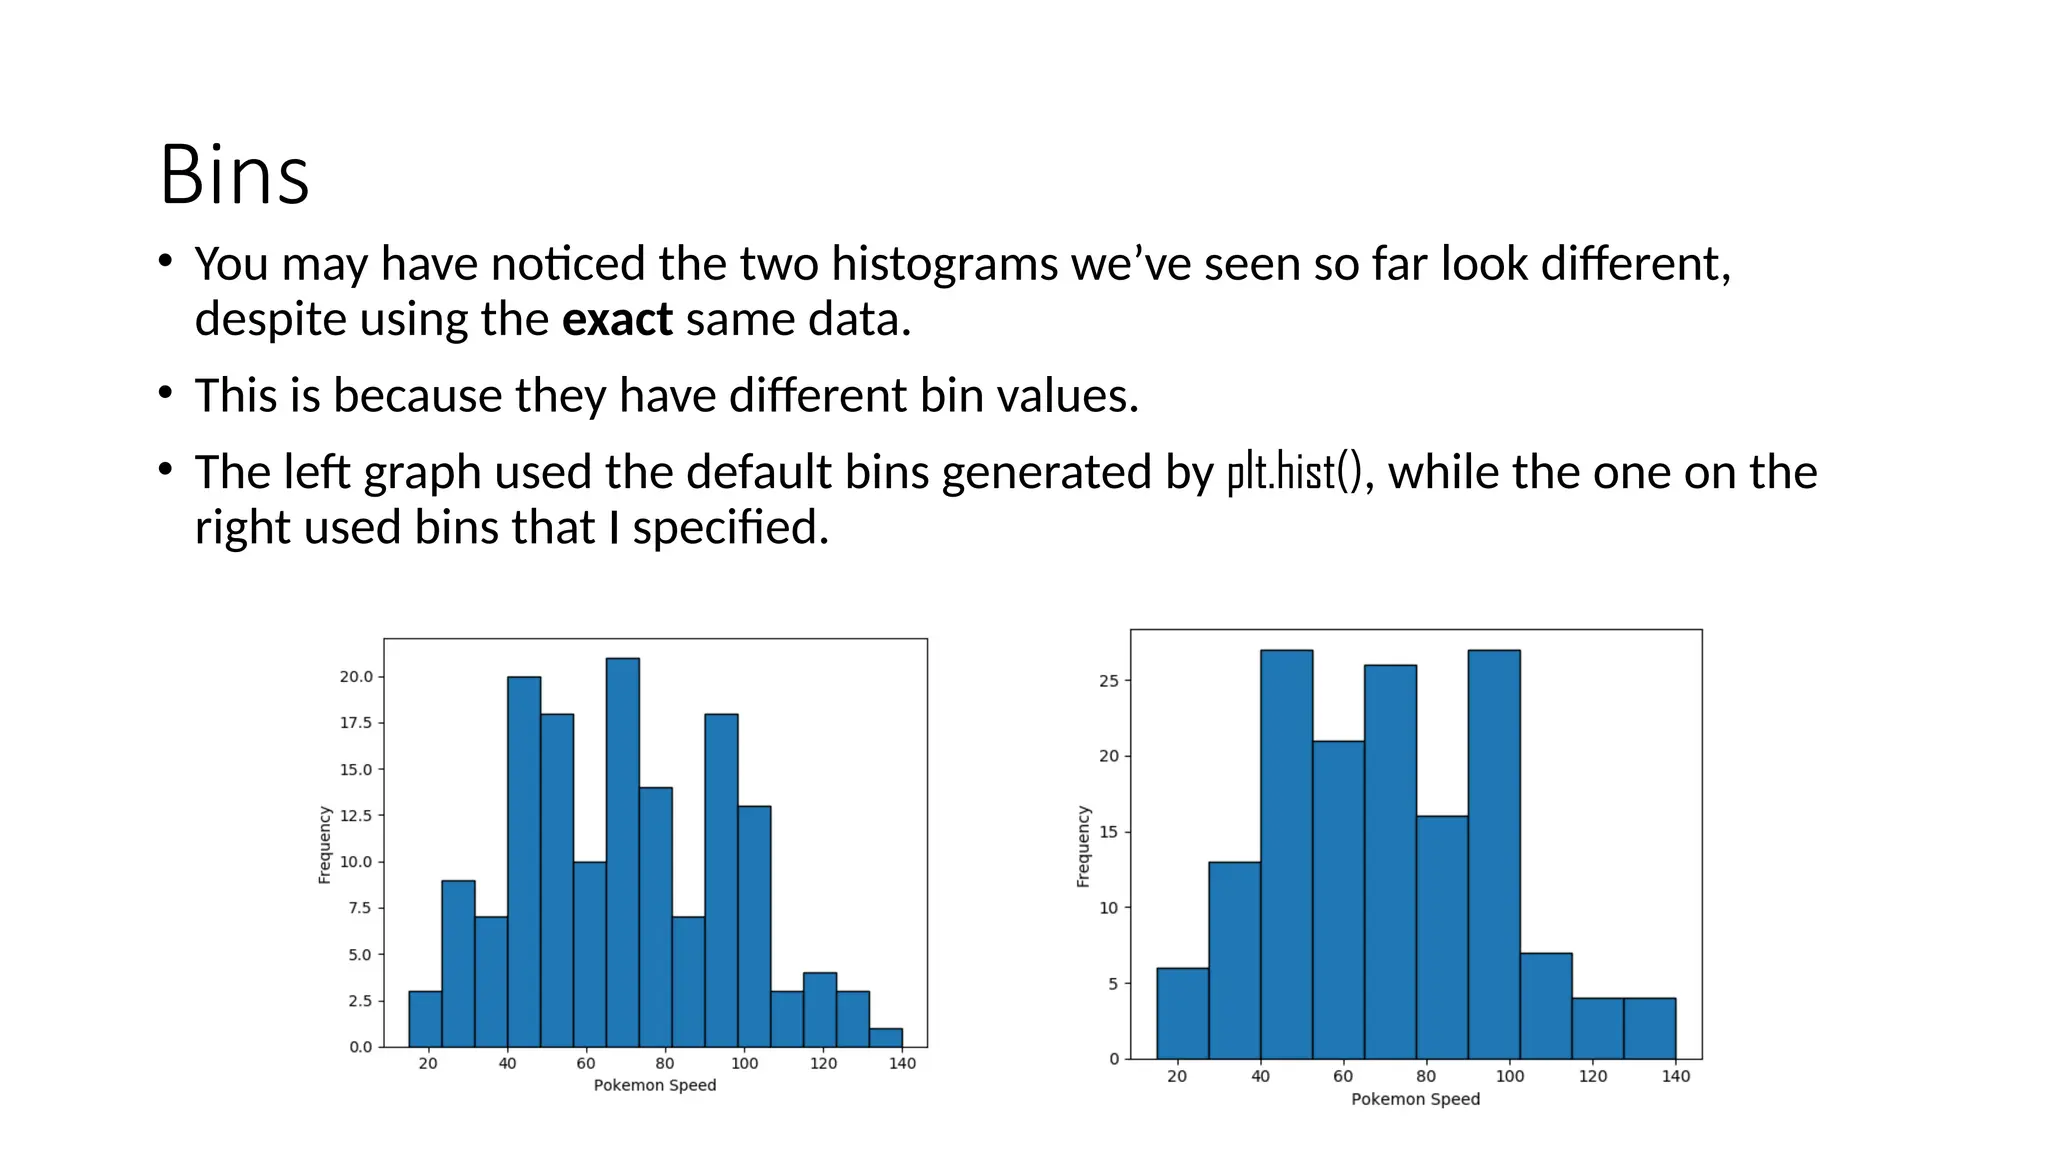
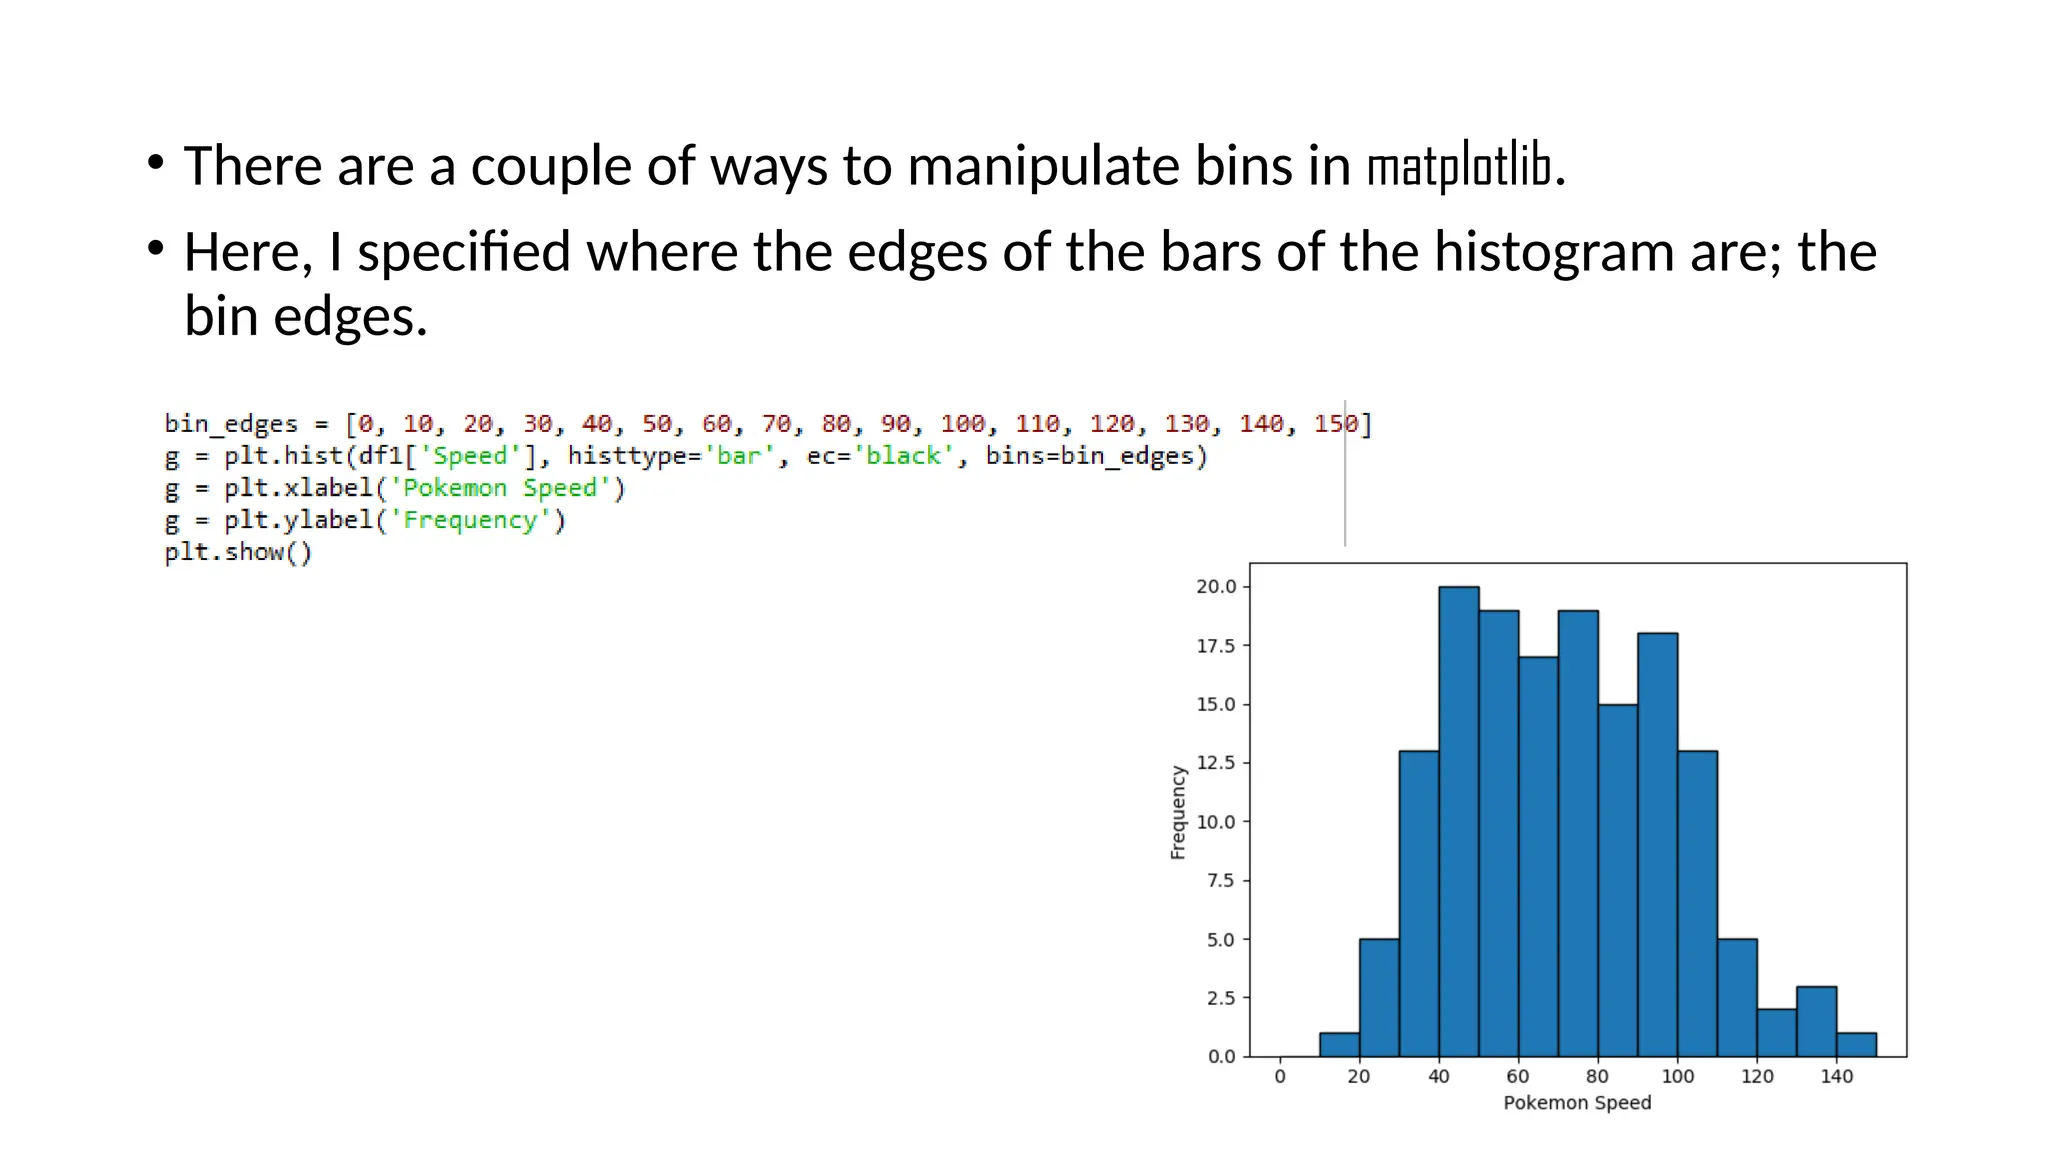
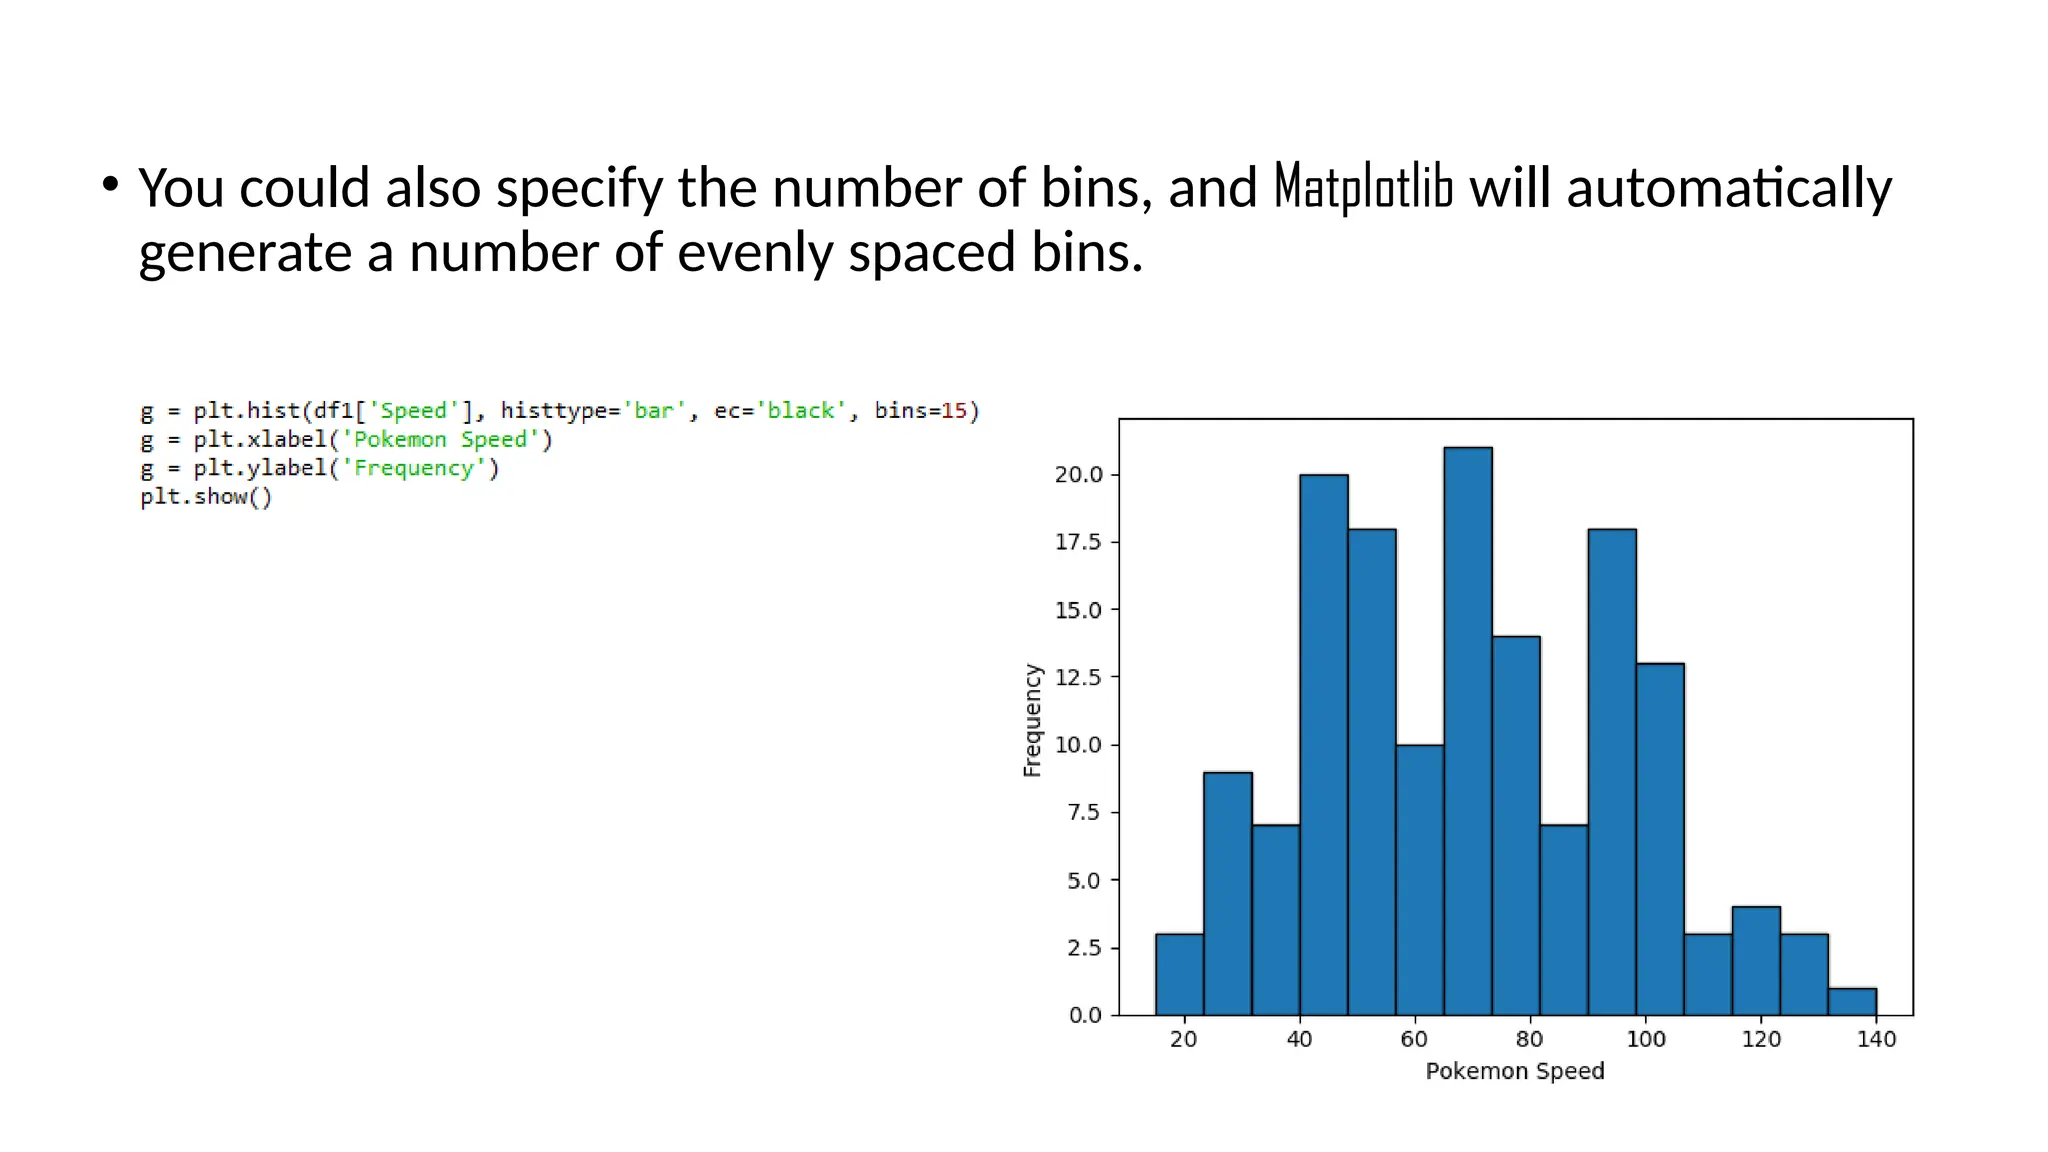
KEMBAR78
Presentation on the basic of numpy and Pandas | PPTX
Pandas
Pandas
• Pandas, like NumPy, is one of the most popular Python libraries for
data analysis.
• It is a high-level abstraction over low-level NumPy, which is written in
pure C.
• Pandas provides high-performance, easy-to-use data structures and
data analysis tools.
• There are two main structures used by pandas; data frames and
series.
Indices in a pandas series
• A pandas series is similar to a list, but differs in the fact that a series associates a label with
each element. This makes it look like a dictionary.
• If an index is not explicitly provided by the user, pandas creates a RangeIndex ranging from 0
to N-1.
• Each series object also has a data type.
In: Out
:
• As you may suspect by this point, a series has ways to extract all of
the values in the series, as well as individual elements by index.
In: Out
:
• You can also provide an index manually.
In:
Out:
• It is easy to retrieve several elements of a series by their indices or
make group assignments.
In:
Out:
Filtering and maths operations
• Filtering and maths operations are easy with Pandas as well.
In: Out
:
Pandas data frame
• Simplistically, a data frame is a table, with rows and columns.
• Each column in a data frame is a series object.
• Rows consist of elements inside series.
Case ID Variable one Variable two Variable 3
1 123 ABC 10
2 456 DEF 20
3 789 XYZ 30
Creating a Pandas data frame
• Pandas data frames can be constructed using Python dictionaries.
In:
Out:
• You can also create a data frame from a list.
In: Out:
• You can ascertain the type of a column with the type() function.
In:
Out:
• A Pandas data frame object as two indices; a column index and row
index.
• Again, if you do not provide one, Pandas will create a RangeIndex from 0
to N-1.
In:
Out:
• There are numerous ways to provide row indices explicitly.
• For example, you could provide an index when creating a data frame:
In: Out:
• or do it during runtime.
• Here, I also named the index ‘country code’.
In:
Out:
• Row access using index can be performed in several ways.
• First, you could use .loc() and provide an index label.
• Second, you could use .iloc() and provide an index number
In: Out:
In: Out:
• A selection of particular rows and columns can be selected this way.
In: Out:
• You can feed .loc() two arguments, index list and column list, slicing operation
is supported as well:
In: Out:
Filtering
• Filtering is performed using so-called Boolean arrays.
Deleting columns
• You can delete a column using the drop() function.
In: Out:
In: Out:
Reading from and writing to a file
• Pandas supports many popular file formats including CSV, XML, HTML,
Excel, SQL, JSON, etc.
• Out of all of these, CSV is the file format that you will work with the
most.
• You can read in the data from a CSV file using the read_csv() function.
• Similarly, you can write a data frame to a csv file with the to_csv()
function.
Exploratory data analysis (EDA)
Exploring your data is a crucial step in data analysis. It involves:
• Organising the data set
• Plotting aspects of the data set
• Maybe producing some numerical summaries; central tendency and
spread, etc.
“Exploratory data analysis can never be the whole story, but nothing
else can serve as the foundation stone.”
- John Tukey.
Reading in the data
• First we import the Python packages we are going to use.
• Then we use Pandas to load in the dataset as a data frame.
NOTE: The argument index_col argument states that we'll treat the first column
of the dataset as the ID column.
NOTE: The encoding argument allows us to by pass an input error created
by special characters in the data set.
Examine the data set
• We could spend time staring at these
numbers, but that is unlikely to offer
us any form of insight.
• We could begin by conducting all of
our statistical tests.
• However, a good field commander
never goes into battle without first
doing a recognisance of the terrain…
• This is exactly what EDA is for…
Plotting a histogram in Python
Bins
• You may have noticed the two histograms we’ve seen so far look different,
despite using the exact same data.
• This is because they have different bin values.
• The left graph used the default bins generated by plt.hist(), while the one on the
right used bins that I specified.
• There are a couple of ways to manipulate bins in matplotlib.
• Here, I specified where the edges of the bars of the histogram are; the
bin edges.
• You could also specify the number of bins, and Matplotlib will automatically
generate a number of evenly spaced bins.

Presentation on the basic of numpy and Pandas

  • 1.
  • 2.
    Pandas • Pandas, likeNumPy, is one of the most popular Python libraries for data analysis. • It is a high-level abstraction over low-level NumPy, which is written in pure C. • Pandas provides high-performance, easy-to-use data structures and data analysis tools. • There are two main structures used by pandas; data frames and series.
  • 3.
    Indices in apandas series • A pandas series is similar to a list, but differs in the fact that a series associates a label with each element. This makes it look like a dictionary. • If an index is not explicitly provided by the user, pandas creates a RangeIndex ranging from 0 to N-1. • Each series object also has a data type. In: Out :
  • 4.
    • As youmay suspect by this point, a series has ways to extract all of the values in the series, as well as individual elements by index. In: Out : • You can also provide an index manually. In: Out:
  • 5.
    • It iseasy to retrieve several elements of a series by their indices or make group assignments. In: Out:
  • 6.
    Filtering and mathsoperations • Filtering and maths operations are easy with Pandas as well. In: Out :
  • 7.
    Pandas data frame •Simplistically, a data frame is a table, with rows and columns. • Each column in a data frame is a series object. • Rows consist of elements inside series. Case ID Variable one Variable two Variable 3 1 123 ABC 10 2 456 DEF 20 3 789 XYZ 30
  • 8.
    Creating a Pandasdata frame • Pandas data frames can be constructed using Python dictionaries. In: Out:
  • 9.
    • You canalso create a data frame from a list. In: Out:
  • 10.
    • You canascertain the type of a column with the type() function. In: Out:
  • 11.
    • A Pandasdata frame object as two indices; a column index and row index. • Again, if you do not provide one, Pandas will create a RangeIndex from 0 to N-1. In: Out:
  • 12.
    • There arenumerous ways to provide row indices explicitly. • For example, you could provide an index when creating a data frame: In: Out: • or do it during runtime. • Here, I also named the index ‘country code’. In: Out:
  • 13.
    • Row accessusing index can be performed in several ways. • First, you could use .loc() and provide an index label. • Second, you could use .iloc() and provide an index number In: Out: In: Out:
  • 14.
    • A selectionof particular rows and columns can be selected this way. In: Out: • You can feed .loc() two arguments, index list and column list, slicing operation is supported as well: In: Out:
  • 15.
    Filtering • Filtering isperformed using so-called Boolean arrays.
  • 16.
    Deleting columns • Youcan delete a column using the drop() function. In: Out: In: Out:
  • 17.
    Reading from andwriting to a file • Pandas supports many popular file formats including CSV, XML, HTML, Excel, SQL, JSON, etc. • Out of all of these, CSV is the file format that you will work with the most. • You can read in the data from a CSV file using the read_csv() function. • Similarly, you can write a data frame to a csv file with the to_csv() function.
  • 18.
    Exploratory data analysis(EDA) Exploring your data is a crucial step in data analysis. It involves: • Organising the data set • Plotting aspects of the data set • Maybe producing some numerical summaries; central tendency and spread, etc. “Exploratory data analysis can never be the whole story, but nothing else can serve as the foundation stone.” - John Tukey.
  • 19.
    Reading in thedata • First we import the Python packages we are going to use. • Then we use Pandas to load in the dataset as a data frame. NOTE: The argument index_col argument states that we'll treat the first column of the dataset as the ID column. NOTE: The encoding argument allows us to by pass an input error created by special characters in the data set.
  • 20.
  • 21.
    • We couldspend time staring at these numbers, but that is unlikely to offer us any form of insight. • We could begin by conducting all of our statistical tests. • However, a good field commander never goes into battle without first doing a recognisance of the terrain… • This is exactly what EDA is for…
  • 22.
  • 23.
    Bins • You mayhave noticed the two histograms we’ve seen so far look different, despite using the exact same data. • This is because they have different bin values. • The left graph used the default bins generated by plt.hist(), while the one on the right used bins that I specified.
  • 24.
    • There area couple of ways to manipulate bins in matplotlib. • Here, I specified where the edges of the bars of the histogram are; the bin edges.
  • 25.
    • You couldalso specify the number of bins, and Matplotlib will automatically generate a number of evenly spaced bins.