Downloaded 14 times
![Prometheus 배포
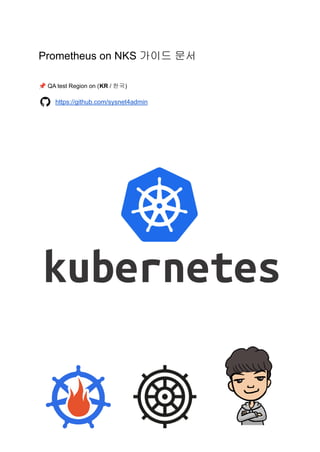
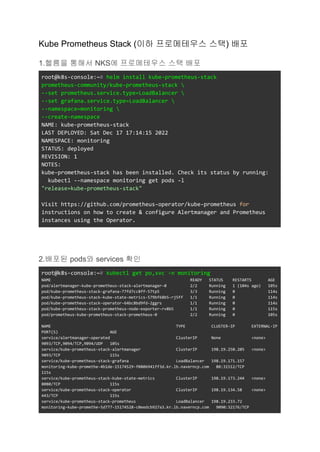
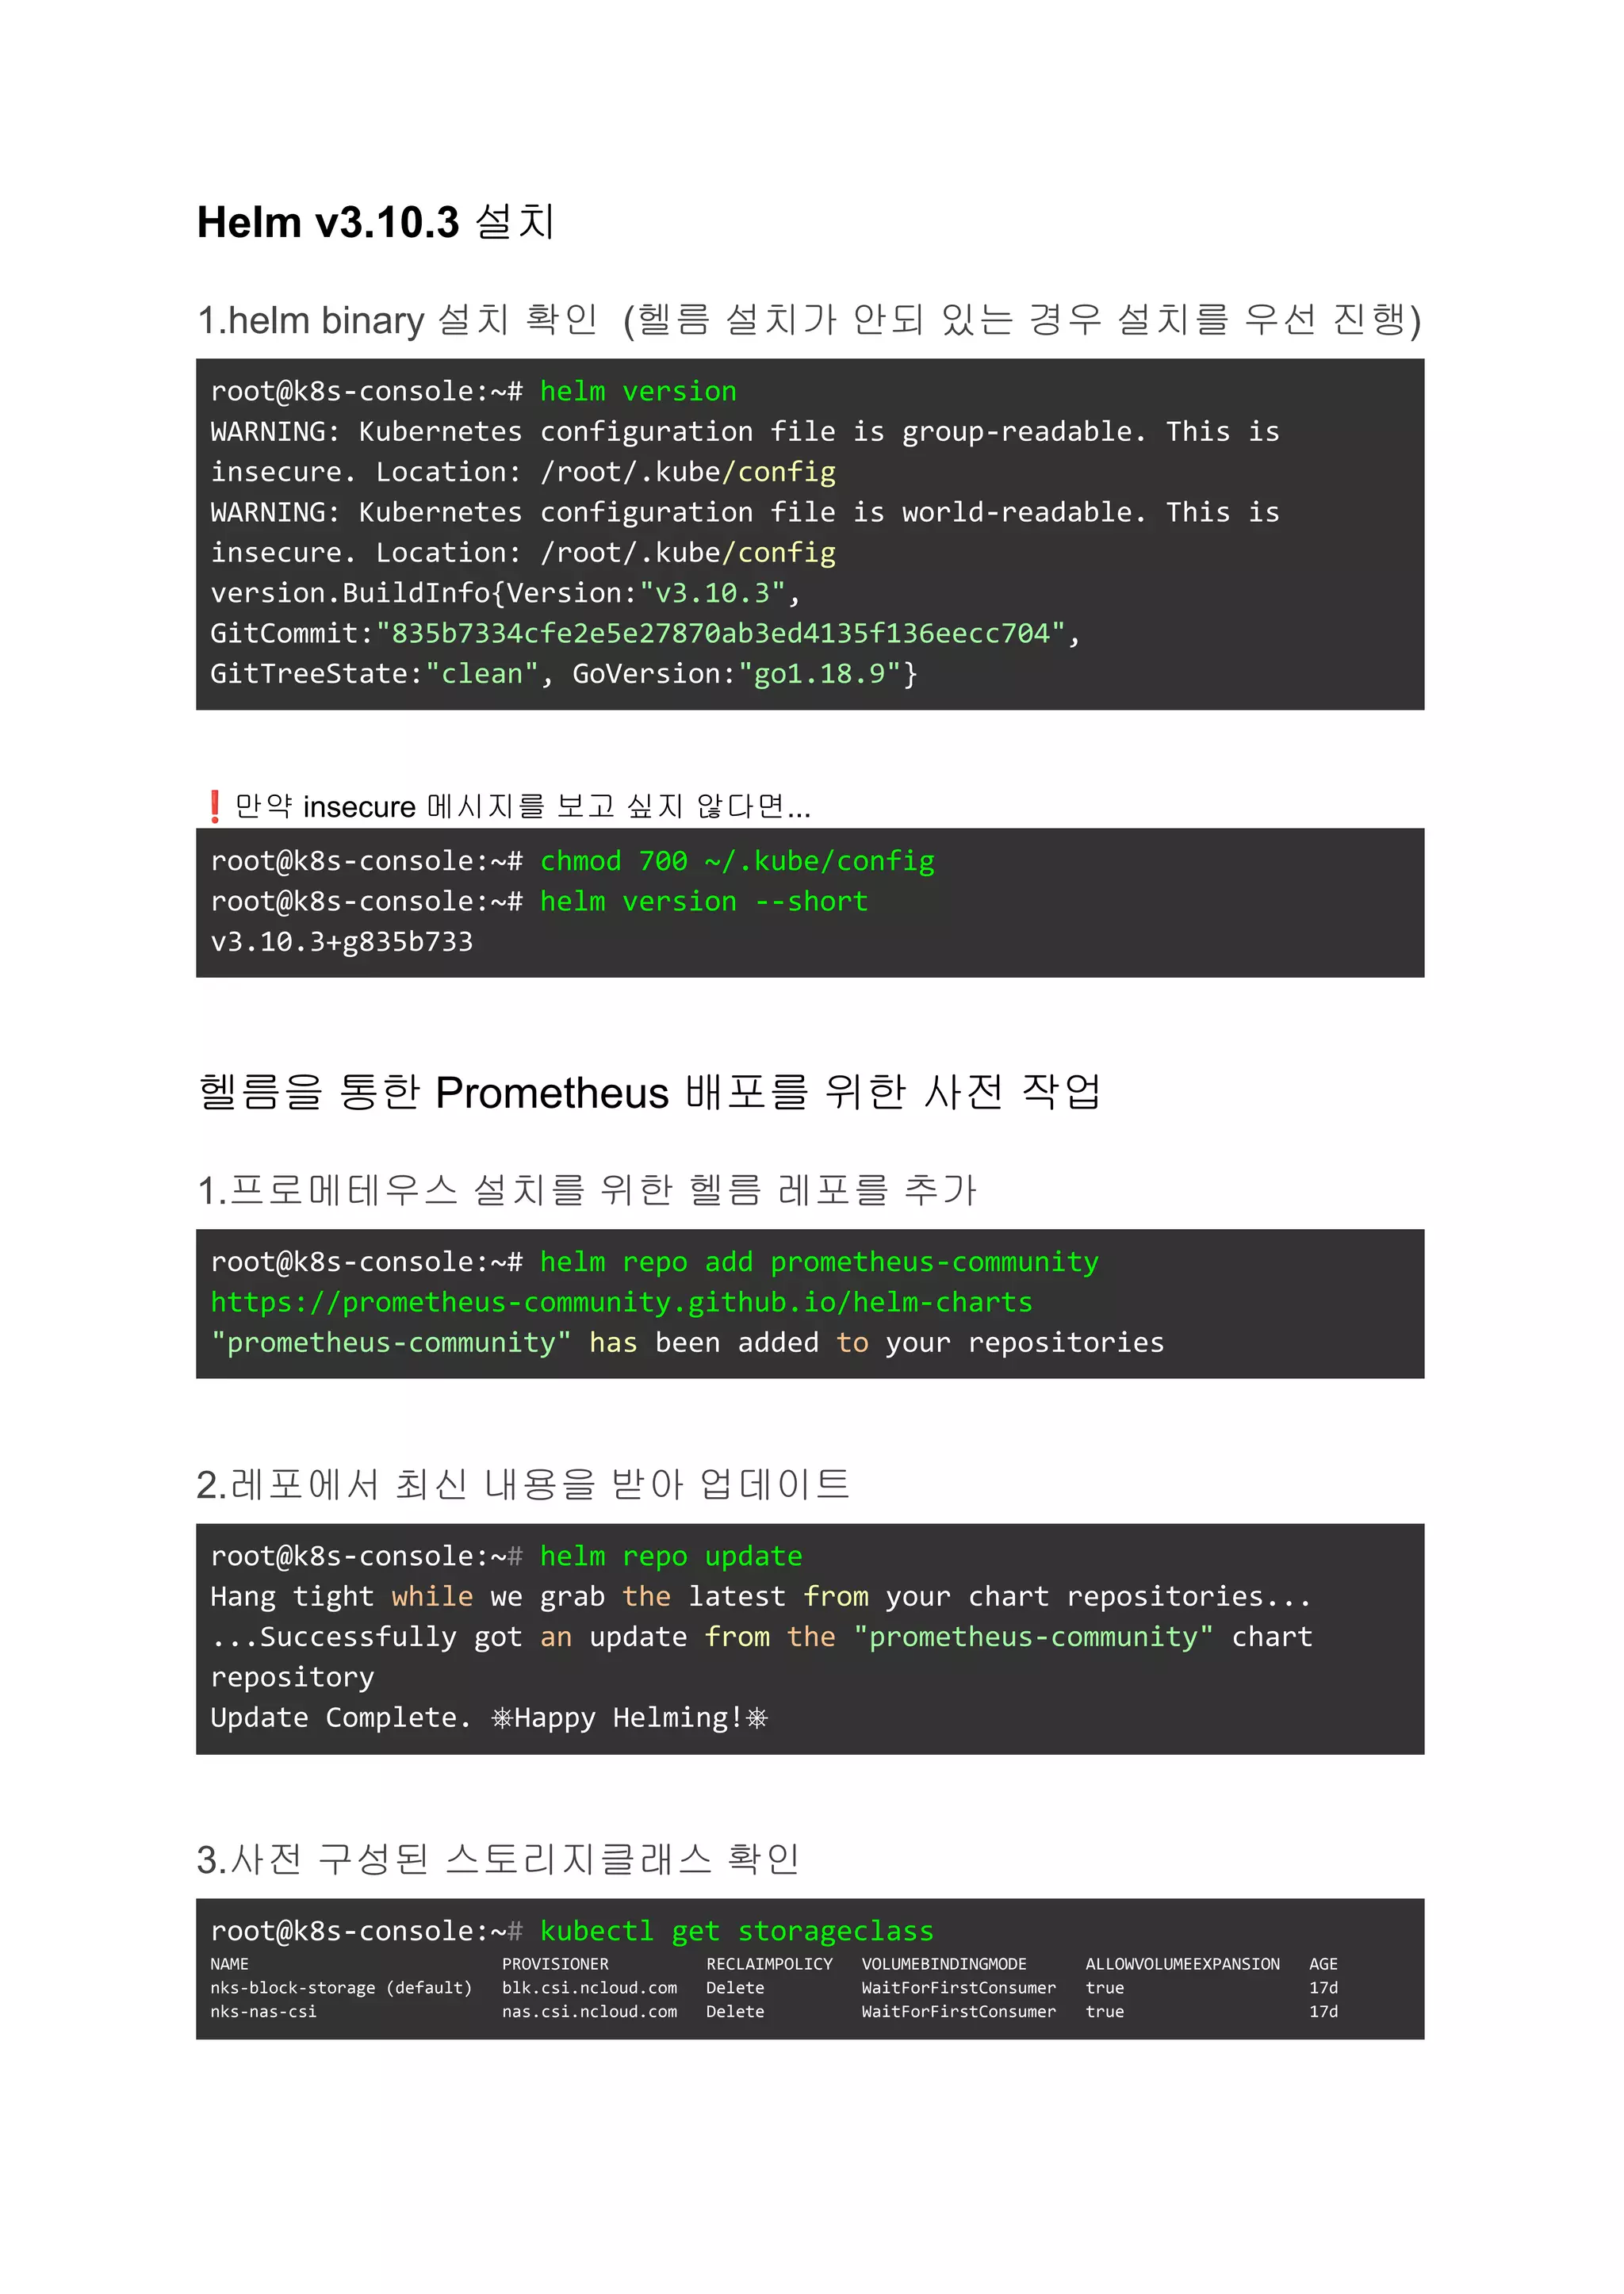
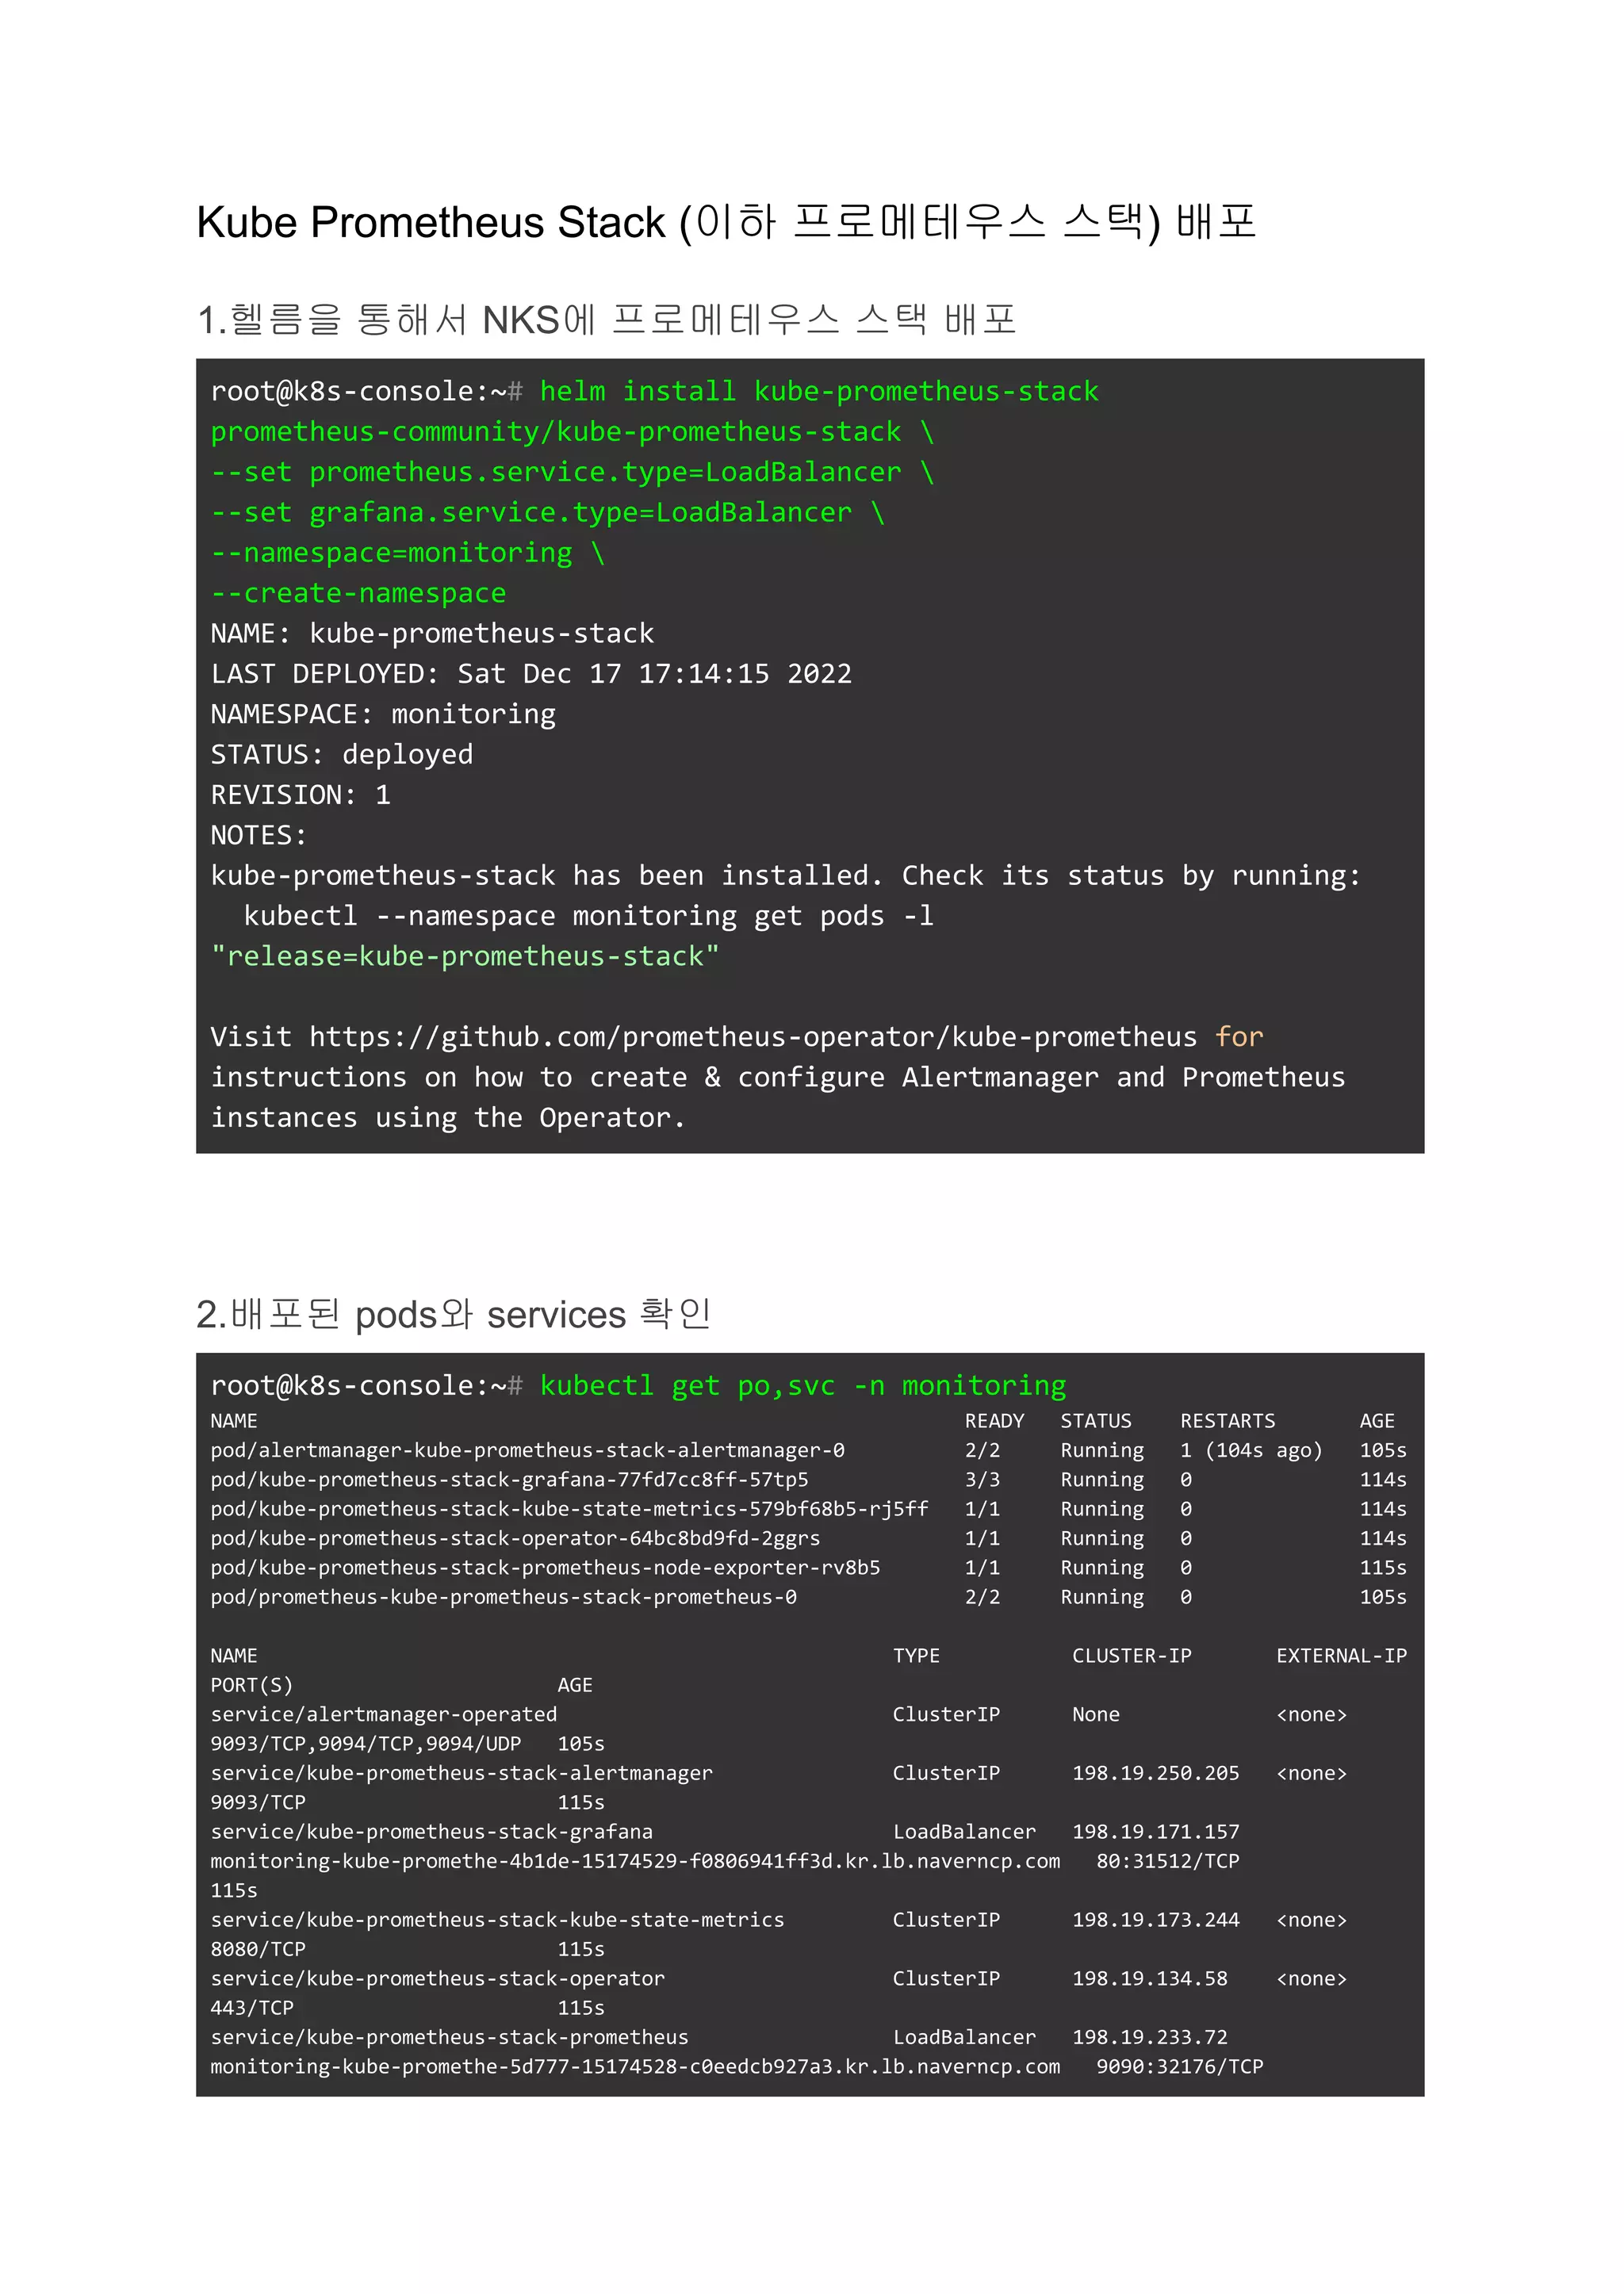
1.헬름을 통해서 NKS에 프로메테우스 배포
root@k8s-console:~# helm install prometheus
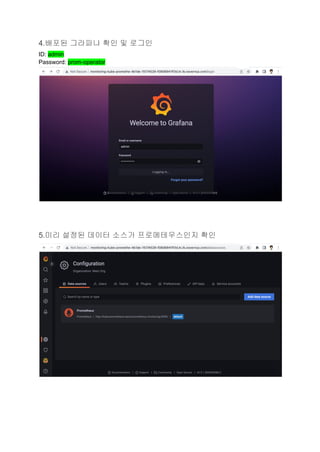
prometheus-community/prometheus
--set server.service.type="LoadBalancer"
--namespace=monitoring
--create-namespace
WARNING: Kubernetes configuration file is group-readable. This is
insecure. Location: /root/.kube/config
WARNING: Kubernetes configuration file is world-readable. This is
insecure. Location: /root/.kube/config
NAME: prometheus
LAST DEPLOYED: Sat Dec 17 17:03:41 2022
NAMESPACE: monitoring
STATUS: deployed
REVISION: 1
NOTES:
The Prometheus server can be accessed via port 80 on the following DNS
name from within your cluster:
prometheus-server.monitoring.svc.cluster.local
Get the Prometheus server URL by running these commands in the same
shell:
NOTE: It may take a few minutes for the LoadBalancer IP to be
available.
You can watch the status of by running 'kubectl get svc
--namespace monitoring -w prometheus-server'
export SERVICE_IP=$(kubectl get svc --namespace monitoring
prometheus-server -o jsonpath='{.status.loadBalancer.ingress[0].ip}')
echo http://$SERVICE_IP:80
The Prometheus alertmanager can be accessed via port on the following
DNS name from within your cluster:
prometheus-%!s(<nil>).monitoring.svc.cluster.local
Get the Alertmanager URL by running these commands in the same shell:
export POD_NAME=$(kubectl get pods --namespace monitoring -l
"app=prometheus,component=" -o jsonpath="{.items[0].metadata.name}")](https://image.slidesharecdn.com/day2-prometheusonnkswhelm-v3-221223012938-d1aa3ebd/85/Prometheus-on-NKS-3-320.jpg)
![kubectl --namespace monitoring port-forward $POD_NAME 9093
########################################################################
#########
###### WARNING: Pod Security Policy has been disabled by default since
#####
###### it deprecated after k8s 1.25+. use
#####
###### (index .Values "prometheus-node-exporter" "rbac"
#####
###### . "pspEnabled") with (index .Values
#####
###### "prometheus-node-exporter" "rbac" "pspAnnotations")
#####
###### in case you still need it.
#####
########################################################################
#########
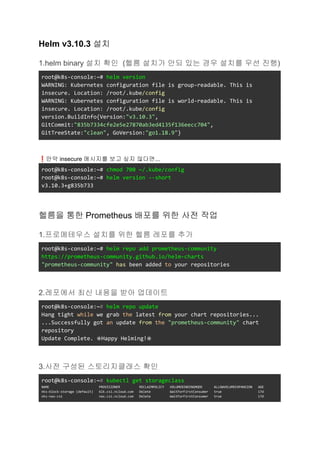
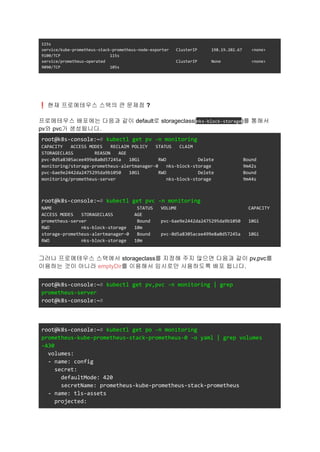
The Prometheus PushGateway can be accessed via port 9091 on the
following DNS name from within your cluster:
prometheus-prometheus-pushgateway.monitoring.svc.cluster.local
Get the PushGateway URL by running these commands in the same shell:
export POD_NAME=$(kubectl get pods --namespace monitoring -l
"app=prometheus-pushgateway,component=pushgateway" -o
jsonpath="{.items[0].metadata.name}")
kubectl --namespace monitoring port-forward $POD_NAME 9091
For more information on running Prometheus, visit:
https://prometheus.io/
❗만약 storageclass를 nks-block-storage가 아닌 다른 스토리지를 쓰고 싶다면 다음을
참조하세요
helm install prometheus prometheus-community/prometheus
--set alertmanager.persistentVolume.storageClass="nks-block-storage"
--set server.persistentVolume.storageClass="nks-block-storage"
--set server.service.type="LoadBalancer"
--namespace=monitoring
--create-namespace](https://image.slidesharecdn.com/day2-prometheusonnkswhelm-v3-221223012938-d1aa3ebd/85/Prometheus-on-NKS-4-320.jpg)
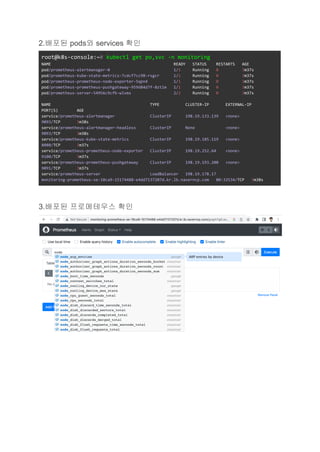
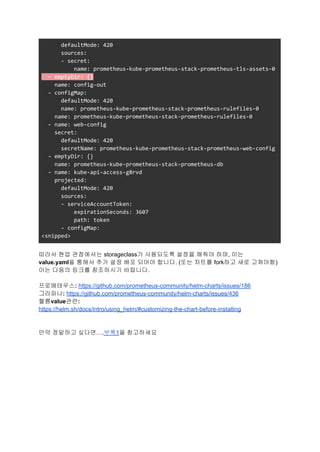
![부록1
1.helm inspect로 values 파일 생성
$ helm inspect values prometheus-community/kube-prometheus-stack
--version 43.1.1 > kube-prometheus-stack-43.1.1.values
2. 생성된 values 파일에 필요 내용 추가 및 수정
라인 번호는 실행 시점 및 수정 순서에 따라 다소 차이가 있을 수도 있습니다.
참고로 라인 번호는 vi 실행 이후에 :set nu로 표시할 수 있습니다.
수정
542 ## Storage is the definition of how storage will be used by the
Alertmanager instances.
543 ## ref:
https://github.com/prometheus-operator/prometheus-operator/blob/main/Doc
umentation/user-guides/storage.md
544 ##
545 storage:
546 volumeClaimTemplate:
547 spec:
548 storageClassName: nks-block-storage
549 accessModes: ["ReadWriteOnce"]
550 resources:
551 requests:
552 storage: 50Gi
553 # selector: {}
추가
697 ## Using default values from
https://github.com/grafana/helm-charts/blob/main/charts/grafana/values.y
aml
698 ##
699 grafana:
700 enabled: true
701 namespaceOverride: ""
702
703 # override configuration by hoon
704 persistence:
705 enabled: true
706 type: pvc](https://image.slidesharecdn.com/day2-prometheusonnkswhelm-v3-221223012938-d1aa3ebd/85/Prometheus-on-NKS-14-320.jpg)
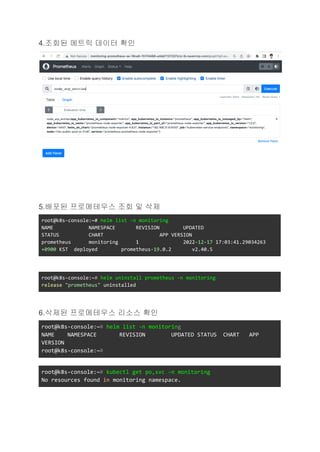
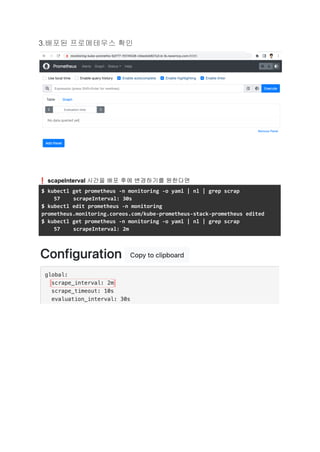
![707 storageClassName: nks-block-storage
708 accessModes:
709 - ReadWriteOnce
710 size: 100Gi
711 finalizers:
712 - kubernetes.io/pvc-protection
수정
726 ## Timezone for the default dashboards
727 ## Other options are: browser or a specific timezone, i.e.
Europe/Luxembourg
728 ##
729 defaultDashboardsTimezone: utc
730
731 adminPassword: admin
732
수정
2580 ## Prometheus StorageSpec for persistent data
2581 ## ref:
https://github.com/prometheus-operator/prometheus-operator/blob/main/Doc
umentation/user-guides/storage.md
2582 ##
2583 storageSpec:
2584 ## Using PersistentVolumeClaim
2585 ##
2586 volumeClaimTemplate:
2587 spec:
2588 storageClassName: nks-block-storage
2589 accessModes: ["ReadWriteOnce"]
2590 resources:
2591 requests:
2592 storage: 50Gi
2593 # selector: {}
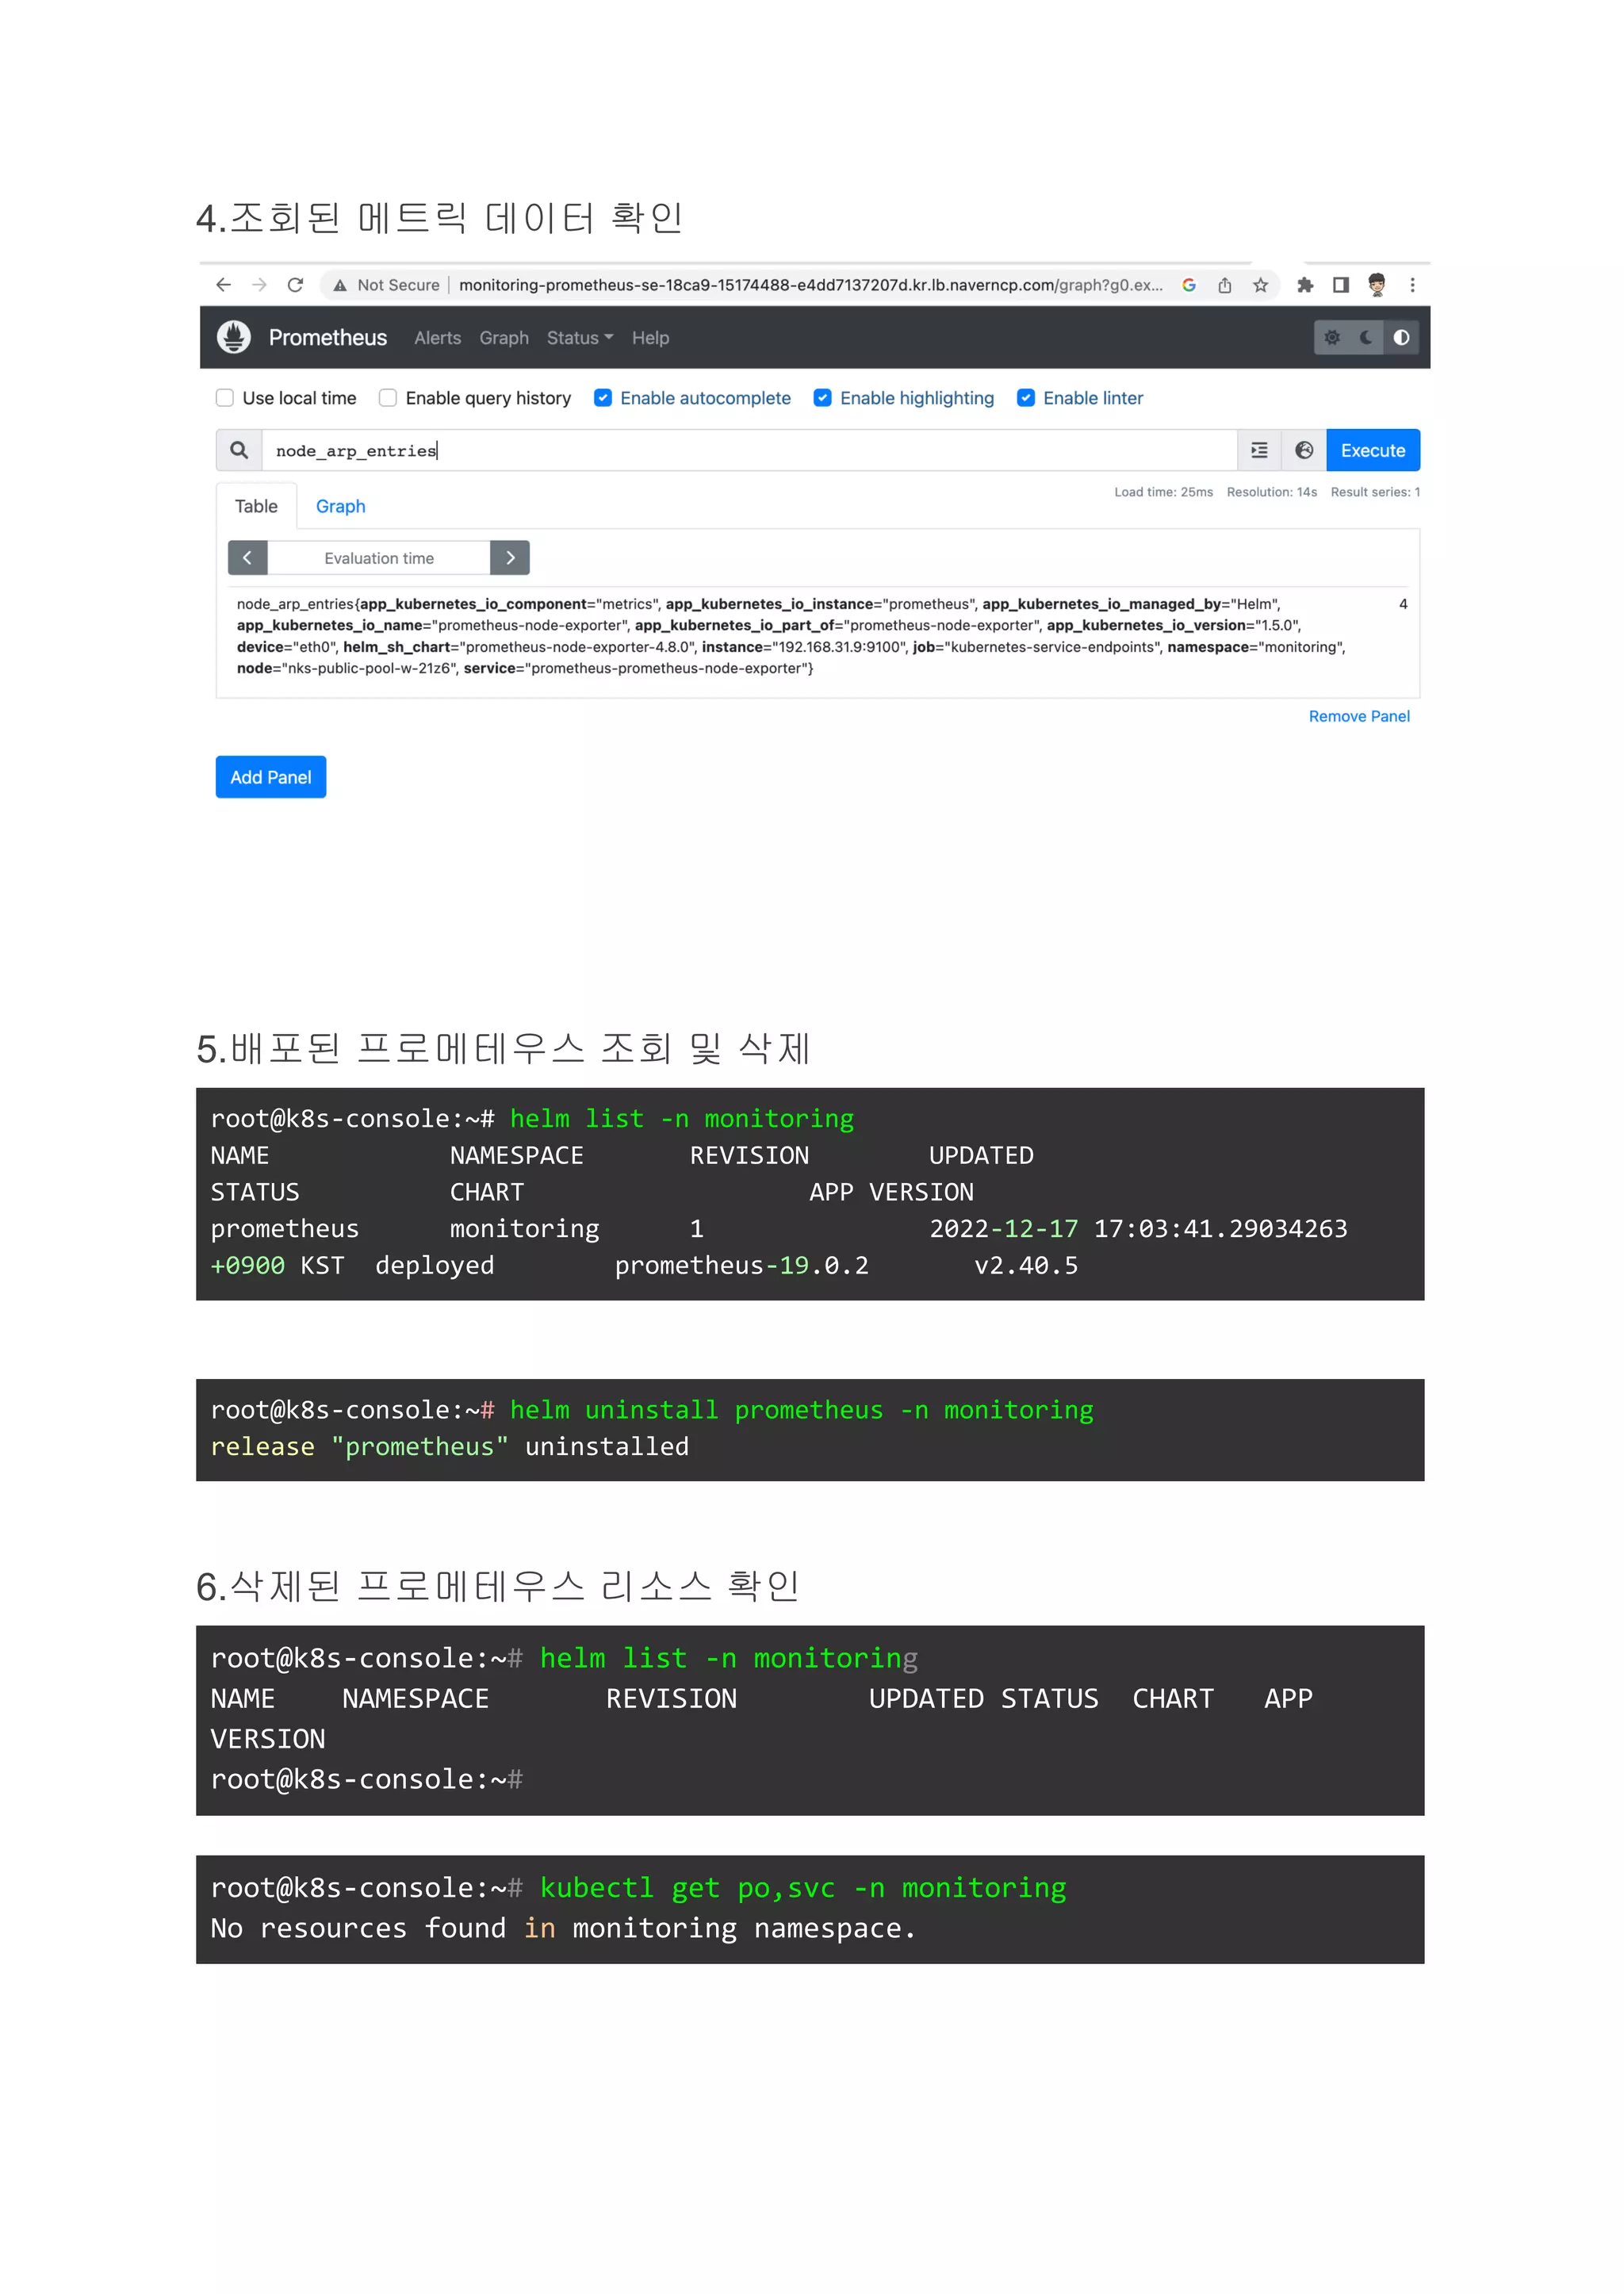
3.helm install 실행
root@k8s-console:~# helm install
prometheus-community/kube-prometheus-stack](https://image.slidesharecdn.com/day2-prometheusonnkswhelm-v3-221223012938-d1aa3ebd/85/Prometheus-on-NKS-15-320.jpg)

![Prometheus 배포
1.헬름을 통해서 NKS에 프로메테우스 배포
root@k8s-console:~# helm install prometheus
prometheus-community/prometheus
--set server.service.type="LoadBalancer"
--namespace=monitoring
--create-namespace
WARNING: Kubernetes configuration file is group-readable. This is
insecure. Location: /root/.kube/config
WARNING: Kubernetes configuration file is world-readable. This is
insecure. Location: /root/.kube/config
NAME: prometheus
LAST DEPLOYED: Sat Dec 17 17:03:41 2022
NAMESPACE: monitoring
STATUS: deployed
REVISION: 1
NOTES:
The Prometheus server can be accessed via port 80 on the following DNS
name from within your cluster:
prometheus-server.monitoring.svc.cluster.local
Get the Prometheus server URL by running these commands in the same
shell:
NOTE: It may take a few minutes for the LoadBalancer IP to be
available.
You can watch the status of by running 'kubectl get svc
--namespace monitoring -w prometheus-server'
export SERVICE_IP=$(kubectl get svc --namespace monitoring
prometheus-server -o jsonpath='{.status.loadBalancer.ingress[0].ip}')
echo http://$SERVICE_IP:80
The Prometheus alertmanager can be accessed via port on the following
DNS name from within your cluster:
prometheus-%!s(<nil>).monitoring.svc.cluster.local
Get the Alertmanager URL by running these commands in the same shell:
export POD_NAME=$(kubectl get pods --namespace monitoring -l
"app=prometheus,component=" -o jsonpath="{.items[0].metadata.name}")](https://image.slidesharecdn.com/day2-prometheusonnkswhelm-v3-221223012938-d1aa3ebd/75/Prometheus-on-NKS-3-2048.jpg)
![kubectl --namespace monitoring port-forward $POD_NAME 9093
########################################################################
#########
###### WARNING: Pod Security Policy has been disabled by default since
#####
###### it deprecated after k8s 1.25+. use
#####
###### (index .Values "prometheus-node-exporter" "rbac"
#####
###### . "pspEnabled") with (index .Values
#####
###### "prometheus-node-exporter" "rbac" "pspAnnotations")
#####
###### in case you still need it.
#####
########################################################################
#########
The Prometheus PushGateway can be accessed via port 9091 on the
following DNS name from within your cluster:
prometheus-prometheus-pushgateway.monitoring.svc.cluster.local
Get the PushGateway URL by running these commands in the same shell:
export POD_NAME=$(kubectl get pods --namespace monitoring -l
"app=prometheus-pushgateway,component=pushgateway" -o
jsonpath="{.items[0].metadata.name}")
kubectl --namespace monitoring port-forward $POD_NAME 9091
For more information on running Prometheus, visit:
https://prometheus.io/
❗만약 storageclass를 nks-block-storage가 아닌 다른 스토리지를 쓰고 싶다면 다음을
참조하세요
helm install prometheus prometheus-community/prometheus
--set alertmanager.persistentVolume.storageClass="nks-block-storage"
--set server.persistentVolume.storageClass="nks-block-storage"
--set server.service.type="LoadBalancer"
--namespace=monitoring
--create-namespace](https://image.slidesharecdn.com/day2-prometheusonnkswhelm-v3-221223012938-d1aa3ebd/75/Prometheus-on-NKS-4-2048.jpg)


![부록1
1.helm inspect로 values 파일 생성
$ helm inspect values prometheus-community/kube-prometheus-stack
--version 43.1.1 > kube-prometheus-stack-43.1.1.values
2. 생성된 values 파일에 필요 내용 추가 및 수정
라인 번호는 실행 시점 및 수정 순서에 따라 다소 차이가 있을 수도 있습니다.
참고로 라인 번호는 vi 실행 이후에 :set nu로 표시할 수 있습니다.
수정
542 ## Storage is the definition of how storage will be used by the
Alertmanager instances.
543 ## ref:
https://github.com/prometheus-operator/prometheus-operator/blob/main/Doc
umentation/user-guides/storage.md
544 ##
545 storage:
546 volumeClaimTemplate:
547 spec:
548 storageClassName: nks-block-storage
549 accessModes: ["ReadWriteOnce"]
550 resources:
551 requests:
552 storage: 50Gi
553 # selector: {}
추가
697 ## Using default values from
https://github.com/grafana/helm-charts/blob/main/charts/grafana/values.y
aml
698 ##
699 grafana:
700 enabled: true
701 namespaceOverride: ""
702
703 # override configuration by hoon
704 persistence:
705 enabled: true
706 type: pvc](https://image.slidesharecdn.com/day2-prometheusonnkswhelm-v3-221223012938-d1aa3ebd/75/Prometheus-on-NKS-14-2048.jpg)
![707 storageClassName: nks-block-storage
708 accessModes:
709 - ReadWriteOnce
710 size: 100Gi
711 finalizers:
712 - kubernetes.io/pvc-protection
수정
726 ## Timezone for the default dashboards
727 ## Other options are: browser or a specific timezone, i.e.
Europe/Luxembourg
728 ##
729 defaultDashboardsTimezone: utc
730
731 adminPassword: admin
732
수정
2580 ## Prometheus StorageSpec for persistent data
2581 ## ref:
https://github.com/prometheus-operator/prometheus-operator/blob/main/Doc
umentation/user-guides/storage.md
2582 ##
2583 storageSpec:
2584 ## Using PersistentVolumeClaim
2585 ##
2586 volumeClaimTemplate:
2587 spec:
2588 storageClassName: nks-block-storage
2589 accessModes: ["ReadWriteOnce"]
2590 resources:
2591 requests:
2592 storage: 50Gi
2593 # selector: {}
3.helm install 실행
root@k8s-console:~# helm install
prometheus-community/kube-prometheus-stack](https://image.slidesharecdn.com/day2-prometheusonnkswhelm-v3-221223012938-d1aa3ebd/75/Prometheus-on-NKS-15-2048.jpg)
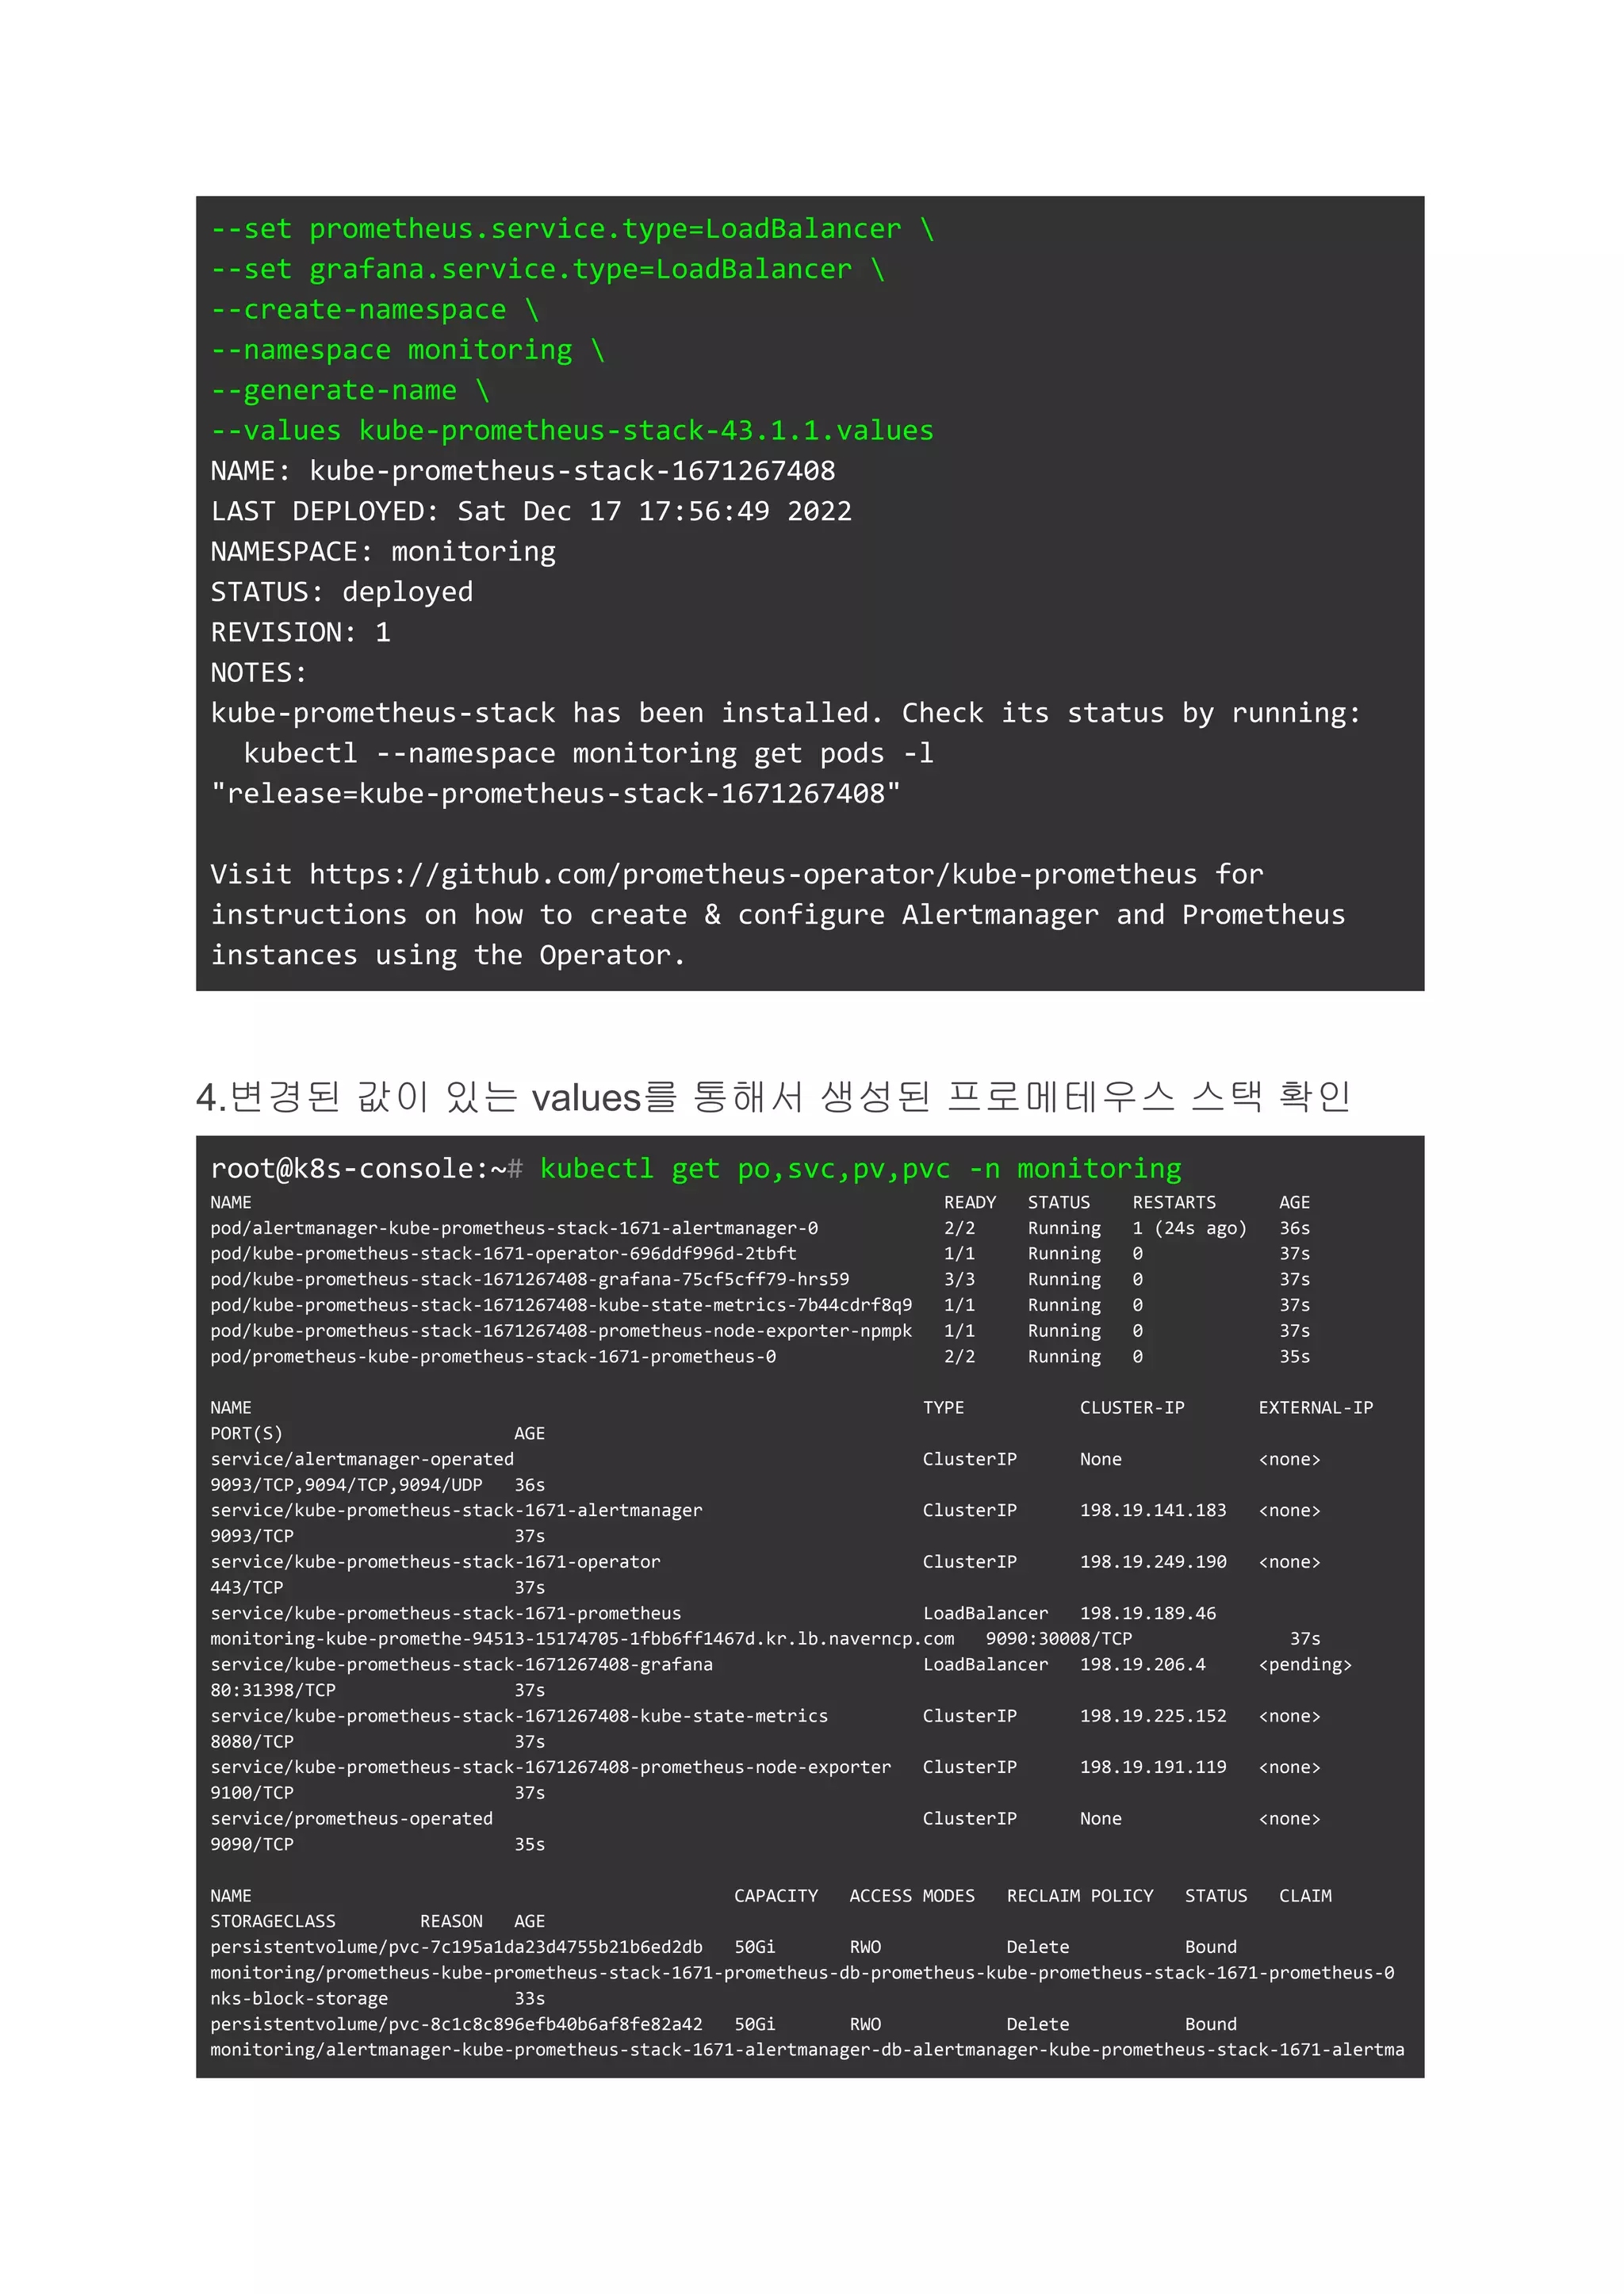
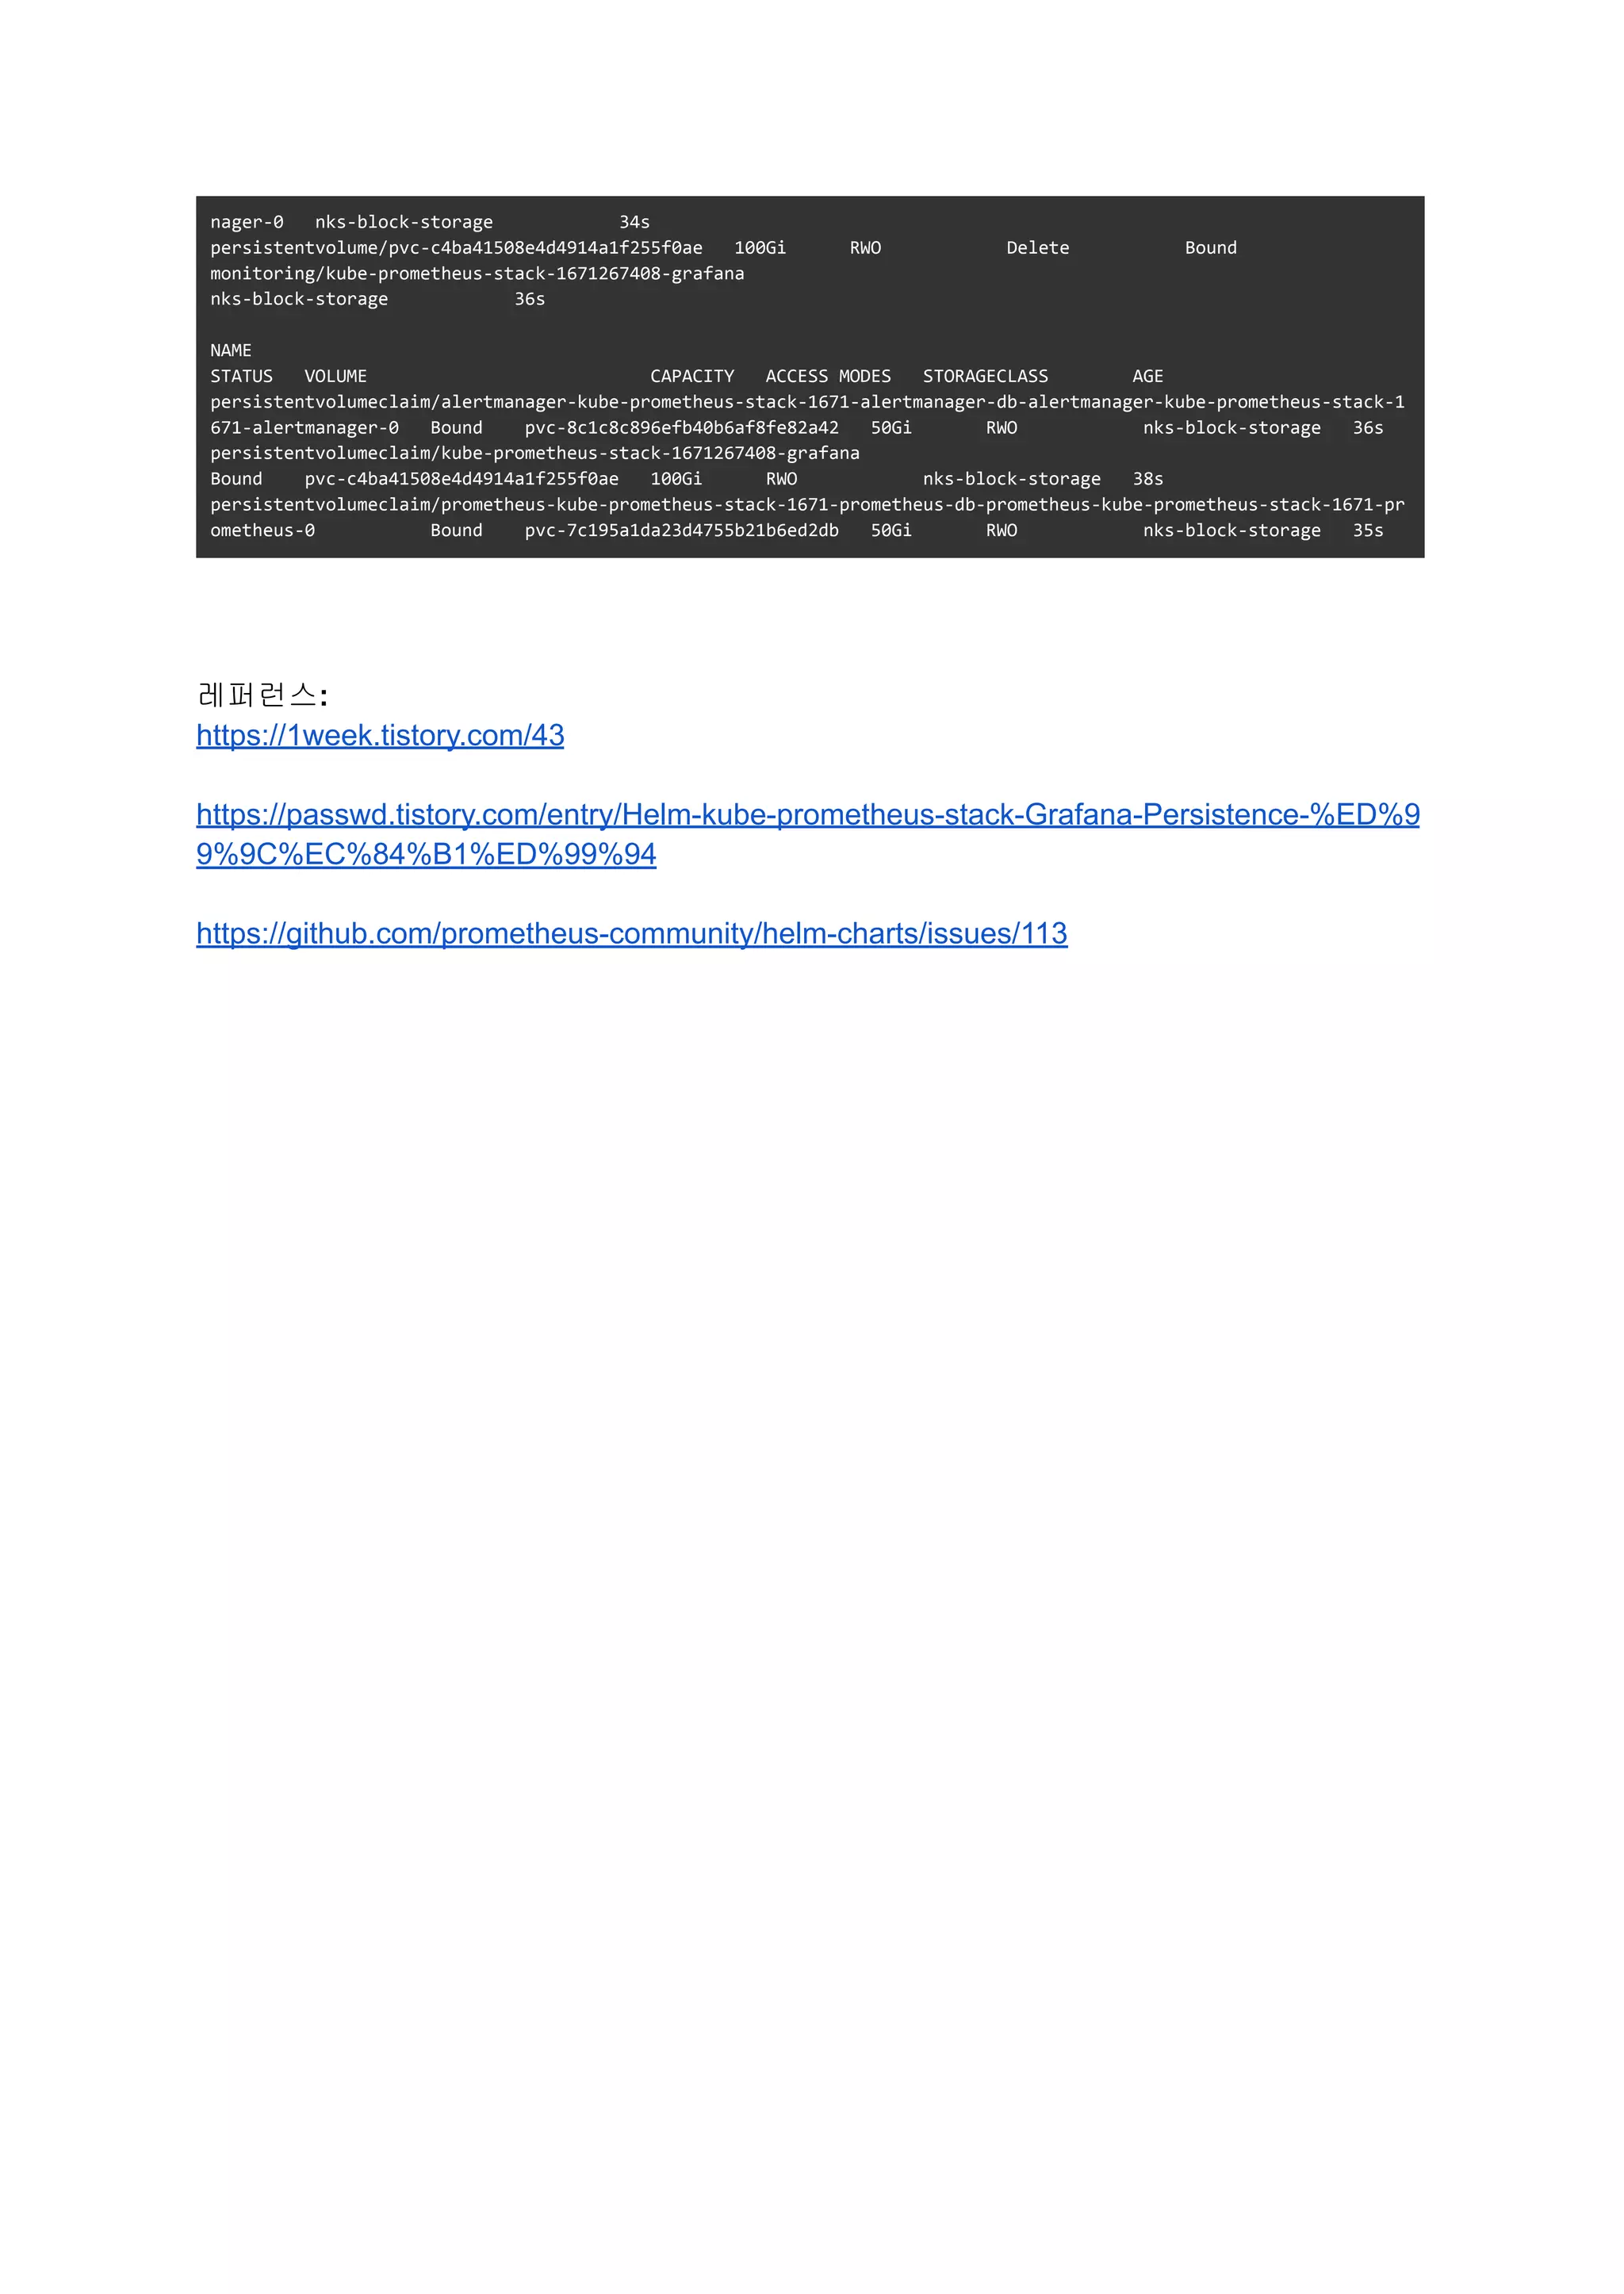

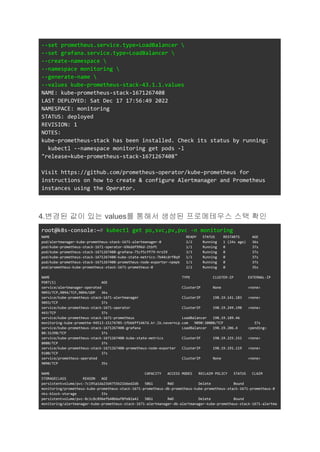
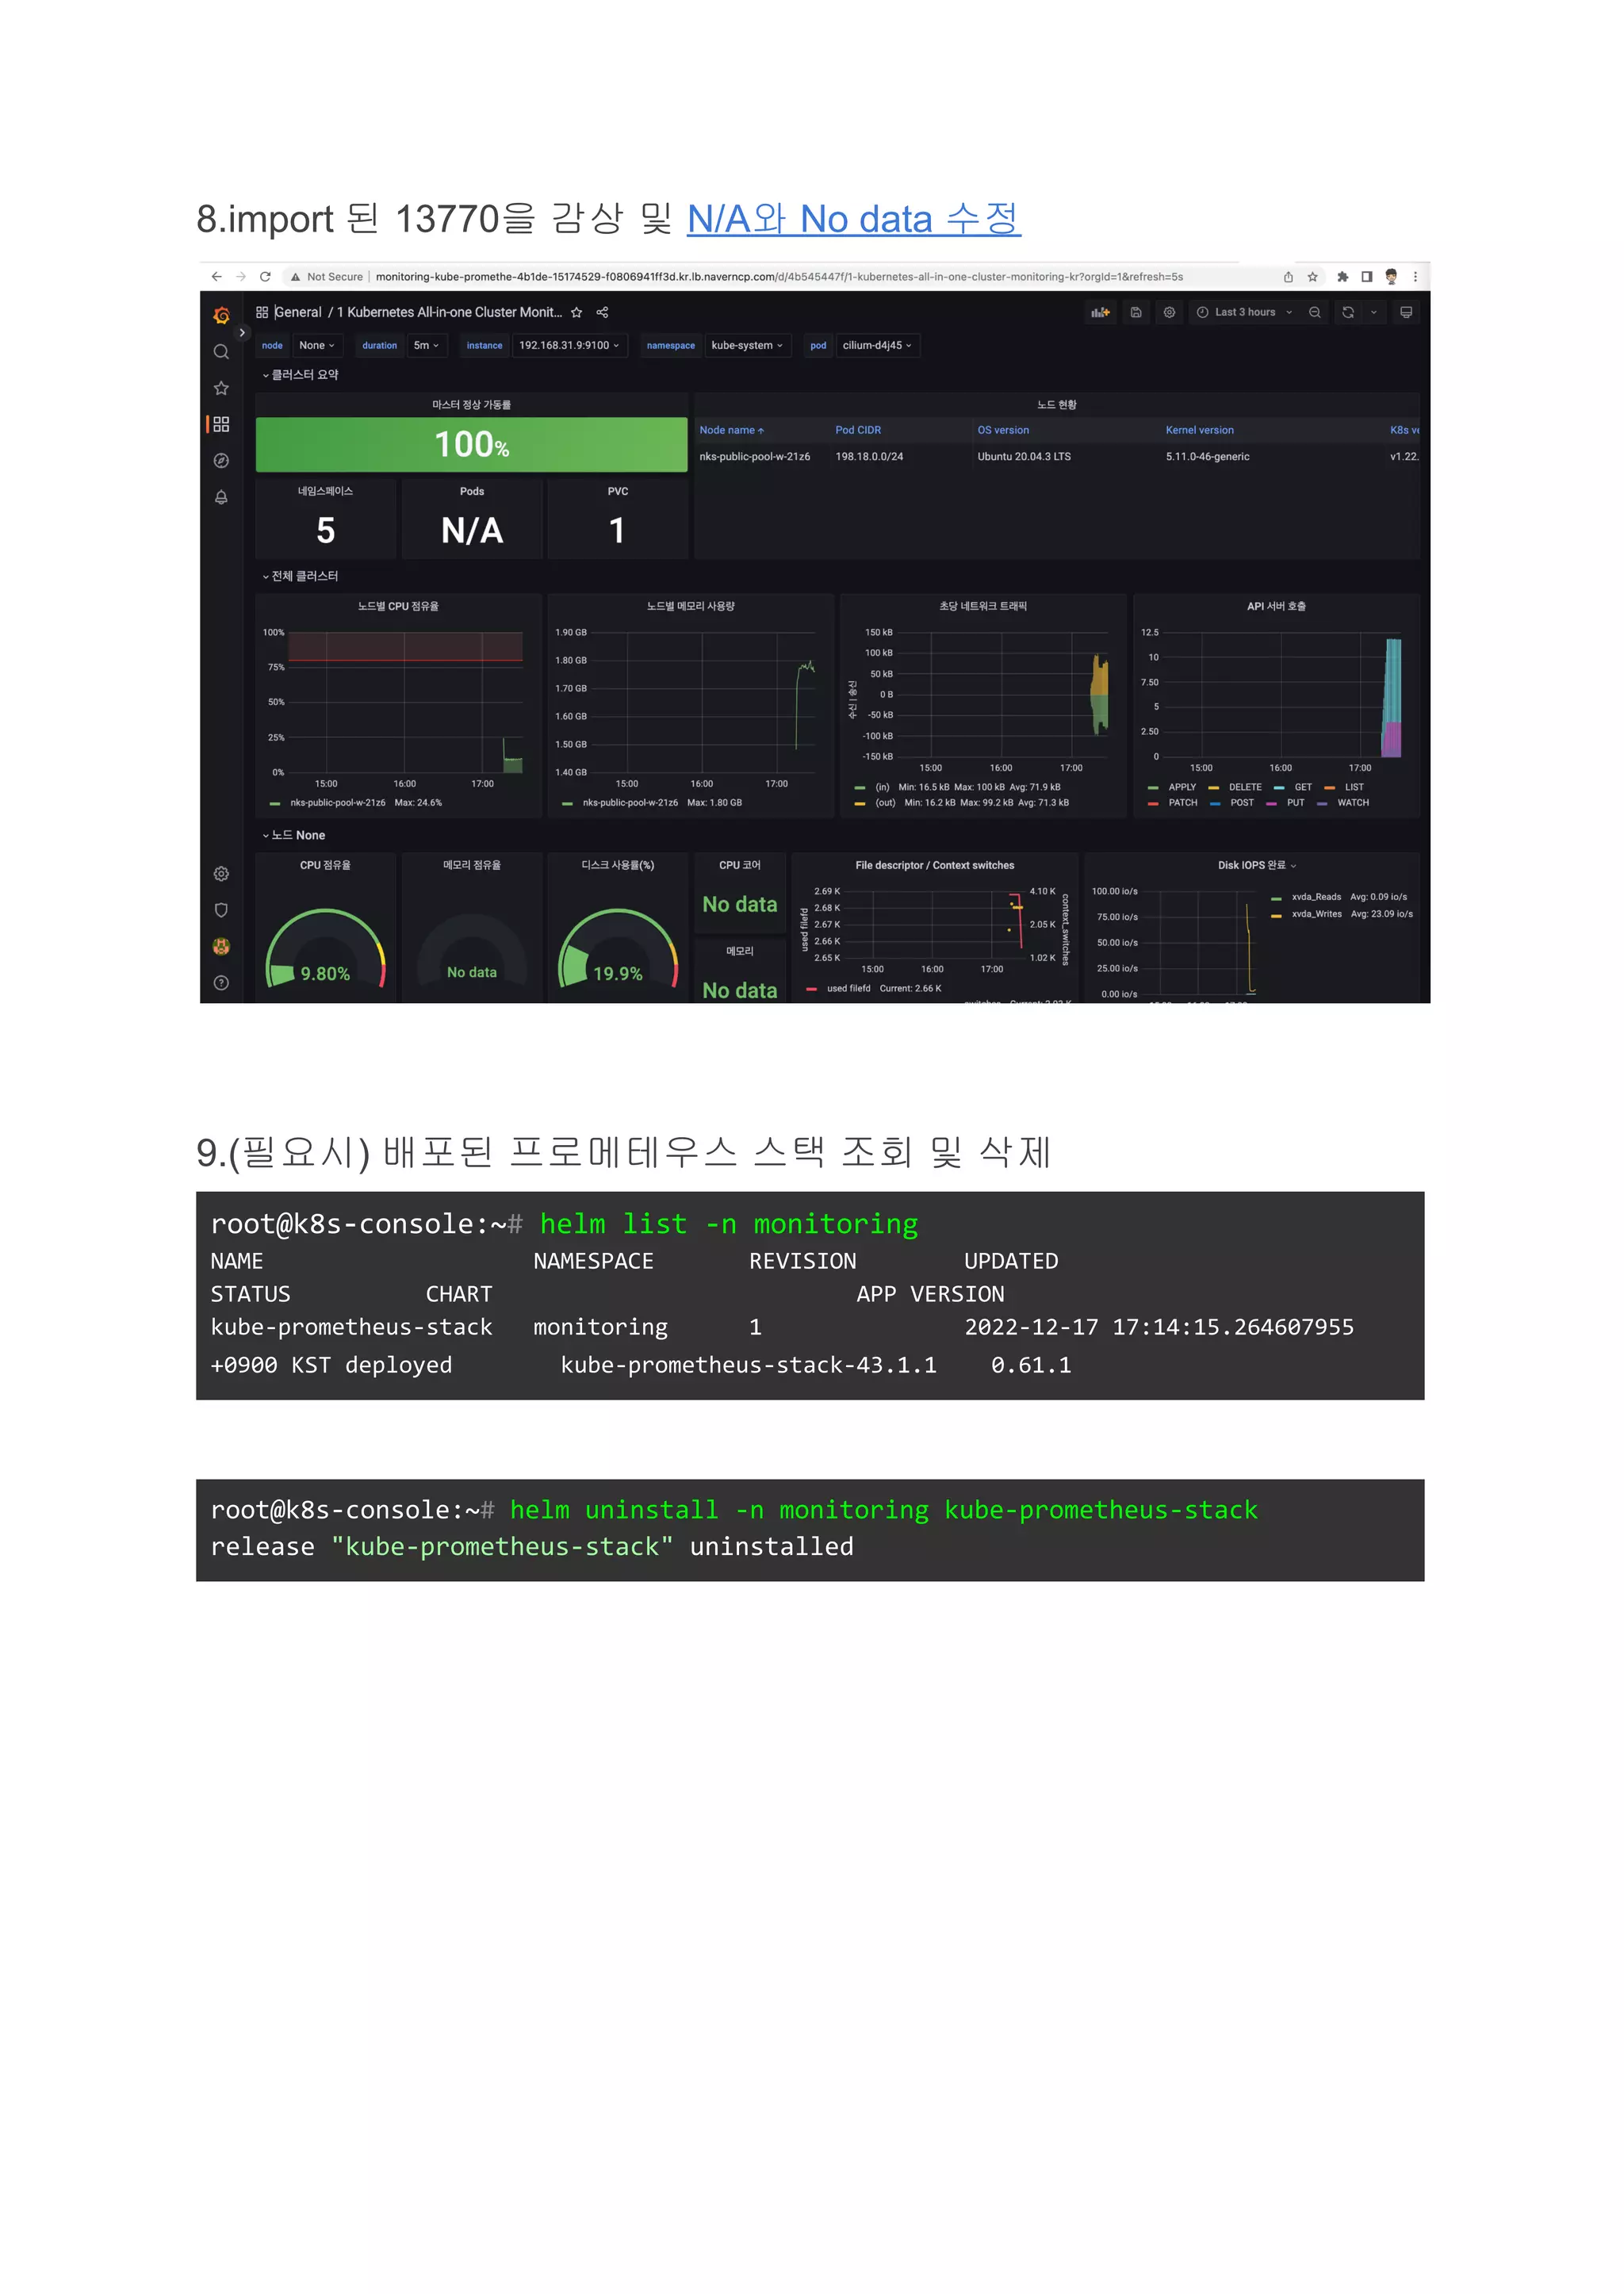
The document provides instructions for deploying Prometheus and the Kube Prometheus Stack on NKS. Key steps include: 1. Deploying Prometheus using Helm with custom storage class and service type settings. 2. Verifying successful deployment by checking pods, services, and accessing the Prometheus UI. 3. Deploying the Kube Prometheus Stack using Helm, again with custom storage class and service type settings. 4. Verifying successful deployment including checking pods, services, and accessing the Grafana UI with default credentials to view pre-configured dashboards importing from Prometheus data.


![[2018] MySQL 이중화 진화기](https://cdn.slidesharecdn.com/ss_thumbnails/cloudinfra03-190131073325-thumbnail.jpg?width=600ounds&width=560&fit=bounds)


![[AWS Builders] AWS 네트워크 서비스 소개 및 사용 방법 - 김기현, AWS 솔루션즈 아키텍트](https://cdn.slidesharecdn.com/ss_thumbnails/1network-191112092246-thumbnail.jpg?width=600ounds&width=560&fit=bounds)


![[오픈소스컨설팅] 프로메테우스 모니터링 살펴보고 구성하기](https://cdn.slidesharecdn.com/ss_thumbnails/oscprometheus-190422050231-thumbnail.jpg?width=600ounds&width=560&fit=bounds)

![[OpenInfra Days Korea 2018] Day 2 - E6 - OpenInfra monitoring with Prometheus](https://cdn.slidesharecdn.com/ss_thumbnails/e61520monitoringopeninfrawithprometheusv1-180704062709-thumbnail.jpg?width=600ounds&width=560&fit=bounds)


![[OpenInfra Days Korea 2018] Day 2 - E5-1: "Invited Talk: Kubicorn - Building ...](https://cdn.slidesharecdn.com/ss_thumbnails/e60955buildingsimplekubernetes-180705043459-thumbnail.jpg?width=600ounds&width=560&fit=bounds)


![[GitOps] Argo CD on GKE (v0.9.2).pdf](https://cdn.slidesharecdn.com/ss_thumbnails/gitopsargocdongkev0-230424043339-b312ca19-thumbnail.jpg?width=600ounds&width=560&fit=bounds)
![[GuideDoc] Deploy EKS thru eksctl - v1.22_v0.105.0.pdf](https://cdn.slidesharecdn.com/ss_thumbnails/guidedocdeployeksthrueksctl-v1-220715080545-0fb340c1-thumbnail.jpg?width=600ounds&width=560&fit=bounds)
![[네전따] 네트워크 엔지니어에게 쿠버네티스는 어떤 의미일까요](https://cdn.slidesharecdn.com/ss_thumbnails/kubernetesfornetworkengineer-211127091518-thumbnail.jpg?width=600ounds&width=560&fit=bounds)


![[네전따 27회] 네트워크 자동화 어렵지 않아요](https://cdn.slidesharecdn.com/ss_thumbnails/networkautomation-191112064240-thumbnail.jpg?width=600ounds&width=560&fit=bounds)
![[Cook book] ansible 4_dell emc networking](https://cdn.slidesharecdn.com/ss_thumbnails/cookbookansible4dellemcnetworking-190905050431-thumbnail.jpg?width=600ounds&width=560&fit=bounds)


![[Ansible] open network automation](https://cdn.slidesharecdn.com/ss_thumbnails/publishopennetworkautomationbyansible169v2-190719010808-thumbnail.jpg?width=600ounds&width=560&fit=bounds)


![UiPath Automation Suite Installation (Hands-On) [2/3]](https://cdn.slidesharecdn.com/ss_thumbnails/automationsuitecommunitysession2-251015095633-a6d862f1-thumbnail.jpg?width=600ounds&width=560&fit=bounds)


