seaborn_pandas_visualizationseaborn_pandas_visualizationseaborn_pandas_visualizationseaborn_pandas_visualizationseaborn_pandas_visualizationseaborn_pandas_visualizationseaborn_paseaborn_pandas_visualizationseaborn_pandas_visualizationseaborn_pandas_visualizationseaborn_pandas_visualizationseaborn_pandas_visualizationseaborn_pandas_visualizationseaborn_pandas_visualizationseaborn_pandas_visualizationseaborn_pandas_visualizationndas_visualizationseaborn_pandas_visualizationseaborn_pandas_visualizationseaborn_pandas_visualizationseaborn_pandas_visualizationseaborn_pandas_visualization, seaborn_pandas_visualization,,, seaborn_pandas_visualizationseaborn_pandas_visualization. seaborn is a library, python library

![Data Visualization with Pandas
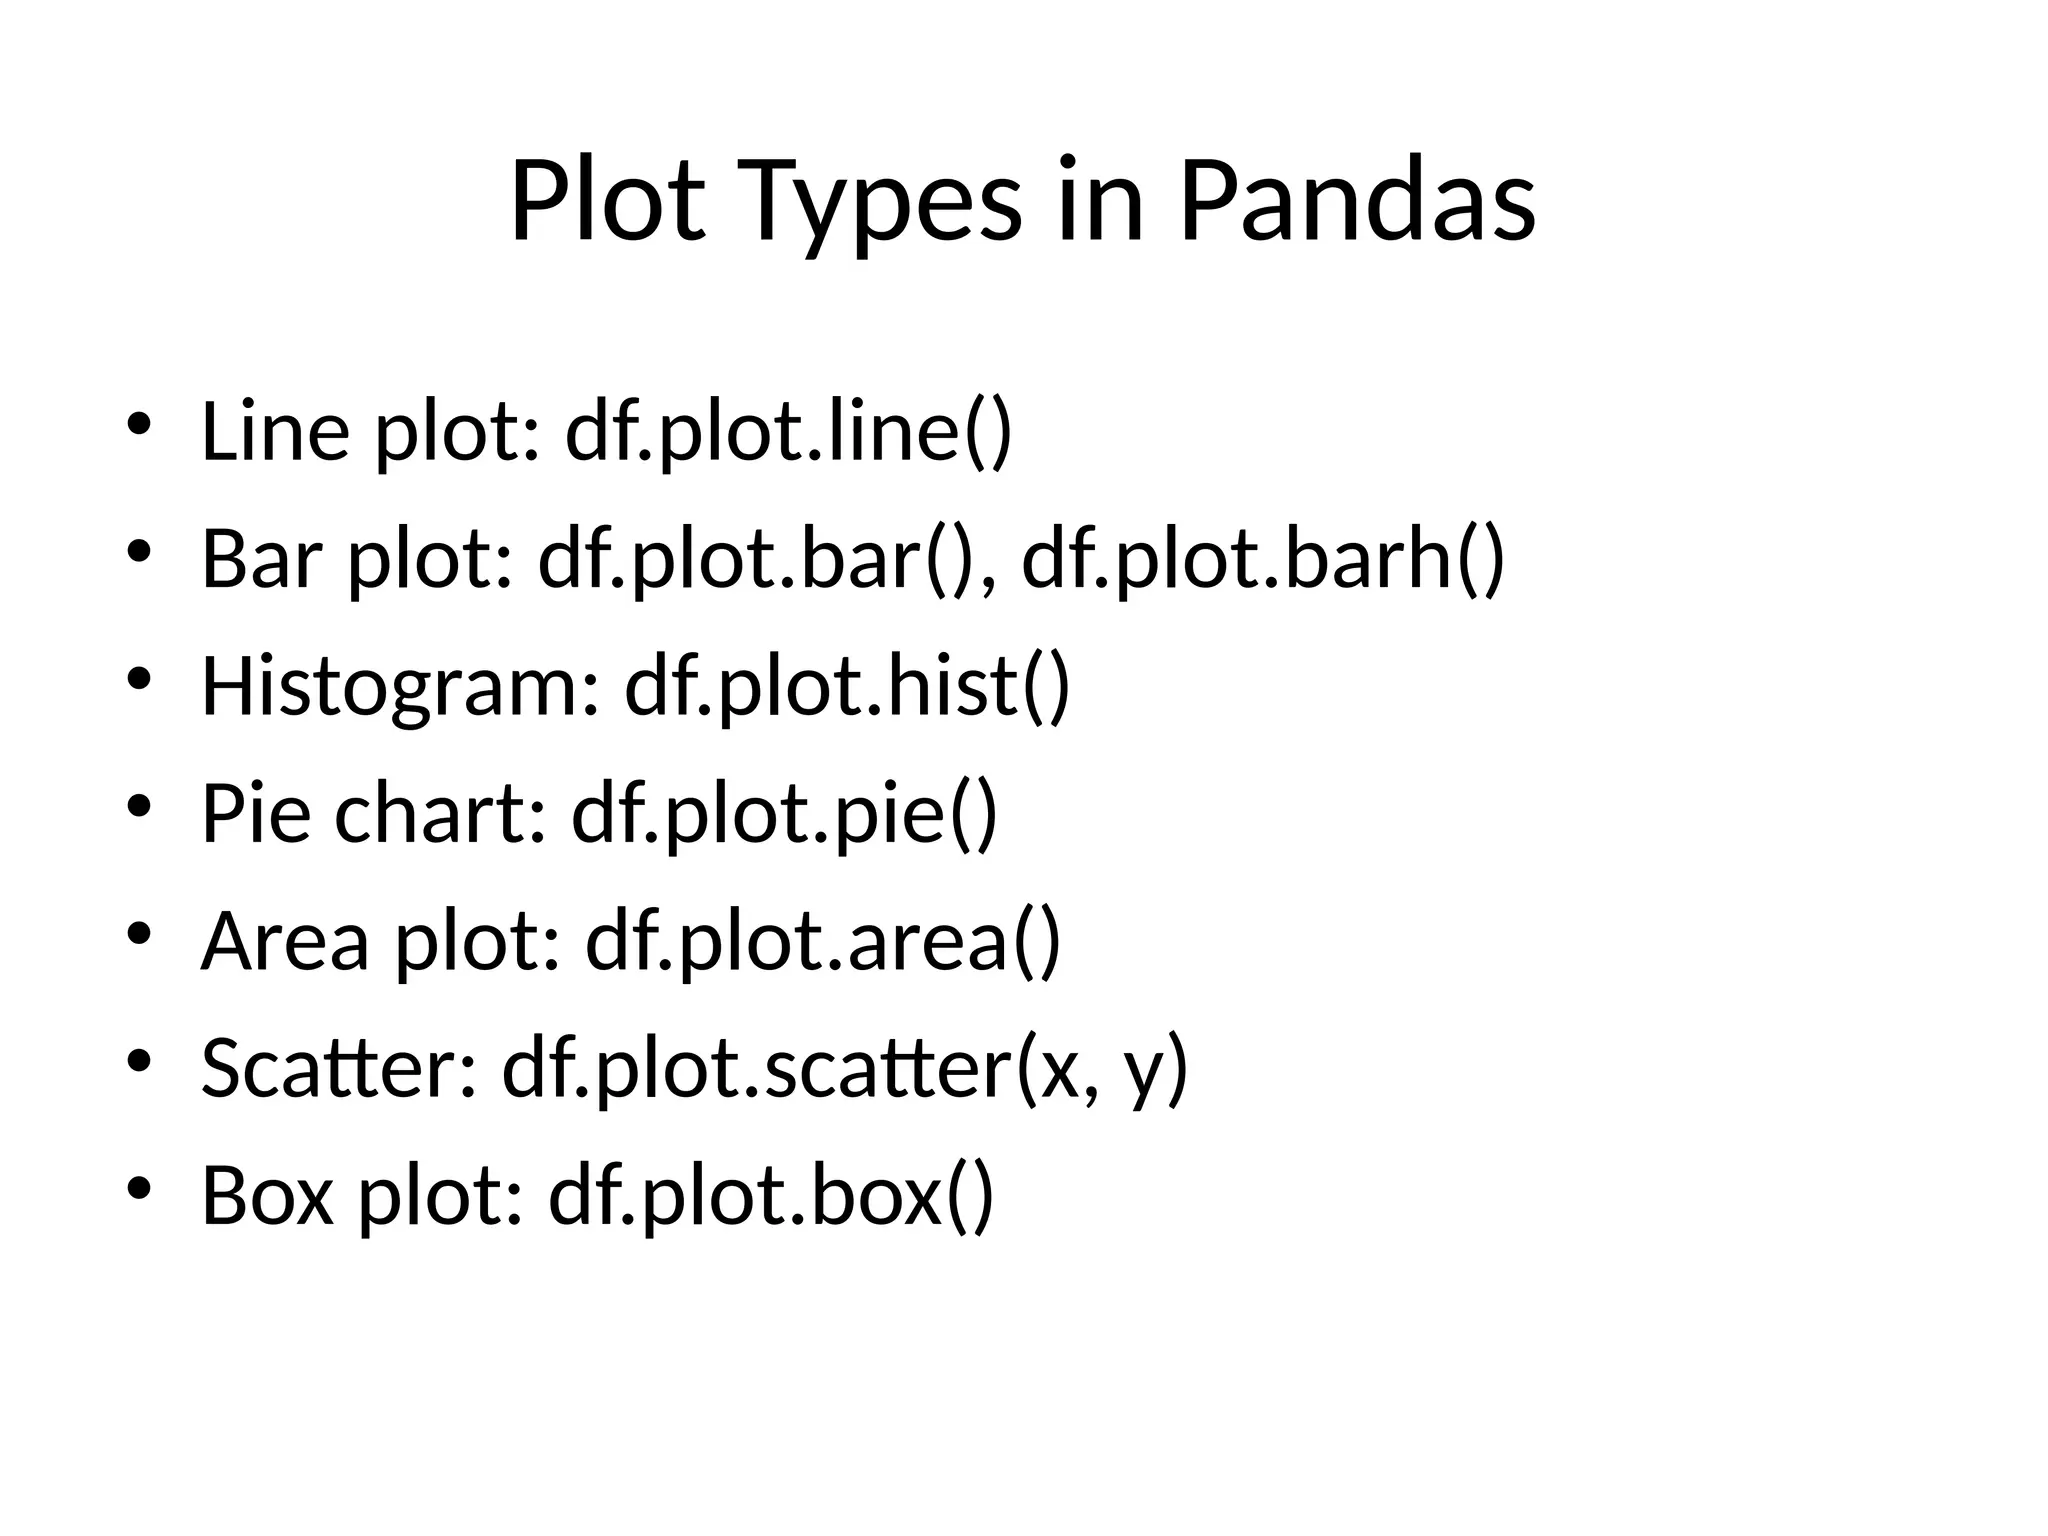
• Pandas has built-in plotting via .plot()
• Quick exploratory visualizations
• Uses Matplotlib under the hood
• Syntax: df.plot(kind='line'),
df['col'].plot(kind='hist')](https://image.slidesharecdn.com/seabornpandasvisualization-250929065302-de6355bb/85/seaborn_pandas_visualization_python-libraries-pptx-4-320.jpg)


![Data Visualization with Pandas
• Pandas has built-in plotting via .plot()
• Quick exploratory visualizations
• Uses Matplotlib under the hood
• Syntax: df.plot(kind='line'),
df['col'].plot(kind='hist')](https://image.slidesharecdn.com/seabornpandasvisualization-250929065302-de6355bb/75/seaborn_pandas_visualization_python-libraries-pptx-4-2048.jpg)


![python libray for data analytics seaborn[1].pptx](https://cdn.slidesharecdn.com/ss_thumbnails/pythonseaborn1-241222125910-e118d8f2-thumbnail.jpg?width=600ounds&width=560&fit=bounds)


![Matrix and determinant URT [Autosaved].pptx](https://cdn.slidesharecdn.com/ss_thumbnails/matrixanddeterminanturtautosaved-251018190340-9e6a6deb-thumbnail.jpg?width=600ounds&width=560&fit=bounds)


