Downloaded 20 times


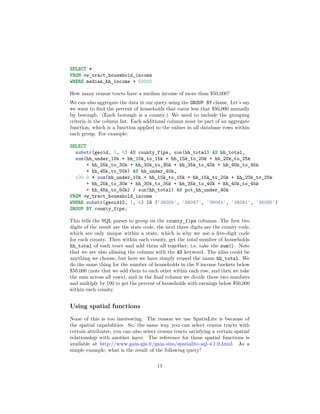
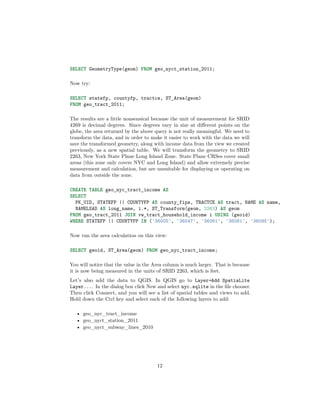
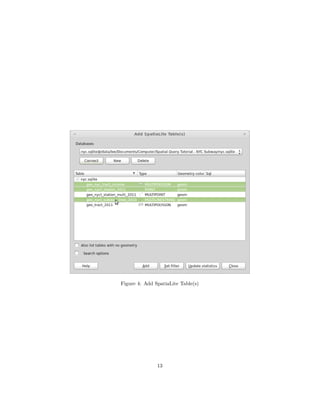
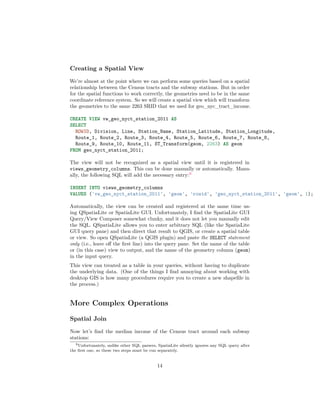
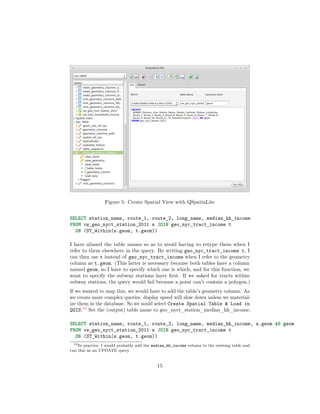
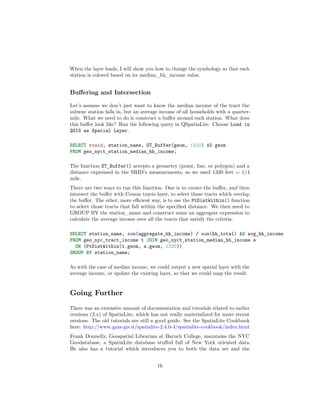
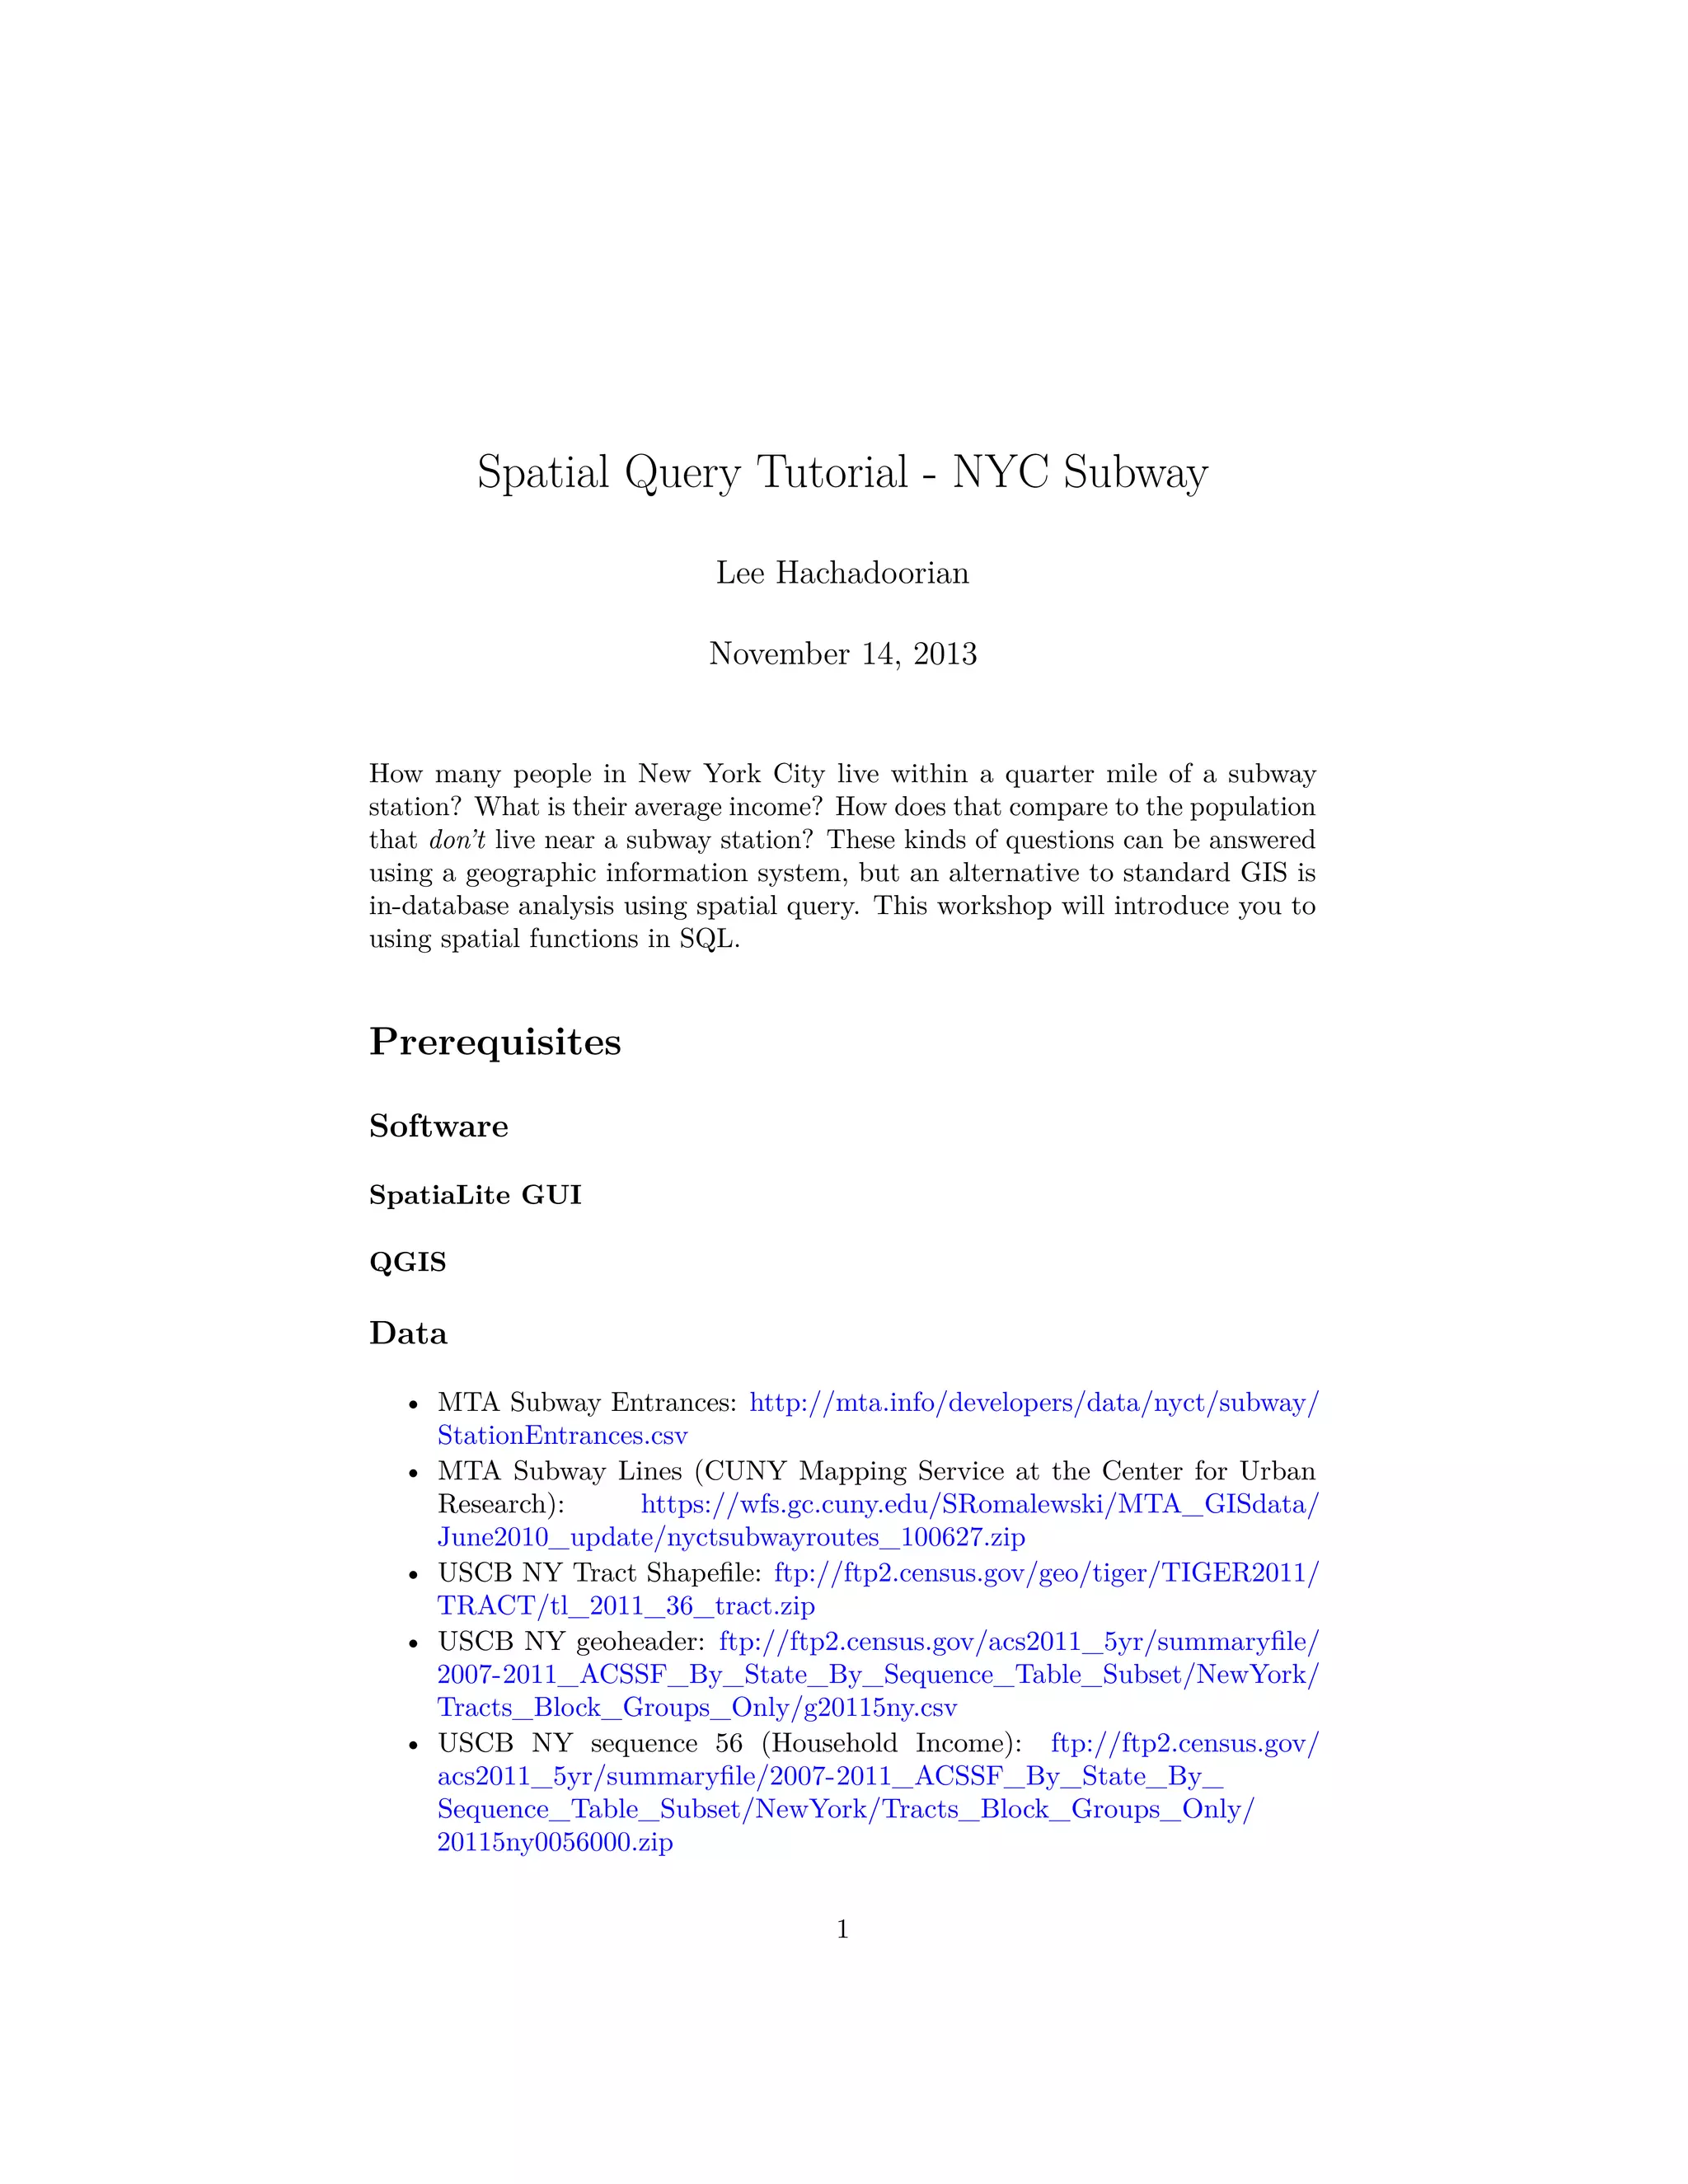
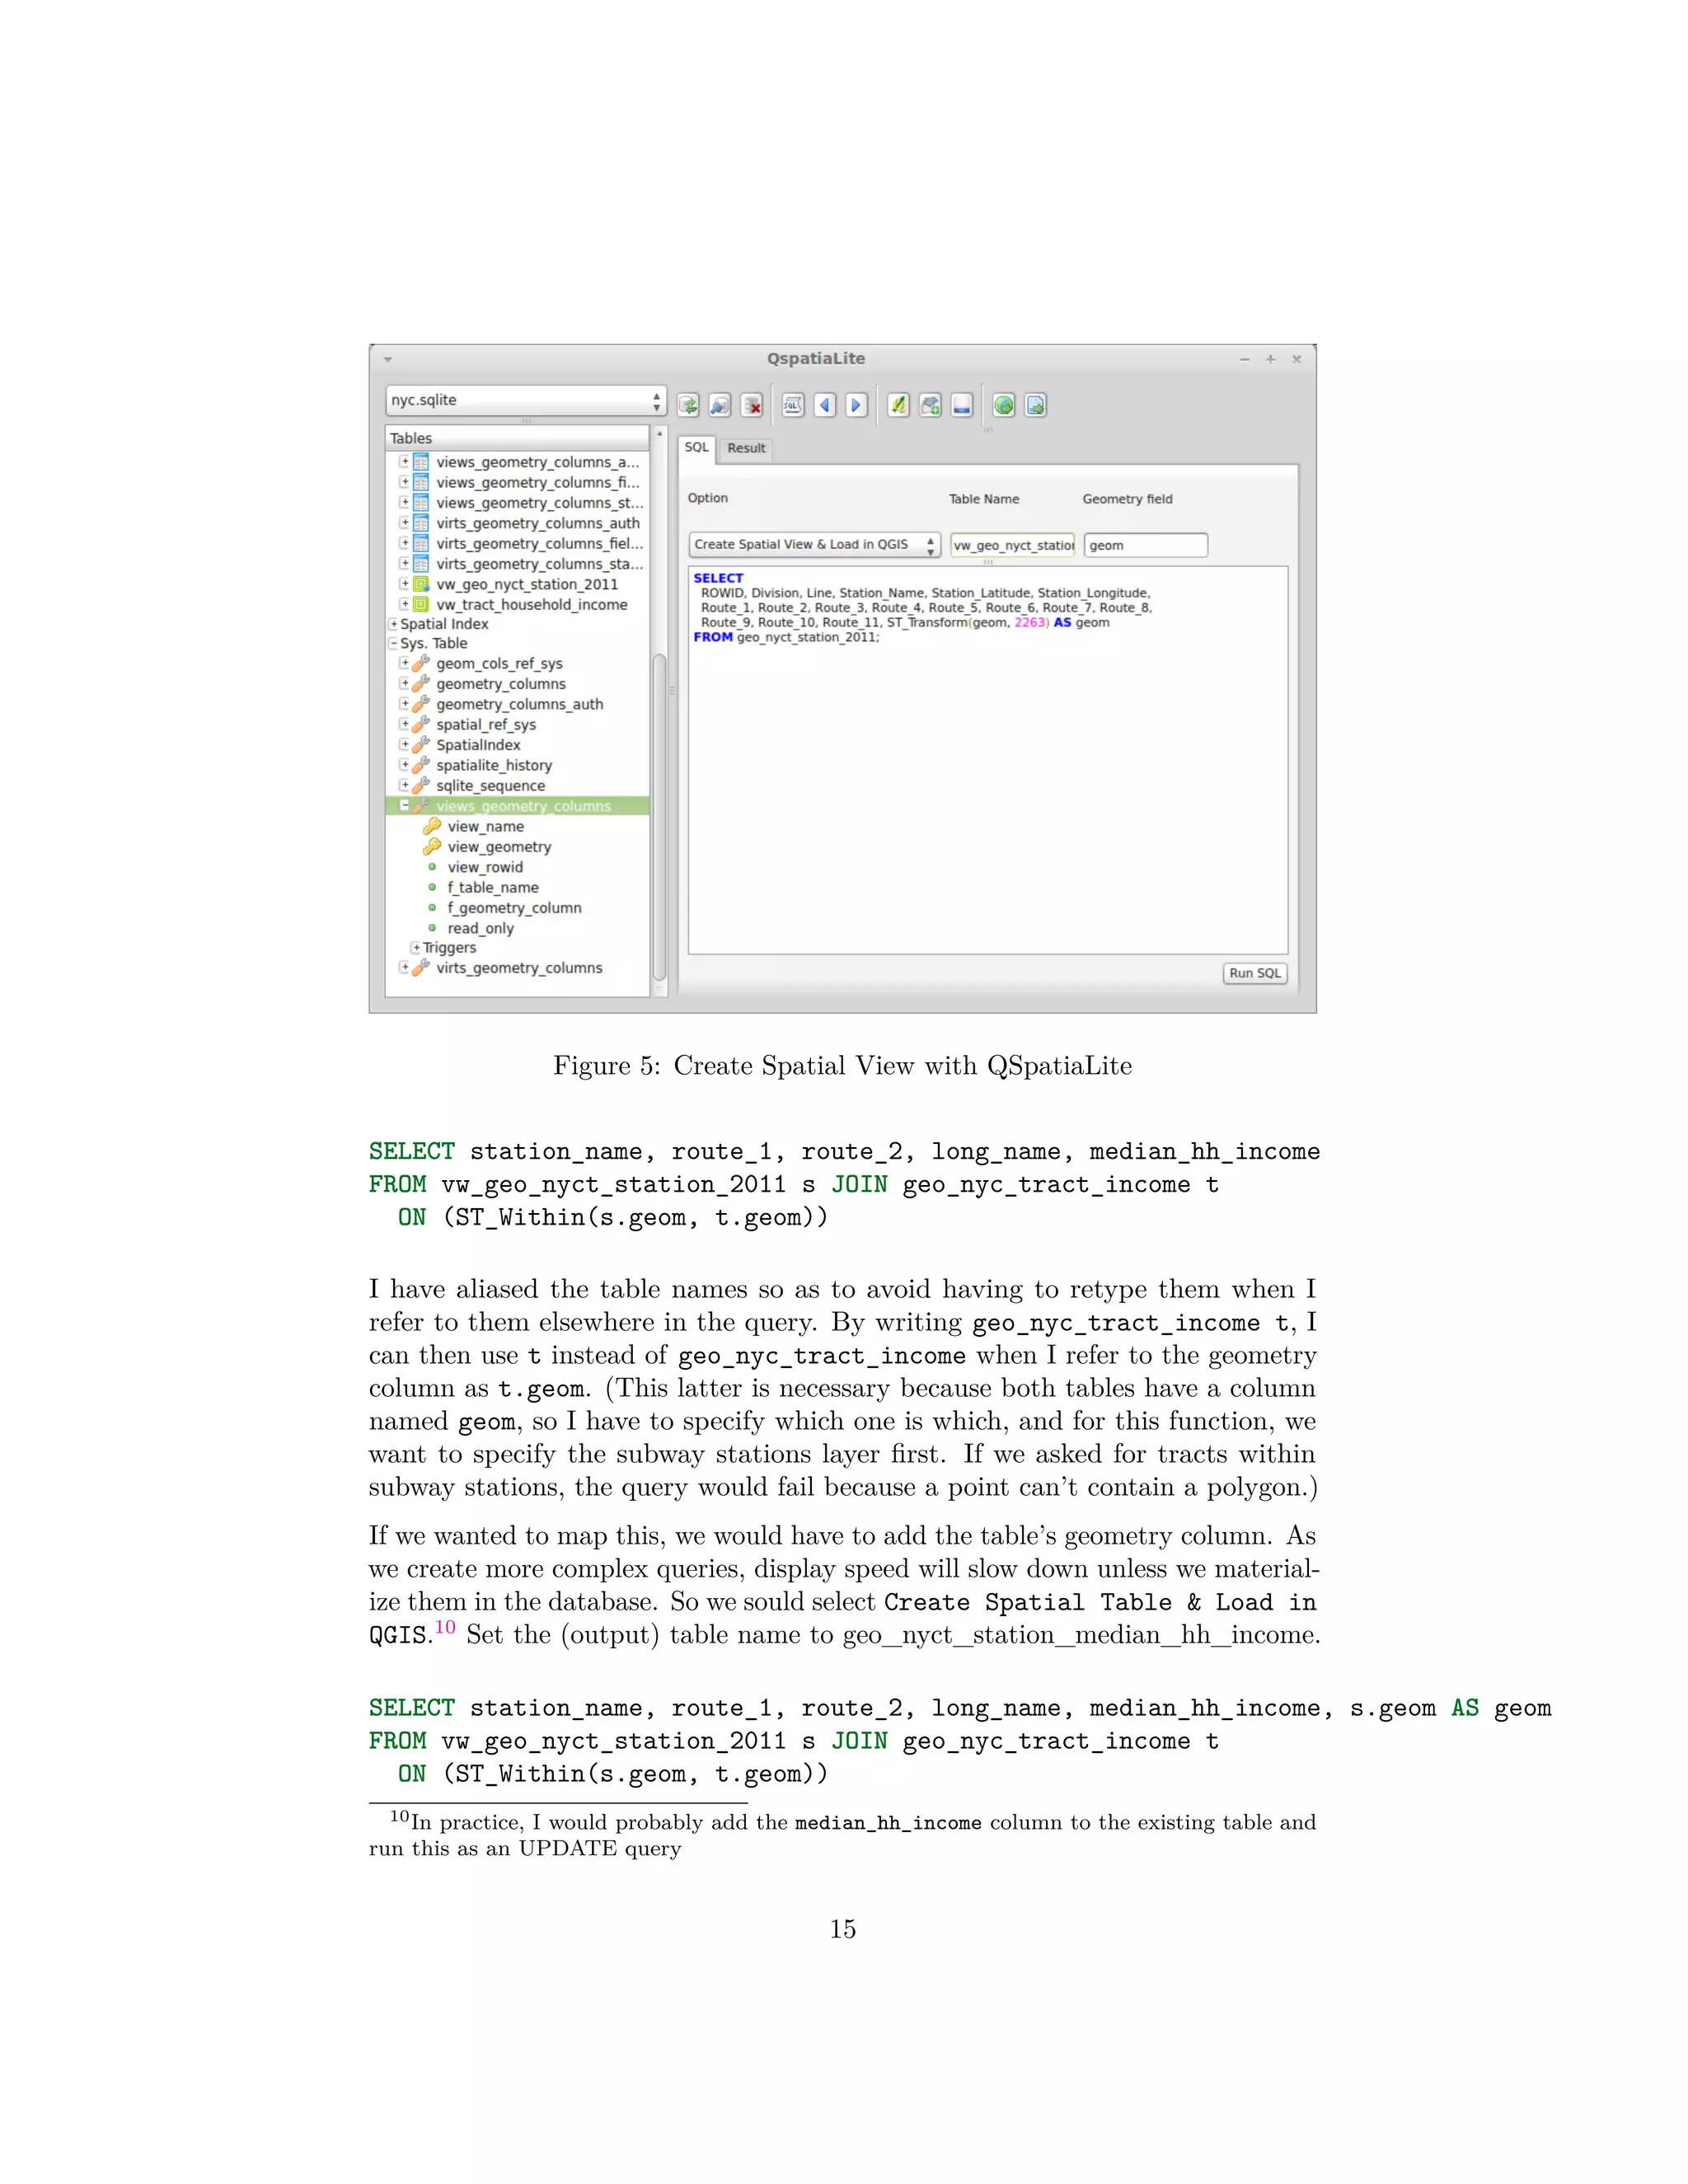

This document provides instructions for a spatial query tutorial on analyzing New York City subway data using SpatiaLite. It describes how to load MTA subway and census tract shapefile data, as well as csv files containing subway station and census income data, into a SpatiaLite database. It then explains how to create views to clean the raw data and perform joins between the spatial and attribute tables to enable spatial queries, such as determining the population within a quarter mile of subway stations and their average income.


