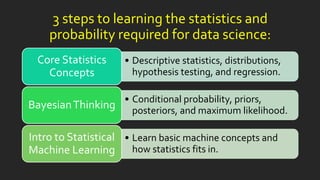
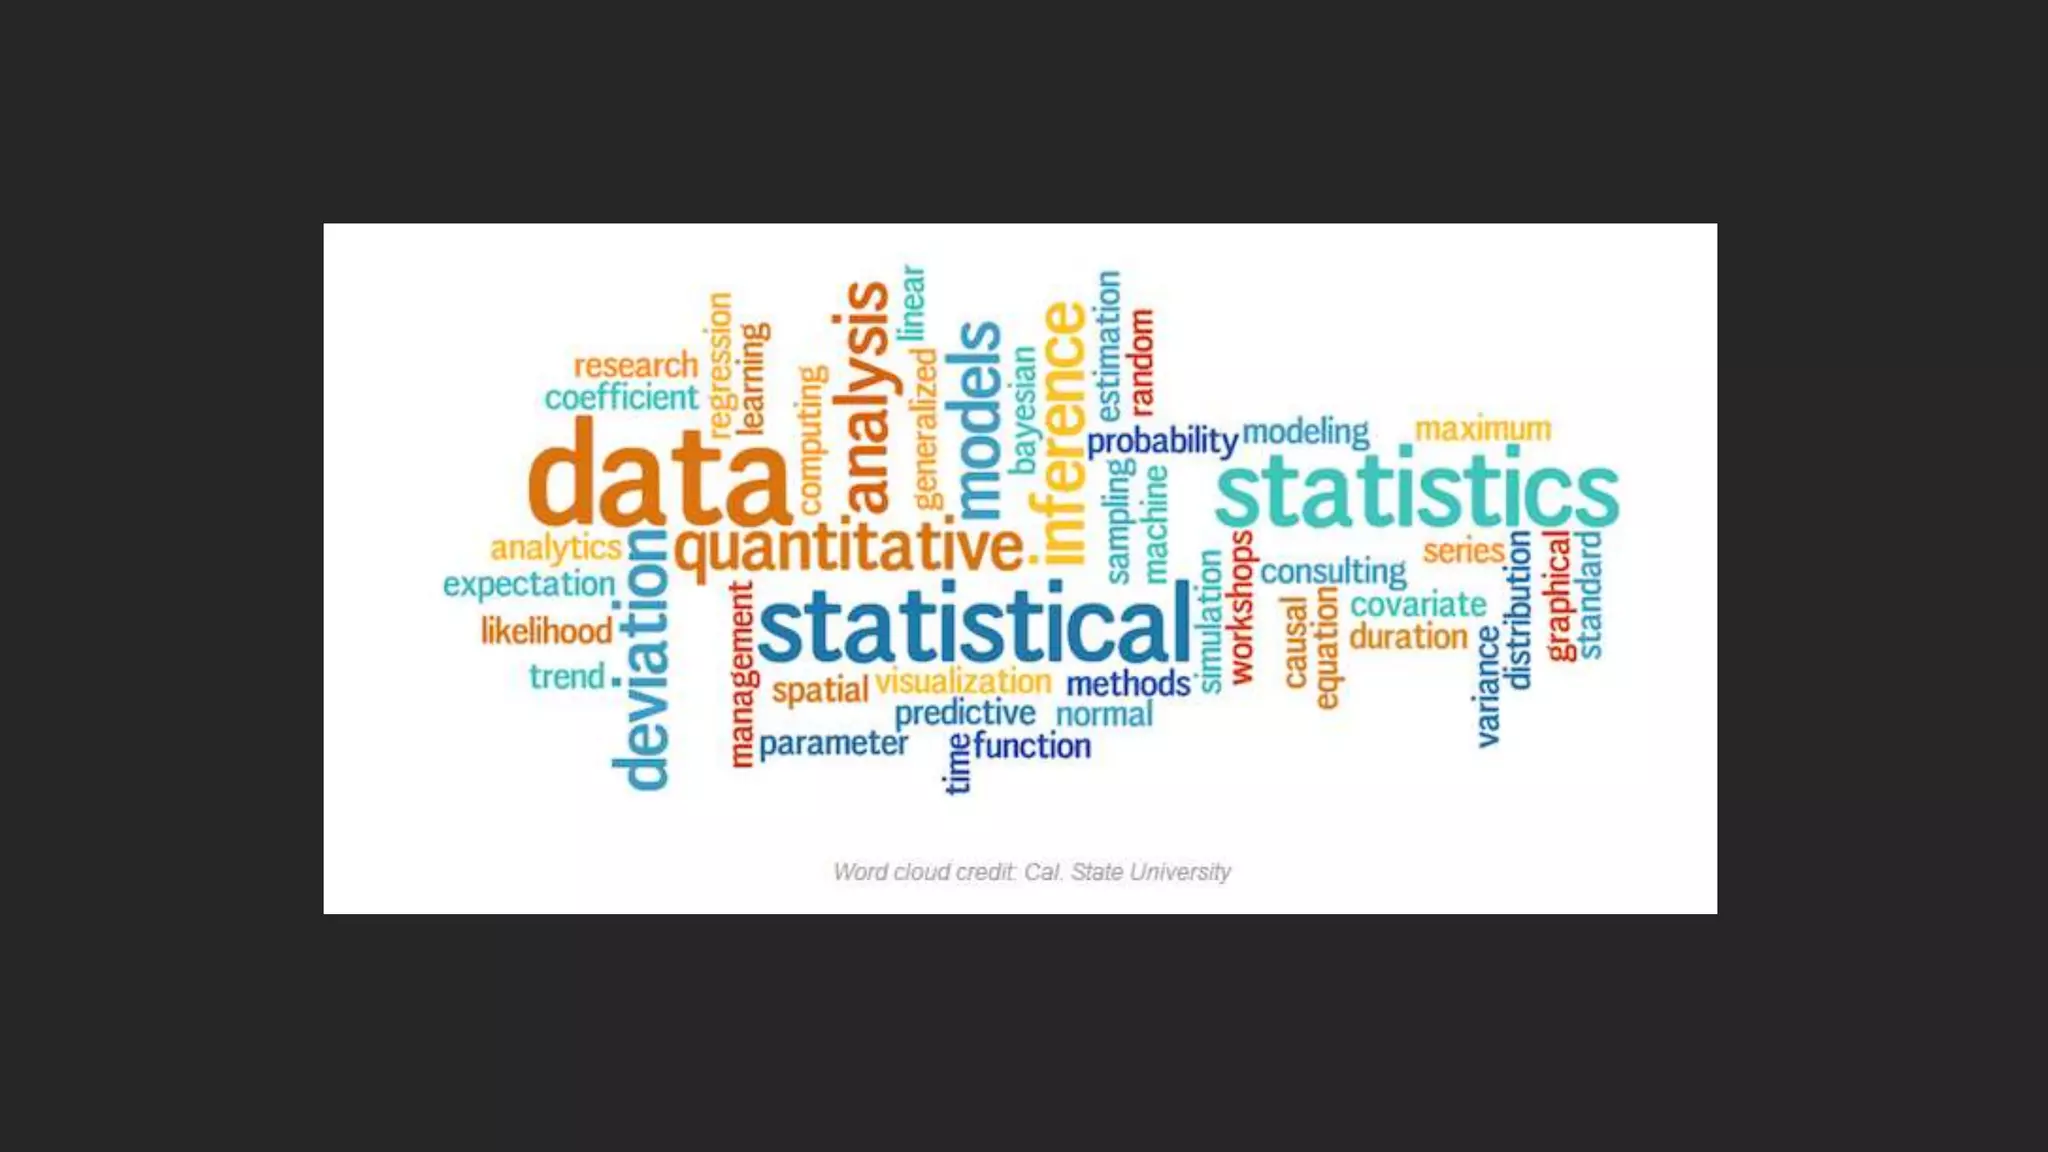
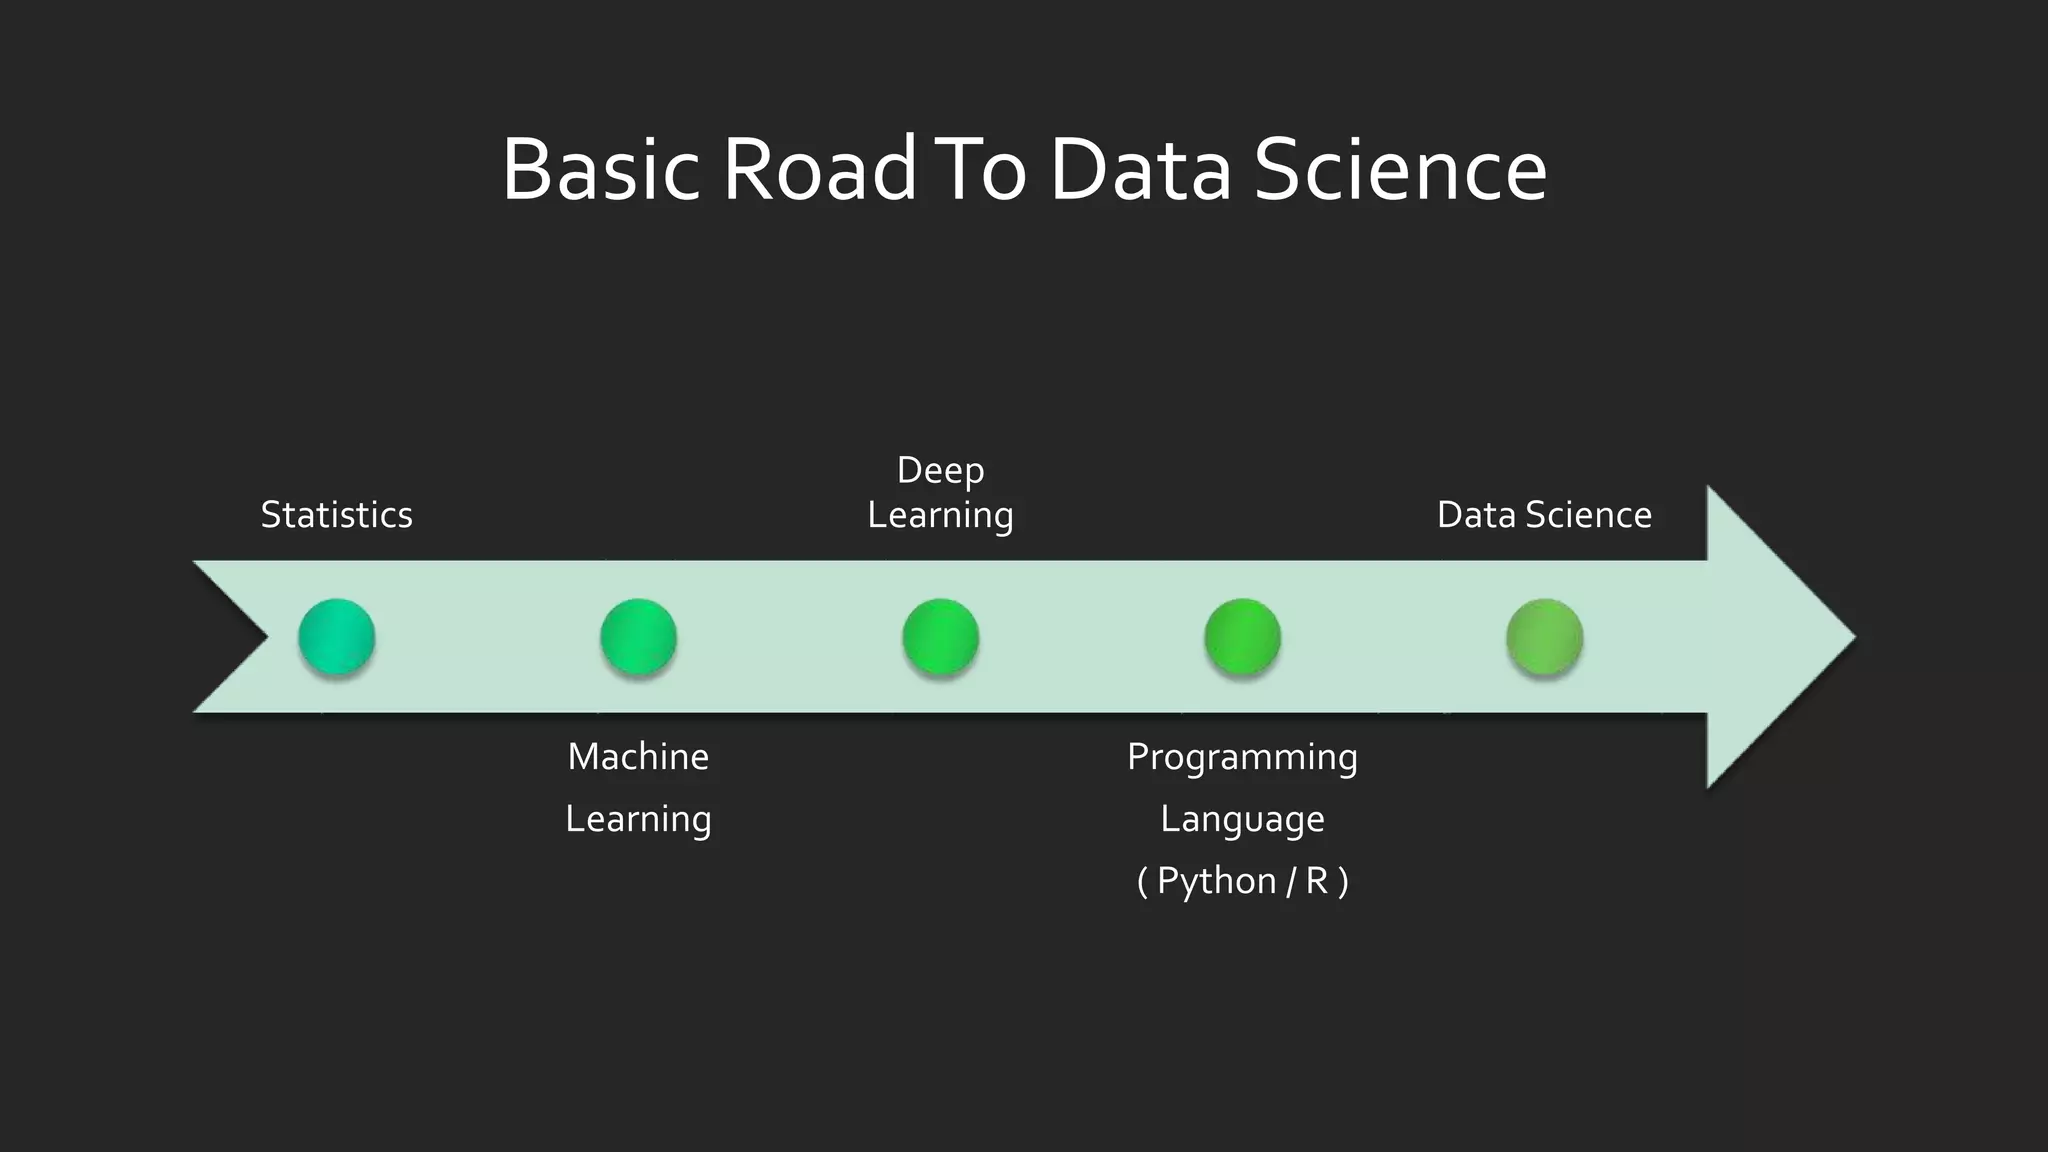
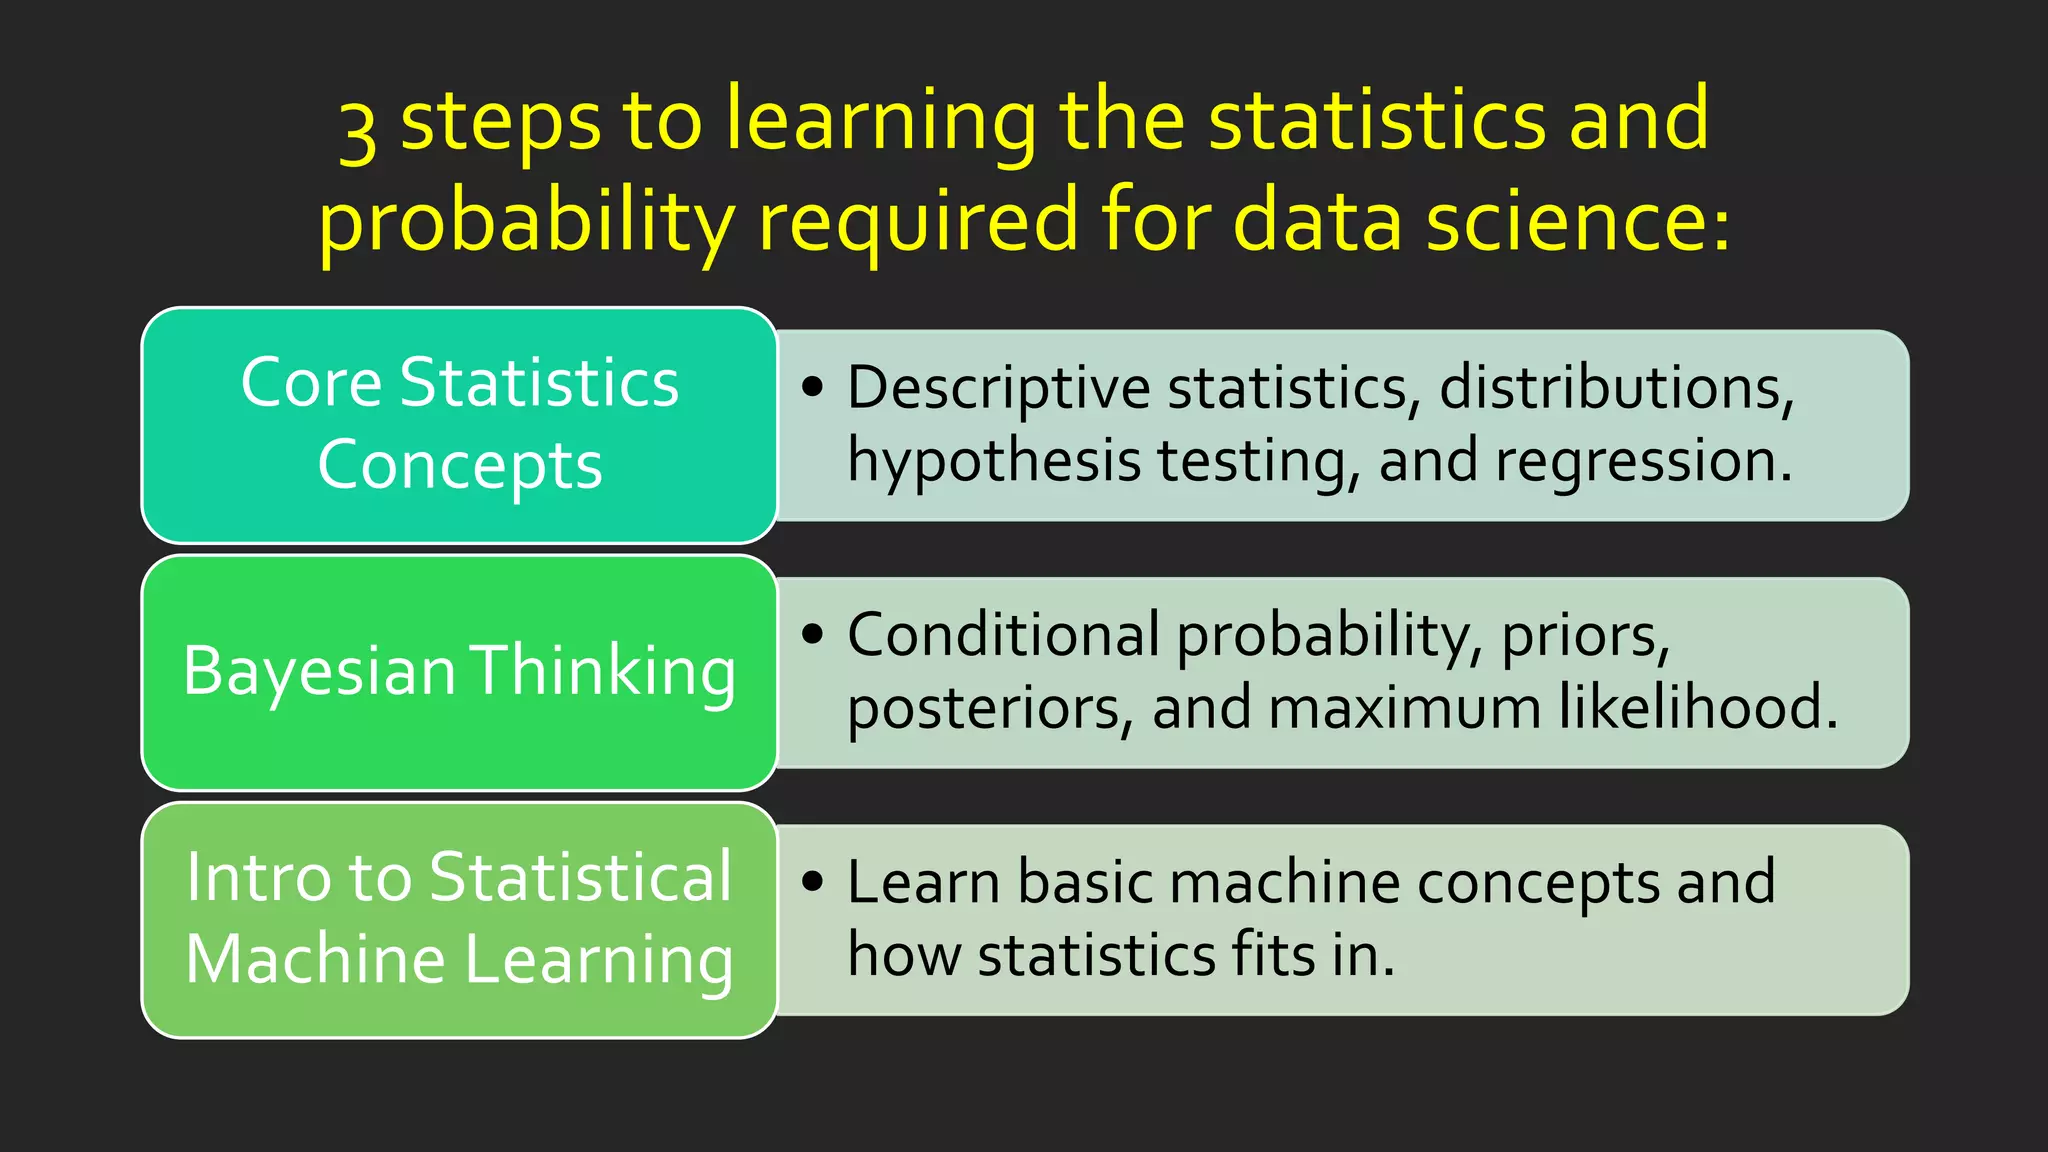
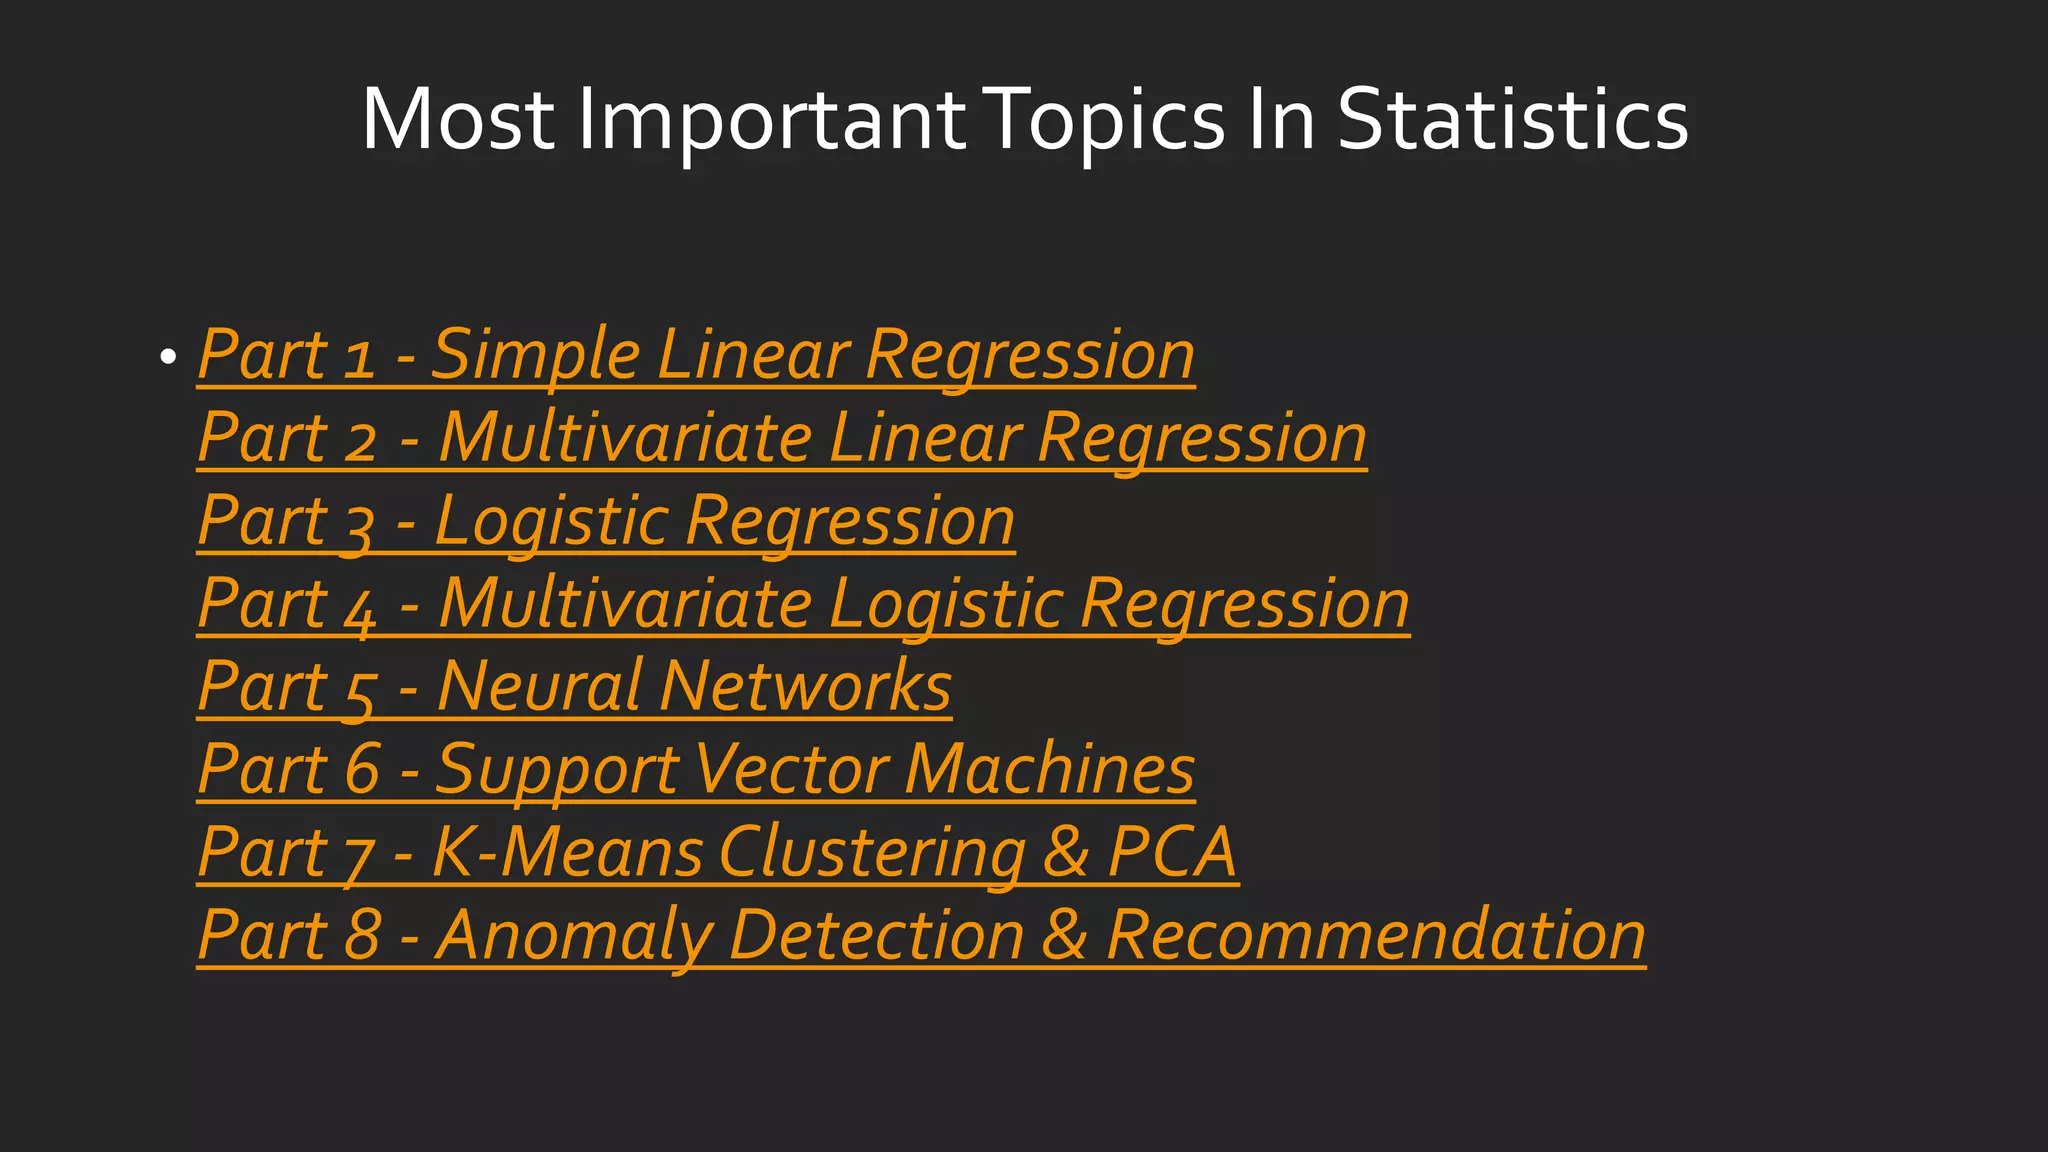
The document discusses learning statistics and probability concepts that are essential for data science, including descriptive statistics, distributions, hypothesis testing, regression, Bayesian thinking, and an introduction to statistical machine learning. It provides an overview of important topics in statistics for data science like linear regression, logistic regression, neural networks, and clustering. The document also includes code examples in Python for implementing simple linear regression on a sample dataset to predict profit based on population size.


![import os
import numpy as np
import pandas as pd
import matplotlib.pyplot as plt
%matplotlib inline
path = os.getcwd() + 'dataex1data1.txt'
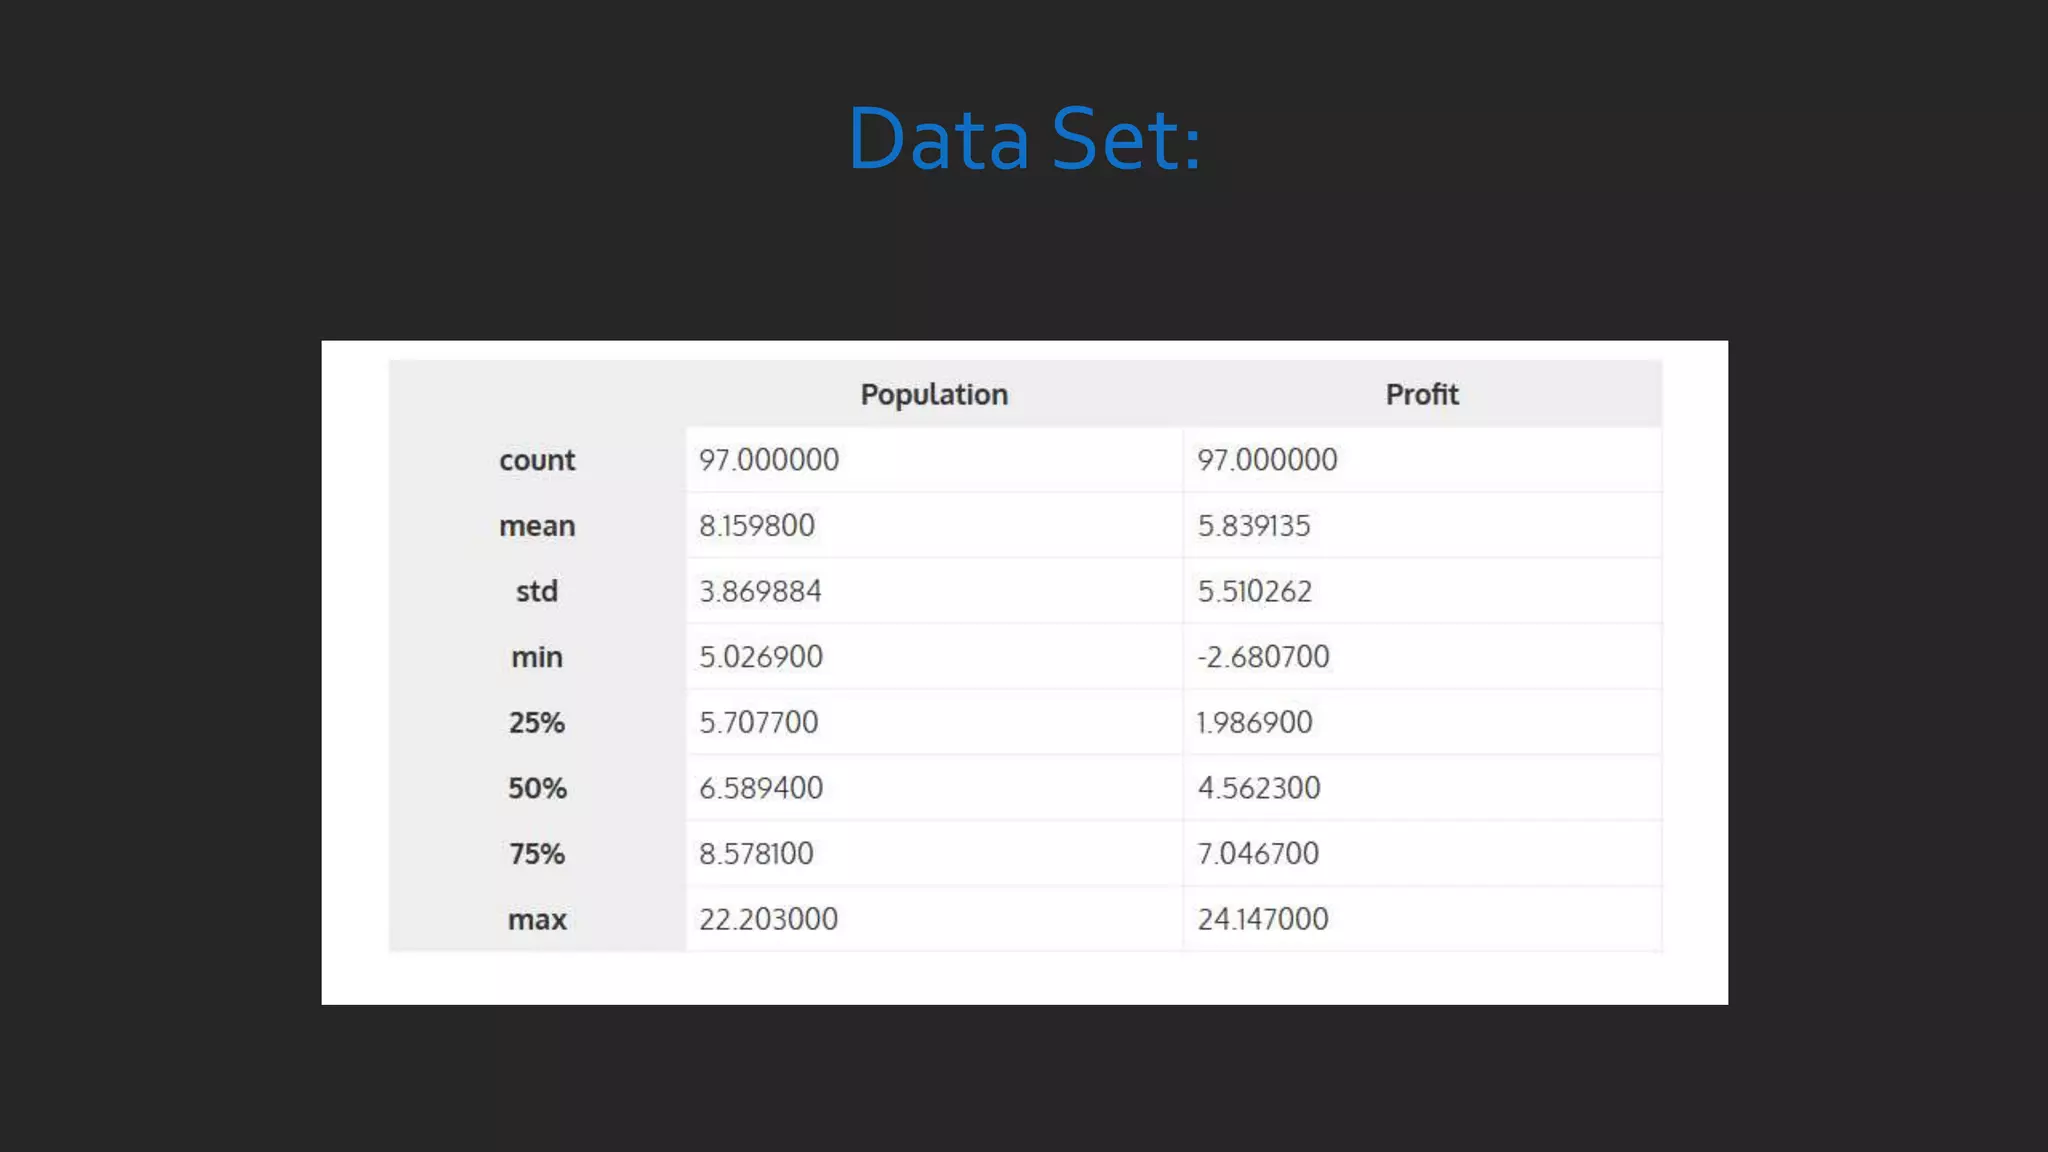
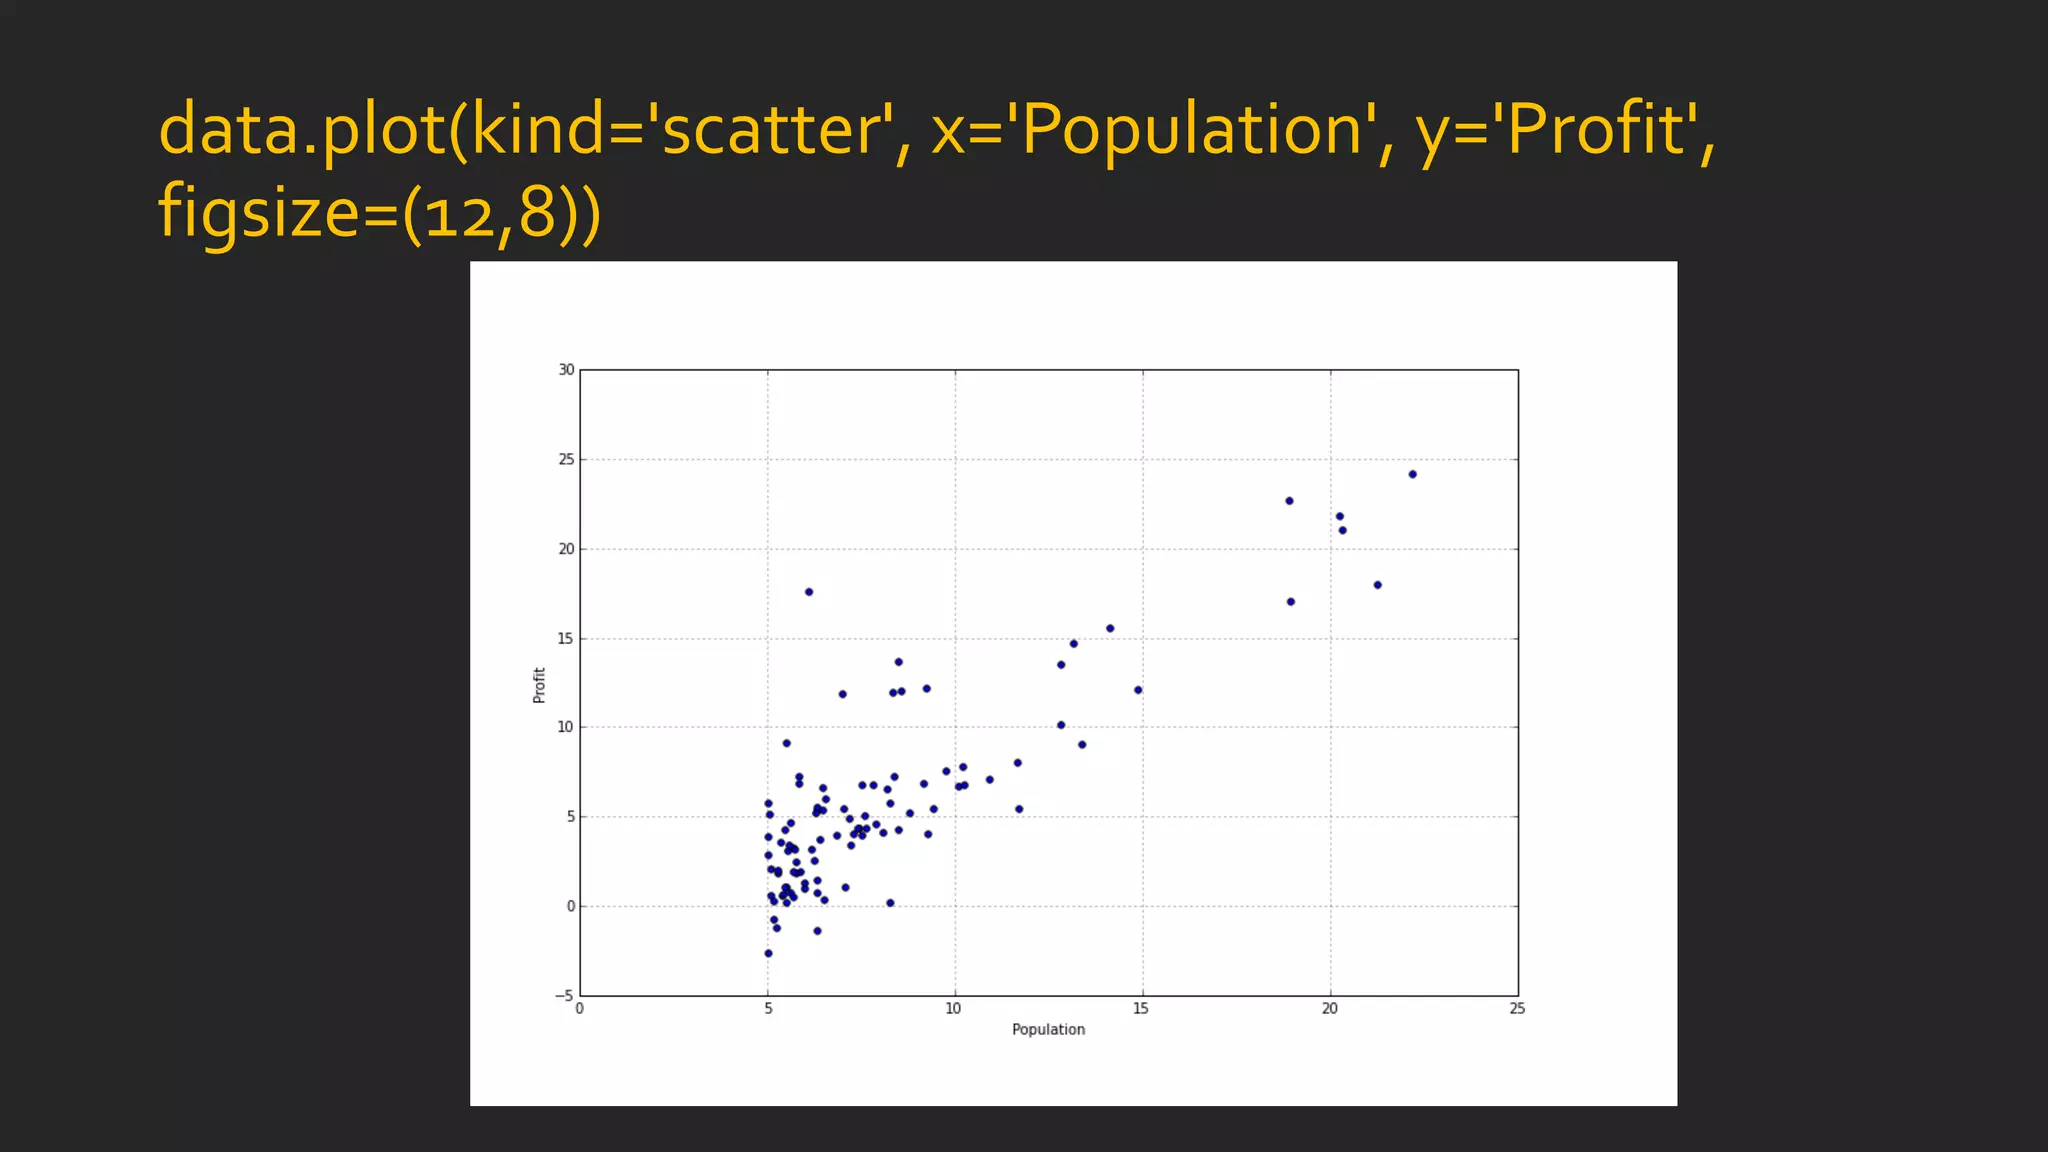
data = pd.read_csv(path, header=None, names=['Population', 'Profit'])
data.head()](https://image.slidesharecdn.com/statisticsindatasciencewithpython-180324222118/85/Statistics-in-Data-Science-with-Python-10-320.jpg)
![Implementing Simple Linear Regression
def computeCost(X, y, theta):
inner = np.power(((X * theta.T) - y), 2)
return np.sum(inner) / (2 * len(X)
# append a ones column to the front of the data set
data.insert(0, 'Ones', 1)
# set X (training data) and y (target variable)
cols = data.shape[1]
X = data.iloc[:,0:cols-1]
y = data.iloc[:,cols-1:cols]
# convert from data frames to numpy matrices
X = np.matrix(X.values)
y = np.matrix(y.values)
theta = np.matrix(np.array([0,0]))](https://image.slidesharecdn.com/statisticsindatasciencewithpython-180324222118/85/Statistics-in-Data-Science-with-Python-13-320.jpg)
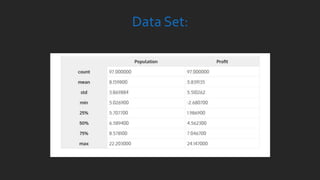
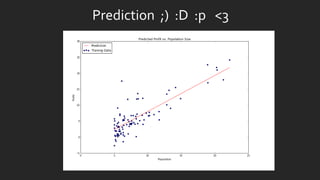
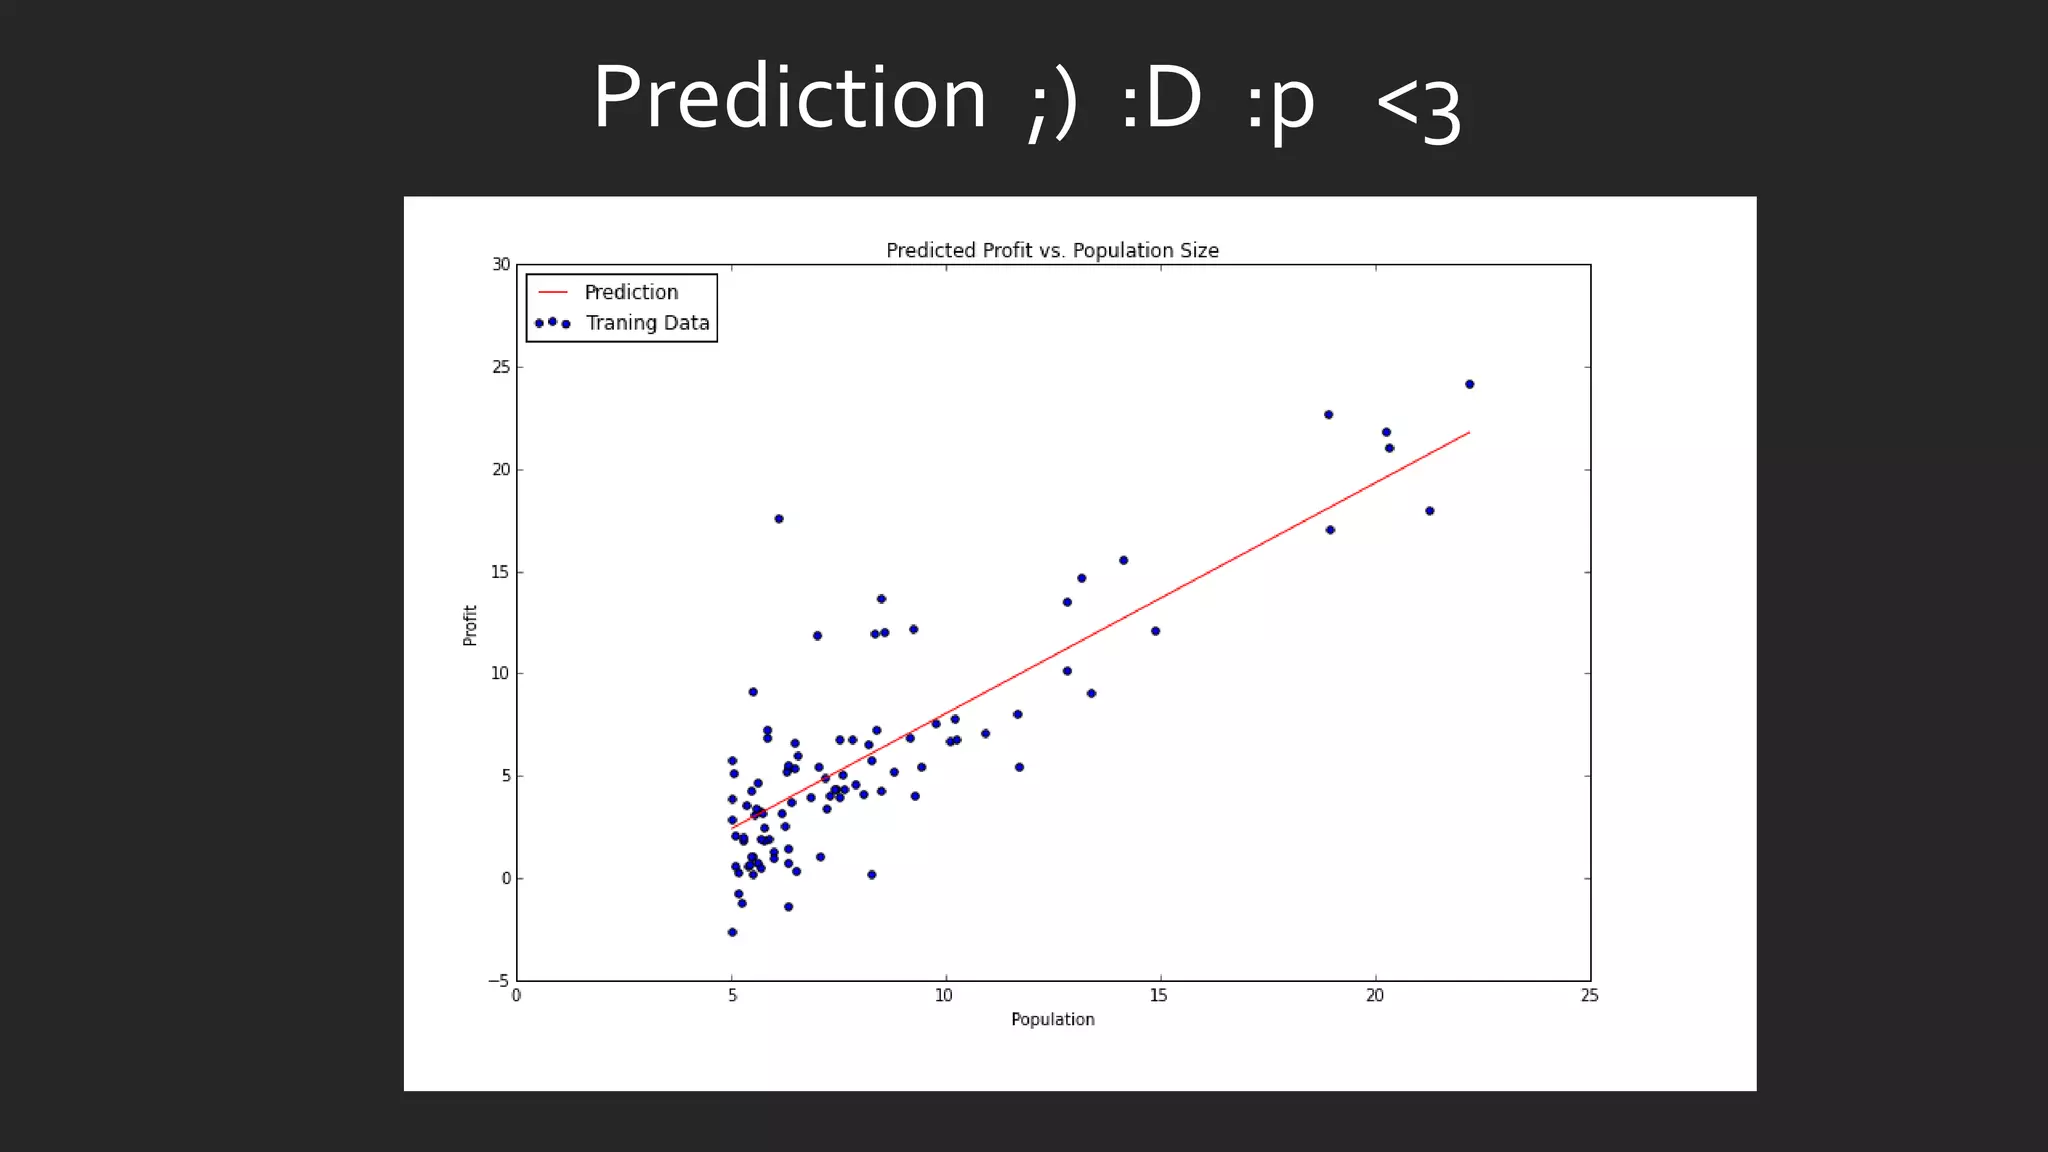
![x = np.linspace(data.Population.min(), data.Population.max(), 100)
f = g[0, 0] + (g[0, 1] * x)
fig, ax = plt.subplots(figsize=(12,8))
ax.plot(x, f, 'r', label='Prediction')
ax.scatter(data.Population, data.Profit, label='Traning Data')
ax.legend(loc=2)
ax.set_xlabel('Population')
ax.set_ylabel('Profit')
ax.set_title('Predicted Profit vs. Population Size')](https://image.slidesharecdn.com/statisticsindatasciencewithpython-180324222118/85/Statistics-in-Data-Science-with-Python-14-320.jpg)


![import os
import numpy as np
import pandas as pd
import matplotlib.pyplot as plt
%matplotlib inline
path = os.getcwd() + 'dataex1data1.txt'
data = pd.read_csv(path, header=None, names=['Population', 'Profit'])
data.head()](https://image.slidesharecdn.com/statisticsindatasciencewithpython-180324222118/75/Statistics-in-Data-Science-with-Python-10-2048.jpg)
![Implementing Simple Linear Regression
def computeCost(X, y, theta):
inner = np.power(((X * theta.T) - y), 2)
return np.sum(inner) / (2 * len(X)
# append a ones column to the front of the data set
data.insert(0, 'Ones', 1)
# set X (training data) and y (target variable)
cols = data.shape[1]
X = data.iloc[:,0:cols-1]
y = data.iloc[:,cols-1:cols]
# convert from data frames to numpy matrices
X = np.matrix(X.values)
y = np.matrix(y.values)
theta = np.matrix(np.array([0,0]))](https://image.slidesharecdn.com/statisticsindatasciencewithpython-180324222118/75/Statistics-in-Data-Science-with-Python-13-2048.jpg)
![x = np.linspace(data.Population.min(), data.Population.max(), 100)
f = g[0, 0] + (g[0, 1] * x)
fig, ax = plt.subplots(figsize=(12,8))
ax.plot(x, f, 'r', label='Prediction')
ax.scatter(data.Population, data.Profit, label='Traning Data')
ax.legend(loc=2)
ax.set_xlabel('Population')
ax.set_ylabel('Profit')
ax.set_title('Predicted Profit vs. Population Size')](https://image.slidesharecdn.com/statisticsindatasciencewithpython-180324222118/75/Statistics-in-Data-Science-with-Python-14-2048.jpg)


![[計一] Basic r programming final0918](https://cdn.slidesharecdn.com/ss_thumbnails/basicrprogramming-final0918-140320003136-phpapp02-thumbnail.jpg?width=600ounds&width=560&fit=bounds)


