![AGILENCR 2011 © Cybercom Datamatics Information Solutions. Priyank email: [email_address] TOP METRICS FOR AGILE](https://image.slidesharecdn.com/topmetricsforagileagilencr2011-13025927996221-phpapp02/85/Top-Metrics-for-Agile-Agile-NCR2011-1-320.jpg)


![AGILENCR 2011 © Cybercom Datamatics Information Solutions. Priyank email: [email_address] TOP METRICS FOR AGILE](https://image.slidesharecdn.com/topmetricsforagileagilencr2011-13025927996221-phpapp02/75/Top-Metrics-for-Agile-Agile-NCR2011-1-2048.jpg)


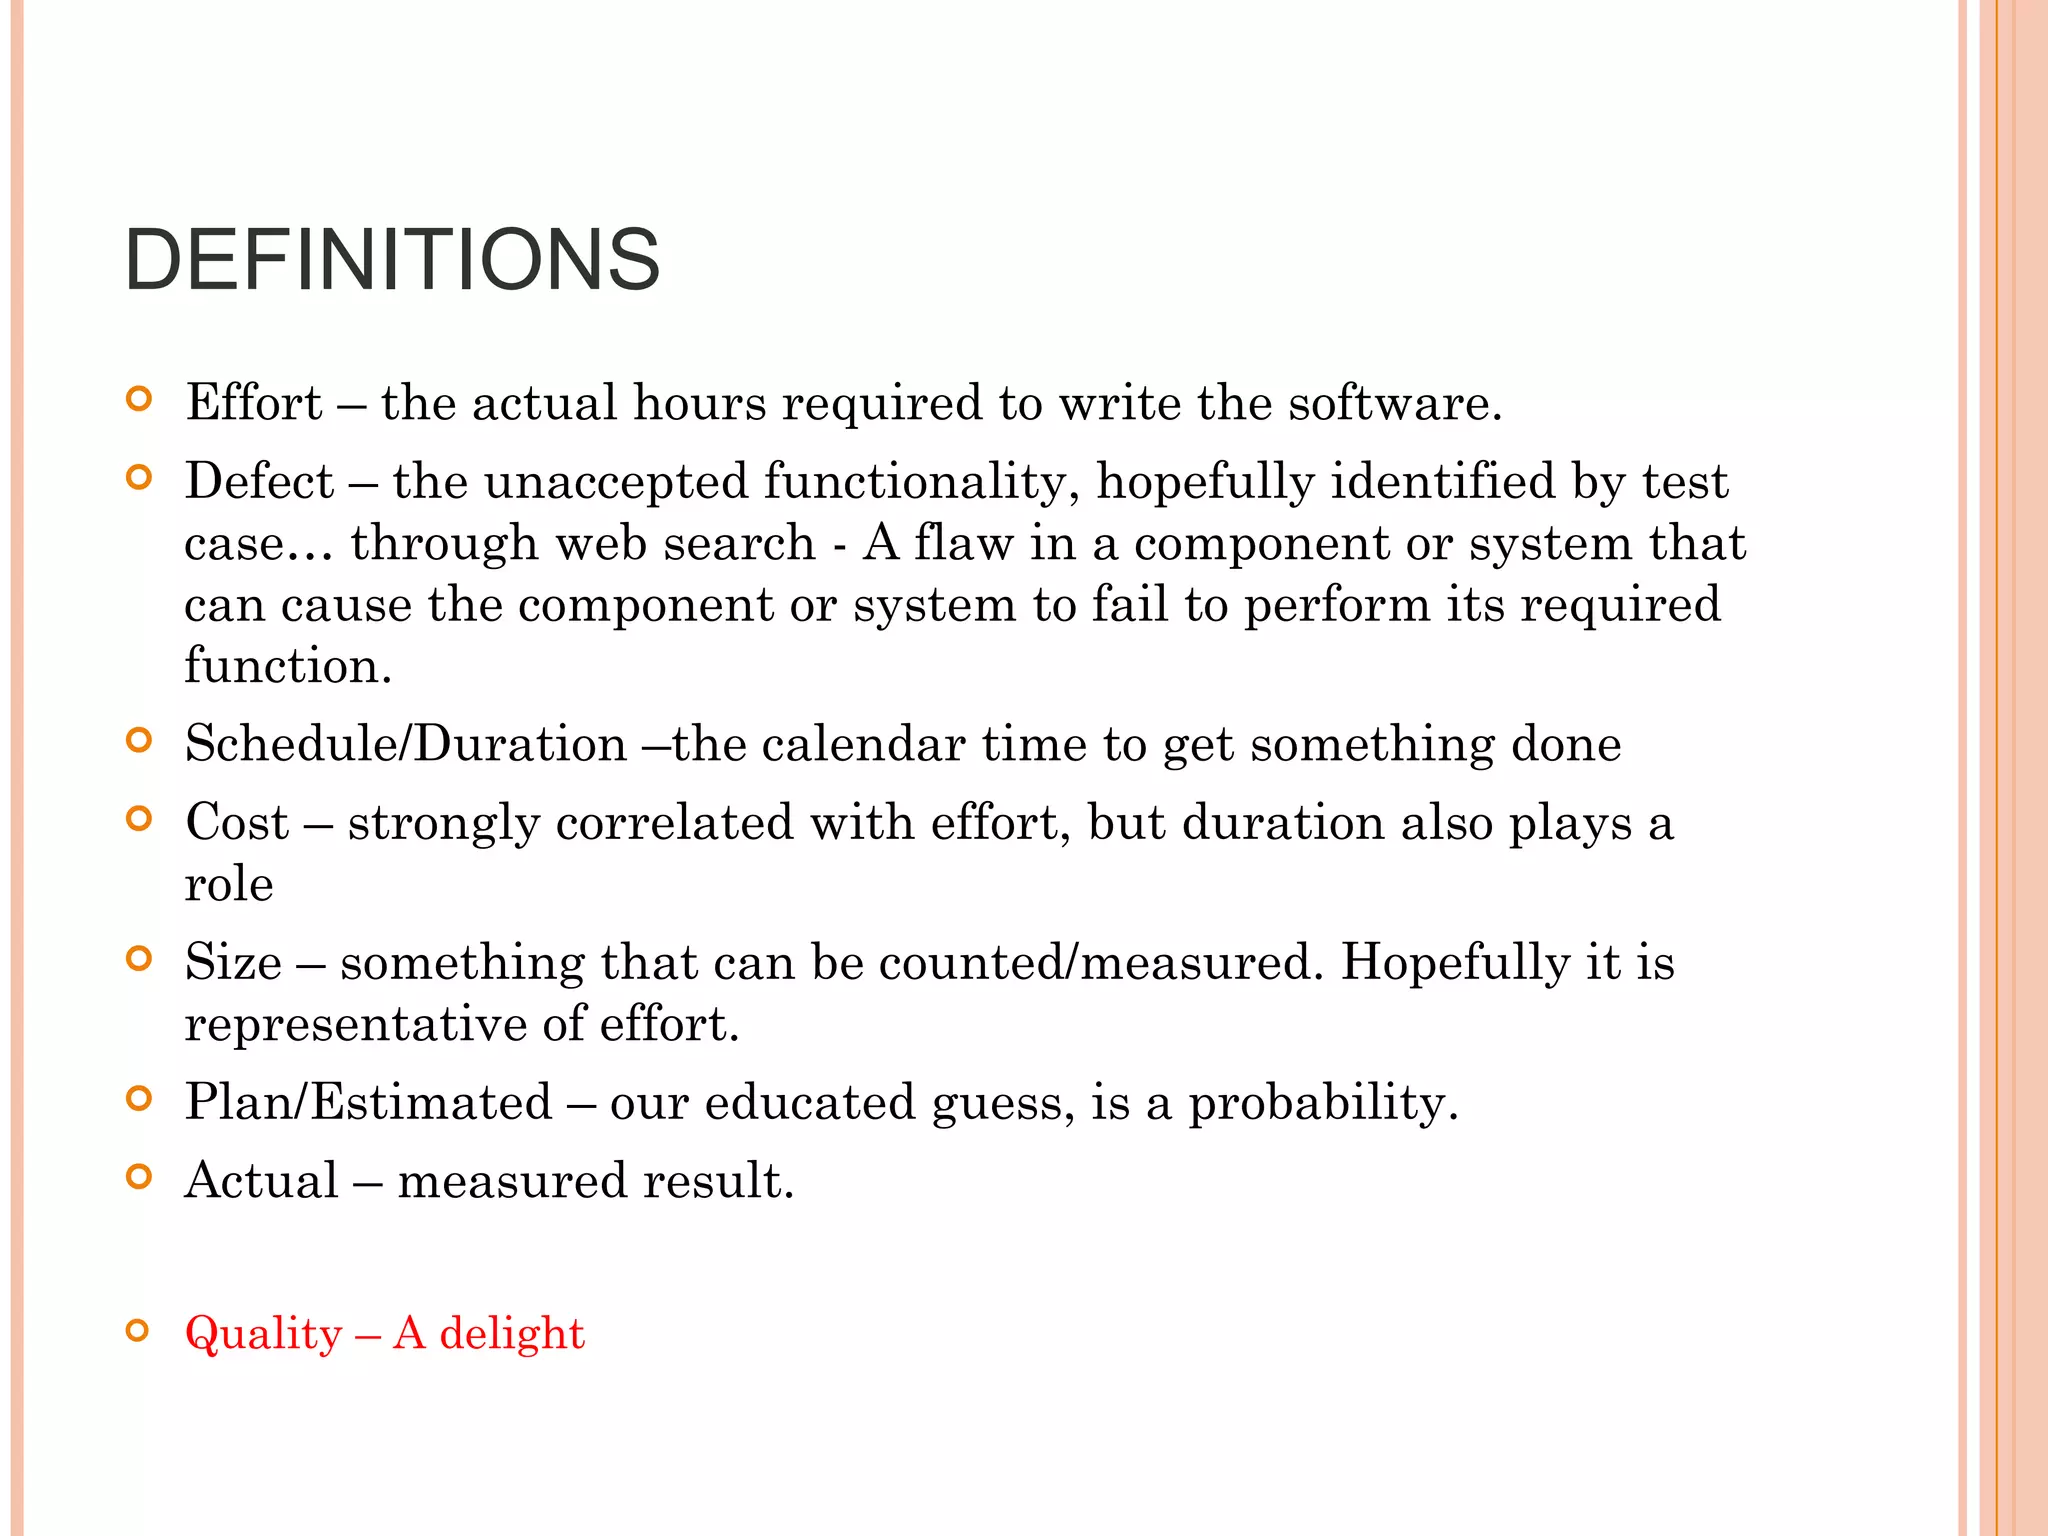
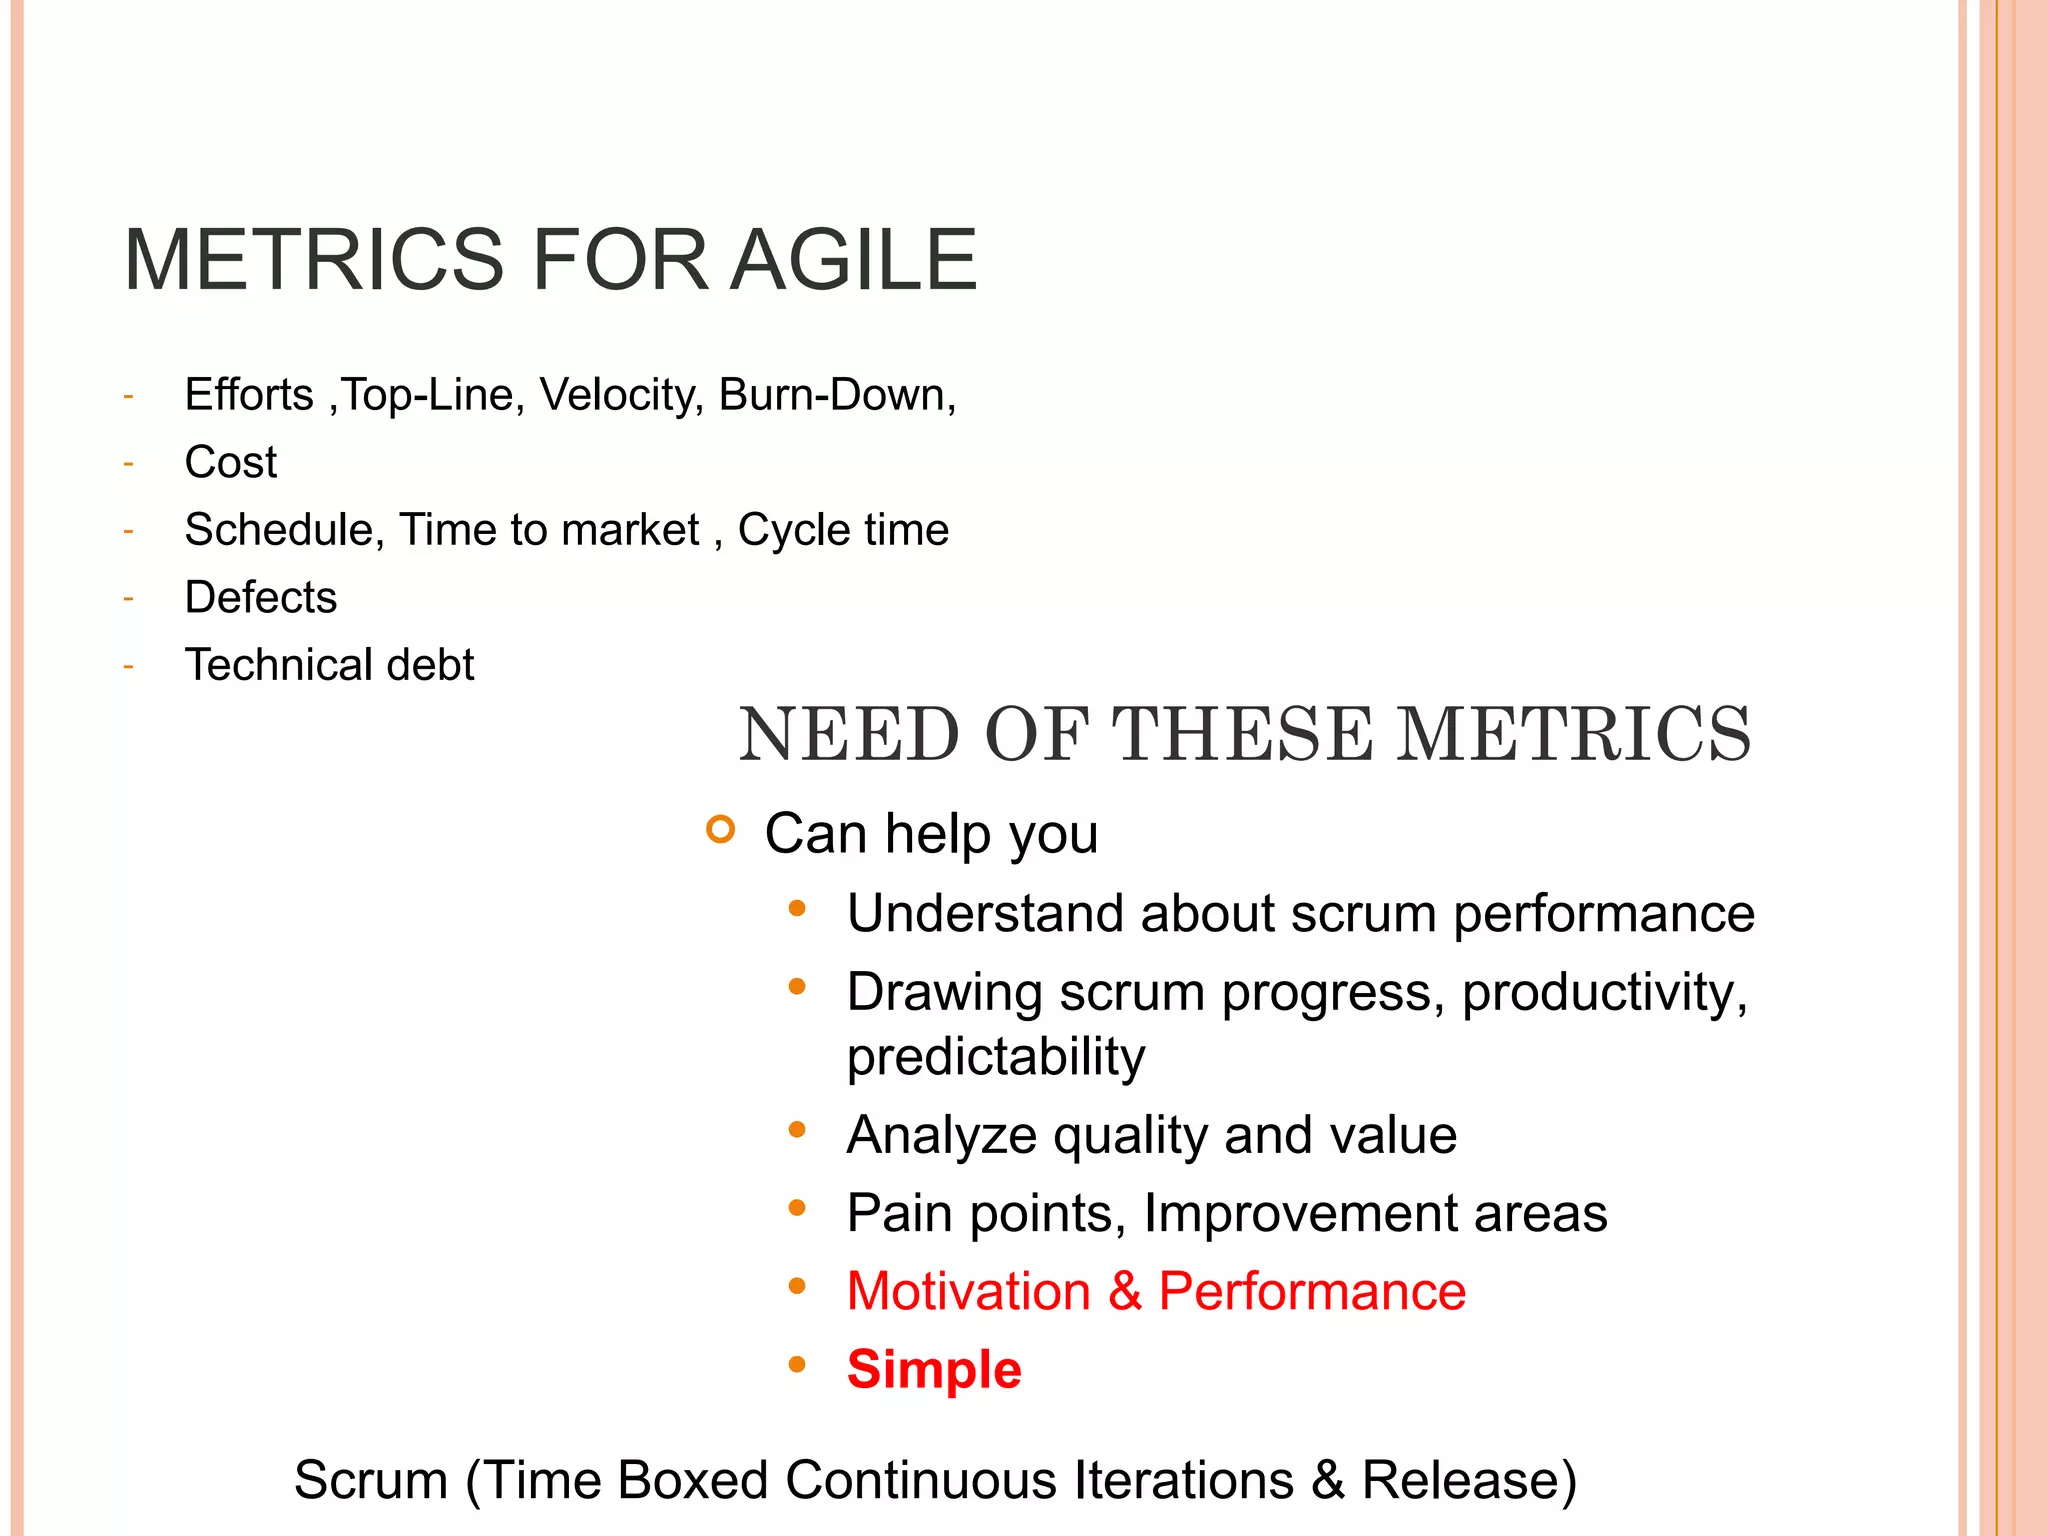

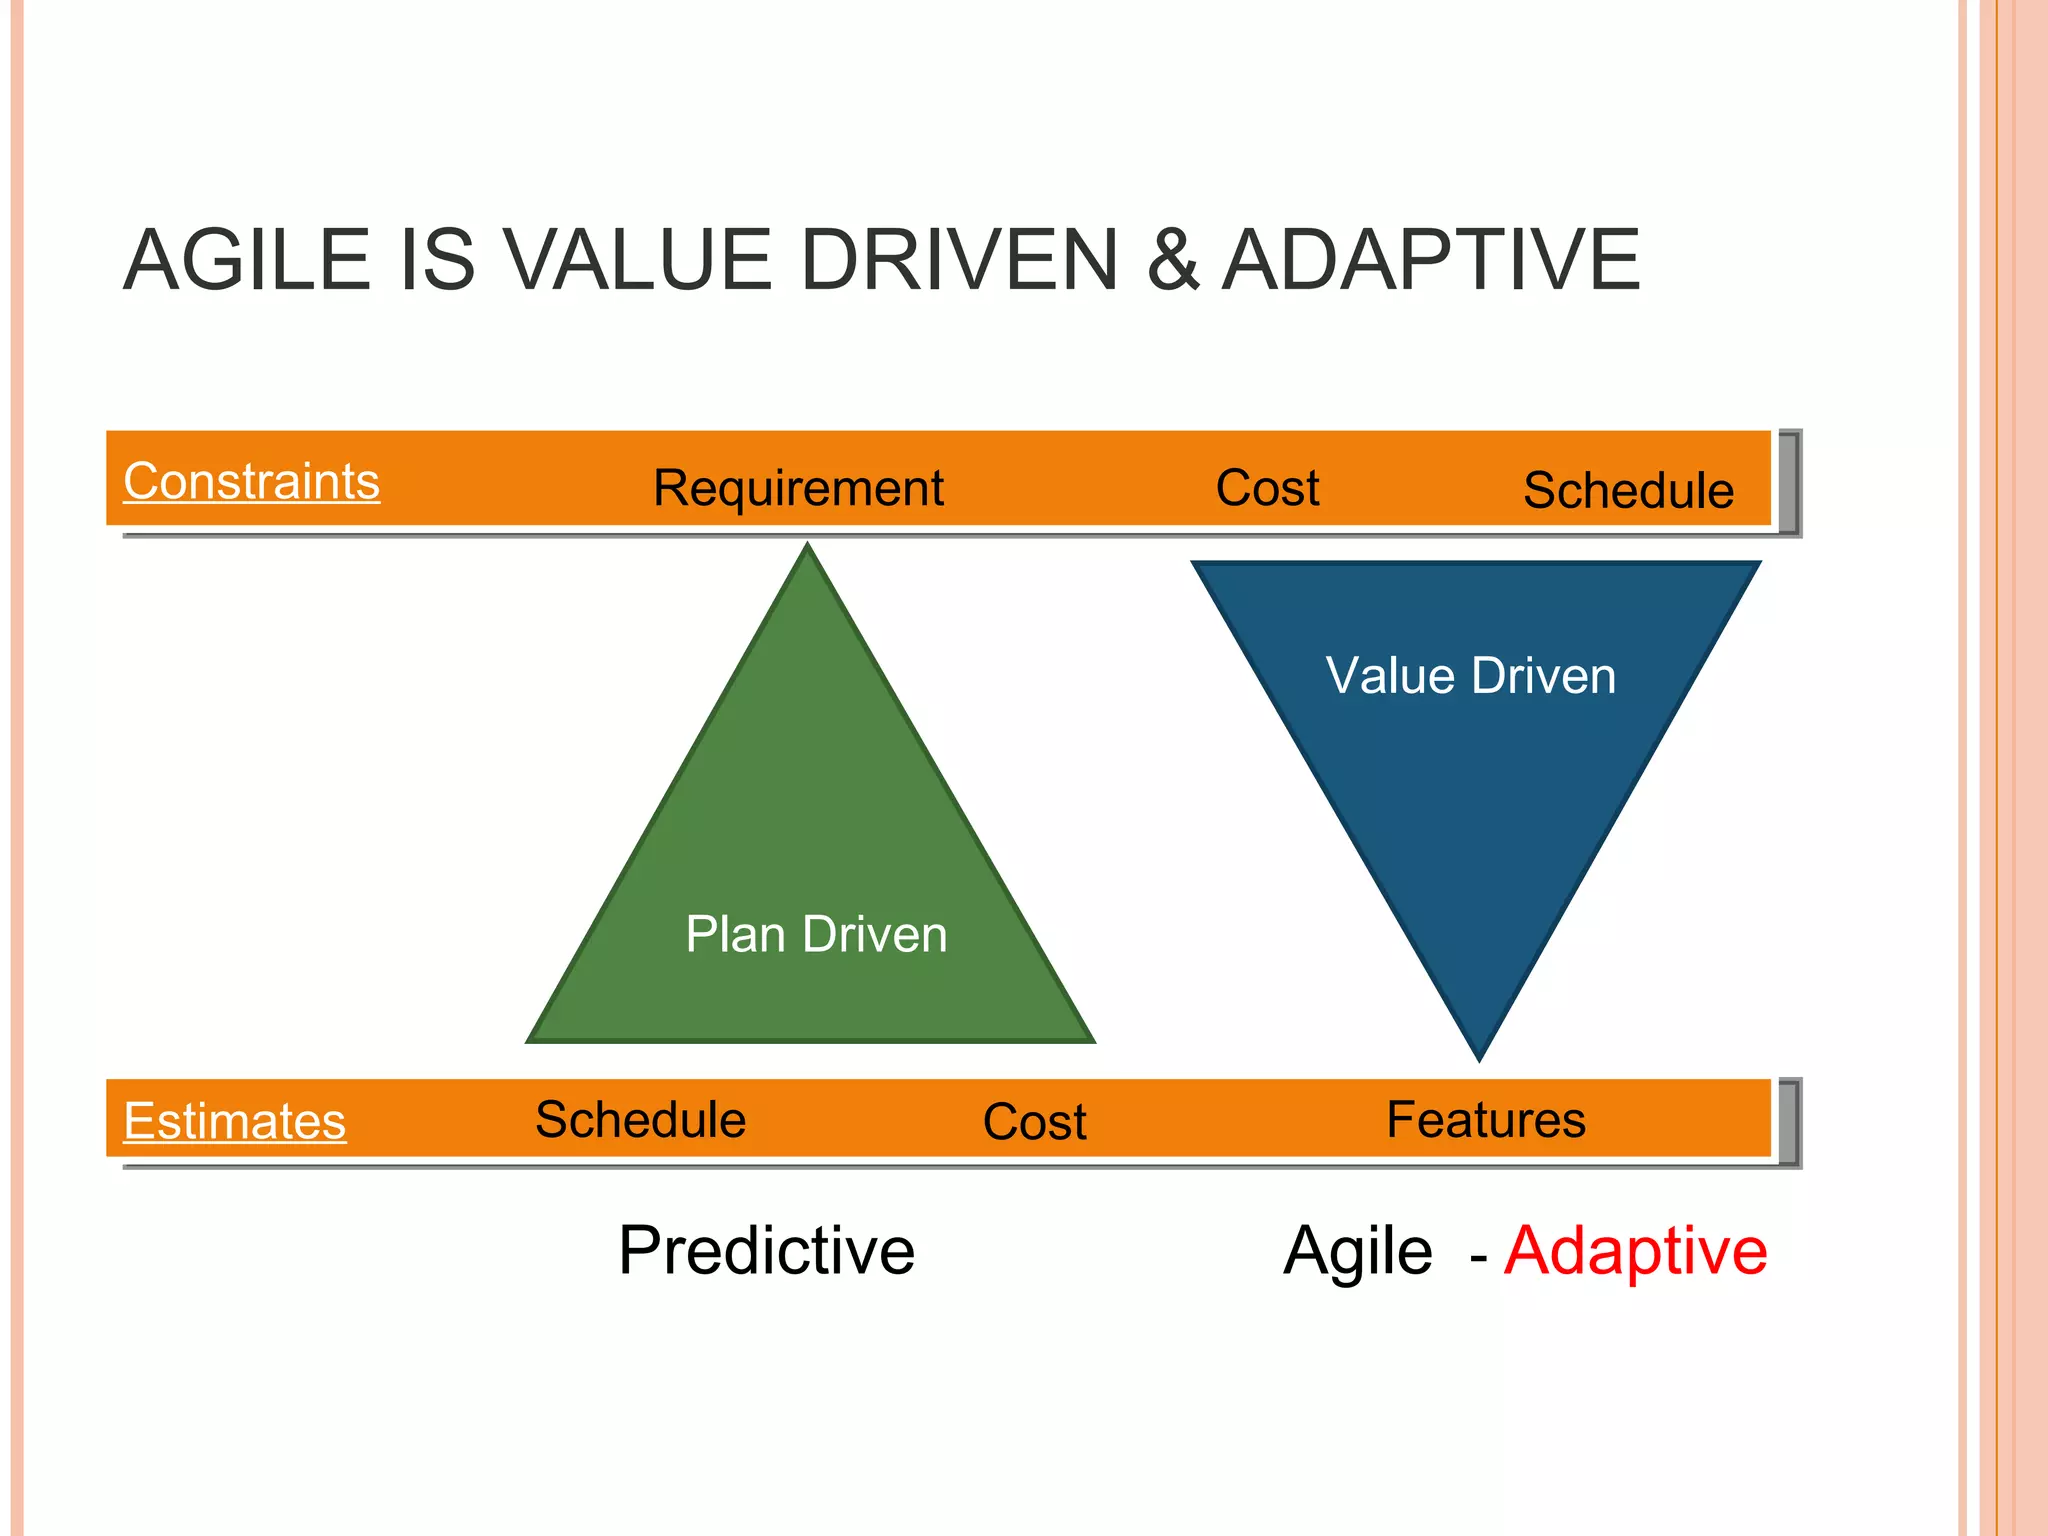

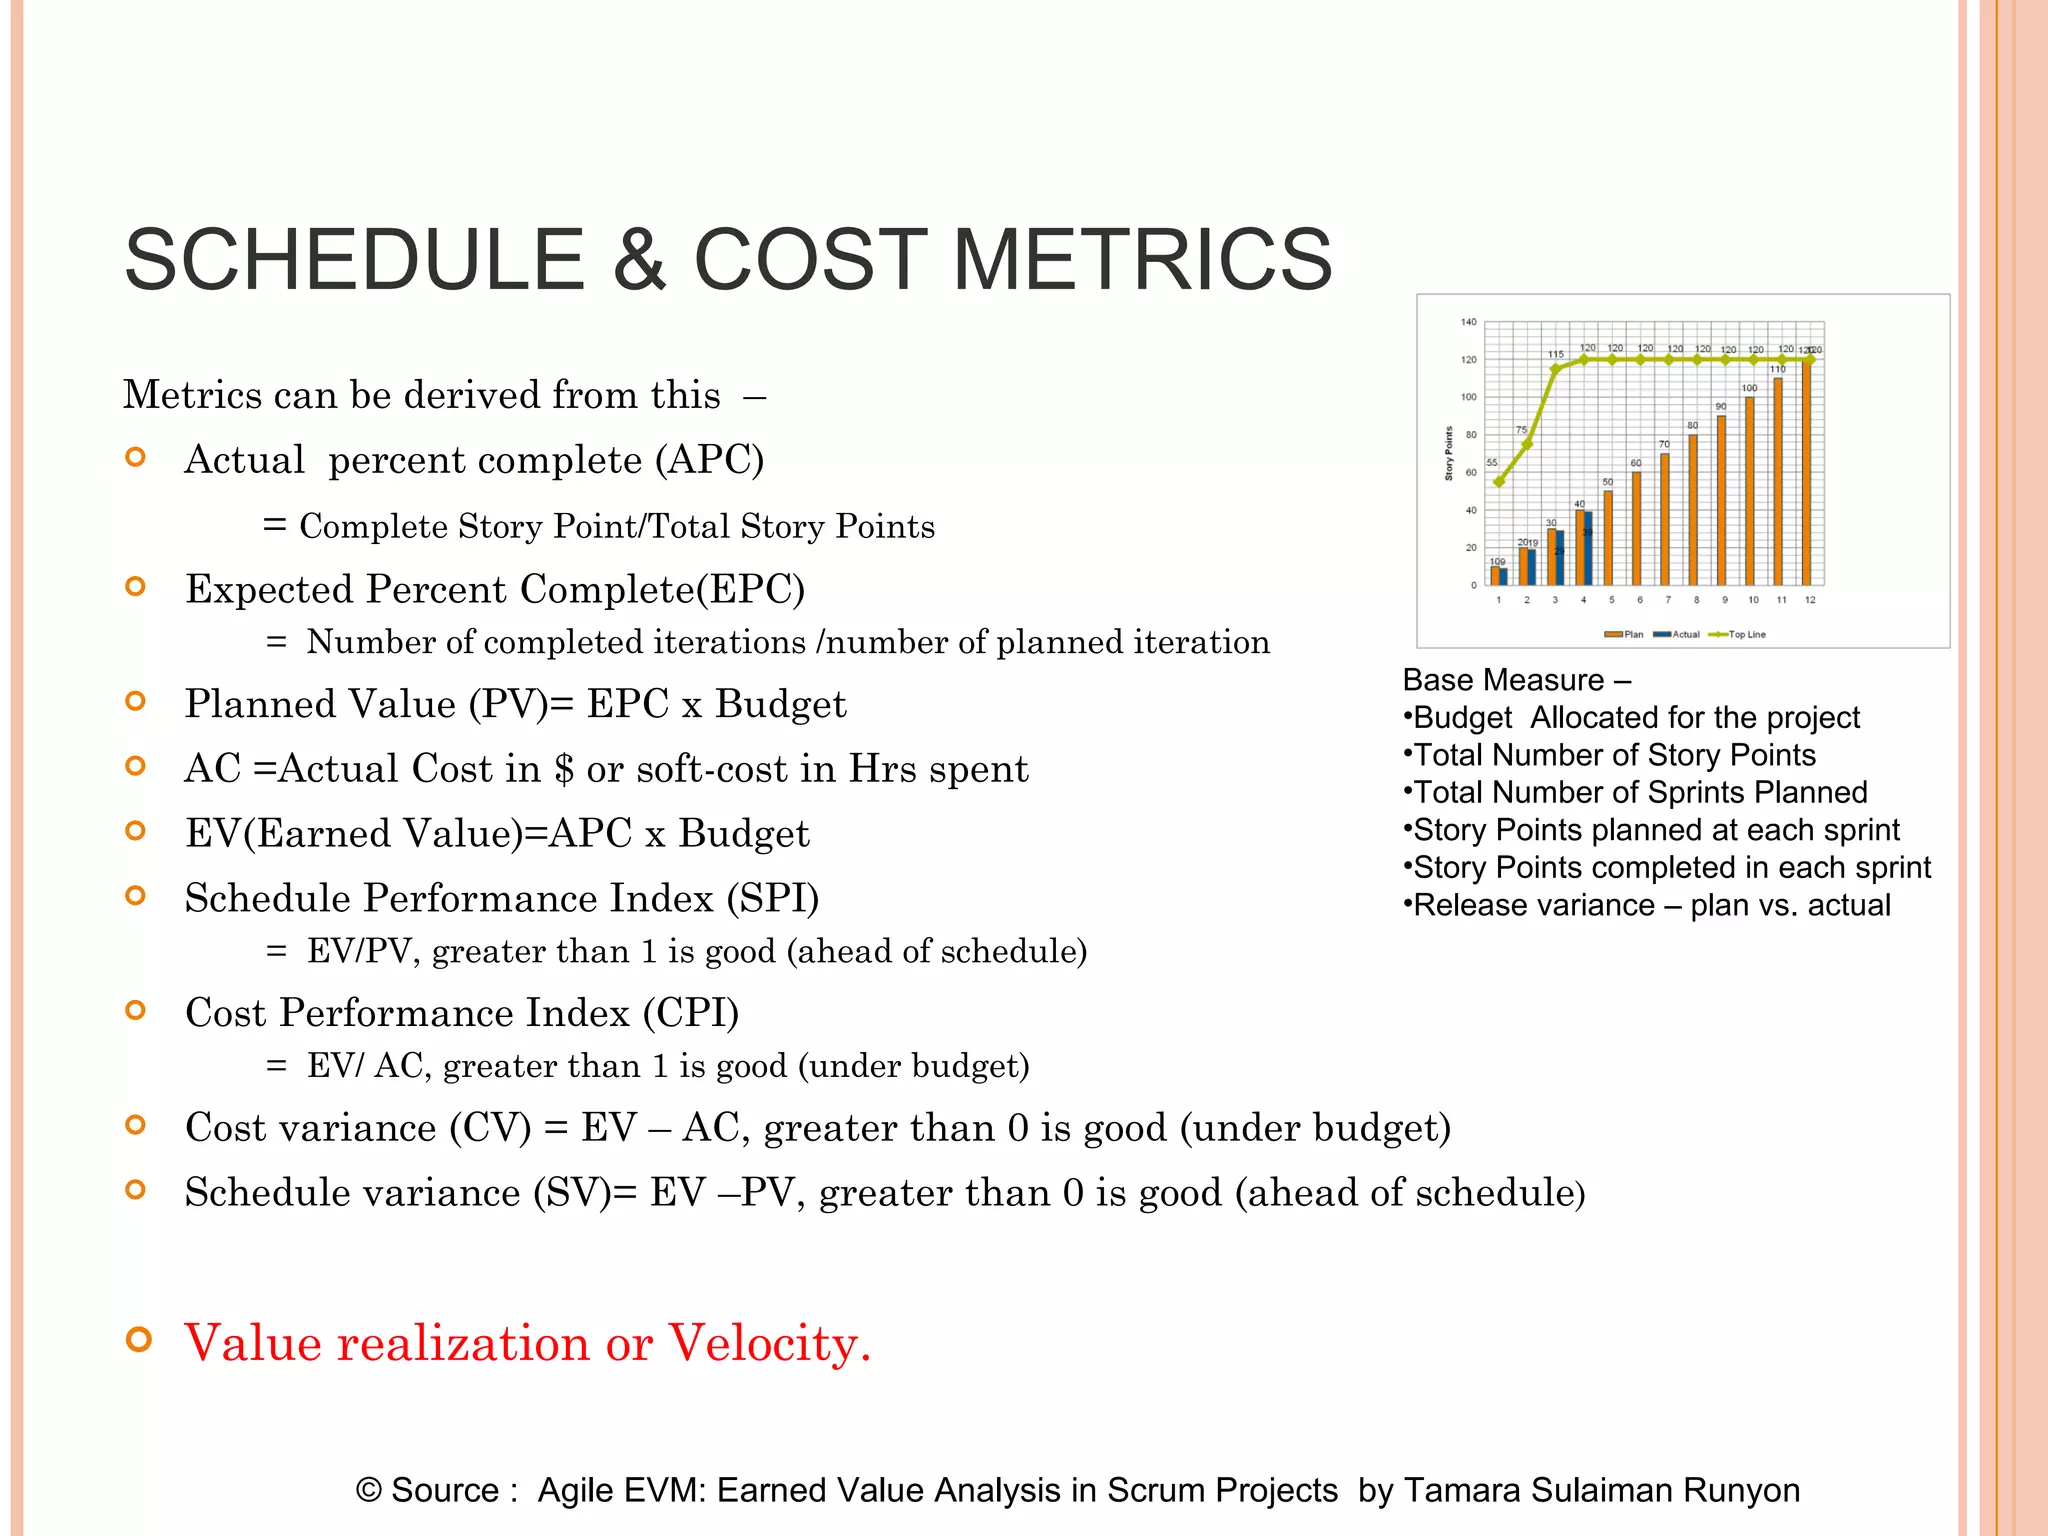
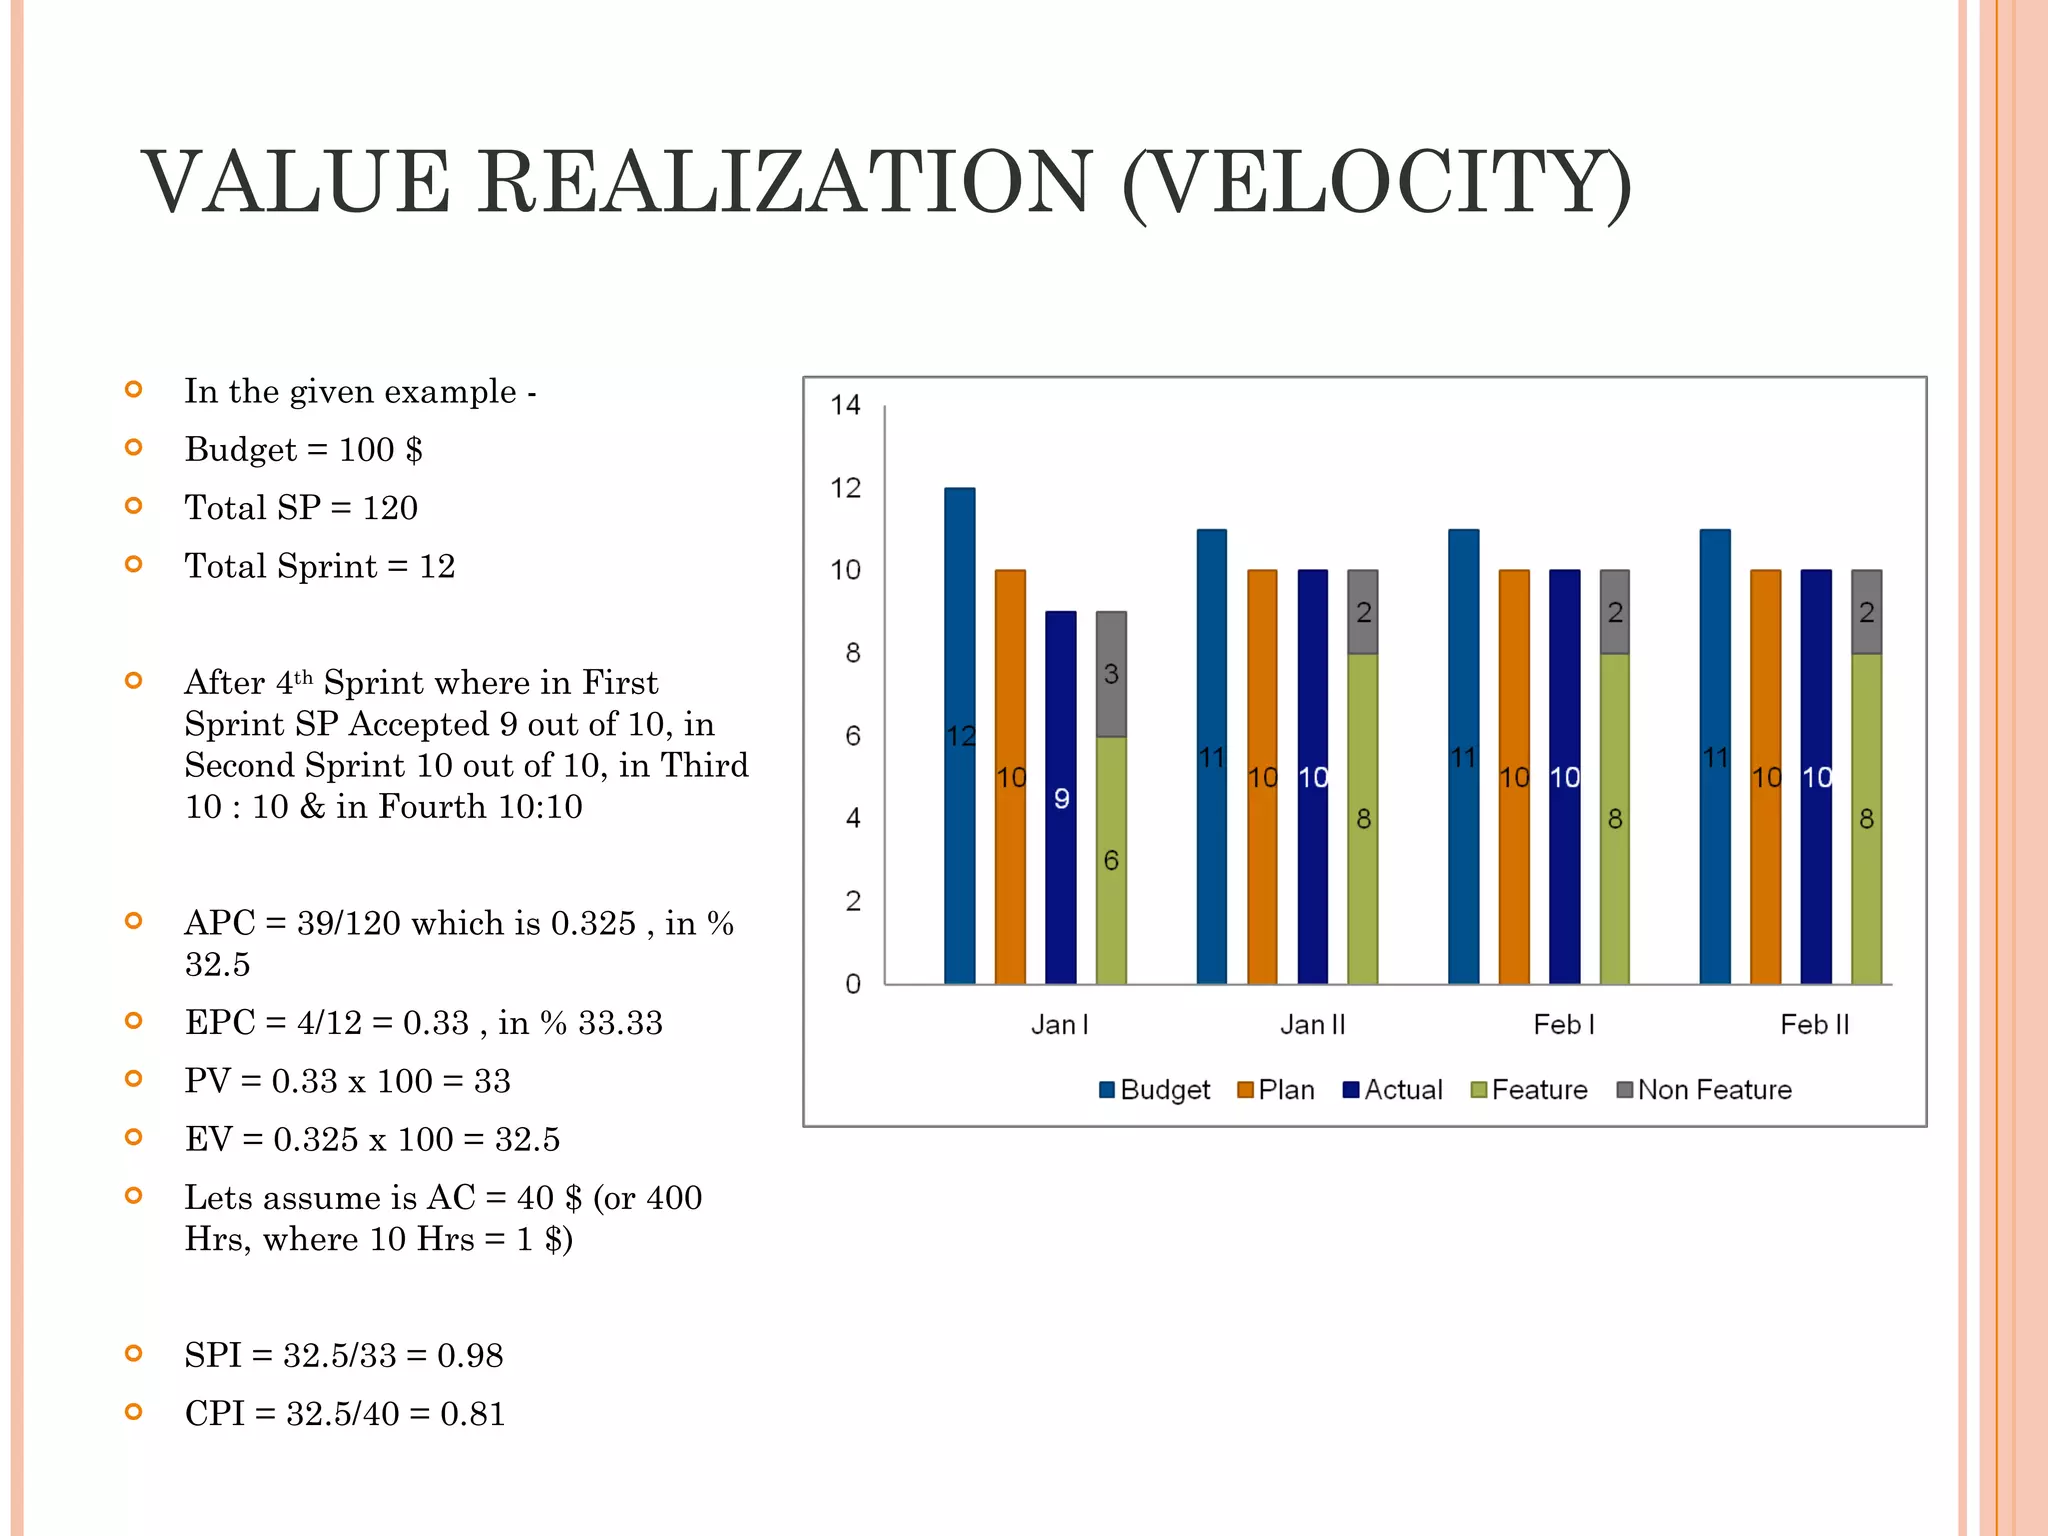
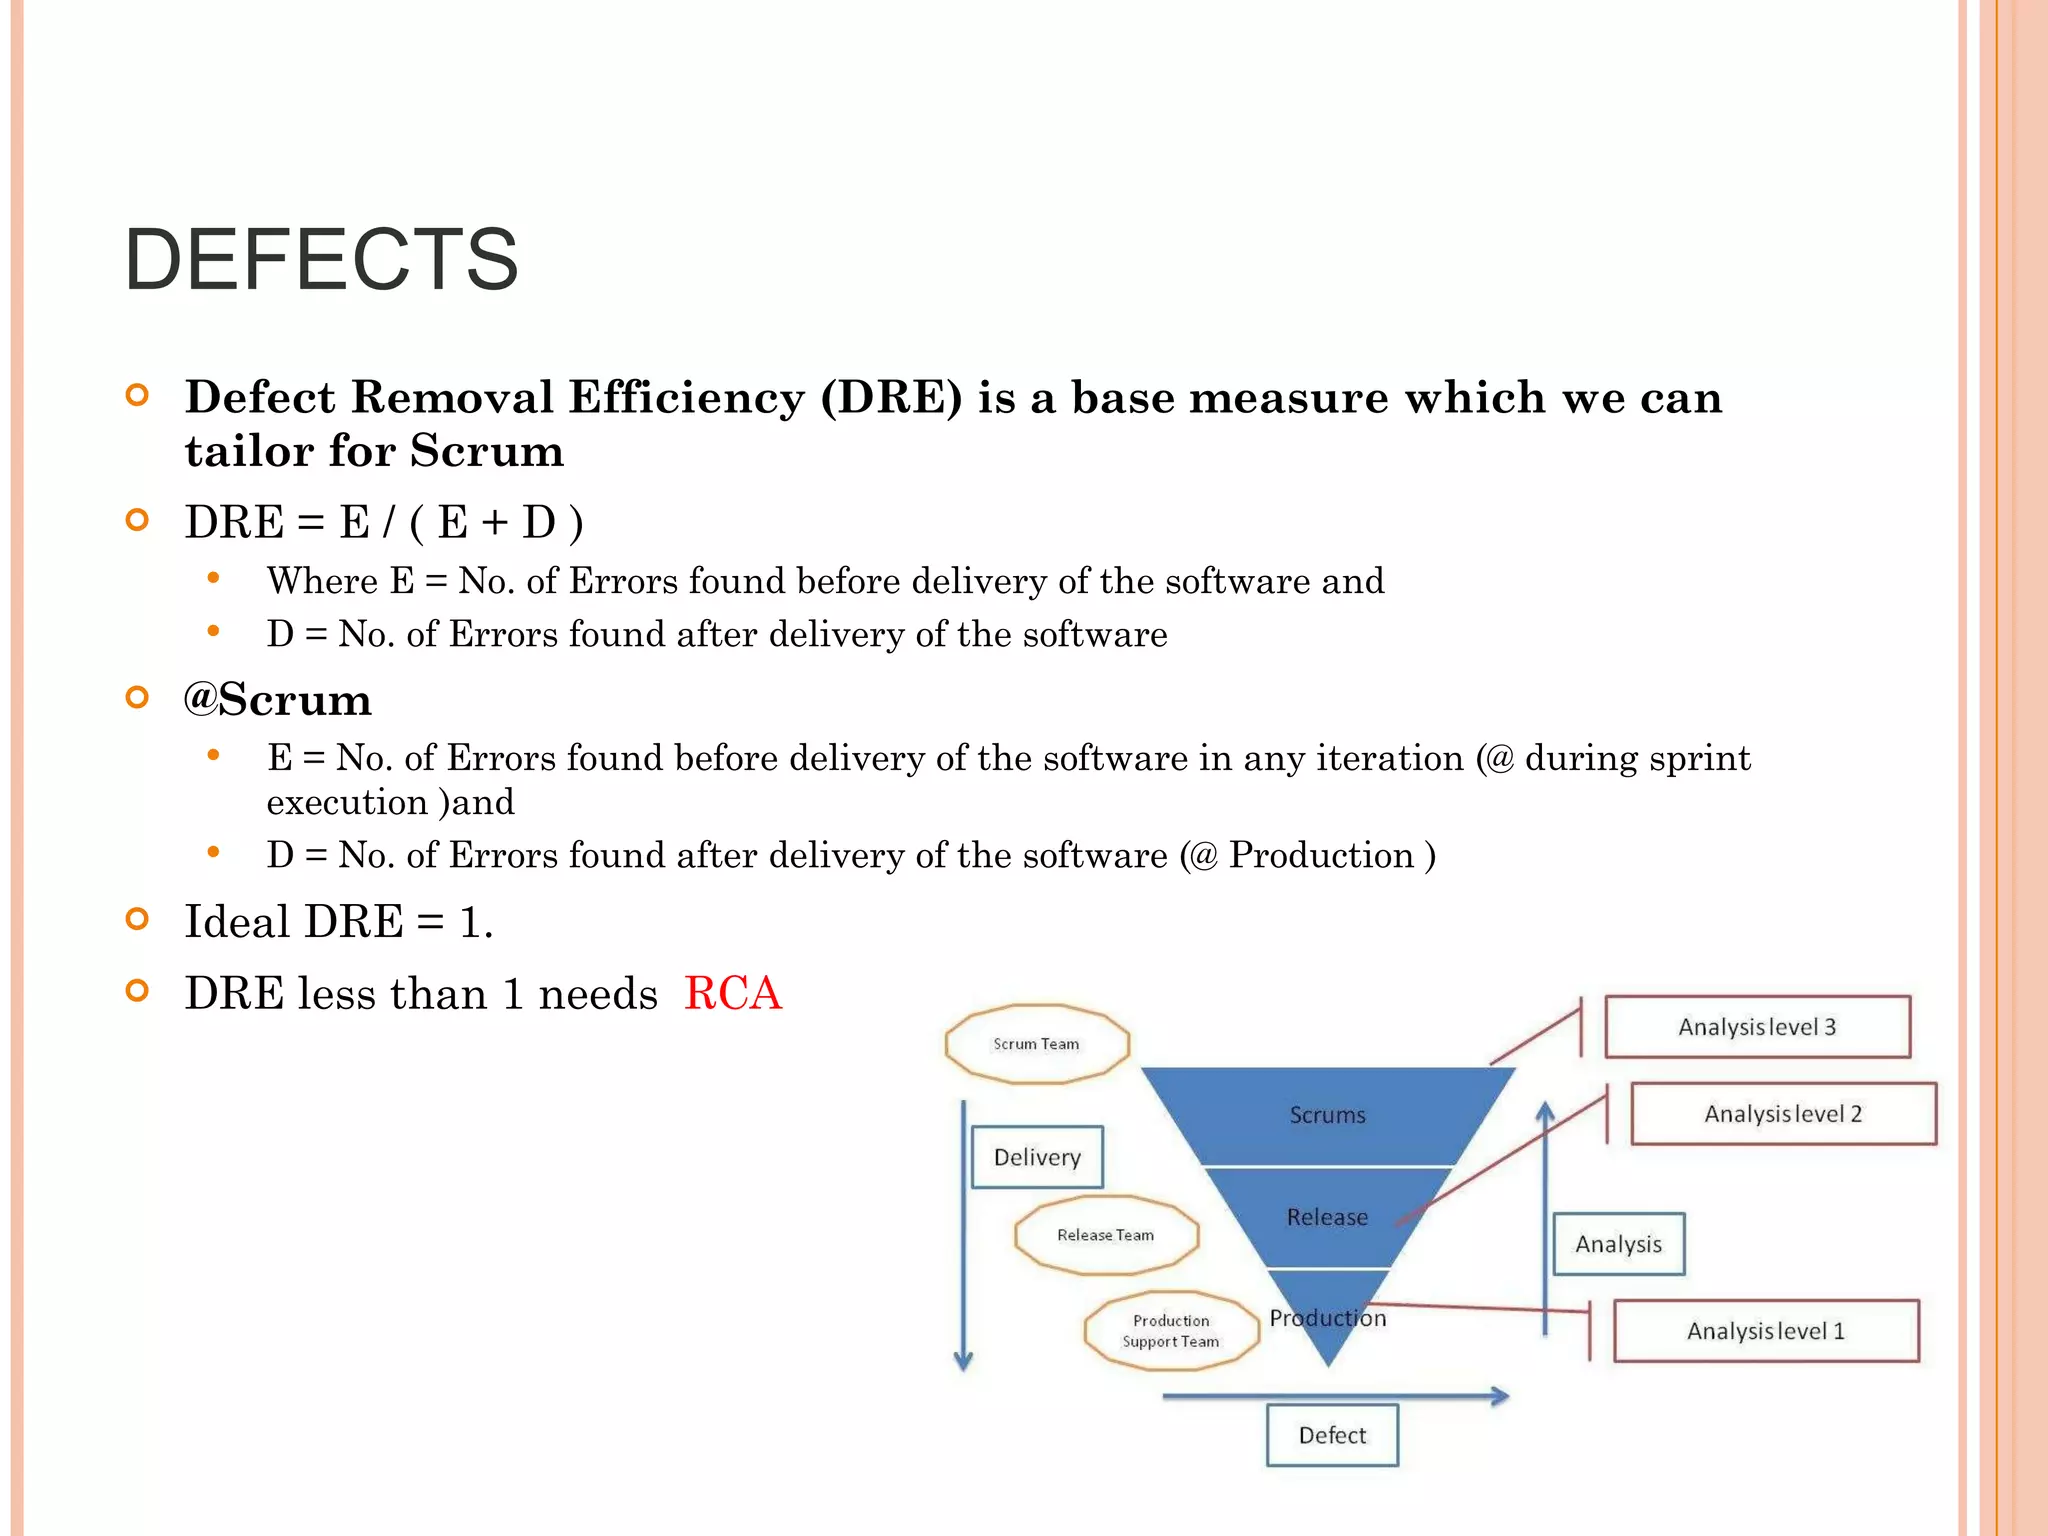
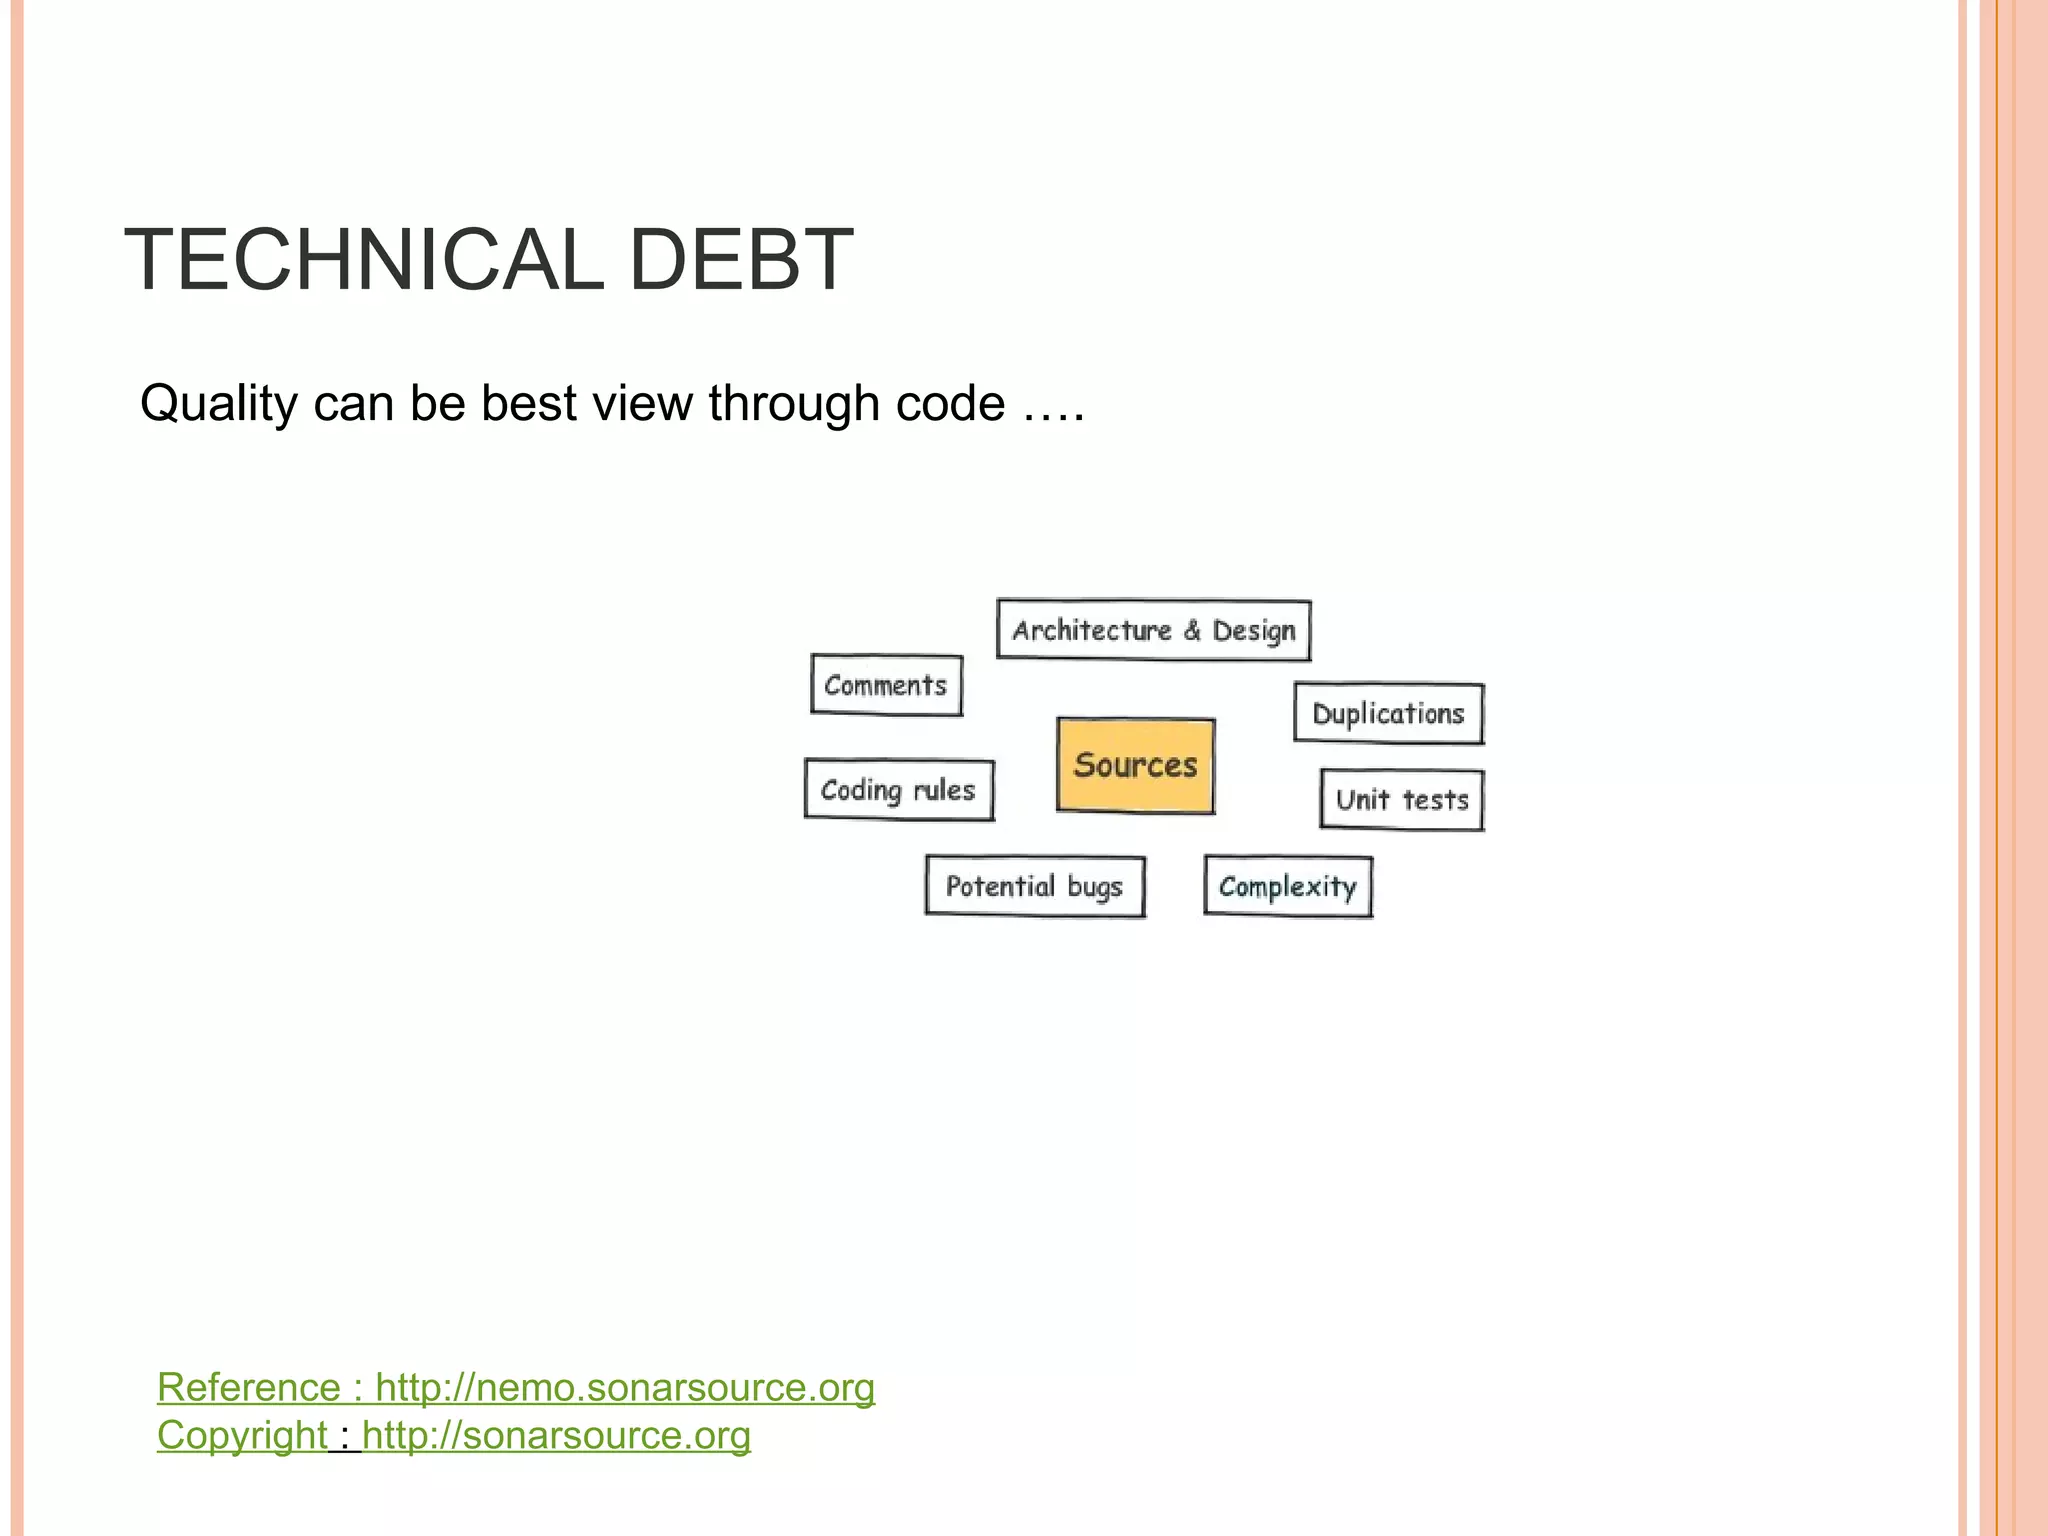


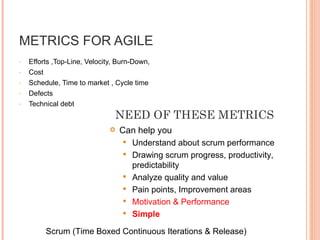
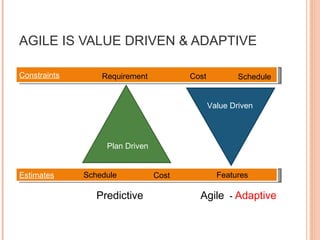
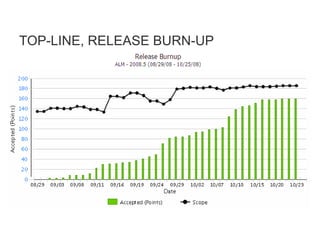
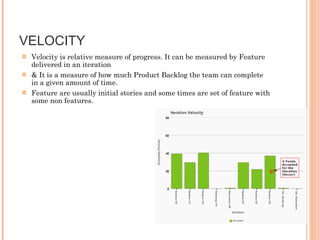
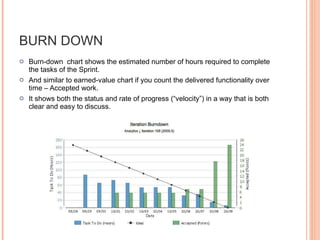
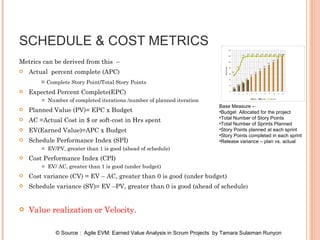
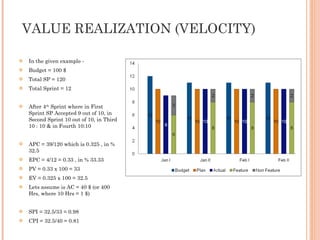
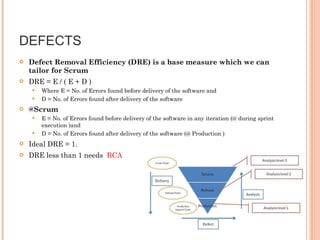
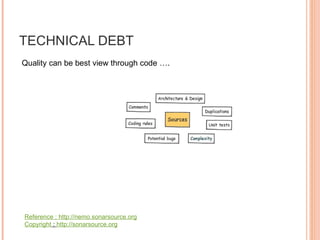
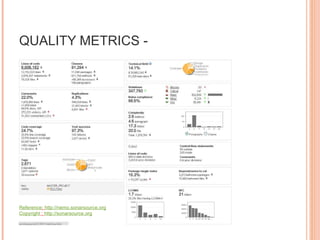
The document discusses various metrics that can be used to measure performance in Agile software development such as velocity, burn down, defects, and quality metrics. It explains metrics like effort, schedule, cost, size, defects, and velocity that provide insight into productivity, predictability, and value. Key Agile principles of adaptive planning, value-driven prioritization, and continuous delivery are important to consider when selecting and using metrics.


![UiPath Automation Suite Installation (Hands-On) [2/3]](https://cdn.slidesharecdn.com/ss_thumbnails/automationsuitecommunitysession2-251015095633-a6d862f1-thumbnail.jpg?width=600ounds&width=560&fit=bounds)


